Dynamic QTL analysis for fruit lycopene content and total...
15
©FUNPEC-RP www.funpecrp.com.br Genetics and Molecular Research 11 (4): 3696-3710 (2012) Dynamic QTL analysis for fruit lycopene content and total soluble solid content in a Solanum lycopersicum x S. pimpinellifolium cross Y.D. Sun, Y. Liang, J.M. Wu, Y.Z. Li, X. Cui and L. Qin Key Laboratory of Horticulture Plant Germplasm and Genetic Improvement, Ministry of Agriculture, College of Horticulture, Northwest A & F University, Yangling, Shaanxi, China Corresponding author: Y. Liang E-mail: [email protected] Genet. Mol. Res. 11 (4): 3696-3710 (2012) Received October 26, 2011 Accepted March 21, 2012 Published August 17, 2012 DOI http://dx.doi.org/10.4238/2012.August.17.8 ABSTRACT. Fruit lycopene content and total soluble solid content are important factors determining fruit quality of tomatoes; however, the dynamic quantitative trait loci (QTL) controlling lycopene and soluble solid content have not been well studied. We mapped the chromosomal regions controlling these traits in different periods in F 2:3 families derived from a cross between the domestic and wild tomato species Solanum lycopersicum and S. pimpinellifolium. Fifteen QTLs for lycopene and soluble solid content and other related traits analyzed at three different fruit ripening stages were detected with a composite interval mapping method. These QTLs explained 7-33% of the individual phenotypic variation. QTLs detected in the color-changing period were different from those detected in the other two periods. On chromosome 1, the soluble solid content QTL was located in the same region during the color-changing and full-ripe periods. On chromosome 4, the same QTL for lycopene content was found during the color- changing and full-ripe periods. The QTL for lycopene content on chromosome 4 co-located with the QTL for soluble solid content during the full-ripe period. Co-location of lycopene content QTL
-
Upload
phungthien -
Category
Documents
-
view
223 -
download
2
Transcript of Dynamic QTL analysis for fruit lycopene content and total...

©FUNPEC-RP www.funpecrp.com.brGenetics and Molecular Research 11 (4): 3696-3710 (2012)
Dynamic QTL analysis for fruit lycopene content and total soluble solid content in a Solanum lycopersicum x S. pimpinellifolium cross
Y.D. Sun, Y. Liang, J.M. Wu, Y.Z. Li, X. Cui and L. Qin
Key Laboratory of Horticulture Plant Germplasm and Genetic Improvement, Ministry of Agriculture, College of Horticulture, Northwest A & F University, Yangling, Shaanxi, China
Corresponding author: Y. LiangE-mail: [email protected]
Genet. Mol. Res. 11 (4): 3696-3710 (2012)Received October 26, 2011Accepted March 21, 2012Published August 17, 2012DOI http://dx.doi.org/10.4238/2012.August.17.8
ABSTRACT. Fruit lycopene content and total soluble solid content are important factors determining fruit quality of tomatoes; however, the dynamic quantitative trait loci (QTL) controlling lycopene and soluble solid content have not been well studied. We mapped the chromosomal regions controlling these traits in different periods in F2:3 families derived from a cross between the domestic and wild tomato species Solanum lycopersicum and S. pimpinellifolium. Fifteen QTLs for lycopene and soluble solid content and other related traits analyzed at three different fruit ripening stages were detected with a composite interval mapping method. These QTLs explained 7-33% of the individual phenotypic variation. QTLs detected in the color-changing period were different from those detected in the other two periods. On chromosome 1, the soluble solid content QTL was located in the same region during the color-changing and full-ripe periods. On chromosome 4, the same QTL for lycopene content was found during the color-changing and full-ripe periods. The QTL for lycopene content on chromosome 4 co-located with the QTL for soluble solid content during the full-ripe period. Co-location of lycopene content QTL

©FUNPEC-RP www.funpecrp.com.brGenetics and Molecular Research 11 (4): 3696-3710 (2012)
QTL analysis in S. lycopersicum x S. pimpinellifolium cross 3697
and soluble solid content QTLs may be due to pleiotropic effects of a single gene or a cluster of genes via physiological relationships among traits. On chromosome 9, the same two QTLs for lycopene content at two different fruit ripening periods may reflect genes controlling lycopene content that are always expressed in tomato fruit development.
Key words: Lycopene content; Solanum lycopersicum tomato;Total soluble solid content; QTL mapping
INTRODUCTION
Tomato (Solanum lycopersicum) is widely consumed, and its health benefits are well known. Antioxidants in tomato fruits have been a public health focus for many years. The lycopene content (LYC) in tomato fruit is an important source of lipid-soluble anti-oxidants in the human diet and can prevent the initiation or propagation of oxidizing chain reactions (Rousseaux et al., 2005; Wu and Kubota, 2008; Riadh et al., 2011). Total soluble solid content (SSC) is one of the main components of tomato flavor (Kader, 1986), and it is the property in tomato most likely to match the consumer perception of internal quality (Arazuri et al., 2007). LYC and SSC are the main quality traits of tomato fruit. However, a range of genetic and environmental factors that result in quantitative variation across va-rieties governs tomato fruit quality, and the inheritance is complex. Therefore, overcom-ing the genetic linkage between fruit quality traits presents a challenge for conventional breeding methods. The use of quantitative trait locus (QTL) mapping to find major genes and functional markers and improve the ability to control quantitative traits is an effective way to solve these problems.
Conventional breeding methods provide little information on the chromosomal regions controlling these complex quality traits or the simultaneous effects of each chromosomal region on other traits such as epistasis, pleiotropy, and linkage (Semel et al., 2006; Kuan-Hung et al., 2010). If based only on phenotype analysis, selection by conventional breeding methods is extremely difficult when genotype-environment interactions are substantial. No reliable field screening technique exists that can be used year after year and generation after generation.
One approach to facilitate the selection and breeding of complex quality traits is to identify genetic markers linked to the traits of interest. DNA markers have facilitated QTL mapping studies in segregated population and shown that certain genomic regions derived from wild germplasm have the potential to improve related traits (Gur and Zamir, 2004). Molecular maps are more useful for identifying and exploiting variations within these genetic resources through marker analysis (Kuan-Hung et al., 2010). Tomato is one of the first plant species in which researchers have began to map QTL traits of agronomic importance using molecular markers (Cagas et al., 2008). During the past decades, QTL studies conducted for tomato have revealed more than 50 traits, and most are fruit-related traits (Eshed and Zamir, 1996; Grandillo and Tanksley, 1996; Tanksley et al., 1996; Ber-nacchi et al., 1998; Chen et al., 1999; Grandillo et al., 1999; Fulton et al., 1997, 2000; Ku et al., 2000; Causse et al., 2002; Doganlar et al., 2002; Lecomte et al., 2004; Rousseaux et al., 2005; Chaib et al., 2006; Foolad, 2007; Kuan-Hung et al., 2010). Current studies on the

©FUNPEC-RP www.funpecrp.com.brGenetics and Molecular Research 11 (4): 3696-3710 (2012)
Y.D. Sun et al. 3698
traits of LYC or SSC have suggested the existence of 17 QTLs for LYC in all of the tomato chromosomes except 9 (Thorup et al., 2000; Saliba-Colombani et al., 2001; Heather et al., 2004; Foolad, 2007; Shirasawa et al., 2010), and 109 QTLs for SSC in all chromosomes (Saliba-Colombani et al., 2001; Heather et al., 2004; Foolad, 2007; Causse et al., 2007; Gur et al., 2011). With the exception of 2 QTLs for LYC, none of these QTLs has been used for marker-assisted selection (MAS) in breeding, this suggests that constructing a static model of genetic roles at only one development point is inadequate, and more effort should be directed toward examining the stability and effectiveness of the target trait QTLs with the view of using a dynamic model in the genetic variation.
Tomato LYC and SSC change during the course of fruit development and maturation. In this study, the phenotype in a time-varying function model of the LYC and SSC dynamic traits was analyzed using simple sequence repeat (SSR) molecular markers to detect the major genes that impact changes in dynamic processes. Fifteen QTLs controlling LYC, SSC, and other fruit-related traits during specific periods of tomato fruit development were detected, and the stability and effectiveness of the dynamic QTLs were analyzed. This information will be useful for developing a strategy for gene functional markers that can be used in MAS, and will also enable the implementation of fine mapping and map-based cloning in the future.
MATERIAL AND METHODS
Mapping population
Two hundred and fourteen F2:3 families developed from a cross between an inbred line S0805 (S. lycopersicum) and S0801 (Solanum pimpinellifolium) were cultivated at the research greenhouse of the Northwest A & F University, China. The LYC and SSC genetic backgrounds of S0805 and S0801 are quite different, and all of the samples were from the World Vegetable Center (Tainan, Taiwan). In August 2009, the F1 generation was obtained by crossing S0801 (male) with S0805 (female), and in January 2010, the F2 population was cre-ated from the F1 single seed descent. In February 2010, 214 F2 plants were planted, yielding 214 F2:3 family seeds in July 2010. The F2:3 families were planted, and the related traits were measured between August and December, 2010.
Phenotypic evaluation
LYC, SSC, and other fruit-related traits were measured at 3-fruit development stages: the color-changing period (CP: fruit coloring area is 10-20%), half-ripe period (HP: fruit col-oring area is 60-80%) and full-ripe period (FP: all fruit is colored and non-softening). During the growing season, 5 fruits were harvest randomly from each plant during these three ripen-ing periods, and the following traits were measured with 3 repetitions; fruit weight (FW) was measured using an electronic balance, in grams to the one-thousandth gram.
Five fruits per period were used to measure LYC (in milligrams per 100 grams of fruit); determination of LYC was based on the method of Lavecchia and Zuorro (2008). For each tomato fruit, chromaticity values were measured at 4 positions in the equatorial regions of the fruit, and the average value was used to estimate LYC.
SSC mixed fresh juice (homogenized in a blender) of fruits from each period studied

©FUNPEC-RP www.funpecrp.com.brGenetics and Molecular Research 11 (4): 3696-3710 (2012)
QTL analysis in S. lycopersicum x S. pimpinellifolium cross 3699
was used to measure SSC in Brix using PAL-1 refractometer.Fruit ascorbic acid (AsA) was determined from the mixed fresh juice of fruits from
each period studied using the method of Ma and Cheng (2003).The fruit juice sample used to measure SSC was also used to measure fruit pH (FpH)
with a pH meter.
Statistical analysis
Means, standard deviations, Pearson’s correlation coefficients, and frequency dis-tributions were calculated for each trait for the parents and 214 F2:3 families using SPSS 19.0 and Microsoft Office Excel 2003. Tests for significant differences in means for each trait among the parents and the F2:3 families were carried out using the univariate analysis of variance model.
DNA extraction and SSR reaction
The DNA of the 214 F2 plants and 2 parents were extracted from fresh leaf tissue fol-lowing the method of Fulton et al. (1995). A total of 300 SSR markers were obtained from the SOL Genomics Network (http://sgn.cornell.edu/ [accessed January 23, 2012]) and the VegMarks database (http://vegmarks.nivot.affrc.go.jp/ [accessed January 23, 2012]), and 45 SSR markers were selected to construct a linkage map. Polymerase chain reaction (PCR) consisted of 2.0 μL 10X PCR buffer, 2.0 μL 2.0 mM MgCl2, 2.0 μL 0.2 mM deoxyribonucleotide triphosphate mixture, 4.0 μL 0.05 U/μL Taq DNA polymerase, 0.5 μL 100 μM forward and reverse primers, 4.0 μL 50 ng/μL template DNA, and 5.0 μL double-distilled water; the total volume was 20.0 μL. PCR was performed in an Eppendorf Mastercyler using the following thermal program: initial denaturation at 94°C for 3 min, followed by 40 cycles of 94°C for 1 min, 42-55°C (de-pending on the primer) for 1 min, and 72°C for 2 min, and a final extension at 72°C for 10 min. The products were separated on 6% vertical polyacrylamide gels at 75 W constant power for 90-120 min until xylene cyanol settled toward the bottom of the gel. After electrophoresis, the gel was stained with silver nitrate solution.
Linkage map construction and QTL analysis
Composite interval mapping was used to detect the QTLs for LYC, SSC and other fruit-related traits using the following linear model:
yi = b0 + b*xj* + ∑ bkxjk + εi,
where b0 is the mean of K ≠ i, j + 1, the population b* is the effect of the potential QTL, xj* is
a variate and its value is 1 or 0, bk is the partial regression coefficient of y phenotype on the kth marker, xjk is the genotype of the kth marker on the individual j and its value is 1 or 0, and εi is post-fit residuals. All polymorphic SSR molecular markers were tested with chi-square goodness-of-fit analysis to determine whether the detected stable molecular markers were in accordance with Mendelian segregation. The JoinMap 4.0 software was used to construct a genetic map, and QTL analysis was conducted using MapQTL 6.0.
©FUNPEC-RP www.funpecrp.com.brGenetics and Molecular Research 11 (4): 3696-3710 (2012)
Y.D. Sun et al. 3700
RESULTS
Trait variation
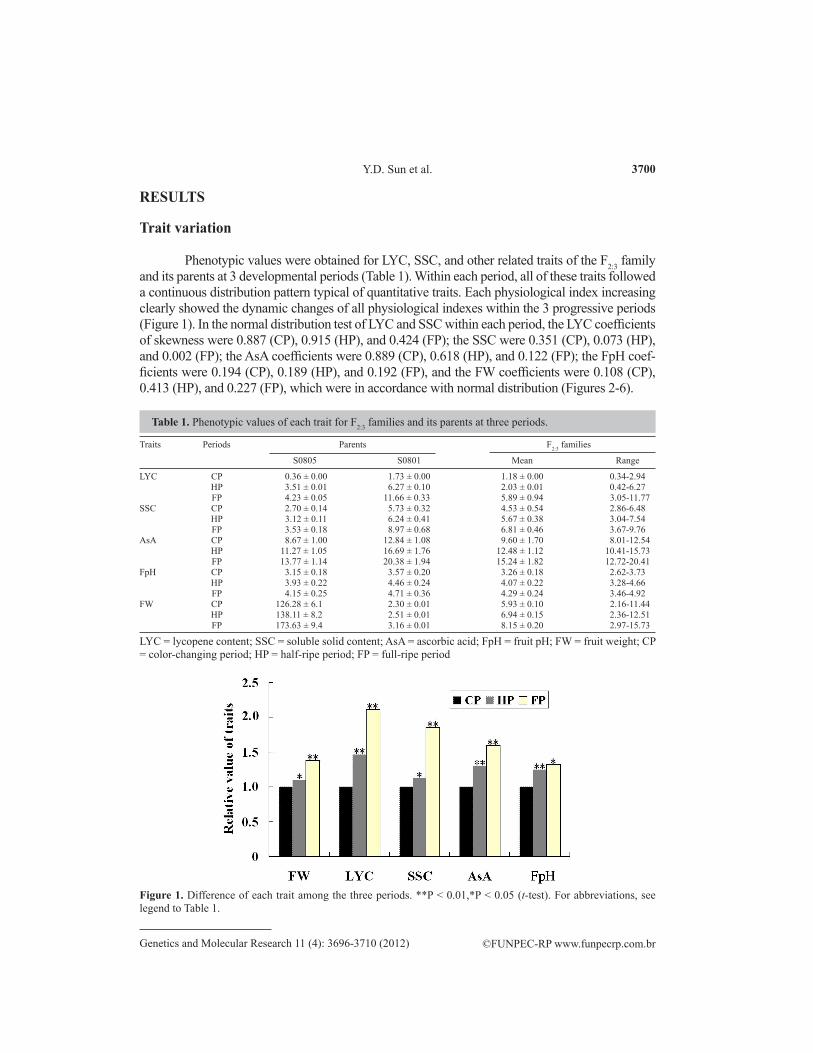
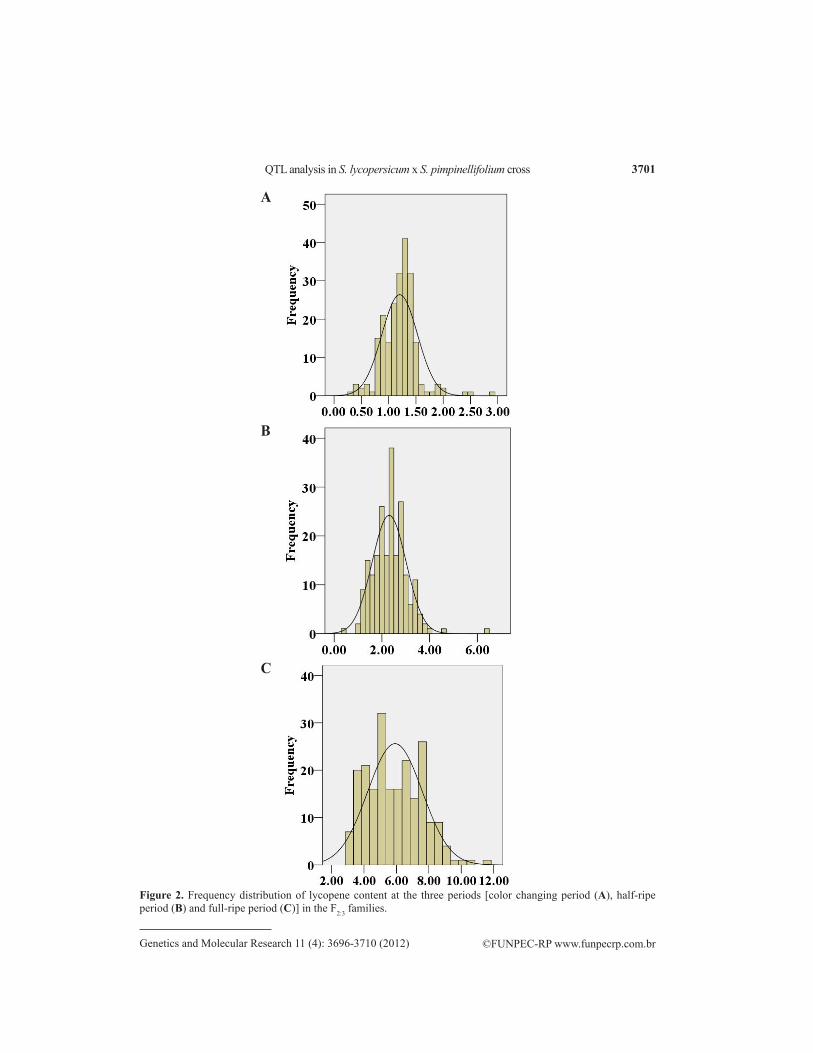
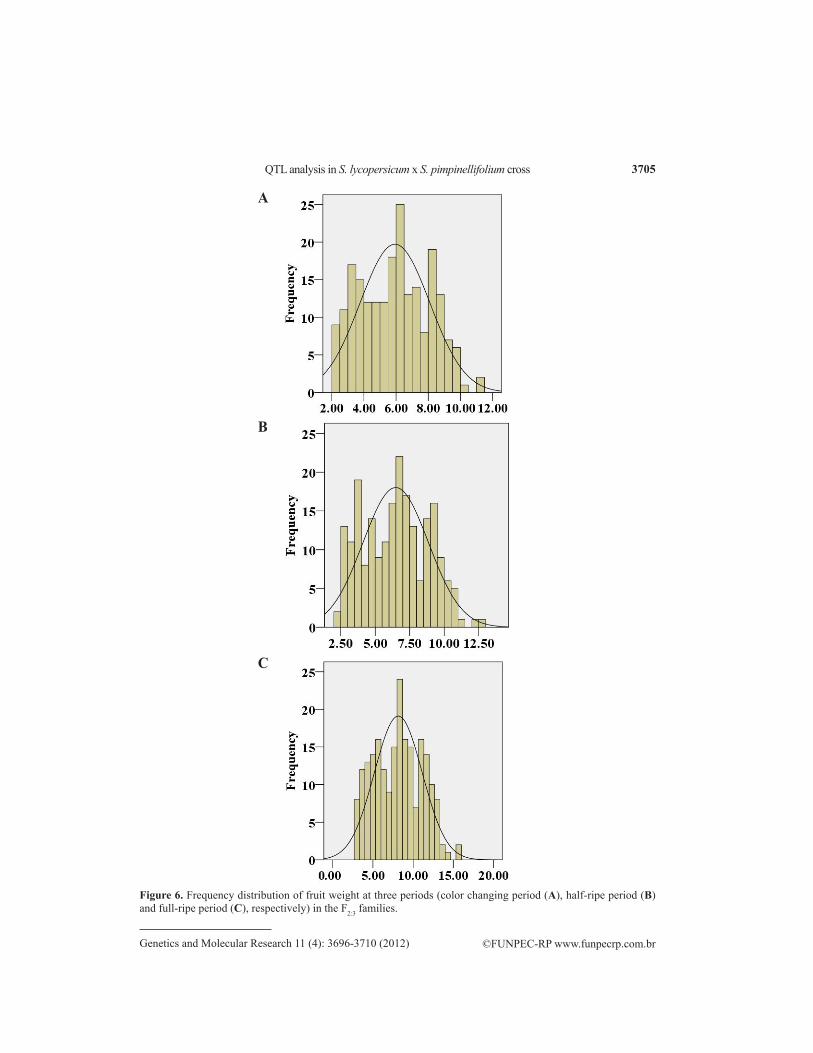
Phenotypic values were obtained for LYC, SSC, and other related traits of the F2:3 family and its parents at 3 developmental periods (Table 1). Within each period, all of these traits followed a continuous distribution pattern typical of quantitative traits. Each physiological index increasing clearly showed the dynamic changes of all physiological indexes within the 3 progressive periods (Figure 1). In the normal distribution test of LYC and SSC within each period, the LYC coefficients of skewness were 0.887 (CP), 0.915 (HP), and 0.424 (FP); the SSC were 0.351 (CP), 0.073 (HP), and 0.002 (FP); the AsA coefficients were 0.889 (CP), 0.618 (HP), and 0.122 (FP); the FpH coef-ficients were 0.194 (CP), 0.189 (HP), and 0.192 (FP), and the FW coefficients were 0.108 (CP), 0.413 (HP), and 0.227 (FP), which were in accordance with normal distribution (Figures 2-6).
Figure 1. Difference of each trait among the three periods. **P < 0.01,*P < 0.05 (t-test). For abbreviations, see legend to Table 1.
Traits Periods Parents F2:3 families
S0805 S0801 Mean Range
LYC CP 0.36 ± 0.00 1.73 ± 0.00 1.18 ± 0.00 0.34-2.94 HP 3.51 ± 0.01 6.27 ± 0.10 2.03 ± 0.01 0.42-6.27 FP 4.23 ± 0.05 11.66 ± 0.33 5.89 ± 0.94 3.05-11.77SSC CP 2.70 ± 0.14 5.73 ± 0.32 4.53 ± 0.54 2.86-6.48 HP 3.12 ± 0.11 6.24 ± 0.41 5.67 ± 0.38 3.04-7.54 FP 3.53 ± 0.18 8.97 ± 0.68 6.81 ± 0.46 3.67-9.76AsA CP 8.67 ± 1.00 12.84 ± 1.08 9.60 ± 1.70 8.01-12.54 HP 11.27 ± 1.05 16.69 ± 1.76 12.48 ± 1.12 10.41-15.73 FP 13.77 ± 1.14 20.38 ± 1.94 15.24 ± 1.82 12.72-20.41FpH CP 3.15 ± 0.18 3.57 ± 0.20 3.26 ± 0.18 2.62-3.73 HP 3.93 ± 0.22 4.46 ± 0.24 4.07 ± 0.22 3.28-4.66 FP 4.15 ± 0.25 4.71 ± 0.36 4.29 ± 0.24 3.46-4.92FW CP 126.28 ± 6.1 2.30 ± 0.01 5.93 ± 0.10 2.16-11.44 HP 138.11 ± 8.2 2.51 ± 0.01 6.94 ± 0.15 2.36-12.51 FP 173.63 ± 9.4 3.16 ± 0.01 8.15 ± 0.20 2.97-15.73
Table 1. Phenotypic values of each trait for F2:3 families and its parents at three periods.
LYC = lycopene content; SSC = soluble solid content; AsA = ascorbic acid; FpH = fruit pH; FW = fruit weight; CP = color-changing period; HP = half-ripe period; FP = full-ripe period
©FUNPEC-RP www.funpecrp.com.brGenetics and Molecular Research 11 (4): 3696-3710 (2012)
QTL analysis in S. lycopersicum x S. pimpinellifolium cross 3701
Figure 2. Frequency distribution of lycopene content at the three periods [color changing period (A), half-ripe period (B) and full-ripe period (C)] in the F2:3 families.
A
B
C

©FUNPEC-RP www.funpecrp.com.brGenetics and Molecular Research 11 (4): 3696-3710 (2012)
Y.D. Sun et al. 3702
Figure 3. Frequency distribution of soluble solid content at the three periods [color changing period (A), half-ripe period (B) and full-ripe period (C)] in the F2:3 families.
A
B
C

©FUNPEC-RP www.funpecrp.com.brGenetics and Molecular Research 11 (4): 3696-3710 (2012)
QTL analysis in S. lycopersicum x S. pimpinellifolium cross 3703
Figure 4. Frequency distribution of ascorbic acid at the three periods [color changing period (A), half-ripe period (B) and full-ripe period (C)] in the F2:3 families.
A
B
C

©FUNPEC-RP www.funpecrp.com.brGenetics and Molecular Research 11 (4): 3696-3710 (2012)
Y.D. Sun et al. 3704
Figure 5. Frequency distribution of fruit pH at the three periods [color changing period (A), half-ripe period (B) and full-ripe period (C)] in the F2:3 families.
A
B
C
©FUNPEC-RP www.funpecrp.com.brGenetics and Molecular Research 11 (4): 3696-3710 (2012)
QTL analysis in S. lycopersicum x S. pimpinellifolium cross 3705
Figure 6. Frequency distribution of fruit weight at three periods (color changing period (A), half-ripe period (B) and full-ripe period (C), respectively) in the F2:3 families.
A
B
C

©FUNPEC-RP www.funpecrp.com.brGenetics and Molecular Research 11 (4): 3696-3710 (2012)
Y.D. Sun et al. 3706
Correlations among traits
Family mean correlation coefficients for traits measured during the 3 periods are pre-sented in Tables 2-4.
The strongest negative correlations were observed between LYC and FW in the 3 periods. LYC was positively correlated with AsA in the HP and FP. A negative correlation was observed between SSC and FW in the CP and strongest negative correlations were observed in other peri-ods. SSC was highly positive correlated with FpH in the HP, and positively correlated in the FP. Otherwise, the strongest negative correlations were observed between FW and AsA in the HP, and the strongest positive correlations were observed between AsA and FpH in the CP and HP. LYC was positively correlated with SSC in the HP and highly positively correlated in the FP.
Genetic map and QTL analysis
The linkage map totaled 218 cM of the tomato genome with an average genetic dis-tance between markers of 4.84 cM. The lowest genetic distance was 0.047 cM. Fifteen QTLs were detected for LYC and SSC evaluated in the 3 periods evaluated (Table 5 and Figure 7), which explained 7-33% of the individual phenotypic variation. All of the detected QTLs were co-located in a single locus on chromosomes 1, 4, and 9. The QTLs identified for LYC and SSC are summarized in Table 5.
Two QTLs for LYC in the CP were detected on chromosomes 4 and 9. Molecular marker SSR146 (chromosomes 4) accounted for 15% of the phenotypic variation, and SSR110 (chromosomes 9) accounted for 31% of the phenotypic variation. In contrast, only one LYC
FW LYC SSC AsA
LYC -0.402**SSC -0.189* 0.146AsA -0.151 0.131 0.093FpH 0.114 -0.142 0.087 0.179**
Table 2. Correlations among traits in the color-changing period.
*P < 0.05; **P < 0.01. For abbreviations, see legend to Table 1.
FW LYC SSC AsA
LYC -0.317**SSC -0.249** 0.181*AsA -0.257** 0.175* 0.149FpH 0.105 -0.149 0.251** 0.234**
Table 3. Correlations among traits in the half-ripe period.
*P < 0.05; **P < 0.01. For abbreviations, see legend to Table 1.
FW LYC SSC AsA
LYC -0.420**SSC -0.430** 0.276**AsA -0.123 0.211* 0.050FpH 0.091 -0.147 0.222* -0.109
Table 4. Correlations among traits in the full-ripe period.
*P < 0.05; **P < 0.01. For abbreviations, see legend to Table 1.

©FUNPEC-RP www.funpecrp.com.brGenetics and Molecular Research 11 (4): 3696-3710 (2012)
QTL analysis in S. lycopersicum x S. pimpinellifolium cross 3707
QTL in the HP was detected on chromosomes 9 by SSR237, and it explained as much as 16% of the phenotypic variation. Three QTLs were detected in the FP for LYC by SSR146 (chro-mosomes 4), SSR111 (chromosomes 4) and SSR237 (chromosomes 9), the phenotypic varia-tions were 20, 16, and 17%, respectively.
Figure 7. Mapping quantitative trait loci for lycopene content and soluble solid content in tomato. SSR = simple sequence repeat. For abbreviations, see legend to Table 1.
One QTL for SSC was detected in the CP and 2 QTLs for SSC were detected in the FP. The SSC QTL in the CP was co-located with the SSC QTL in the FP on chromosome 1 by SSR67, accounting for 12% of the phenotypic variation in the CP and 33% of the phenotypic variation in the FP. Another SSC QTL in the FP was detected on chromosome 4 by SSR111 and accounted for 23% of the phenotypic variation.
Traits Period QTL molecular marker Chromosome QTL position (cM) LOD score Additive effect R2
LYC CP SSR146 4 22.164 3.33 2.1224 0.15 SSR110 9 18.691 4.43 -1.1597 0.31 HP SSR237 9 22.108 2.78 2.1752 0.16 FP SSR146 4 22.164 5.84 1.5446 0.20 SSR111 4 30.094 2.99 1.1434 0.16 SSR237 9 22.108 4.53 1.7675 0.17SSC CP SSR67 1 55.811 2.68 -0.8373 0.12 FP SSR67 1 55.811 3.07 -0.7898 0.33 SSR111 4 30.094 2.66 2.3282 0.23FW HP SSR300 4 52.411 3.05 -2.1264 0.24 FP SSR45 7 5.864 2.94 -1.1649 0.19AsA FP SSR111 1 10.005 2.73 0.9781 0.07FpH CP LEaat004 1 42.814 3.32 -0.1732 0.11 HP SSR304 7 15.722 4.25 1.3427 0.21 FP SSR85 10 13.126 2.84 -1.7934 0.13
Table 5. Quantitative trait loci, their position, additive effects, and percentage of phenotypic variation explained (R2) for LYC and SSC in the F2:3 population developed from Solanum lycopersicum x S. pimpinellifolium.
QTL = quantitative trait locus; LOD = logarithm of the odds. For abbreviations, see legend to Table 1.

©FUNPEC-RP www.funpecrp.com.brGenetics and Molecular Research 11 (4): 3696-3710 (2012)
Y.D. Sun et al. 3708
Two QTLs for FW in the HP and FP were detected on chromosomes 4 (SSR300) and 7 (SSR45). The molecular marker SSR300 accounted for 24% of the phenotypic variation, whereas SSR45 accounted for 19% of the phenotypic variation. Only one QTL was detected on chromosome 1 (SSR111) and accounted for 7% of the phenotypic variation. One QTL for FpH was detected in each period on chromosomes 1 (LEaat004), 7 (SSR304), and 10 (SSR85), and the phenotypic variations were 11, 21, and 13%, respectively.
DISCUSSION
S. pimpinellifolium has repeatedly served as a source of many important traits for horticulture improvement, making it an important genetic resource and a conservation pri-ority (Cagas et al., 2008). S. pimpinellifolium harbors numerous desirable horticultural and agronomic characteristics, such as good fruit quality. The LYC and SSC of S. pimpinellifolium are higher than those of the cultivated tomato, and high LYC and SSC gene introgression to cultivated tomatoes would be beneficial for the implementation of tomato fruit qualities.
As indicated earlier, several major genes with significant contribution to high LYC and SSC contents were previously identified and mapped onto the classical linkage map of tomato (Foolad, 2007). In this study, the dynamic QTLs for LYC and SSC were first developed using a crossed population from S. lycopersicum and S. pimpinellifolium. The molecular markers SSR146 in the CP and FP, and SSR237 in the HP and FP for LYC were identified, which may reflect that some genes for controlling LYC are always expressed in tomato fruit development. The molecular marker SSR110 for LYC was identified in the CP, but not in the HP or FP. The molecular marker SSR146 for LYC was not identified in the HP, and the molecular marker SSR237 for LYC was not identified in the CP, which may reveal that some genes for control-ling the LYC are ever changing in tomato fruit development, and the expression of these genes would be limited by time. We also identified the SSC molecular marker SSR67 in the CP and FP, and identified SSC molecular marker SSR111 in the FP, but we did not identify any SSC molecular markers in the HP. The genetic molecular markers may cover only a few genomes, and the SSC molecular markers could exist in other chromosomes.
LYC and SSC were the target traits for several QTL mapping studies in tomato using in-terspecific crosses between a cultivated tomato and a related wild species. Several reports (Chen et al., 1999; Yong-Sheng et al., 2003; Foolad, 2007; Sonah et al., 2011) have concluded that QTLs for LYC are present in all tomato chromosomes except chromosome 9, but we identified LYC QTL on chromosome 9 in the CP (SSR110), HP and FP (SSR237) that accounted for 16-17% of the phenotypic variation. This discovery may be useful for tomato breeders using MAS.
The LYC QTL on chromosome 4 in the FP was co-located with the SSC QTL. Cagas et al. (2008) have reported that QTLs for tomato FW and days to flowering were co-located. Kuan-Hung et al. (2010) have reported a co-location of FW and Brix QTLs. In most case, traits that were co-localized showed significant correlations with each other (Doganlar et al., 2002). Thus, the co-localization of QTLs and correlations between LYC and SSC may be due to pleiotropic effects of a single gene or a cluster of genes via physiological relationships among traits because they were found to be highly significantly correlated. However, separat-ing linkage and pleiotropy is nearly impossible, unless QTLs have been cloned. Several novel QTLs for LYC and SSC were identified in this study, which aimed to assess the implication of dynamic changes during the course of fruit development and maturation. Our study could
©FUNPEC-RP www.funpecrp.com.brGenetics and Molecular Research 11 (4): 3696-3710 (2012)
QTL analysis in S. lycopersicum x S. pimpinellifolium cross 3709
contribute in helping to breeding programmes as tomato breeders are more likely to seek im-provements to LYC and SSC.
We detected one QTL in each period for FpH, and detected 2 QTLs for FW in the HP and FP. Molecular mapping studies have revealed that the genetic control of FW and FpH are extraordinarily complex (Chen et al., 1999; Causse et al., 2004; Frary et al., 2004; Foolad, 2007; Cagas et al., 2008; Sonah et al., 2011). Several QTLs were co-located with the FW and FpH QTLs, but our study revealed few QTLs co-located with those for FW and FpH. Only one QTL for AsA was found in the FP, and few studies have investigated the AsA of tomato. Confirmation of these QTLs is currently in progress in our laboratory.
ACKNOWLEDGMENTS
Research supported by grants from the Program for Transforming Agricultural Sci-ence and Technology (#2009GB2G00362), and the Coordination and Innovation Project of Shaanxi Province (#2011KTCL02-03).
REFERENCES
Arazuri S, Jarén C, Arana JI and Pérez de Ciriza JJ (2007). Influence of mechanical harvest on the physical properties of processing tomato (Lycopersicon esculentum Mill.). J. Food Eng. 80: 190-198.
Bernacchi D, Beck-Bunn T, Eshed Y, Lopez J, et al. (1998). Advanced backcross QTL analysis in tomato. I. Identification of QTLs for traits of agronomic importance from Lycopersicon hirsutum. Theor. Appl. Genet. 97: 381-397.
Cagas CC, Lee OL, Keisuke N and Nobuo S (2008). Quantitative trait loci controlling flowering time and related traits in a Solanum lycopersicum x S. pimpinellifolium cross. Sci. Hort. 116: 144-151.
Causse M, Saliba-Colombani V, Lecomte L, Duffe P, et al. (2002). QTL analysis of fruit quality in fresh market tomato: a few chromosome regions control the variation of sensory and instrumental traits. J. Exp. Bot. 53: 2089-2098.
Causse M, Duffe P, Gomez MC, Buret M, et al. (2004). A genetic map of candidate genes and QTLs involved in tomato fruit size and composition. J. Exp. Bot. 55: 1671-1685.
Causse M, Chaib J, Lecomte L, Buret M, et al. (2007). Both additivity and epistasis control the genetic variation for fruit quality traits in tomato. Theor. Appl. Genet. 115: 429-442.
Chaib J, Lecomte L, Buret M and Causse M (2006). Stability over genetic backgrounds, generations and years of quantitative trait locus (QTLs) for organoleptic quality in tomato. Theor. Appl. Genet. 112: 934-944.
Chen FQ, Foolad MR, Hyman J, Clair DASt, et al. (1999). Mapping of QTLs for lycopene and other fruit traits in a Lycopersicon esculentum x L. pimpinellifolium cross and comparison of QTLs across tomato species. Mol. Breed. 5: 283-299.
Doganlar S, Frary A, Ku HM and Tanksley SD (2002). Mapping quantitative trait loci in inbred backcross lines of Lycopersicon pimpinellifolium (LA1589). Genome 45: 1189-1202.
Eshed Y and Zamir D (1996). Less-than-additive epistatic interactions of quantitative trait loci in tomato. Genetics 143: 1807-1817.
Foolad MR (2007). Genome mapping and molecular breeding of tomato. Int. J. Plant Genomics 2007: 64358.Frary A, Fulton TM, Zamir D and Tanksley SD (2004). Advanced backcross QTL analysis of a Lycopersicon esculentum
x L. pennellii cross and identification of possible orthologs in the Solanaceae. Theor. Appl. Genet. 108: 485-496.Fulton TM, Chunwingse J and Tanksley SD (1995). Microprep protocol for extraction of DNA from tomato and other
herbaceous plants. Plant Mol. Biol. Rep. 13: 207-209.Fulton TM, Beck-Bunn T, Emmatty D, Eshed Y, et al. (1997). QTL analysis of an advanced backcross of Lycopersicon
peruvianum to the cultivated tomato and comparisons with QTLs found in other wild species. Theor. Appl. Genet. 95: 881-894.
Fulton TM, Grandillo S, Beck-Bunn T, Fridman E, et al. (2000). Advanced backcross QTL analysis of a Lycopersicon esculentum x Lycopersicon parviflorum cross. Theor. Appl. Genet. 100: 1025-1042.
Grandillo S and Tanksley SD (1996). QTL analysis of horticultural traits differentiating the cultivated tomato from the closely related species Lycopersicon pimpinellifolium. Theor. Appl. Genet. 92: 935-951.

©FUNPEC-RP www.funpecrp.com.brGenetics and Molecular Research 11 (4): 3696-3710 (2012)
Y.D. Sun et al. 3710
Grandillo S, Ku HM and Tanksley SD (1999). Identifying the loci responsible for natural variation in fruit size and shape in tomato. Theor. Appl. Genet. 99: 978-987.
Gur A and Zamir D (2004). Unused natural variation can lift yield barriers in plant breeding. PLoS Biol. 2: e245.Gur A, Semel Y, Osorio S, Friedmann M, et al. (2011). Yield quantitative trait loci from wild tomato are predominately
expressed by the shoot. Theor. Appl. Genet. 122: 405-420.Heather EY, Anne F, Sami D, Anna F, et al. (2004). Comparative fine mapping of fruit quality QTLs on chromosome 4
introgressions derived from two wild tomato species. Euphytica 135: 283-296.Kader AA (1986). Effects of postharvest handling procedures on tomato quality. Acta Hort. 190: 209-221.Ku HM, Grandillo S and Tanksley SD (2000). fs8.1, a major QTL, sets the pattern of tomato carpel shape well before
anthesis. Theor. Appl. Genet. 101: 873-878.Kuan-Hung L, Wei-Lung Y, Huei-Mei C and Hsiao-Feng L (2010). Quantitative trait loci influencing fruit-related
characteristics of tomato grown in high-temperature conditions. Euphytica 174: 119-135.Lavecchia R and Zuorro A (2008). Improved lycopene extraction from tomato peels using cell-wall degrading enzymes.
Eur. Food Res. Technol. 228: 153-158.Lecomte L, Duffe P, Buret M, Servin B, et al. (2004). Marker-assisted introgression of five QTLs controlling fruit quality traits
into three tomato lines revealed interactions between QTLs and genetic backgrounds. Theor. Appl. Genet. 109: 658-668.Ma F and Cheng L (2003). The sun-exposed peel of apple fruit has higher xanthophyll cycle-dependent thermal dissipation
and antioxidants of the ascorbate-glutathione pathway than the shaded peel. Plant Sci. 165: 819-827. Riadh I, Chafik H, Marcello SL, Imen T, et al. (2011). Antioxidant activity and bioactive compound changes during fruit
ripening of high-lycopene tomato cultivars. J. Food Compost. Anal. 24: 588-595.Roberto L and Antonio Z (2008). Improved lycopene extraction from tomato peels using cell-wall degrading enzymes.
Eur. Food Res. Technol. 228: 153-158. Rousseaux MC, Jones CM, Adams D, Chetelat R, et al. (2005). QTL analysis of fruit antioxidants in tomato using
Lycopersicon pennellii introgression lines. Theor. Appl. Genet. 111: 1396-1408.Saliba-Colombani V, Causse M, Langlois D, Philouze J, et al. (2001). Genetic analysis of organoleptic quality in fresh
market tomato. 1. Mapping QTLs for physical and chemical traits. Theor. Appl. Genet. 102: 259-272. Semel Y, Nissenbaum J, Menda N, Zinder M, et al. (2006). Overdominant quantitative trait loci for yield and fitness in
tomato. Proc. Natl. Acad. Sci. U. S. A. 103: 12981-12986.Shirasawa K, Asamizu E, Fukuoka H, Ohyama A, et al. (2010). An interspecific linkage map of SSR and intronic
polymorphism markers in tomato. Theor. Appl. Genet. 121: 731-739.Sonah H, Deshmukh RK, Singh VP, Gupta DK, et al. (2011). Genomic resources in horticultural crops: status, utility and
challenges. Biotechnol. Adv. 29: 199-209.Tanksley SD, Grandillo S, Fulton TM, Zamir D, et al. (1996). Advanced backcross QTL analysis in a cross between an
elite processing line of tomato and its wild relative L. pimpinellifolium. Theor. Appl. Genet. 92: 213-224.Thorup TA, Tanyolac B, Livingstone KD, Popovsky S, et al. (2000). Candidate gene analysis of organ pigmentation loci
in the Solanaceae. Proc. Natl. Acad. Sci. U. S. A. 97: 11192-11197.Wu M and Kubota C (2008). Effects of high electrical conductivity of nutrient solution and its application timing on
lycopene, chlorophyll and sugar concentrations of hydroponic tomatoes during ripening. Sci. Hort. 116: 122-129.Yong-Sheng L, Amit G, Ronen G, Causse M, et al. (2003). There is more to tomato fruit colour than candidate carotenoid
genes. Plant Biotechnol. J. 1: 195-207.