Dynamic performance measurement control Dynamic event grouping Multiple configurable counters...
4
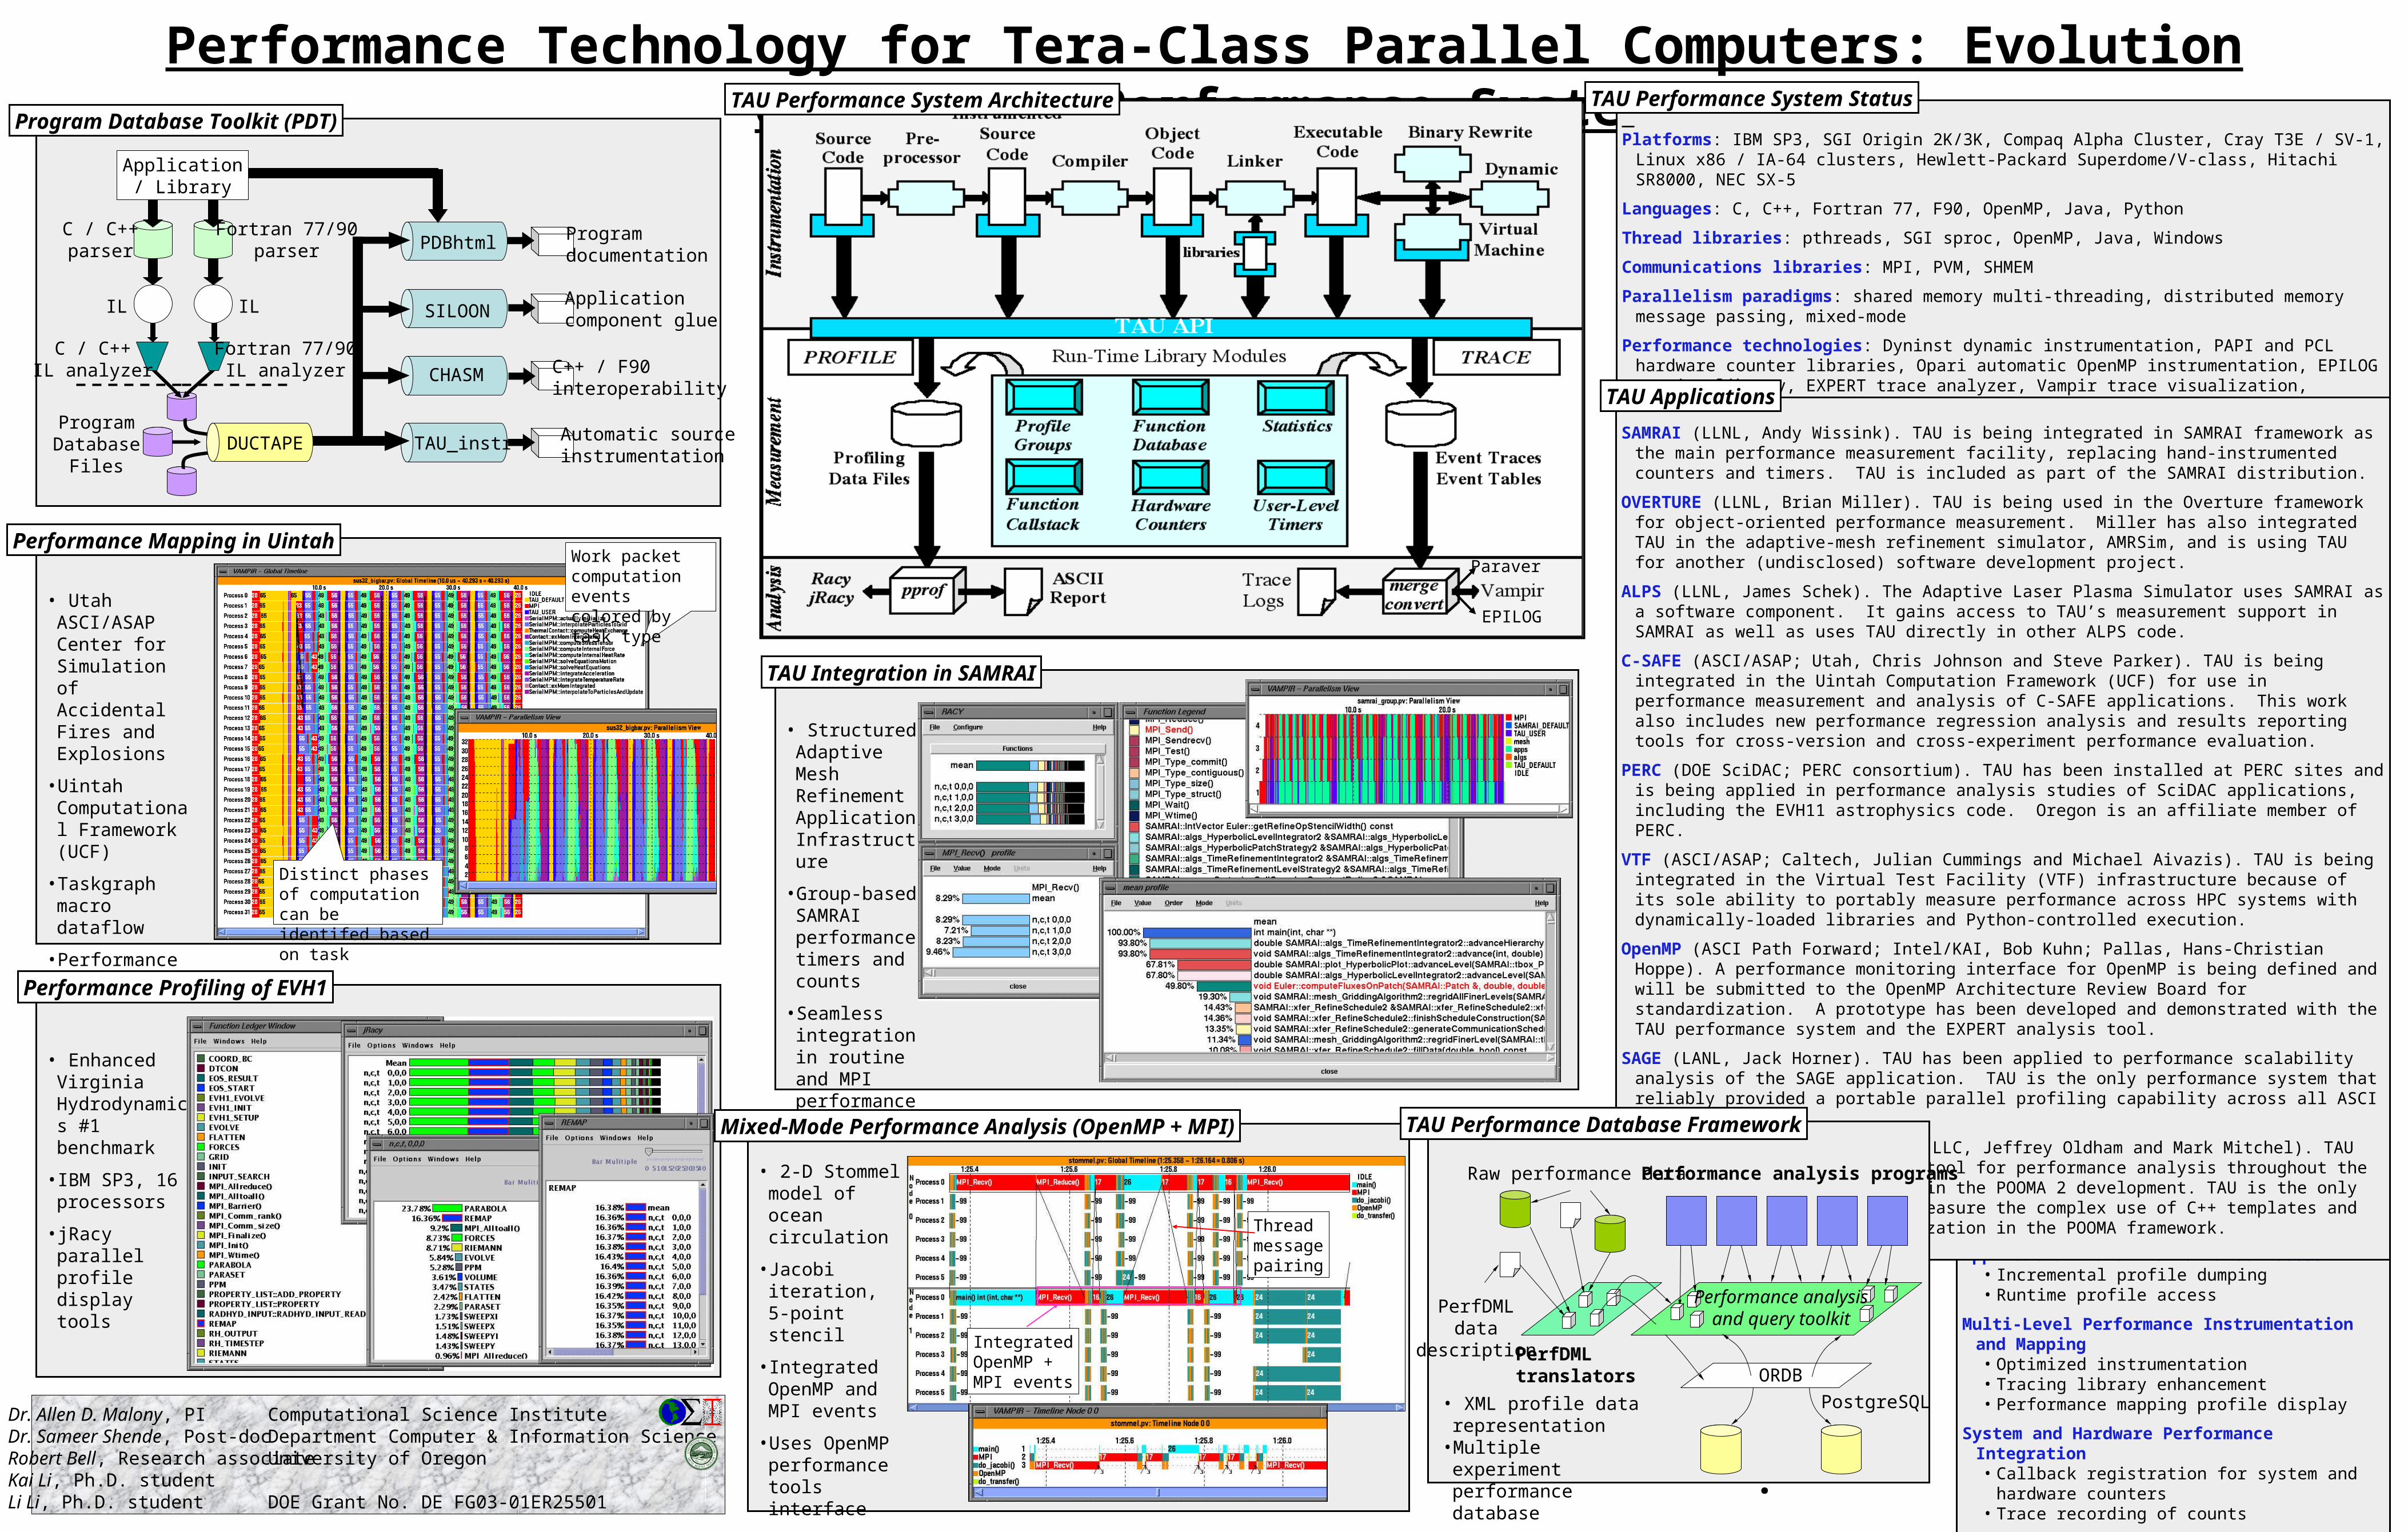
Dynamic performance measurement control • Dynamic event grouping • Multiple configurable counters • Selective instrumentation Application-Level Performance Access • Incremental profile dumping • Runtime profile access Multi-Level Performance Instrumentation and Mapping • Optimized instrumentation • Tracing library enhancement • Performance mapping profile display System and Hardware Performance Integration • Callback registration for system and hardware counters • Trace recording of counts Project Goals and Recent Accomplishments Performance Technology for Tera-Class Parallel Computers: Evolution of the TAU Performance System Application / Library C / C++ parser Fortran 77/90 parser C / C++ IL analyzer Fortran 77/90 IL analyzer Program Database Files IL IL DUCTAPE PDBhtml SILOON CHASM TAU_instr Program documentation Application component glue C++ / F90 interoperability Automatic source instrumentation Program Database Toolkit (PDT) Platforms: IBM SP3, SGI Origin 2K/3K, Compaq Alpha Cluster, Cray T3E / SV-1, Linux x86 / IA-64 clusters, Hewlett-Packard Superdome/V-class, Hitachi SR8000, NEC SX-5 Languages: C, C++, Fortran 77, F90, OpenMP, Java, Python Thread libraries: pthreads, SGI sproc, OpenMP, Java, Windows Communications libraries: MPI, PVM, SHMEM Parallelism paradigms: shared memory multi-threading, distributed memory message passing, mixed-mode Performance technologies: Dyninst dynamic instrumentation, PAPI and PCL hardware counter libraries, Opari automatic OpenMP instrumentation, EPILOG tracing library, EXPERT trace analyzer, Vampir trace visualization, Paraver trace visualization TAU Performance System Status SAMRAI (LLNL, Andy Wissink). TAU is being integrated in SAMRAI framework as the main performance measurement facility, replacing hand-instrumented counters and timers. TAU is included as part of the SAMRAI distribution. OVERTURE (LLNL, Brian Miller). TAU is being used in the Overture framework for object-oriented performance measurement. Miller has also integrated TAU in the adaptive-mesh refinement simulator, AMRSim, and is using TAU for another (undisclosed) software development project. ALPS (LLNL, James Schek). The Adaptive Laser Plasma Simulator uses SAMRAI as a software component. It gains access to TAU’s measurement support in SAMRAI as well as uses TAU directly in other ALPS code. C-SAFE (ASCI/ASAP; Utah, Chris Johnson and Steve Parker). TAU is being integrated in the Uintah Computation Framework (UCF) for use in performance measurement and analysis of C-SAFE applications. This work also includes new performance regression analysis and results reporting tools for cross-version and cross-experiment performance evaluation. PERC (DOE SciDAC; PERC consortium). TAU has been installed at PERC sites and is being applied in performance analysis studies of SciDAC applications, including the EVH11 astrophysics code. Oregon is an affiliate member of PERC. VTF (ASCI/ASAP; Caltech, Julian Cummings and Michael Aivazis). TAU is being integrated in the Virtual Test Facility (VTF) infrastructure because of its sole ability to portably measure performance across HPC systems with dynamically-loaded libraries and Python-controlled execution. OpenMP (ASCI Path Forward; Intel/KAI, Bob Kuhn; Pallas, Hans-Christian Hoppe). A performance monitoring interface for OpenMP is being defined and will be submitted to the OpenMP Architecture Review Board for standardization. A prototype has been developed and demonstrated with the TAU performance system and the EXPERT analysis tool. SAGE (LANL, Jack Horner). TAU has been applied to performance scalability analysis of the SAGE application. TAU is the only performance system that reliably provided a portable parallel profiling capability across all ASCI platforms. POOMA II (LANL / Code Sourcery LLC, Jeffrey Oldham and Mark Mitchel). TAU has been used as the primary tool for performance analysis throughout the POOMA project, most recently in the POOMA 2 development. TAU is the only tool able to instrument and measure the complex use of C++ templates and expression template parallelization in the POOMA framework. TAU Applications EPILOG Paraver TAU Performance System Architecture Work packet computation events colored by task type Distinct phases of computation can be identifed based on task Performance Mapping in Uintah • Utah ASCI/ASAP Center for Simulation of Accidental Fires and Explosions •Uintah Computationa l Framework (UCF) •Taskgraph macro dataflow •Performance mapping based on task semantics Performance Profiling of EVH1 • Enhanced Virginia Hydrodynamic s #1 benchmark •IBM SP3, 16 processors •jRacy parallel profile display tools TAU Integration in SAMRAI • Structured Adaptive Mesh Refinement Application Infrastruct ure •Group-based SAMRAI performance timers and counts •Seamless integration in routine and MPI performance measurement Integrated OpenMP + MPI events Thread message pairing Mixed-Mode Performance Analysis (OpenMP + MPI) • 2-D Stommel model of ocean circulation •Jacobi iteration, 5-point stencil •Integrated OpenMP and MPI events •Uses OpenMP performance tools interface •Automatic Dr. Allen D. Malony, PI Dr. Sameer Shende, Post-doc Robert Bell, Research associate Kai Li, Ph.D. student Li Li, Ph.D. student Computational Science Institute Department Computer & Information Science University of Oregon DOE Grant No. DE FG03-01ER25501 . . . Raw performance data PerfDML data description Performance analysis programs PerfDML translators Performance analysis and query toolkit ORDB PostgreSQL TAU Performance Database Framework • XML profile data representation •Multiple experiment performance database
-
Upload
earl-allen -
Category
Documents
-
view
230 -
download
4
Transcript of Dynamic performance measurement control Dynamic event grouping Multiple configurable counters...
Dynamic performance measurement control
• Dynamic event grouping• Multiple configurable counters• Selective instrumentation
Application-Level Performance Access• Incremental profile dumping• Runtime profile access
Multi-Level Performance Instrumentation and Mapping• Optimized instrumentation• Tracing library enhancement• Performance mapping profile display
System and Hardware Performance Integration• Callback registration for system and hardware counters• Trace recording of counts
Project Goals and Recent Accomplishments
Performance Technology for Tera-Class Parallel Computers: Evolution of the TAU Performance System
Application/ Library
C / C++parser
Fortran 77/90parser
C / C++IL analyzer
Fortran 77/90IL analyzer
ProgramDatabase
Files
IL IL
DUCTAPE
PDBhtml
SILOON
CHASM
TAU_instr
Programdocumentation
Applicationcomponent glue
C++ / F90interoperability
Automatic sourceinstrumentation
Program Database Toolkit (PDT) Platforms: IBM SP3, SGI Origin 2K/3K, Compaq Alpha Cluster, Cray T3E / SV-1, Linux x86 / IA-64 clusters,
Hewlett-Packard Superdome/V-class, Hitachi SR8000, NEC SX-5
Languages: C, C++, Fortran 77, F90, OpenMP, Java, Python
Thread libraries: pthreads, SGI sproc, OpenMP, Java, Windows
Communications libraries: MPI, PVM, SHMEM
Parallelism paradigms: shared memory multi-threading, distributed memory message passing, mixed-mode
Performance technologies: Dyninst dynamic instrumentation, PAPI and PCL hardware counter libraries, Opari automatic OpenMP instrumentation, EPILOG tracing library, EXPERT trace analyzer, Vampir trace visualization, Paraver trace visualization
TAU Performance System Status
SAMRAI (LLNL, Andy Wissink). TAU is being integrated in SAMRAI framework as the main performance measurement facility, replacing hand-instrumented counters and timers. TAU is included as part of the SAMRAI distribution.
OVERTURE (LLNL, Brian Miller). TAU is being used in the Overture framework for object-oriented performance measurement. Miller has also integrated TAU in the adaptive-mesh refinement simulator, AMRSim, and is using TAU for another (undisclosed) software development project.
ALPS (LLNL, James Schek). The Adaptive Laser Plasma Simulator uses SAMRAI as a software component. It gains access to TAU’s measurement support in SAMRAI as well as uses TAU directly in other ALPS code.
C-SAFE (ASCI/ASAP; Utah, Chris Johnson and Steve Parker). TAU is being integrated in the Uintah Computation Framework (UCF) for use in performance measurement and analysis of C-SAFE applications. This work also includes new performance regression analysis and results reporting tools for cross-version and cross-experiment performance evaluation.
PERC (DOE SciDAC; PERC consortium). TAU has been installed at PERC sites and is being applied in performance analysis studies of SciDAC applications, including the EVH11 astrophysics code. Oregon is an affiliate member of PERC.
VTF (ASCI/ASAP; Caltech, Julian Cummings and Michael Aivazis). TAU is being integrated in the Virtual Test Facility (VTF) infrastructure because of its sole ability to portably measure performance across HPC systems with dynamically-loaded libraries and Python-controlled execution.
OpenMP (ASCI Path Forward; Intel/KAI, Bob Kuhn; Pallas, Hans-Christian Hoppe). A performance monitoring interface for OpenMP is being defined and will be submitted to the OpenMP Architecture Review Board for standardization. A prototype has been developed and demonstrated with the TAU performance system and the EXPERT analysis tool.
SAGE (LANL, Jack Horner). TAU has been applied to performance scalability analysis of the SAGE application. TAU is the only performance system that reliably provided a portable parallel profiling capability across all ASCI platforms.
POOMA II (LANL / Code Sourcery LLC, Jeffrey Oldham and Mark Mitchel). TAU has been used as the primary tool for performance analysis throughout the POOMA project, most recently in the POOMA 2 development. TAU is the only tool able to instrument and measure the complex use of C++ templates and expression template parallelization in the POOMA framework.
TAU Applications
EPILOG
Paraver
TAU Performance System Architecture
Work packet computation events colored by task type
Distinct phases of computation can be identifed based on task
Performance Mapping in Uintah
• Utah ASCI/ASAP Center for Simulation of Accidental Fires and Explosions
• Uintah Computational Framework (UCF)
• Taskgraph macro dataflow
• Performance mapping based on task semantics
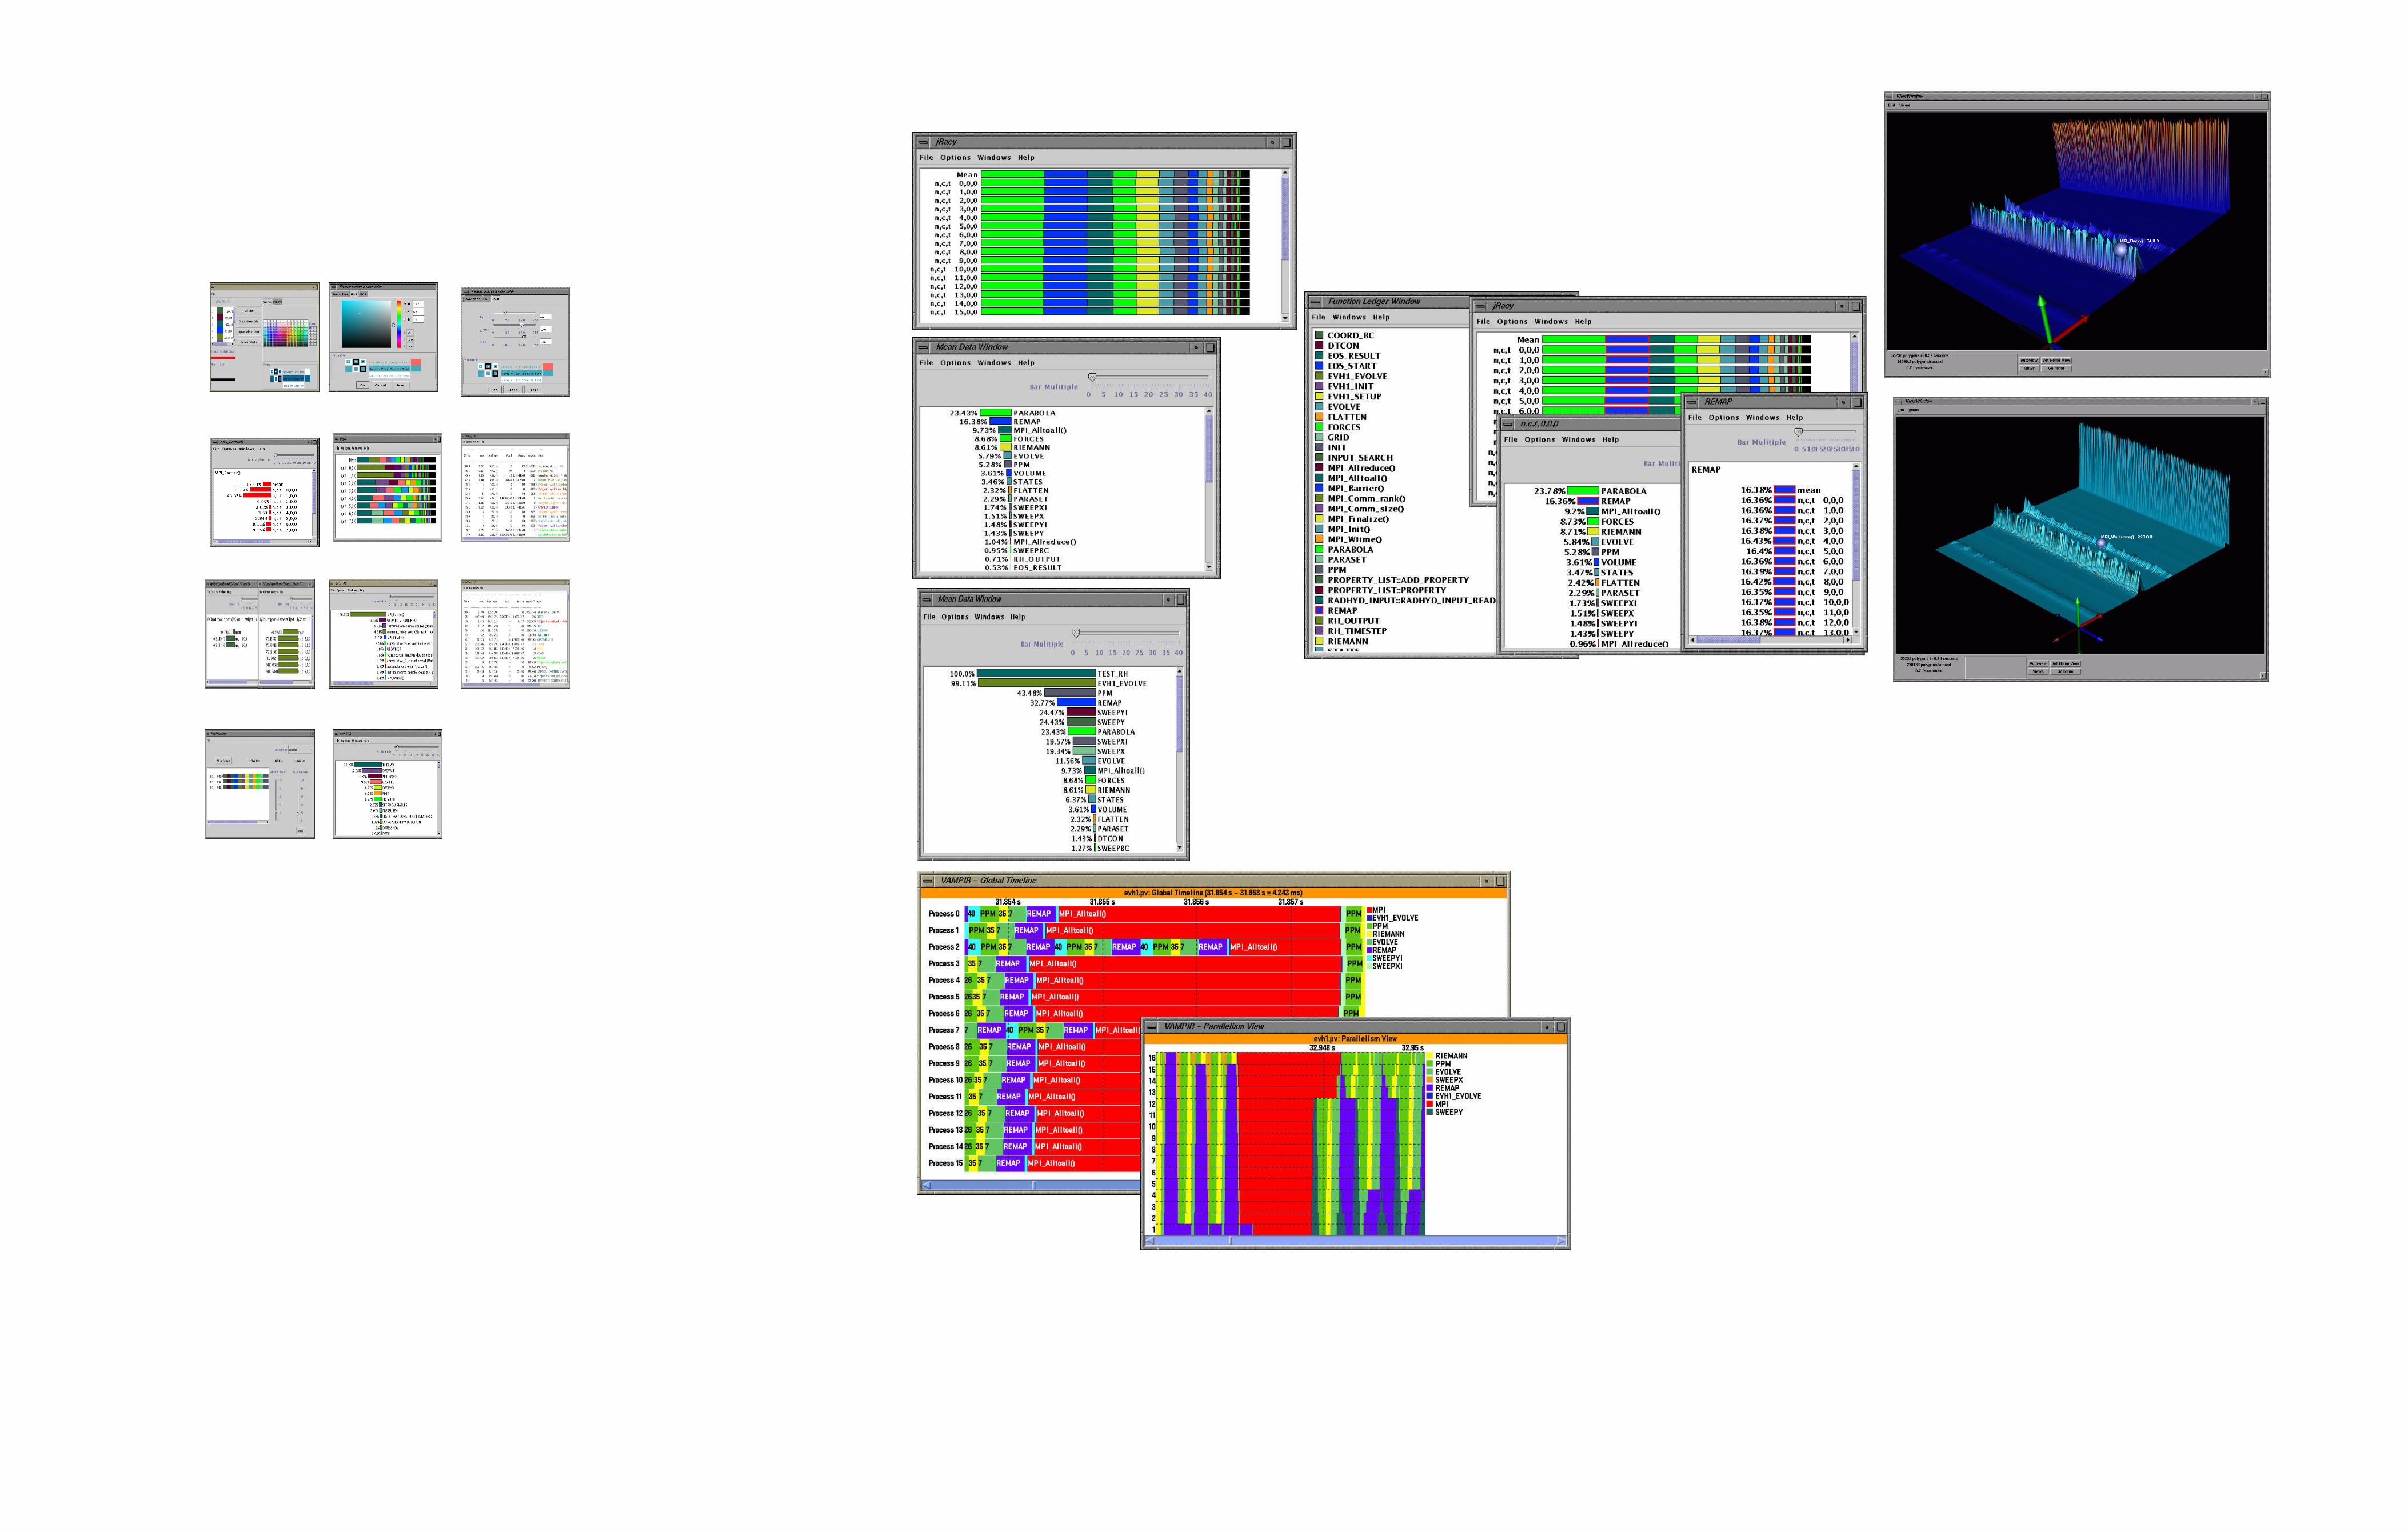
Performance Profiling of EVH1
• Enhanced Virginia Hydrodynamics #1 benchmark
• IBM SP3, 16 processors
• jRacy parallel profile display tools
TAU Integration in SAMRAI
• Structured Adaptive Mesh Refinement Application Infrastructure
• Group-based SAMRAI performance timers and counts
• Seamless integration in routine and MPI performance measurement
IntegratedOpenMP +MPI events
Threadmessagepairing
Mixed-Mode Performance Analysis (OpenMP + MPI)
• 2-D Stommel model of ocean circulation
• Jacobi iteration,5-point stencil
• Integrated OpenMP and MPI events
• Uses OpenMP performance tools interface
• Automatic instrumentation with Opari
Dr. Allen D. Malony, PIDr. Sameer Shende, Post-docRobert Bell, Research associateKai Li, Ph.D. studentLi Li, Ph.D. student
Computational Science InstituteDepartment Computer & Information ScienceUniversity of Oregon
DOE Grant No. DE FG03-01ER25501
. . .
Raw performance data
PerfDMLdata
description
Performance analysis programs
PerfDMLtranslators
Performance analysisand query toolkit
ORDB
PostgreSQL
TAU Performance Database Framework
• XML profile data representation
• Multiple experiment performance database

Performance Technology for Tera-Class Parallel Computers: Evolution of the TAU Performance System
. . .
Raw performance data
PerfDMLdata
description
Performance analysis programs
PerfDMLtranslators
Performance analysisand query toolkit
ORDBPostgreSQL
Performanceresults
Application/ Library
C / C++parser
Fortran 77/90parser
C / C++IL analyzer
Fortran 77/90IL analyzer
ProgramDatabase
Files
IL IL
DUCTAPE
PDBhtml
SILOON
CHASM
TAU_instr
Programdocumentation
Applicationcomponent glue
C++ / F90interoperability
Automatic sourceinstrumentation
JVMPI
Thread API
Eventnotification
Java program
TAU package mpiJava package
MPI profiling interface
TAU wrapper
Native MPI library
Profile DB
JNI
TAU
Allen D. Malony, PISameer Shende, Research AssociateRobert Bell, Research AssociateDOE Grant No. DE FG03-01ER25501
Performance mapping for different tasks
Mapped task performance across processes
Work packet computation events colored by task type
Distinct phases of computation can be identifed based on task
8 processes
8 processes
32 processes32 processes
32 processes
EPILOG
Paraver. . .
Raw performance data
PerfDMLdata
description
Performance analysis programs
PerfDMLtranslators
Performance analysisand query toolkit
ORDBPostgreSQL
TAU Performance Database Framework
System and Hardware Performance Integration•Callback registration for system and hardware counters•Trace recording of counts
Multi-Level Performance Instrumentation and Mapping•Optimized instrumentation•Tracing library enhancement•Performance mapping profile display
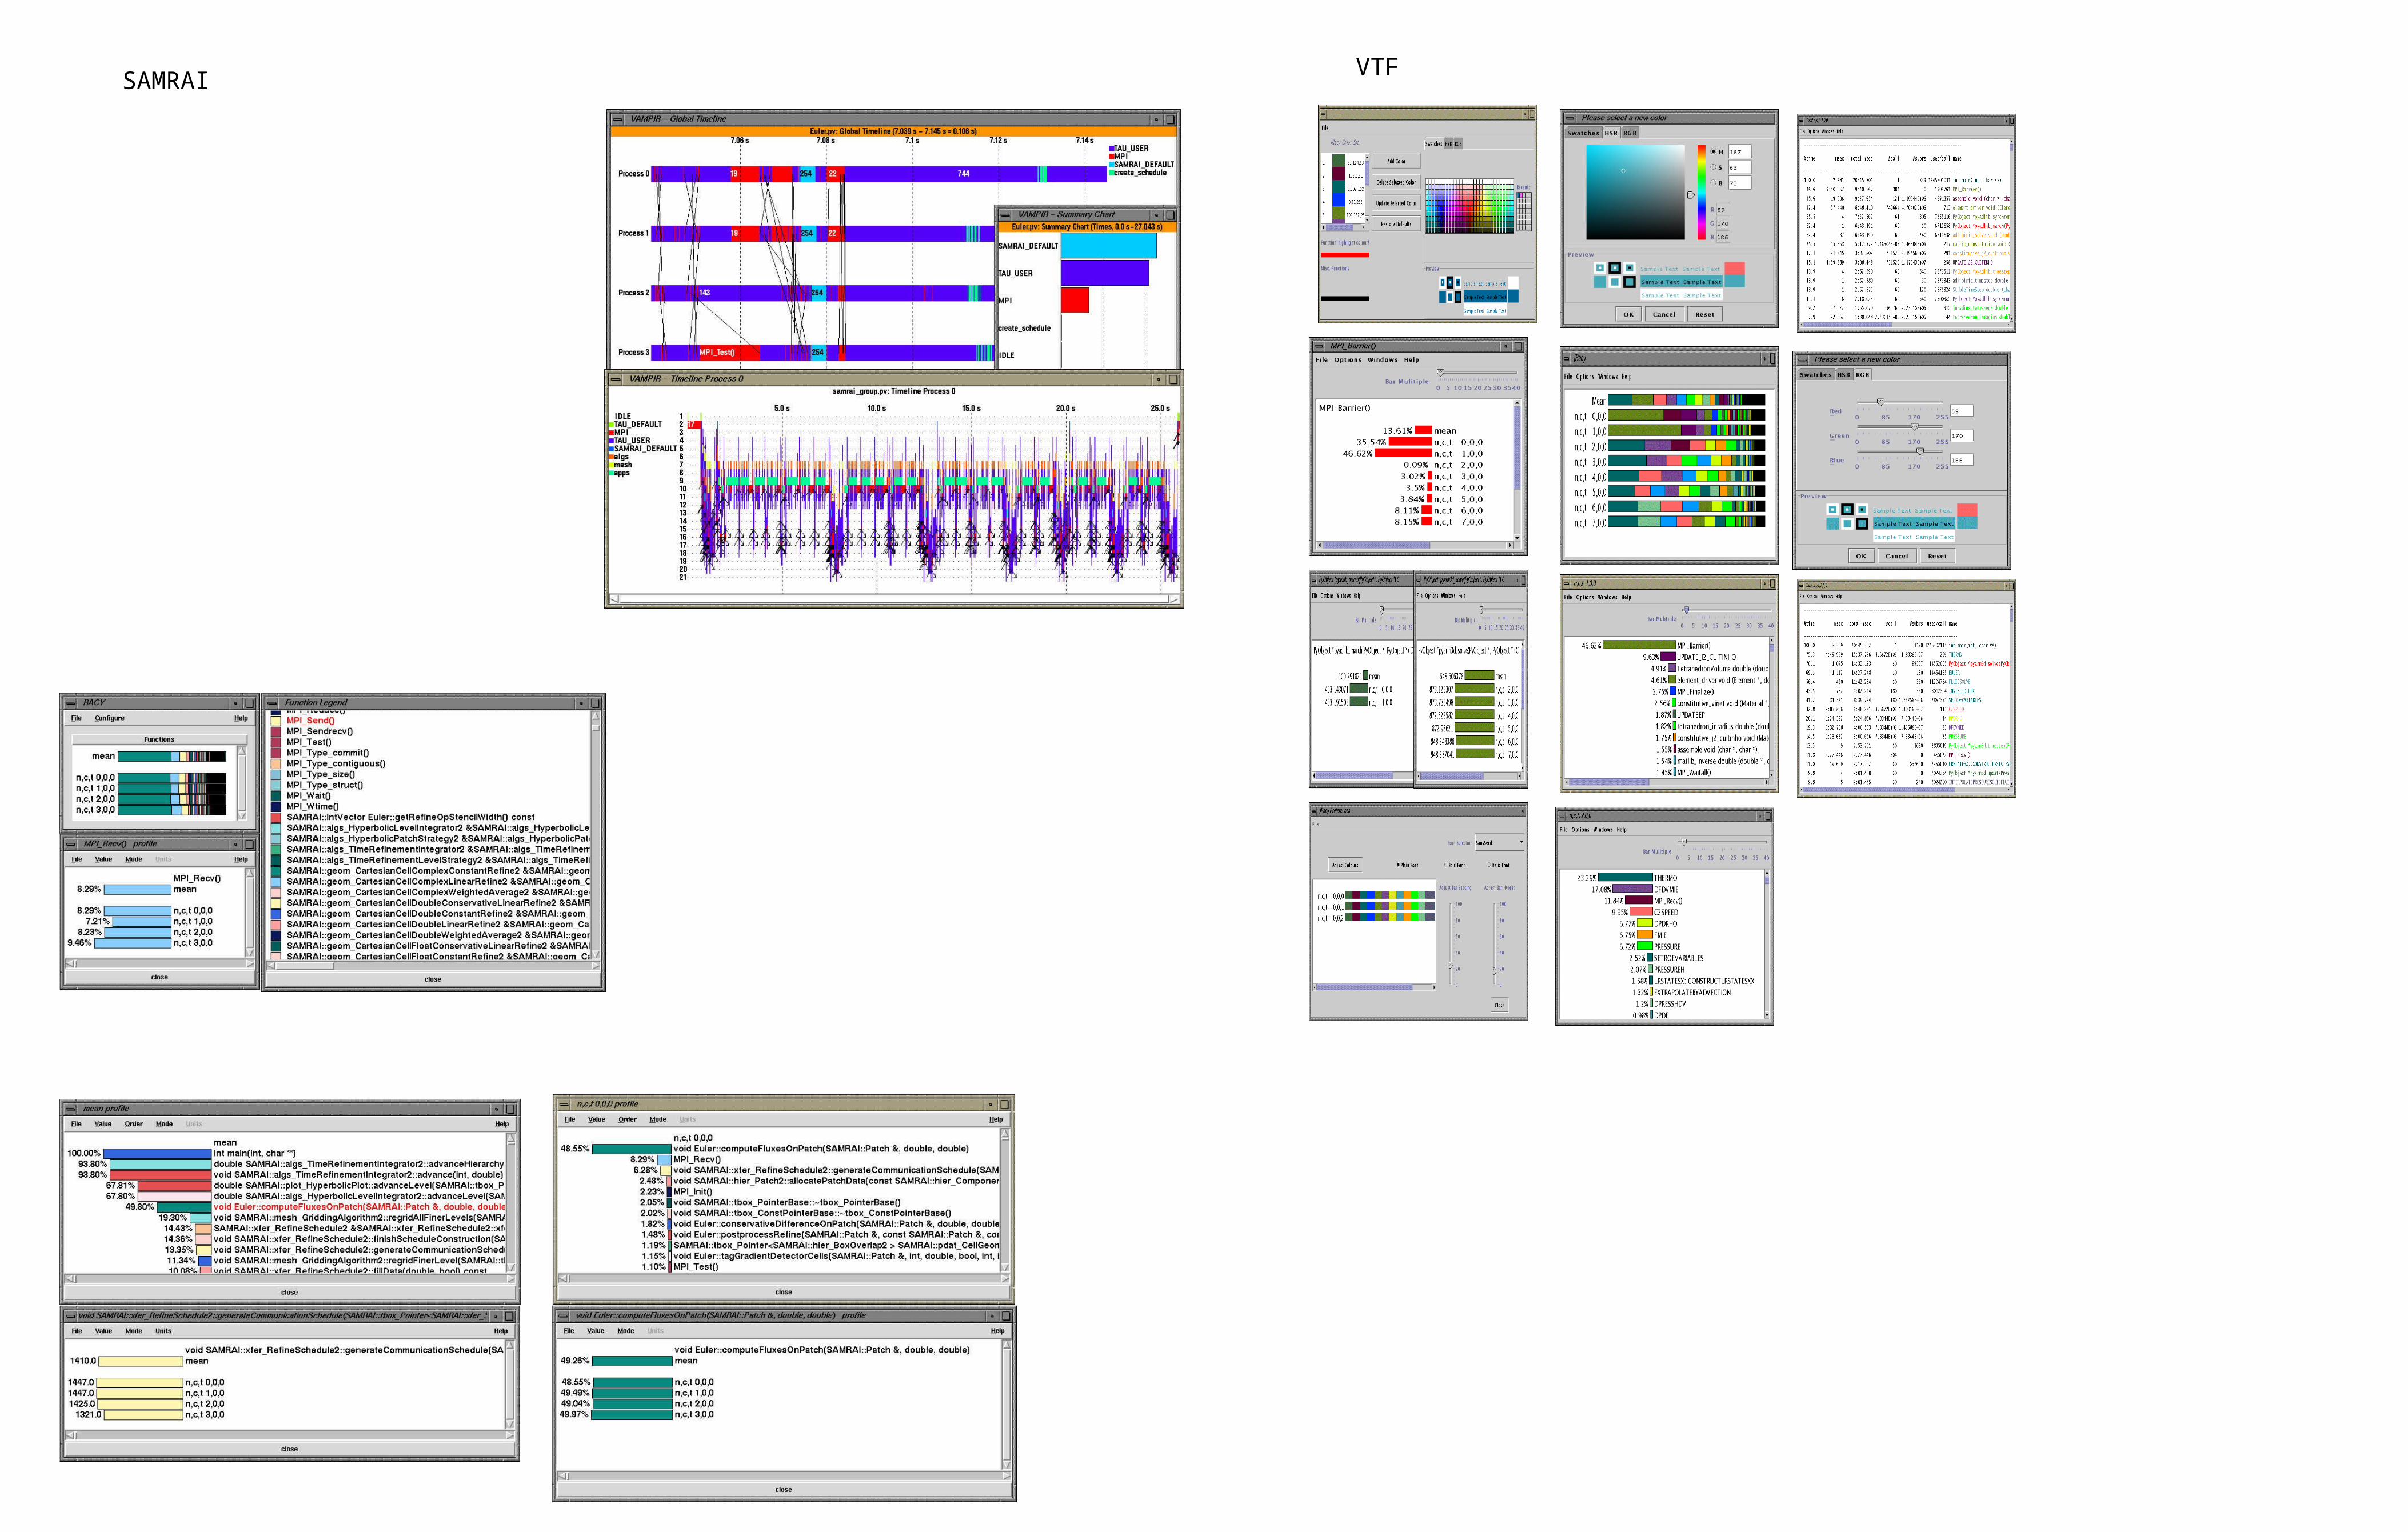
SAMRAIVTF