Dynamic neutron computer tomography technique for velocity
15
Journal of Physics: Conference Series OPEN ACCESS Dynamic neutron computer tomography technique for velocity measurement in liquid metal flow - Fundamental PTV experiment - To cite this article: M Kureta et al 2009 J. Phys.: Conf. Ser. 147 012087 View the article online for updates and enhancements. You may also like Constrained optimization towards marker- based tumor tracking in VMAT Azeez Omotayo, Sankar Venkataraman and Boyd McCurdy - Investigating the robustness of ion beam therapy treatment plans to uncertainties in biological treatment parameters T T Böhlen, S Brons, M Dosanjh et al. - A particle tracking velocimetry algorithm based on the Voronoi diagram Yang Zhang, Yuan Wang, Bin Yang et al. - This content was downloaded from IP address 126.108.94.39 on 03/12/2021 at 17:38
Transcript of Dynamic neutron computer tomography technique for velocity
Journal of Physics Conference Series
OPEN ACCESS
Dynamic neutron computer tomography techniquefor velocity measurement in liquid metal flow -Fundamental PTV experiment -To cite this article M Kureta et al 2009 J Phys Conf Ser 147 012087
View the article online for updates and enhancements
You may also likeConstrained optimization towards marker-based tumor tracking in VMATAzeez Omotayo Sankar Venkataramanand Boyd McCurdy
-
Investigating the robustness of ion beamtherapy treatment plans to uncertainties inbiological treatment parametersT T Boumlhlen S Brons M Dosanjh et al
-
A particle tracking velocimetry algorithmbased on the Voronoi diagramYang Zhang Yuan Wang Bin Yang et al
-
This content was downloaded from IP address 1261089439 on 03122021 at 1738
Dynamic neutron computer tomography technique for
velocity measurement in liquid metal flow
- Fundamental PTV experiment -
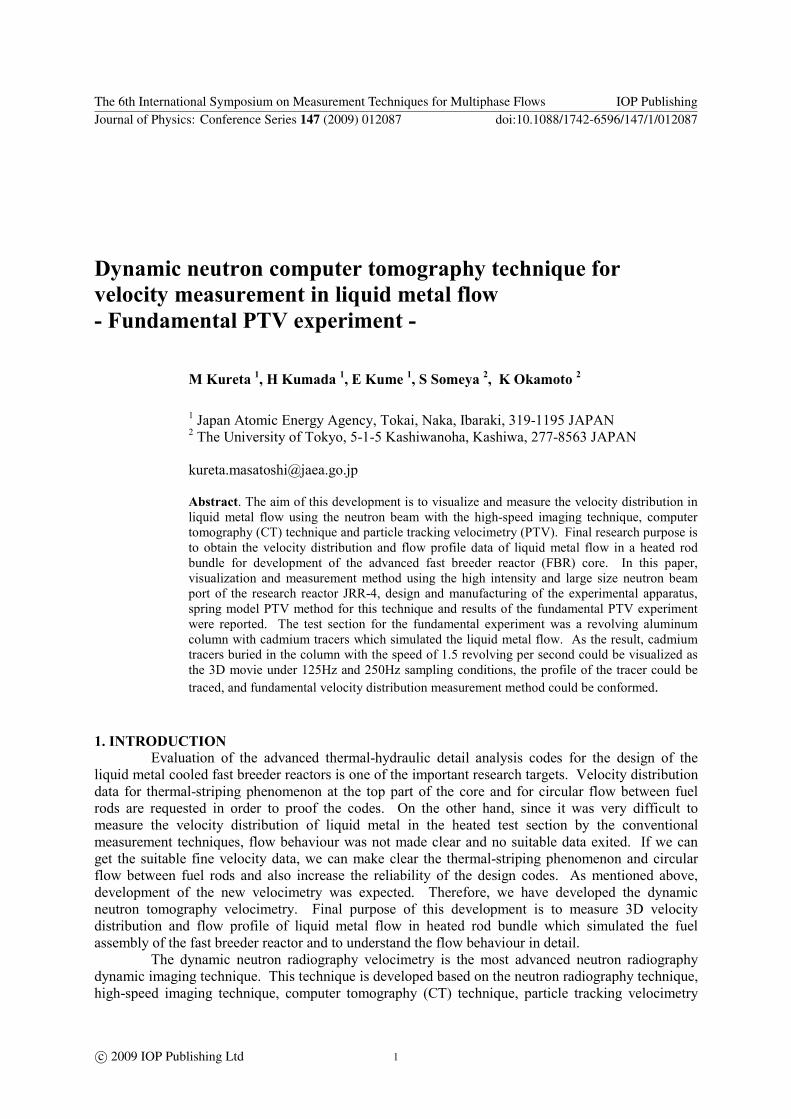
M Kureta 1 H Kumada
1 E Kume
1 S Someya
2 K Okamoto
2
1 Japan Atomic Energy Agency Tokai Naka Ibaraki 319-1195 JAPAN 2 The University of Tokyo 5-1-5 Kashiwanoha Kashiwa 277-8563 JAPAN
kuretamasatoshijaeagojp
Abstract The aim of this development is to visualize and measure the velocity distribution in
liquid metal flow using the neutron beam with the high-speed imaging technique computer
tomography (CT) technique and particle tracking velocimetry (PTV) Final research purpose is
to obtain the velocity distribution and flow profile data of liquid metal flow in a heated rod
bundle for development of the advanced fast breeder reactor (FBR) core In this paper
visualization and measurement method using the high intensity and large size neutron beam
port of the research reactor JRR-4 design and manufacturing of the experimental apparatus
spring model PTV method for this technique and results of the fundamental PTV experiment
were reported The test section for the fundamental experiment was a revolving aluminum
column with cadmium tracers which simulated the liquid metal flow As the result cadmium
tracers buried in the column with the speed of 15 revolving per second could be visualized as
the 3D movie under 125Hz and 250Hz sampling conditions the profile of the tracer could be
traced and fundamental velocity distribution measurement method could be conformed
1 INTRODUCTION
Evaluation of the advanced thermal-hydraulic detail analysis codes for the design of the
liquid metal cooled fast breeder reactors is one of the important research targets Velocity distribution
data for thermal-striping phenomenon at the top part of the core and for circular flow between fuel
rods are requested in order to proof the codes On the other hand since it was very difficult to
measure the velocity distribution of liquid metal in the heated test section by the conventional
measurement techniques flow behaviour was not made clear and no suitable data exited If we can
get the suitable fine velocity data we can make clear the thermal-striping phenomenon and circular
flow between fuel rods and also increase the reliability of the design codes As mentioned above
development of the new velocimetry was expected Therefore we have developed the dynamic
neutron tomography velocimetry Final purpose of this development is to measure 3D velocity
distribution and flow profile of liquid metal flow in heated rod bundle which simulated the fuel
assembly of the fast breeder reactor and to understand the flow behaviour in detail
The dynamic neutron radiography velocimetry is the most advanced neutron radiography
dynamic imaging technique This technique is developed based on the neutron radiography technique
high-speed imaging technique computer tomography (CT) technique particle tracking velocimetry
The 6th International Symposium on Measurement Techniques for Multiphase Flows IOP PublishingJournal of Physics Conference Series 147 (2009) 012087 doi1010881742-65961471012087
ccopy 2009 IOP Publishing Ltd 1
(PTV) neutron Monte Carlo analysis technique and parallel supercomputer technique Kureta et al
(2001) developed the high-frame-rate neutron radiography (HFR-NR) void fraction measurement
system Saito et al (2005) studied the void fraction and velocity of liquid-metal two-phase flow by
the HFR-NR and the PTV Dimension of above mentioned techniques are (2D+Time) The 3D
neutron tomography void fraction measurement techniques were developed by Kureta (2007) and
Takenaka (1999) from the different approach Measured data were time-averaged 3D scalar data
Kureta and Iikura (2008) have developed the ultra-high-speed scanning (UHSS) neutron tomography
system to improve the 3D data quality and to realize 4D (3D+Time) visualization Scanning time was
reduced to 1 s or less by the UHSS neutron tomography However since it was requested from the
fluid measurement point of view that time resolution of 01s or more less and spatial resolution of
1mm or less we needed to develop the new 4D velocimetry The dynamic neutron tomography
velocimetry was thereby developed to realize the 4D velocimetry for liquid-metal flow
In this paper dynamic neutron tomography technique fundamental experimental studies and
discussions are described
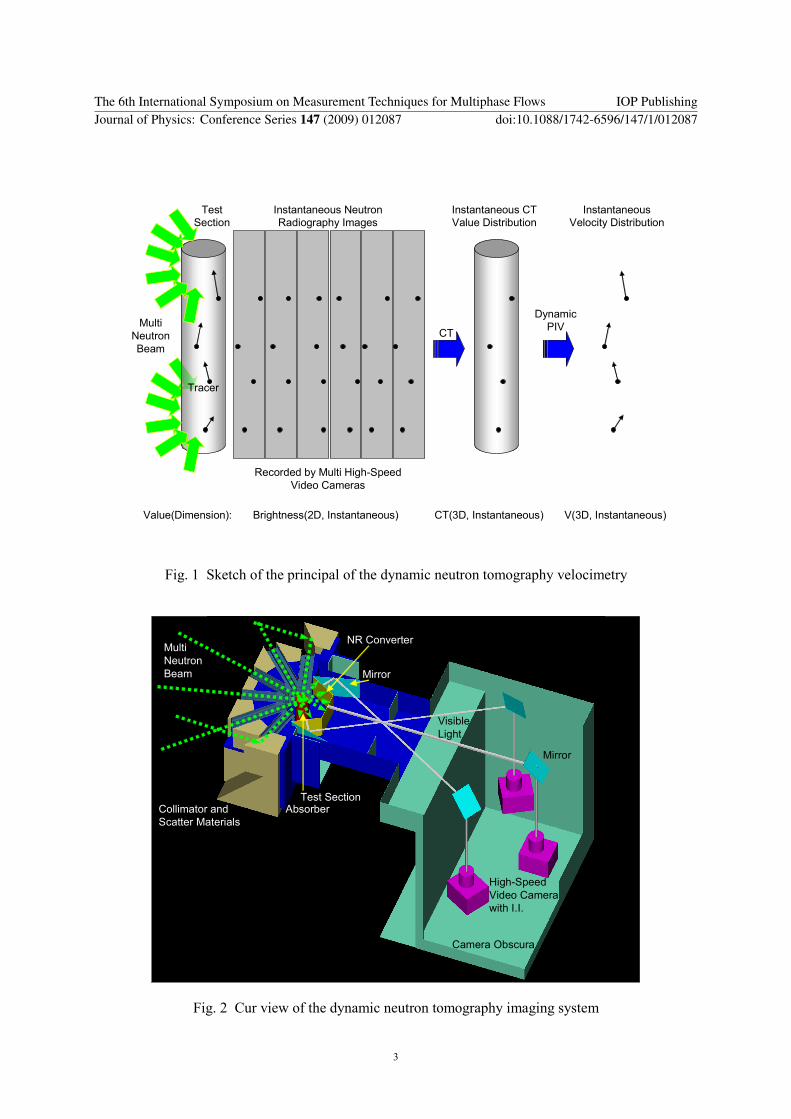
2 DYNAMIC NEUTRON TOMOGRAPHY VELOCIMETRY Since the dynamic neutron tomography velocimetry is a new method the principal design
and manufacture of the imaging system are reported in this section in detail
21 Dynamic Neutron Tomography Figure 1 indicates the overall sketch of the principal of the dynamic neutron tomography
velocimetry This new technique is classified in a scan-less CT that is real 4D CT imaging method
Test section is fixed and liquid-metal with tracer flows inside of the test section Multi neutron beams
are generated and fright to the test section from the different direction as shown in a left caricature of
Fig 1 Instantaneous neutron radiography images are recorded by multi high-speed video cameras
From the instantaneous 2D brightness images instantaneous CT value distributions can be
reconstructed by the 3D CT technique After discrimination of the tracer position instantaneous 3D
velocity distribution is calculated using the PTV 3D flow profile can be obtained by tracing the
individual tracers
We had to design the imaging system data processing software from zero We selected the
research reactor JRR-4 of Japan Atomic Energy Agency as the neutron source We needed large size
and high neutron flux beam The beam size of the JRR-4 neutron irradiation room is 771x771mm in
the beam port 400x400mm at the collimated point Thermal neutron flux at the core side is simulated
about 1x10¹⁰ [n(cm
2s)] by the neutron Monte Carlo code MCNP
Cut view of the dynamic neutron tomography imaging system was shown in Fig 2 Neutron
source is located in the left side of the figure Six neutron beams are generated using the neutron
control units as indicated in Fig2 A cross point of the beams is designed to the center of the test
section Three neutron radiography converters are fixed behind the test section Visible light on the
converter is transferred by the mirror to the high-speed video camera with the image intensifier
(Photoron Fastcam MAX-II NEO-II) These imaging devices are fixed in the camera obscure
The 6th International Symposium on Measurement Techniques for Multiphase Flows IOP PublishingJournal of Physics Conference Series 147 (2009) 012087 doi1010881742-65961471012087
2
Multi
Neutron
Beam
Test
Section
Tracer
Instantaneous Neutron
Radiography Images
CT
Instantaneous CT
Value Distribution
Dynamic
PIV
Instantaneous
Velocity Distribution
Recorded by Multi High-Speed
Video Cameras
Value(Dimension) Brightness(2D Instantaneous) CT(3D Instantaneous) V(3D Instantaneous)
Fig 1 Sketch of the principal of the dynamic neutron tomography velocimetry
Multi
Neutron
Beam
Collimator and
Scatter Materials
Absorber
NR Converter
Mirror
Visible
Light
Mirror
High-Speed
Video Camera
with II
Camera Obscura
Test Section
Fig 2 Cur view of the dynamic neutron tomography imaging system
The 6th International Symposium on Measurement Techniques for Multiphase Flows IOP PublishingJournal of Physics Conference Series 147 (2009) 012087 doi1010881742-65961471012087
3
22 Design and Manufacture of the Imaging System All imaging system was designed for the JRR-4 by using the MCNP Figure 3 shows the
outside view of the final design of the imaging system Most important parts are neutron control units
which are consisted of the collimators scatter blocks and neutron absorbers as shown in Fig 4 3D
arrangement of the imaging system was designed as shown in Fig 5 Each position is fixed by the
neutron beam design optical design and radiation shielding point of view Figure 6 indicates the 3D
view of the neutron beam lines and visible light lines from the backside of the test section Front and
back side mirrors reflect the side converter image to the high-speed video camera Design of the
neutron control units and radiation shielding were carried out using the MNCP Figure 7 shows the
3D distribution of thermal neutron around the test section Six neutron beams are generated and
penetrating the test section Figure 8 shows the simulated distribution of thermal neutron on the
neutron radiography converters We confirmed that the distribution was relatively uniform
Horizontal cross-section view and size of the parts near the test section are indicated in Fig 9 Two
neutron radiography images are projected on one converter Diameter of the test section and width of
one beam are 58mm Width of the converter is 140mm Beam height and imaging height are 240mm
and 214mm respectively as shown in Fig 10
Here the test section was designed to simulate the 7-rod bundle of the fast breeder reactor
Main material of the imaging system is listed as follows
Macro collimator and neutron scatter block Polyethylene (PE)
Parallel collimator B4C
Neutron absorber B4C
6Li
Converter 6Li+ZnS(Ag)
Mirror Aluminium on the quarts glass
Collimator
Scatter Materials
Camera Obscura
Reactor
Side
Fig 3 Outside view of the dynamic neutron tomography imaging system
The 6th International Symposium on Measurement Techniques for Multiphase Flows IOP PublishingJournal of Physics Conference Series 147 (2009) 012087 doi1010881742-65961471012087
4
(b) Photo
(c) Cut-View
(a) Neutron Control Unit
- Collimator
- Scatter Absorber
Materials
Macro
Collimator
(B4C)
Parallel
Collimator
(B4C)Scatter
Material
(PE)18x18mm2mm
(thickness)18x8mm
Fig 4 Neutron control units (collimator scatterabsorber parts)
NR Converter
Mirror
Test Section
Neutron
Absorber
Mirror
Mirror
Camera
(C001
MAX-II)
Camera
(C002
NEO-II)
Camera
(C003
MAX-II)
Lens
(50mmF095)
WD=15m
Fig 5 3D arrangement of the imaging system
The 6th International Symposium on Measurement Techniques for Multiphase Flows IOP PublishingJournal of Physics Conference Series 147 (2009) 012087 doi1010881742-65961471012087
5
Test Section Control Unit
Test Section (φ 60mm)
Collimator
(NR Converter Fluorescent)
Mirror
Mirror
Neutron
Beam
Visible
Light
Fig 6 3D view of the neutron beam lines and visible light lines
Fig 7 3D distribution of thermal neutron around the test section
(Simulation result by the Monte Carlo code)
The 6th International Symposium on Measurement Techniques for Multiphase Flows IOP PublishingJournal of Physics Conference Series 147 (2009) 012087 doi1010881742-65961471012087
6
Fig 8 Simulated distribution of thermal neutron on the neutron converters
58
Validφ 58 Test
Section
φ 60
140
140
140
60o
60o
60o Visible Light
Front Mirror
Converter
Camera Obscure
Neutron Absorber (B4C)
Macro Collimator(PE B4Cetc)
Parallel
Collimator
(B4Cetc)
Reactor Side
Fig 9 Horizontal cross-sectional view and size of the parts near the test section
The 6th International Symposium on Measurement Techniques for Multiphase Flows IOP PublishingJournal of Physics Conference Series 147 (2009) 012087 doi1010881742-65961471012087
7
Test
Section
φ 60
Test Section Height
370 (Test Section A)
376 (Test Section B)
372 (Test Section C)
Macro Collimator(PE B4Cetc)
Parallel
Collimator
(B4Cetc)
Reactor Side
Beam
Height
240
Beam
CenterBeam Center
Imaging
Height
214
Test Section
Controller
Fig 10 Vertical size of the test section and beams
23 Image Data Processing The data processing is classified into (A) Pre-CT processing (B) CT processing and (C)
Post-CT processing In the Pre-CT processing final output is (Σδ) value for calculation of the CT
value at the CT processing In the CT processing the instantaneous 3D CT value distribution is
calculated Post-CT processing is to measure the 3D velocity distribution and the flow profile
(A) Pre-CT processing
- Read the consecutive three camera images (1024x1024pixel or 512x512pixel 10bit)
- Kureta filter (2007) for reduction of the white-spot-noise
- Butterworth filter for reduction of the high frequency noise
- Brightness correction
- Vertical correction
- Projection angle correction
- Scale correction
- Brightness correction between imaging units and time directional
- Mirror image correction
- Cut two images from one converter image
- Calculation of (Σδ) value
(B) CT processing
- CT data processing by an improved MAP-EM algorism
(C) Post-CT processing
- Normalization and scaling to 8bit scale
- 3D binarization
- Shrinkage processing
- Swelling processing
- Labelling
The 6th International Symposium on Measurement Techniques for Multiphase Flows IOP PublishingJournal of Physics Conference Series 147 (2009) 012087 doi1010881742-65961471012087
8
- Calculation of the tracer center
- Calculation of velocity by the spring model PTV (Okamoto 1995)
- Smoothing processing
- Flow profile processing
We developed original data processing software named RAIDEEN and the 4D data viewer
named TRITON Since the data size and the processing time were extremely large RAIDEEN was
designed to work on the parallel supercomputer system Nominal CPU number was 128
3 EXPERIMENTAL
31 Fundamental Tests for the Principle Confirmation In order to proof the principle of this technique the fundamental experiments were carried
out using a rotating test section as illustrated in Fig 11 Photo in Fig 11 shows the inside view of the
test section Controlled revolving column which is made of aluminium is rotating in the fixed
aluminium case Cadmium bars and grains are buried in the column Here aluminium column and
cadmium barsgrains simulate the liquid-metal and tracer respectively Diameter of the cadmium
barsgrains are 10mm and 20mm
3
25
60
40
3
5
1520
23
25Cdφ2
75
45
12
12
6
9
6
39
20
8
12
25
Cdφ1
Beam
Center
Cdφ2Cdφ1
Cdφ2Cdφ1
10
3
96
φ 50 Cdφ2
Cdφ2
Empty
Aluminum Case (t=1)
Unit [mm]
Revolving Column(Aluminum)
φ 60
Al φ10
Beam
Center
Fig 11 Photo and sketches of the fundamental rotating test section
32 Test Conditions
Figure 12 shows the sketch of the control pattern of the rotating column The rotating speed
was 15 10 and 05 rps Surface speed of 15 rps was about 024 ms All imaging system was
installed in the JRR-4 and fundamental tests were carried out with recording speed of 125 fps and 250
fps
The 6th International Symposium on Measurement Techniques for Multiphase Flows IOP PublishingJournal of Physics Conference Series 147 (2009) 012087 doi1010881742-65961471012087
9
Fig 12 Sketches of the rotating control pattern
4 RESULTS AND DISCUSSIONS Figure 13 shows the snapshots of the original neutron radiography images Upper and lower
images were recorded with recording speed of 250fps and 125 fps respectively When we obtained
the consecutive image with synchronizing each other rotating behaviour of the cadmium bars could be
recognized on all images Quality of the 125fps images was a little higher than that of the 250fps
images It was conformed from this result that we can recognize the motion of the tracer under the
condition of 250fps Quality of the images was low because of the low collimator ratio (LD) of about
10 - 24 and low scattered neutron beam flux at this moment If we can make the high collimator ratio
beam and high neutron flux beam then we could record much higher quality images
After many types of calibrations were applied to the original images as shown in Fig 13 we
can get the instantaneous 3D CT value distributions Furthermore from the consecutive instantaneous
3D CT value data velocity distributions of the tracers and its profiles were calculated using the PTV
Fig 14 shows the consecutive instantaneous 3D CT value distributions and velocity and profile of the
tracers in the rotating test section Revolving speed was 15rps and recording speed was 250fps 3D
CT value distributions were visualized using the volume rendering technique As shown in Fig 14
vertical cadmium bars were successfully visualized After we made the movie of the 3D CT values
we could observe the motion of the cadmium bars as the tracer Quality of the instantaneous 3D CT
images was low However center points of the tracers could be recognized and velocity could
calculate from its center points Instantaneous velocity of the tracer and its profile data could
visualized from the perpendicular eye point to the neutron beam as shown in Fig 14 In this figure
line and marker for velocity view were eliminated when the large miss vector of velocity and
impractical profile were recognized by the data processing software When we observed the velocity
and profile of tracer we could understand the center position of the tracer here and there Then next
smoothing processing on time direction was conducted Figure 15 indicates the results of profile after
smoothing processing As shown in Fig 15 we can understand the tracer profile from the data more
clearly
As above mentioned the principal of the dynamic neutron tomography velocimetry was
confirmed by the fundamental rotating experiments From the fundamental tents followings were
found
1) Limitation of the recording speed was 250fps at this moment
The 6th International Symposium on Measurement Techniques for Multiphase Flows IOP PublishingJournal of Physics Conference Series 147 (2009) 012087 doi1010881742-65961471012087
10
2) Diameter of the tracer should be larger than 20 mm 10mm was difficult to be recognized
at the pre-PTV processing
3) Improving of the original image quality is the most important subjects
Fig 13 Original neutron radiography images recorded on the imaging system
(Upper 250fps Lower 125fps)
The 6th International Symposium on Measurement Techniques for Multiphase Flows IOP PublishingJournal of Physics Conference Series 147 (2009) 012087 doi1010881742-65961471012087
11
(Revolving speed = 15rps Recording speed = 250fps XY-Plane)
Fig 14 Consecutive instantaneous 3D CT value distributions and velocity
and profile of the tracers in the rotating test section
The 6th International Symposium on Measurement Techniques for Multiphase Flows IOP PublishingJournal of Physics Conference Series 147 (2009) 012087 doi1010881742-65961471012087
12
Fig 15 Velocity and profile view from the top to the bottom
of the center part in the test section
5 CONCLUSIONS
Dynamic neutron tomography velocimetry technique was developed as the new visualization
and measurement method using the research reactor JRR-4 Fundamental rotating experiments were
carried out in order to proof its principal As the result cadmium tracers buried in the column with the
speed of 15 revolving per second could be visualized as the 3D movie under 125Hz and 250Hz
sampling conditions the profile of the tracer could be recognized well by the movie and fundamental
velocity distribution measurement method could be confirmed
ACKNOWLEDGEMENTS
This paper contains some results obtained within the task Development of High-speed
three-dimensional measurement technique for Liquid Metal Thermo-fluid Dynamics entrusted from
the Ministry of Education Culture Sports Science and Technology of Japan This research was
conducted using a supercomputer and the reserch reactor JRR-4 of the Japan Atomic Energy Agency
(JAEA) The authors would like to acknowledge Messrs M Katagiri K Soyama for there help on
making the neutron radiography converters and collimators H Tamai T Sato K Sakamoto N
Kurata H Yokota and M Nemoto for there assist on experiment and software
The 6th International Symposium on Measurement Techniques for Multiphase Flows IOP PublishingJournal of Physics Conference Series 147 (2009) 012087 doi1010881742-65961471012087
13
REFERENCES
Kureta M et al (2001) Void Fraction Measurement in Subcooled-Boiling Flow Using High-Frame-
Rate Neutron Radiography Nuclear Technology 136 pp241-254
Kureta M (2007) Development of a Neutron Radiography Three-Dimensional Computed
Tomography System for Void Fraction Measurement of Boiling Flow in Tight Lattice Rod Bundles J
Power and Energy Systems 1(3) pp 211-224
Kureta M and Iikura H (2008) Development of an Ultra-high-speed Scanning Neutron
Tomography System for High-quality and Four-dimensional Visualizations Nucl Instr Meth A (in
Print)
Saito Y et al (2005) Application of High Frame-rate Neutron Radiography to Liquid Metal Two-
Phase Flow Research Nucl Instr Meth A 542 pp 168-174
Takenaka N (1999) Application of Fast Neutron Radiography to Three-dimensional Visualization
of Steady Two-phase Flow in a Rod Bundle Nucl Instr Meth A 424 pp 73-76
The 6th International Symposium on Measurement Techniques for Multiphase Flows IOP PublishingJournal of Physics Conference Series 147 (2009) 012087 doi1010881742-65961471012087
14
Dynamic neutron computer tomography technique for
velocity measurement in liquid metal flow
- Fundamental PTV experiment -
M Kureta 1 H Kumada
1 E Kume
1 S Someya
2 K Okamoto
2
1 Japan Atomic Energy Agency Tokai Naka Ibaraki 319-1195 JAPAN 2 The University of Tokyo 5-1-5 Kashiwanoha Kashiwa 277-8563 JAPAN
kuretamasatoshijaeagojp
Abstract The aim of this development is to visualize and measure the velocity distribution in
liquid metal flow using the neutron beam with the high-speed imaging technique computer
tomography (CT) technique and particle tracking velocimetry (PTV) Final research purpose is
to obtain the velocity distribution and flow profile data of liquid metal flow in a heated rod
bundle for development of the advanced fast breeder reactor (FBR) core In this paper
visualization and measurement method using the high intensity and large size neutron beam
port of the research reactor JRR-4 design and manufacturing of the experimental apparatus
spring model PTV method for this technique and results of the fundamental PTV experiment
were reported The test section for the fundamental experiment was a revolving aluminum
column with cadmium tracers which simulated the liquid metal flow As the result cadmium
tracers buried in the column with the speed of 15 revolving per second could be visualized as
the 3D movie under 125Hz and 250Hz sampling conditions the profile of the tracer could be
traced and fundamental velocity distribution measurement method could be conformed
1 INTRODUCTION
Evaluation of the advanced thermal-hydraulic detail analysis codes for the design of the
liquid metal cooled fast breeder reactors is one of the important research targets Velocity distribution
data for thermal-striping phenomenon at the top part of the core and for circular flow between fuel
rods are requested in order to proof the codes On the other hand since it was very difficult to
measure the velocity distribution of liquid metal in the heated test section by the conventional
measurement techniques flow behaviour was not made clear and no suitable data exited If we can
get the suitable fine velocity data we can make clear the thermal-striping phenomenon and circular
flow between fuel rods and also increase the reliability of the design codes As mentioned above
development of the new velocimetry was expected Therefore we have developed the dynamic
neutron tomography velocimetry Final purpose of this development is to measure 3D velocity
distribution and flow profile of liquid metal flow in heated rod bundle which simulated the fuel
assembly of the fast breeder reactor and to understand the flow behaviour in detail
The dynamic neutron radiography velocimetry is the most advanced neutron radiography
dynamic imaging technique This technique is developed based on the neutron radiography technique
high-speed imaging technique computer tomography (CT) technique particle tracking velocimetry
The 6th International Symposium on Measurement Techniques for Multiphase Flows IOP PublishingJournal of Physics Conference Series 147 (2009) 012087 doi1010881742-65961471012087
ccopy 2009 IOP Publishing Ltd 1
(PTV) neutron Monte Carlo analysis technique and parallel supercomputer technique Kureta et al
(2001) developed the high-frame-rate neutron radiography (HFR-NR) void fraction measurement
system Saito et al (2005) studied the void fraction and velocity of liquid-metal two-phase flow by
the HFR-NR and the PTV Dimension of above mentioned techniques are (2D+Time) The 3D
neutron tomography void fraction measurement techniques were developed by Kureta (2007) and
Takenaka (1999) from the different approach Measured data were time-averaged 3D scalar data
Kureta and Iikura (2008) have developed the ultra-high-speed scanning (UHSS) neutron tomography
system to improve the 3D data quality and to realize 4D (3D+Time) visualization Scanning time was
reduced to 1 s or less by the UHSS neutron tomography However since it was requested from the
fluid measurement point of view that time resolution of 01s or more less and spatial resolution of
1mm or less we needed to develop the new 4D velocimetry The dynamic neutron tomography
velocimetry was thereby developed to realize the 4D velocimetry for liquid-metal flow
In this paper dynamic neutron tomography technique fundamental experimental studies and
discussions are described
2 DYNAMIC NEUTRON TOMOGRAPHY VELOCIMETRY Since the dynamic neutron tomography velocimetry is a new method the principal design
and manufacture of the imaging system are reported in this section in detail
21 Dynamic Neutron Tomography Figure 1 indicates the overall sketch of the principal of the dynamic neutron tomography
velocimetry This new technique is classified in a scan-less CT that is real 4D CT imaging method
Test section is fixed and liquid-metal with tracer flows inside of the test section Multi neutron beams
are generated and fright to the test section from the different direction as shown in a left caricature of
Fig 1 Instantaneous neutron radiography images are recorded by multi high-speed video cameras
From the instantaneous 2D brightness images instantaneous CT value distributions can be
reconstructed by the 3D CT technique After discrimination of the tracer position instantaneous 3D
velocity distribution is calculated using the PTV 3D flow profile can be obtained by tracing the
individual tracers
We had to design the imaging system data processing software from zero We selected the
research reactor JRR-4 of Japan Atomic Energy Agency as the neutron source We needed large size
and high neutron flux beam The beam size of the JRR-4 neutron irradiation room is 771x771mm in
the beam port 400x400mm at the collimated point Thermal neutron flux at the core side is simulated
about 1x10¹⁰ [n(cm
2s)] by the neutron Monte Carlo code MCNP
Cut view of the dynamic neutron tomography imaging system was shown in Fig 2 Neutron
source is located in the left side of the figure Six neutron beams are generated using the neutron
control units as indicated in Fig2 A cross point of the beams is designed to the center of the test
section Three neutron radiography converters are fixed behind the test section Visible light on the
converter is transferred by the mirror to the high-speed video camera with the image intensifier
(Photoron Fastcam MAX-II NEO-II) These imaging devices are fixed in the camera obscure
The 6th International Symposium on Measurement Techniques for Multiphase Flows IOP PublishingJournal of Physics Conference Series 147 (2009) 012087 doi1010881742-65961471012087
2
Multi
Neutron
Beam
Test
Section
Tracer
Instantaneous Neutron
Radiography Images
CT
Instantaneous CT
Value Distribution
Dynamic
PIV
Instantaneous
Velocity Distribution
Recorded by Multi High-Speed
Video Cameras
Value(Dimension) Brightness(2D Instantaneous) CT(3D Instantaneous) V(3D Instantaneous)
Fig 1 Sketch of the principal of the dynamic neutron tomography velocimetry
Multi
Neutron
Beam
Collimator and
Scatter Materials
Absorber
NR Converter
Mirror
Visible
Light
Mirror
High-Speed
Video Camera
with II
Camera Obscura
Test Section
Fig 2 Cur view of the dynamic neutron tomography imaging system
The 6th International Symposium on Measurement Techniques for Multiphase Flows IOP PublishingJournal of Physics Conference Series 147 (2009) 012087 doi1010881742-65961471012087
3
22 Design and Manufacture of the Imaging System All imaging system was designed for the JRR-4 by using the MCNP Figure 3 shows the
outside view of the final design of the imaging system Most important parts are neutron control units
which are consisted of the collimators scatter blocks and neutron absorbers as shown in Fig 4 3D
arrangement of the imaging system was designed as shown in Fig 5 Each position is fixed by the
neutron beam design optical design and radiation shielding point of view Figure 6 indicates the 3D
view of the neutron beam lines and visible light lines from the backside of the test section Front and
back side mirrors reflect the side converter image to the high-speed video camera Design of the
neutron control units and radiation shielding were carried out using the MNCP Figure 7 shows the
3D distribution of thermal neutron around the test section Six neutron beams are generated and
penetrating the test section Figure 8 shows the simulated distribution of thermal neutron on the
neutron radiography converters We confirmed that the distribution was relatively uniform
Horizontal cross-section view and size of the parts near the test section are indicated in Fig 9 Two
neutron radiography images are projected on one converter Diameter of the test section and width of
one beam are 58mm Width of the converter is 140mm Beam height and imaging height are 240mm
and 214mm respectively as shown in Fig 10
Here the test section was designed to simulate the 7-rod bundle of the fast breeder reactor
Main material of the imaging system is listed as follows
Macro collimator and neutron scatter block Polyethylene (PE)
Parallel collimator B4C
Neutron absorber B4C
6Li
Converter 6Li+ZnS(Ag)
Mirror Aluminium on the quarts glass
Collimator
Scatter Materials
Camera Obscura
Reactor
Side
Fig 3 Outside view of the dynamic neutron tomography imaging system
The 6th International Symposium on Measurement Techniques for Multiphase Flows IOP PublishingJournal of Physics Conference Series 147 (2009) 012087 doi1010881742-65961471012087
4
(b) Photo
(c) Cut-View
(a) Neutron Control Unit
- Collimator
- Scatter Absorber
Materials
Macro
Collimator
(B4C)
Parallel
Collimator
(B4C)Scatter
Material
(PE)18x18mm2mm
(thickness)18x8mm
Fig 4 Neutron control units (collimator scatterabsorber parts)
NR Converter
Mirror
Test Section
Neutron
Absorber
Mirror
Mirror
Camera
(C001
MAX-II)
Camera
(C002
NEO-II)
Camera
(C003
MAX-II)
Lens
(50mmF095)
WD=15m
Fig 5 3D arrangement of the imaging system
The 6th International Symposium on Measurement Techniques for Multiphase Flows IOP PublishingJournal of Physics Conference Series 147 (2009) 012087 doi1010881742-65961471012087
5
Test Section Control Unit
Test Section (φ 60mm)
Collimator
(NR Converter Fluorescent)
Mirror
Mirror
Neutron
Beam
Visible
Light
Fig 6 3D view of the neutron beam lines and visible light lines
Fig 7 3D distribution of thermal neutron around the test section
(Simulation result by the Monte Carlo code)
The 6th International Symposium on Measurement Techniques for Multiphase Flows IOP PublishingJournal of Physics Conference Series 147 (2009) 012087 doi1010881742-65961471012087
6
Fig 8 Simulated distribution of thermal neutron on the neutron converters
58
Validφ 58 Test
Section
φ 60
140
140
140
60o
60o
60o Visible Light
Front Mirror
Converter
Camera Obscure
Neutron Absorber (B4C)
Macro Collimator(PE B4Cetc)
Parallel
Collimator
(B4Cetc)
Reactor Side
Fig 9 Horizontal cross-sectional view and size of the parts near the test section
The 6th International Symposium on Measurement Techniques for Multiphase Flows IOP PublishingJournal of Physics Conference Series 147 (2009) 012087 doi1010881742-65961471012087
7
Test
Section
φ 60
Test Section Height
370 (Test Section A)
376 (Test Section B)
372 (Test Section C)
Macro Collimator(PE B4Cetc)
Parallel
Collimator
(B4Cetc)
Reactor Side
Beam
Height
240
Beam
CenterBeam Center
Imaging
Height
214
Test Section
Controller
Fig 10 Vertical size of the test section and beams
23 Image Data Processing The data processing is classified into (A) Pre-CT processing (B) CT processing and (C)
Post-CT processing In the Pre-CT processing final output is (Σδ) value for calculation of the CT
value at the CT processing In the CT processing the instantaneous 3D CT value distribution is
calculated Post-CT processing is to measure the 3D velocity distribution and the flow profile
(A) Pre-CT processing
- Read the consecutive three camera images (1024x1024pixel or 512x512pixel 10bit)
- Kureta filter (2007) for reduction of the white-spot-noise
- Butterworth filter for reduction of the high frequency noise
- Brightness correction
- Vertical correction
- Projection angle correction
- Scale correction
- Brightness correction between imaging units and time directional
- Mirror image correction
- Cut two images from one converter image
- Calculation of (Σδ) value
(B) CT processing
- CT data processing by an improved MAP-EM algorism
(C) Post-CT processing
- Normalization and scaling to 8bit scale
- 3D binarization
- Shrinkage processing
- Swelling processing
- Labelling
The 6th International Symposium on Measurement Techniques for Multiphase Flows IOP PublishingJournal of Physics Conference Series 147 (2009) 012087 doi1010881742-65961471012087
8
- Calculation of the tracer center
- Calculation of velocity by the spring model PTV (Okamoto 1995)
- Smoothing processing
- Flow profile processing
We developed original data processing software named RAIDEEN and the 4D data viewer
named TRITON Since the data size and the processing time were extremely large RAIDEEN was
designed to work on the parallel supercomputer system Nominal CPU number was 128
3 EXPERIMENTAL
31 Fundamental Tests for the Principle Confirmation In order to proof the principle of this technique the fundamental experiments were carried
out using a rotating test section as illustrated in Fig 11 Photo in Fig 11 shows the inside view of the
test section Controlled revolving column which is made of aluminium is rotating in the fixed
aluminium case Cadmium bars and grains are buried in the column Here aluminium column and
cadmium barsgrains simulate the liquid-metal and tracer respectively Diameter of the cadmium
barsgrains are 10mm and 20mm
3
25
60
40
3
5
1520
23
25Cdφ2
75
45
12
12
6
9
6
39
20
8
12
25
Cdφ1
Beam
Center
Cdφ2Cdφ1
Cdφ2Cdφ1
10
3
96
φ 50 Cdφ2
Cdφ2
Empty
Aluminum Case (t=1)
Unit [mm]
Revolving Column(Aluminum)
φ 60
Al φ10
Beam
Center
Fig 11 Photo and sketches of the fundamental rotating test section
32 Test Conditions
Figure 12 shows the sketch of the control pattern of the rotating column The rotating speed
was 15 10 and 05 rps Surface speed of 15 rps was about 024 ms All imaging system was
installed in the JRR-4 and fundamental tests were carried out with recording speed of 125 fps and 250
fps
The 6th International Symposium on Measurement Techniques for Multiphase Flows IOP PublishingJournal of Physics Conference Series 147 (2009) 012087 doi1010881742-65961471012087
9
Fig 12 Sketches of the rotating control pattern
4 RESULTS AND DISCUSSIONS Figure 13 shows the snapshots of the original neutron radiography images Upper and lower
images were recorded with recording speed of 250fps and 125 fps respectively When we obtained
the consecutive image with synchronizing each other rotating behaviour of the cadmium bars could be
recognized on all images Quality of the 125fps images was a little higher than that of the 250fps
images It was conformed from this result that we can recognize the motion of the tracer under the
condition of 250fps Quality of the images was low because of the low collimator ratio (LD) of about
10 - 24 and low scattered neutron beam flux at this moment If we can make the high collimator ratio
beam and high neutron flux beam then we could record much higher quality images
After many types of calibrations were applied to the original images as shown in Fig 13 we
can get the instantaneous 3D CT value distributions Furthermore from the consecutive instantaneous
3D CT value data velocity distributions of the tracers and its profiles were calculated using the PTV
Fig 14 shows the consecutive instantaneous 3D CT value distributions and velocity and profile of the
tracers in the rotating test section Revolving speed was 15rps and recording speed was 250fps 3D
CT value distributions were visualized using the volume rendering technique As shown in Fig 14
vertical cadmium bars were successfully visualized After we made the movie of the 3D CT values
we could observe the motion of the cadmium bars as the tracer Quality of the instantaneous 3D CT
images was low However center points of the tracers could be recognized and velocity could
calculate from its center points Instantaneous velocity of the tracer and its profile data could
visualized from the perpendicular eye point to the neutron beam as shown in Fig 14 In this figure
line and marker for velocity view were eliminated when the large miss vector of velocity and
impractical profile were recognized by the data processing software When we observed the velocity
and profile of tracer we could understand the center position of the tracer here and there Then next
smoothing processing on time direction was conducted Figure 15 indicates the results of profile after
smoothing processing As shown in Fig 15 we can understand the tracer profile from the data more
clearly
As above mentioned the principal of the dynamic neutron tomography velocimetry was
confirmed by the fundamental rotating experiments From the fundamental tents followings were
found
1) Limitation of the recording speed was 250fps at this moment
The 6th International Symposium on Measurement Techniques for Multiphase Flows IOP PublishingJournal of Physics Conference Series 147 (2009) 012087 doi1010881742-65961471012087
10
2) Diameter of the tracer should be larger than 20 mm 10mm was difficult to be recognized
at the pre-PTV processing
3) Improving of the original image quality is the most important subjects
Fig 13 Original neutron radiography images recorded on the imaging system
(Upper 250fps Lower 125fps)
The 6th International Symposium on Measurement Techniques for Multiphase Flows IOP PublishingJournal of Physics Conference Series 147 (2009) 012087 doi1010881742-65961471012087
11
(Revolving speed = 15rps Recording speed = 250fps XY-Plane)
Fig 14 Consecutive instantaneous 3D CT value distributions and velocity
and profile of the tracers in the rotating test section
The 6th International Symposium on Measurement Techniques for Multiphase Flows IOP PublishingJournal of Physics Conference Series 147 (2009) 012087 doi1010881742-65961471012087
12
Fig 15 Velocity and profile view from the top to the bottom
of the center part in the test section
5 CONCLUSIONS
Dynamic neutron tomography velocimetry technique was developed as the new visualization
and measurement method using the research reactor JRR-4 Fundamental rotating experiments were
carried out in order to proof its principal As the result cadmium tracers buried in the column with the
speed of 15 revolving per second could be visualized as the 3D movie under 125Hz and 250Hz
sampling conditions the profile of the tracer could be recognized well by the movie and fundamental
velocity distribution measurement method could be confirmed
ACKNOWLEDGEMENTS
This paper contains some results obtained within the task Development of High-speed
three-dimensional measurement technique for Liquid Metal Thermo-fluid Dynamics entrusted from
the Ministry of Education Culture Sports Science and Technology of Japan This research was
conducted using a supercomputer and the reserch reactor JRR-4 of the Japan Atomic Energy Agency
(JAEA) The authors would like to acknowledge Messrs M Katagiri K Soyama for there help on
making the neutron radiography converters and collimators H Tamai T Sato K Sakamoto N
Kurata H Yokota and M Nemoto for there assist on experiment and software
The 6th International Symposium on Measurement Techniques for Multiphase Flows IOP PublishingJournal of Physics Conference Series 147 (2009) 012087 doi1010881742-65961471012087
13
REFERENCES
Kureta M et al (2001) Void Fraction Measurement in Subcooled-Boiling Flow Using High-Frame-
Rate Neutron Radiography Nuclear Technology 136 pp241-254
Kureta M (2007) Development of a Neutron Radiography Three-Dimensional Computed
Tomography System for Void Fraction Measurement of Boiling Flow in Tight Lattice Rod Bundles J
Power and Energy Systems 1(3) pp 211-224
Kureta M and Iikura H (2008) Development of an Ultra-high-speed Scanning Neutron
Tomography System for High-quality and Four-dimensional Visualizations Nucl Instr Meth A (in
Print)
Saito Y et al (2005) Application of High Frame-rate Neutron Radiography to Liquid Metal Two-
Phase Flow Research Nucl Instr Meth A 542 pp 168-174
Takenaka N (1999) Application of Fast Neutron Radiography to Three-dimensional Visualization
of Steady Two-phase Flow in a Rod Bundle Nucl Instr Meth A 424 pp 73-76
The 6th International Symposium on Measurement Techniques for Multiphase Flows IOP PublishingJournal of Physics Conference Series 147 (2009) 012087 doi1010881742-65961471012087
14
Multi
Neutron
Beam
Test
Section
Tracer
Instantaneous Neutron
Radiography Images
CT
Instantaneous CT
Value Distribution
Dynamic
PIV
Instantaneous
Velocity Distribution
Recorded by Multi High-Speed
Video Cameras
Value(Dimension) Brightness(2D Instantaneous) CT(3D Instantaneous) V(3D Instantaneous)
Fig 1 Sketch of the principal of the dynamic neutron tomography velocimetry
Multi
Neutron
Beam
Collimator and
Scatter Materials
Absorber
NR Converter
Mirror
Visible
Light
Mirror
High-Speed
Video Camera
with II
Camera Obscura
Test Section
Fig 2 Cur view of the dynamic neutron tomography imaging system
The 6th International Symposium on Measurement Techniques for Multiphase Flows IOP PublishingJournal of Physics Conference Series 147 (2009) 012087 doi1010881742-65961471012087
3
22 Design and Manufacture of the Imaging System All imaging system was designed for the JRR-4 by using the MCNP Figure 3 shows the
outside view of the final design of the imaging system Most important parts are neutron control units
which are consisted of the collimators scatter blocks and neutron absorbers as shown in Fig 4 3D
arrangement of the imaging system was designed as shown in Fig 5 Each position is fixed by the
neutron beam design optical design and radiation shielding point of view Figure 6 indicates the 3D
view of the neutron beam lines and visible light lines from the backside of the test section Front and
back side mirrors reflect the side converter image to the high-speed video camera Design of the
neutron control units and radiation shielding were carried out using the MNCP Figure 7 shows the
3D distribution of thermal neutron around the test section Six neutron beams are generated and
penetrating the test section Figure 8 shows the simulated distribution of thermal neutron on the
neutron radiography converters We confirmed that the distribution was relatively uniform
Horizontal cross-section view and size of the parts near the test section are indicated in Fig 9 Two
neutron radiography images are projected on one converter Diameter of the test section and width of
one beam are 58mm Width of the converter is 140mm Beam height and imaging height are 240mm
and 214mm respectively as shown in Fig 10
Here the test section was designed to simulate the 7-rod bundle of the fast breeder reactor
Main material of the imaging system is listed as follows
Macro collimator and neutron scatter block Polyethylene (PE)
Parallel collimator B4C
Neutron absorber B4C
6Li
Converter 6Li+ZnS(Ag)
Mirror Aluminium on the quarts glass
Collimator
Scatter Materials
Camera Obscura
Reactor
Side
Fig 3 Outside view of the dynamic neutron tomography imaging system
The 6th International Symposium on Measurement Techniques for Multiphase Flows IOP PublishingJournal of Physics Conference Series 147 (2009) 012087 doi1010881742-65961471012087
4
(b) Photo
(c) Cut-View
(a) Neutron Control Unit
- Collimator
- Scatter Absorber
Materials
Macro
Collimator
(B4C)
Parallel
Collimator
(B4C)Scatter
Material
(PE)18x18mm2mm
(thickness)18x8mm
Fig 4 Neutron control units (collimator scatterabsorber parts)
NR Converter
Mirror
Test Section
Neutron
Absorber
Mirror
Mirror
Camera
(C001
MAX-II)
Camera
(C002
NEO-II)
Camera
(C003
MAX-II)
Lens
(50mmF095)
WD=15m
Fig 5 3D arrangement of the imaging system
The 6th International Symposium on Measurement Techniques for Multiphase Flows IOP PublishingJournal of Physics Conference Series 147 (2009) 012087 doi1010881742-65961471012087
5
Test Section Control Unit
Test Section (φ 60mm)
Collimator
(NR Converter Fluorescent)
Mirror
Mirror
Neutron
Beam
Visible
Light
Fig 6 3D view of the neutron beam lines and visible light lines
Fig 7 3D distribution of thermal neutron around the test section
(Simulation result by the Monte Carlo code)
The 6th International Symposium on Measurement Techniques for Multiphase Flows IOP PublishingJournal of Physics Conference Series 147 (2009) 012087 doi1010881742-65961471012087
6
Fig 8 Simulated distribution of thermal neutron on the neutron converters
58
Validφ 58 Test
Section
φ 60
140
140
140
60o
60o
60o Visible Light
Front Mirror
Converter
Camera Obscure
Neutron Absorber (B4C)
Macro Collimator(PE B4Cetc)
Parallel
Collimator
(B4Cetc)
Reactor Side
Fig 9 Horizontal cross-sectional view and size of the parts near the test section
The 6th International Symposium on Measurement Techniques for Multiphase Flows IOP PublishingJournal of Physics Conference Series 147 (2009) 012087 doi1010881742-65961471012087
7
Test
Section
φ 60
Test Section Height
370 (Test Section A)
376 (Test Section B)
372 (Test Section C)
Macro Collimator(PE B4Cetc)
Parallel
Collimator
(B4Cetc)
Reactor Side
Beam
Height
240
Beam
CenterBeam Center
Imaging
Height
214
Test Section
Controller
Fig 10 Vertical size of the test section and beams
23 Image Data Processing The data processing is classified into (A) Pre-CT processing (B) CT processing and (C)
Post-CT processing In the Pre-CT processing final output is (Σδ) value for calculation of the CT
value at the CT processing In the CT processing the instantaneous 3D CT value distribution is
calculated Post-CT processing is to measure the 3D velocity distribution and the flow profile
(A) Pre-CT processing
- Read the consecutive three camera images (1024x1024pixel or 512x512pixel 10bit)
- Kureta filter (2007) for reduction of the white-spot-noise
- Butterworth filter for reduction of the high frequency noise
- Brightness correction
- Vertical correction
- Projection angle correction
- Scale correction
- Brightness correction between imaging units and time directional
- Mirror image correction
- Cut two images from one converter image
- Calculation of (Σδ) value
(B) CT processing
- CT data processing by an improved MAP-EM algorism
(C) Post-CT processing
- Normalization and scaling to 8bit scale
- 3D binarization
- Shrinkage processing
- Swelling processing
- Labelling
The 6th International Symposium on Measurement Techniques for Multiphase Flows IOP PublishingJournal of Physics Conference Series 147 (2009) 012087 doi1010881742-65961471012087
8
- Calculation of the tracer center
- Calculation of velocity by the spring model PTV (Okamoto 1995)
- Smoothing processing
- Flow profile processing
We developed original data processing software named RAIDEEN and the 4D data viewer
named TRITON Since the data size and the processing time were extremely large RAIDEEN was
designed to work on the parallel supercomputer system Nominal CPU number was 128
3 EXPERIMENTAL
31 Fundamental Tests for the Principle Confirmation In order to proof the principle of this technique the fundamental experiments were carried
out using a rotating test section as illustrated in Fig 11 Photo in Fig 11 shows the inside view of the
test section Controlled revolving column which is made of aluminium is rotating in the fixed
aluminium case Cadmium bars and grains are buried in the column Here aluminium column and
cadmium barsgrains simulate the liquid-metal and tracer respectively Diameter of the cadmium
barsgrains are 10mm and 20mm
3
25
60
40
3
5
1520
23
25Cdφ2
75
45
12
12
6
9
6
39
20
8
12
25
Cdφ1
Beam
Center
Cdφ2Cdφ1
Cdφ2Cdφ1
10
3
96
φ 50 Cdφ2
Cdφ2
Empty
Aluminum Case (t=1)
Unit [mm]
Revolving Column(Aluminum)
φ 60
Al φ10
Beam
Center
Fig 11 Photo and sketches of the fundamental rotating test section
32 Test Conditions
Figure 12 shows the sketch of the control pattern of the rotating column The rotating speed
was 15 10 and 05 rps Surface speed of 15 rps was about 024 ms All imaging system was
installed in the JRR-4 and fundamental tests were carried out with recording speed of 125 fps and 250
fps
The 6th International Symposium on Measurement Techniques for Multiphase Flows IOP PublishingJournal of Physics Conference Series 147 (2009) 012087 doi1010881742-65961471012087
9
Fig 12 Sketches of the rotating control pattern
4 RESULTS AND DISCUSSIONS Figure 13 shows the snapshots of the original neutron radiography images Upper and lower
images were recorded with recording speed of 250fps and 125 fps respectively When we obtained
the consecutive image with synchronizing each other rotating behaviour of the cadmium bars could be
recognized on all images Quality of the 125fps images was a little higher than that of the 250fps
images It was conformed from this result that we can recognize the motion of the tracer under the
condition of 250fps Quality of the images was low because of the low collimator ratio (LD) of about
10 - 24 and low scattered neutron beam flux at this moment If we can make the high collimator ratio
beam and high neutron flux beam then we could record much higher quality images
After many types of calibrations were applied to the original images as shown in Fig 13 we
can get the instantaneous 3D CT value distributions Furthermore from the consecutive instantaneous
3D CT value data velocity distributions of the tracers and its profiles were calculated using the PTV
Fig 14 shows the consecutive instantaneous 3D CT value distributions and velocity and profile of the
tracers in the rotating test section Revolving speed was 15rps and recording speed was 250fps 3D
CT value distributions were visualized using the volume rendering technique As shown in Fig 14
vertical cadmium bars were successfully visualized After we made the movie of the 3D CT values
we could observe the motion of the cadmium bars as the tracer Quality of the instantaneous 3D CT
images was low However center points of the tracers could be recognized and velocity could
calculate from its center points Instantaneous velocity of the tracer and its profile data could
visualized from the perpendicular eye point to the neutron beam as shown in Fig 14 In this figure
line and marker for velocity view were eliminated when the large miss vector of velocity and
impractical profile were recognized by the data processing software When we observed the velocity
and profile of tracer we could understand the center position of the tracer here and there Then next
smoothing processing on time direction was conducted Figure 15 indicates the results of profile after
smoothing processing As shown in Fig 15 we can understand the tracer profile from the data more
clearly
As above mentioned the principal of the dynamic neutron tomography velocimetry was
confirmed by the fundamental rotating experiments From the fundamental tents followings were
found
1) Limitation of the recording speed was 250fps at this moment
The 6th International Symposium on Measurement Techniques for Multiphase Flows IOP PublishingJournal of Physics Conference Series 147 (2009) 012087 doi1010881742-65961471012087
10
2) Diameter of the tracer should be larger than 20 mm 10mm was difficult to be recognized
at the pre-PTV processing
3) Improving of the original image quality is the most important subjects
Fig 13 Original neutron radiography images recorded on the imaging system
(Upper 250fps Lower 125fps)
The 6th International Symposium on Measurement Techniques for Multiphase Flows IOP PublishingJournal of Physics Conference Series 147 (2009) 012087 doi1010881742-65961471012087
11
(Revolving speed = 15rps Recording speed = 250fps XY-Plane)
Fig 14 Consecutive instantaneous 3D CT value distributions and velocity
and profile of the tracers in the rotating test section
The 6th International Symposium on Measurement Techniques for Multiphase Flows IOP PublishingJournal of Physics Conference Series 147 (2009) 012087 doi1010881742-65961471012087
12
Fig 15 Velocity and profile view from the top to the bottom
of the center part in the test section
5 CONCLUSIONS
Dynamic neutron tomography velocimetry technique was developed as the new visualization
and measurement method using the research reactor JRR-4 Fundamental rotating experiments were
carried out in order to proof its principal As the result cadmium tracers buried in the column with the
speed of 15 revolving per second could be visualized as the 3D movie under 125Hz and 250Hz
sampling conditions the profile of the tracer could be recognized well by the movie and fundamental
velocity distribution measurement method could be confirmed
ACKNOWLEDGEMENTS
This paper contains some results obtained within the task Development of High-speed
three-dimensional measurement technique for Liquid Metal Thermo-fluid Dynamics entrusted from
the Ministry of Education Culture Sports Science and Technology of Japan This research was
conducted using a supercomputer and the reserch reactor JRR-4 of the Japan Atomic Energy Agency
(JAEA) The authors would like to acknowledge Messrs M Katagiri K Soyama for there help on
making the neutron radiography converters and collimators H Tamai T Sato K Sakamoto N
Kurata H Yokota and M Nemoto for there assist on experiment and software
The 6th International Symposium on Measurement Techniques for Multiphase Flows IOP PublishingJournal of Physics Conference Series 147 (2009) 012087 doi1010881742-65961471012087
13
REFERENCES
Kureta M et al (2001) Void Fraction Measurement in Subcooled-Boiling Flow Using High-Frame-
Rate Neutron Radiography Nuclear Technology 136 pp241-254
Kureta M (2007) Development of a Neutron Radiography Three-Dimensional Computed
Tomography System for Void Fraction Measurement of Boiling Flow in Tight Lattice Rod Bundles J
Power and Energy Systems 1(3) pp 211-224
Kureta M and Iikura H (2008) Development of an Ultra-high-speed Scanning Neutron
Tomography System for High-quality and Four-dimensional Visualizations Nucl Instr Meth A (in
Print)
Saito Y et al (2005) Application of High Frame-rate Neutron Radiography to Liquid Metal Two-
Phase Flow Research Nucl Instr Meth A 542 pp 168-174
Takenaka N (1999) Application of Fast Neutron Radiography to Three-dimensional Visualization
of Steady Two-phase Flow in a Rod Bundle Nucl Instr Meth A 424 pp 73-76
The 6th International Symposium on Measurement Techniques for Multiphase Flows IOP PublishingJournal of Physics Conference Series 147 (2009) 012087 doi1010881742-65961471012087
14
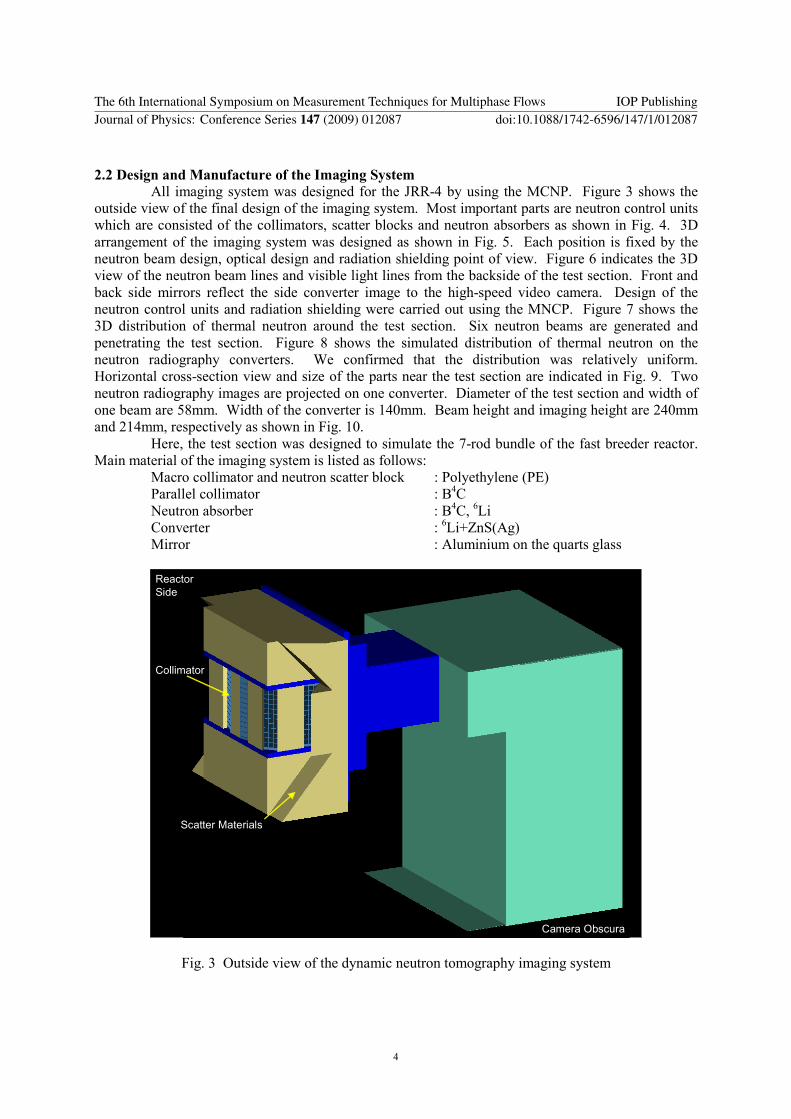
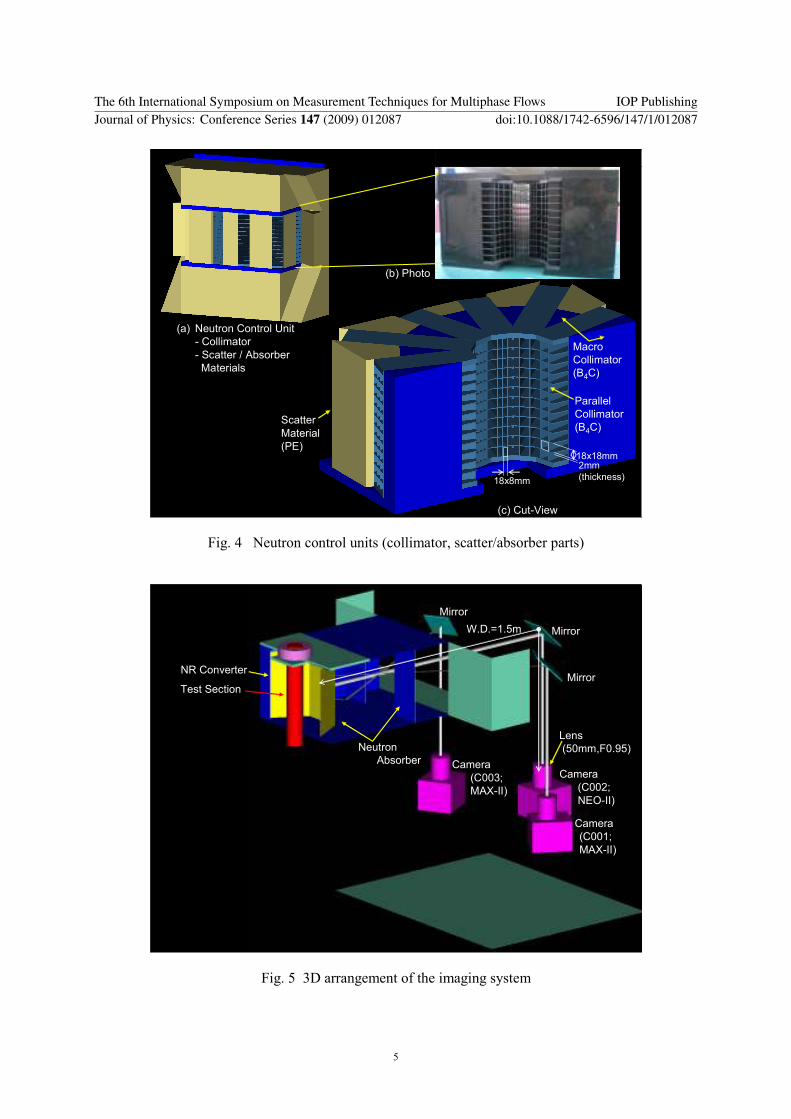
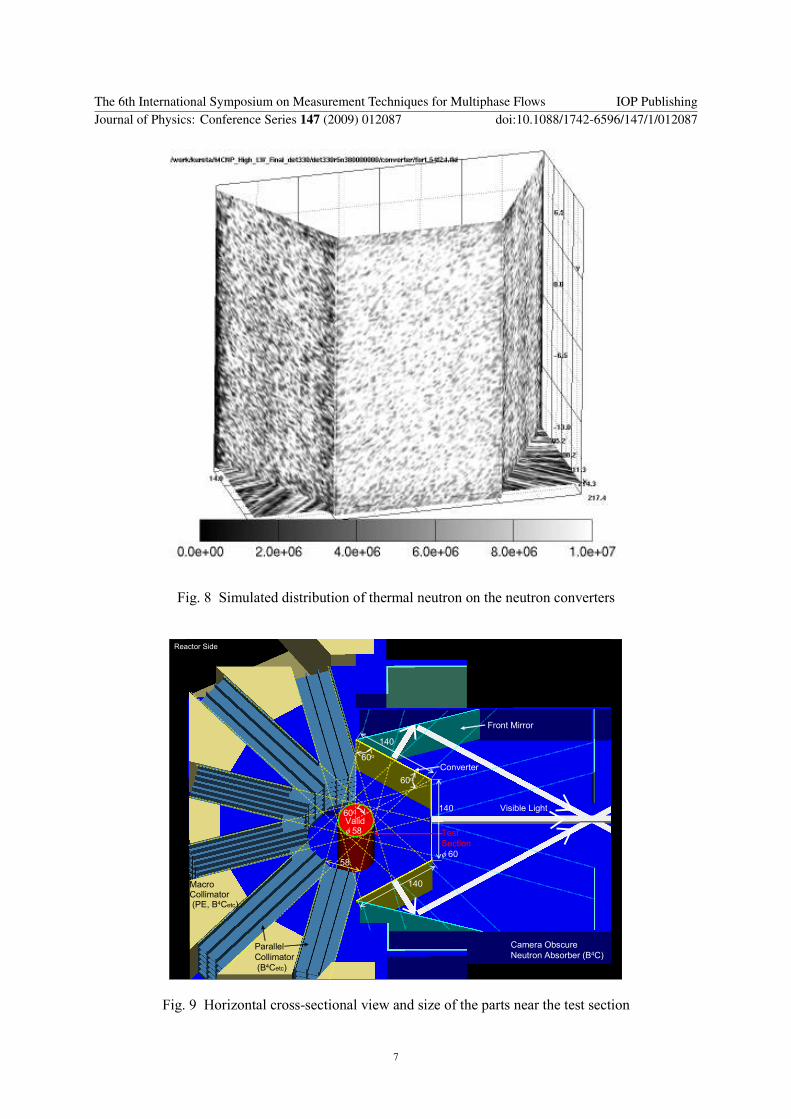
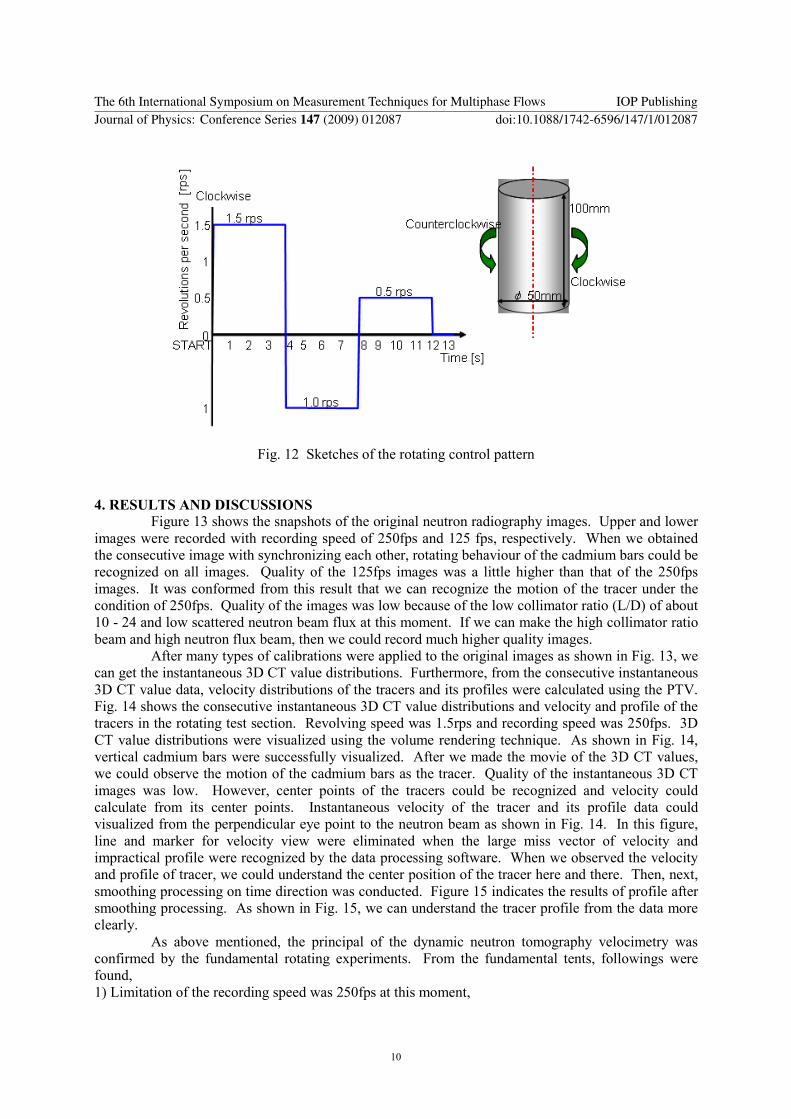
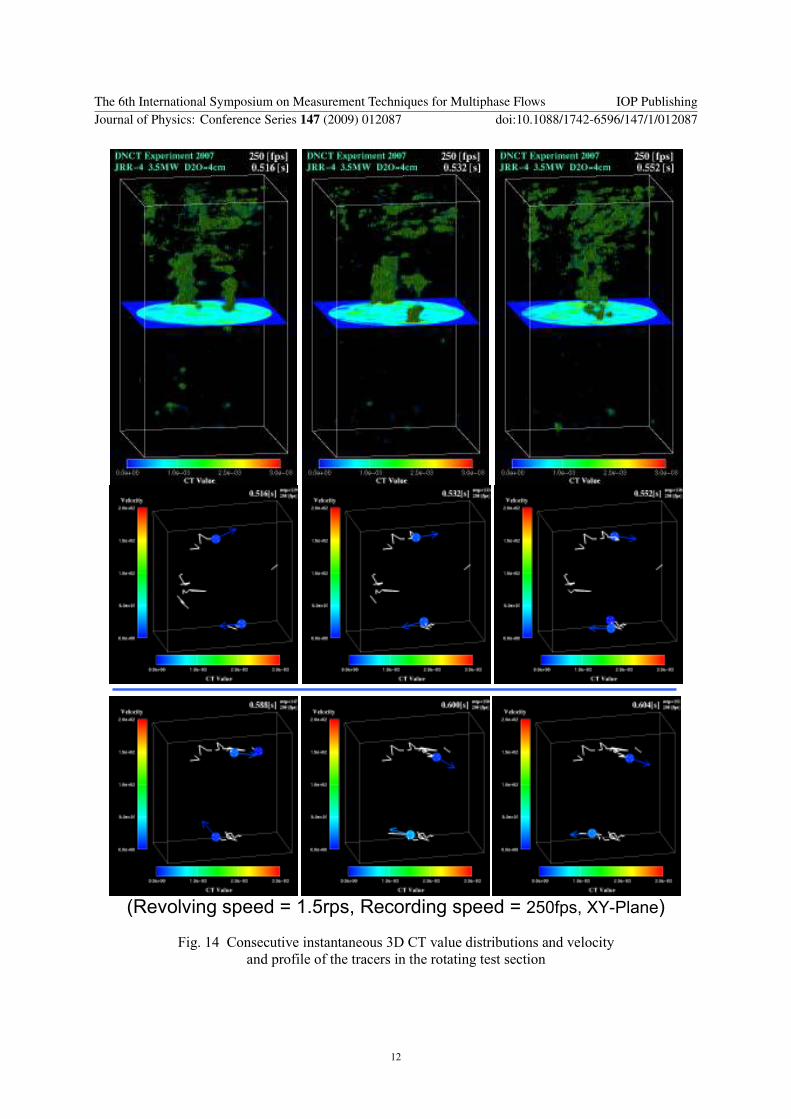
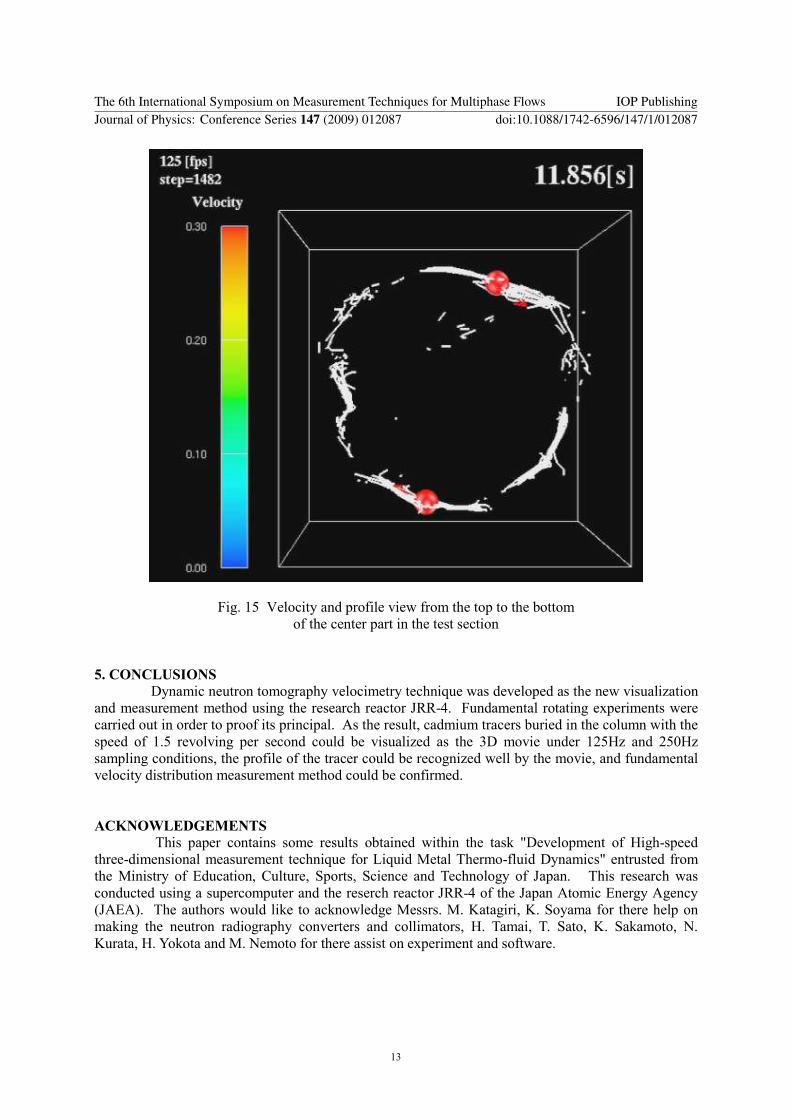