Dynamic features (and others) tutorial
26
Dynamic features (and others) tutorial beta 0.6
Transcript of Dynamic features (and others) tutorial

Dynamic features (and others) tutorial
beta 0.6

Create Connectivity matrix -> sliding windows
Generate the Sliding Window matrices with the „connectivity“
measure you desire:
- Pearson corr - Partial corr - Covariance - Mutual inf
- etc…..

GraphVar loads SW-matrices in the subject list
SW Matrices are stored (as usual) in your workspace/results/CorrMatrix and are loaded automatically in the
subject list
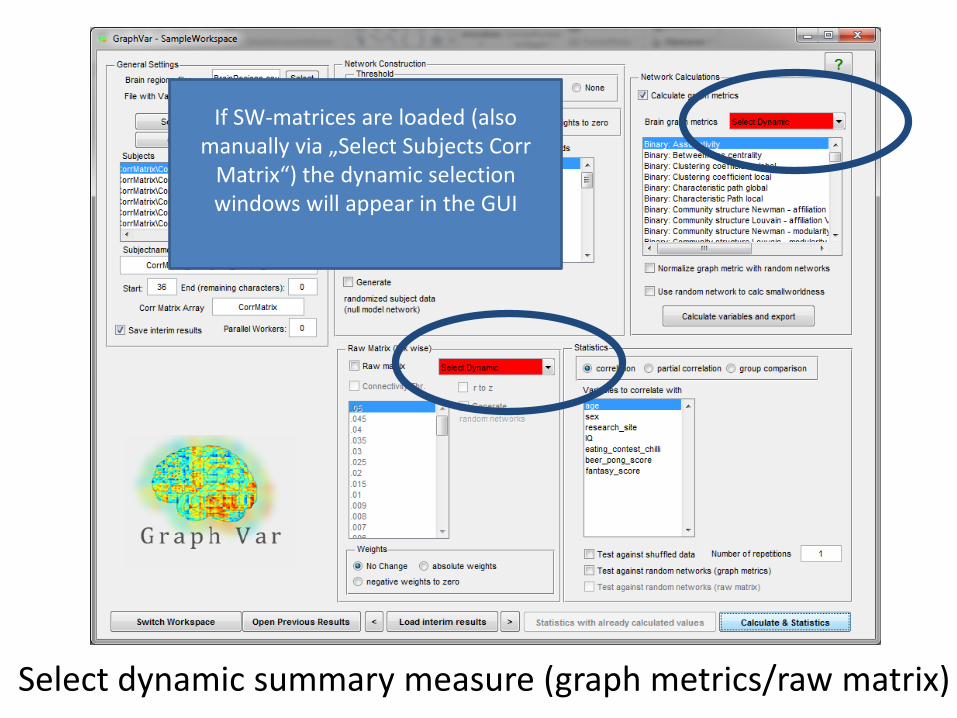
Select dynamic summary measure (graph metrics/raw matrix)
If SW-matrices are loaded (also manually via „Select Subjects Corr
Matrix“) the dynamic selection windows will appear in the GUI

Select dynamic summary measure (graph metrics/raw matrix)
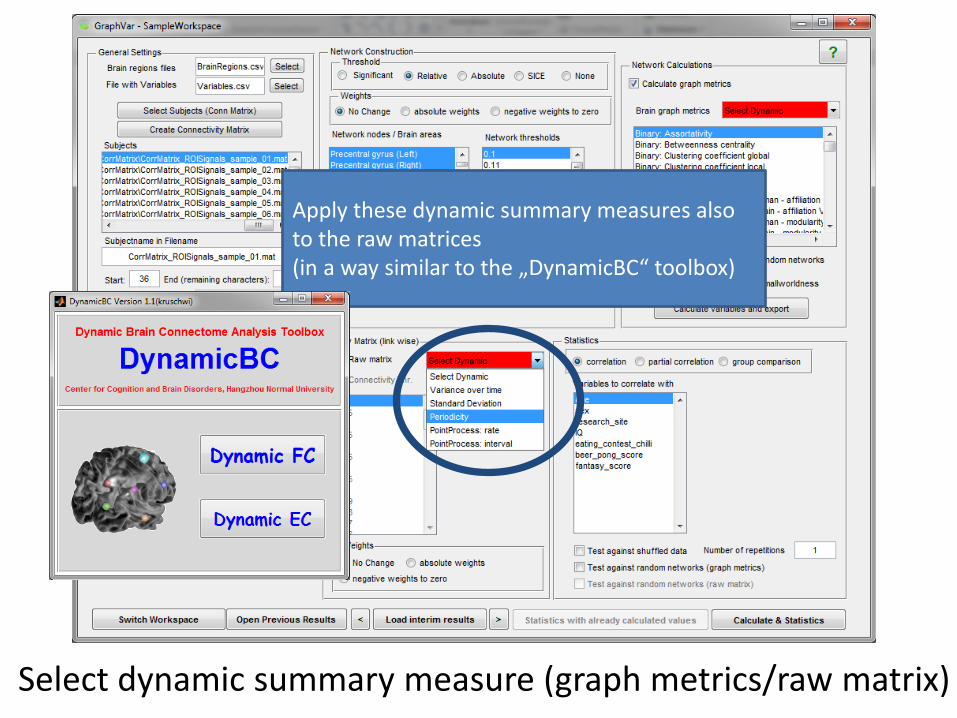
Dynamic summary measures*:
- Variance - Standard deviation - Periodicity - PointProcess: rate - PointProcess: intervall
* definition at the end of
document

Select dynamic summary measure (graph metrics/raw matrix)
GraphVar will perform all the operations with respect to the dynamic summary measure: e.g. compute the variance of the clustering coefficient across the sliding windows and export or do group statistics on this measure

Select dynamic summary measure (graph metrics/raw matrix)
A recent paper that showed differences in variance in Clustering Coefficient and Global Efficiency between schizophrenia patients and controlls (here we got the idea from)
Select dynamic summary measure (graph metrics/raw matrix)
Apply these dynamic summary measures also to the raw matrices (in a way similar to the „DynamicBC“ toolbox)
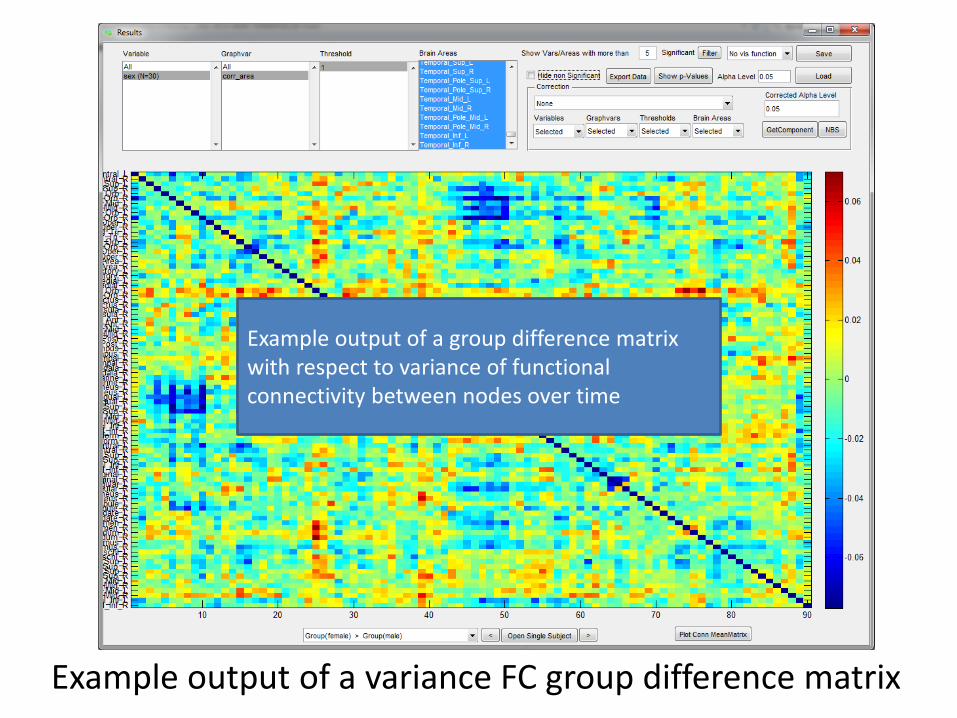
Example output of a variance FC group difference matrix
Example output of a group difference matrix with respect to variance of functional connectivity between nodes over time

Example output of a FC variance group difference matrix
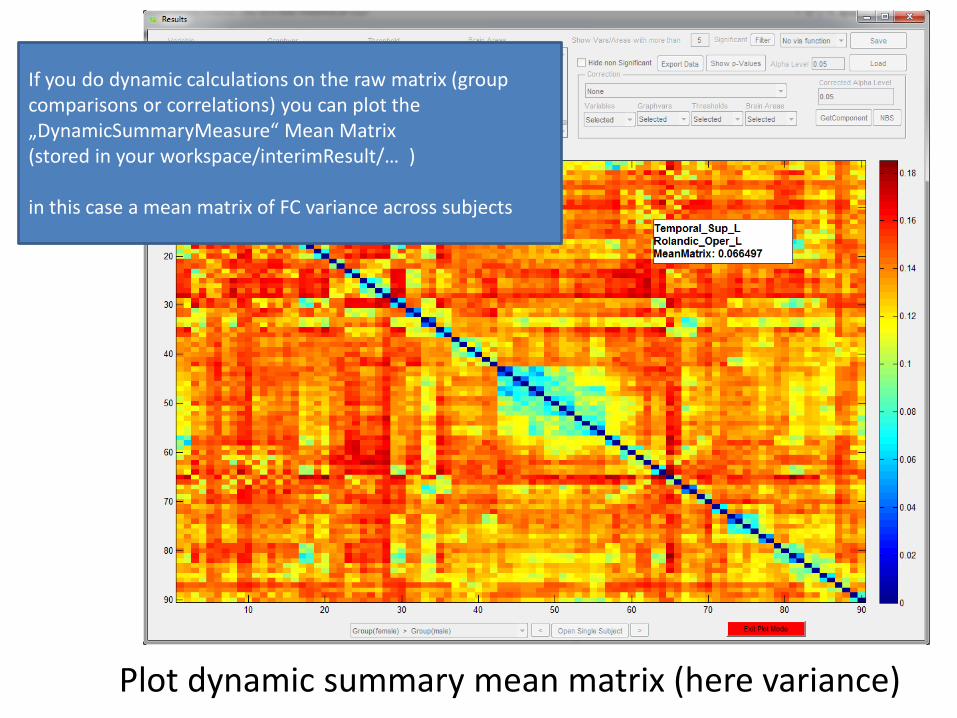
If you do dynamic calculations on the raw matrix (group comparisons or correlations) you can plot the „DynamicSummaryMeasure“ Mean Matrix (stored in your workspace/interimResult/… ) in this case a mean matrix of FC variance across subjects
If you do dynamic calculations on the raw matrix (group comparisons or correlations) you can plot the „DynamicSummaryMeasure“ Mean Matrix (stored in your workspace/interimResult/… ) in this case a mean matrix of FC variance across subjects
Plot dynamic summary mean matrix (here variance)

Plot mean FC for each sliding window (across subjects)
If you have conducted dynamic analyses on the raw matrix, you can plot the mean connectivity across all subjects for each sliding window
-> „Open Single Subject“ -> Dynamic Mean Matrix

… use the „sliding window“ arrow keys to navigate through the time points ….
Plot mean FC for each sliding window (across subjects)
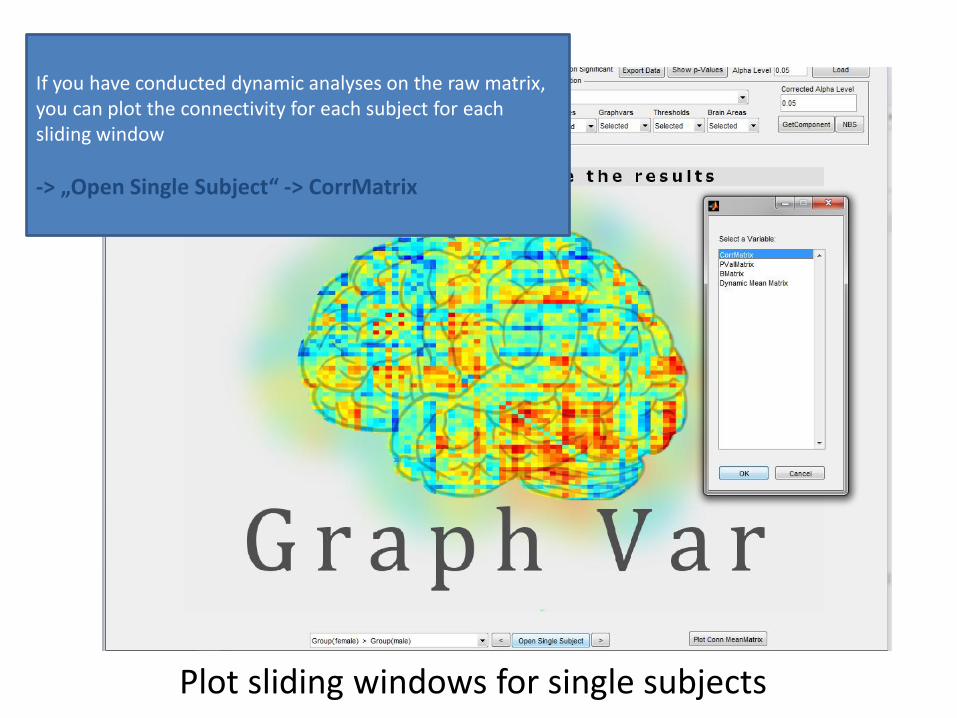
Plot sliding windows for single subjects
If you have conducted dynamic analyses on the raw matrix, you can plot the connectivity for each subject for each sliding window
-> „Open Single Subject“ -> CorrMatrix

Plot mean FC for each sliding window (across subjects)
Sliding Window Select subject with arrows

NBS with dynamic summary measures
… you can also perform Network Based Statistics with the dynamic summary measure (e.g. variance) to identify a network that relates to this dynamic effect
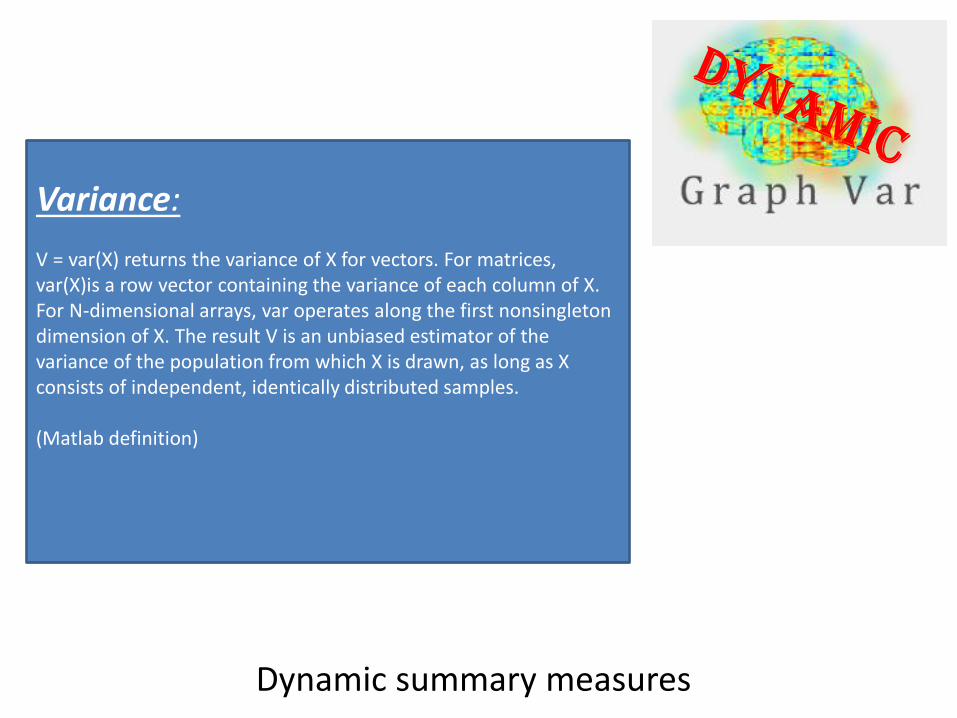
Dynamic summary measures
Variance: V = var(X) returns the variance of X for vectors. For matrices, var(X)is a row vector containing the variance of each column of X. For N-dimensional arrays, var operates along the first nonsingleton dimension of X. The result V is an unbiased estimator of the variance of the population from which X is drawn, as long as X consists of independent, identically distributed samples. (Matlab definition)

Dynamic summary measures
Standard Deviation: s = std(X), where X is a vector, returns the standard deviation. The result s is the square root of an unbiased estimator of the variance of the population from which X is drawn, as long as X consists of independent, identically distributed samples. (Matlab definition)

Dynamic summary measures
Periodicity: idea and function from http://studyforrest.org/contest_findforrestnetworks.html “Identifying task-related activity using periodic graph properties” Sat 01 November 2014 Lars Marstaller, Jeiran Choupan, Arend Hintze -> Periodicity: 1. Optional: band pass filter of the time series of graph measures or connectivity
measures of the raw matrix (by default this is not done; to change see script in src/ext/DynamicSummaryMeasures/periodicity)
2. project it into the frequency domain using a Fast Fourier transform. 3. Next, we count the number of peaks (defined as zero crossings of the first derivative)
and calculate the maximum and the median of the power spectrum. 4. From these a final singular measure is derived, which is higher the more 'peaky' the
power spectrum and hence the more periodic the changes in network properties
5. (measure = maximum/[median*peaks])

Dynamic summary measures
PointProcess – rate/interval: idea from the paper: “Enhanced repertoire of brain dynamical states during the psychedelic experience: Enhanced Repertoire of Brain Dynamical States. Human Brain Mapping 35, 5442–5456. doi:10.1002/hbm.22562” by Tagliazucchi, E., Carhart-Harris, R., Leech, R., Nutt, D., Chialvo, D.R., 2014. ->the authors apply this to BOLD time series (in GraphVar “Raw matrix”) . We also offer to apply this method to “graph time series” (i.e., local efficiency at different time points). It is up to the community to determine if this approach may contribute to the evolving field of dynamic graph theory. -> Point Process – Rate/interval: „ … A recent series of studies demonstrated that the continuous BOLD signal can be transformed into a discrete point-process encoding the timings of the most functionally relevant events [Petridou et al., 2012, Davis et al., 2013; Tagliazucchi et al., a,b, 2012a]. In this approach, relevant events are defined by a threshold crossing (e.g. whenever the signal departs +1 SD from its mean value). Two interdependent observables are defined once the point-process is obtained: the rate (number of crossings divided by the series length) and inter-event intervals (average temporal separation between two consecutive points). On average, there is a clear inverse relationship between these two variables. Furthermore, the rate is expected to increase (or the interval to decrease) for a signal with a high contribution of fast frequencies.” This approach is described as an efficient alternative to spectral analysis.
As default in GraphVar the critical threshold is set as mean + - 1 SD of the respective time series You can change this in the scripts: src/calc/pointprocess_*

Dynamic summary measures
Do it yourself: As always you can include your own scripts for your costum analyses 1. Add your function name in the GUI 2. Add your function name in „CalcCorrMatrix“ 3. Add your function name in „CalcVars“
4. -> make sure you find all the parts where „e.g. periodicity“ is mentioned in the scrips
and copy the style of the reference functions. Also use the dimensions of the data as we suggest (the „multidimfunc“ will do the rest)
If you have an awesome function that you would like to share with the community through GraphVar, we would be happy to receive the proper MATLAB code to include it in an upcoming version!

Dynamic summary measures
Additional „GetComponent“ feature in beta 0.6

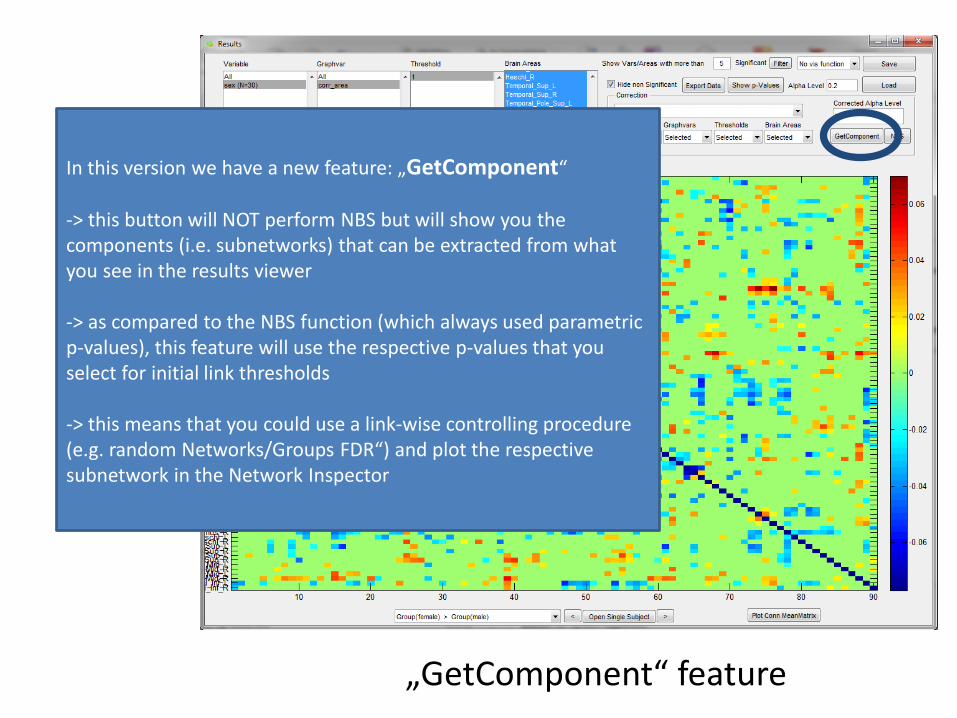
„GetComponent“ feature
In the previous GraphVar versions we had a button „Show Network“ -> This old button reffered to Network Based Statistics (NBS) … NBS was (and is) always performed with parametric derived test-statistics (i.e., p-values) as initial link threshold -> NBS is now performed by hitting the button „NBS“
„GetComponent“ feature
In this version we have a new feature: „GetComponent“ -> this button will NOT perform NBS but will show you the components (i.e. subnetworks) that can be extracted from what you see in the results viewer -> as compared to the NBS function (which always used parametric p-values), this feature will use the respective p-values that you select for initial link thresholds -> this means that you could use a link-wise controlling procedure (e.g. random Networks/Groups FDR“) and plot the respective subnetwork in the Network Inspector
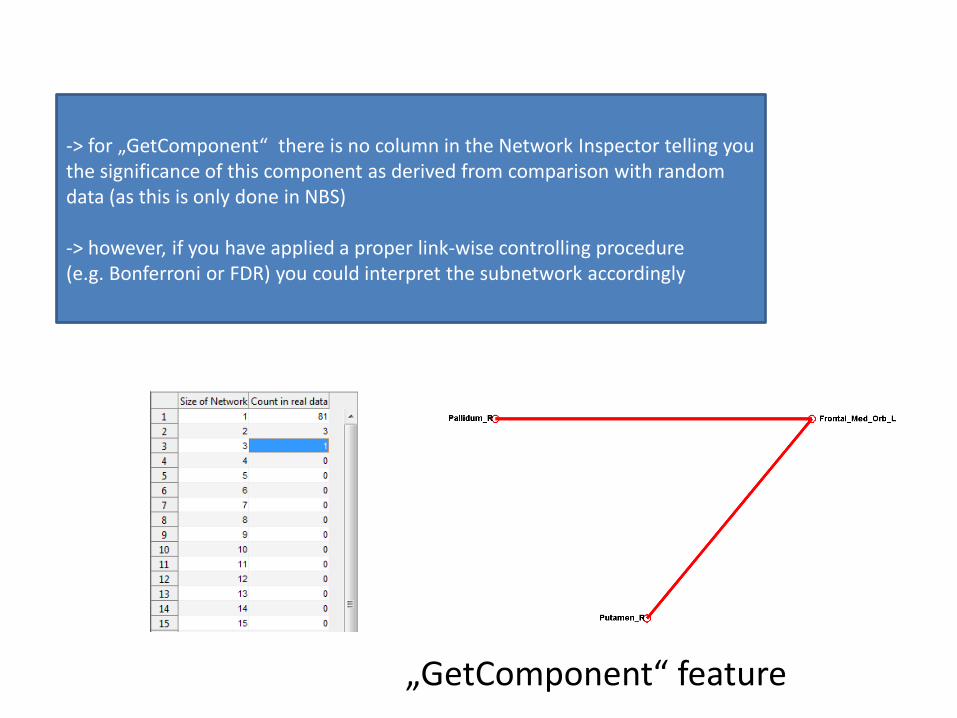
„GetComponent“ feature
-> for „GetComponent“ there is no column in the Network Inspector telling you the significance of this component as derived from comparison with random data (as this is only done in NBS) -> however, if you have applied a proper link-wise controlling procedure (e.g. Bonferroni or FDR) you could interpret the subnetwork accordingly