Dyes and Dye Intermediate Industries -...
52
Sectoral Guidance Manual Series Manual drafted by Environmental Management Centre LLP C-29, Royal Industrial Estate, 2 nd Floor, Naigoan X Road, Wadala, Mumbai – 400031 Gujarat Cleaner Production Centre 3 rd Floor, Block No. 11-12, Udyog Bhavan Gandhinagar, Gujarat Cleaner Production in the Dyes and Dye Intermediate Industries
Transcript of Dyes and Dye Intermediate Industries -...

Sectoral Guidance Manual Series
Manual drafted by
Environmental Management Centre LLP C-29, Royal Industrial Estate, 2nd Floor, Naigoan X Road, Wadala,
Mumbai – 400031
Gujarat Cleaner Production Centre 3rd Floor, Block No. 11-12, Udyog Bhavan
Gandhinagar, Gujarat
Cleaner Production in the
Dyes and Dye Intermediate
Industries
© Gujarat Cleaner Production Centre (GCPC), 2012 This publication may be reproduced in whole or in part and in any form for educational or non-profit purposes without special permission from the copyright holder, provided acknowledgement of the source is made. GCPC would appreciate receiving a copy of any publication that uses this publication as a source. No use of this publication may be made for resale or for any other commercial purpose whatsoever without prior permission in writing from the GCPC. The document is intended to provide guidance to the dyes & dye-intermediate industries in developing approaches for Cleaner Production.Compliance with environmental regulations is the responsibility of each individual businesses and is not the focus of this document. Any use made of this report, or reliance on, or any decision to be made based on it, is the responsibility of such user. The GCPC or EMC accepts no responsibility for damages, if any, suffered by any third party as a result of decisions made or actions taken based on this manual. Published by: Gujarat Cleaner Production Centre 3rd Floor, Block No. 11-12, Udyog Bhavan, Gandhinagar, Gujarat Tel +91 79 232 44147 E-mail [email protected] Home page http://www.gcpcgujarat.org.in Concept Bharat Jain, Member Secretary, GCPC Research, preperation and design Environmental Manabgement Centre LLP C-29, Royal Industrial Estate, 2nd Floor, Naigoan X Road, Wadala, Mumbai – 400031 Manual drafted by Shantanu Roy with assisstance from Mahazareen Dastur

Cleaner Production in the
Dyes and Dye Intermediate Industry
[2]
About this Manual
The importance of dyes cannot be understated. From textiles to
medicines, the industry forms an important constituent to
various product lines. The synthetic organic chemical industry
began in 1856 when English chemist William Henry Perkin
prepared the dye mauve from coal-tar chemicals. Perkin built
a factory near London to supply the world's first synthetic dye.
Since then, the industry has grown by leaps and bounds, with a
large chunk of its base shifting to Asia post World War II. The
origin of the dyestuff industry in India can be traced to the
fifties when most dyes and intermediaries were totally
imported in the country. Gradually the manufacturing of
dyestuffs picked up in the country and in the early eighties this
industry started export in good quantity. Today, the Indian
State of Gujarat alone is home to a dyes and dye intermediate
industry with an estimated worth Rs. 15,000 crores.
And yet, with the prosperity, there are problems as well. It is
not without reason that this sector appears in the red category
list issued by the Central Pollution Control Board. The
environmental problems arose first after industrialization
replaced traditional natural dyes by the synthetic dyes used
today. Over and above the pollution the industry generates,
issues pertaining to poor economies of scale, ban on certain
dyes in export markets, ever-increasing prices of raw materials,
and competition from other developing countries, have started
squeezing profit margins to such an extent that small scale
producers (the very backbone of this industry in India) are
finding it hard to stay afloat.
In such a scenario, the implementation of the concept of
Cleaner Production can breathe new life into small-scale dyes
and dye intermediate production units.
“Improved housekeeping while drying has led to the net
saving of Rs. 48,240 per annum with no initial
investment in a company manufacturing OCPNA (Ortho
Chloro Para Nitro Aniline)...”, “Modification in the
addition practice of Phthalic Anhydride and Di-Ethyl
Meta Amino Phenol in a Rhodomine manufacturing has
led to an annual savings of Rs. 2,28,480. This involved
the investment of a mere Rs. 3,000 and an operational
cost of Rs. 3,580. This also reduced the cost of energy on

Cleaner Production in the
Dyes and Dye Intermediate Industry
[3]
heating, as the reaction is exothermic. The shop floor
environment also improved by virtue of this solution”...
There are many such examples and they are all possible only
through Cleaner Production. Cleaner Production is a creative
and innovative way of thinking about products and the
processes which make them. Cleaner Production may be
achieved by adopting one technique or a combination of
various techniques such as good housekeeping, input material
change, better process control, by-product recovery,
equipment modification, etc. This proactive approach to waste
management serves a dual purpose – to ensure that waste
generation is minimized to start with and in doing so, boost the
productivity and profitability of the enterprise.
While there are some already existing manuals on Cleaner
Production the present manual is specifically focused on
cleaner production techniques applicable to the small-scale
dyes and dye intermediate industry in India. It is hoped that the
Cleaner Production techniques presented here will encourage
these industries to successfully undertake Cleaner Production
at their facilities as well.

Cleaner Production in the
Dyes and Dye Intermediate Industry
[4]
Acknowledgement
Gujarat Cleaner Production Centre (GCPC) wishes to express
gratitude and thanks to all the persons and departments that
contributed in the many ways for the preparation of this
manual. The shared technical knowledge, experiences, and
perspectives have produced a tool that will have a significant
positive impact on the environment by preventing pollution
through Cleaner Production strategies in the Dyes & Dye
Intermediate sector.
We want to thank Dr. K.U Mistry, Chairman, Gujarat Pollution
Control Board (GPCB) and Shri Hardik Shah, Member Secretary,
GPCB for giving approval to commence this manual in the first
instance and encouraged us to go ahead.
We are deeply indebted to the Environmental Management
Centre LLP, Mumbai whose help, support, interest, stimulating
suggestions and encouragement helped us in all the time of
research and writing of this manual, without whom it would
have been a distant reality.
Hearty wishes and thanks to GCPC ENVIS Team and GCPC
officials and staff for their hard work and valuable assistance in
bringing out this guidelines. Sincere appreciation is also
extended to the officials of GPCB who have provided peer
review to the modules.

Cleaner Production in the
Dyes and Dye Intermediate Industry
[5]
List of Abbreviations
ASC Acetyl Sulfonyl Chloride
BOD Biochemical Oxygen Demand
CETPs Common Effluent Treatment Plants
COD Chemical Oxygen Demand
CPA Cleaner Production Assessment
DCNB Dichloronitrobenzene
DEMAP Di-Ethyl Meta Amino Phenol
EC European Commission
ETP Effluent Treatment Plant
GCPC Gujarat Cleaner Production Centre
GDMA Gujarat Dyestuff Manufacturer’s Association
GPCB Gujarat Pollution Control Board
IPA Iso-Propyl Alcohol
kg Kilogram
MIF Multilateral Investment Fund
MNA Meta Nitro Aniline
MoEF Ministry of Environment and Forests
NMJ N-Methyl J Acid
NPC National Productivity Council
OCPNA Ortho Chloro Para Nitro Aniline
REACH Registration, Evaluation and Authorization of Chemicals
SIDBI Small Industrial Development Bank of India
SMEs Small and Medium Enterprises
SSI Small-scale industry
SWGF Specific Waste Generation Factor
TDS Total Dissolved Solids

Cleaner Production in the
Dyes and Dye Intermediate Industry
[6]
What would you like to know?
Cleaner Production in the
Dyes and Dye Intermediate Industry
[7]
1.0 The Dyes and Dye Intermediate Industry
1.1 What are dyes and dye intermediates?
Dyestuff is a general industry term covering both dyes and pigments in terms of chemistry,
reactions and properties. Dyes are intensely coloured organic compounds or mixtures used for
imparting colour to the substrates ranging from cloth, paper, leather to plastics in a permanent
fashion. There are about 600 types of dyestuffs produced in the country. A dye is generally
applied in an aqueous solution, and may require a mordant to improve the fastness of the dye
on the fibre. The basic importance of dye lies in its product and resistant to washing. Pigments,
on the other hand, are insoluble and are important inputs to products such as paints.
A dye intermediate is the main raw material used for the manufacturing dyestuff. The
manufacturing chain of dyes can be traced back to petroleum based products. Naphtha and
natural gas are used for the production of benzene and toluene, which are subsequently used
for manufacturing nitro-aromatics. The nitro-aromatics are then used for manufacturing the
compounds called dye intermediates. Hence, the third stage of production i.e., from nitro
aromatics to a dye intermediate is a part of the dyes and dye intermediate sector. Examples of
major dye intermediates are Vinyl Sulfone, Gamma Acid, H Acid, CPC Blue, J Acid, α-Naphthyl
Amine, etc.
1.2 Classification of Dyes
Dyestuffs have been classified in different categories based on the criteria like the colour,
origin (natural or synthetic), chemical structure or constitution, applications and method of
application. Application-based classification is the most useful and widely accepted
classification system by dye manufacturing industries. The various types of colouring matter
based on their classification are shown in Figure 1.
Dyes are also used in high technology applications, such as in the medical, electronics, and
especially the reprographics industries. These applications are low volume (tens of kg up to
several hundred ton per annum) and high added value (hundreds of dollars to several
thousand dollars per kg), with high growth rates (up to 60%).

Cleaner Production in the
Dyes and Dye Intermediate Industry
[8]
Figure 1: Types of Dyes Based on Classification
1.3 The Global and Indian Dyes and Dye Intermediate Industry
The dyestuff sector is one of the important segments of the chemicals industry in India, having
forward and backward linkages with a variety of sectors like textiles, leather, paper, plastics,
printing inks and foodstuffs. The textile industry accounts for the largest consumption of
dyestuffs (about 80% of the total dye production). Table 1 provides information about the
areas of application of dyes in this industry.
Table 1: Areas of Application of Dyes in the Textiles Industry1
Group Application
Acid Wood, silk, paper, synthetic fibres, leather
Azoic Printing inks and pigments
Basic Silk, wood, cotton
Direct Cotton, cellulosic and blended fibres
Disperse dyes Synthetic fibres
Reactive Cellulosic fibres and fabric
Organic pigments Cotton, cellulosic, blended fabric and paper
Sulfur Cotton and cellulosic fibres
Vat dyes Cotton, cellulosic and blended fibres
1 Potential for Adoption of Clean Technologies in SMEs: An Introduction. Central Pollution Control Board.
April 2011. Series: IMPACTS/16/2011-2012.

Cleaner Production in the
Dyes and Dye Intermediate Industry
[9]
In contrast, 40-50% of dyes produced in the developed countries find application in paint
industry, 30-40% in other industries and less than 10% of the aggregate is used in textile
sector. However, due to the growth in export and very high export potential of the dyestuff,
the dependence of this sector on textile sector is slowly being diluted. Further, the domestic
demands of dyes are increasing due to the growth of industrial paint industries, printing
industries, plastic and tannery industries, which are also consumers of dyestuff.
The world market, which was traditionally highly dominated by Europe and North America, is
now being slowly taken over by Asia. Asian markets are growing at a very rapid pace. Since
European countries concentrate on specialty products, they have continued to remain major
players in this industry (as seen in Figure 2).
Figure 2: Global Market Share of the Dyestuff Industry2
From being importers and distributors in the 1950s, the dyestuff sector has now emerged as a
very strong industry and a major foreign exchange earner. India has emerged as a global
supplier of dyestuffs and dye intermediates, particularly for reactive, acid, vat and direct dyes,
post 1970, due to the introduction of government policy on Small-scale Industry3 (SSI)
reservations along with excise exemption and concessions. This led to an overnight
mushrooming of units especially in Gujarat and Maharashtra.
Dyestuff production has increased from 3,500 TPA to 1,60,000 TPA today, meeting more than
95% of the domestic requirement. India accounts for 7% of the world production.4 In Gujarat
2 Indian Dyestuff Industry and Global Opportunities. White Paper for FICCI, New Delhi, 2006. Available
at: http://www.cygnusindia.com/articles/Indian%20Dyestuff%20Industry-FICCI%20Whitepaper-
180906.pdf 3 Definition of an SSI unit: An industrial undertaking having an investment in fixed assets (plant and
machinery; whether held on ownership terms on lease or on hire purchase) not exceeding Rs. 10
million. Source: Ministry of Micro, Small and Medium Enterprises, Government of India. 4 Website of the Department of Chemicals and Petrochemicals. Available at:
http://chemicals.nic.in/chem1.htm.
Cleaner Production in the
Dyes and Dye Intermediate Industry
[10]
alone, the industry is worth Rs. 15,000 crores.5 Nearly 80% of the total capacity is in the state
of Gujarat, where there are nearly 750 units. The industry has now firmly established itself in
the export field; today it is the second largest export earner in the chemical industry and the
third largest exporter among the developing countries.
Exports of dyes and dye intermediates are to Western Europe (Germany, UK, Netherlands,
Italy, Switzerland, France etc.), South Asia (Bangladesh, Sri Lanka), East Asia (Australia, Hong
Kong, Indonesia, Japan, Singapore, Thailand etc.), North America (USA, Canada etc.).
With developed countries having shifted their manufacturing base for non-specialty products
to the east and China having captured 25% of the world market share,6 the Indian industry has
a very challenging role ahead. Export revenues fell from Rs. 2,823 crores in 2001 to Rs. 2,213
crores in 2002. In order to increase its export revenues for countering this challenge, the
Ministry of Chemicals and Fertilizers along with Dyestuff Manufacturers Association of India
developed a strategic action plan, which envisioned an increase in exports by four times to
achieve an export revenue target of US$ 2.5 billion i.e. Rs. 12,000 crores by 2010.
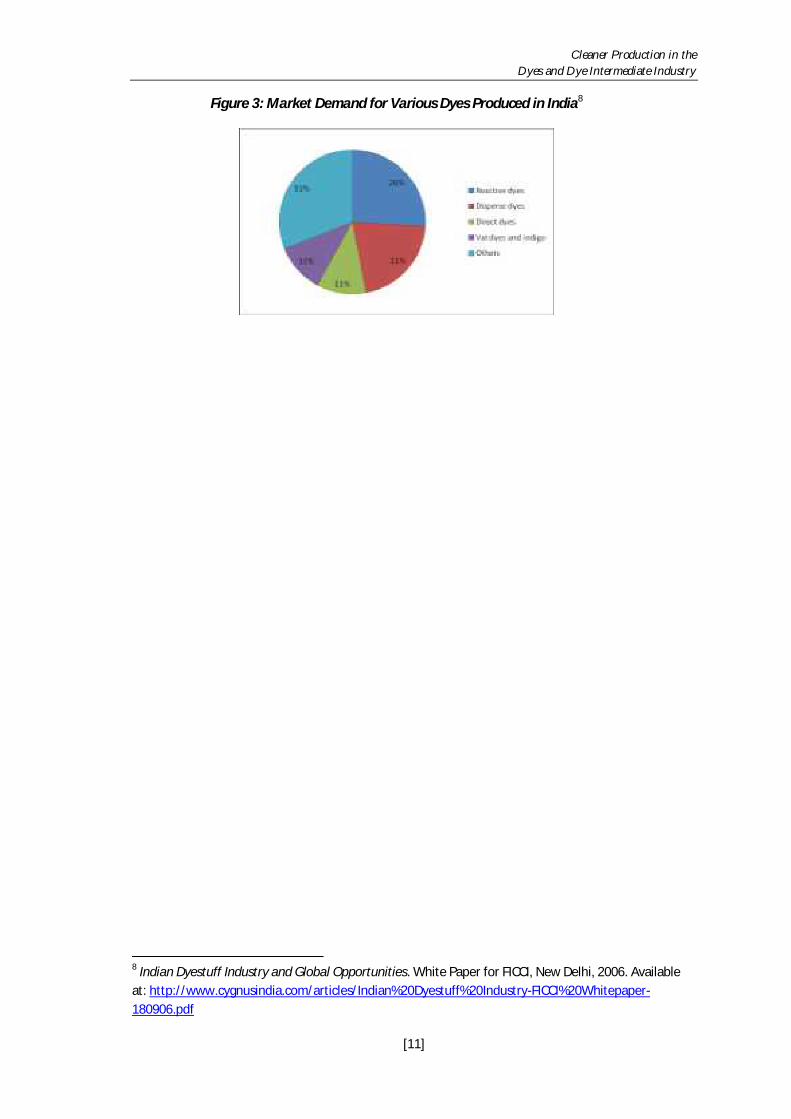
1.4 Types of Dyestuff Manufactured in India
Dyes highly consumed in India are vat dyes, disperse dyes, reactive dyes, azoic, acid and direct
dyes (refer to Figure 3). Reactive dyes are gaining popularity owing to better fastness. Disperse
and reactive dyes constitute the largest product segments in the country constituting nearly
45% of dyestuff consumption. Vat dyes are superior to reactive dyes, but are almost ten times
more expensive. With the change in the product profile of the textile industry from the high-
cost cotton textiles to the highly durable and versatile synthetic fibres, the consumption
pattern of dyes has also been changing. Polyesters are projected to account for a large part of
dye consumption in the country. Accordingly, disperse dyes, which find application in
polyesters, are projected to grow faster.7
5 Article in Times of India: Dye Units Fear Chemical Crunch. Available at:
http://articles.timesofindia.indiatimes.com/2011-03-16/india-business/28698981_1_dyes-and-
intermediates-chemicals-shailesh-patwari. 6 Global Dyestuff Industry. Available at: http://www.dyespigments.com/global-dyestuff-industry.html. 7 Sector Overview: Dyestuff. Available at: http://myiris.com/.
Cleaner Production in the
Dyes and Dye Intermediate Industry
[11]
Figure 3: Market Demand for Various Dyes Produced in India8
8 Indian Dyestuff Industry and Global Opportunities. White Paper for FICCI, New Delhi, 2006. Available
at: http://www.cygnusindia.com/articles/Indian%20Dyestuff%20Industry-FICCI%20Whitepaper-
180906.pdf

Cleaner Production in the
Dyes and Dye Intermediate Industry
[12]

Cleaner Production in the
Dyes and Dye Intermediate Industry
[13]
2.0 Critical Factors Affecting the Sector in India
The following major factors affect this sector adversely in India (and by extension, Gujarat):
Poor economies of scale
Issues related to environmental pollution
Ban on certain dyes in export markets
Prices of raw materials
Competition from other developing countries
Low expenditure on research and development
These factors are explained in detail below.
2.1 Poor Economies of Scale
As mentioned previously, the Indian dyestuff industry is dominated by SSIs. Out of 1,200 units,
only 160 are large scale units, while the rest are SSIs. SSIs concentrate on production of
reactive dyes, acid dyes, and direct dyes, while large companies mainly concentrate on vat,
disperse and pigment dyes.
With the government's policy to encourage SSI growth, economies of scale are very low; while
8-10 units of the developed countries produce 63% of the world production, the Indian
contribution from 1,200 units approximates to only 8-9%. Clearly, the productivity for SSIs in
this sector is very low.
2.2 Issues Related to Environmental Pollution
The Supreme Court has been very active in shutting down a number of units in the country,
which did not adhere to pollution standards. In 1995, given the sheer spate of public interest
litigations against polluting industries, the Gujarat High Court passed judgment on closure of
756 industrial units in Vatva, Narol, Naroda, and Odhav. Industries generating specified dye
intermediate products formed part of this list and were ordered closed till they put up a
treatment system for achieving the prescribed norms.
SSIs form a major chunk of the producers and typically develop in clusters. As a result,
pollution loads on a collective basis have been found to be often quite high even if the
Cleaner Production in the
Dyes and Dye Intermediate Industry
[14]
environmental impacts of individual units are low. Many a time, such enterprises are
frequently located near human settlements. As a result, they pose considerable on-site and
off-site risks to the neighborhood as well as to the environment.
Moreover, SSIs manufacture products in batch processes rather than a continuous process,
mainly in order to cater to product diversity. However, batch operations are intermittent (i.e.
irregular and sporadic) and have almost no degree of automation to control the amounts of
raw material being used in the process (it has been reported that 20%-75% of raw material is
lost as “waste”).9 These practices tend to contribute greatly to pollution generation. It
becomes extremely hard to characterize and therefore control the various sectional waste
streams emerging from the units.
Increasingly stringent environmental legislation poses a threat to the survival of these units,
which are a crucial component of the economy, and a source of employment to a large
segment of the population. SSIs are unable to meet environmental regulations, mainly
because of high capital and operating costs, space constraints and lack of adequate skills for
operating the facilities. Besides the environmental requirements, SSIs constantly face severe
competition, both in the domestic and export market, requiring process and product
improvements, adoption of new technologies and building of newer skills.
2.3 Ban on Certain Dyes in Export Markets
The prohibition on the use of certain azo dyes is laid down in Annex XVII to the EU Regulation
(EC) 1907/2006 on the Registration, Evaluation and Authorization of Chemicals (REACH)10,
which is directly applicable in all EU Member States. Azo dyes are often used in the coloring
process of textiles and leather. Some of these dyes have the capacity to release certain
aromatic amines (such as benzidine, 4-chloroaniline, 2-naphthylamine etc.), which pose cancer
risks. For this reason, the EU has passed legislation to prevent exposure to 22 of these
hazardous substances. Therefore, azo dyes releasing the 22 specified aromatic amines can no
longer be used for textile and/or leather products which come into contact with the skin or
oral cavity. All parts of the product must comply with the limit and each present amine must
also comply with the limit by itself. Measurements of average concentrations of a certain
amine in the complete product are disallowed. Given such stringent criteria to be met, a
number of SSIs have had to either face closure or adapt by changing their product lines
accordingly. Prior to the ban, about 20%11 of all dyes used in the Indian textile industry were
azo dyes.
9 Potential for Adoption of Clean Technologies in SMEs: An Introduction. Central Pollution Control
Board. April 2011. Series: IMPACTS/16/2011-2012. 10 The very first legislation banning azo dyes was introduced in Germany in the early 1990s. 11 Beerbaum S. and Heidhaus F. Impact of Environmental Regulations on Trade Relations of Developing
Countries: A Case Study of Indian-German Textile Trade. Available at:
http://www.uclouvain.be/cps/ucl/doc/ecru/documents/TF5M5D19.pdf

Cleaner Production in the
Dyes and Dye Intermediate Industry
[15]
Moreover, indications are that such bans are likely to increase in the future. For instance, the
potential human health risks of chemicals widely used in dyes have prompted the U.S.
Environmental Protection Agency to study and potentially ban their manufacture and use. In
August 2010, the EPA released action plans that address benzidine dyes used in both
consumer and industrial applications.12
2.4 Prices of Raw Materials
The dye manufacturing chain involves four key stages of production and a rise in the input
price at any stage has a cascading effect on the price of the end product. The prices of dyes are
impacted by the rise in basic raw material costs of dye intermediates. The raw materials
account for about 50% of the cost of production in this sector. The prices of the feedstock are
dependent on the prices of crude oil, which can easily affect business adversely in this
industry. Although 90% of the raw material is available indigenously, domestic raw material
prices are at times 40-50% higher than those in the international market. For SSIs, their small
size and low purchasing power also result in higher procurement price of raw material. Once
again, lack of productivity deters efficient use of raw materials, thus adding to the burden for
SSIs.
2.5 Competition from Other Developing Countries
As explained in the earlier section, China has become the major competitor to India. In the
price war of products with China, many SSI units in India have suffered. Domestic consumers
are also shifting their choice to Chinese products due to the lower price, although these tend
to be of a lower quality compared to Indian products.
Therefore, the main obstacle faced is the undercutting of prices to compete with the
organized sector and the export market. This practice leads Indian companies for outbidding
each other instead of their rivals abroad. Again, it follows that some mechanism or strategy is
clearly needed to help improve productivity in the sector.
2.6 Low expenditure on R&D
Due to internal and external competition, and fragmentation, the margin of profits in the dyes
industries is rapidly being squeezed. The consequence is that there is low expenditure
12 Benzidine dyes are used in the production of consumer textiles, paints, printing inks, paper, and
pharmaceuticals and may pose health problems, including cancer. Source: EPA Takes Aim at Toxics in
Dyes, Flame Retardants, Detergents. Available at: http://www.ens-newswire.com/ens/aug2010/2010-
08-18-092.html

Cleaner Production in the
Dyes and Dye Intermediate Industry
[16]
incurred for R&D (about 1% in India compared to 5-10% globally).13 This leads to a vicious
cycle; with lower end technology, Indian SSIs tend to find it hard to make better and
environmentally safe products, and thus lose business to their competitors.
13 Joy Clancy and Mark Lakmakker. Improving the Environmental Performance of Small-Scale Industries
in the South: A Case Study of the Dyestuffs Industry in India. Technology and Development Group,
University of Twente, PO Box 217, 7500 AE Enschede, The Netherlands. Available at:
http://doc.utwente.nl/21606/1/Clancy98improving.pdf
Cleaner Production in the
Dyes and Dye Intermediate Industry
[17]
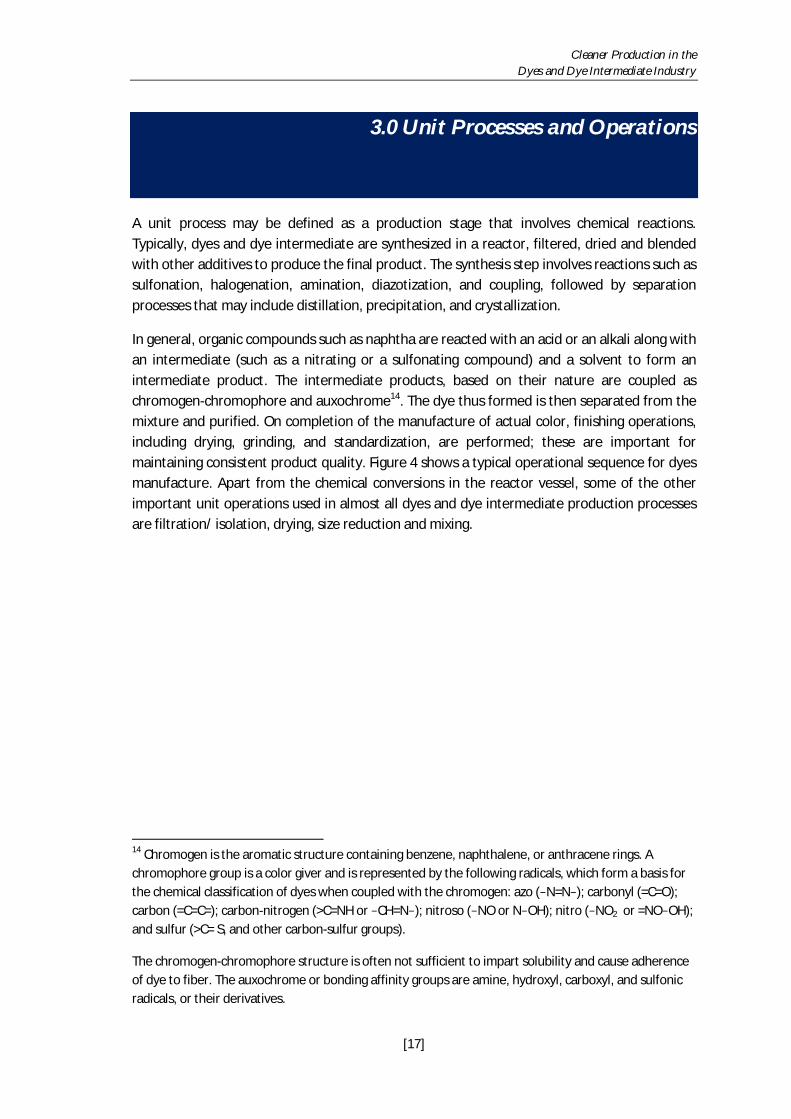
3.0 Unit Processes and Operations
A unit process may be defined as a production stage that involves chemical reactions.
Typically, dyes and dye intermediate are synthesized in a reactor, filtered, dried and blended
with other additives to produce the final product. The synthesis step involves reactions such as
sulfonation, halogenation, amination, diazotization, and coupling, followed by separation
processes that may include distillation, precipitation, and crystallization.
In general, organic compounds such as naphtha are reacted with an acid or an alkali along with
an intermediate (such as a nitrating or a sulfonating compound) and a solvent to form an
intermediate product. The intermediate products, based on their nature are coupled as
chromogen-chromophore and auxochrome14. The dye thus formed is then separated from the
mixture and purified. On completion of the manufacture of actual color, finishing operations,
including drying, grinding, and standardization, are performed; these are important for
maintaining consistent product quality. Figure 4 shows a typical operational sequence for dyes
manufacture. Apart from the chemical conversions in the reactor vessel, some of the other
important unit operations used in almost all dyes and dye intermediate production processes
are filtration/ isolation, drying, size reduction and mixing.
14 Chromogen is the aromatic structure containing benzene, naphthalene, or anthracene rings. A
chromophore group is a color giver and is represented by the following radicals, which form a basis for
the chemical classification of dyes when coupled with the chromogen: azo (‒N=N‒); carbonyl (=C=O);
carbon (=C=C=); carbon-nitrogen (>C=NH or ‒CH=N‒); nitroso (‒NO or N‒OH); nitro (‒NO2 or =NO‒OH);
and sulfur (>C= S, and other carbon-sulfur groups).
The chromogen-chromophore structure is often not sufficient to impart solubility and cause adherence
of dye to fiber. The auxochrome or bonding affinity groups are amine, hydroxyl, carboxyl, and sulfonic
radicals, or their derivatives.
Cleaner Production in the
Dyes and Dye Intermediate Industry
[18]
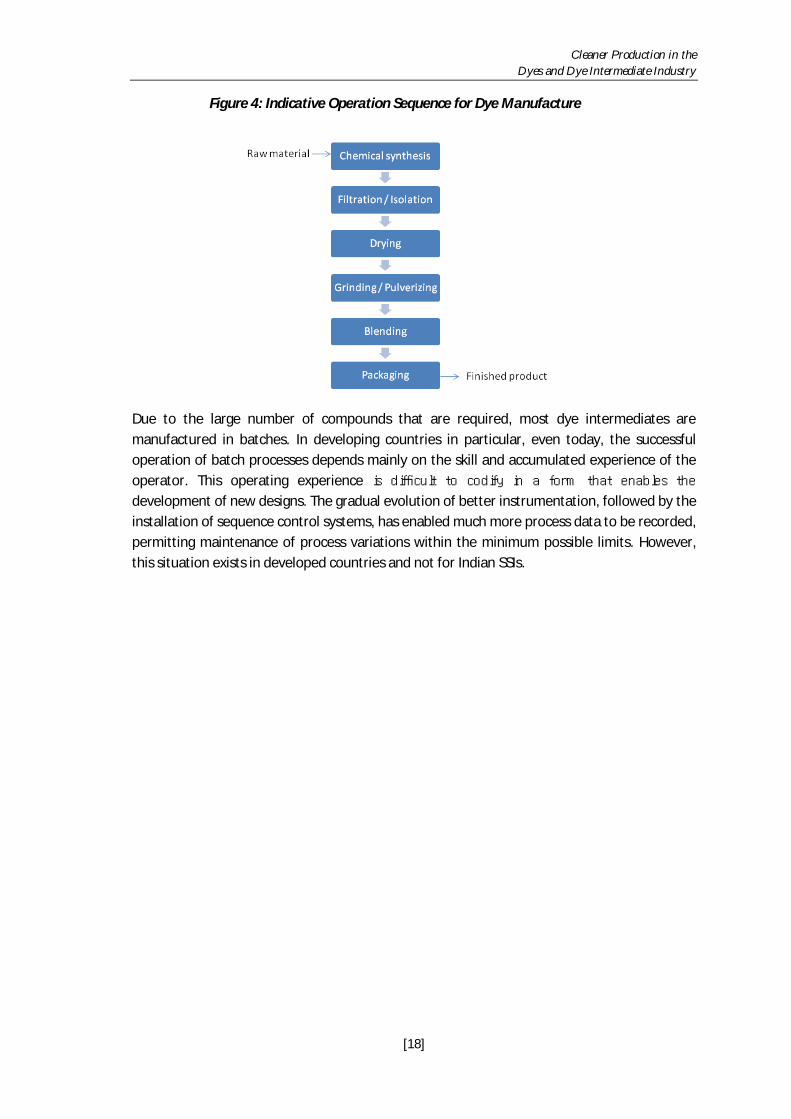
Figure 4: Indicative Operation Sequence for Dye Manufacture
Due to the large number of compounds that are required, most dye intermediates are
manufactured in batches. In developing countries in particular, even today, the successful
operation of batch processes depends mainly on the skill and accumulated experience of the
operator. This operating experience is difficult to codify in a form that enables the
development of new designs. The gradual evolution of better instrumentation, followed by the
installation of sequence control systems, has enabled much more process data to be recorded,
permitting maintenance of process variations within the minimum possible limits. However,
this situation exists in developed countries and not for Indian SSIs.
Cleaner Production in the
Dyes and Dye Intermediate Industry
[19]
4.0 Waste Generation
The dyes and dye intermediate industries sector are one of the most polluting industrial
sectors. The waste generated from this sector is highly toxic/hazardous, difficult to treat and
very large in quantum. The causes of severe pollution generation from this sector dominated
by SSIs are:
Multistage batch operations
Poor process control of the unit operations/ processes
Poor housekeeping practices
Use of obsolete technology
Poor or no recovery of by-products
Excessive use of reactants, solvents and utilities
Poor quality control
Poor maintenance and record keeping
Unskilled / untrained workers
Therefore, the pollution load generated per ton of product is very high. It has been reported
that for manufacturing of one ton of product approximately 5.5 tons of waste is generated.15
The total number of waste streams generated from the units contributing to the above
mentioned waste was 255. This did not include additional waste generation from the
treatment of wastes.
The following sub-sections give brief descriptions of the various wastes generated by the
sector. It may be noted that treatment of these wastes was seen as an impractical and
incomplete solution to the problem, mainly because of the high cost and technical difficulties
involved in the treatment16.
15 From the Forests and Environment Department, Government of Gujarat; Project on “Cluster Based
Approach for Promotion and Multiplier Effect on Cleaner Production”, where Cleaner Production was
demonstrated in 12 Dyes and Dye intermediate manufacturing units. 16 Unless mentioned otherwise, material in this section adapted from the following document:
Cleaner Production in Action - Technical Manual for the Dyes and Dye Intermediate Sector. 1st edition,
2003. Prepared by the National Productivity Council (Gandhinagar) for the Forests and Environment
Department, Government of Gujarat.

Cleaner Production in the
Dyes and Dye Intermediate Industry
[20]
4.1 Liquid Waste
The environmental problems attributed to this industry arose first after industrialization
replaced traditional natural dyes by the synthetic dyes used today. Since synthetic dyes are
designed to resist bleaching by ultraviolet light and chemicals to improve the quality of the
end product, they are also persistent in the environment and some dyes can be biologically
modified into carcinogenic compounds. The release of untreated wastewater poses a threat to
the environment and the most serious problems are ground water and surface water
pollution. Further, the discharge of colored effluents into water bodies affects the sunlight
penetration which in turn decreases both the photosynthetic activity and dissolved oxygen
levels. The removal of dyes from wastewater is one of the major environmental challenges.
Since the majority of dyes are recalcitrant to conventional biological methods the most
common techniques used today are physico-chemical in nature. However, many of these
methods suffer from limitations. They are usually not cost-efficient and most of them lead to
generation of hazardous waste that needs to be dealt with separately.17
The quantum of wastewater generated per ton of dyestuff production is very low compared to
that generated per ton of dye intermediate production. The specific wastewater generation
for major dye intermediates is about 15-20 m3/ton of product. The main sources of
wastewater generation are:
Mother liquor or filtrate streams from filtration operations
The wastewater streams from the washing of filter cake to remove either salt impurities or
residual filtrate adhere from the cake
Leakage and spillage
Floor washing of the work area
The typical characteristics of the wastewater from this sector are mentioned in the Table 1.
Table 1: Typical Characteristics of Wastewater from the Production
of Dyes and Dye Intermediates18
Parameter Value
Colour Varying deep colours
pH 4 - 6
Chemical Oxygen Demand
(COD)
50,000 - 1,00,000 mg/L
Total Dissolved Solids (TDS) 15,000 - 2,00,000 mg/L
17 Information in this paragraph adapted from Treatment of Textile Dyes Using Biological and
Physiochemical Techniques. Available at: http://www.biotek.lu.se/dyeremediation/research/. 18 Potential for Adoption of Clean Technologies in SMEs: An Introduction. Central Pollution Control
Board. April 2011. Series: IMPACTS/16/2011-2012.

Cleaner Production in the
Dyes and Dye Intermediate Industry
[21]
Parameter Value
Ratio of Biochemical
Oxygen Demand (BOD) to
COD
< 0.2
Sulfates 61,000 to 73,000 mg/L
Sodium 40,000 to 47,000 mg/L
Chlorides 16,000 to 20,000 mg/L
The effluent discharged from this industrial sector is highly acidic and contains toxic
compounds; many of them are carcinogenic and highly hazardous to human health and the
environment. This is due to the presence of benzene, naphthalene and other nitro-aromatic
based compounds in the wastewater, which are used as raw materials during the production
of dye intermediates. Due to the excess use of acid and alkali quantity, the wastewater
contains high concentration of inorganic salts that results in the high concentration of TDS.
Due to this, treatment of effluent is very difficult and highly expensive.
As per the standard prescribed by the Ministry of Environment and Forests (MoEF),19 the
effluent discharged by an industrial unit must meet the parameters given in Table 2.
Table 2: Major Parameters in the Standard for Effluents from this Industry
Parameter Standard for Effluent* (limiting concentration in
mg/L except for pH, temperature, colour and
bioassay test
pH 6.0-8.5
COD 250
BOD (3 days; 27oC) 100
Temperature Shall not exceed 5oC above the ambient
temperature of water in the receiving body
TSS 100
Colour 400 Hazen units
Mercury (as Hg) 0.01
Chromium (as Cr+6) 0.1
Total chromium (as Cr) 2.0
Copper (as Cu) 3.0
Zinc (as Zn) 5.0
Nickel (as Ni) 3.0
Lead (as Pb) 0.1
Manganese (as Mn) 2.0
Cadmium (as Cd) 2.0
Chloride (as Cl)** 1,000
19 G.S.R. 485(E), published in the Official Gazette on 9 June 2010. Available at:
http://cpcb.nic.in/Industry_Specific_Standards.php

Cleaner Production in the
Dyes and Dye Intermediate Industry
[22]
Parameter Standard for Effluent* (limiting concentration in
mg/L except for pH, temperature, colour and
bioassay test
Sulfate (as SO4)** 1,000
Phenolic compounds (as C6H5OH) 1.0
Oil and grease 10.0
Bioassay test (to be conducted as per
IS:6582-1971)
90% survival of fish after 96 hours in 100%
effluent
* Effluent shall not be stored in holding water tanks in such a manner so as to cause groundwater pollution.
** The standard for chlorides and sulfates shall be applicable only for discharge of treated effluent into
inland surface water courses. When discharged on land for irrigation, the norms for chloride shall not
exceed 600mg/L over and above the contents of raw water and the sodium absorption ratio shall not
exceed 26.
Till 1994, many of the SSIs were not treating their wastewater and discharging it directly into
nearby surface water bodies. Following a strict action by the regulatory body and due to the
intervention of High Court and Supreme Court following some of the public litigation against
these industries, industries started the treatment of wastewater. The consequent introduction
and funding of Common Effluent Treatment Plants (CETPs), research aimed at the revival of
using natural dyes, extension of modvat benefits to pollution control equipment etc., have
helped ease matters somewhat. Nevertheless, treatment of effluent from this sector
continues to be an expensive proposition for SSIs.
4.2 Solid Waste
Large quantities of solid waste are generated from the dyes industry. In fact, solid waste items
generated in the process of the production and industrial use of synthetic dyes, dye
intermediates and pigments account for 26% of the entire volume of hazardous waste sent to
Treatment, Storage and Disposal Facilities for hazardous waste in the State of Gujarat.20
Disposing off such large volumes of hazardous waste entails a huge cost to the individual SSI as
well as the industry as a whole.
The sources of waste generation are both from the process itself as well as from the treatment
of wastewater. For instance, a large quantum of gypsum sludge is generated from the primary
treatment of acidic wastewater, where lime is used for neutralization. The types of wastes
from the process include gypsum sludge, iron sludge, residues from the filter press, tarry
waste, waste dye powder and packaging material.
20 Hazardous Waste Management Project Formulation Study in Gujarat. March 2010. Engineering and
Consultation Firms Association, Japan. Available at: http://www.ecfa.or.jp/japanese/act-
pf_jka/H22/india_extoshi.pdf
Cleaner Production in the
Dyes and Dye Intermediate Industry
[23]
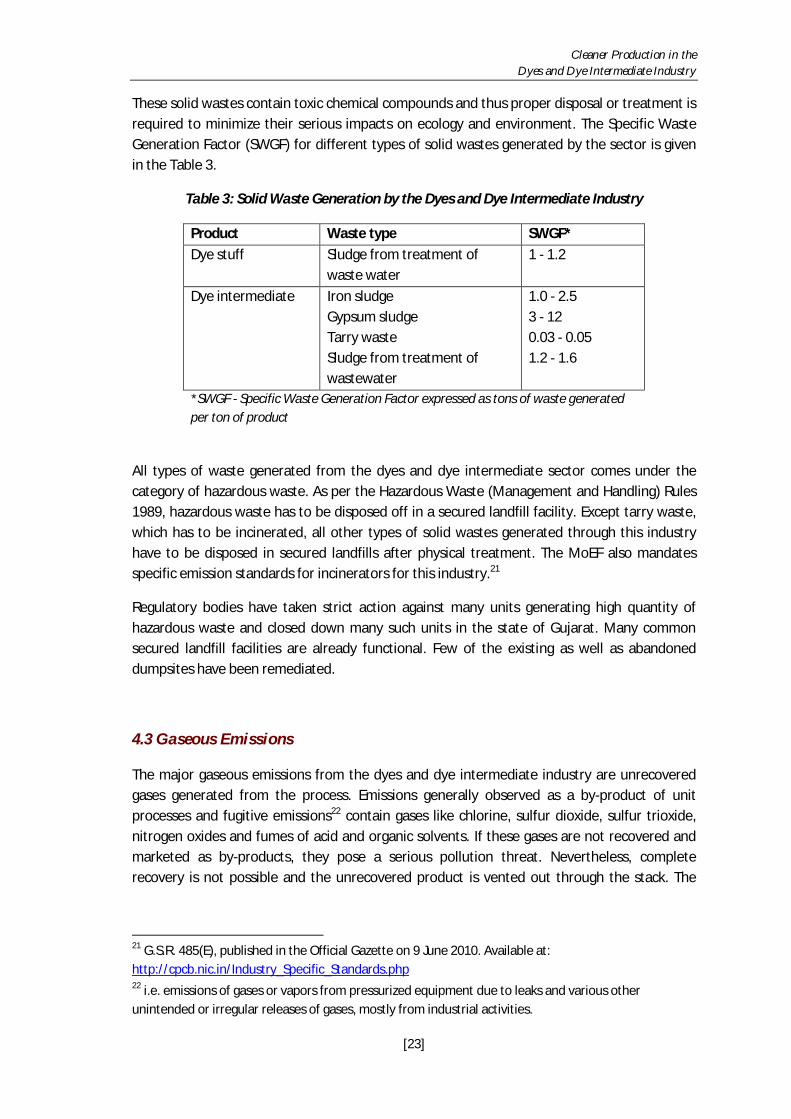
These solid wastes contain toxic chemical compounds and thus proper disposal or treatment is
required to minimize their serious impacts on ecology and environment. The Specific Waste
Generation Factor (SWGF) for different types of solid wastes generated by the sector is given
in the Table 3.
Table 3: Solid Waste Generation by the Dyes and Dye Intermediate Industry
Product Waste type SWGF*
Dye stuff Sludge from treatment of
waste water
1 - 1.2
Dye intermediate Iron sludge
Gypsum sludge
Tarry waste
Sludge from treatment of
wastewater
1.0 - 2.5
3 - 12
0.03 - 0.05
1.2 - 1.6
*SWGF - Specific Waste Generation Factor expressed as tons of waste generated
per ton of product
All types of waste generated from the dyes and dye intermediate sector comes under the
category of hazardous waste. As per the Hazardous Waste (Management and Handling) Rules
1989, hazardous waste has to be disposed off in a secured landfill facility. Except tarry waste,
which has to be incinerated, all other types of solid wastes generated through this industry
have to be disposed in secured landfills after physical treatment. The MoEF also mandates
specific emission standards for incinerators for this industry.21
Regulatory bodies have taken strict action against many units generating high quantity of
hazardous waste and closed down many such units in the state of Gujarat. Many common
secured landfill facilities are already functional. Few of the existing as well as abandoned
dumpsites have been remediated.
4.3 Gaseous Emissions
The major gaseous emissions from the dyes and dye intermediate industry are unrecovered
gases generated from the process. Emissions generally observed as a by-product of unit
processes and fugitive emissions22 contain gases like chlorine, sulfur dioxide, sulfur trioxide,
nitrogen oxides and fumes of acid and organic solvents. If these gases are not recovered and
marketed as by-products, they pose a serious pollution threat. Nevertheless, complete
recovery is not possible and the unrecovered product is vented out through the stack. The
21 G.S.R. 485(E), published in the Official Gazette on 9 June 2010. Available at:
http://cpcb.nic.in/Industry_Specific_Standards.php 22 i.e. emissions of gases or vapors from pressurized equipment due to leaks and various other
unintended or irregular releases of gases, mostly from industrial activities.

Cleaner Production in the
Dyes and Dye Intermediate Industry
[24]
other source of air pollution from this sector is the particulate matter emission from the drying
and grinding operations. Flue gas from boilers is also a source of air pollution.
Emission standards exist for most types of gases; e.g. 50 mg/L for hydrogen chloride or HCl
gas.23 Most of the SSIs in the sector, however, are unable to meet these standards, for
emissions from source as well as fugitive emissions.
The previous Sections point to a critical need to develop practical, cost-effective and
sustainable solutions to address both environmental and productivity concerns of the SSIs in
this sector. The concept of Cleaner Production presents such a strategy. The following Section
will expand on this concept.
23 G.S.R. 485(E), published in the Official Gazette on 9 June 2010. Available at:
http://cpcb.nic.in/Industry-Specific-Standards/Effluent/Dye&DyeIntermediateIndustry.pdf

Cleaner Production in the
Dyes and Dye Intermediate Industry
[25]
5.0 The Concept of Cleaner Production
Conventional approaches to industrial pollution management tend to focus on end-of-pipe
treatment of wastes. There is no attempt to reduce waste streams at the source and / or
undertake resource recovery. However, this kind of approach leads to wastage of resources,
associated costs of managing the pollution generated, environmental concerns, and poor
worker health and safety.
Instead, the concept of Cleaner Production provides a better solution. According to the
assessment carried out by Gujarat Dyestuff Manufacturer’s Association (GDMA), the capital
cost of only effluent treatment comes to 8-10% of the total investment of the unit and
recurring cost towards effluent treatment comes to around 5-6% of the sales price. The
reduction of waste at source through Cleaner Production can be the only solution productive
for this problem.
Cleaner Production is a preventive business strategy designed to conserve resources, mitigate
risks to humans and the environment, and promote greater overall efficiency through
improved production techniques and technologies.
In addition to environmental, health and safety benefits, many Cleaner Production techniques
provide opportunities to substantially reduce operating costs and improve product quality.
SSIs can profit from cleaner production through more efficient use of inputs and machinery,
higher quality, and reduced waste disposal costs. Improved safety measures can also help SSIs
avoid costly accidents and worker absences.
Experience has demonstrated that, with assistance, SSIs can frequently identify Cleaner
Production opportunities that produce a positive financial return, sometimes with little or no
investment. Many enterprises that change to Cleaner Production methods may realize
substantial financial and environmental benefits, indicating that Cleaner Production should be
the first option considered in addressing SSIs environmental problems.24
Application of the concept assists regulators in developing proactive strategies for
complementing enforcement, or command and control. It is a 'win-win-win' strategy
protecting the environment, the health and safety of consumers and workers while improving
efficiency, profitability, and competitiveness.
24 However, Cleaner Production options with clear financial benefits may not always be equally available
to all businesses. Further, such options may not completely mitigate environmental problems. In some
cases, improving environmental performance may require businesses to use methods or approaches
that offer no measurable financial return. Businesses typically undertake such measures if required by
law or as part of a commitment to the community.

Cleaner Production in the
Dyes and Dye Intermediate Industry
[26]
Cleaner Production makes sound business sense to industries and service providers as it often
results in cost reduction, improved productivity and enhanced competitiveness of wider
markets.
Cleaner Production is also known by other names such as Pollution Prevention, Waste
Minimization and Green Productivity, but for all intents and purposes, these terms mean one
and the same thing.
It is also important to remember that the term “Cleaner Production” is not the same as the
term “pollution control”. This is because Cleaner Production entails restricting the generation
of waste in the first place (i.e. at the source). In contrast, pollution control concentrates on
dealing with the treatment and disposal of waste which has already been generated. So, by
practicing Cleaner Production, the facility will automatically generate less waste to be treated.
5.1 Benefits of Cleaner Production
The benefits of Cleaner Production are many.
1. Conservation of raw material and energy: Given the increasing cost of raw materials and
the growing scarcity of good quality of water, no industry can afford to use these
resources inefficiently. Cleaner Production measures help in overcoming constraints
posed by scarce, or increasingly costly, raw materials, chemicals, water and energy.
2. Lower costs: The ultimate goal of Cleaner Production is to minimize the generation of
emissions and waste. In doing so, the amount of waste and emissions that need to be
treated is reduced, as are associated costs.
3. Improved environment: Cleaner Production minimizes not just the amount but also the
toxicity of waste generated. This leads to a decrease in the pollution load thus leading to a
cleaner environment.
4. Better compliance with environmental regulations: by minimizing waste generation,
Cleaner Production makes it easier for an industrial unit to meet existing environmental
regulations and standards, which may not have been the case prior to adopting Cleaner
Production.
5. Enhanced working environment: Cleaner Production not only improves the environment
outside the industry but also improves it on the factory floor itself. It reduces the
likelihood of accidents at the work place and increases worker productivity.
6. Improved quality: Through its focus on the process, Cleaner Production can lead to
improvements in the quality of the product, which in turn leads to better market share or
improved profitability.
Cleaner Production in the
Dyes and Dye Intermediate Industry
[27]
7. Improved efficiency: Cleaner Production leads to better efficiency of production, which
means more output of product per unit input of raw materials. An improvement in
efficiency also leads to better financial performance for the industrial unit.
8. Market requirements: Increasing consumer awareness about environmental issues has
brought about a need for the companies to demonstrate the environmental friendliness of
their products and manufacturing processes, particularly in international markets. By
adopting the Cleaner Production approach, many of these market requirements can be
met and a company’s ability to compete and get access such markets increases.
9. Public image: The environmental profile of a company is an increasingly important part of
its overall reputation, particularly in this day and age when the common man is aware
about issues pertaining to the environment. Adopting Cleaner Production helps the
concerned company build confidence with the public regarding its environmental
responsibility.
Given the convergence of Cleaner Production benefits listed here and the issues SSIs typically
face, it follows that this sector would find it worthwhile to explore Cleaner Production.
5.2 How to Undertake Cleaner Production: An Introduction to Cleaner
Production Assessments
Exploring the various possible benefits of Cleaner Production is done through what is known as
the Cleaner Production Assessment (CPA). The CPA consists of a systematic and an objective
review of manufacturing processes, products and services. It is designed to identify Cleaner
Production opportunities for increasing productivity, profitability and sustainability of the
enterprise, while reducing its environmental impacts and associated risks.
This approach has been tried and tested with excellent results at numerous units and across
various sectors. The six-step CPA methodology keeping in mind the industrial culture, type of
technology and technical constraints at SSIs has been successfully used in India.
Following section gives a brief introduction to how CPAs should be conducted. For additional
details on the approach, readers may contact the Gujarat Cleaner Production Centre (GCPC).
Documents explaining detailed step-by-step approach for conducting CPA may be requested
from GCPC25.
The approach consists of six steps with each sub-divided into a number of tasks, as seen in
Figure 5.
25 To know more about the Gujarat Cleaner Production Centre visit http://www.gcpcgujarat.org.in/

Cleaner Production in the
Dyes and Dye Intermediate Industry
[28]
Figure 5: The CPA Approach
The predominant aspect of the methodology is the examination and re-evaluation of the
production process. The activity starts with the basic aspect of team formation, followed by a
process study, material balance, stoichiometric calculations, and waste and energy audits to
establish and characterize the sources as well as quantities of wastes generated. Investigating
the factors that influence the volume and composition of the generated waste and emissions
is also required.
Step 3 of the above Figure is concerned with the generation of “Cleaner Production
opportunities”. What are these? These are the various possible ways to derive Cleaner
Production benefits and are driven by “Cleaner Production techniques”. The following section
of this Manual focuses on the types of Cleaner Production techniques and will provide
examples for each within the context of the dyes and dye intermediate sector.
Lastly, as with other investments or technological innovation options, the implemented
Cleaner Production measures should be taken up for performance evaluation, to ensure they
perform as intended.

Cleaner Production in the
Dyes and Dye Intermediate Industry
[29]
6.0 Cleaner Production Techniques
Cleaner Production may be achieved by adopting one technique or a combination of various
techniques, as seen in Figure 6 and explained in detail in this section. In general, the
techniques entail (a) waste reduction at source, (b) recycling, (c) product modification and (d)
energy conservation.
Figure 6: Cleaner Production Techniques
Studies in some SSI units have indicated that there is a good scope for minimizing the waste
generated from such plants using Cleaner Production techniques. For a typical dye
manufacturing unit, the indicated average saving potential is Rs. 10 million per annum. Most
of the process steps can be redesigned with a strong emphasis on pollution prevention.
Tapping of this potential does not require much investment. In fact, significant monetary as
well as environmental benefits can be achieved with minimal financial inputs. In many of the
Cleaner Production projects implemented in this sector, it has been found that the overall
payback period for the implementation of such techniques is about 4-14 months. In addition,
most of the time, the Cleaner Production techniques improve the cost economic viability of
installing and operating end of pipe pollution control systems, since they entail a reduction in
pollution load.
A description of these techniques and real-life examples of their implementation are provided
below. Some of these examples have been sourced from the various demonstration projects
carried out under the support from Forests & Environment Department, Government of

Cleaner Production in the
Dyes and Dye Intermediate Industry
[30]
Gujarat. The rest have been contributed by industries which have implemented Cleaner
Production.
Note that the figures for costs and returns highlighted in each example date back to the time
the Cleaner Production Assessments (CPAs) were conducted, and that these may not
necessarily reflect the conditions on the ground today. Nevertheless, these examples still
serve to highlight the many opportunities industries can explore through Cleaner Production.
6.1 Waste Reduction at Source
As the name suggests, reducing waste at the source itself is one of the basic tenets of Cleaner
Production. This may be achieved through good housekeeping and process rationalization /
optimization.
6.1.1 Good Housekeeping
Good housekeeping entails improvements to work practices and methods, and proper
maintenance of equipment. These actions alone can produce significant benefits in terms of
saving resources. Housekeeping related techniques are low cost and provide low-to-moderate
benefits. Examples include training for proper material handling, minimizing materials loss
(e.g. stopping leakages), storage of materials in compatible groups, implementing a predictive
and preventive maintenance system, using energy efficient devices, etc.
Typically, the following elements are covered under this technique.
Procedural measures
Changes in routine but faulty operating practices
Maximization of batch size to reduce cleaning waste
Dedication of equipment to a single product
Optimization of raw material usage
Prevention of fugitive emissions,
spillages and leakages
Training for detecting and minimizing material loss
Provisions for prevention of fugitive emissions, spillages and leakages
Spilled material management system
Reward schemes for attitudinal development of shop floor personnel
Waste stream segregation
Preventing mixing of hazardous and non-hazardous wastes
Storage of materials in compatible groups
Segregation of different spent solvents
Isolation of liquid wastes from solid wastes
Improvements in material
handling
Training to employees for proper material handling practices
Providing appropriate tools for material handling

Cleaner Production in the
Dyes and Dye Intermediate Industry
[31]
Given below are some examples of good housekeeping which have been recorded in the dyes
and dye intermediate industry.
Examples of employing the “Good housekeeping” technique:
1. Avoidance of the excess addition of Litharge (Lead Oxide) to compensate for the
incomplete emptying of bags of the raw material and thus losing raw material by
introducing a system for complete emptying of litharge from bags, has led to a savings of
Rs. 38,000 per annum, with no investment.
2. Taking extra care in handling the product while drying and thus avoidance of losses due to
spillages and fugitive emissions has led to the net saving of Rs. 48,240 per annum with no
initial investment for a company manufacturing Ortho Chloro Para Nitro Aniline (OCPNA).
3. A benzene pump (with gland packing) dripping in a dye-intermediate manufacturing
company led to an annual loss of 2,000 litres of intermediate product equivalent to Rs.
36,000. The change to mechanical seals with an investment of Rs. 20,000 stopped the
leakage and also improved the working environment.
6.1.2 Process Rationalization / Optimization
Process rationalization / optimization involves slight reworking of the process sequence (for
example the elimination of a redundant washing sequence), combining or modifying process
operations to save on resources and time, and improve the process efficiency. In some cases,
the changes may best be produced by piloting or demonstrating on a small scale. These
techniques are typically low-to-medium cost and provide moderate-to-high benefits.
Process rationalization in turn could happen in a number of ways ‒ better process control,
equipment modification, raw material changes, and changes to technology (including
technology upgradation). Given below are some examples of process rationalization /
optimization which have been recorded in the dyes and dye intermediate industry.
6.1.2.1 Better Process Control
Better process control aims at increasing the efficiency of existing processes and at the same
time, reducing waste and emission generation. The following elements are covered under this
technique:

Cleaner Production in the
Dyes and Dye Intermediate Industry
[32]
Changes in operational settings
Changing reaction parameters and controlling the process
Establishing and maintaining end points for chemical and physical operations
Improving maintenance and
equipment reliability
Maintaining equipment history cards
Maintaining a preventive maintenance schedule
Installing indicators and controllers to maintain process conditions as close as possible to the desired values
Examples of employing the “Better process control” technique:
1. Before implementation of the technique, about 18 kg of Di-Ethyl Meta Amino Phenol
(DEMAP) was added to the vessel to begin with, followed by the addition of the entire
quantity of Phthalic Anhydride in different lots, to manufacture Rhodomine. The balance
amount of the DEMAP was to be added once the addition of Phthalic Anhydride was
complete. This would result in large quantities of Phthalic Anhydride wastage due to
sublimation. After implementation of the technique, the method was modified so as to
add both raw materials alternately to enable a better chemical reaction, yielding more
condensed mass. This modification led to an annual savings of Rs. 2,28,480. This involved
the investment of a mere Rs. 3,000 and an operational cost of Rs. 3,580. This also reduced
the cost of energy spent on heating, as the reaction is exothermic. The shop floor
environment improved by virtue of this solution. Moreover, this also reduced the cost of
energy on heating, as the reaction is exothermic. This technique also resulted in a direct
decrease in the specific consumption of Phthalic Anhydride (since losses by sublimation
reduced).
2. Recalibrating the overflow quantity of Dichloronitrobenzene (DCNB) and optimizing the
batch size of Ortho Chloro Para Nitro Aniline (OCPNA) in an OCPNA manufacturing unit,
led to a net annual savings of Rs. 3,15,000. The SWGF reduced from 12.7 to 11.4 litres/kg
of OCPNA.
3. Optimizing the quantity of the wash water to be added to the reaction vessel for Meta
Nitro Aniline (MNA) manufacturing led to a saving of Rs. 1,350 per annum. While the cost
savings were minimal, the quantity of wastewater reduced significantly - by 500 litres per
batch; i.e. 12,500 litres per month.
4. In a Vinyl Sulfone manufacturing unit, the quantity of water for stripping was optimized in
order to increase the recovery of Hydrochloric Acid. This was possible at an operating cost
of Rs. 43,000 and led to an impressive economic benefit of Rs. 1,44,200 per annum.

Cleaner Production in the
Dyes and Dye Intermediate Industry
[33]
6.1.2.2 Equipment Modification
As the name suggests, modification of equipment can also serve as a Cleaner Production
technique. These techniques are typically low to medium cost and can provide moderate to
high benefits. The following elements are covered under this technique:
Equipment improvement Replacing of equipment
Redesigning and retrofitting of equipments
Layout changes Rearranging equipment for better material movement
Given below are some examples of equipment modification which have been recorded in the
dyes and dye intermediate industry.
Examples of employing the “Equipment modification” technique:
1. In an OCPNA manufacturing unit, it was found that positive pressure in a section of the
dryer (used to dry the product) near the feed hopper caused spillage to occur. Trials were
taken after stopping the forced draft fan and varying the feed rate. The feed rate could
now be increased from 125 kg/hr to 180 kg/hr. The problems of fugitive emissions and
spillage also reduced drastically since the forced draft fan was stopped. The cycle time of
drying reduced from 8 to 6 hours. This modification to the spin flash drier led to savings of
Rs. 3,47,400 by virtue of reduction in electricity consumed as well in down time.
2. Modifying the design of the siphoned pipe in the reaction vessel in MNA manufacture to
reduce the quantity of decanted liquor with an investment of Rs. 40,000 led to a savings of
Rs. 3,12,000 per annum. Additionally, the organic pollutant load equivalent to 8 kg of
product per batch was reduced.
3. Changing the Nutsche Filter cloth with a finer mesh size by investing just Rs. 4,000 led to
saving of Rs. 37,252 per annum in a Rhodamine manufacturing unit. This measure also
reduced the TSS and COD load of the effluent.
6.1.2.3 Raw Material Changes
Raw materials may be changed if better options exist in terms of costs, process efficiency, and
reduced health and safety related hazards. Such an approach may be necessary if the
materials already in use are difficult to source, have become expensive, or have come under
the purview of new environmental regulations. Before adopting raw material changes, it is
essential to assess results through laboratory / bench-scale studies and pilots to ensure that
the product quality is not changed and is acceptable to the market. Given below are some
examples of raw material changes which have been recorded in the dyes and dye intermediate
industry.
Cleaner Production in the
Dyes and Dye Intermediate Industry
[34]
Examples of employing the “Raw material changes” technique
1. Organic acid was used for isolation of N-Methyl J Acid (NMJ) after purification, the only
criteria for isolation being the maintenance of the pH. Substituting the use of inorganic
acid instead of organic acid in the final isolation of the dye intermediate product led to an
annual savings of Rs. 43,37,328. The highlight of this solution was the reduction of organic
effluent load of the stream by 50%. However, it was observed that that the pH needed to
be very carefully monitored during the addition of inorganic acid as even slight excess
could lead to off-specification products and rejection. The change was implemented on
the shop floor only after laboratory trials proved successful.
2. Use of purer grade Napthalene and Iron Powder with higher activity was used by a
company manufacturing Sodium Naphthionate. Although the changed raw materials cost
more than the materials they replaced, the technique led to savings of Rs. 3,40,000 with
an operational cost Rs. 1,56,000 mainly on account of the better conversion rates. An
added advantage was the reduction of organics by 50% in the sludge.
3. In the manufacture of Fast Bordeaux GP Base, raw material substitution of Acetic
Anhydride with Acetic Acid in the acetylation step reduced effluent generation from 76 kL
to nil.26
4. During sulfonation, replacing Sulfuric Acid with Sulfur Trioxide helps to reduce the volume
of acidic effluent generated during this process step. For continuous processes (which are
generally not applicable to SSIs), sulfonation can be achieved through the Air/ Sulfur
Trioxide reaction. This is a direct process in which Sulfur Trioxide gas is diluted with dry air
and reacted with organic feedstock. However, this reaction is complicated by the
possibility of side reactions and therefore tight process control is a must.
6.1.2.4 Technology Modification
Modifying a technology or upgrading to a new technology can often reduce consumption,
minimize wastes as well as increase the throughput of productivity. However, the uptake of
such initiatives is largely dependent on the circumstances of each SSI unit.
Given below are some measures of technology modification / upgradation possible in the dyes
and dye intermediate industry.
1. Spray drying of mono-azo dyes instead of salting out, so as to totally eliminate liquid
effluent and loading on the Effluent Treatment Plant (ETP).
2. Iron Powder and Hydrochloric Acid are used in the reduction process, resulting in the
generation of a large volume of iron sludge (e.g. 3-3.5 tons per ton of H-Acid). Instead,
catalytic hydrogenation (using gaseous hydrogen on the active surface of a metallic
26 Complete details for this case study may be accessed from Cleaner Production Assessment of Fast
Bordeaux GP Base, available at www.hindawi.com/journals/oci/2011/752191/
Cleaner Production in the
Dyes and Dye Intermediate Industry
[35]
catalyst) in the place of iron-acid reduction, can totally eliminate the generation of iron
sludge.
3. Use of Agitated Nutsche Filter27 (as opposed to a conventional Nutsche Filter); the agitated
filter is a closed vessel designed to separate solid and liquid by filtration under pressure
and vacuum. Safety requirements and environmental concerns due to solvents
evaporation led to development of this type of filter wherein filtration under vacuum or
pressure can be carried out in closed vessels and solids can be discharged straightaway
into drier. It offers an economical operation whereby maximum percentage of liquid in the
slurry can be separated through mechanical means.
The technology modification / upgradation technique may be capital intensive in some cases,
but can lead to potentially high benefits. Due to the initial (i.e. capital) expense incurred,
technology upgrades have been cited as an unfulfilled need for the dyes and dye intermediate
sector, particularly for SSIs. In the recent past, the industry has requested the government to
allot a special fund for setting up an R&D center. It also wants the government to provide
incentives on expenditure incurred on technology upgradation on lines of similar schemes
available to the textile industry.28
Furthermore, most commercial financial institutions are not aware of Cleaner Production and
are not always willing to finance cost-intensive Cleaner Production measures such as
technology upgradation due to longer payback periods. Even in cases where financing is
available, interest rates tend to be high (in the range of 15-20 per cent), making major Cleaner
Production investments using this technique a challenge. Without adequate aid and
incentives, technology upgradation is likely to be difficult to undertake, especially for SSIs.
Section 8.0 of this Manual offers important guidance on financing Cleaner Production
techniques at SSIs.
6.1.3 Recovery and Recycling
The recovery and recycling technique entails material recovery followed by on-site recycling,
and the recovery of by-products. The effectiveness of this technique depends on the
segregation of the recoverable waste from other process wastes. This technique is typically
low to medium cost and can provide moderate to high benefits.
27 (About the) Agitated Nutsche Filter. Available at:
http://en.wikipedia.org/wiki/Agitated_Nutsche_Filter 28 Dyes and Pigments: Technology Upgradation is Need of the Hour. Available at:
http://www.indiabulls.com/securities/market/Useful_Information/budget/budget11-
12/BudgetHeiglights.aspx?strTitle=Dyes%20^%20Pigments:%20Technology%20upgradation%20is%20ne
ed%20of%20the%20hour
Cleaner Production in the
Dyes and Dye Intermediate Industry
[36]
6.1.3.1 Material Recovery
It is possible that some waste streams or constituents thereof can be reused directly as raw
material in the original production process, or substituted without reprocessing into another
process. A number of physical and chemical techniques are available for such recovery. Most
recovery systems generate some type of residue, and the management and associated costs of
these residues in turn determine the feasibility of material recovery in many cases. Wash
water waste streams and solvents can be considered for possible recovery opportunities.
Given below are some examples recorded in the dyes and dye intermediate industry which
lead to material recovery.
Examples of employing the “Material recovery” technique:
1. In an OCPNA manufacturing unit, the collection, cooling and re-filtration of wash liquor to
recover product lost as filter loss, led to a net saving of Rs. 97,200 per annum with an
initial investment of just Rs. 18,000.
2. Collection and reuse of non-contaminated condensate as feed water for the boiler was
done through an investment of Rs. 35,000. Although this entailed an operational cost of
Rs. 6,700, it helped the NMJ manufacturing unit to save Rs. 56,000 and also contributing to
the reduction in generation of waste water by 200 lit./day
6.1.3.2 Recovery of By-products
In this industry in particular, by-products recovery from waste generated is a possibility worth
exploring. Recovered by-products may have useful applications within the industry itself or
outside it. Such recovered material not only leads to a minimization of waste but cost savings
as well.
Given below are some examples of recovery and recycling which have been recorded in the
dyes and dye intermediate industry.
Examples of employing the “Recovery of by-products” technique:
1. The recovery of Sulfanilic Acid by concentration and cooling of mother liquor stream of
Acetyl Sulfonyl Chloride (ASC) led to a net savings of Rs. 17,60,000 per annum against an
investment of Rs. 12,12,000 and an operational cost of Rs. 3,40,000.
2. In the manufacture of Fast Bordeaux GP Base (2-nitro-p-anisidine), recovery and recycling
operation in nitration and hydrolysis steps not only harvested the by-products of spent
acid (in nitration) and sodium acetate (in hydrolysis) but also eliminated effluent
generation in the process step. The sale of by-products helped the firm increase its profits.
The proposed production process further eliminated the requirement of effluent
Cleaner Production in the
Dyes and Dye Intermediate Industry
[37]
treatment of neutralization step due to the decrease in pollutant amount in effluent. It
also increased the yield from 90 to 95%.29
3. The gypsum sludge generated after neutralization can be washed effectively to minimize
retained organics, and then sold to cement manufacturers.
4. Studies have shown that during the manufacture of Anthraquinone-1-Sulfonic Acid Sodium
Salt, approximately 180 kg of Aluminum Hydroxide per ton of product can be recovered
through hydrolysis and filtration. The precipitated Aluminum Hydroxide sludge can be
further purified through iron exchange and recrystallization, and then sold to the
pharmaceutical industry.
5. Medium- to large-scale manufacturers of Gamma Acid have been known to recover the
Sulfur Dioxide liberated in the isolation step through scrubbing with Sodium Hydroxide (to
get Sodium Bisulfite). The recovered product can be used in the plant or sold to other dyes
and dye intermediate manufacturers.
6. Some studies have focused on the possibility of purifying Aluminum Hydroxide generated
during pigment manufacture and selling it to pharmaceutical companies. If the hydroxide
can be purified sufficiently (in terms of colour and impurities), it is estimated that about
one ton of Aluminum Hydroxide may be recovered per ton of product.
7. In the manufacture of Disperse Blue 165, the possibility of recovering Copper from the
Copper-Ammonium complex is being explored. Research is also ongoing on the possibility
of recovering Dibenzanthronyl from wet cake by extraction during the manufacture of
Dark Blue VO.
6.1.4 Product Modification
Modifying a product can cause impacts on both the “upstream” as well as “downstream” side
of the product life cycle. Product re-design can, for instance, reduce the quantity or toxicity of
materials in a product, or reduce the use of energy, water and other materials during use, or
reduce packaging requirements, or increase the "recyclability" of used components. This can
lead to benefits such as reduced consumption of natural resources, increased productivity,
and reduced environmental risks. Often, this helps in both establishing as well as widening the
market. At times, product modification may include modifying the packaging as well.
Product modification is however a major business strategy and may require feasibility studies
and market surveys, especially if the supply-chain around the product is already established
29 Complete details for this case study may be accessed in the Resources Section of this Manual; see the
entry Cleaner Production Assessment of Fast Bordeaux GP Base.
Cleaner Production in the
Dyes and Dye Intermediate Industry
[38]
and is complex. An example where such a technique could be implemented is changing the
composition of paper to enable an FSC certification.30
A common example of this technique in the dyes manufacturing industry is the use of bi-
functional reactive dyes instead of mono-functional reactive dyes. Mono-functional dyes (e.g.
Dichlortriazine, Vinyl Sulfone, Vinyl Amide, etc.) consist of one chromophore and one
functional group that binds the dyestuff to the fiber. These dyestuffs suffer from a low degree
of fixation thus leading to poor colour yields and fastness in the product, as well as more
dyestuff being lost to the process effluent. To overcome these problems, dyestuffs containing
two groups (1-Monochlorotriazin and 1-Vinyl Sulfone) were created. Such dyestuffs are known
as bi-functional dyestuffs. Some of these were specially manufactured to be more tolerant to
temperature deviations. Other bi-functional dyes were created to provide improved fastness
(and hence a better quality product).31 Today, research in this sector has progressed to the
manufacture of tri-functional dyes. However, these changes were not immediate and came
about over a span of many years.
6.1.5 Energy Conservation
This technique is an integral and yet often overlooked part of Cleaner Production. Industries
are major consumers of energy ‒ thermal as well as electrical. With the rising costs of fuel (and
therefore energy), it has become imperative to consider energy conservation as one way to
help industry reduce processing costs. Moreover, with the added benefit of green house gas
emission reductions and subsequent monetization of the same, industries would be well-
advised to consider this technique as part of their CPA. In the dyes and dye intermediate
industry however, energy consumption plays a minor part as compared to raw material
wastage and waste generation. Nevertheless, the examples given below do provide some idea
of how this technique may be put into practice.
Examples of employing the “Energy conservation” technique:
1. After load measurements, it was found that the centrifuge motor with 7.5 HP rating could
be replaced with a 5 HP motor. The power saving due to this solution was to the tune of
Rs. 25,500 per annum.
2. A slight modification to the preheating system for Hitherm fluid in the thermic fluid heater
in a OCPNA manufacturing unit led to a savings of 1,51,200 units of electrical energy. This
was possible with an investment of Rs. 30,000 only.
3. Hot air is used for drying DCPNA in a drier. The air was heated up to 110oC and the return
temperature after passing over the mass was 60 to 85oC, depending on the moisture
content. Thirty percent of the air was purged to avoid moisture content build up and the
30 The Forest Stewardship Council (FSC) is an international non-profit organization founded in 1993 to
support the world's forests. The FSC label can be found on a wide range of timber and non-timber
products from paper and furniture to medicine and jewelry. 31 Reactive Dyes. Available at: http://www.chemeurope.com/en/encyclopedia/Reactive_dye.html

Cleaner Production in the
Dyes and Dye Intermediate Industry
[39]
remaining 70% was re-circulated during the entire drying period of about 24 hours.
Monitoring the moisture content showed that it was possible to reduce the air purging to
as low as 10% after 8 to 10 hours. This is because the majority of the moisture content of
the mass was removed during the first 8-10 hours of drying. Implementation of this
solution allowed fuel consumption to reduce substantially.
Cleaner Production in the
Dyes and Dye Intermediate Industry
[40]
7.0 Best Practices in Unit Operations and Processes
Section 4.0 of this Manual noted that the production process in this sector generates a large
quantity of wastes in the form of solid, liquid and gaseous emissions. While carrying out
studies in the sector, it has been observed that there are some waste streams which can be
avoided, particularly those arising from non-process activities or operations. If these activities
and operations are conducted using specific procedures or “best practices”, the generation of
wastes from these operations can be eliminated or reduced to a significant extent. This section
will provide a short briefing on such possibilities. It may be noted that most of these practices
do not involve a cost but can nevertheless bring about big benefits to the business. Figure 7
provides a brief of best practices in unit operations in the dyes and dye intermediate
manufacturing industry.
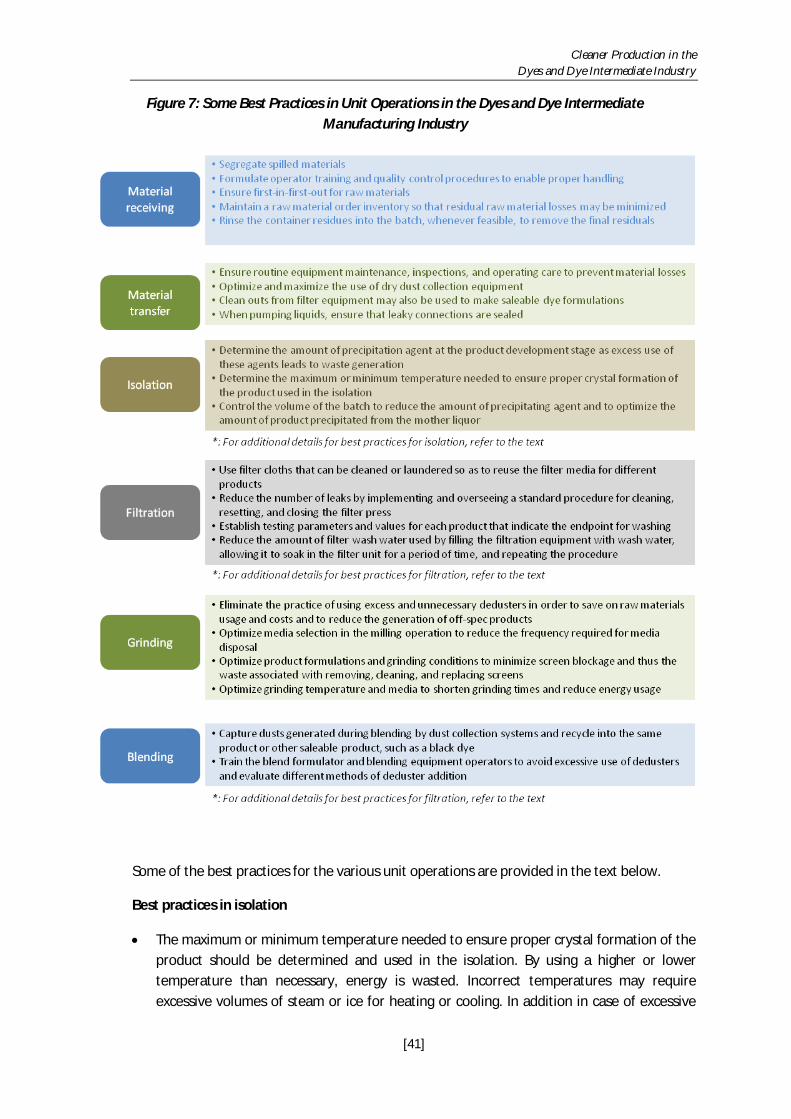
Cleaner Production in the
Dyes and Dye Intermediate Industry
[41]
Figure 7: Some Best Practices in Unit Operations in the Dyes and Dye Intermediate
Manufacturing Industry
Some of the best practices for the various unit operations are provided in the text below.
Best practices in isolation
The maximum or minimum temperature needed to ensure proper crystal formation of the
product should be determined and used in the isolation. By using a higher or lower
temperature than necessary, energy is wasted. Incorrect temperatures may require
excessive volumes of steam or ice for heating or cooling. In addition in case of excessive

Cleaner Production in the
Dyes and Dye Intermediate Industry
[42]
heating, the product frequently becomes more soluble and requires additional
precipitating agent. The operating instructions should indicate whether the elevated
temperature after crystal formation needs to be maintained for filtration or if the product
can be allowed to cool as it is filtered. Significant amount of energy can be saved by
allowing the product cooling while filtration. In addition, one can reduce the possibility of
the product resolubilizing. Such controls can be achieved by using instrumentation to
control batch temperature. The savings are reflected both in terms of better product yield
as well as energy savings.
The amount of precipitating agent required can be reduced and the amount of product
precipitated from the mother liquor can be optimized by controlling the volume of the
batch. Volume control is accomplished by batch concentration, the use of indirect heat
sources, such as coils or jackets, and the use of temperature control equipment. Indirect
heat sources may result in reduced energy efficiency, which needs to be balanced against
optimum batch volumes. The added benefit is of improved product yield.
Best practices in filtration
In filter press, the press design should allow all filtrations (even closed delivery) to be
checked for filtrate leakage from the individual chambers. By detecting leakage in filter
chambers individually, corrective actions to prevent product loss throughout the filtration.
This will enable to ascertain the source of the leak so that punctures in the filtration media
can be repaired.
Reduction of wastewater pollution load may be accomplished by starting each filtration
with recycle of mother liquor until clarity is established. This reduces the product loss as
well resulting in improved yield.
Establishing test parameters and values for each product that indicate the endpoint for
washing is another practice which can be easily incoporated. This will allow operators to
determine whether an amount of filter washing is excessive or insufficient. The
parameters may be as simple as conductivity when salts are removed or pH when acids
are removed and it can be as complicated as spectrophotometric curves or thin-layer
chromatography when an impurity is removed. It may even be possible to test individual
press spigots and close them to washing when they meet the necessary parameters
values. For example, when a cake is required to be washed in a centrifuge or Nutsche
Filter (as is the case with condensed product to remove salts), it is suggested that a
conductivity meter be installed in the waste wash liquor discharge line. Therefore,
depending on the type of washing purpose, the use of instruments like pH meter and
conductivity meter would be useful in pinpointing the end point of washing.
In case of filtration in a Nutsche Filter, mechanical movement of the cake while cake
washing facilitates the washing and reduces the consumption of wash water. The
mechanical movement can be manual or by the installation of various means like agitator
Cleaner Production in the
Dyes and Dye Intermediate Industry
[43]
or scrapper. The stirred type of Nutsche Filter has also been found as a better means of
filtration for many dye intermediate products.
When the products or intermediate products are required to be filtered by more than one
means, e.g. Nutsche Filter followed by centrifuge, and when cake washing is also a
requirement of the process, it is suggested to carry out the washing in the centrifuge.
Studies at both pilot and plant scales prove that wash water consumption is reduced by at
least 50% when the wash is given in the centrifuge.
When the product is required to be dried after the filtration, blowing out excess liquid
from the filter press with compressed air in order to minimize the drying time and improve
energy utilization in the drier. This procedure saves energy by reducing the amount of
liquid that needs to be evaporated in the drying process. Additionally, the removal of
residual wash or filtrate by blowing can improve product strength and quality and may
result in less off-grade product. Improved drying efficiency is also obtainable with the
newer diaphragm presses.
Large amounts of product are often unnecessarily lost due to filter cake spillage during
product transfer. Use custom boxes or bins along with pans or chutes to catch filter cake
as it is removed from the filtration equipment. This will eliminate product losses and
contamination, in addition to increased waste generation caused by spillage onto the
floor.
Best practices in blending
Dusts generated during blending can frequently be captured by dust collection systems
and recycled into the same product or other saleable product, such as a black dye. Some
blending operations may also allow for dust recycling into colours other than black, which
may be sold as one-time blends. However, careful control of the dusts collected from the
various dye classes must be maintained to prevent contamination. Generally, dusts need
to be segregated and stored for a period of time to collect a marketable quantity of dye.
When selecting new blending equipment, consider the amount of dust generated by each
type of equipment and blending method (e.g. pneumatic, agitation). For plants equipped
with several types of blending equipment, matching the blending equipment that
generates the least dust with the particular dyes that are inherently most dusty. This will
minimize the total amount of dust generated by the plant.
Dedusting materials are added to the blend to reduce the dustiness of the dye.
Frequently, a certain amount of deduster is required to reduce dusting, while subsequent
additions do not further enhance the performance of the deduster. Train blend formulator
and blending equipment operators to avoid excessive use of dedusters and evaluate
different methods of deduster addition.
Optimization of blend size can reduce the amount of equipment cleanups required and,
consequently, the volume of wash water generated. After reviewing the product sales

Cleaner Production in the
Dyes and Dye Intermediate Industry
[44]
history, warehouse capacity, and product stability in storage schedule the largest
production volume possible for a single blending operation.

Cleaner Production in the
Dyes and Dye Intermediate Industry
[45]
8.0 Financing Cleaner Production
Experience has demonstrated that, with assistance, SSIs can frequently identify Cleaner
Production techniques that produce a positive financial return, most times with little or no
investment.
However, there may be some interventions which require more extensive amounts of
investment. In fact, many a time, industries are reluctant to consider the concept on account
of lack of finance. Research has shown that the industrial sector and SSIs in particular face
difficulties while accessing to an adequate amount of fund s to invest in Cleaner Production. In
general, financial institutions do not have a particular preference for environmentally-oriented
projects leading to CP, and pay more attention to the financial elements of a loan compared to
the technical ones.
In order to facilitate proactive environmental management, the Government of Gujarat has
developed mechanism to help SSI facilities to adopt Cleaner Production techniques. The
Industrial Policy of Gujarat State (2009) provides certain financing mechanisms towards
projects qualifying as Cleaner Production. While these schemes are not specifically termed as
Cleaner Production schemes (they tend to be a blend of pollution control and pollution
prevention), they are nevertheless worth mentioning here.
The Industrial Policy specifically targets micro-, small and medium-sized enterprises through
the “Scheme for Assistance to MSMEs”. As seen in Table 4, on offer are interest subsidy,
venture capital assistance and quality certification assistance to the MSME sector to make it
more competitive.32 Note that this Policy is effective for a period of 5 years (i.e. till February
2014).
Other than the above-mentioned scheme, there are schemes available from the Small
Industrial Development Bank of India (SIDBI; http://dcmsme.gov.in/schemes/sfnsb02z.htm). It
offers schemes under which financial support for cleaner technology adoption is available on a
concessional basis.33 SIDBI also assists in setting up demonstration projects and offers loan
guarantees.
32 Schemes of Assistance for Environment Protection Measures – MSME Units. Gujarat Industrial Policy
(2009). Available at: http://ic.gujarat.gov.in/gr/environment-protection-measure-msme-units.pdf 33 Note that these schemes may not be necessarily labeled as Cleaner Production schemes; nevertheless
they do include some component of Cleaner Production like Cleaner Production processes, equipment
upgradation so as to conserve utilization of natural resources, minimize waste generation, and prevent
pollution and health hazards to workers, community and the environment.

Cleaner Production in the
Dyes and Dye Intermediate Industry
[46]
Table 4: Some Key Features for the “Scheme for Assistance to MSMEs” Under the Gujarat Industrial Policy (2009)**
** Note that while Cleaner Production is not mentioned explicitly as part of the scheme, there are nevertheless opportunities for SSIs to deploy Cleaner Production to avail of
the incentives being offered through this scheme
Scheme Name and Operative
Period
Eligible Unit Eligible Projects / Activities
Pertinent to CP
Quantum of Assistance per Project
1. Scheme of assistance for
environmental
management to MSMEs
intending to set up facilities
for waste management /
pollution prevention and
abatement
Operative period:
27.02.2009 - 27.02. 2014
Any MSME unit
engaged in
manufacturing and
who intends to set
up facilities in
waste management
/ pollution
prevention and
abatement
Application of innovative /
state-of-the-art technology
is a must. Eligible projects
include implementation of
CP measures including
substitution and
optimization of raw
materials including
catalysts
For CP projects involving substitution / optimization of raw
material including catalysts: Up to 25% of cost of plant and
machinery with a ceiling of Rs. 10 lakh per project
For implementation of CP and clean technology measures: Up to
50% of cost of plant and machinery with a ceiling of Rs. 10 lakh
per project
Quantum of assistance will be fixed by the State Level
Committee on the basis of scrutiny of the project report by the
GCPC
2. Scheme of assistance for
environmental
management to MSMEs to
encourage (implementation
of) green practices and
environmental audit
Operative period:
27.02.2009 - 27.02. 2014
Any MSME unit
engaged in
manufacturing and
which intends to
encourage green
practices in its unit
Eligible activities include:
Use of clean, efficient,
innovative pollution
control equipment in
industries
Purchase of new
equipment / systems
related to occupational
health and safety for a
cluster of industries
(minimum of 10 in a
cluster)
Depending on the project, the quantum of assistance varies. For:
Use of clean, efficient, innovative pollution control equipment in
industries: up to 25% of cost of equipment or a ceiling of Rs. 2.5
lakh per unit. The quantum of assistance will be fixed by the
District Level Committee
Purchase of new equipment / systems related to occupational
health and safety for a cluster of industries (minimum of 10 in a
cluster): Up to 25% of equipment cost or a maximum of Rs. 25
lakh per cluster. The quantum of assistance will be fixed by the
State Level Committee
Cleaner Production in the
Dyes and Dye Intermediate Industry
[47]
The following section on Resources also provides some information on the financial
assessment of Cleaner Production projects at the facility level.34
34 See the entry Improving Your Competitive Position: Strategic and Financial Assessment of Pollution
Prevention Investments.

Cleaner Production in the
Dyes and Dye Intermediate Industry
[48]

Cleaner Production in the
Dyes and Dye Intermediate Industry
[49]
9.0 Resources
Some useful resources on Cleaner Production, particularly for SSIs, are provided below.
Audit and Reduction Manual for Industrial Emissions and Wastes.
This manual is a practical working document on the audit and reduction of industrial emissions and
wastes intended for use within industry. It assists in the diagnosis of emission and waste sources. It
can be used by factory personnel at all levels interested in upgrading their own processes,
consultants reporting to an industrial client, or even government personnel reviewing existing
factory operations. Perhaps the most arresting feature of this manual is the section on case studies
from the beer, printed circuit board manufacture and leather manufacture. Each element of the
audit and waste reduction procedures has been elaborated on in detail for each of these case
studies, thus transforming the manual into a valuable resource.
Available at http://www.p2pays.org/ref/01/00950.pdf
Best Practices in Cleaner Production Promotion and Implementation for Smaller Enterprises.
This report provides a review of a set of international programs that have been designed to
promote Cleaner Production. It is intended for use by the Multilateral Investment Fund (MIF), and
similar donor agencies in their considerations of how best to structure their programs with small
and medium enterprises (SMEs). This report will contribute to projects aimed at promoting
resource efficiency while improving the economic and environmental performance of SMEs
through the concept of Cleaner Production.
Available at http://idbdocs.iadb.org/wsdocs/getdocument.aspx?docnum=553928
Good Housekeeping Guide for Small and Medium Sized Enterprises.
The objective of this Guide is to enable SMEs to identify simple, practical, common sense measures
of ‘Good Housekeeping’ that can be undertaken to reduce the costs of production, enhance the
company’s overall productivity, and mitigate environmental impact. It includes simple analysis
tools and guidance with examples. This Guide is intended to be used by those individuals who are
responsible for managing daily operations within SMEs. However, the relevance of the topics
discussed also extends to larger companies and the guide will prove useful to them also.
Available at: http://www.gtz.de/de/dokumente/en-good-housekeeping-guide.pdf
Greening Your Products: Good for the Environment, Good for Your Bottom Line.
Many innovative businesses have successfully introduced "green" products in recent years. While
many of these products have saved money, they have also reduced impacts on human health and
the environment by using recycled or recyclable material (e.g., recycled paper products), reducing
Cleaner Production in the
Dyes and Dye Intermediate Industry
[50]
their energy usage (e.g., efficient washing machines that use less water and energy) or eliminating
the use of toxic chemicals during their manufacture, for example. How do these business owners
and product designers go about improving existing products or introducing new green products?
What motivates them to do so? In providing insight into these questions, this guidance document
aims to encourage identification of opportunities to green existing products or introduce new
green products to the product line.
Available at: http://www.epa.gov/epp/pubs/jwod_product.pdf
Improving Your Competitive Position: Strategic and Financial Assessment of Pollution Prevention
Investments.
This training document provides information and guidance to help improve the practice of
pollution prevention financial analysis, complete and accurate recognition of cost savings and less-
tangible benefits which can lead companies to see how pollution prevention can advance a firm’s
strategic objectives and improve its competitive position. As a consequence, it is hoped that
companies will be encouraged to devote greater resources to pollution prevention investments.
Topics addressed include "Cost Information" (cash flow, tax impacts, depreciation, etc.), "Measures
of Profitability" (payback period, return on investment, ranking multiple projects, etc.), and
"Qualitative Issues" (assessing less tangible factors, potential liabilities, etc.).
Available at: http://www.newmoa.org/publications/competitive.pdf
Profits From Cleaner Production: A Self-Help Tool for Small to Medium-Sized Businesses.
Oriented towards small and medium sized businesses, this document forms a vital part of the
"Profits from Cleaner Production Pilot Program". It outlines, in easy-to-understand terms, what a
small to medium enterprise can do to minimize waste and reduce environmental impacts, and
demonstrates the strong links between environmental and financial performance. This self-help
tool assists businesses in incorporating cleaner production into their routine activities.
Available at: http://www.environment.nsw.gov.au/resources/sustainbus/selfhelptool.pdf
The Nothing to Waste Program: Incorporating Pollution Prevention into Small Businesses.
An Output of the Green Zia Environmental Excellence Program, this manual is designed to assist all
New Mexico businesses, from the largest facility to the smallest corner business, achieve
environmental excellence by implementing pollution prevention and energy efficiency programs. It
provides six tutorials on simple tools using employee participation for finding pollution prevention
solutions. It may be used for any organization - small or large.
Available at: http://www.ecy.wa.gov/programs/hwtr/P2/Nothing-to-Waste.pdf
Waste Minimization: An Environmental Good Practice Guide for Industry.
This guide offers a step-by-step assistance in the realm of waste reduction through the
introduction of a range of practical and tested solutions. Whether used individually or as a training
tool with a group of companies, this guide can aid businesses to improve their overall business
performance and reduce environmental impact. Chapters covered include "Benefits of Waste

Cleaner Production in the
Dyes and Dye Intermediate Industry
[51]
Minimization", "Reducing Water Use", "Energy Efficiency", "Waste Management" and "Pollution
Prevention and Control".
Available at: http://www.p2pays.org/ref/16/15243.pdf


![Dye removal from aqueous solution using low cost adsorbent · commercially available dyes with over 7 x 10 5 of dyes produced annually worldwide [1 2]. Dye s are widely used in industries](https://static.fdocuments.in/doc/165x107/5e4d1b413ebaf31a5142800c/dye-removal-from-aqueous-solution-using-low-cost-commercially-available-dyes-with.jpg)