Characterization of Natural Peruvian Dyes on Dye...
45
Characterization of Natural Peruvian Dyes on Dye-Sensitized Solar Cells Elvira Boman & Jessie Torpner Arbetsgruppen för Tropisk Ekologi Minor Field Study 207 Committee of Tropical Ecology ISSN 1653-5634 Uppsala University, Sweden September 2017 Uppsala
Transcript of Characterization of Natural Peruvian Dyes on Dye...

Characterization of Natural Peruvian Dyes on Dye-Sensitized Solar Cells
Elvira Boman & Jessie Torpner
Arbetsgruppen för Tropisk Ekologi Minor Field Study 207 Committee of Tropical Ecology ISSN 1653-5634 Uppsala University, Sweden
September 2017 Uppsala

Charcterization of Natural Peruvian Dyes on Dye-Sensitized Solar Cells
Elvira Boman & Jessie Torpner
Supervisors: Dr. Roger Herbert, Department of Earth Sciences, Program for Air, Water and Landscape, Uppsala University, Sweden. Prof. Mikael Sternad, Department of Engineering Sciences, Signals and Systems group, Uppsala University, Sweden. Prof. Maria Quintana, Facultad de Ciencias, Universidad Nacional de Ingeniería, Lima, Peru.

Abstract
Dye sensitized solar cells (DSSCs) are the third generation of solar cells and are thinnerand cheaper than conventional silicon solar cells. The purpose of the project is to studypurple corn as a photosensitizer and compare it to airampo which is another photosensiti-zor. To achieve this purpose the solar cells need to be manufactured and optimal solutionfor purple corn needs to be found. Current density-voltage (J-V) and incident photon tocurrent conversion efficiency (IPCE) are measured and solar-to-electrical conversion effi-ciency and fill factor is calculated from the measurements.
The results showed that purple corn work better as a photosensitizer than airampo sincethe maximal solar-to-electrical energy conversion efficiency for purple corn was 0.2425procent and for airampo was it 0.06127 procent. The maximal open circuit voltage washigher for airampo than purple corn but the other measurements were higher for purplecorn. The optimal solution for purple corn ended up to 20:1 for the amount of purple cornand distilled water in the solution. The LED-measurements and the halogen measure-ments showed that purple corn is neither water sensitive nor sensitive to the amount ofpurple corn in the solution. The IPCE measurements for purple corn had strangely highvalues and the curve showed slopes around 480 nm and 490 nm and peaks around 540 nmand 625 nm. For airampo was the IPCE measurements not translatable.
More measurements need to be done to establish if purple corn is sensitive to water andamount of purple corn in the solution due to measuring errors. The reduction of IPCE,for purple corn, at 475 nm shows surface recombination in the DSSCs and a dip around580 nm could be an indicator of activity in the bulk, such as short diffusion lengths. Dueto low values even for DSSCs dyed with purple corn, it is unclear if the dye is fit for useoutside a laboratory, further research on both dyes are therefore suggested. Continuedwork could be to study cells with polymer paper, do measurements with closed cells, useanother electrolyte and other measurement devices that have a sun simulator.
2

Title:Characterization of Natural Peruvian Dyes on Dye-Sensitized Solar Cells
Authors:Elvira Boman och Jessie Torpner
Supervisors:Prof. Dr. Maria Quintana, Department of Science, Universidad National de IngenieriaSenior Lecturer Erik Johansson, Department of Chemistry, Uppsala University
Granting Institution:Arbetsgruppen för Tropisk Ekologi, ATE
Key words:DSSC, renewable resource, solar energy
3

Acknowledgments
We would like to give special thanks to
Prof. Dr. Maria Quintana for her guidance and support as our supervisor at UniversidadNational de Ingenieria.
Dr. Erik Johansson for his feedback and assistance as our supervisor at Uppsala Univer-sity.
Prof. Dr. Walter Estrada for arranging for us to come to Universidad National de Inge-nieria.
Russell Nazario Ticse for all his help in manufacturing, measuring and analyzing thesolar cells.
Pierre Ramos Apestegui for his help with the measurement apparatuses and his generalhelp in the thin film lab.
Harry Anderson Rivera Tito for his help with all the chemical questions that developedduring the project.
The thin films group for their hospitality and support through the project.
Prof. Dr. Mikael Sternad for his feedback on the physical and technical aspects of ourproject.
Dr. Roger Herbert for his support and feedback on the structure and relevance of ourproject.
Arbetsgruppen för Tropisk Ekologi, Uppsala University, och Ronny Alexanderssonfor choosing us as MFS candidates for the SIDA sponsorship.
SIDA for the sponsorship and preparatory course for minor field studies.
4

Abbreviations
CB Conduction Band
DSSC Dye-Sensitized Solar Cell
EQE External Quantum Efficiency
FF Fill Factor
IPCE Incident Photon to Converted Electron
IQE Internal Quantum Efficiency
PV Photovoltaic
QE Quantum Efficiency
UNI Universidad Nacional de Ingeniería
Nomenclature
η Solar-to-electrical energy conversion efficiency
JMP Maximum power output current density [A/m2]
JSC Short-circuit current density [A/m2]
PIN Input power [W]
VOC Open-circuit voltage [V]
VMP Maximum power output voltage [V]
Units
AU Astronomical Unit 1 AU = 149597870700 m
deg C Degrees Celsius 1 deg C = -273.15 K
J Joule 1 J = 1 kg*m2s2
K Kelvin 1 K = 273.15 deg C
W Watt 1 W = 1 J/s
5

Contents1 Introduction 8
1.1 Project Purpose . . . . . . . . . . . . . . . . . . . . . . . . . . . . . . . 81.2 Project Goals . . . . . . . . . . . . . . . . . . . . . . . . . . . . . . . . 81.3 Limitations . . . . . . . . . . . . . . . . . . . . . . . . . . . . . . . . . 9
2 Background and Theory 92.1 A Brief History of Solar Cells . . . . . . . . . . . . . . . . . . . . . . . 92.2 DSSCs: Advantages and Disadvantages . . . . . . . . . . . . . . . . . . 102.3 The Sun and the Solar Radiation . . . . . . . . . . . . . . . . . . . . . . 112.4 Dye-Sensitized Solar Cells . . . . . . . . . . . . . . . . . . . . . . . . . 12
2.4.1 The Properties of Dyes . . . . . . . . . . . . . . . . . . . . . . . 132.4.2 Solvents of Dyes . . . . . . . . . . . . . . . . . . . . . . . . . . 142.4.3 Measurement Techniques for Characterizations of Dye-Sensitized
Solar Cells . . . . . . . . . . . . . . . . . . . . . . . . . . . . . 14
3 Method 163.1 Manufacture DSSCs . . . . . . . . . . . . . . . . . . . . . . . . . . . . 16
3.1.1 Cleaning FTO-glass . . . . . . . . . . . . . . . . . . . . . . . . 163.1.2 TiO2 Film . . . . . . . . . . . . . . . . . . . . . . . . . . . . . . 163.1.3 Applying TiO2 Film on FTO-glas . . . . . . . . . . . . . . . . . 163.1.4 Counter Electrodes . . . . . . . . . . . . . . . . . . . . . . . . . 173.1.5 Electrolyte . . . . . . . . . . . . . . . . . . . . . . . . . . . . . 173.1.6 Finished DSSC . . . . . . . . . . . . . . . . . . . . . . . . . . . 18
3.2 Manufacturing of Natural Peruvian Dyes . . . . . . . . . . . . . . . . . . 193.2.1 Airampo . . . . . . . . . . . . . . . . . . . . . . . . . . . . . . 193.2.2 Purple Corn . . . . . . . . . . . . . . . . . . . . . . . . . . . . . 203.2.3 Finding Optimal Solution . . . . . . . . . . . . . . . . . . . . . 20
3.3 Measurements . . . . . . . . . . . . . . . . . . . . . . . . . . . . . . . . 203.3.1 Current-Voltage Measurements . . . . . . . . . . . . . . . . . . 213.3.2 IPCE . . . . . . . . . . . . . . . . . . . . . . . . . . . . . . . . 22
4 Results 224.1 Finding Optimal Solution for Purple Corn . . . . . . . . . . . . . . . . . 22
4.1.1 Sensitivity to Amount of Distilled Water . . . . . . . . . . . . . 224.1.2 Sensitivity to Amount of Purple Corn . . . . . . . . . . . . . . . 28
4.2 Final Results with Optimal Solutions . . . . . . . . . . . . . . . . . . . . 294.2.1 Purple corn . . . . . . . . . . . . . . . . . . . . . . . . . . . . . 294.2.2 Airampo . . . . . . . . . . . . . . . . . . . . . . . . . . . . . . 32
4.3 Other Results . . . . . . . . . . . . . . . . . . . . . . . . . . . . . . . . 32
5 Discussion 335.1 Purple Corn . . . . . . . . . . . . . . . . . . . . . . . . . . . . . . . . . 33
5.1.1 Finding Optimal Concentration . . . . . . . . . . . . . . . . . . 335.1.2 J-V Curve, Efficiency and Fill Factor . . . . . . . . . . . . . . . 345.1.3 IPCE . . . . . . . . . . . . . . . . . . . . . . . . . . . . . . . . 34
5.2 Airampo . . . . . . . . . . . . . . . . . . . . . . . . . . . . . . . . . . . 345.2.1 Optimal Concentration . . . . . . . . . . . . . . . . . . . . . . . 34
6

5.2.2 J-V Curve, Efficiency and Fill Factor . . . . . . . . . . . . . . . 355.2.3 IPCE . . . . . . . . . . . . . . . . . . . . . . . . . . . . . . . . 35
5.3 Comparing Purple Corn and Airampo . . . . . . . . . . . . . . . . . . . 355.4 Sources of Errors in Manufacturing and Measurements . . . . . . . . . . 36
5.4.1 Washing of FTO-glasses . . . . . . . . . . . . . . . . . . . . . . 365.4.2 Different Results for Different Batches of Dye . . . . . . . . . . 365.4.3 Unevenness in TiO2 Film Caused by Doctor Blading . . . . . . . 365.4.4 Unknown Manufacturing Technique for Machine Made Cells . . 365.4.5 Spectrum and Intensity of J-V Measurements . . . . . . . . . . . 375.4.6 Spikes in J-V Curves Caused by Adjustable Resistance Box . . . 375.4.7 Evaporation of Electrolyte . . . . . . . . . . . . . . . . . . . . . 375.4.8 Usage of Two J-V Measurement Apparatuses . . . . . . . . . . . 375.4.9 Improbable High IPCE Results . . . . . . . . . . . . . . . . . . . 37
5.5 Continued Work . . . . . . . . . . . . . . . . . . . . . . . . . . . . . . . 385.5.1 Optimal Concentration for Dye with Purple Corn . . . . . . . . . 385.5.2 Polymer Paper . . . . . . . . . . . . . . . . . . . . . . . . . . . 385.5.3 Closed Cells . . . . . . . . . . . . . . . . . . . . . . . . . . . . 385.5.4 Electrolyte . . . . . . . . . . . . . . . . . . . . . . . . . . . . . 385.5.5 Other Measurement Devices . . . . . . . . . . . . . . . . . . . . 385.5.6 Further Measurements . . . . . . . . . . . . . . . . . . . . . . . 38
6 Conclusions 39
Appendices 43
A Measurement Apparatuses 43
7

1 IntroductionCombating climate change will be one of the greatest challenges mankind has ever faced.In order to honor the Paris Agreement and thus limiting global average temperature riseto below 2° C compared to preindustrial levels, the world’s countries must move fromnon-renewable energy sources, such as fossil fuels, to renewable energy sources to powerour civilization (United Nations, 2017).
The sun is the most prominent source of renewable energy (Dr. Stern, 2006). Solarcells have historically been inefficient, but new generations of cells are changing this.Modern thin-film solar cells are lighter, less expensive than their precursors, giving solarenergy potential to power much of the future world. One type of thin-film cell is the dye-sensitized solar cell (DSSC). The DSSCs have several advantages to more conventionalsilicon cells, which makes them an interesting subject for research (Jacoby, 2016). Theyare semi-transparent and semi-flexible, unlike solid conventional solar cells, giving thempotential for a wide range of uses. They can convert any visible light to electricity, mak-ing them fit both for outside as well as inside applications as well as low-light weatherconditions, and the performance-to-price ratio of DSSCs is one of the most favorable ofthe third generation cells (Gcell, 2017a).
At the Universidad Nacional de Ingeniería (UNI) in Lima, Peru, the Thin Films Groupis working with DSSCs at the Faculty of Science. The handmade solar cells are man-ufactured and evaluated by the group, aiming to find more efficient cells using naturalPeruvian dyes as sensitizers (Quintana, 2017).
1.1 Project PurposeThe purpose of the project is to characterize the natural Peruvian dye purple corn asphotosensitizer for DSSCs at UNI and compare its properties to another natural Peruviandye, airampo.
1.2 Project GoalsThe goal of the project is to manufacture, measure and analyze the performance of DSSCswith two natural Peruvian dyes as photosensitizers. In order to achieve this, the work hasbeen divided in tasks.
• Manufacture DSSCs
• Finding the optimal solution for the extraction of purple corn as a dye
• Measuring current density-voltage (J-V) ratio for DSSCs sensitized with purplecorn and airampo
• Measuring incident photon to current conversion efficiency (IPCE) for DSSCs sen-sitized with purple corn
• Analyzing solar-to-electrical energy conversion efficiency η and fill factor (FF) forDSSCs sensitized with purple corn and airampo
8

1.3 LimitationsDuring the course of the project limitations to the work was encountered.
The project spans 9 weeks in the laboratory at UNI. No more experimental data can begenerated after the 9 week deadline, and any further investigations into findings will beleft to other projects.
At UNI resources are limited. Regarding characterizations, J-V curve and IPCE can bemeasured, and fill factor and efficiency calculated with the existing measuring equipment.The equipment is built in the laboratory. The J-V measurements are done with an LEDor halogen based apparatus, since there is no sun simulator. Fourier transform infraredspectroscopy (FTIR) was not possible to measure. Other resources such as FTO-glasses,ovens and cups are also limited, prompting reuse of resources or bottlenecks in the project.Chemicals are also limited, affecting what kind of electrolyte for the DSSCs that can bemanufactured.
Sharing a laboratory with a group of 10 people leads to sharing machines and other re-sources like cups, scissors and ethanol. When a machine is needed to be on overnight itis important to leave a note on the machine telling to leave it on, otherwise it happens thatsomeone in the group turns it off. Language barriers can cause difficulties and delays inthe project.
2 Background and TheoryThe history, the advantages and the disadvantages of DSSCs are presented and the trans-formation of solar energy to electricity and properties of the dyes are presented in thissection.
2.1 A Brief History of Solar CellsThe first silicon PV cells were developed by Bell labs in 1954 after decades of experimentswith low efficient solar cells made from selenium. A year later, the first commercial li-censes for silicon PV cells where sold, and in 1958 the first silicon PV cells were used insatellites (U.S. Department of Energy, 2001). This continued to be the main area of use forPV cells during the 1960s, but new improvements of the cells in the 1970s increased qual-ity and performance, and reduced costs, resulting in PV cells entering new markets suchas telecommunications aids, navigation equipment, and other low-power usages (FloridaSolar Energy Center, 2014).
The energy crises during the 1970s increased efforts to develop PV systems for big scaleuse, and further improvements made PV cells enter the consumer electronics as well asoff-grid solutions in the 1980s. Thin film solar cells were developed, the first solar pow-ered aircraft flew over the English Channel and the first solar powered car drove betweenSydney and Perth. The total worldwide installed PV power was 9.3 megawatts (MV) in1982 (U.S. Department of Energy, 2001), which can be compared to the generating ca-pacity of a nuclear power plant, which lies in the span of 500-4000 MW (PVeducation,
9

2017a).
During the 1990s the efficiency of PV cells continued to increase, and in 1999 the totalinstalled PV power reached 1000 MW (U.S. Department of Energy, 2001). The 2000smeant a continued exponential growth in the installation of PV power (Figure 1), and asharp drop in prices (Fraas, 2014).
Figure 1. Evolution of annual installed PV power 2000-2015, with portion of installationper top installer country/region marked for 2015. Source: Trends 2016 in PhotovoltaicApplications, International Energy Agency
Increasing understanding of man-made climate change further advanced the PV cell mar-ket, and PV cells are today seen as a key factor to halt fossil fuel growth (The Guardian,2017). As can be seen in Figure 1, installation of PV power has been on a steady rise sinceit was first developed. A few countries dominates the new installations, with China lead-ing the way, but installations are increasing also outside the IEA membership countries,which incorporates the developing world.
2.2 DSSCs: Advantages and DisadvantagesSilicon solar cells has shown the maximal efficiency of 26.3 procent which is close to themaximal theoretical efficincy that is 29 procent (Boyd, 2017). The lifespan is 25 years andafter that the cells still produce 80 procent of their original power. Today is approximatly90 procent of the sold solar cells silicon based (Energy, 2013). The cost of the balance ofthe system (BOS), which is hardware, invertes, installation, inspections, finances and soon, is high for silicon solar cells. The cells need a thick layer of glass and are thereforeheavy and robust which limits the area of use (Stauffer, 2015).
The maximal efficiency for DSSCs is 14.1 procent and the theoretical maximal efficiencyis 32 procent under standard conditions (Gcell, 2017b). The maximal open circuit voltageis 0.85-0.9 V and the maximal current is approximately 22 mA/cm2. A normal value forthe fill factor (FF) is 0.75 for DSSCs (Soga, 2006). Even though the efficiency is lower forDSSCs than conventional silicon solar cells and they use less expensive materials and cantherefore be more convenient to use in larger volumes (Energy, 2013). One of the maindifficulties with DSSCs are their longterm stability issues. The lifespan is 5-10 years(Solar Energy, 2016). Using natural sensitizers such as betalains the lifespan is only one
10

year. Another difficulty with DSSCs is the liquid electrolyte which brings problems withleakage and contamination. And at higher temperatures there are stability issues (Hug etal., 2013).
The main advantages are that they are light and thin and can absorb all visible light andcan therefore be installed in windows and other new areas of use. They are also easy totransport and to be installed (Stauffer, 2015).
2.3 The Sun and the Solar RadiationIn the center of our solar system there is a yellow dwarf star: the Sun. In its core, at atemperature of 15 million degrees Celsius, a thermonuclear fusion process produces enor-mous amounts of energy in the form of electromagnetic radiation (Nasa Science, 2017).This electromagnetic radiation is then uniformly radiated from the Sun out in space.
The Sun has a luminosity of 3.83*1026 W, of which 1.75*1017 W hits the Earth (Williams,2016). This can be compared to the total human energy yearly energy consumption of6.21*1020 J (U. S Energy Information Administration, 2017), translating to 1.97*1013 Wover the year. The solar constant is another way of measuring the power of the Sun atEarth, being the electromagnetic radiation from the Sun going through a square meterincident perpendicular to the radiation, at one astronomical unit (AU) from the Sun - ap-proximately the distance between the Sun and Earth. Despite its name, the solar constantis not constant, but varies historically and with solar minimums and maximums. There-fore, an approximate value of 1370 W/m2 is used to express the solar constant (NasaScience Beta, 2003).
The Sun’s radiation lies predominantly in the visible and infrared spectrum (Figure 2),and behaves similarly to a 5250 °C (5525 K) blackbody.
Figure 2. Solar radiation spectrum for direct light for at sea level, the top of Earth’satmosphere and a 5525 K blackbody. Source: Global Warming Art, based on AmericanSociety for Testing and Materials, 2007-08-25.
This is not surprising seeing the Sun’s surface temperature is 5772 K. A portion of theSun’s electromagnetic radiation passing through Earth’s atmosphere is absorbed by gases.
11

2.4 Dye-Sensitized Solar CellsIn 1839, French scientist Edmond Becquerel discovered the photovoltaic (PV) effect.During experiments, Becquerel noticed that a voltage and electric current could be cre-ated in materials when exposed to light. This became the first step in the development oftoday’s solar cells (U.S. Department of Energy, 2001).
Dye-sensitized solar cells (DSSCs) use the PV effect to convert visible light to electricitythrough a special bond between a sensitized dye and a semiconductor. Titanium dioxide(TiO2) is used as semiconductor with its n-type wide band gap (Soga, 2006). The specialbond is created by the carboxylic groups on the dye that adsorb to the surface of TiO2 andmakes electron injection effective and fast (Lalander, 2009). Electrons are mobile chargecarriers, and their movement create an electric current (Encyclopædia Britannica, 2017).
The electron energy in the DSSC is different for the different parts of the cell (Figure 3).When a photon meet the sensitized dye in the cell an electron excites and injects into theconduction band (CB) of the TiO2 due to the carboxylic groups on the dye. The lowestunoccupied molecular orbital (LUMO) of the dye is the electron energy for the exitedelectron and the highest unoccupied molecule orbital (HOMO) of the dye is the electronenergy when the electron is not excited. Inside the semiconductor the electron diffuses tothe electrode and travels through the fluorine doped tin oxide (FTO) glasses towards thecounter electrode where the platinum is. The electron diffuses from the platinum to theelectrolyte, iodide, then goes to the dye and the circle is complete (Lalander, 2009).
Figure 3. A simplified example how the electron energy levels for FTO, TiO2, the dye,electrolyte and the platinum in the DSSC are placed (Johansson, 2016).
The most important thing with the energy levels are the difference between the excitedelectron in the dye, the CB for the TiO2 and the electrolyte. If the energy level for theelectrolyte is too close to the energy level for the excited electron in the dye the electron
12

can go there instead, it recombinates instead of injects into the semiconductor (Lalander,2009). Recombination of electrons annihilates the carriers, and losses due to recom-bination affects the currents and voltages produced by the cell. Recombination can beclassified by where in the cell it occurs, with surface- and bulk recombination being themost common in solar cells (PVeducation, 2017b). Diffusion length is the length a carriertravels on average between generation and recombination. Short diffusion lengths indi-cate high recombination rates, and vice versa. Long diffusion lengths are associated withlong lifetimes for the material in question, and is therefore of importance when evaluatinga semiconductor material (PVeducation, 2017a).
2.4.1 The Properties of Dyes
Airampo and purple corn come from natural plants and are thereby organic dyes and havesimilar properties such as being able to solve in water. To get better results of the cells it isimportant to know and understand the properties of the dyes. Airampo (Opuntia soehren-sii) comes from the cactus family and are famous in the Andean region for its antioxidantcapacity. In the seeds of airampo betacyanin can be found (Figure 4) (Caldas-Cueva etal., 2015).
Figure 4. The chemical structure of betanin.
Betacyanin can be found in most red plants and contain nitrogen and glycosylated com-bounds. Betaxanthins are chemically similar but generate yellow pigments and these twogroups are classed as betalains. The most studied betalain is betanin (Figure 4) (A Dic-tionary of Biology, 2004). The color of the purple corn has a more purple color than thedark pink color from airampo (Figure 5).
13

Figure 5. Above: The color of airampo with handmade TiO2-film. Lower: The color ofpurple corn with handmade TiO2-film.
Purple corn or maíz morado (Spanish) is native to Peru and is used for the popular drinkchicha morada. The color from the purple corn is so intense that it is used for coloringrise for example (Peru Delights, 2013). Both airampo and purple corn are being used andhave being used by the Peruvians in Cusco to color the alpaca wool they are using to makeclothes and blankets (Anderson Rivera Tito, 2017).
2.4.2 Solvents of Dyes
Distilled water and ethanol are the solvents for the dyes. When a ZnO based dye-sensitizedsolar cells been studied with different sensitizing dyes, with and without including waterto the dye solution it showed that water in the dye solution reduces surface dye aggrega-tion for one of the sensitizing dyes. The solar cell performance for one of the sensitizingdye was thereby showing better results (Schölin et al., 2011).
2.4.3 Measurement Techniques for Characterizations of Dye-Sensitized Solar Cells
In order to evaluate the performance of solar cells a characterization of the cells is made,taking several properties into consideration. In this project current density-voltage J-Vcharacterization, fill factor, efficiency, and quantum efficiency will be used to evaluate theperformance of the differently dyed cells.
One of the most fundamental characterizations is the current-voltage (I-V) characteri-zation, where voltage V and current I of the illuminated solar cell is measured cite. Themeasurements are used to calculate the output power P according to (Hyper Physics,2017).
P = IV (1)
In order to make the measurements independent of cell size, current density J is oftenconsidered instead of current I, using the relation
J = I/a (2)
14

with a being the area of the cell (Elert, 2017). Any equation describing the solar cell’scurrent can thus be modified to instead describe the cell’s current density, and the I-Vcharacterization thus becomes a J-V characterization. A solar cell can operate at a rangeof voltages and currents. The short-circuit current density JSC is the maximum possiblecurrent density the cell can produce, and the open circuit voltage VOC the highest voltage.A maximum power PMP output is given by a cell specific current density-voltage ratio,the voltage VMP and the current density JMP. The fill factor (FF) is the ratio between themaximum obtainable power output PMP and the ideal maximum power output:
FF =JMPVMP
JSCVOC(3)
with JMP and VMP being the current density and voltage respectively for the maximumpower output PMP (Tupta, 2017). Thus, the fill factor provides insight in the internal ef-ficiency of the solar cell, being a measurement on how close the cell is to its highestpossible performance.
The solar-to-electrical energy conversion efficiency η of the cell can then be calculatedusing
η =JSCVOCFF
PIN(4)
PIN is the solar power input (Tupta, 2017).
The quantum efficiency (QE) of a solar cell is the ratio of the total amount of carrierscollected by the cell to the amount of incident photons by a given energy on the cell(PVeducation, 2017d). QE can be defined in two ways.
• External quantum efficiency (EQE). EQE includes optical losses due to phenomenasuch as transmission and reflection.
• Internal quantum efficiency (IQE). IQE excludes optical losses, but only considersthe QE with regard to photons that are not transmitted or reflected out of the cell.To obtain the IQE of a solar cell, the EQE is measured, and the reflection andtransmission is then subtracted from the EQE curve (PVeducation, 2017d).
In the particular case of DSSCs, QE is often referred to as the incident photon to currentconversion efficiency, IPCE, and then specifically means the EQE. When the DSSC is illu-minated by an monochromatic source, the IPCE gives the ratio between the photocurrentdensity in the external circuit and the incident photon flux (Hagfeldt et al., 2010).
IPCE =JSC(λ)
e
1
φ(λ)=hc
e
JSC(λ)
PIN(λ)λ= 1240
JSC(λ)
PIN(λ)λ(5)
with e being the elementary charge, h the Planck’s constant, c the speed of light and λ thelight’s wavelength in nanometer (Hagfeldt et al., 2010). An IPCE curve for ideal solarcell is square, meaning the IPCE is at a 100% through the whole wavelength spectrum.Depending on where in the cell the electromagnetic radiation is being absorbed, differentspans of wavelengths of electromagnetic radiation in the IPCE will affected (PVeducation,2017c). Recombination effects and diffusion lengths in particular parts of the solar cellwill reduce the IPCE for the corresponding wavelengths of radiation. Visible blue lightwith a wavelength of 475 nm (Madigan, 2017) is absorbed close to the surface of the cell,
15

and surface recombination will reduce the IPCE around the 475 nm wavelength. Greenlight on the other hand, with a wavelength of 510 nm, is absorbed in the cell’s bulk, andlow diffusion lengths will reduce the IPCE around the 510 nm wavelength. For photonswith energy below the bandgap the IPCE is zero (PVeducation, 2017c). IPCE typicallypeak around 10-50% for DSSCs (Zimmermann et al., 2014).
3 MethodPreparing the solar cells and the measurements are presented in this section.
3.1 Manufacture DSSCsTo manufacture DSSC two FTO-glasses are needed. One of the glasses is treated withTiO2 and the other is treated with platinum. Both glasses are painted with silver on oneside and thereafter is usual paper placed between the glasses. Clamps are used to keep thecell together and an open cell is created.
3.1.1 Cleaning FTO-glass
The FTO-glasses are scrubbed with washing-up liquid and a sponge and thereafter washedwith distilled water that is created at the laboratory. The scrubbed FTO-glasses are placedin a beaker that fills up with distilled water and placed in to a sonicator for 20 minutes.After 20 minutes is the distilled water replaced with ethanol and placed in the sonicatorfor another 20 minutes. To finish the cleaning process the FTO-glasses are placed in aoven in 60-120 degrees until the ethanol has evaporated.
3.1.2 TiO2 Film
Two grams of pure TiO2 is scaled in a cleaned cup with a cleaned magnet inside that actsas a stirrer. Thereafter eight grams of ethanol is scaled and a plastic-paper is placed ontop of the cup to avoid evaporation of the ethanol. For 12 hours is the stirrer on and thenis the TiO2 film ready to be used.
3.1.3 Applying TiO2 Film on FTO-glas
Cleaned FTO-glasses are placed on a pane of glass with a graphed paper glued under it(Figure 6).
16

Figure 6. The 5*5 millimeter square of the TiO2 is created with four pieces of tape. Thewhite TiO2 film covers the square.
A 5*5 millimeter square is created with four pieces of tape. One drop of the TiO2-solutionis placed on the tape on the FTO-glass near the square and the TiO2-solution wipes overthe square with a smooth tool. This method is called doctor blading and the purpose is toget a homogeneous TiO2 film over the entire square. After a few minutes when the TiO2
film has dried can the pieces of tape be removed and the TiO2-glasses is places in a coldoven. The TiO2-glasses are in the oven for 50 minutes in 450 degrees and then the oventurns off and the glasses need to cool down for two hours before they can leave the oven.
3.1.4 Counter Electrodes
The cleaning process of FTO-glass are made the same way as is described in the section4.1.1 Cleaning of FTO-glass. One to three drops of liquid platinum are placed on eachFTO-glass with a pipette. It is important to cover the entire surface but also to not let theplatinum liquid to pour over the surface. The FTO-glasses are thereafter placed in a coldoven and after 30 minutes in 450 degrees the oven turns off. After two hours of coolingin the oven the counter electrodes are ready to be used.
3.1.5 Electrolyte
The electrolyte that is used in this project is taken from the course Oorganiskt kemi,3B1781, at Uppsala University used in Laboration 2: Dye Sensitized Nanostructured So-lar cells. The amount of electrolyte that is created is 50 ml and the concentration oflitium iodide (LiI) is 0.5 M and the concentration of iodide (I2) is 50 mM. The mass forthe substances are calculated with equation 6 and 7.
n[mol] =m[g]
M [g/mol](6)
with n being the amount of solute, m the mass and M the mass per amount of substancecalled the molar mass (Mills & Milton, 2009).
c[M ] =n[mol]
V [L](7)
17

with c being the molar concentration which is the amount of a solute present in one unitof a solution and V the volume (Sigma-Aldrich, 2017). 3.349 g of LiI and 0.635 g of I2
is scaled into a beaker and thereafter is the solution 3-metoxypropionitrile added until 50ml is accomplished.
3.1.6 Finished DSSC
When both the TiO2-glasses and the counter electrodes are made a thin line with a silverconductive paint is painted on one side of the glasses with a toothpick made of wood(Figure 7).
Figure 7. A TiO2-glass with a silver line and a normal paper over the 5*5 square that iscolored yellow from the electrolyte.
A piece of tissue paper is placed over the 5*5 square and after a few minutes when the sil-ver has dried the electrodes are putted together. For an open cell the electrodes are puttedtogether with clamps and 1-2 drops of electrolyte is being dropped between the glasses(Figure 8).
18

Figure 8. A finished handmade solar cell with a dyed TiO2-glass and a counter electrodetogether thanks to the clamps. The painted silver lines on each electrode are placed sothat cables can be connected and measurements can be done.
For a closed cell the electrodes are glued together. For all measurements in this projectwere only open cells used. After all the measurements were done the cells were pickedapart and the FTO-glasses were washed clean and were used again for new handmadesolar cells.
3.2 Manufacturing of Natural Peruvian DyesAirampo and purple corn are the two different natural Peruvian dyes that are studied asphotosensitizers for DSSCs.
3.2.1 Airampo
Seeds from airampo are scaled in a cup and desired amount of distilled water and ethanolare added. The optimal concentration of seeds, distilled water and ethanol is used fromearlier studies of airampo (Nazario Ticse, 2017). Optimal concentration for a dye meansthat it dissolves and can dye the TiO2 film effectively so that the DSSC reaches as highefficiency, P, as possible. After one test session the same optimal concentration wasachieved to 1:1:5 for seeds, distilled water and ethanol as earlier studies showed. If 5g of seeds from airampo is used, 5 g of distilled water and 25 g of ethanol are added.
The beaker with the optimal concentration of seeds, distilled water and ethanol are placedin a sonicator for 20 minutes. Thereafter is the dye-solution ready to dye the TiO2 film onthe FTO-glass. When finished TiO2-glasses are placed in the cup with dye-solution it isimportant to have the TiO2 film facing up so it can get dyed correctly. The TiO2-glassesshould be in the dye-solution for two days to achieve the most efficient color of the TiO2
19
film (Nazario Ticse, 2017). A plastic paper is used to avoid evaporation and tinfoil is usedto cover the dye-solution from light because the dye is sensitive to light.
3.2.2 Purple Corn
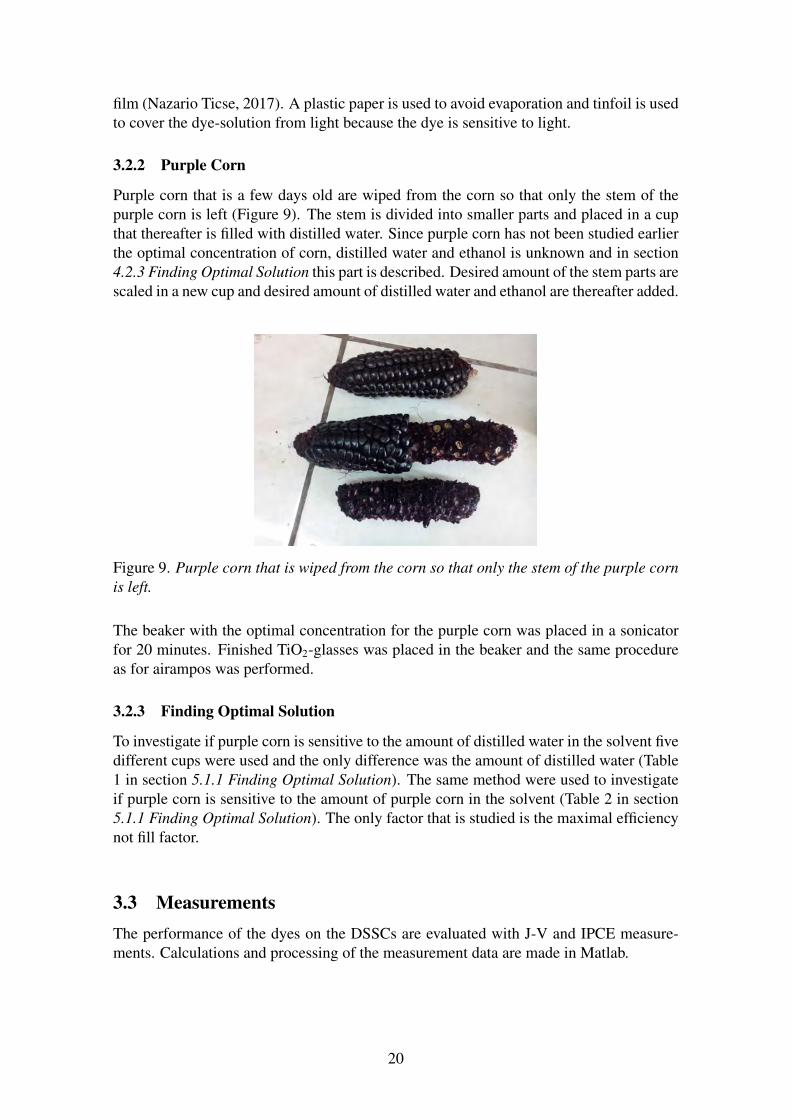
Purple corn that is a few days old are wiped from the corn so that only the stem of thepurple corn is left (Figure 9). The stem is divided into smaller parts and placed in a cupthat thereafter is filled with distilled water. Since purple corn has not been studied earlierthe optimal concentration of corn, distilled water and ethanol is unknown and in section4.2.3 Finding Optimal Solution this part is described. Desired amount of the stem parts arescaled in a new cup and desired amount of distilled water and ethanol are thereafter added.
Figure 9. Purple corn that is wiped from the corn so that only the stem of the purple cornis left.
The beaker with the optimal concentration for the purple corn was placed in a sonicatorfor 20 minutes. Finished TiO2-glasses was placed in the beaker and the same procedureas for airampos was performed.
3.2.3 Finding Optimal Solution
To investigate if purple corn is sensitive to the amount of distilled water in the solvent fivedifferent cups were used and the only difference was the amount of distilled water (Table1 in section 5.1.1 Finding Optimal Solution). The same method were used to investigateif purple corn is sensitive to the amount of purple corn in the solvent (Table 2 in section5.1.1 Finding Optimal Solution). The only factor that is studied is the maximal efficiencynot fill factor.
3.3 MeasurementsThe performance of the dyes on the DSSCs are evaluated with J-V and IPCE measure-ments. Calculations and processing of the measurement data are made in Matlab.
20

3.3.1 Current-Voltage Measurements
The J-V measurements are done using two measurement apparatuses, refered to as theLED based J-V measurement apparatus (Figure 10) and the halogen based measurementapparatus (Figure 11).
Figure 10. Schematic of measurement apparatus for J-V measurements of DSSCs using aLED as a light source, at the Faculty of Science, Universidad Nacional de Ingeniería.
The LED based measurement apparatus has a MR16 LED lamp as light source (Figure10, Appendix A), operating on 20 V. The lamp is facing a plastic container filled withwater, used to filter out infrared light. Behind the container, there is a fastener on which asolar cell can be attached, so that the light from the overhead filtered through the water isincident. At this distance from the LED lamp the intensity of the light is 1000 W/m2. Twowires are attached to an adjustable resistance box and a voltmeter. A resistance sweep canbe made with the resistance box with a range of 999 999-0 Ohm [Ω], with respectivevoltages shown on the voltmeter. The wires can be attached to the solar cell to do mea-surements. Currents corresponding to resistances and voltages can be calculated from themeasurement data (Equation 1).
Figure 11. Schematic of measurement apparatus for J-V measurements of DSSCs usingan oat the Faculty of Science, Universidad Nacional de Ingeniería.
The halogen based measurement apparatus has an overhead projector with a halogen lampas light source (Figure 27, Appendix A). It is facing a plastic container filled with water,filtering out infrared light. Behind the container a lens focuses the light on a fastener onwhich solar cells can be attached for measurements. The intensity of the light hitting thesolar cell at this distance form the halogen light source is 1000 W/m2. Just as for theLED based apparatus, two wires are attached to an adjustable resistance box (range of
21
999 999-0 (Ω), and a voltmeter for reading the voltages over the cell.
The halogen based measurement apparatus has a spectrum more like the Sun’s spectrum(Figure 2), compared to the LED based measurement apparatus (Quintana, 2017). Theexact spectrum of the two apparatuses are not known.
3.3.2 IPCE
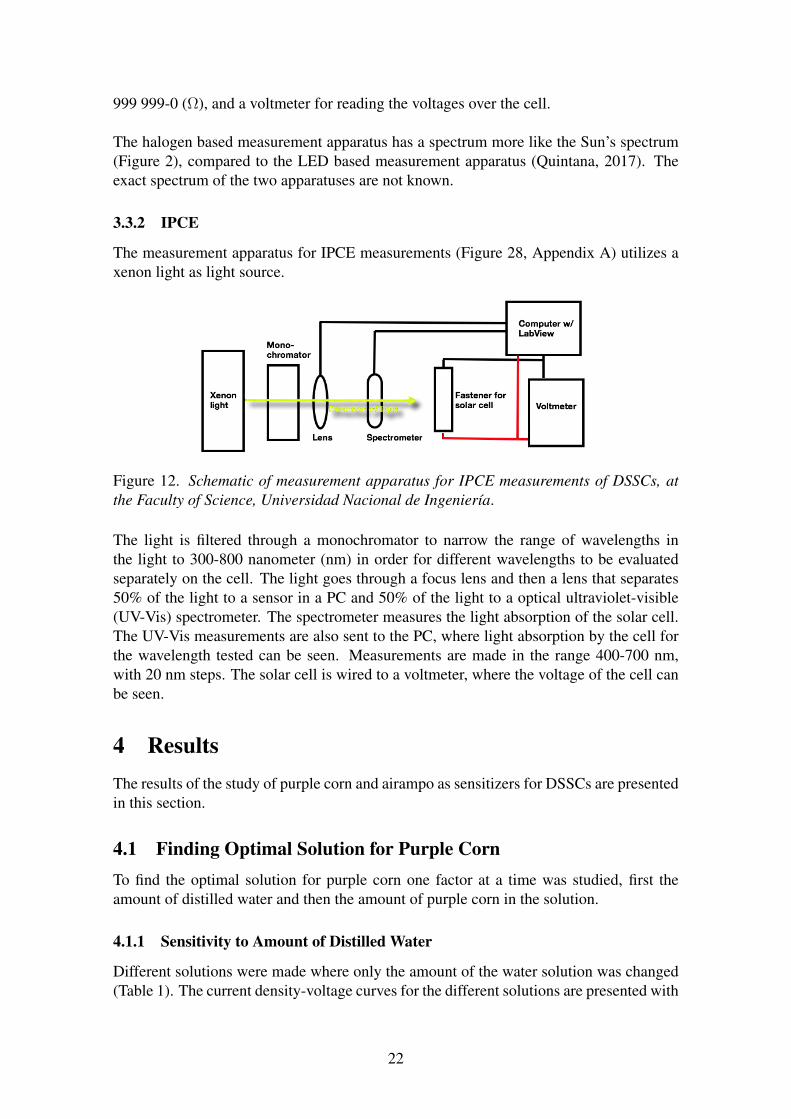
The measurement apparatus for IPCE measurements (Figure 28, Appendix A) utilizes axenon light as light source.
Figure 12. Schematic of measurement apparatus for IPCE measurements of DSSCs, atthe Faculty of Science, Universidad Nacional de Ingeniería.
The light is filtered through a monochromator to narrow the range of wavelengths inthe light to 300-800 nanometer (nm) in order for different wavelengths to be evaluatedseparately on the cell. The light goes through a focus lens and then a lens that separates50% of the light to a sensor in a PC and 50% of the light to a optical ultraviolet-visible(UV-Vis) spectrometer. The spectrometer measures the light absorption of the solar cell.The UV-Vis measurements are also sent to the PC, where light absorption by the cell forthe wavelength tested can be seen. Measurements are made in the range 400-700 nm,with 20 nm steps. The solar cell is wired to a voltmeter, where the voltage of the cell canbe seen.
4 ResultsThe results of the study of purple corn and airampo as sensitizers for DSSCs are presentedin this section.
4.1 Finding Optimal Solution for Purple CornTo find the optimal solution for purple corn one factor at a time was studied, first theamount of distilled water and then the amount of purple corn in the solution.
4.1.1 Sensitivity to Amount of Distilled Water
Different solutions were made where only the amount of the water solution was changed(Table 1). The current density-voltage curves for the different solutions are presented with
22
possible measurement error and without them (Figure 13 and 14).
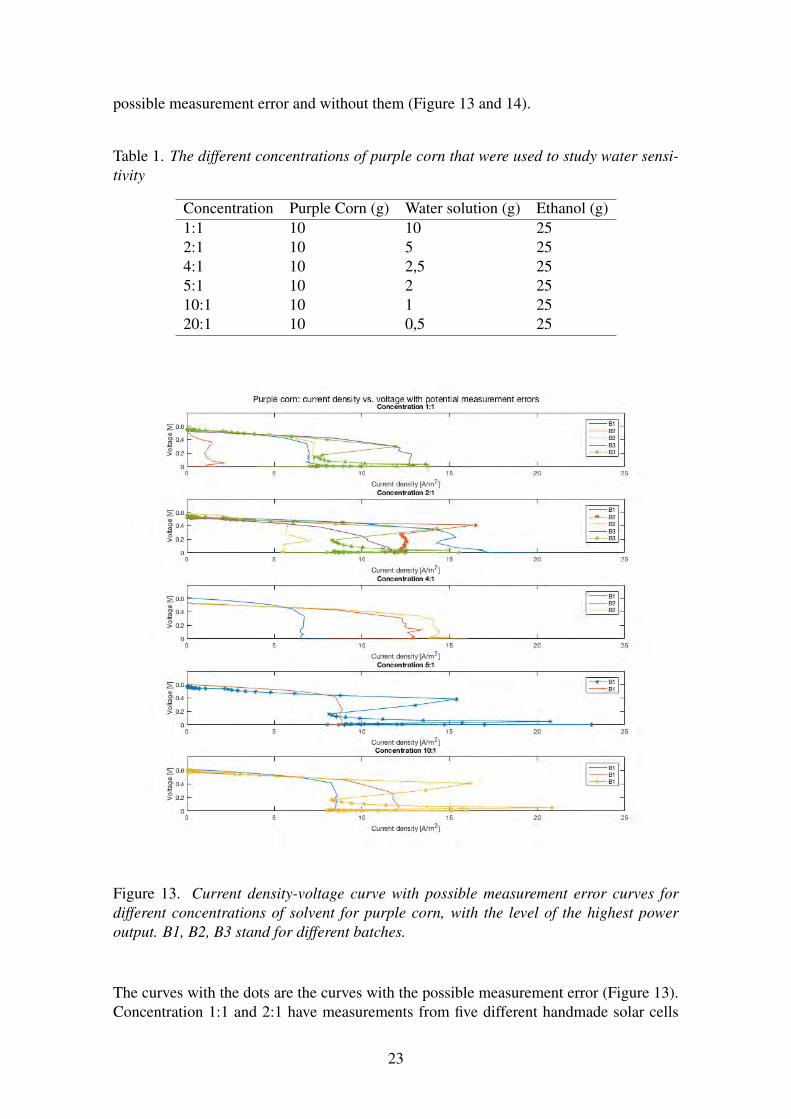
Table 1. The different concentrations of purple corn that were used to study water sensi-tivity
Concentration Purple Corn (g) Water solution (g) Ethanol (g)1:1 10 10 252:1 10 5 254:1 10 2,5 255:1 10 2 2510:1 10 1 2520:1 10 0,5 25
Figure 13. Current density-voltage curve with possible measurement error curves fordifferent concentrations of solvent for purple corn, with the level of the highest poweroutput. B1, B2, B3 stand for different batches.
The curves with the dots are the curves with the possible measurement error (Figure 13).Concentration 1:1 and 2:1 have measurements from five different handmade solar cells
23

from three different batches. Concentration 4:1 has measurements from three differenthandmade solar cells from two different batches. Concentration 5:1 has measurementsfrom two different handmade solar cells from only one batch. Concentration 10:1 hasthree different handmade solar cells from only one batch as well (Figure 13). Without thepossible measurement error has 1:1 four different curves, 2:1 and 4:1 have three, 5:1 hasonly one and 10:1 has measurement from two different handmade solar cells (Figure 14).
Figure 14. Current density-voltage curve without possible measurement error curves fordifferent concentrations of solvent for purple corn, with the level of the highest poweroutput. B1, B2 and B3 are different batches.
The current density-output power curves for the different concentrations are presentedwith and without possible measurement error (Figure 15 and 16).
24

Figure 15. Current density-output power curve with possible measurement error curvesfor different concentrations of solvent for purple corn. The maximal output power ispresented for each concentration.
The maximal output power for the concentrations 1:1, 2:1, 4:1, 5:1 and 10:1 are 3.530 W,8.793 W, 4.520 W, 5.995 W and 5.535 W respectively (Figure 15).
25

Figure 16. Current density-output power curve without possible measurement errorcurves for different concentrations of solvent for purple corn.
The maximal output power for the concentrations 1:1, 2:1, 4:1, 5:1 and 10:1 are now 3.580W, 4.549 W, 4.520 W, 3.580 W and 4.124 W respectively (Figure 16). The relationshipbetween the maximal output power and the different concentrations using a LED lampand using an overhead are illustrated (Figure 17, Figure 18).
26

Figure 17. (Left) Maximum power output for in relation to solvent concentration and(right) maximum power output per solvent concentration with fitted curve for LED mea-surements on purple corn.
With the results from LED measurements the purple corn is not sensitive to the amountof water solution. The fitted curve has the gradient -0.0076 (Figure 17).
Figure 18. (Left) Maximum power output for in relation to solvent concentration and(right) maximum power output per solvent concentration with fitted curve for overheadmeasurements on purple corn.
The measurements from the LED lamp show that purple corn is not sensitive to changesof the amount of water in the solution and the measurements from the halogen lamp showthe same. The fitted curve has the gradient 0.027 (Figure 18).
27
4.1.2 Sensitivity to Amount of Purple Corn
The concentrations with different amount of purple corn were studied to analyze if purplecorn is sensitive to the amount of purple corn in the solution (Table 2).
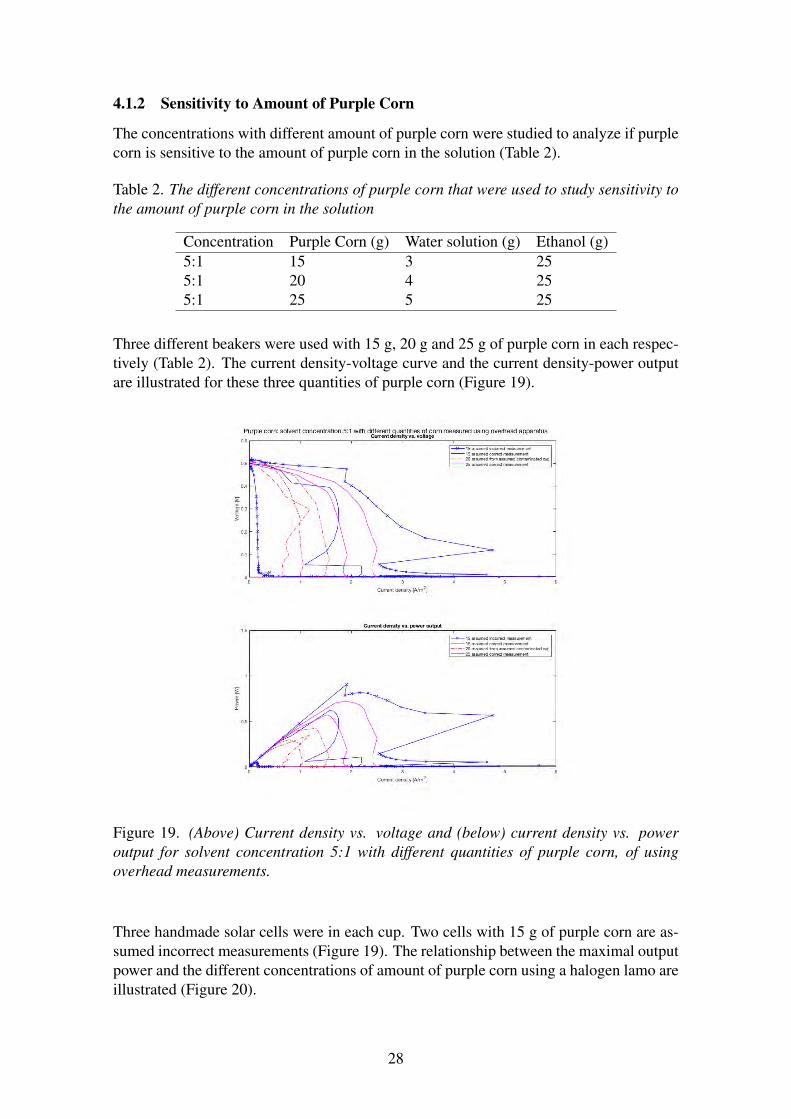
Table 2. The different concentrations of purple corn that were used to study sensitivity tothe amount of purple corn in the solution
Concentration Purple Corn (g) Water solution (g) Ethanol (g)5:1 15 3 255:1 20 4 255:1 25 5 25
Three different beakers were used with 15 g, 20 g and 25 g of purple corn in each respec-tively (Table 2). The current density-voltage curve and the current density-power outputare illustrated for these three quantities of purple corn (Figure 19).
Figure 19. (Above) Current density vs. voltage and (below) current density vs. poweroutput for solvent concentration 5:1 with different quantities of purple corn, of usingoverhead measurements.
Three handmade solar cells were in each cup. Two cells with 15 g of purple corn are as-sumed incorrect measurements (Figure 19). The relationship between the maximal outputpower and the different concentrations of amount of purple corn using a halogen lamo areillustrated (Figure 20).
28
m
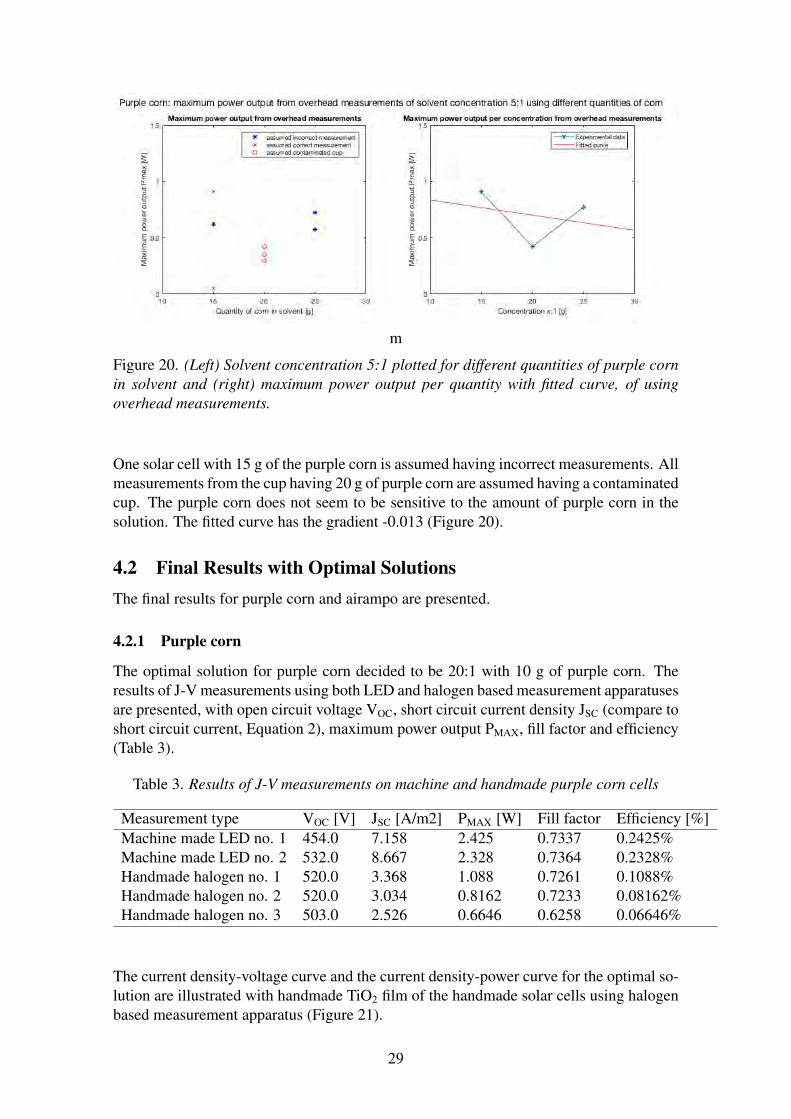
Figure 20. (Left) Solvent concentration 5:1 plotted for different quantities of purple cornin solvent and (right) maximum power output per quantity with fitted curve, of usingoverhead measurements.
One solar cell with 15 g of the purple corn is assumed having incorrect measurements. Allmeasurements from the cup having 20 g of purple corn are assumed having a contaminatedcup. The purple corn does not seem to be sensitive to the amount of purple corn in thesolution. The fitted curve has the gradient -0.013 (Figure 20).
4.2 Final Results with Optimal SolutionsThe final results for purple corn and airampo are presented.
4.2.1 Purple corn
The optimal solution for purple corn decided to be 20:1 with 10 g of purple corn. Theresults of J-V measurements using both LED and halogen based measurement apparatusesare presented, with open circuit voltage VOC, short circuit current density JSC (compare toshort circuit current, Equation 2), maximum power output PMAX, fill factor and efficiency(Table 3).
Table 3. Results of J-V measurements on machine and handmade purple corn cells
Measurement type VOC [V] JSC [A/m2] PMAX [W] Fill factor Efficiency [%]Machine made LED no. 1 454.0 7.158 2.425 0.7337 0.2425%Machine made LED no. 2 532.0 8.667 2.328 0.7364 0.2328%Handmade halogen no. 1 520.0 3.368 1.088 0.7261 0.1088%Handmade halogen no. 2 520.0 3.034 0.8162 0.7233 0.08162%Handmade halogen no. 3 503.0 2.526 0.6646 0.6258 0.06646%
The current density-voltage curve and the current density-power curve for the optimal so-lution are illustrated with handmade TiO2 film of the handmade solar cells using halogenbased measurement apparatus (Figure 21).
29

Figure 21. (Above) current density-voltage curve and (below) current density-powercurve for solvent concentration 20:1 for purple corn of using overhead measurementswith handmade TiO2 film for the solar cells.
The curves have 0.53 V, 3.4 A/m2 and 1.2 W as the highest values with handmade TiO2
film to the handmade solar cells using halogen measurements (Figure 21). The currentdensity-voltage curve and the current density-power curve for the optimal solution usingLED measurements with machine made FTO-glasses with TiO2 film for handmade solarcells are presented (Figure 22).
30
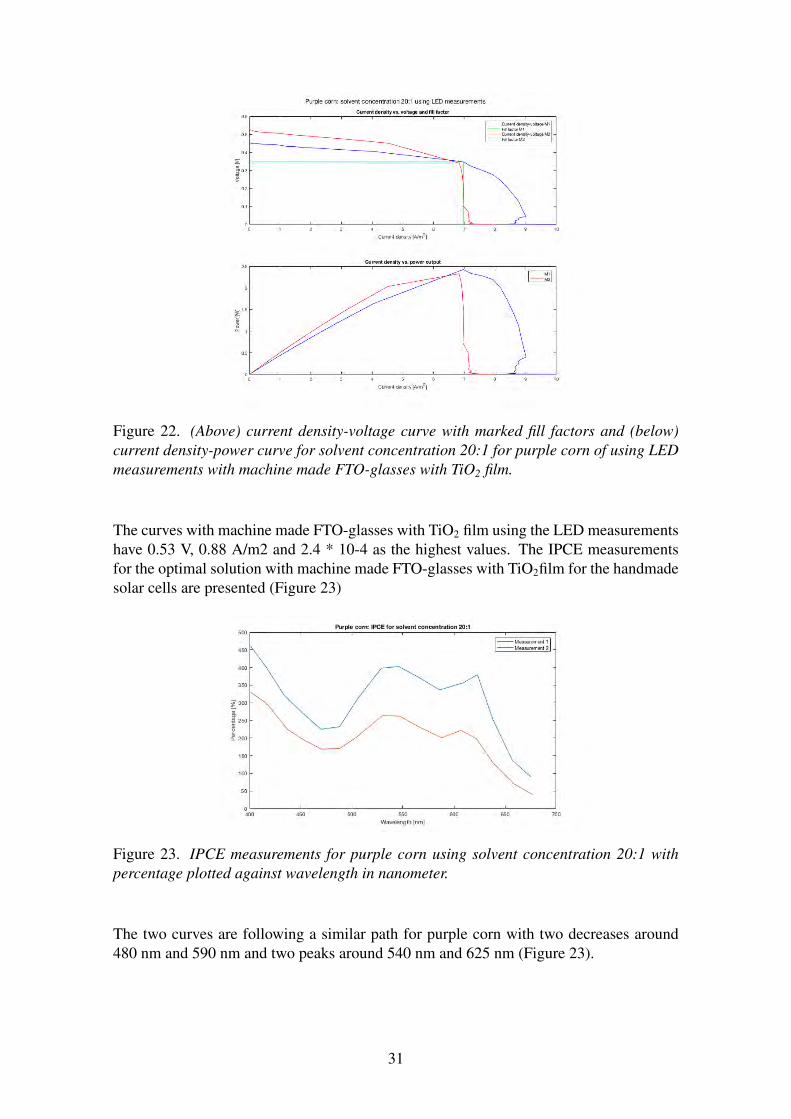
Figure 22. (Above) current density-voltage curve with marked fill factors and (below)current density-power curve for solvent concentration 20:1 for purple corn of using LEDmeasurements with machine made FTO-glasses with TiO2 film.
The curves with machine made FTO-glasses with TiO2 film using the LED measurementshave 0.53 V, 0.88 A/m2 and 2.4 * 10-4 as the highest values. The IPCE measurementsfor the optimal solution with machine made FTO-glasses with TiO2film for the handmadesolar cells are presented (Figure 23)
Figure 23. IPCE measurements for purple corn using solvent concentration 20:1 withpercentage plotted against wavelength in nanometer.
The two curves are following a similar path for purple corn with two decreases around480 nm and 590 nm and two peaks around 540 nm and 625 nm (Figure 23).
31
4.2.2 Airampo
The optimal solution for airampo is 1:1:5 with seeds from airampo, distilled water andethanol. The results of J-V measurements on handmade cells using the LED based mea-surement apparatus are presented, with open circuit voltage VOC, short circuit currentdensity JSC, maximum power output PMAX, fill factor and efficiency (Table 4).
Table 4. Results of J-V measurements on handmade airampo cells
Measurement type VOC [V] JSC [A/m2] PMAX [W] Fill factor Efficiency [%]LED no. 1 550.0 1.795 0.6127 0.7270 0.06127%LED no. 2 477.0 1.949 0.5646 0.7246 0.05646%LED no. 3 451.0 1.079 0.2711 0.6982 0.02711%
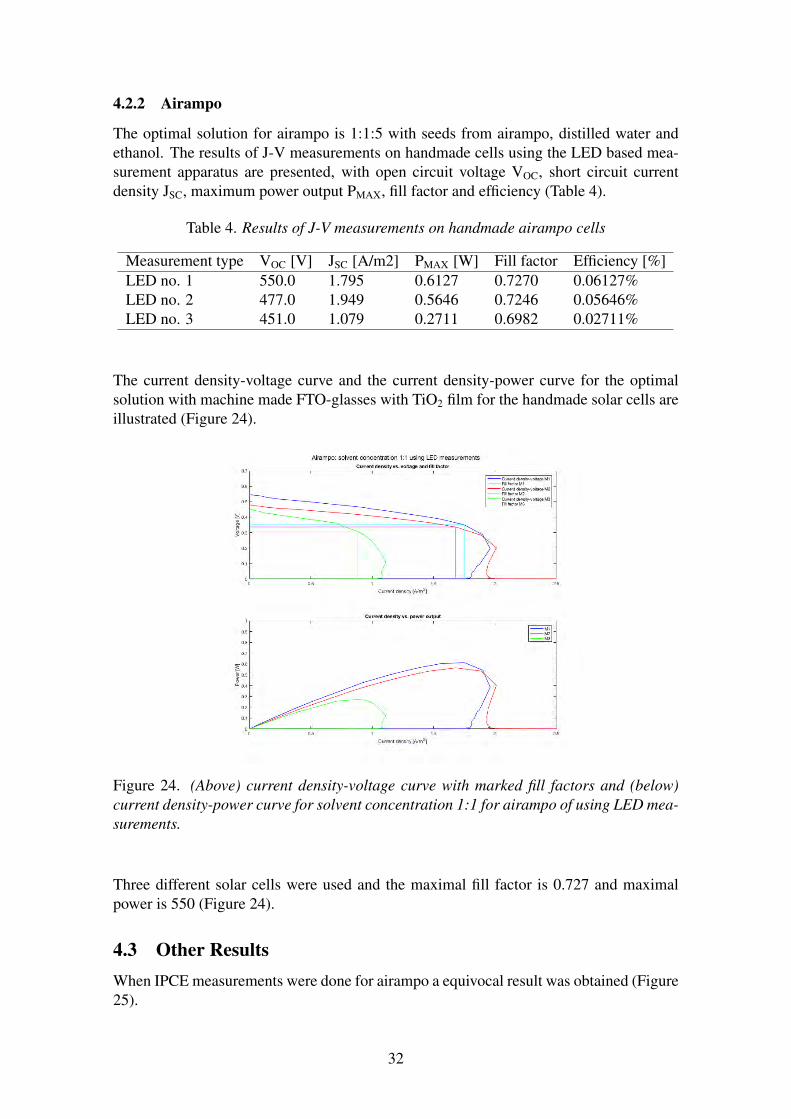
The current density-voltage curve and the current density-power curve for the optimalsolution with machine made FTO-glasses with TiO2 film for the handmade solar cells areillustrated (Figure 24).
Figure 24. (Above) current density-voltage curve with marked fill factors and (below)current density-power curve for solvent concentration 1:1 for airampo of using LED mea-surements.
Three different solar cells were used and the maximal fill factor is 0.727 and maximalpower is 550 (Figure 24).
4.3 Other ResultsWhen IPCE measurements were done for airampo a equivocal result was obtained (Figure25).
32

Figure 25. IPCE measurements for airampo using solvent concentration 1:1 with per-centage plotted against wavelength in nanometer.
The two curves do not follow each other and show opposite behaviour for higher wave-lengths (Figure 25).
5 DiscussionThe analysis about how well purple corn and airampo are fitted to use as photosensitizersare discussed in this section.
5.1 Purple CornThe results show that purple corn works as photosensitizer for DSSCs.
5.1.1 Finding Optimal Concentration
The optimal concentration for purple corn as a dye for DSSCs was decided to be 20:1 (20g purple corn to 1 g of water). The results from LED versus halogen based measurementsdid not coincide. The LED based measurements showed a peak in efficiency in the con-centration range 2:1 to 4:1, with a slight decline in efficiency for the higher concentration10:1 (Figure 17). The halogen based measurements showed an opposite relationship, withthe higher efficiency for concentration 20:1, compared to the lower concentration 5:1 and10:1 (Figure 18). Since the spectrum of the halogen measurement apparatus is more sim-ilar to that of the sun with greater accuracy than the LED based ditto, the results from thehalogen measurement were considered more accurate and 20:1 was chosen as the optimalsolution for dye with purple corn.
Investigations into whether dyes with purple corn are sensitive to the quantity of pur-ple corn and water in the solvent showed a negative relationship (Figure 19). Since few
33

data points were recorded and one of the batches of dye for the cells showed signes ofbeing defect, further research would be needed to establish this. If the suspected defectdye batch was not taken into consideration, the relationship would be almost neutral, im-plying no sensitivity to quantity of seed and water for dyes with purple corn. The quantity10 g of purple corn to 0.5 g of water was therefore chosen as the optimal quantity.
5.1.2 J-V Curve, Efficiency and Fill Factor
The obtained efficiencies, in the range 0.2328-0.2425% for LED based measurements and0.06646-0.1088% for halogen based measurements, are very low. This could in part bedue to low JSC, in the range 7.158-8.667 A/m2 for LED based measurements and 2.526-3.368 A/m2 for halogen based measurements (Table 3), which in turn could be caused byevaporation of the cells’ electrolyte since the cells are open.
The obtained VOC for the DSSCs was also low, ranging 454.0-532.0 for all measure-ments (Table 3). This could be caused in part by the manufacturing technique of the cells,especially the doctor blading but also due to the reuse of FTO-glasses which reduces theglasses conductivity. Worth noting is that where both the efficiencies and JSC differ signif-icantly for LED versus halogen based measurements, the VOC are similar. The fill factorfor the measured DSSCs were mostly in the range 0.7233-0.7364, with one exception of0.6646. The fill factors were without any significant difference between LED and halogenbased measurements. Fill factors in this range are common for DSSCs.
5.1.3 IPCE
The IPCE measurements of dye concentration 20:1 of purple corn gave results that werestrangely high (Figure 23). It is very unlikely that the IPCE for the measured cells actuallyexceeded 450%, and it is probable that measurement errors contributed to the high per-centage. Considering the equation for IPCE 5, it seems likely that the JSC was recorded ashigher than its actual value, or the PIN was recorded as lower than its actual value. This isdiscussed further in 5.4.9 Improbable High IPCE Results. The IPCE results for airampodye also show improbable high results for short wavelenghths (Figure 25), but then con-tine to diverge (measurement 1) and converge to zero (measurement 2). The divergenceand convergence to zero indicate faulty results, but the high IPCE for wavelengths around400 nm shows that the measurement technique gives errors in the obtained data.
Apart from the unlikely high IPCE the curves has two coinciding dips, a major dip around475 nm and smaller dip around 580 nm. The reduction of IPCE at 475 nm shows surfacerecombination in the DSSCs, and the dip around 580 nm could be an indicator of activityin the bulk, such as short diffusion lengths.
5.2 AirampoThe results show that airampo works as photosensitizer for DSSCs.
5.2.1 Optimal Concentration
The optimal concentration for the dye with airampo was chosen to be 1:1 (1 g airampoto 1 g of water), based on previous research from the Thin Films Group at UNI (Nazario
34

Ticse, 2017).
5.2.2 J-V Curve, Efficiency and Fill Factor
Two of three measured J-V curves for airampo are following a similar pattern, wherasthe third curve shows significantly lower values (Figure 24). There is therefore reason topresume that the cell corresponding to the third, lower, curve was somehow faulty. Thiscould be becuase of resued FTO-glasses or defects in the dye. The two measurements thatare assumed correct has efficiencies of 0.06127 and 0.05646% respectivly, and the pre-sumed faulty measurement 0.02711%. These efficiencies are all very low, and are causedby very low JSC, with 1.795 and 1.949 A/m2 for the presumed correct measurements, and1.079 A/m2 for the presumed faulty measurement. Just as in the case of purple corn, thiscould be caused by the cells being open and electrolyte evaoprating during the measure-ment process since DSSCs dyed with airampo also showed VOCs that were in a low butacceptable range of 451.0-550.0 V (Table 4). The VOC could, just as in the case of purplecorn, be affected by the doctor blading of the cells as well as of the resuse of FTO-glasses,giving reduced conductivity. The fill factors for the measured DSSCs were in the range0.6982-0.7270, and thus lie within the common range for DSSCs’ fill factors.
5.2.3 IPCE
The IPCE measurements of DSSCs dyed with airampo showed faulty results (Figure 25).The two measurements did show a correlation in the range 400-450 nm, but did not in therange 450-700 nm. For higher wavelengths, measurement 1 seems to diverge to infinityand measurement 2 converges to zero. Despite of the IPCE being high for both of themeasurements, this is probably a result of errors in the measurement technique as can beseen when comparing to the IPCE results of DSSCs dyed with purple corn. It is thereforesafe to assume that the accurate IPCE of the two measurements are significantly lowerthan the obtained results.
Both the measurements show an intital decline, which ends at around 475 nm. Thiscould indicate recombination effects in the cells’ surface. For wavelengths higher thanthis, the curves seize to coincide. Both the divergence of measurement 1 and the conver-gence of measurement 2 are probable to be results of defective DSSCs, since the samemeasurement technique resulted in coinciding curves for purple corn. The voltage ofmeasurement 1 increased significantly slower compared to other samples after the mea-surement apparatus was turned on and the cell exposed to light. This could be because ofdefect FTO-glasses used in the cell, as well as defect dying process. The converging curveof measurement 2 could be a result of reused FTO-glasses, unable to conduct properly forlonger wavelengths with lower energies.
Due to time restrictions of the project, the measurements could not be redone.
5.3 Comparing Purple Corn and AirampoIf comparing LED based measurement results, DSSCs dyed with purple corn and DSSCsdyed with airampo had similar VOC and fill factors, but DSSCs dyed with purple cornshowed significantly higher JSC and thus efficiency. Therefore the results suggest thatpurple corn is a preferred photosensitizer for DSSCs compared to airampo. Due to low
35

values even for DSSCs dyed with purple corn, it is unclear if the dye is fit for use outsidea laboratory. Since the solar constant is higher than the intensities used for measurementsslightly higher efficiencies could be expected, but the efficiencies remain very low. Be-cause of suspected measurement errors the J-V measurements could have ended up lowerthan their actual values, and further research on both dyes are therefore suggested.
5.4 Sources of Errors in Manufacturing and MeasurementsThere is reason to believe that error sources in the manufacturing process and measure-ment equipment affected the measurements.
5.4.1 Washing of FTO-glasses
The FTO-glasses used for conduction in the DSSCs were reused and cleaned each timethe cells were manufactured. The cleaning process impacted the FTO-glasses conductionability, potentially reducing their conductivity for each wash. The reduction in conductiv-ity was not of the same magnitude for each FTO-glass for every cleaning, meaning somecells went through the process with a maintained conductivity and some did not. If a glasshad lost all conductivity this was noted and the glass discarded since this made DSSCsnon-functioning during measurements, but otherwise it was not possible to know if theglass had reduced conductivity due to cleaning and how this affected the measurementson the finished DSSCs. There is therefore reason to believe that the later measurements -those of the optimal solutions - can have been lower due to lessened conductivity of theFTO-glasses compared to earlier measurements.
5.4.2 Different Results for Different Batches of Dye
The performance of DSSCs seem to be affected by which batch of dye they were dyed in,even if the dye and concentration were the same. The first batch of purple corn using con-centration 4:1 for finding the optimal concentration show significantly lower performancecompared to the second batch of the same concentration (Figure 14). When investigatingif purple corn dye was amount sensitive, the cells dyed in dyes with 20 g purple cornhad a lower performance compared to those dyed in dyes with 15 g and 25 g purple corn(Figure 19). This could be caused by a fault in the dye batch, since dyes with purple corndoes not seem to have amount sensitive behavior seeing that the 15 g and 25 g purple corndyes performed similarly.
5.4.3 Unevenness in TiO2 Film Caused by Doctor Blading
Doctor blading can cause unevenness in the TiO2 film, which can affect the performanceof the finished DSSCs. Scratches and impurities can also be introduced to the film throughdoctor blading, further increasing the risk of affecting the performance of the DSSCs.
5.4.4 Unknown Manufacturing Technique for Machine Made Cells
The manufacturing technique for the machine made cells is unknown, other than that theywere manufactured at Uppsala University using a manufacturing machine. This gives thatthey can have defects affecting the measurement results in unknown ways.
36

5.4.5 Spectrum and Intensity of J-V Measurements
The spectrum of the LED based and the halogen based measurement apparatuses are un-known, and it is unlikely that they match the solar spectrum (Figure 2), since the lightgeneration processes differ greatly. This will affect the measurements, seeing that theDSSCs might absorb the solar light to a greater or lesser extent than the investigated spec-trum. The intensity of both the measurement apparatuses is 1000 W/m2, where the solarconstant is 1370 W/m2. This means that the DSSCs will produce higher current densi-ties and voltages when using solar measurements compared to the used measurementsapparatuses, seeing the higher input power per area unit.
5.4.6 Spikes in J-V Curves Caused by Adjustable Resistance Box
Several DSSCs showed spikes in J-V measurements (Figure 13, Figure 19), which allwhere in the 899-699 Ω and 99-79 Ω ranges. This implies that the adjustable resistancebox used for measurements have some sort of defect in these ranges, rather than this beingaccurate measurements. Because of this, the data points in these spikes are seen as faultyresult.
5.4.7 Evaporation of Electrolyte
Since the DSSCs measured where open and paper was used to keep the electrolyte inplace, evaporation of electrolyte during the measurement process is probable. Because ofthis, there is reason to believe that the short circuit current density JSC from the measure-ments is lower than it would be if the electrolyte did not evaporate during the measure-ments.
5.4.8 Usage of Two J-V Measurement Apparatuses
The usage of two different measurement apparatuses for J-V measurements was due topracticalities, and resulted in measurement data not being able to be translated directlybetween the apparatuses. This caused difficulties in evaluation of the obtained data. Theobtained VOC were of similar size, but the JSC differed considerably (Table 3) between themeasurement apparatuses. Since a LED spectrum has steep spikes for certain wavelengthsof light, wheras a halogen lamp has a continous spectrum for visable wavelengths oflight, the different ranges of JSC for the two measurement apparatuses could be spectrumrelated. The halogen based measurements were assessed as more accurate, since previousexperiments had showed its spectrum to be closer to the Sun’s spectrum.
5.4.9 Improbable High IPCE Results
The results of the IPCE measurements came out suspiciously high. The measurements onDSSCs dyed with purple corn exceeded 450%, where DSSCs can generally be expectedto have an IPCE under 100%. The high values could be caused by light pollution fromthe room. This would give higher JSC, measured by the voltmeter, wheras the input powerread from the PC would be lower than the actual provided power (Equation 5). Regardlessof input power, the DSSCs’ IPCE would still have reductions at the same wavelengths.Because of this, the reductions in teh measurements remain valid despite the improbablehigh IPCE results.
37

5.5 Continued WorkSeveral aspects of the project’s results could be subject of continued work.
5.5.1 Optimal Concentration for Dye with Purple Corn
Because of the time restriction of the project, further investigations into the optimal so-lution for purple corn could not be conducted. Since measurements showed an increasedefficiency for increased concentration, concentrations higher than 20:1 could be investi-gated. More measurements on lower concentrations in the range 2:1 to 4:1 could also bedone, to better establish whether a higher concentration of purple corn in the dye giveshigher efficiency of the DSSC.
5.5.2 Polymer Paper
Instead of using paper to keep the electrolyte in place on the DSSCs, polymer papercould be used. Polymer paper is placed around the DSSC’s TiO2 film, and the cell isthen exposed to heat while the FTO-glass and the counter electrode are pressed together,causing the polymer paper to work as a glue between the two. This prevents the electrolytefrom evaporating during measurements or employment.
5.5.3 Closed Cells
Open cells makes for less stable cells than closed dittos, since electrolyte and dye canevaporate or be contaminated by the surroundings. Therefore further measurements onclosed cells would be advisable, since closed cells have potential to be more stable andproduce higher measurement values.
5.5.4 Electrolyte
Improvements of the electrolyte could be made. The used electrolyte could for instancehave 0.5 M of 4-tertbutylpyridine added for increased efficiency (Quintana, 2017).
5.5.5 Other Measurement Devices
Since it is not probable that J-V measurements apparatuses used has the same spectrum asthe sun, and it is known that the intensity differs, it would be advisable to do measurementswith a solar simulator as well. Measurements using a solar simulator would give animproved image of how the DSSCs would behave if employed in sunlight.
5.5.6 Further Measurements
As a complement to measuring J-V ratio and IPCE, further measurements could be doneto analyze the DSSCs behavior. Recommended measurements are FTIR for dye prop-erties, measurements in cell stability, and electron lifetime to understand recombinationeffects.
38
6 ConclusionsBoth purple corn and airampo work as photosensitizers for DSSCs. With the used methodand solvent DSSCs dyed with purple corn get higher results than DSSCs dyed withairampo for efficiency, short-circuit current density and fill factor, but not for open-circuitvoltage. This implies that purple corn is better suited as a photosensitizer for DSSCs ofthe two natural Peruvian dyes.
The optimal solution for purple corn as a dye for DSSCs is 20:1, with 20 g purple corn to1 g water, along with 25 g ethanol. Dyes with purple corn showed a negative relationshipregarding quantity of seed and water in the solvent in relation to efficiency.
The fill factors for DSSCs dyed with the two dyes are within the range of what can beexpected from DSSCs, but the rest of the measured values are not. Current-density mea-surement results were low or very low, and IPCE suspiciously high. This could in part bedue to the respective dyes unsuitability as a photosensitizer for DSSCs, but also to severalpotential measurement errors resulting in inacurate measurement data. Further researchinto purple corn and airampo as photosensitizer for DSSCs could confirm or deny this,and would be desirable before any larger scale of use of either dye.
The open-circuit voltages were low for both dyes, and the short-circuit current densitieswere very low. This resulted in very low efficiencies. The current densities and effi-ciencies were particularily low for DSSCs dyed with airampo, where DSSCs dyed withpurple corn gave more than four times the short-circuit current density compared to thesame dyed with airampo. The open-circuit voltages were in the same range for both dyes,with airampo producing slightly higher results at max. Also the fill factors for the twodyes were in the same range.
The results of the IPCE measurements of DSSCs dyed with purple corn were suspiciouslyhigh. This was most likely due to measurement errors. They showed surface recombina-tion in the cells, as well as indications of short diffusion lengths in the bulk. The IPCEmeasurements of airampo came out unclear, and could not be interpereted.
39

References
A Dictionary of Biology (2004). Betacyanin. [http://www.encyclopedia.com/science/dictionaries-thesauruses-pictures-and-press-releases/betacyanin] read 2017-03-24
Anderson Rivera Tito, H., MSc. Dr. Faculty of Science, Universidad National de Inge-nieria. [email protected]. Interviews 2017-02.
Boyd, J. (2017). Efficiency of Silicon Solar Cells Climps. [http://spectrum.ieee.org/energywise/energy/renewables/efficiency-of-solar-cells-continues-to-climb?utm_source=Tech+Alert&utm_medium=Email&utm_campaign=TechAlert_03-23-17&bt_ee=cV/Nehsd80Y8ZxsGqYCdHnFDCgrmObHZJAdF5cORwdU=&bt_ts=1490282585434] read 2017-04-06
Caldas-Cueva, J.P., Morales, P., Ludena, F., Betalleluz-Pallardel, I., Chirinos, R., Noratto,G., Campos, D. (2015). Stability of Betacyanin Pigments and Antioxidants in Ayrampo(Opuntia Soehrensii Britton and Rose) Seed Extracts and as a Yogurt Natural Colorant.Journal of Food Processing and Preservation ISSN 1745-4549
Elert, G. (2017). Electric Current. [http://physics.info/electric-current/] read 2017-03-12
Encyclopædia Britannica (2017). Charge Carriers. [https://global.britannica.com/science/charge-carrier] read 2017-03-17
Energy (2013). Solar Photovotaic Cell Basics. [https://energy.gov/eere/energybasics/articles/solar-photovoltaic-cell-basics] read 2017-04-06
Florida Solar Energy Center (2014). History of Photovoltaics. [http://www.fsec.ucf.edu/en/consumer/solar_electricity/basics/history_of_pv.htm] read 2017-02-15
Fraas, L. M. (2014). Low-Cost Solar Electric Power. Springer International Publishing.ISBN: 978-3-319-07530-3
Gcell (2017a). Dye Sensitized Solar Cells. [http://gcell.com/dye-sensitized-solar-cells]read 2017-04-18
Gcell (2017b). Efficiency of DSSC. [http://gcell.com/dye-sensitized-solar-cells/advantages-of-dscc/efficiency] read 2017-04-06
Hagfeldt, A., Boschloo, G., Sun, L., Kloo, L., Pettersson, H. (2010).Dye-Sensitized SolarCells. Chem. Rev. 110, 6595-6663.
Hug, H., Bader, M., Mair, P., Glatzel, T. (2013). Biophotovoltaics: Natural pigments indye-sensitized solar cells. Switzerland: Elsevier. [http://www.sciencedirect.com/science/article/pii/S0306261913008854] read 2017-04-20
Hyper Physics (2017). DC Electric Power. [http://hyperphysics.phy-astr.gsu.edu/hbase/electric/elepow.html] read 2017-03-12
40

Jacoby, M. (2016). The future of low-cost solar cells. [http://cen.acs.org/articles/94/i18/future-low-cost-solar-cells.html] read 2017-04-18
Johansson E. M. J. Senior lecturer, Inst. for Chemistry, Uppsala University. [email protected] 2016-12-05.
Lalander, C. (2009). A comparative study between the organic sensitizers D6 and D5 forsolar device application. Stockholm: The Royal Institute of Technology. Physical Chem-istry
Madigan, J. (2017). What Wavelength Goes With a Color?. [https://science-edu.larc.nasa.gov/EDDOCS/Wavelengths_for_Colors.html] read 2017-02-10
Mills, I., Milton, M. (2009). Amount of Substance and the Mole. [https://www.iupac.org/publications/ci/2009/3102/1_mills.html] read 2017-03-24
Nasa Science (2017). Sun: In Depth. [http://solarsystem.nasa.gov/planets/sun/indepth]read 2017-03-13
Nasa Science Beta (2003). The Inconstant Sun. [https://science.nasa.gov/science-news/science-at-nasa/2003/17jan_solcon/] read 2017-03-13
Nazario Ticse, R., MSc student, Dr., Faculty of Science, Universidad National de Inge-nieria. [email protected]. Interviews 2017-02.
Peru Delights (2013). Maíz Morado - Purple Corn. [http://perudelights.com/maiz-morado-purple-corn/] read 2017-03-24
PVeducation (2017a). Diffusion Length. [http://pveducation.org/pvcdrom/diffusion-length]read 2017-02-15
PVeducation (2017b). Recombination Losses. [http://pveducation.org/pvcdrom/design/recombination-losses] read 2017-03-17
PVeducation (2017c). Quantum Efficiency. [http://www.pveducation.org/pvcdrom/quantum-efficiency] read 2017-02-10
Quintana, M. Prof. Dr., Faculty of Science, Unicersidad National de Ingenieria. [email protected]. Interviews 2017-02.
Schölin, R., Quintana, M., Johansson, E. M. J., Hahlin, M., Marinado, T., Hagfeldt, A.,Rensmo, H. (2011). Preventing Dye Aggregation on ZnO by Adding Water in the Dye-Sensitization Process. The Journal of Physical Chemistry
41

Sigma-Aldrich (2017). Mass Molarity Calculator. [http://www.sigmaaldrich.com/chemistry/stockroom-reagents/learning-center/technical-library/mass-molarity-calculator.html] read 2017-03-24
Soga, T. (2006). Nanostructured Materials for Solar Energy Conversion. Oxford: Else-vier B.V. ISBN-13: 978-0-444-52844-5
Solar Energy (2016). Solar Panel Efficiency and Lifespan. [http://solarenergyforus.com/solar-panel-efficiency-lifespan/] read 2017-04-20
Stauffer, N. W. (2015). Study Assesses solar photovoltaic Technologies. [http://news.mit.edu/2015/solar-photovoltaic-technologies-1216] read 2017-04-06
Stern, D. P. (2006). The Energy of the Sun. [https://www-istp.gsfc.nasa.gov/stargaze/Sun7enrg.htm]read 2017-04-18
The Guardian (2017). Electric cars and cheap solar ’could halt fossil fuel growth by2020’. [https://www.theguardian.com/environment/2017/feb/02/electric-cars-cheap-solar-power-halt-fossil-fuel-growth-2020] read 2017-02-02
Tupta, M. A. (2017). I-V characterization of solar cells and panels using a source-measure unit. [https://www.evaluationengineering.com/v-characterization-solar-cells-panels-using-source-measure-unit] read 2017-03-12
United Nations Framework Convention on Climate Change (2017). Summary of the Parisagreement. [http://bigpicture.unfccc.int/#content-the-paris-agreemen] read 2017-04-18
U.S. Department of Energy (2001) The History of Solar. [https://www1.eere.energy.gov/solar/pdfs/solar_timeline.pdf] read 2017-03-13
U.S. Energy Information Administration (2017). International Energy Outlook 2017.[http://www.eia.gov/outlooks/aeo/data/browser/#/?id=1-IEO2016&sourcekey=0] read 2017-03-13
Williams, D. R. (2016). Sun Fact Sheet. [http://nssdc.gsfc.nasa.gov/planetary/factsheet/sunfact.html]read 2017-03-13
Zimmermann, E., Ehrenreich, P., Pfadler, T., Dorman, J. A., Weickert, J., Schmidt-Mende,L. (2014). Erroneous efficiency reports harm organic solar cell research. Nature Photon-ics. 8, 669-672.
42

AppendicesA Measurement ApparatusesPhotographs of the measurement apparatuses used for the project are presented.
A photograph of the LED based J-V measurement apparatus can be seen (Figure 26).
Figure 26. Photograph of measurement apparatus for J-V measurements of DSSCs usinga LED as a light source, at the Faculty of Science, Universidad Nacional de Ingeniería.
A photograph of the halogen based J-V measurement apparatus can be seen (Figure 27).
A photograph of the IPCE measurement apparatus can be seen (Figure 28).
43

Figure 27. Photograph of measurement apparatus for J-V measurements of DSSCs usingan oat the Faculty of Science, Universidad Nacional de Ingeniería.
Figure 28. Photograph of measurement apparatus for ICPE measurements of DSSCs, atthe Faculty of Science, Universidad Nacional de Ingeniería.
44