Dye tracer and morphophysical properties to observe water ... · Dye tracer and morphophysical...
7
160 Sci. Agric. (Piracicaba, Braz.), v.68, n.2, p.160-166, March/April 2011 Dye tracer and morphophysical properties to observe water flow in a Gleyic Luvisol Monica Martins Silva Salvador 1 ; Sigrid Köhne 2 ; John Maximilian Köhne 3 ; Bernd Lennartz 4 ; Paulo Leonel Libardi 5 * 1 USP/ESALQ – Programa de Pós-Graduação em Física do Ambiente Agrícola 2 Martin-Luther – Universität Halle-Wittenberg, ZUV A6.1, Universitätsplatz 10 - 06099 -Halle (Saale), Germany. 3 Helmholtz Centre for Environmental Research – Dept. of Soil Physics – UFZ, Theodor-Lieser-Strasse 4 – D 06120 – Halle, Germany. 4 University of Rostock – Faculty for Agricultural and Environmental Sciences Inst. for Land Use, Justus-von- Liebig – Weg 6, 18044 Rostock, Germany. 5 USP/ESALQ – Depto. de Engenharia de Biossistemas, C.P. 09 – 13418-900 – Piracicaba, SP – Brasil. *Corresponding author <[email protected]> ABSTRACT: The understanding of the preferential water flow and solute transport is important with regard to losses of nutrients and pesticides that affect the quality of the groundwater or surface water resources. Experiments using the brilliant blue dye tracer, a tension infiltrometer (TI) and a double square infiltrometer (DI) were carried out in the experimental field site located around 15 km southeast of the city of Rostock (North-Eastern Germany) on arable land in a Pleistocene lowland landscape where corn (Zea mays L.) and barley (Hordeum spp.) had been cultivated. One day after dye the infiltration, a pit was dug and vertical profiles were prepared in the TI and DI sites to assess the dye pathways in the subsoil of a Gleyic Luvisol. We wanted to examine if the mottled red and white (bleached) colour-pattern of the Gleyic Luvisol subsoil resulting from temporally stagnant water could be related to flow paths as visualized by dye tracing and if the soil colour could be related to other physical soil properties. Biogenic soil structures were the main transport routes conducting water and solutes into great depth in short time. These pathways had lower bulk density and less cone resistance than the adjacent red or white (bleached) areas of the Gleyic Luvisol subsoil. The red areas were involved in transport because their water contents increased after as compared to before infiltration. However, the measured physical soil properties did not differ between white and red areas. We assume that red areas participate in transport at least by imbibing water from the adjacent biogenic flow paths. Key words: soil water content, bulk density, cone resistance Fluxo de água em um Gleyic Luvisol usando traçador e sua relação com as propriedades físicas e morfológicas do solo RESUMO: O fluxo preferencial de água e o transporte de solutos relacionam-se com perdas de nutrientes e pesticidas e afetam a qualidade de águas subterrâneas. Foram realizados experimentos utilizando o traçador Brilhante Blue, um infiltrômetro de tensão (TI) e um infiltrômetro com “duplos quadrados” (DI) num campo experimental localizado a cerca de 15 km a sudeste da cidade de Rostock (nordeste da Alemanha) num solo onde cultiva-se milho (Zea mays L.) e cevada (Hordeum spp.). Um dia após a infiltração do traçador, perfis de solo foram escavados no local do TI e do DI para observar o fluxo da água deixado pelo do traçador no solo. O objetivo era verificar se os mosqueados vermelhos e partes esbranquiçadas cor-padrão do subsolo do Gleyic Luvisol, resultante da água estagnada temporariamente, poderia estar relacionada ao fluxo da água visualizados pelo traçador e se a cor do solo poderia estar relacionada a outras propriedades físicas do solo. A estrutura biogênica do solo foi a principal rota de transporte conduzindo água e solutos em profundidade e em menor tempo. Esses caminhos tiveram menor densidade do solo e menor resistência do que as áreas vermelhas e esbranquiçadas adjacentes do subsolo do Gleyic Luvisol. Áreas vermelhas foram relacionadas com o transporte devido apresentarem maior conteúdo de água após o teste de infiltração. Entretanto, não houve diferenças entre as propriedades físicas do solo das áreas brancas e vermelhas. Assumiu-se que as áreas vermelhas participaram do transporte de água porque absorveram água do fluxo adjacente, ou seja, dos bioporos. Palavras-chave: umidade do solo, densidade do solo, resistência Introduction The understanding of the preferential water flow and solute transport is important with regard to losses of nutrients and pesticides that affect the quality of the groundwater or surface water resources. The groundwater constitutes a critical water supply com- ponent for many sectors, including agricultural use, when considered a clean water resource (Persson et al., 2005).
Transcript of Dye tracer and morphophysical properties to observe water ... · Dye tracer and morphophysical...
Salvador et al.160
Sci. Agric. (Piracicaba, Braz.), v.68, n.2, p.160-166, March/April 2011
Dye tracer and morphophysical properties to observewater flow in a Gleyic Luvisol
Monica Martins Silva Salvador1; Sigrid Köhne2; John Maximilian Köhne3; Bernd Lennartz4;Paulo Leonel Libardi5*
1USP/ESALQ – Programa de Pós-Graduação em Física do Ambiente Agrícola
2Martin-Luther – Universität Halle-Wittenberg, ZUV A6.1, Universitätsplatz 10 - 06099 -Halle (Saale), Germany.
3Helmholtz Centre for Environmental Research – Dept. of Soil Physics – UFZ, Theodor-Lieser-Strasse 4 – D
06120 – Halle, Germany.4University of Rostock – Faculty for Agricultural and Environmental Sciences Inst. for Land Use, Justus-von-
Liebig – Weg 6, 18044 Rostock, Germany.5USP/ESALQ – Depto. de Engenharia de Biossistemas, C.P. 09 – 13418-900 – Piracicaba, SP – Brasil.
*Corresponding author <[email protected]>
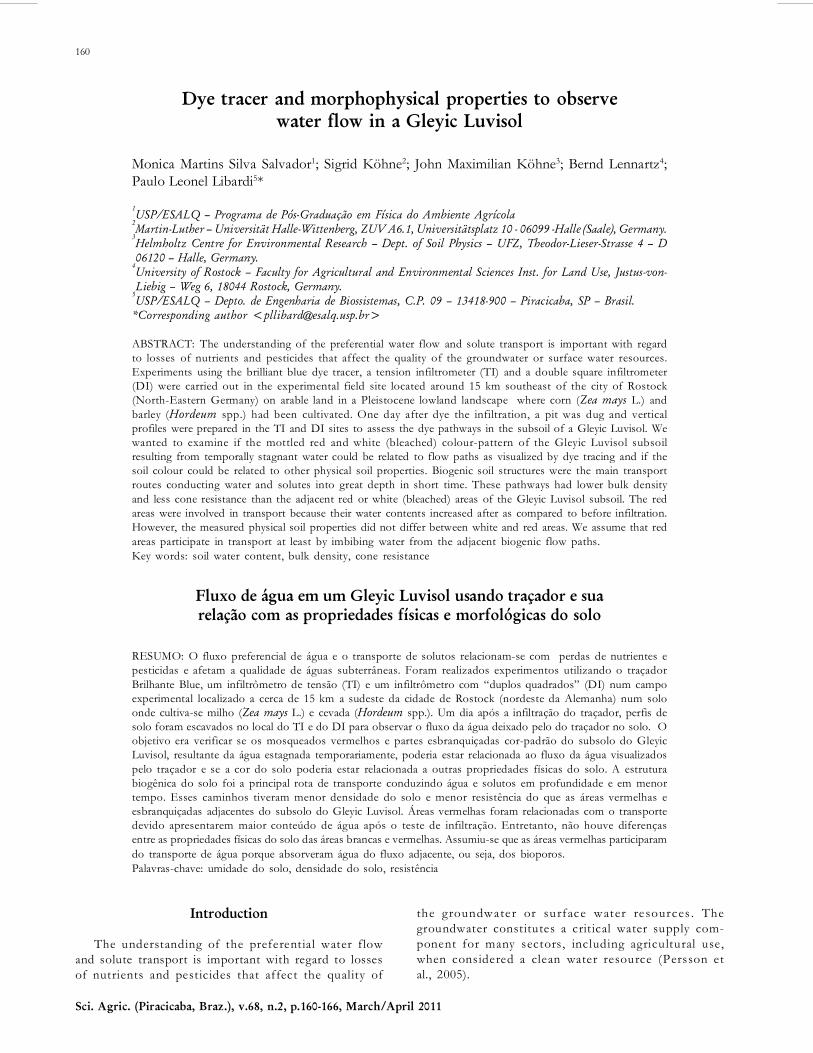
ABSTRACT: The understanding of the preferential water flow and solute transport is important with regardto losses of nutrients and pesticides that affect the quality of the groundwater or surface water resources.Experiments using the brilliant blue dye tracer, a tension infiltrometer (TI) and a double square infiltrometer(DI) were carried out in the experimental field site located around 15 km southeast of the city of Rostock(North-Eastern Germany) on arable land in a Pleistocene lowland landscape where corn (Zea mays L.) andbarley (Hordeum spp.) had been cultivated. One day after dye the infiltration, a pit was dug and verticalprofiles were prepared in the TI and DI sites to assess the dye pathways in the subsoil of a Gleyic Luvisol. Wewanted to examine if the mottled red and white (bleached) colour-pattern of the Gleyic Luvisol subsoilresulting from temporally stagnant water could be related to flow paths as visualized by dye tracing and if thesoil colour could be related to other physical soil properties. Biogenic soil structures were the main transportroutes conducting water and solutes into great depth in short time. These pathways had lower bulk densityand less cone resistance than the adjacent red or white (bleached) areas of the Gleyic Luvisol subsoil. The redareas were involved in transport because their water contents increased after as compared to before infiltration.However, the measured physical soil properties did not differ between white and red areas. We assume that redareas participate in transport at least by imbibing water from the adjacent biogenic flow paths.Key words: soil water content, bulk density, cone resistance
Fluxo de água em um Gleyic Luvisol usando traçador e suarelação com as propriedades físicas e morfológicas do solo
RESUMO: O fluxo preferencial de água e o transporte de solutos relacionam-se com perdas de nutrientes epesticidas e afetam a qualidade de águas subterrâneas. Foram realizados experimentos utilizando o traçadorBrilhante Blue, um infiltrômetro de tensão (TI) e um infiltrômetro com “duplos quadrados” (DI) num campoexperimental localizado a cerca de 15 km a sudeste da cidade de Rostock (nordeste da Alemanha) num soloonde cultiva-se milho (Zea mays L.) e cevada (Hordeum spp.). Um dia após a infiltração do traçador, perfis desolo foram escavados no local do TI e do DI para observar o fluxo da água deixado pelo do traçador no solo. Oobjetivo era verificar se os mosqueados vermelhos e partes esbranquiçadas cor-padrão do subsolo do GleyicLuvisol, resultante da água estagnada temporariamente, poderia estar relacionada ao fluxo da água visualizadospelo traçador e se a cor do solo poderia estar relacionada a outras propriedades físicas do solo. A estruturabiogênica do solo foi a principal rota de transporte conduzindo água e solutos em profundidade e em menortempo. Esses caminhos tiveram menor densidade do solo e menor resistência do que as áreas vermelhas eesbranquiçadas adjacentes do subsolo do Gleyic Luvisol. Áreas vermelhas foram relacionadas com o transportedevido apresentarem maior conteúdo de água após o teste de infiltração. Entretanto, não houve diferençasentre as propriedades físicas do solo das áreas brancas e vermelhas. Assumiu-se que as áreas vermelhas participaramdo transporte de água porque absorveram água do fluxo adjacente, ou seja, dos bioporos.Palavras-chave: umidade do solo, densidade do solo, resistência
Introduction
The understanding of the preferential water flowand solute transport is important with regard to lossesof nutrients and pesticides that affect the quality of
the groundwater or surface water resources . Thegroundwater constitutes a crit ical water supply com-ponent for many sectors, including agricultural use,when considered a clean water resource (Persson etal., 2005).
Water flow in a Gleyic Luvisol 161
Sci. Agric. (Piracicaba, Braz.), v.68, n.2, p.160-166, March/April 2011
Many investigators have tried to predict water flowand transport processes in soils with numerical simula-tion models, which need numerous input parametersfrom the soil under study. For preferential flow dual po-rosity and dual permeability models have been devel-oped including various experimental and numericalmethods to determine model parameters (Gerke and vanGenuchten, 1993). Up to now it is still difficult to deter-mine the fractions of fast and slow flowing regions insuch models. All methods to determine parameters aremore or less indirect i.e. involve destructive experimen-tation with soil samples or soil profiles. Attempts havebeen made to directly deduce information and/or modelparameters from soil morphology. However, the use ofdye tracers combined with morphological parametersof the soil and image analysis can be useful procedureto examine water flow paths.
On the basis of morphology, the structure of a porousmedium is the most important property governing themovement of water through it. Soil structure and prefer-ential flow are thought to be highly related, but quantifi-cation of this relationship has remained problematic(Vervoort et al., 1999). Preferential flow or deep penetra-tion of water into the soil profile take place throughmacropores (Gjettermann et al., 1997) and through cracksor fissures (Bouma, 1991). In this context the soil mechani-cal strength is an important soil parameter that affectsroot growth and water movement (Bradford, 1986).
Dye tracing has been used to visualize flow pathsand to stain the solutes transport behaviour, rangingfrom qualitative descriptions of water flow to the quan-titative interpretation of the associated pore types anddistributions (Beven and Germann, 1982; Flury andFlühler, 1994; Gjettermann et al., 1997; Kasteel et al.,2002; Kim et al., 2006). One major disadvantage of usingdyes to study flow paths of water is that the sampling,i.e., excavation of soil, is destructive and experimentalresults cannot be repeated at the same location. How-ever, the results obtained from staining experimentsclearly illustrate the complicated pattern of water move-ment (Flury et al., 1994).
Red and white areas in the subsoil of the GleyicLuvisol mark patterns of predominant water saturationand desaturation, i.e. slow-flow and faster-flow regions,respectively. We wanted to examine, if these mottledpatterns and the different colours of the subsoil couldbe related to flow path as visualized by dye tracing and
if the soil colours and visualized flow paths could berelated to selected physical soil properties.
Material and Methods
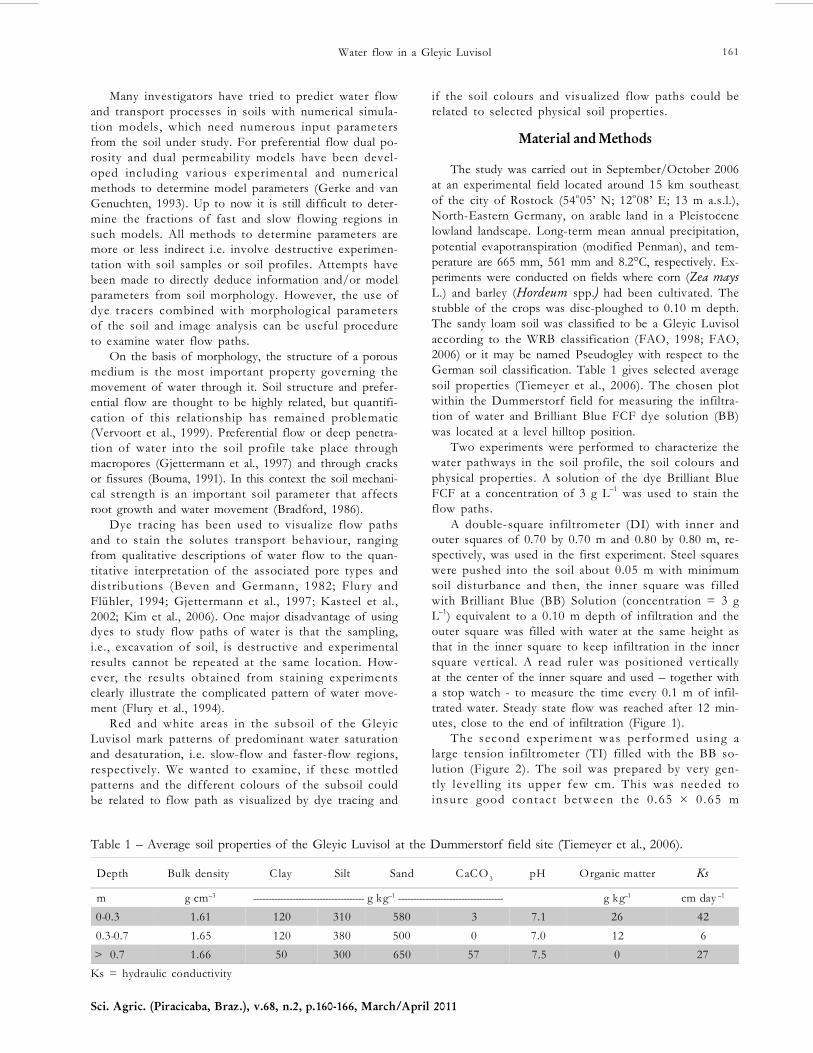
The study was carried out in September/October 2006at an experimental field located around 15 km southeastof the city of Rostock (54o05’ N; 12o08’ E; 13 m a.s.l.),North-Eastern Germany, on arable land in a Pleistocenelowland landscape. Long-term mean annual precipitation,potential evapotranspiration (modified Penman), and tem-perature are 665 mm, 561 mm and 8.2°C, respectively. Ex-periments were conducted on fields where corn (Zea maysL.) and barley (Hordeum spp.) had been cultivated. Thestubble of the crops was disc-ploughed to 0.10 m depth.The sandy loam soil was classified to be a Gleyic Luvisolaccording to the WRB classification (FAO, 1998; FAO,2006) or it may be named Pseudogley with respect to theGerman soil classification. Table 1 gives selected averagesoil properties (Tiemeyer et al., 2006). The chosen plotwithin the Dummerstorf field for measuring the infiltra-tion of water and Brilliant Blue FCF dye solution (BB)was located at a level hilltop position.
Two experiments were performed to characterize thewater pathways in the soil profile, the soil colours andphysical properties. A solution of the dye Brilliant BlueFCF at a concentration of 3 g L–1 was used to stain theflow paths.
A double-square infiltrometer (DI) with inner andouter squares of 0.70 by 0.70 m and 0.80 by 0.80 m, re-spectively, was used in the first experiment. Steel squareswere pushed into the soil about 0.05 m with minimumsoil disturbance and then, the inner square was filledwith Brilliant Blue (BB) Solution (concentration = 3 gL–1) equivalent to a 0.10 m depth of infiltration and theouter square was filled with water at the same height asthat in the inner square to keep infiltration in the innersquare vertical. A read ruler was positioned verticallyat the center of the inner square and used – together witha stop watch - to measure the time every 0.1 m of infil-trated water. Steady state flow was reached after 12 min-utes, close to the end of infiltration (Figure 1).
The second experiment was performed us ing alarge tension infiltrometer (TI) filled with the BB so-lution (Figure 2). The soil was prepared by very gen-tly levelling i ts upper few cm. This was needed toinsure good contac t between the 0 .65 × 0 .65 m
Table 1 – Average soil properties of the Gleyic Luvisol at the Dummerstorf field site (Tiemeyer et al., 2006).
Ks = hydraulic conductivity
Depth Bulk density C lay Silt Sand CaCO3 pH Organic matter Ks
m g cm–3 ------------------------------------- g kg–1 ----------------------------------- g kg–1 cm day –1
0-0.3 1.61 120 310 580 3 7.1 26 420.3-0.7 1.65 120 380 500 0 7.0 12 6> 0.7 1.66 50 300 650 57 7.5 0 27

Salvador et al.162
Sci. Agric. (Piracicaba, Braz.), v.68, n.2, p.160-166, March/April 2011
6
6.5
7
7.5
8
0 3 6 9 12 15
Infil
tratio
n ra
te (c
m m
in–1
)
time (min)
Figure 1 – Infiltration rate for the double square infiltrometer(DI) experiment.
00.010.020.030.040.050.060.070.080.09
0.1
0 240 480 720 960 1200 1440
Infil
tratio
n ra
te (c
m m
in–1
)
time (min)
Figure 3 – Infiltration rate for the tension infiltrometer (TI)experiment.
square membrane, which was placed onto the soil andattached to the reservoir tower and tension control tubevia flexible tube. The suction of infiltration was adjustedat 0.005 m. The amount of water infiltrating into the soilwas measured by recording the water level drop in thereservoir tower as a function of time. Steady state flowwas reached after 22 hours (Figure 3) and the total infil-tration depth accumulated to 0.115 m.
During the infiltration and dye application, a pit wasdug at about 0.5 m distance to the outer square and ten-sion infiltration plate. A first profile was prepared in theunstained soil ( i.e . without infiltrat ion) and sampleswere taken from red and white areas as explained be-low. Then, the day after infiltration, 3 (TI) and 6 (DI)vertical profiles were prepared beneath the TI and DIinfiltration areas to assess the extent of dye movement(to a depth of approximately 1 m). A 0.7 by 0.7 m framewas attached in the soil profiles to allow corrections bydigital image analysis and then were photographed witha Digital Colour Camera (8 mega-pixels) installed on atripod positioned in the centre of the area at 1.3 m ofthe horizontal distance of the profile (Figure 4). This
frame was placed at 0.23 m depth from the soil surfacebecause own interest was to visualize the pathways inthe stagnic horizon.
The stained patterns on the photographs wereanalysed using the adobe Photoshop 7.0 including geo-metrical corrections and for the best identification of theblue areas, the cyan colour intensity was increased by 30%
Figure 2 – Large tension infiltrometer (a); detailed control tubeand bouble tower (b); detailed square membrane (c).
Figure 4 – Digital colour image showing stained (blue) and notstained (white and red) areas in the Stagnic horizonfor the double square infiltrometer (above) and thetension infiltrometer (below) experiments.
Water flow in a Gleyic Luvisol 163
Sci. Agric. (Piracicaba, Braz.), v.68, n.2, p.160-166, March/April 2011
hue and 80% saturation. The “Magic wand tool” in thePhotoshop was then applied with 50% tolerance to selectthe dye stained area. This simple yet efficient procedureyielded accurate identification of the blue stained areasas was visually verified. The resulting selected dye andunstained areas were converted into black and with pic-tures. Finally, the depth distribution of dye coverage frac-tions under and outside the cross section of the infiltra-tion area was calculated line for line from the number ofblack pixel using a custom program code in Excel.
The resistance of the soil to penetration (cone resis-tance (CR)), the soil water content (θ), and the bulk den-sity (ρ) were randomly obtained for each profile (blocks)and colour (treatments) and, on average, twenty mea-surements or soil samples per colour per profile werealso taken. The experimental data was analysed by thestatistical package SPSS 12.0. Boxplot graphs were usedto take out the outliers and then the data were submit-ted to analysis of variance and the averages comparedthrough the Tukey test (p < 0.05). Pearson correlationat the 1% level was utilized to verify the relationshipbetween the analysed soil parameters.
To obtain the penetration resistance (PR) in thewhite and red (natural colours of the soil) and bluestained areas in the soil profiles, a hand penetrometer(Type IB Eijkelkamp) was used. The principle of thehand penetrometer depends on measuring the highestpenetration resistance of the soil against a moving cone.An appropriate cone, according to the expected PR, ismounted to the corresponding probing rod which is at-tached to the penetrometer via extention rod. The re-quired compression spring is placed in the penetrom-eter. The indicator ring must be set at the zero positionwhen measuring starts. The cone is pushed, using onehand only, perpendicularly to the soil profile into theinvestigated spot at a constant velocity of approximately0.2 m s–1. The indicator ring moves to a position thatshows the maximum compression of the spring on the
mm scale of the penetrometer. The equation to calcu-late the cone resistance (CR) is as follows:
–12
–2
total force (cm) × spring compression (N cm )Cone resistance (N cm ) = cone surface area (cm )
After obtaining the cone resistance (CR) measure (to-tal force), small soil volume samples (10.62 cm3) were ob-tained in the same spots using a tube sample, consistedof a 0.15 m long of copper pipe with 0.026 m internal di-ameter and sharpened front edge. The sample tube waspushed into the soil to a depth of 0.02 m. After the sam-pler was inserted, the soil around the sampler was exca-vated and the sample contained within the sampler waslevelled in the sampler end and removed with a piston.The fresh undisturbed samples were weighed and trans-ported to the laboratory for the traditional determinationof soil water content and bulk density.
Results and Discussion
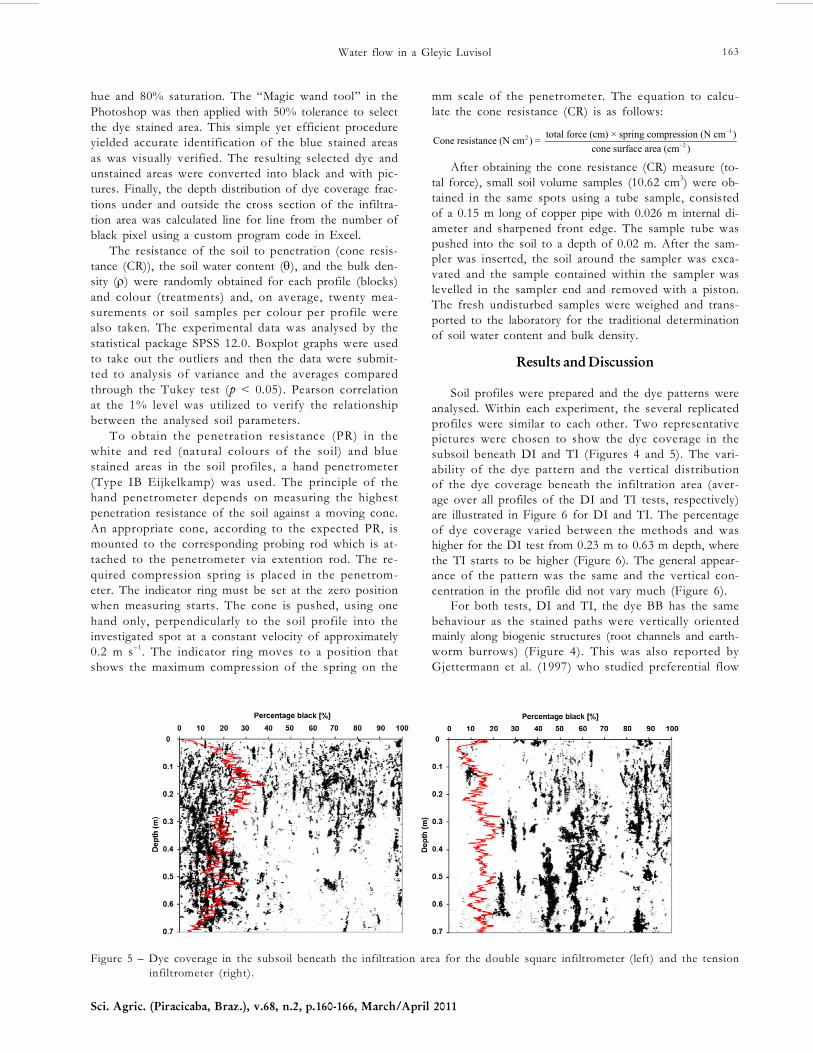
Soil profiles were prepared and the dye patterns wereanalysed. Within each experiment, the several replicatedprofiles were similar to each other. Two representativepictures were chosen to show the dye coverage in thesubsoil beneath DI and TI (Figures 4 and 5). The vari-ability of the dye pattern and the vertical distributionof the dye coverage beneath the infiltration area (aver-age over all profiles of the DI and TI tests, respectively)are illustrated in Figure 6 for DI and TI. The percentageof dye coverage varied between the methods and washigher for the DI test from 0.23 m to 0.63 m depth, wherethe TI starts to be higher (Figure 6). The general appear-ance of the pattern was the same and the vertical con-centration in the profile did not vary much (Figure 6).
For both tests, DI and TI, the dye BB has the samebehaviour as the stained paths were vertically orientedmainly along biogenic structures (root channels and earth-worm burrows) (Figure 4). This was also reported byGjettermann et al. (1997) who studied preferential flow
Figure 5 – Dye coverage in the subsoil beneath the infiltration area for the double square infiltrometer (left) and the tensioninfiltrometer (right).
Salvador et al.164
Sci. Agric. (Piracicaba, Braz.), v.68, n.2, p.160-166, March/April 2011
mechanisms in the field as affected by irrigation inten-sity and by Flury et al. (1994) who compared soils withrespect to their susceptibility of soils to preferential flowof water. Kim et al. (2004) investigated the effect of tex-ture and structure on the infiltration pattern at three fieldsoils and verified that macropores (cracks and veins) andplant roots induced the preferential flow in the studiedsoils. Water water flow is not always uniform due to theoccurrence of macropores which create by-pass channels(Smettem and Trudgill, 1983), and also due cracks or fis-sures (Bouma, 1991). The visual interpretation of our soilprofile pictures suggested that the morphologic specificsof a Pseudogley subsoil - mainly, the white and red areas- were not directly related to the preferential flow paths.
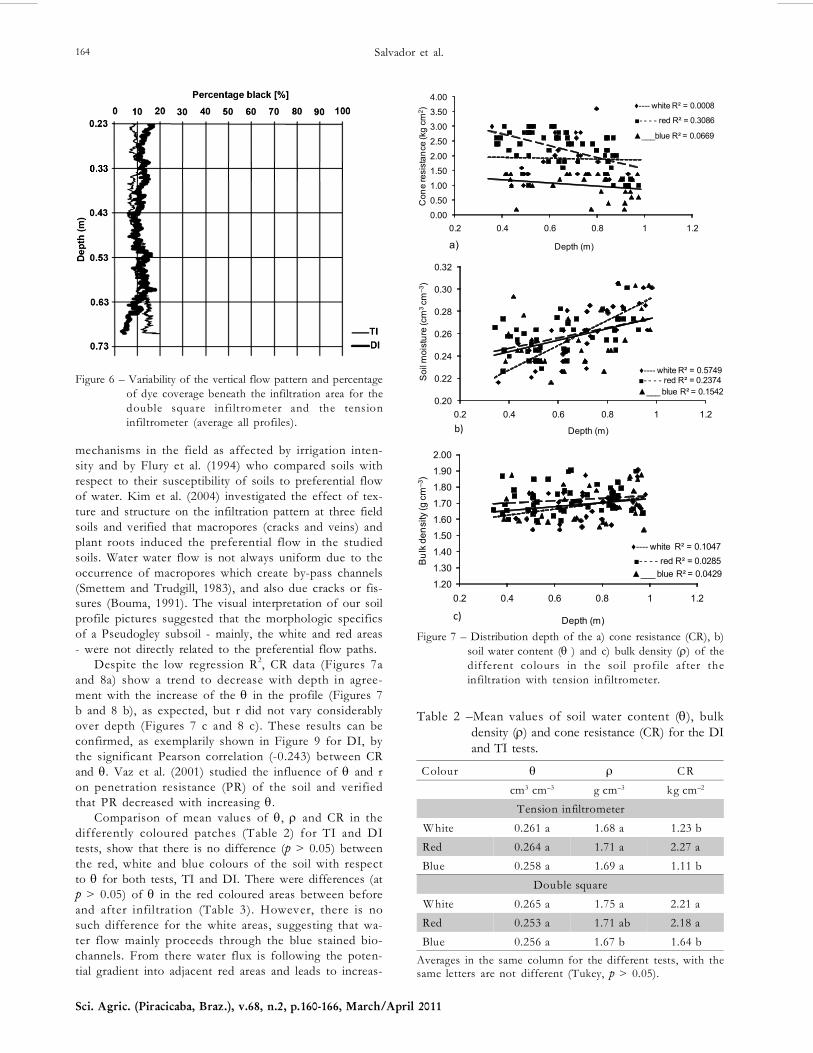
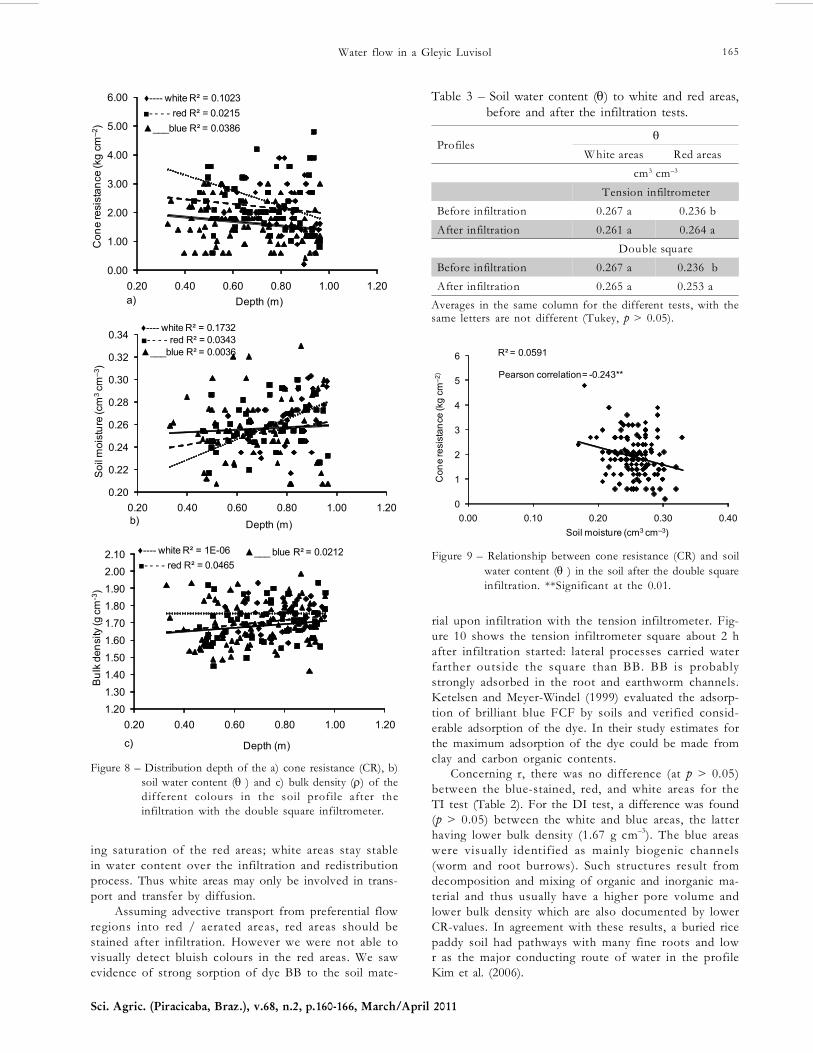
Despite the low regression R2, CR data (Figures 7aand 8a) show a trend to decrease with depth in agree-ment with the increase of the θ in the profile (Figures 7b and 8 b), as expected, but r did not vary considerablyover depth (Figures 7 c and 8 c). These results can beconfirmed, as exemplarily shown in Figure 9 for DI, bythe significant Pearson correlation (-0.243) between CRand θ. Vaz et al. (2001) studied the influence of θ and ron penetration resistance (PR) of the soil and verifiedthat PR decreased with increasing θ.
Comparison of mean values of θ, ρ and CR in thedifferently coloured patches (Table 2) for TI and DItests, show that there is no difference (p > 0.05) betweenthe red, white and blue colours of the soil with respectto θ for both tests, TI and DI. There were differences (atp > 0.05) of θ in the red coloured areas between beforeand after infiltrat ion (Table 3). However, there is nosuch difference for the white areas, suggesting that wa-ter flow mainly proceeds through the blue stained bio-channels. From there water flux is following the poten-tial gradient into adjacent red areas and leads to increas-
Figure 6 – Variability of the vertical flow pattern and percentageof dye coverage beneath the infiltration area for thedouble square infiltrometer and the tens ioninfiltrometer (average all profiles).
Colour θ ρ CRcm3 cm–3 g cm–3 kg cm–2
Tension infiltrometerWhite 0.261 a 1.68 a 1.23 bRed 0.264 a 1.71 a 2.27 aBlue 0.258 a 1.69 a 1.11 b
Double squareWhite 0.265 a 1.75 a 2.21 aRed 0.253 a 1.71 ab 2.18 aBlue 0.256 a 1.67 b 1.64 b
Table 2 –Mean values of soil water content (θ), bulkdensity (ρ) and cone resistance (CR) for the DIand TI tests.
Averages in the same column for the different tests, with thesame letters are not different (Tukey, p > 0.05).
♦---- white R² = 0.0008
■- - - - red R² = 0.3086
▲___blue R² = 0.0669
0.000.50
1.00
1.50
2.00
2.50
3.00
3.50
4.00
0.2 0.4 0.6 0.8 1 1.2
Con
e re
sist
ance
(kg
cm2 )
Depth (m)a)
♦---- white R² = 0.5749■- - - - red R² = 0.2374▲___ blue R² = 0.1542
0.20
0.22
0.24
0.26
0.28
0.30
0.32
0.2 0.4 0.6 0.8 1 1.2S
oil m
oist
ure
(cm
3cm
–3)
Depth (m)b)
Figure 7 – Distribution depth of the a) cone resistance (CR), b)soil water content (θ ) and c) bulk density (ρ) of thedifferent colours in the soil profile after theinfiltration with tension infiltrometer.
♦---- white R² = 0.1047■- - - - red R² = 0.0285▲___ blue R² = 0.0429
1.20
1.30
1.40
1.50
1.60
1.70
1.80
1.90
2.00
0.2 0.4 0.6 0.8 1 1.2
Bul
k de
nsity
(g c
m–3
)
Depth (m)c)
Water flow in a Gleyic Luvisol 165
Sci. Agric. (Piracicaba, Braz.), v.68, n.2, p.160-166, March/April 2011
Table 3 – Soil water content (θ) to white and red areas,before and after the infiltration tests.
Averages in the same column for the different tests, with thesame letters are not different (Tukey, p > 0.05).
Profilesθ
White areas Red areascm3 cm–3
Tension infiltrometerBefore infiltration 0.267 a 0.236 bAfter infiltration 0.261 a 0.264 a
Double squareBefore infiltration 0.267 a 0.236 bAfter infiltration 0.265 a 0.253 a
♦---- white R² = 0.1023■- - - - red R² = 0.0215▲___blue R² = 0.0386
0.00
1.00
2.00
3.00
4.00
5.00
6.00
0.20 0.40 0.60 0.80 1.00 1.20
Con
e re
sist
ance
(kg
cm–2
)
Depth (m)a)
♦---- white R² = 0.1732■- - - - red R² = 0.0343▲___blue R² = 0.0036
0.20
0.22
0.24
0.26
0.28
0.30
0.32
0.34
0.20 0.40 0.60 0.80 1.00 1.20
Soi
l moi
stur
e (c
m3
cm–3
)
Depth (m)b)
♦---- white R² = 1E-06■- - - - red R² = 0.0465
▲___ blue R² = 0.0212
1.201.301.401.501.601.701.801.902.002.10
0.20 0.40 0.60 0.80 1.00 1.20
Bul
k de
nsity
(g c
m-3
)
Depth (m)c)
Figure 8 – Distribution depth of the a) cone resistance (CR), b)soil water content (θ ) and c) bulk density (ρ) of thedifferent colours in the soil profile after theinfiltration with the double square infiltrometer.
ing saturation of the red areas; white areas stay stablein water content over the infiltration and redistributionprocess. Thus white areas may only be involved in trans-port and transfer by diffusion.
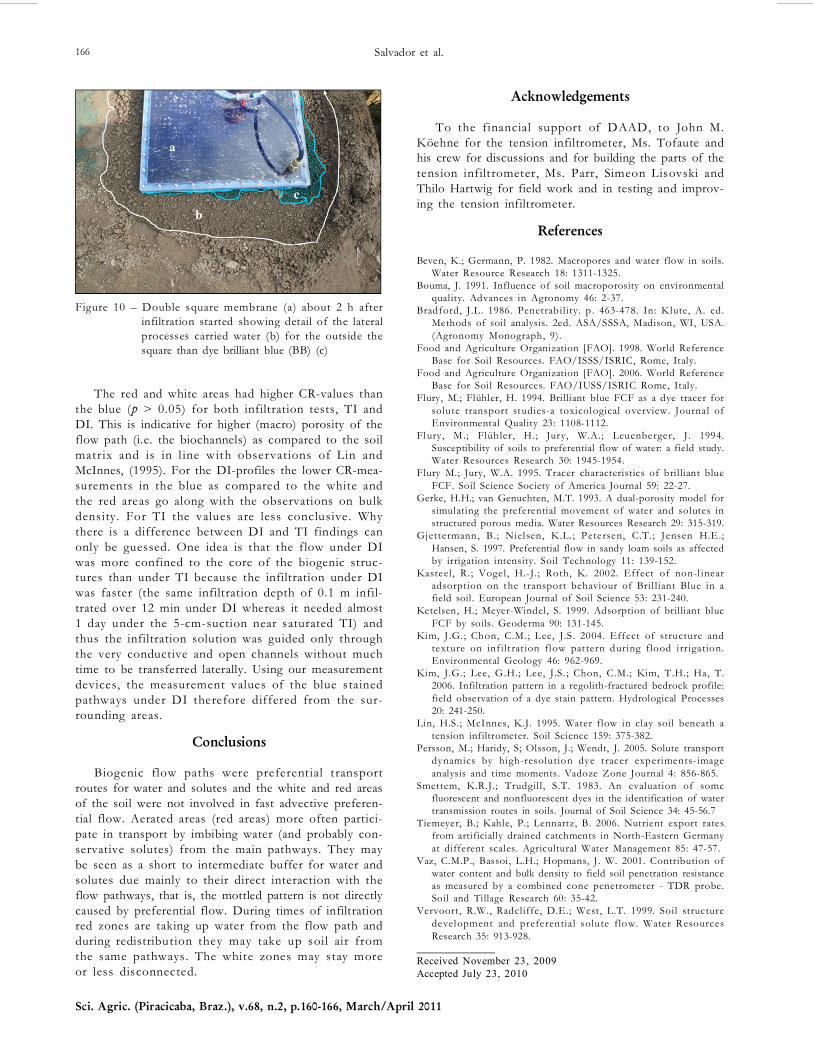
Assuming advective transport from preferential flowregions into red / aerated areas, red areas should bestained after infiltration. However we were not able tovisually detect bluish colours in the red areas. We sawevidence of strong sorption of dye BB to the soil mate-
rial upon infiltration with the tension infiltrometer. Fig-ure 10 shows the tension infiltrometer square about 2 hafter infiltration started: lateral processes carried waterfarther outside the square than BB. BB is probablystrongly adsorbed in the root and earthworm channels.Ketelsen and Meyer-Windel (1999) evaluated the adsorp-tion of brilliant blue FCF by soils and verified consid-erable adsorption of the dye. In their study estimates forthe maximum adsorption of the dye could be made fromclay and carbon organic contents.
Concerning r, there was no difference (at p > 0.05)between the blue-stained, red, and white areas for theTI test (Table 2). For the DI test, a difference was found(p > 0.05) between the white and blue areas, the latterhaving lower bulk density (1.67 g cm–3). The blue areaswere visually identified as mainly biogenic channels(worm and root burrows). Such structures result fromdecomposition and mixing of organic and inorganic ma-terial and thus usually have a higher pore volume andlower bulk density which are also documented by lowerCR-values. In agreement with these results, a buried ricepaddy soil had pathways with many fine roots and lowr as the major conducting route of water in the profileKim et al. (2006).
R² = 0.0591
Pearson correlation= -0.243**
0
1
2
3
4
5
6
0.00 0.10 0.20 0.30 0.40
Con
e re
sist
ance
(kg
cm–2
)
Soil moisture (cm3 cm–3)
Figure 9 – Relationship between cone resistance (CR) and soilwater content (θ ) in the soil after the double squareinfiltration. **Significant at the 0.01.
Salvador et al.166
Sci. Agric. (Piracicaba, Braz.), v.68, n.2, p.160-166, March/April 2011
The red and white areas had higher CR-values thanthe blue (p > 0.05) for both infiltration tests, TI andDI. This is indicative for higher (macro) porosity of theflow path (i.e. the biochannels) as compared to the soilmatr ix and is in l ine with observations of Lin andMcInnes, (1995). For the DI-profiles the lower CR-mea-surements in the blue as compared to the white andthe red areas go along with the observations on bulkdensity. For TI the values are less conclusive. Whythere is a difference between DI and TI findings canonly be guessed. One idea is that the flow under DIwas more confined to the core of the biogenic struc-tures than under TI because the infiltration under DIwas faster (the same infiltration depth of 0.1 m infil-trated over 12 min under DI whereas it needed almost1 day under the 5-cm-suction near saturated TI) andthus the infiltration solution was guided only throughthe very conductive and open channels without muchtime to be transferred laterally. Using our measurementdevices, the measurement values of the blue stainedpathways under DI therefore differed from the sur-rounding areas.
Conclusions
Biogenic flow paths were preferential transportroutes for water and solutes and the white and red areasof the soil were not involved in fast advective preferen-tial flow. Aerated areas (red areas) more often partici-pate in transport by imbibing water (and probably con-servative solutes) from the main pathways. They maybe seen as a short to intermediate buffer for water andsolutes due mainly to their direct interaction with theflow pathways, that is, the mottled pattern is not directlycaused by preferential flow. During times of infiltrationred zones are taking up water from the flow path andduring redistribution they may take up soil air fromthe same pathways. The white zones may stay moreor less disconnected.
Acknowledgements
To the financial support of DAAD, to John M.Köehne for the tension infiltrometer, Ms. Tofaute andhis crew for discussions and for building the parts of thetension infiltrometer, Ms. Parr, Simeon Lisovski andThilo Hartwig for field work and in testing and improv-ing the tension infiltrometer.
References
Beven, K.; Germann, P. 1982. Macropores and water flow in soils.Water Resource Research 18: 1311-1325.
Bouma, J. 1991. Influence of soil macroporosity on environmentalquality. Advances in Agronomy 46: 2-37.
Bradford, J.L. 1986. Penetrability. p . 463-478. In: Klute, A. ed.Methods of soil analysis. 2ed. ASA/SSSA, Madison, WI, USA.(Agronomy Monograph, 9).
Food and Agriculture Organization [FAO]. 1998. World ReferenceBase for Soil Resources. FAO/ISSS/ISRIC, Rome, Italy.
Food and Agriculture Organization [FAO]. 2006. World ReferenceBase for Soil Resources. FAO/IUSS/ISRIC Rome, Italy.
Flury, M.; Flühler, H. 1994. Brilliant blue FCF as a dye tracer forsolute transport studies-a toxicological overview. Journal ofEnvironmental Quality 23: 1108-1112.
Flury , M.; Flühler , H.; Jury, W.A.; Leuenberger, J. 1994.Susceptibility of soils to preferential flow of water: a field study.Water Resources Research 30: 1945-1954.
Flury M.; Jury, W.A. 1995. Tracer characteristics of bril liant blueFCF. Soil Science Society of America Journal 59: 22-27.
Gerke, H.H.; van Genuchten, M.T. 1993. A dual-porosity model forsimulating the preferential movement of water and solutes instructured porous media. Water Resources Research 29: 315-319.
Gjettermann, B.; Niel sen, K.L. ; Petersen, C.T.; Jensen H.E.;Hansen, S. 1997. Preferential flow in sandy loam soils as affectedby irrigation intensity. Soil Technology 11: 139-152.
Kasteel, R. ; Vogel, H.-J.; Roth, K. 2002. Effect of non-l inearadsorption on the transport behaviour of Bril l iant Blue in afield soil. European Journal of Soil Science 53: 231-240.
Ketelsen, H.; Meyer-Windel, S. 1999. Adsorption of bril liant blueFCF by soils. Geoderma 90: 131-145.
Kim, J .G.; Chon, C.M.; Lee, J.S . 2004. Effect of structure andtexture on inf ilt rat ion flow pat tern during flood irr igation.Environmental Geology 46: 962-969.
Kim, J.G.; Lee, G.H.; Lee, J.S. ; Chon, C.M.; Kim, T.H.; Ha, T.2006. Infiltration pattern in a regolith-fractured bedrock profile:field observation of a dye stain pattern. Hydrological Processes20: 241-250.
Lin, H.S.; McInnes, K.J. 1995. Water flow in clay soil beneath atension infiltrometer. Soil Science 159: 375-382.
Persson, M.; Haridy, S; Olsson, J.; Wendt, J. 2005. Solute transportdynamics by high-resolution dye t racer experiments-imageanalysis and time moments. Vadoze Zone Journal 4: 856-865.
Smettem, K.R.J.; Trudgill , S.T. 1983. An evaluation of somefluorescent and nonfluorescent dyes in the identification of watertransmission routes in soils. Journal of Soil Science 34: 45-56.7
Tiemeyer, B.; Kahle, P.; Lennartz, B. 2006. Nutrient export ratesfrom artificially drained catchments in North-Eastern Germanyat different scales. Agricultural Water Management 85: 47-57.
Vaz, C.M.P., Bassoi, L.H.; Hopmans, J. W. 2001. Contribution ofwater content and bulk density to field soil penetration resistanceas measured by a combined cone penetrometer - TDR probe.Soil and Tillage Research 60: 35-42.
Vervoort, R.W., Radcliffe, D.E.; West, L.T. 1999. Soil structuredevelopment and preferential solute flow. Water ResourcesResearch 35: 913-928.
Received November 23, 2009Accepted July 23, 2010
Figure 10 – Double square membrane (a) about 2 h afterinfiltration started showing detail of the lateralprocesses carried water (b) for the outside thesquare than dye brilliant blue (BB) (c)