DWORSHAK RESERVOIR KOKANEE POPULATION MONITORING... · 2012-11-30 · Dworshak Reservoir Kokanee...
21
DWORSHAK RESERVOIR KOKANEE POPULATION MONITORING ANNUAL PROGRESS REPORT January 1, 2000 – December 31, 2000 Prepared by: Eric J. Stark, Fisheries Research Biologist and Melo A. Maiolie, Principal Fisheries Research Biologist IDFG Report Number 02-14 May 2002
Transcript of DWORSHAK RESERVOIR KOKANEE POPULATION MONITORING... · 2012-11-30 · Dworshak Reservoir Kokanee...

DWORSHAK RESERVOIR KOKANEE POPULATION MONITORING
ANNUAL PROGRESS REPORT January 1, 2000 – December 31, 2000
Prepared by:
Eric J. Stark, Fisheries Research Biologist
and
Melo A. Maiolie, Principal Fisheries Research Biologist
IDFG Report Number 02-14 May 2002

Dworshak Reservoir Kokanee Population Monitoring
Project Progress Report
2000 Annual Report
By
Eric J. Stark Melo A. Maiolie
Idaho Department of Fish and Game 600 South Walnut Street
P.O. Box 25 Boise, ID 83707
To
U.S. Department of Energy Bonneville Power Administration
Division of Fish and Wildlife P.O. Box 3621
Portland, OR 97283-3621
Project Number 0001739 Contract Number 97BP35167
IDFG Report Number 02-14 May 2002

i
TABLE OF CONTENTS Page
ABSTRACT.................................................................................................................................1
INTRODUCTION ........................................................................................................................2
OBJECTIVE................................................................................................................................3
DESCRIPTION OF STUDY AREA..............................................................................................3
METHODS..................................................................................................................................4
Hydroacoustics........................................................................................................................4Discharge ................................................................................................................................5Angler Caught Kokanee...........................................................................................................5Spawner Counts......................................................................................................................6Strobe Light Research Platform Construction ..........................................................................6
RESULTS ...................................................................................................................................7
Hydroacoustics........................................................................................................................7Discharge ................................................................................................................................9Angler Caught Kokanee.........................................................................................................10Spawner Counts....................................................................................................................11
DISCUSSION............................................................................................................................12
CONCLUSIONS........................................................................................................................13
RECOMMENDATIONS.............................................................................................................13
ACKNOWLEDGMENTS............................................................................................................14
LITERATURE CITED................................................................................................................15
LIST OF TABLES
Table 1. Estimated abundance of kokanee (thousands) in Dworshak Reservoir, Idaho, 1988-2000. ....................................................................................................8
Table 2. Number of kokanee spawners counted in selected tributaries to Dworshak Reservoir during September 1981-2000. ................................................................12

ii
LIST OF FIGURES Page
Figure 1. Map of Dworshak Reservoir, major tributaries, and sampling sections, North Fork Clearwater River, Idaho. ...................................................................................4
Figure 2. Completed strobe light research platform in the fore bay of Dworshak Reservoir, showing propane tanks, generator, steel anchoring structure, and gray shelter housing the strobe lights, power head, and computer. ..........................7
Figure 3. Abundance estimates for age-0, age-1, and age-2 kokanee based on hydroacoustic sampling in three sections of Dworshak Reservoir, 2000. ..................8
Figure 4. Frequency distribution of fish’s target strengths sampled with hydroacoustics on Dworshak Reservoir, Idaho 2000.........................................................................9
Figure 5. Mean monthly discharge from Dworshak Dam, 2000..............................................10
Figure 6. Length frequency of angler-caught kokanee from Dworshak Reservoir July 2000. ......................................................................................................................11

1
ABSTRACT
On-site testing of the effectiveness of strobe lights to deter kokanee Oncorhynchus nerka entrainment in Dworshak Reservoir began in 2000. We constructed a floating research platform holding a system of strobe lights. A split-beam echo sounder was used to monitor the kokanee population in Dworshak Reservoir during 2000. Estimated abundance of kokanee has continued to increase since high entrainment losses during the spring of 1996. Based on hydroacoustic surveys, we estimated 2,397,691 kokanee in Dworshak Reservoir in early July 2000. This included 1,894,857 age-0 kokanee (90% CI ± 23%), 303,680 age-1 kokanee (90% CI ± 22%), and 199,155 age-2 kokanee (90% CI ± 22%). Counts of spawning kokanee in four tributary streams reached 4,465 fish. This is a marked decrease from the 1999 total of 11,320 kokanee, yet is still much higher than the 1998 total of 660 spawning kokanee. This spawner count appeared unusually low considering the population estimate of kokanee based on echo sounding.
Authors:
Eric J. Stark Fishery Research Biologist
Melo A. Maiolie Principal Fishery Research Biologist

2
INTRODUCTION
Fisheries for kokanee Oncorhynchus nerka in the Pacific Northwest are very popular (Wydoski and Bennett 1981; Rieman and Myers 1992). Kokanee feed low on the food chain and may reach densities in excess of 150 harvestable-sized fish/ha, even in relatively sterile waters (Maiolie et al. 1991). They also appear to be an ideal fish in fluctuating reservoirs; they rear in the open pelagic zone, and some strains spawn in tributary streams away from the potential impacts of water level fluctuations.
Kokanee, however, can exhibit behavioral tendencies to school and emigrate resulting in potentially large entrainment losses. Entrainment losses have been documented in Libby Reservoir in Montana (Skarr et al. 1996), Banks Lake, Washington (Stober et al. 1979), and Dworshak Reservoir (Maiolie and Elam 1998).
At Dworshak Reservoir, it was estimated that 1.4 million kokanee (95% of the population) were lost through the dam in a period of five months in 1996. Thus, entrainment loss of kokanee has been established as the single most important factor causing variability in the population (Maiolie et al. 1992). In 1996, losses of kokanee were severe enough that they strongly affected the fishery in subsequent years. Years with high discharge have correlated with lower kokanee populations in the reservoir (Maiolie and Elam 1993). When densities are high, Dworshak Reservoir becomes one of the best kokanee fisheries in the state, accounting for a harvest of over 200,000 fish annually. When densities are low, catch rates, harvest, and fishing effort are sharply reduced.
Dworshak Reservoir has also become increasingly important for providing increased river flows to benefit salmon and steelhead (Cichosz et al. 2001). During May, July, and August, large volumes of water are typically released to aid smolt migration and cool water temperatures in the Lower Snake River. This changed operation, however, has the potential to entrain additional fish during the summer.
Physically screening Dworshak Dam to prevent fish losses would be very difficult because of the high flows (800 m3/s) and the large amounts of debris within the reservoir. Therefore, one major task of this project is to test behavioral avoidance devices to determine if kokanee, and other fish, can be deterred from the turbine intakes of the dam and effectively decrease entrainment.
Many previous studies have proven successful at affecting the behavior of different species of fish with the use of strobe lights in a number of different conditions (Patrick 1982; Nemeth and Anderson 1992; Winchell et al. 1994; Ploskey and Johnson 2001). Strobe light testing for this project was first conducted off-site in 1997 in Spirit Lake and Lake Pend Oreille, and again in 1998 on Lake Pend Oreille. In 1998, kokanee avoided the strobe lights for the entire night and remained 30 to 40 m away from them in the open water environment of Lake Pend Oreille (Maiolie et al. 2001). Lights were found to be even more effective during winter (the season of highest entrainment losses) and repelled kokanee in excess of 100 m.
During 2000, a research platform was constructed and strobe lights installed on it to operate in front of one turbine of the dam. Preliminary on-site testing began during early 2001 to determine how kokanee react to the lights at Dworshak Dam. Full-scale effectiveness testing of the strobe lights will continue through 2001. These tests will allow us to study the effects of strobe lights on fish that are in a current of water and are schooled near the dam for a period of

3
several months. If entrainment losses can be minimized using strobe lights, then the operation of dams for flood control, power production, providing anadromous fish flows, and recreation opportunities could be done with less of an impact on resident species. Thus, this project may help to increase the flexibility of dam operations and allow a better integration of resident and anadromous fish needs.
In addition, other tasks of this project included estimating the kokanee population in the reservoir. We used mobile split-beam hydroacoustics to quantify density and abundance of kokanee. We also conducted creel surveys to obtain representative samples of fish lengths and scales for aging. Aging was used to identify age structure of the population.
OBJECTIVE
1. To maintain densities of 30 to 50 adult (age-2 and older) kokanee/ha in Dworshak Reservoir by reducing entrainment losses.
DESCRIPTION OF STUDY AREA
Dworshak Dam is located on the North Fork of the Clearwater River in northern Idaho. At 219 m tall, it is the tallest straight-axis concrete dam in the United States. The U.S. Army Corps of Engineers (USACE) built it in 1971 for power production and flood control. Three turbines within the dam have a total operating capacity of 450 megawatts. The dam can discharge up to 380 m3/s through the turbines and an additional 420 m3/s through reservoir outlets and the spillway.
Dworshak Reservoir is 86 km long at full pool (Figure 1). Maximum and mean depths are 194 m and 56 m, respectively. Surface area at full pool is 6,644 ha with 5,400 ha of kokanee habitat, defined as the area over 15 m deep. Draw downs for flood control may lower the surface elevation 47 m and reduce surface area by as much as 52%. The reservoir has a mean hydraulic retention time of 10.2 months and a mean annual discharge of 162 m3/s (Falter 1982). High releases from the reservoir occur during spring runoff, during the fall when the reservoir is lowered for flood control, and during late summer when water is released for anadromous fish flows.
Kokanee were first stocked into Dworshak Reservoir in 1972 (Horton 1981). Four sources of fish were initially used, but the early spawning strain from Anderson Ranch Reservoir, Idaho now populates the reservoir (Winans et al. 1996). These fish spawn during September in tributary streams as far as 140 km above the reservoir. They reach maturity primarily at age-2, although age-1 and age-3 spawners are occasionally found. Adults range in size from 200 to 400 mm in total length depending on the density of fish in the reservoir, but generally average 300 mm during spawning (Maiolie and Elam 1995).

4
Figure 1. Map of Dworshak Reservoir, major tributaries, and sampling sections, North Fork Clearwater River, Idaho.
METHODS
Hydroacoustics
We used a Simrad EY500 split-beam scientific echo sounder with a 120 kHz transducer to document the abundance and distribution of kokanee. Boat speed was 1.5 to 2.3 m/s, and all surveys were conducted at night. The echo sounder was set to ping at 0.7 s intervals with a pulse width of 0.3 milliseconds. Data were collected with a time varied gain constant of 20 log r (range). We calibrated the echo sounder at the beginning of the year using a 23 mm copper calibration sphere with a target strength of -40.4 dB (decibels) at 23°C. We checked the calibration of the echo sounder prior to each monthly survey and adjusted the transducer gains if needed.
We configured the echo sounder so that only echoes meeting certain criteria would be regarded as a fish. The returned echo had to be greater than -60 dB. The length of the returned echo had to be between 0.8 and 1.8 times the length of the echo sounder’s ping. The echo could not require more than 4.0 dB compensation for being off the acoustic axis, and the target
5
had to be within a 7.1° cone. Echoes meeting these criteria were classified as a fish "trace" (a single returned echo from a single fish).
Fish density estimates for each transect were calculated using EP-500 software, version 5.2. Densities were estimated by echo integration techniques to account for fish within schools that could not be distinguished as single targets. We analyzed only the pelagic region of each echogram, generally from depths of 5 m to 50 m.
We graphed a frequency distribution of the fish’s target strengths to separate kokanee into age classes. The resultant frequency distribution defined three peaks that corresponded to the three age classes of kokanee.
Reservoir-wide hydroacoustic surveys were conducted to estimate kokanee abundance. We used a systematic, stratified survey design (Scheaffer et al. 1990). The reservoir was stratified into three sections: the dam to Dent Bridge (section 1), Dent Bridge to Granddad Bridge (section 2), and Granddad Bridge to the headwaters (section 3) (Figure 1). Survey transects were spaced at 3.2 km intervals throughout the length of the reservoir using Global Positioning System (GPS) locations. The first transect was started 3.2 km from the dam, and this and all subsequent transects were run perpendicular to the main axis of the reservoir. Twenty-six survey transects were conducted on the evenings of July 12 and 13, 2000; eight, twelve, and six transects respectively for reservoir sections 1, 2, and 3. Reservoir section mean fish densities were calculated as an average of the transect densities for each respective section. Mean fish densities in each reservoir section were multiplied by the area of that section and then totaled to obtain a total reservoir population estimate. Ninety percent confidence limits were placed on the total kokanee population estimates using a formula for stratified systematic designs (Scheaffer et al. 1990). Mean reservoir fish density was calculated by dividing the total reservoir population estimate by the total area (ha) of the reservoir.
Discharge
Data on monthly discharge through the dam were obtained from the USACE. All discharge values were measured in thousand cubic feet per second and were then converted to metric units (m3/s). Time and magnitude of discharge from Dworshak Dam is used to examine correlations between potential entrainment and population abundances.
Angler Caught Kokanee
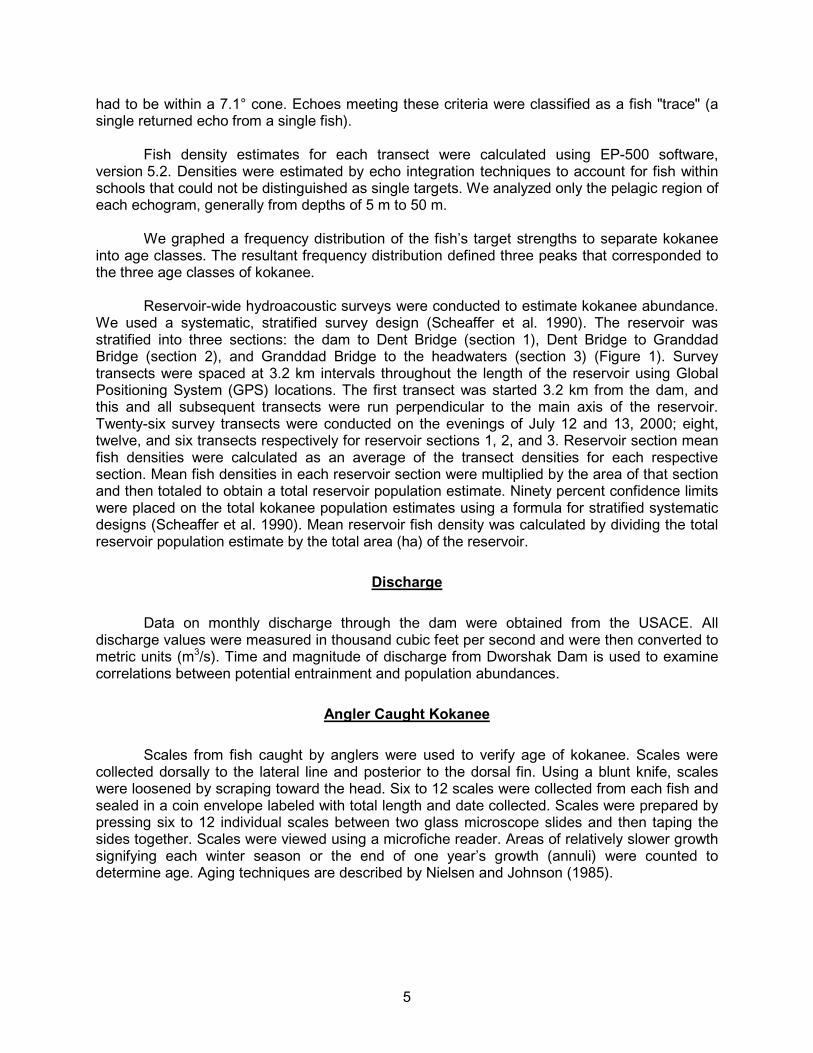
Scales from fish caught by anglers were used to verify age of kokanee. Scales were collected dorsally to the lateral line and posterior to the dorsal fin. Using a blunt knife, scales were loosened by scraping toward the head. Six to 12 scales were collected from each fish and sealed in a coin envelope labeled with total length and date collected. Scales were prepared by pressing six to 12 individual scales between two glass microscope slides and then taping the sides together. Scales were viewed using a microfiche reader. Areas of relatively slower growth signifying each winter season or the end of one year’s growth (annuli) were counted to determine age. Aging techniques are described by Nielsen and Johnson (1985).

6
Spawner Counts
We counted kokanee in four tributaries to Dworshak Reservoir to serve as an additional relative index of the adult population abundance. Spawning kokanee were counted in Isabella Creek, Dog Creek, Skull Creek, and Quartz Creek. We walked these streams from their mouths to the furthest upstream reaches utilized by kokanee. These tributaries have been surveyed annually from 1981 to 2000 on or near September 25, which was the peak of kokanee spawning (Horton 1980).
Strobe Light Research Platform Construction
To construct the strobe light research platform, arrangements were made with the USACE to borrow a pumpkin seed barge (5 x 8.8 m) and a floating aluminum dock (2.1 x 6.1m). Safety precautions were made a priority during construction, such as safety railing, propane storage, and protected electrical supply from the generator. The research platform was built according to the USACE Safety and Health Manual (EM385-1-1).
Construction was completed on the pumpkin seed, hereafter referred to as ‘the platform,’ while secured to the side of a public boat launch (Figure 2). A gas generator supplied power. A boat landing, 2.1 x 6.1 m floating dock and an outside work area, 1.2 x 6.1 m deck constructed of 5 x 15 cm pressure treated wood with a 13 x 13cm center opening for the lights) were attached to the platform. A welder was hired to weld the safety rails, winch boom, and assorted attaching points as needed to the platform.
A propane generator (Kohler 10RY 10,000 watts) was used to supply electricity for the strobe light control box (power head), computer, and interior lighting. The minimum surface area required to operate the generator at full power required the use of at least four 45.4 kg tanks. A distribution manifold was constructed to supply propane to the generator from four portable tanks, which allowed for ease of refilling and saved weight and space. An appropriate shelter was purchased considering the size of the equipment, interior workspace needed, and size and height of the strobe light power head 1.8 m H x 3.2 m W with power head in open mode.
At completion of the preliminary construction, arrangements were made with the USACE to load the large equipment: generator 263 kg, power head 816 kg, flash heads, cable, and spools 562 kg onto the platform. Weight distribution of the equipment was coordinated to optimize balance and insure safe floatation of the platform. Then, arrangements were made with a welder to be on-site to secure equipment onto the platform.
The shelter, a heavy-duty vinyl-covered 4.3 x 4.9 m structure (Cover-It® Instant Garage) was set up on the platform. Propane connections and electrical wiring (220 volt to power head and two 110 volt circuits) were then completed, and an electrician was brought on-site to inspect all wiring and connections.
A 3-point attachment pulley system was also constructed on the barge to secure the research platform in place within the fore bay. Existing anchored buoys and the face of the dam supplied the necessary anchor points. Approximately 457 m of 1.6 cm polypropylene rope was used between the buoys, dam, and the platform. We chose a 3-point anchor system over a bottom anchor because of water fluctuations and the depth of the fore bay, and because it allows easy movement of the platform between different turbine openings. A two-speed boat

7
trailer winch was used to tighten the ropes for proper platform placement. Since our strobe lights would be used at different depths, we used a quick disconnect system between the power supply cable to the lights and the power head to enable us to unspool and spool the supply cable up and down, respectively.
Figure 2. Completed strobe light research platform in the fore bay of Dworshak Reservoir, showing propane tanks, generator, steel anchoring structure, and gray shelter housing the strobe lights, power head, and computer.
RESULTS
Hydroacoustics
We estimated 2,397,691 kokanee in Dworshak Reservoir on July 2000 based on hydroacoustics. This included 1,894,857 age-0 kokanee (90% CI ± 23%), 303,680 age-1 kokanee (90% CI ± 22%), and 199,155 age-2 kokanee (90% CI ± 22%) (Table 1). Total density of kokanee in section 1 was 313 fish/ha. Densities in sections 2 and 3 were 535 fish/ha and 795 fish/ha, respectively. Abundance of age classes of kokanee also varied between reservoir sections (Figure 3).
Based on the results of the hydroacoustic surveys, we defined age-0 kokanee as fish between -60 and -42 dB, estimated between 25 and 139 mm TL (Figure 4). Age-1 kokanee were defined as fish between -41 and -36 dB (140 mm to 279 mm TL). Age-2 kokanee were defined as fish between -35 and -27 dB (>280 mm TL). No clear-cut break could be seen between age-1 and age-2 kokanee, so the separation point -36 dB was based on kokanee lengths from the creel survey.

8
Table 1. Estimated abundance of kokanee (thousands) in Dworshak Reservoir, Idaho, 1988-2000.
Density of Sampling Age Classes age-2 & -3
Year Technique 0+ 1+ 2+ 3+ Total (fish/ha) 2000 Hydroacoustic 1,894,857 303,680 199,155 0 2,397,692 37 1999 Hydroacoustic 1,143,634 363,250 38,464 0 1,545,348 35 1998 Hydroacoustic 537,000 73,000 39,000 0 649,000 7 1997 Trawling 65,000 0 0 0 65,000 0 1996 Hydroacoustic 231,000 43,000 29,000 0 303,000 5 1995b Hydroacoustic 1,630,000 1,300,000 595,000 0 3,539,000 110 1994 Hydroacoustic 156,000 984,000 304,000 9,000 1,457,000 69 1993 Trawling 453,000 556,000 148,000 6,000 1,163,000 33 1992 Trawling 1,040,000 254,000 98,000 0 1,043,000 22 1991 Trawling 132,000 208,000 19,000 6,000 365,000 5 1990a Trawling 978,000 161,000 11,000 3,000 1,153,000 3 1989b Trawling 148,000 148,000 175,000 0 471,000 32 1988 Trawling 553,000 501,000 144,000 12,000 1,210,000 29
a September trawling likely resulted in underestimation of the mature fish. b June sampling likely resulted in underestimation of age-0 kokanee.
0
100
200
300
400
500
600
700
800
900
1 2 3
Reservoir Section
Ko
kan
ee (
x1,0
00)
Age 0+
Age 1+
Age 2+
Figure 3. Abundance estimates for age-0, age-1, and age-2 kokanee based on hydroacoustic sampling in three sections of Dworshak Reservoir, 2000.

9
0
5
10
15
20
25
30
35
-60
-58
-56
-54
-52
-50
-48
-46
-44
-42
-40
-38
-36
-34
-32
-30
Target Strength (dB)
Fis
h T
rack
ed (
#)
Age 0+
Age 1+
Age 2+
Figure 4. Frequency distribution of fish’s target strengths sampled with hydroacoustics on Dworshak Reservoir, Idaho 2000.
Discharge
Mean monthly flows from Dworshak Dam ranged from a low of 36.8 m3/s to a high of 407.8 m3/s during 2000 (Figure 5). High flows occurred during releases in July and August (252 and 266 m3/s, respectively) to aid anadromous fishes downstream; however, the highest flows of the year came during spring runoff in April. Water was spilled at different times during April, July, and August in 2000, but the greatest frequency and magnitude of spill occurred during April, with an average of 402 m3/s.

10
0
50
100
150
200
250
300
350
400
450
Janu
ary
Febru
ary
Mar
chApr
ilM
ayJu
ne July
Augus
t
Septe
mbe
r
Octobe
r
Novem
ber
Decem
ber
Dis
char
ge
(m3 /s
)
Figure 5. Mean monthly discharge from Dworshak Dam, 2000.
Angler Caught Kokanee
A total of 70 angler-caught kokanee were sampled in early July 2000. Angler sampled kokanee averaged 272 mm total length (TL), with the largest measuring 330 mm (Figure 6). Scale aging revealed fish were either age-1+ or -2+; age-3+ kokanee were not represented in the catch. Age-1+ kokanee ranged from 230 to 279 mm TL, and age-2+ kokanee ranged from 280 mm to 330 mm TL. Growth of this magnitude recruits age-1 kokanee to the fishery.

11
0
2
4
6
8
10
12
14
16
230 240 250 260 270 280 290 300 310 320 330
Length (mm)
# o
f ko
kan
ee
Age 1Age 2
Figure 6. Length frequency of angler-caught kokanee from Dworshak Reservoir July 2000.
Spawner Counts
There was a 61% decrease in the number of kokanee counted in spawning tributaries from 11,320 in 1999 to 4,465 in 2000 (Table 2).

12
Table 2. Number of kokanee spawners counted in selected tributaries to Dworshak Reservoir during September 1981-2000.
Year Isabella Creek Skull Creek Quartz Creek Dog Creek Total (Isabella,
Quartz, and Skull)1
2000 3939 402 124 565 4,465 1999 10,132 361 827 2,207 11,320 1998 627 20 13 18 660 1997 144 0 0 0 144 1996 2,552 4 13 82 2,569 1995 12,850 20,850 2,780 1,160 36,480 1994 14,613 12,310 4,501 1,878 31,424 1993 29,171 7,574 2,476 6,780 39,221 1992 7,085 4,299 1,808 1,120 13,192 1991 4,053 1,249 693 590 5,996 1990 10,535 3,219 1,702 1,875 15,456 1989 11,830 5,185 2,970 1,720 19,985 1988 10,960 5,780 5,080 1,720 21,820 1987 3,520 1,351 1,477 700 6,348 1986 — — — — — 1985 10,000 8,000 2,000 20,000 1984 9,000 2,200 1,000 12,200 1983 2,250 135 66 2,451 1982 5,000 4,500 1,076 10,576 1981 4,000 3,220 850 8,070
1 Total does not include Dog Creek, because it was not censused until 1987.
DISCUSSION
Population abundance estimates in 2000 indicated Dworshak Reservoir kokanee were nearly recovered from the 95% entrainment losses in 1996 (Maiolie et al. 1999). Densities of age-0, age-1, and age-2 kokanee (Table 1), as well as spawning kokanee numbers (Table 2), have increased from previous years. Hatchery supplementation in 1998 (480,000 kokanee fry) and 1999 (890,000 kokanee fry) may have contributed to the increased numbers of fish in recent years. In addition, no extreme kokanee entrainment events have occurred since the spring of 1996. Therefore, Dworshak Reservoir achieved the management goal of maintaining densities of 30 to 50 adult (age-2 and older) kokanee/ha in 2000 (37/ha).
We feel confident that in 2000 nearly all pelagic fish with target strengths less than -38.0 dB (215 mm) were kokanee based on mid-water trawling from previous years’ sampling (Maiolie et al. 2001). However, approximately 130,000 hatchery rainbow trout 150 mm and larger were stocked into Dworshak Reservoir between March 26 and May 31, 2000. Therefore, our estimates of both age-1 and age-2 kokanee may contain rainbow trout. Depending upon survival for trout from the time of stocking until the time of the reservoir-wide hydroacoustic survey (no data on rainbow trout survival was estimated), our age-1 and age-2 estimates of kokanee may have included up to 130,000 rainbow trout, which likely overlap in target strength (TS) with the larger age-1 kokanee and the age-2 kokanee. However, it is likely most rainbow

13
trout were distributed much shallower than the kokanee depth layer where we analyzed for kokanee densities. Therefore, it is hard to estimate the contribution of rainbow trout to the hydroacoustic estimate. In the future, sampling of hatchery rainbow trout to obtain length frequency data may be conducted near the time of the hydroacoustic population survey as well as obtaining an estimate of trout survival rates. This sampling would greatly help to partition the amount of overlap in kokanee and trout size structure, and thus enable us to correct the kokanee population estimates accordingly.
Discharge of water from Dworshak Dam during 2000 did not seem to adversely affect kokanee abundance based on results from hydroacoustic surveys. Lastly, the spawner counts appeared unusually low considering the population estimate of kokanee based on echo sounding. The decrease in the count of spawning kokanee is not consistent with the increase in total abundance based on hydroacoustic estimates. We expected to count approximately 26,000 spawning kokanee in the survey tributaries based on the previously established relationship between the number of kokanee spawners and adult abundance (Maiolie and Elam 1993). If this trend continues, it may be pertinent to investigate the reason for a discrepancy in these two abundance measures.
CONCLUSIONS
Based on population abundance estimates derived using hydroacoustic techniques and spawner counts, kokanee numbers appear to have recovered from heavy entrainment losses in 1996. Favorable conditions, apparently minimal entrainment losses, and low abundances of kokanee in recent years have allowed for good growth and survival in Dworshak Reservoir.
RECOMMENDATIONS
1. Continue testing strobe lights at turbine intakes under various conditions.
2. Currently, stocking of kokanee is not needed. If stocking is needed in the future, we recommend stocking marked kokanee to discriminate between naturally produced and stocked fish.

14
ACKNOWLEDGMENTS
The authors would like to thank Charlie Craig and the Bonneville Power Administration for their help in funding and contracting this project. The authors would like to thank Bill Ament, Mark Duclos, and Bill Harryman for conducting the hydroacoustic survey and data analysis. We would also like to thank Ric Downing for his excellent work in the planning and construction of the strobe light research platform, virtually on his own. We also wish to thank Steve Yundt and Vaughn Paragamian for editing drafts of this report.

15
LITERATURE CITED
Cichosz, T., D. Saul, C. Rabe, A. Davidson, W. Warren, D. Rollins, J. Willey, and T. Tate. 2001. Draft FY 2002-2004 Mountain Snake Province Work Plan, Columbia Basin Fish and Wildlife Authority. Prepared for the Northwest Power Planning Council.
Falter, C. M. 1982. Limnology of Dworshak Reservoir in a low flow year. U.S. Army Corps of Engineers. Walla Walla, Washington.
Horton, W. A. 1980. Dworshak Reservoir fisheries investigations. Idaho Department of Fish and Game Job Performance Report. Prepared for U.S. Army Corps of Engineers, Contract Number DACW68-79-C-0034, Boise, Idaho.
Horton, W. A. 1981. Dworshak Reservoir fisheries investigations. Idaho Department of Fish and Game Job Performance Report. Prepared for U.S. Army Corps of Engineers, Contract Number DACW68-79-C-0034, Boise, Idaho.
Idaho Department of Fish and Game (IDFG). 2001. Fisheries Management Plan 2001-2006. Idaho Department of Fish and Game, Boise, Idaho.
Maiolie, M. A., D. P. Statler, and S. Elam. 1992. Dworshak Dam impact assessment and fishery investigation and trout, bass and forage species. Idaho Department of Fish and Game and Nez Perce Tribe, combined completion report. Prepared for Bonneville Power Administration, Project No. 87-99 and 87-407, Portland, Oregon.
Maiolie, M. A., and S. Elam. 1993. Dworshak Dam impact assessment and fisheries investigation. U.S. Department of Energy, Bonneville Power Administration, Project No. 87-99, Portland, Oregon.
Maiolie, M. A., and S. Elam. 1995. Dworshak Dam impact assessment and fisheries investigations project. Idaho Department of Fish and Game Annual Progress Report. Prepared for Bonneville Power Administration, Project No. 89-99, Portland, Oregon.
Maiolie, M. A., and S. Elam. 1998. Kokanee entrainment losses at Dworshak Reservoir. Idaho Department of Fish and Game Annual Progress Report. Prepared for Bonneville Power Administration, Project No. 87-99, Portland, Oregon.
Maiolie, M. A., N. Horner, J. Davis. 1991. Regional Fisheries Management Investigations. Idaho Department of Fish and Game Job Performance Report, Project F-71-R-14, Job 1-b, Boise, Idaho.
Maiolie, M. A., B. Ament and B. Harryman. 1999. Strobe light testing and kokanee population monitoring; Dworshak dam impacts assessment and fisheries investigation. Idaho Department of Fish and Game Annual Progress Report. Prepared for Bonneville Power Administration, Project No. 87BP35167, Portland, Oregon.
Maiolie, M. A., B. Harryman, and B. Ament. 2001. Response of free-ranging kokanee to strobe lights. Pages 27-36 in C.C. Coutant, editor. Behavioral technologies for fish guidance. American Fisheries Society, Symposium 26, Bethesda, Maryland.

16
Maiolie, M. A., D. T. Vidergar, and B. Harryman. 2001. Dworshak Reservoir Kokanee Population Monitoring. Idaho Department of Fish and Game Annual Progress Report. Prepared for U.S. Department of Energy, Bonneville Power Administration, Project No. 198709900, Portland, Oregon.
Nemeth, R. S., and J. J. Anderson. 1992. Response of juvenile coho and chinook salmon to strobe and mercury vapor lights. North American Journal of Fisheries Management 12:684-692.
Nielsen, L., and D. Johnson. 1985. Fisheries Techniques. American Fisheries Society Bethesda, Maryland.
Patrick, P. H. 1982. Responses of alewife to flashing light. Progress Report number 82-305-K. Ontario Hydro Research Division.
Ploskey, G. R., and P. N. Johnson. 1997. Development of behavioral technologies to improve the efficiency of surface collection and bypass structures on the Lower Columbia River. USAE Waterways Experiment Station, Stevenson, Washington.
Ploskey, G. R., and P. N. Johnson. 2001. Effectiveness of strobe lights and an infrasound device for eliciting avoidance by juvenile salmon. Pages 37-56 in C.C. Coutant, editor. Behavioral technologies for fish guidance. American Fisheries Society, Symposium 26, Bethesda, Maryland.
Rieman, B. E., and D. L. Myers. 1992. Influence of fish density and relative productivity on growth of kokanee in ten oligotrophic lakes and reservoirs in Idaho. Transactions of the American Fisheries Society 121:178-191.
Scheaffer, R. L., W. Mendenhall, and L. Ott. 1990. Elementary survey sampling, 4th edition. Duxbury Press, Belmont, California.
Skarr, D., J. DeShazer, L. Garrow, T. Ostrowski, and B. Thornburg. 1996. Investigation of fish entrainment through Libby Dam, 1990-1994. Montana Department of Fish, Wildlife and Parks. Prepared for Bonneville Power Administration, Project Number 83-467, Portland, Oregon.
Stober, Q. J., R. W. Tyler, C. E. Petrosky, K. P. Johnson, C. F. Cowman, Jr., J. Wilcock, and R. E. Nakatani. 1979. Development and evaluation of a net barrier to reduce entrainment loss of kokanee from Banks Lake. Fisheries Research Institute, Final Report. Prepared for U.S. Bureau of Reclamation, Contract No. 7-07-10-50023, University of Washington, Seattle, Washington.
Winans, G. A., P. B. Aebersold, and R. S. Waples. 1996. Allozyme variability of Oncorhynchus nerka in the Pacific Northwest, with special consideration to populations of Redfish Lake, Idaho. Transactions of the American Fisheries Society 125:645-6663.
Winchell, F. C., S. V. Amaral, and E. P. Taft. 1994. Research update on fish protection technologies for water intakes. Final Report for Electric Power Research Institute. Palo Alto, California.
Wydoski, R. S., and D. H. Bennett. 1981. Forage species in lakes and reservoirs of the western United States. Transactions of the American Fisheries Society 110:764-771.

17
Prepared by: Approved by:
IDAHO DEPARTMENT OF FISH AND GAME
Eric J. Stark Virgil K. Moore, Chief Fisheries Research Biologist Bureau of Fisheries
Melo A. Maiolie Steve Yundt Principal Fisheries Research Biologist Fisheries Research Manager