Brown’s Ferry: Accident & Implications Matthew Denman Nelson Royall.
Durham Research Online
Deposited in DRO:
20 November 2014
Version of attached �le:
Accepted Version
Peer-review status of attached �le:
Peer-reviewed
Citation for published item:
Yang, Keming and Banamah, Ahmad (2014) 'Quota sampling as an alternative to probability sampling? Anexperimental study.', Sociological research online., 19 (1). p. 29.
Further information on publisher's website:
http://dx.doi.org/10.5153/sro.3199
Publisher's copyright statement:
Additional information:
Use policy
The full-text may be used and/or reproduced, and given to third parties in any format or medium, without prior permission or charge, forpersonal research or study, educational, or not-for-pro�t purposes provided that:
• a full bibliographic reference is made to the original source
• a link is made to the metadata record in DRO
• the full-text is not changed in any way
The full-text must not be sold in any format or medium without the formal permission of the copyright holders.
Please consult the full DRO policy for further details.
Durham University Library, Stockton Road, Durham DH1 3LY, United KingdomTel : +44 (0)191 334 3042 | Fax : +44 (0)191 334 2971
http://dro.dur.ac.uk
Quota Sampling as an Alternative to
Probability Sampling? An Experimental
Study
by Keming Yang and Ahmad Banamah
University of Durham
Sociological Research Online, 18 (4) 24
<http://www.socresonline.org.uk/18/4/24.html>
10.5153/sro.3199
Received: 10 Apr 2013 Accepted: 9 Sep 2013 Published: 30 Nov 2013
Abstract
In spite of the establishment of probability sampling methods since the 1930s, non-
probability sampling methods have remained popular among many commercial and
polling agents, and they have also survived the embarrassment from a few incorrect
predictions in American presidential elections. The increase of costs and the decline
of response rates for administering probability samples have led some survey
researchers to search for a non-probability sampling method as an alternative to
probability sampling. In this study we aim to test whether results from a quota sample,
believed to be the non-probability sampling method that is the closest in
representativeness to probability sampling, are statistically equivalent to those from a
probability sample. Further, we pay special attention to the effects of the following
two factors for understanding the difference between the two sampling methods: the
survey's topic and the response rate. An experimental survey on social capital was
conducted in a student society in Northeast England. The results suggest that the
survey topic influences who responded and that the response rate was associated with
the sample means as well. For these reasons, we do not think quota sampling should
be taken as an acceptable alternative to probability sampling.
Keywords: Probability Sampling, Quota Sampling, Representativeness, Response
Rate, Social Capital
Introduction 1.1 In the mid-1920s, probability sampling started to replace full enumeration as an
efficient way of collecting reliable information on a population (Kruskal and
Mosteller 1980: 173). Nowadays, apart from national censuses, government agencies,
academic institutions or commercial organizations routinely employ probability
sampling to make inference about a particular population in the surveys they
administer (Rao 2000:1).
1.2 However, over the past several decades survey researchers have recognized two
major difficulties in following the probability sampling procedure. The first is the
rising cost of using probability samples. Some have even argued that 'cost is probably
the single most important factor driving the search for new methods of sampling'
(Brick 2011: 877), with the 'new methods of sampling' referring to non-probability
sampling methods. The second problem is the decline of response rates, and there has
been a large literature on this issue (Groves and Couper 1998; Groves, Dillman,
Eltinge and Little 2002). For instance, Curtin et al. (2005) examined the response rate
changes on the University of Michigan's Survey of Consumer Attitudes from 1979 to
1996. They found that the response rate faced a marked drop from 72 per cent to 62
per cent with an average decline of .75 per cent per year. Indeed, given the large
amount of time, money and other resources invested in probability sample surveys,
the declining response rates have led some researchers to claim that probability
samples with low response rates are no better than volunteering samples (Levy and
Lemeshow 1999; Brick 2011). Conversely, some have pointed out that a well-
designed non-probability sampling scheme such as quota sampling could produce a
quasi-representative sample (Neuman 2011: 243). To overcome these difficulties
some researchers have started to look for alternative ways of drawing a sample since
the mid-1900s (Stephan and McCarthy 1958; Godambe 1966; Royall 1970; Holt and
Smith 1979; Thompson and Seber 1996; Heckathorn 1997; Lavallee 2007).
1.3 The search for an alternative to probability samples points to the fundamental
issue of keeping a balance between cost and quality. On the one hand, few would
argue that we should sacrifice accuracy and quality while achieving speed and low
cost. On the other hand, non-probability samples would become attractive to survey
organizers if the quality of the results that they produce is within a 'satisfactory' range.
In the end, the dilemma boils down to the following question: given that a non-
probability sample is in principle inferior to probability sample in terms of
representativeness, could a non-probability sampling method such as quota sampling
produce a sample whose representativeness is so satisfactory that its relative low
quality is acceptable considering the lower cost of running a survey, the faster speed,
and maintaining the same level of response rate? If the answer is positive, then
perhaps it is time for survey researchers to switch from costly probability samples
struggling for a decent response rate to an equally good non-probability sample.
However, there does not seem to be enough convincing evidence yet for such switch.
Non-representativeness and low-response rate are two distinctive types of biases, and
it seems that survey researchers have been struggling to eliminate both of them at the
same time.
1.4 Moreover, our decision should not completely reply on theoretical discussions
based on probability theories with regard to the two sampling schemes as such
discussions often fail to demonstrate the effects of influencing factors on the practice
of sample surveys, such as the topic and reminders. Most social surveys focus on one
or a few limited number of substantive topics, which will appear to be appealing to
different groups of respondents. In other words, for a certain topic, the respondents of
a survey could be roughly classified into two groups, those who find the topic
interesting or relevant and thus are willing to participate and those who are in the
opposite situation. As we shall show later in this paper, the topic of the survey will
affect the willingness of participation, which in turn will affect the response rate and
the potential risk of collecting biased results. We need experimental data to show
whether the risk of poor or even biased representation of the population could be
reduced to an acceptable level with a non-probability sample, and more importantly,
we must demonstrate the source and the underlying mechanisms of such potential
bias, if shown to be the case.
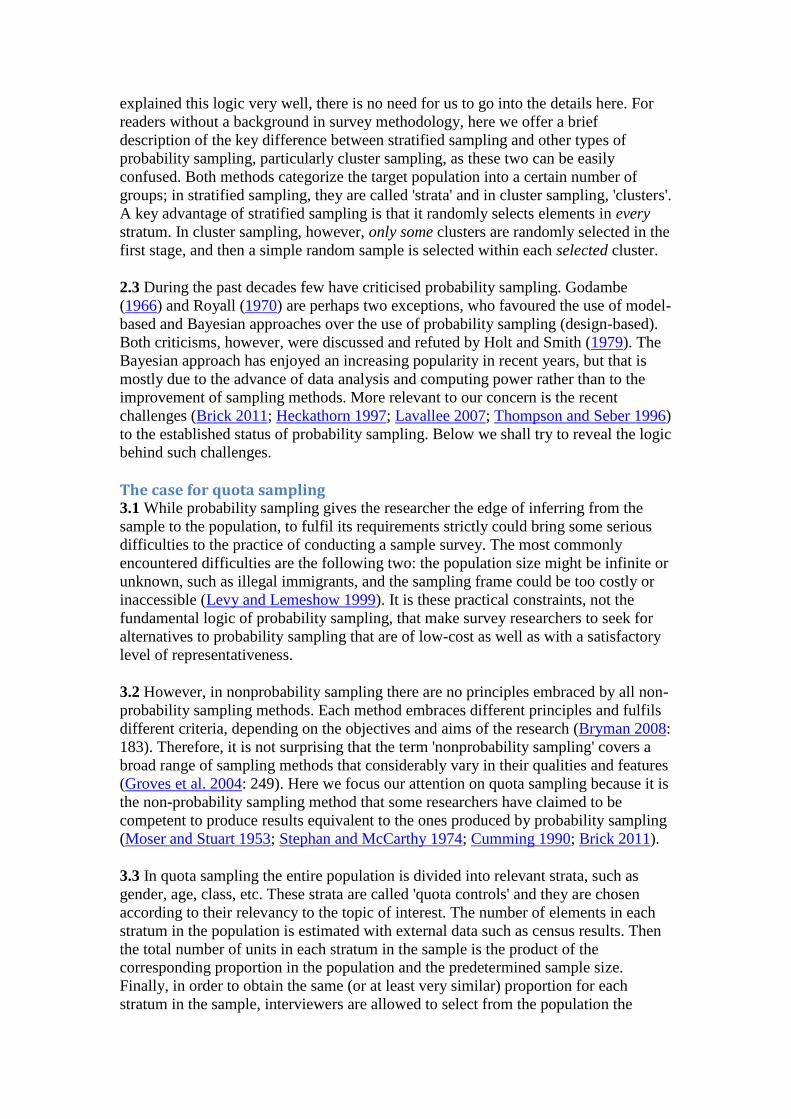
1.5 It is with these objectives in mind that we conducted an experiment in which we
compared the results of a probability sample with those of a non-probability sample
for the same survey. As Marsh and Scarbrough (1990) have noted – they refer to the
case of the UK but we think their point is applicable to social surveys in general,
'what missing in British survey research is a coherent programme reviewing the effect
of different sampling procedure' (1990: 485). More recently, Brick (2011) pointed out
that for the future of sampling, the relationship between probability and
nonprobability sampling must be addressed in the context of the decreasing response
rate and the increasing costs of data collection. We designed and conducted an
experimental survey on social capital in a student society in Northeast England. We
chose social capital as the theme of the survey due to its importance in university
students' life and its growing importance in sociological research. We realize that the
limited scope of our experiment may not allow us to reach a definite solution to the
choice of sampling method. We do believe, however, that our analysis of the
experiment will provide fresh evidence and insights to the comparative advantages (or
disadvantages) of each sampling scheme. It is our hope that studies such as ours will
eventually resolve the controversy over the choice of sampling schemes.
The case for probability sampling 2.1 The earliest discussion of probability sampling can be traced back to the work of
Karl Pearson (Pearson and Filon 1987; Pearson 1900). After about thirty years of
discussion of Pearson's ideas, Jerzy Neyman's essay 'On the Two Aspects of the
Representative Method' (1934) represented a major landmark in the history of
probability sampling. In his essay, Neyman compared between probability and
nonprobability sampling and explained the conditions under which the estimates from
non-probability samples could and could not be representative. Fifteen years after the
publication of Neyman's essay, his approach of probability sampling became widely
accepted by almost all leading statisticians, with a theory of probability-based design
being fully developed and the first generation of statistics text books being widely
adopted. In the mid-1960s, William Cochran (1964: 9) summarized the four principles
of the probability sampling method as follows:
1. The sampling procedure can identify how many possible samples can be
drawn from the investigated population and what possible units could be
included in each one of these samples;
2. Each possible sample has a known probability of selection;
3. The sampling method should select the samples in a process that assures that
each possible sample receives its appropriate probability of being selected;
4. The procedure of calculating the estimates which are going to be generalised
from the sample to the population must be known and lead to a unique
estimate for each sample.
2.2 Whilst this is not a place for explaining why such sampling scheme would lead to
the representativeness of sample estimates of population parameters, it is necessary to
point out, albeit briefly, that it is the probability distribution of sample estimates,
which are produced by such sampling procedure, that lays the foundation for
representativeness. As many statistical textbooks (Lohr 2010; Thompson 2012) have
explained this logic very well, there is no need for us to go into the details here. For
readers without a background in survey methodology, here we offer a brief
description of the key difference between stratified sampling and other types of
probability sampling, particularly cluster sampling, as these two can be easily
confused. Both methods categorize the target population into a certain number of
groups; in stratified sampling, they are called 'strata' and in cluster sampling, 'clusters'.
A key advantage of stratified sampling is that it randomly selects elements in every
stratum. In cluster sampling, however, only some clusters are randomly selected in the
first stage, and then a simple random sample is selected within each selected cluster.
2.3 During the past decades few have criticised probability sampling. Godambe
(1966) and Royall (1970) are perhaps two exceptions, who favoured the use of model-
based and Bayesian approaches over the use of probability sampling (design-based).
Both criticisms, however, were discussed and refuted by Holt and Smith (1979). The
Bayesian approach has enjoyed an increasing popularity in recent years, but that is
mostly due to the advance of data analysis and computing power rather than to the
improvement of sampling methods. More relevant to our concern is the recent
challenges (Brick 2011; Heckathorn 1997; Lavallee 2007; Thompson and Seber 1996)
to the established status of probability sampling. Below we shall try to reveal the logic
behind such challenges.
The case for quota sampling 3.1 While probability sampling gives the researcher the edge of inferring from the
sample to the population, to fulfil its requirements strictly could bring some serious
difficulties to the practice of conducting a sample survey. The most commonly
encountered difficulties are the following two: the population size might be infinite or
unknown, such as illegal immigrants, and the sampling frame could be too costly or
inaccessible (Levy and Lemeshow 1999). It is these practical constraints, not the
fundamental logic of probability sampling, that make survey researchers to seek for
alternatives to probability sampling that are of low-cost as well as with a satisfactory
level of representativeness.
3.2 However, in nonprobability sampling there are no principles embraced by all non-
probability sampling methods. Each method embraces different principles and fulfils
different criteria, depending on the objectives and aims of the research (Bryman 2008:
183). Therefore, it is not surprising that the term 'nonprobability sampling' covers a
broad range of sampling methods that considerably vary in their qualities and features
(Groves et al. 2004: 249). Here we focus our attention on quota sampling because it is
the non-probability sampling method that some researchers have claimed to be
competent to produce results equivalent to the ones produced by probability sampling
(Moser and Stuart 1953; Stephan and McCarthy 1974; Cumming 1990; Brick 2011).
3.3 In quota sampling the entire population is divided into relevant strata, such as
gender, age, class, etc. These strata are called 'quota controls' and they are chosen
according to their relevancy to the topic of interest. The number of elements in each
stratum in the population is estimated with external data such as census results. Then
the total number of units in each stratum in the sample is the product of the
corresponding proportion in the population and the predetermined sample size.
Finally, in order to obtain the same (or at least very similar) proportion for each
stratum in the sample, interviewers are allowed to select from the population the
calculated number of units in each stratum, and they are free to choose anyone as long
as the person meets the requirements of the stratum. People who are not willing to
participate are simply replaced by other people who are (Brinsky 2006).
3.4 The fundamental difference between quota sampling and probability sampling lies
in the last stage. If the participants in quota sampling are assigned equal probability of
being included in the sample, quota sampling will be equivalent to stratified sampling,
which is a probability sampling method, and the results of both methods should be the
same or very close. However, since the way of choosing the participants in quota
sampling is left to the interviewers, the samples drawn with the two methods agree
only in the quota-controls and may vary in other characteristics (Singleton and Straits
1999: 159). A key question then is whether the variation in these 'other characteristics'
will lead to a sample biased in a certain way. Users of quota sampling including many
well-established polling agencies such as Gallop in the USA and Mori in the UK
would argue that these characteristics – and therefore the potential biases – are
irrelevant to the topic of concern and that the efficiency and low cost of quota
sampling will outweigh the potential bias. This is perhaps why quota sampling has
survived disastrous predictions such as those by The Literary Digest in 1936 and pre-
presidential elections in 1948 in the US (Jacoby and Handlin 1991). The Literary
Digest successfully predicted the result of 1920, 1924, 1928 and 1932 U.S.
presidential election without using probability sampling or defining a sampling frame
for any of the previous surveys. In 1936 the magazine increased its sample from about
1 million to 10 million people assuming that this increase would improve the accuracy
of its results, predicting a huge victory for Alf Landon over Franklin D. Roosevelt,
which was a false prediction. The second event was the pre-election poll in 1948
between Truman and Dewey (Frankel and Frankel 1987), when most pre-election and
public opinion polls were still using quota sampling (Brinsky 2006). They had broad
agreement that the upcoming election would be decided for Dewey. The victory of
Truman over Dewey raised serious doubts as to quota sampling and left the social
research community divided about its reliability. The incorrect predictions resulted
from the fact that the used quota criteria missed some important factors that affected
how the Americans voted in those elections, but the question stayed as to whether the
two incorrect predictions would completely invalidate quota sampling.
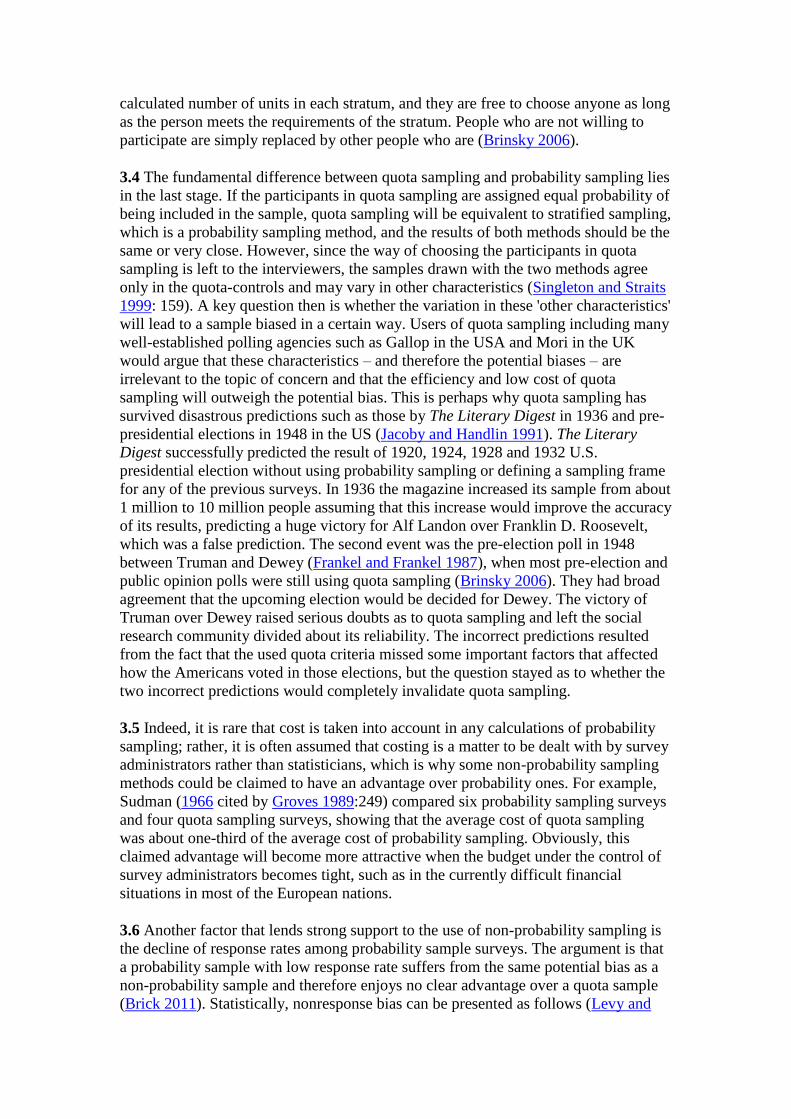
3.5 Indeed, it is rare that cost is taken into account in any calculations of probability
sampling; rather, it is often assumed that costing is a matter to be dealt with by survey
administrators rather than statisticians, which is why some non-probability sampling
methods could be claimed to have an advantage over probability ones. For example,
Sudman (1966 cited by Groves 1989:249) compared six probability sampling surveys
and four quota sampling surveys, showing that the average cost of quota sampling
was about one-third of the average cost of probability sampling. Obviously, this
claimed advantage will become more attractive when the budget under the control of
survey administrators becomes tight, such as in the currently difficult financial
situations in most of the European nations.
3.6 Another factor that lends strong support to the use of non-probability sampling is
the decline of response rates among probability sample surveys. The argument is that
a probability sample with low response rate suffers from the same potential bias as a
non-probability sample and therefore enjoys no clear advantage over a quota sample
(Brick 2011). Statistically, nonresponse bias can be presented as follows (Levy and
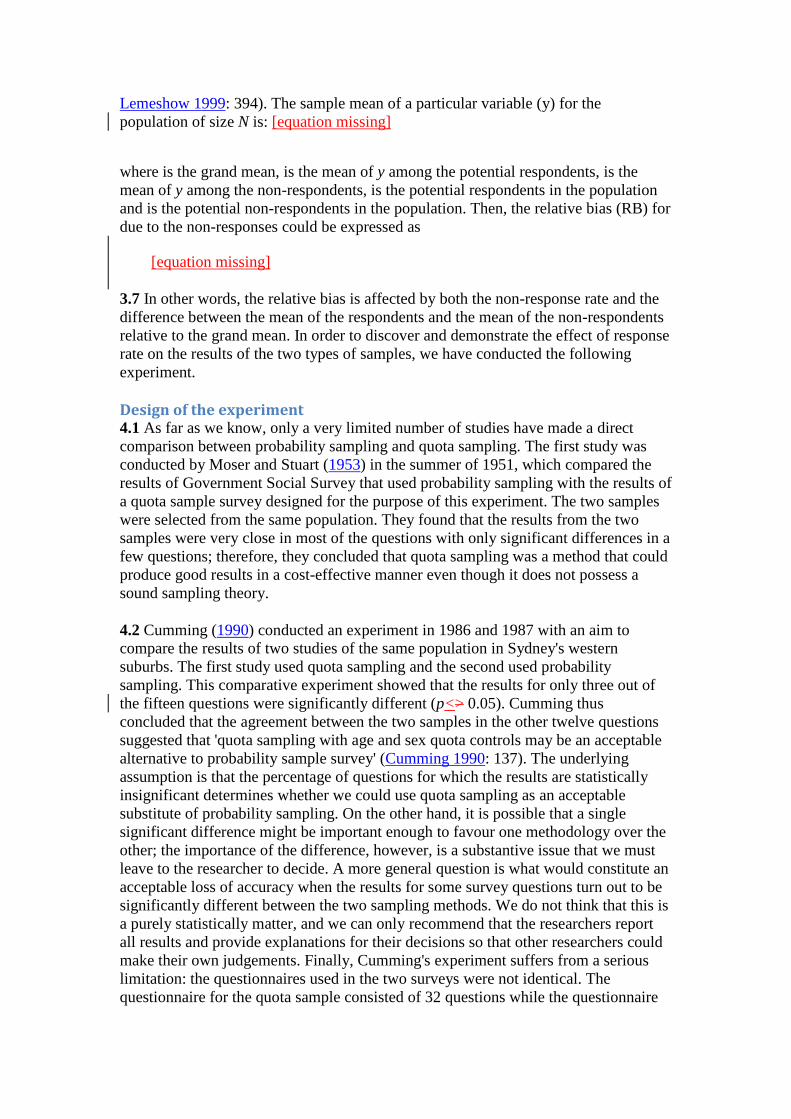
Lemeshow 1999: 394). The sample mean of a particular variable (y) for the
population of size N is: [equation missing]
where is the grand mean, is the mean of y among the potential respondents, is the
mean of y among the non-respondents, is the potential respondents in the population
and is the potential non-respondents in the population. Then, the relative bias (RB) for
due to the non-responses could be expressed as
[equation missing]
3.7 In other words, the relative bias is affected by both the non-response rate and the
difference between the mean of the respondents and the mean of the non-respondents
relative to the grand mean. In order to discover and demonstrate the effect of response
rate on the results of the two types of samples, we have conducted the following
experiment.
Design of the experiment 4.1 As far as we know, only a very limited number of studies have made a direct
comparison between probability sampling and quota sampling. The first study was
conducted by Moser and Stuart (1953) in the summer of 1951, which compared the
results of Government Social Survey that used probability sampling with the results of
a quota sample survey designed for the purpose of this experiment. The two samples
were selected from the same population. They found that the results from the two
samples were very close in most of the questions with only significant differences in a
few questions; therefore, they concluded that quota sampling was a method that could
produce good results in a cost-effective manner even though it does not possess a
sound sampling theory.
4.2 Cumming (1990) conducted an experiment in 1986 and 1987 with an aim to
compare the results of two studies of the same population in Sydney's western
suburbs. The first study used quota sampling and the second used probability
sampling. This comparative experiment showed that the results for only three out of
the fifteen questions were significantly different (p<> 0.05). Cumming thus
concluded that the agreement between the two samples in the other twelve questions
suggested that 'quota sampling with age and sex quota controls may be an acceptable
alternative to probability sample survey' (Cumming 1990: 137). The underlying
assumption is that the percentage of questions for which the results are statistically
insignificant determines whether we could use quota sampling as an acceptable
substitute of probability sampling. On the other hand, it is possible that a single
significant difference might be important enough to favour one methodology over the
other; the importance of the difference, however, is a substantive issue that we must
leave to the researcher to decide. A more general question is what would constitute an
acceptable loss of accuracy when the results for some survey questions turn out to be
significantly different between the two sampling methods. We do not think that this is
a purely statistically matter, and we can only recommend that the researchers report
all results and provide explanations for their decisions so that other researchers could
make their own judgements. Finally, Cumming's experiment suffers from a serious
limitation: the questionnaires used in the two surveys were not identical. The
questionnaire for the quota sample consisted of 32 questions while the questionnaire
for the probability sample consisted of 97 questions, and only 15 questions were
common. This raises the question about the influence that answering these common
questions in different contexts might have on the results.
4.3 Our experiment has the same aim to find out whether the differences between the
results from the two samples of the same population are statistically significant. In our
experiment, the probability sample will be treated as a control group and the non-
probability (quota) sample will be treated as an experimental group. The probability
sample was drawn by following a full probability sampling procedure. In order to
study the effect of reminders on the results, two reminders were sent to the
respondents of the probability sample; therefore, we have three groups of respondents,
each having a different response rate as a consequence of each respective reminder.
They will be compared with the quota sample to examine the influence of the
reminders on the relationship between quota and probability sampling. Respondents
of both samples were asked to fill in exactly the same questionnaire.
4.4 The population of this study was the members of a student society in one of the
universities in the Northeast of England, and its size (N) was 312. It consisted of
university students as well as people who were not part of the university. Members
who were not university students accounted for 17% of the population, while
university students accounted for the other 83%. Of the student members, 43% were
master students, 39% were PhD students, while undergraduate students comprised
only around 18%. The females accounted for 41% of the population and males 59%.
The population had a mean age of 33.4 (SD =9.1). Full permission was obtained from
the executive committee of the society to gain access to membership lists and records
and to conduct the experiment.
4.5 A probability sample of 40 members (n1=40) was selected by the systematic
sampling method. Since some first names tend to be more popular in certain ethnic
background, the whole membership list was randomized with randomization software.
In order to measure the influence of response rate, the respondents in this probability
sample were divided into three groups: the participants who responded immediately
without receiving any reminders (n=9, response rate=22.5%); the respondents who
responded after receiving the first reminder (n=17, response rate=42.5%) and all
participants in the probability sample who responded after receiving the second
reminder (n=27, response rate=67.5%). The latter two are cumulative participant
response totals in the three probability samples; that is, the sample of the 42.5%
response rate includes the sample of the 22.5% response rate, and that of the 67.5%
includes the other two samples of lower response rates.
4.6 For the quota sample, two quota-controls, gender (male and female) and
educational level (Master's, PhDs, and others) were used. We chose these two quota
variables because they are two social characteristics that we believe are related to
social capital among this particularly population – it is highly reasonable to expect
that students tend to make friends and join social activities that are of the same gender
and/or educational level due to convenience and/or comfort. The population was
therefore divided into six groups according to these quota controls. A sample of 60
members was selected by direct proportion to the population. In order to obtain the
sample, two assistants were asked to fill these groups with members. Each assistant
was responsible for three different groups to ensure no overlap between them. In order
to restrict the assistants' freedom, they were asked to contact the members from a
specific area in five locations that commonly known to be inhabited or regularly
visited by the society members. Furthermore, they were asked not to approach only
people they personally know or to immediately replace members who are unwilling to
participate with other members without trying to persuade them or approach them
again. As the reader will see soon, not all sixty selected members participated in the
quota sample, but the number of non-participants is very small.
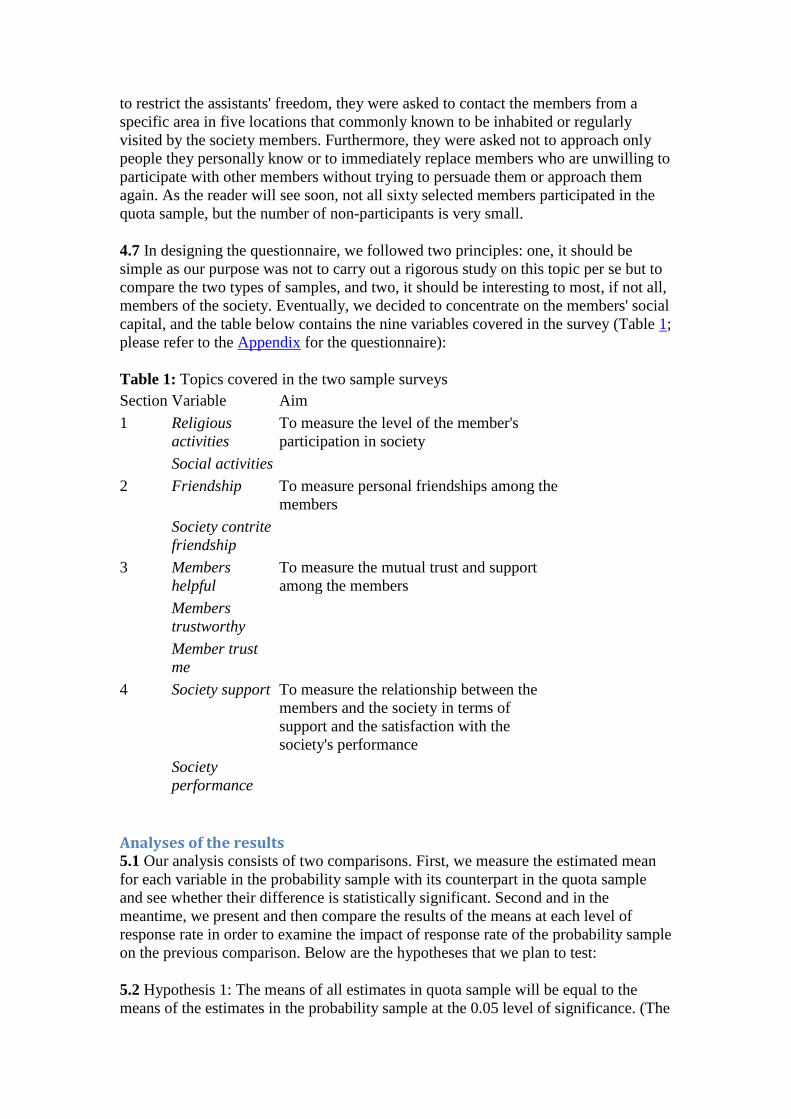
4.7 In designing the questionnaire, we followed two principles: one, it should be
simple as our purpose was not to carry out a rigorous study on this topic per se but to
compare the two types of samples, and two, it should be interesting to most, if not all,
members of the society. Eventually, we decided to concentrate on the members' social
capital, and the table below contains the nine variables covered in the survey (Table 1;
please refer to the Appendix for the questionnaire):
Table 1: Topics covered in the two sample surveys
Section Variable Aim
1 Religious
activities
To measure the level of the member's
participation in society
Social activities
2 Friendship To measure personal friendships among the
members
Society contrite
friendship
3 Members
helpful
To measure the mutual trust and support
among the members
Members
trustworthy
Member trust
me
4 Society support To measure the relationship between the
members and the society in terms of
support and the satisfaction with the
society's performance
Society
performance
Analyses of the results 5.1 Our analysis consists of two comparisons. First, we measure the estimated mean
for each variable in the probability sample with its counterpart in the quota sample
and see whether their difference is statistically significant. Second and in the
meantime, we present and then compare the results of the means at each level of
response rate in order to examine the impact of response rate of the probability sample
on the previous comparison. Below are the hypotheses that we plan to test:
5.2 Hypothesis 1: The means of all estimates in quota sample will be equal to the
means of the estimates in the probability sample at the 0.05 level of significance. (The
variables that were being compared across samples were ordinal, with the exception
of friendship, which was binary).
5.3 Hypothesis 2a: When the response rate is low (before any reminder was used),
there will be no significant difference between the quota sample and the probability
sample as the respondents tend to be similar (people who are willing or interested in
participating).
5.4 Hypothesis 2b: When the response rate becomes higher (after using reminders),
the difference between the quota sample and the probability sample will become
significant due to the results submitted by the non-willing participants.
Comparison of the means at the response rate of 22.5%
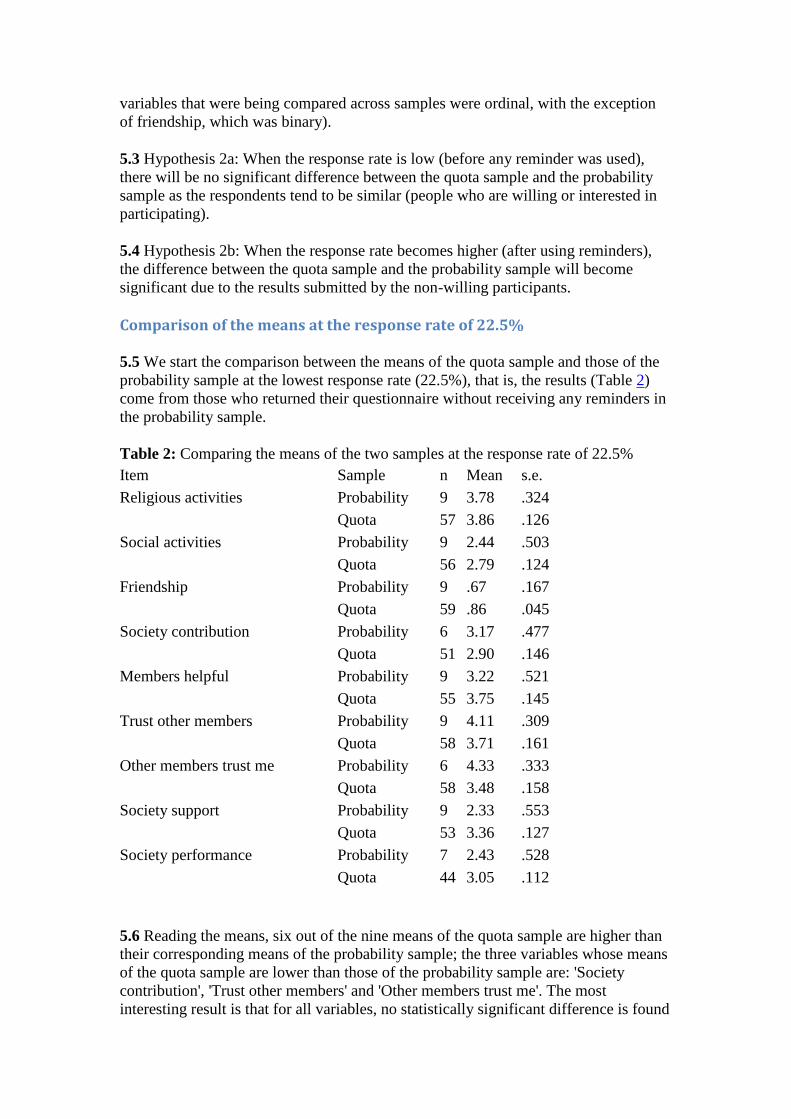
5.5 We start the comparison between the means of the quota sample and those of the
probability sample at the lowest response rate (22.5%), that is, the results (Table 2)
come from those who returned their questionnaire without receiving any reminders in
the probability sample.
Table 2: Comparing the means of the two samples at the response rate of 22.5%
Item Sample n Mean s.e.
Religious activities Probability 9 3.78 .324
Quota 57 3.86 .126
Social activities Probability 9 2.44 .503
Quota 56 2.79 .124
Friendship Probability 9 .67 .167
Quota 59 .86 .045
Society contribution Probability 6 3.17 .477
Quota 51 2.90 .146
Members helpful Probability 9 3.22 .521
Quota 55 3.75 .145
Trust other members Probability 9 4.11 .309
Quota 58 3.71 .161
Other members trust me Probability 6 4.33 .333
Quota 58 3.48 .158
Society support Probability 9 2.33 .553
Quota 53 3.36 .127
Society performance Probability 7 2.43 .528
Quota 44 3.05 .112
5.6 Reading the means, six out of the nine means of the quota sample are higher than
their corresponding means of the probability sample; the three variables whose means
of the quota sample are lower than those of the probability sample are: 'Society
contribution', 'Trust other members' and 'Other members trust me'. The most
interesting result is that for all variables, no statistically significant difference is found
between the means of the quota sample and this first group of probability sample.
Indeed, some means were almost identical such as the means of attending religious
activities, although the standard errors of the probability sample are bigger due to the
much smaller sample size.
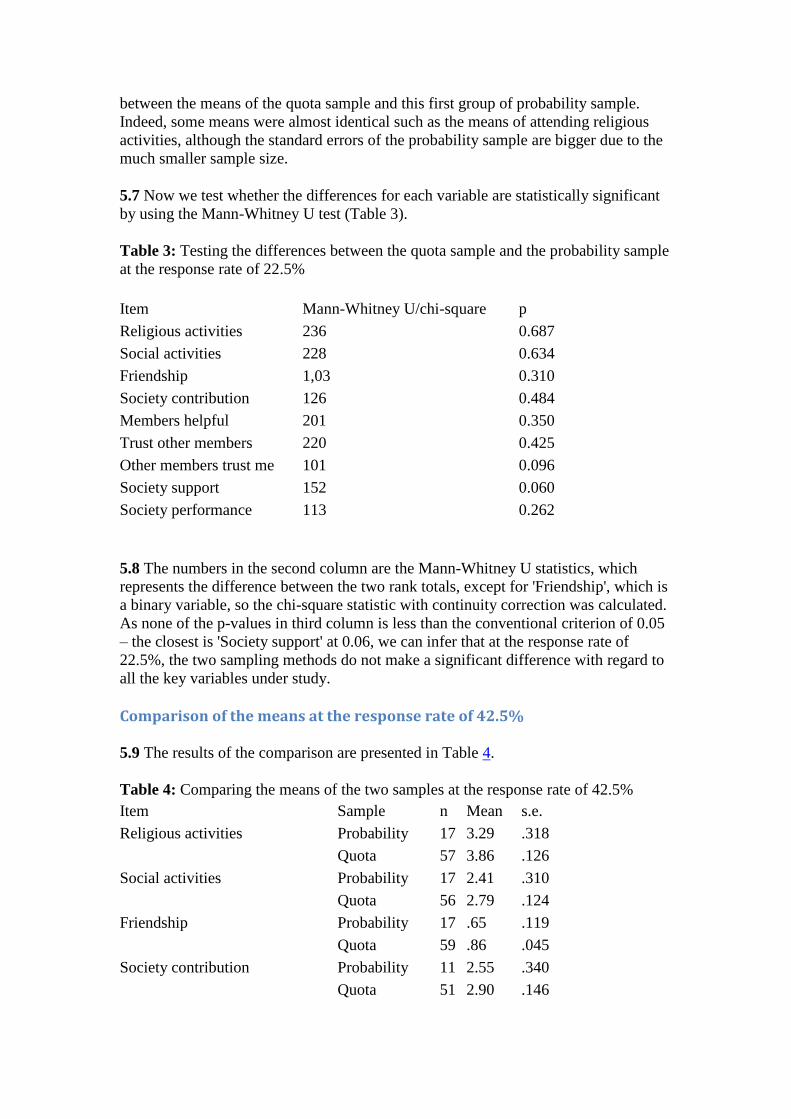
5.7 Now we test whether the differences for each variable are statistically significant
by using the Mann-Whitney U test (Table 3).
Table 3: Testing the differences between the quota sample and the probability sample
at the response rate of 22.5%
Item Mann-Whitney U/chi-square p
Religious activities 236 0.687
Social activities 228 0.634
Friendship 1,03 0.310
Society contribution 126 0.484
Members helpful 201 0.350
Trust other members 220 0.425
Other members trust me 101 0.096
Society support 152 0.060
Society performance 113 0.262
5.8 The numbers in the second column are the Mann-Whitney U statistics, which
represents the difference between the two rank totals, except for 'Friendship', which is
a binary variable, so the chi-square statistic with continuity correction was calculated.
As none of the p-values in third column is less than the conventional criterion of 0.05
– the closest is 'Society support' at 0.06, we can infer that at the response rate of
22.5%, the two sampling methods do not make a significant difference with regard to
all the key variables under study.
Comparison of the means at the response rate of 42.5%
5.9 The results of the comparison are presented in Table 4.
Table 4: Comparing the means of the two samples at the response rate of 42.5%
Item Sample n Mean s.e.
Religious activities Probability 17 3.29 .318
Quota 57 3.86 .126
Social activities Probability 17 2.41 .310
Quota 56 2.79 .124
Friendship Probability 17 .65 .119
Quota 59 .86 .045
Society contribution Probability 11 2.55 .340
Quota 51 2.90 .146
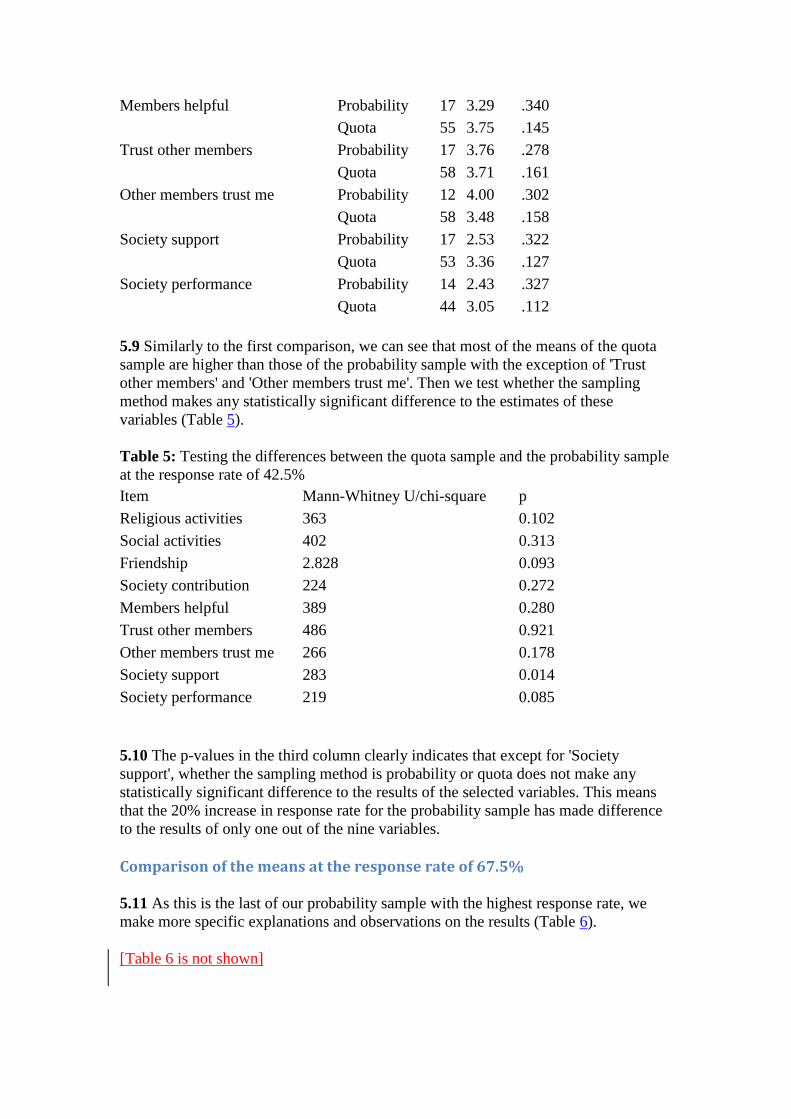
Members helpful Probability 17 3.29 .340
Quota 55 3.75 .145
Trust other members Probability 17 3.76 .278
Quota 58 3.71 .161
Other members trust me Probability 12 4.00 .302
Quota 58 3.48 .158
Society support Probability 17 2.53 .322
Quota 53 3.36 .127
Society performance Probability 14 2.43 .327
Quota 44 3.05 .112
5.9 Similarly to the first comparison, we can see that most of the means of the quota
sample are higher than those of the probability sample with the exception of 'Trust
other members' and 'Other members trust me'. Then we test whether the sampling
method makes any statistically significant difference to the estimates of these
variables (Table 5).
Table 5: Testing the differences between the quota sample and the probability sample
at the response rate of 42.5%
Item Mann-Whitney U/chi-square p
Religious activities 363 0.102
Social activities 402 0.313
Friendship 2.828 0.093
Society contribution 224 0.272
Members helpful 389 0.280
Trust other members 486 0.921
Other members trust me 266 0.178
Society support 283 0.014
Society performance 219 0.085
5.10 The p-values in the third column clearly indicates that except for 'Society
support', whether the sampling method is probability or quota does not make any
statistically significant difference to the results of the selected variables. This means
that the 20% increase in response rate for the probability sample has made difference
to the results of only one out of the nine variables.
Comparison of the means at the response rate of 67.5%
5.11 As this is the last of our probability sample with the highest response rate, we
make more specific explanations and observations on the results (Table 6).
[Table 6 is not shown]
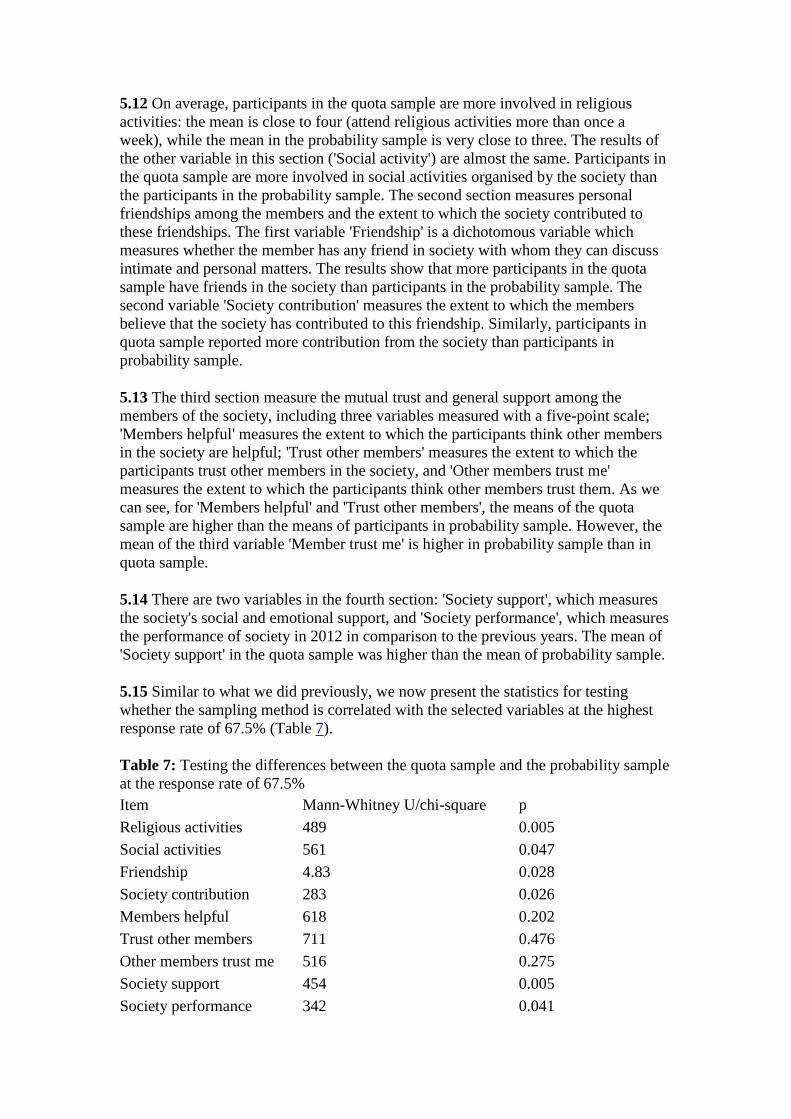
5.12 On average, participants in the quota sample are more involved in religious
activities: the mean is close to four (attend religious activities more than once a
week), while the mean in the probability sample is very close to three. The results of
the other variable in this section ('Social activity') are almost the same. Participants in
the quota sample are more involved in social activities organised by the society than
the participants in the probability sample. The second section measures personal
friendships among the members and the extent to which the society contributed to
these friendships. The first variable 'Friendship' is a dichotomous variable which
measures whether the member has any friend in society with whom they can discuss
intimate and personal matters. The results show that more participants in the quota
sample have friends in the society than participants in the probability sample. The
second variable 'Society contribution' measures the extent to which the members
believe that the society has contributed to this friendship. Similarly, participants in
quota sample reported more contribution from the society than participants in
probability sample.
5.13 The third section measure the mutual trust and general support among the
members of the society, including three variables measured with a five-point scale;
'Members helpful' measures the extent to which the participants think other members
in the society are helpful; 'Trust other members' measures the extent to which the
participants trust other members in the society, and 'Other members trust me'
measures the extent to which the participants think other members trust them. As we
can see, for 'Members helpful' and 'Trust other members', the means of the quota
sample are higher than the means of participants in probability sample. However, the
mean of the third variable 'Member trust me' is higher in probability sample than in
quota sample.
5.14 There are two variables in the fourth section: 'Society support', which measures
the society's social and emotional support, and 'Society performance', which measures
the performance of society in 2012 in comparison to the previous years. The mean of
'Society support' in the quota sample was higher than the mean of probability sample.
5.15 Similar to what we did previously, we now present the statistics for testing
whether the sampling method is correlated with the selected variables at the highest
response rate of 67.5% (Table 7).
Table 7: Testing the differences between the quota sample and the probability sample
at the response rate of 67.5%
Item Mann-Whitney U/chi-square p
Religious activities 489 0.005
Social activities 561 0.047
Friendship 4.83 0.028
Society contribution 283 0.026
Members helpful 618 0.202
Trust other members 711 0.476
Other members trust me 516 0.275
Society support 454 0.005
Society performance 342 0.041

5.16 To sum up, apart from the third variable in third section, the means of all
variables in the quota sample are always higher than their counterparts in the
probability sample. Furthermore, apart from the three variables in the third section,
the means of all variables in all sections in the quota sample are significantly different
from their counterparts in the probability sample.
Discussions 6.1 The present study aims to find out whether a probability sample and a quota
sample would produce statistically equivalent results and to examine the impact of
response rate on the results. We hypothesize that quota sampling is not able to
produce results that are statistically equivalent to those produced by probability
sampling and that response rate has a significant effect on any difference found; more
specifically, when the response rate is high we expect that the different between the
two samples will be significant and when the response rate is low, the results from the
two samples tend to be similar.
6.2 The above analyses have confirmed the first hypothesis. In most of the measured
variables, the estimated means produced by probability sampling are significantly
different from those produced by quota sampling (p < 0.05). These results differ from
the findings by Moser and Stuart (1953) and Cumming (1990) which suggest that
quota sampling produces similar results to probability sampling. Conversely, our
results are generally consistent with those by Marsh and Scarbrough (1990) who have
showed that there are significant differences between the estimates of probability
sampling and quota sampling.
6.3 A possible explanation of these significant differences in this study can be related
to the survey topic itself. The questionnaire used in this study measures some aspects
of social capital that includes levels of involvement and social support received from
the society. It is possible that people who were more satisfied with the role of the
society and its activities were more interested in participating in the survey, while
people who were not satisfied refused to take part. This could lead to marked bias in
quota sample against people who were less satisfied with the society as they were
simply replaced by other participants once they had refused. Although strict
instructions were given to the assistants that they do not immediately replace people
who refused without making attempts to persuade them, once the assistants enters the
field there is no way to insure that the given instructions were exactly followed as the
assistants' judgments of selection become the dominant guiding force. This
explanation agrees with what Stephan and McCarthy (1974) concluded from their
review of many empirical studies about quota sampling; that is, interviewers must be
well trained and closely monitored to be able to persuade people who refuse to
participate and not replace them immediately once they refuse. Otherwise, assistants'
decision in selecting the respondents will be the main source of bias.
6.4 The direction of the difference between the probability and quota sample supports
the previous explanation for the significant difference between the two samples. With
the exception of 'Other members trust me' variable, the means of all other variables in
quota sample were significantly higher than their counterparts in the probability
samples. This demonstrates that the participants in the quota sample had much higher

positive perceptions about the society and were much involved in its activities than
the participants in the probability sample.
6.5 It is important to note that the results do not completely confirm the first
hypothesis. The hypothesis predicts that the difference between the two samples will
be significant in all variables. However, the results show that there are three variables
whose means are not significantly different. It is worth pointing out that all of the
three variables are from the third section which measures the level of mutual trust and
support among the members generally and they are the only variables measured using
Likert scale. It is difficult to ignore the similarity between the three variables while
we are seeking for an explanation for this exception. A possible explanation for this
exception might be that the investigated population was remarkably homogeneous
regarding these three variables. High level of homogeneity means there is a good
chance that any selected sample will produce similar results and there is no need to
select large and probability sample to ensure representativeness. This assumption is
supported by the fact that through the three comparisons made in this study no mean
of these three variables is significantly different from its counterpart in the other
sample.
6.6 The results also support our hypotheses that response rate is an influential factor
in the relationship between quota and probability sampling. In both sampling
processes, people who were interested in the survey topic or had a personal
motivation for participating in the survey would be the first people to respond, while
people who were not interested in the survey topic were more likely to refuse. The
main difference between the two ways of sampling is that in probability sampling
three attempts were made to persuade those who refused or failed to respond to
participate in the survey. If they did not respond, they would be counted in the rate of
nonresponse which determines whether the obtained data should be weighted to
achieve representativeness. However, in quota sampling these people were simply
replaced with people who were willing to participate and were more likely to have
different opinions of the society from those who were unwilling to participate.
Therefore, if the probability sampling failed to achieve high rate of response, or if the
interviewer immediately replaced people who are unwilling to participate, the
respondents in both samples would be biased toward people who were interested and
had personal interest in participating. The comparison between the quota sample and
the first group in probability sample indicates that there was no significant difference
between the two samples in most variables. After we included the people who
responded after receiving the first reminder (the second group) the difference between
the two samples in some variables became larger but remained statistically
insignificant. However, when the all participants in the probability sample were
included in the comparison (the third group in the probability sample with the highest
response rate), all variables, with the exception of the three variables in the third
section, became significantly different from their counterparts in the quota sample.
6.7 This can be explained with logic that the first group of respondents in the two
samples tended to be people who are interested in the survey topic. It can be assumed
that those people had positive perceptions about the society tended to respond
positively. However, when the reminders were sent, people who were less interested
or those who had negative perceptions started to respond, which changed the means of
the probability sample to became significantly different from the means of the quota
samples. This assumption can be supported by the fact that most of the means in the
first group of probability sample were much higher than their counterparts in the
second group of probability sample, and the same relation existed between the second
and the third groups in the probability sample. This means that people who responded
later had less positive perceptions about the society which changed the means of the
probability sample to become significantly different from the quota sample.
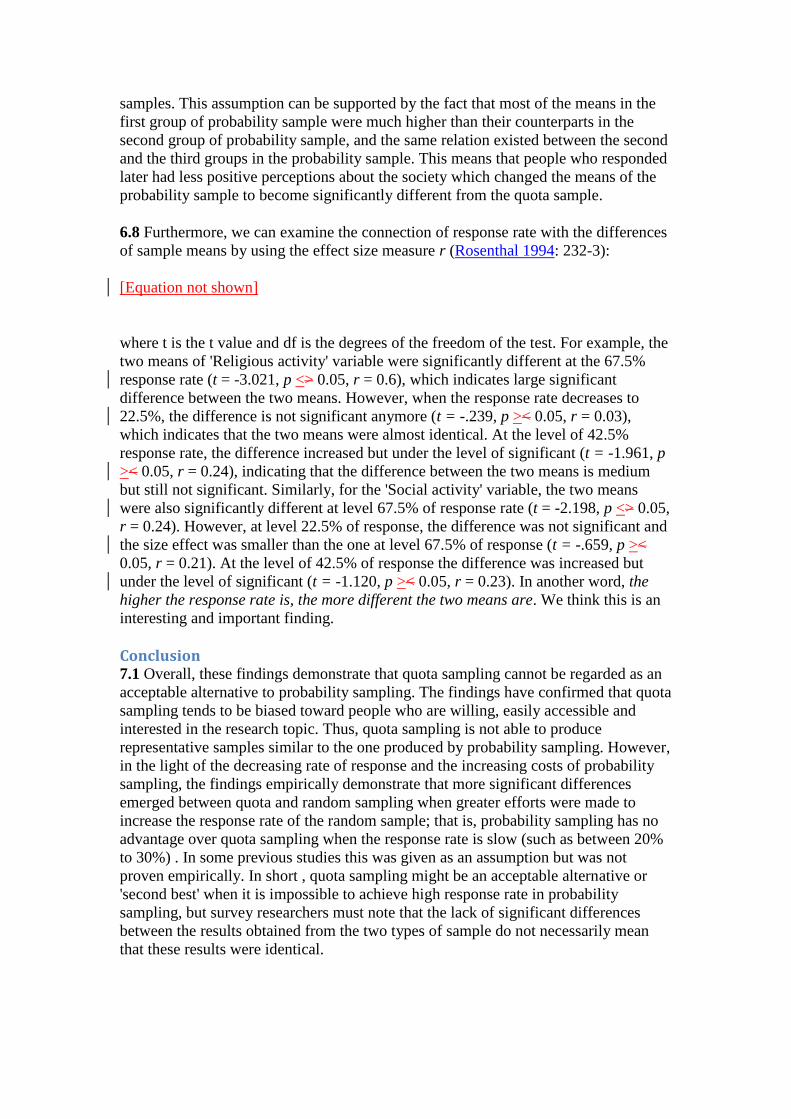
6.8 Furthermore, we can examine the connection of response rate with the differences
of sample means by using the effect size measure r (Rosenthal 1994: 232-3):
[Equation not shown]
where t is the t value and df is the degrees of the freedom of the test. For example, the
two means of 'Religious activity' variable were significantly different at the 67.5%
response rate (t = -3.021, p <> 0.05, r = 0.6), which indicates large significant
difference between the two means. However, when the response rate decreases to
22.5%, the difference is not significant anymore (t = -.239, p >< 0.05, r = 0.03),
which indicates that the two means were almost identical. At the level of 42.5%
response rate, the difference increased but under the level of significant (t = -1.961, p
>< 0.05, r = 0.24), indicating that the difference between the two means is medium
but still not significant. Similarly, for the 'Social activity' variable, the two means
were also significantly different at level 67.5% of response rate (t = -2.198, p <> 0.05,
r = 0.24). However, at level 22.5% of response, the difference was not significant and
the size effect was smaller than the one at level 67.5% of response (t = -.659, p ><
0.05, r = 0.21). At the level of 42.5% of response the difference was increased but
under the level of significant (t = -1.120, p >< 0.05, r = 0.23). In another word, the
higher the response rate is, the more different the two means are. We think this is an
interesting and important finding.
Conclusion 7.1 Overall, these findings demonstrate that quota sampling cannot be regarded as an
acceptable alternative to probability sampling. The findings have confirmed that quota
sampling tends to be biased toward people who are willing, easily accessible and
interested in the research topic. Thus, quota sampling is not able to produce
representative samples similar to the one produced by probability sampling. However,
in the light of the decreasing rate of response and the increasing costs of probability
sampling, the findings empirically demonstrate that more significant differences
emerged between quota and random sampling when greater efforts were made to
increase the response rate of the random sample; that is, probability sampling has no
advantage over quota sampling when the response rate is slow (such as between 20%
to 30%) . In some previous studies this was given as an assumption but was not
proven empirically. In short , quota sampling might be an acceptable alternative or
'second best' when it is impossible to achieve high response rate in probability
sampling, but survey researchers must note that the lack of significant differences
between the results obtained from the two types of sample do not necessarily mean
that these results were identical.
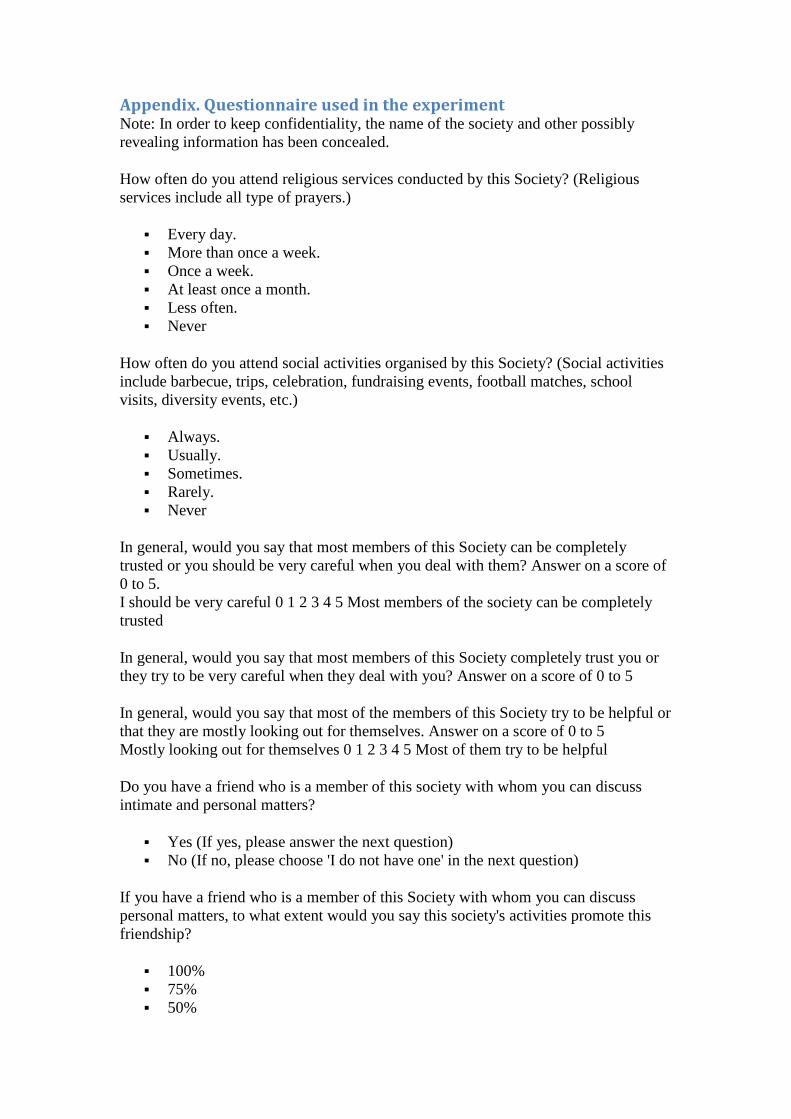
Appendix. Questionnaire used in the experiment Note: In order to keep confidentiality, the name of the society and other possibly
revealing information has been concealed.
How often do you attend religious services conducted by this Society? (Religious
services include all type of prayers.)
Every day.
More than once a week.
Once a week.
At least once a month.
Less often.
Never
How often do you attend social activities organised by this Society? (Social activities
include barbecue, trips, celebration, fundraising events, football matches, school
visits, diversity events, etc.)
Always.
Usually.
Sometimes.
Rarely.
Never
In general, would you say that most members of this Society can be completely
trusted or you should be very careful when you deal with them? Answer on a score of
0 to 5.
I should be very careful 0 1 2 3 4 5 Most members of the society can be completely
trusted
In general, would you say that most members of this Society completely trust you or
they try to be very careful when they deal with you? Answer on a score of 0 to 5
In general, would you say that most of the members of this Society try to be helpful or
that they are mostly looking out for themselves. Answer on a score of 0 to 5
Mostly looking out for themselves 0 1 2 3 4 5 Most of them try to be helpful
Do you have a friend who is a member of this society with whom you can discuss
intimate and personal matters?
Yes (If yes, please answer the next question)
No (If no, please choose 'I do not have one' in the next question)
If you have a friend who is a member of this Society with whom you can discuss
personal matters, to what extent would you say this society's activities promote this
friendship?
100%
75%
50%

25%
00%
I do not have one
Generally speaking, to what extent would you say the existence of this Society is
beneficial for you in terms of social relationships?
100%
75%
50%
25%
00%
How would you rate the performance of this society during this year compared to last
years?
Very good
Good
Normal
Poor
Very poor
What is your gender?
Male
Female
If you are a student, what is your education level?
School Student
Undergraduate
Master
PhD
Higher
Not a student
Which category below includes your age?
17 or younger
18-22
23-29
30-39
40-49
50-59
60 or older
Are you living in a university college?
Yes
No
References BRICK, M. (2011) 'The Future of Survey Sampling', Public Opinion Quarterly
(Special Issue) 75(5), p.872-888.
BRINSKY, A. (2006) 'American Public Opinion in the 1930s and 1940s: The
Analysis of Quota-Controlled Sample Survey Data', The Public Opinion Quarterly
70(4), p.499-529.
BRYMAN, A. (2008) Social Research Method. London and New York: Oxford
University Press.
COCHRAN, W. (1964) Sampling Techniques. New York: Wiley.
CUMMING, R. (1990) 'Is probability Sampling Always Better? A Comparison of
Results from a Quota and Probability Sample Survey', Community Health Studies
14(2), p.132-137.
CURTIN, R., PRESSER, S. and SINGER, S. (2005) 'Changes in Telephone Survey
Nonresponse over the Past Quarter Century', Public Opinion Quarterly 69 (1), p.87-
98.
GODAMBE, V. (1966) 'A New Approach to Sampling from Finite Populations. II.
Distribution-Free Sufficiency', Journal of the Royal Statistical Society Series B
(Methodological) 28, p.320-28.
GROVES, R. (1989) Survey Errors and Survey Cost. Hoboken, New Jersey: John
Wiley & Sons.
GROVES, R. (2006) 'Nonresponse Rates and Nonresponse Bias in Household
Surveys', Public Opinion Quarterly 70(5), p.646-675.
GROVES, R. M., & COUPER, M. P. (1998) Nonresponse in Household Interview
Surveys. New York: John Wiley & Sons.
GROVES, R. M., DILLMAN, D. A., ELTINGE, J. L., & LITTLE, R. J. A. (Eds.).
(2002) Survey Nonresponse. New York: John Wiley & Sons.
GROVES, R., PRESSER, S., and DIKE, S. (2004) 'The Role of Topic Interest in
Survey Participation Decisions', Public Opinion Quarterly 68(1) p.2-31.
HECKATHORN, D. (1997) 'Respondent-Driven Sampling: A New Approach to the
Study of Hidden Populations', Social Problems 44, p.174-99.
HOLT, D. and SMITH, T. (1979) 'Post-Stratification', Journal of the Royal Statistical
Society Series A 142, p.33-46.
JACOBY, J. and HANDLIN, A.H. (1991) 'Non-probability designs for litigation
surveys', The Trademark Reporter 81, p.169-179.

KRUSKAL, W. and MOSTELLER, F. (1980) 'Representative Sampling IV: The
History of the Concept in Statistics, 1895-1939', International Statistical Review 48,
p.169-95.
LAVALLEE, P. (2007) Indirect Sampling. New York: Springer.
LEVY, P. and LEMESHOW, S. (1999) Sampling of Populations: Methods and
Applications. New York: John Wiley & Sons.
LOHR, S. L. (2010) Sampling: Design and Analysis. CA: Duxbury Press.
MARSH, C. and SCARBROUGH, E. (1990) 'Testing nine hypotheses about quota
sampling', Journal of Market Research Society (JMRS) 32(4), p.485-506.
MOSER, C.A. and STUART, A. (1953) 'An experimental study of Quota Sampling',
Journal of the Royal Statistical Society Series A 116(4), p.349-405.
NEUMAN, W. (2011) Social Research Method. Pearson, 7th
edition.
NEYMAN, J. (1934) 'On the Two Different Aspects of the Representative Method:
The Method of Stratified Sampling and the Method of Purposive Selection', Journal
of the Royal Statistical Society 97, p.558-625.
PEARSON, K., & FILON, L. N. G. (1897) 'On the probable errors of frequency
constants and on the influence of random selection on variation and correlation',
Proceedings of the Royal Society of London, 62, p.173–176.
PEARSON, K. (1990) 'On the criterion that a given system of deviations from the
probable in the case of a correlated system of variables is such that it can be
reasonably supposed to have arisen from random sampling'. Philosophical Magazine
50, p.157–175.
RAO, P. (2000) Sampling Methodologies with Applications, USA: Chapman & Hall.
ROSENTHAL, R. (1994) 'Parametric Measures of Effect Size', p.231-243 in Harris
M. Cooper, Larry V. Hedges (eds.), The Handbook of Research Synthesis, Russell
Sage Foundation.
ROYALL, R. (1970) 'On Finite Population Sampling Theory under Certain Linear
Regression Models', Biometrika 57, p.377-87.
SINGLETON, R. and STRAITS, B. (1999) Approaches to Social Research, 3rd
edition. New York: Oxford University Press.
STEPHAN, F. and MCCARTHY, P. (1974) Sampling Opinions: An Analysis of
Survey Procedure, 2nd
edition. New York: Wiley.
SUDMAN, S. (1966) 'Probability Sampling with Quotas', American Statistical
Association Journal 20, p.749-71.

THOMPSON, S. (2012) Sampling, 3rd
edition. New York: Willey-Blackwell.
THOMPSON, S. and SEBER, G. (1996) Adaptive Sampling. New York: Wiley.