“Dude, Where’s My Data?” UCB DataDude (v. 0.6.7) User...
31
UCB_DataDude_UserGuide_updated_Track Changes_WP.doc August 2006 1 “Dude, Where’s My Data?” UCB DataDude (v. 0.6.7) User Guide Center for Social Services Research University of California at Berkeley http://cssr.berkeley.edu/ “Dude, Where’s My Data?”…The University of California, Berkeley (UCB) DataDude is freely available for the use of California counties and others who wish to download data from the CWS/CMS reports on the Center for Social Services Research website: http://cssr.berkeley.edu/cwscmsreports/ The DataDude (MS Excel) and Documentation for users are available at: http://cssr.berkeley.edu/datadude/ Contents 1. Introduction ..................................................................................................................... 2 2. Set Up.............................................................................................................................. 2 3. Downloading the DataDude to use as a Template……………………………..……….3 4. Tour the DataDude.......................................................................................................... 3 5. Basic Use ........................................................................................................................ 7 Part 1: Get Data............................................................................................................... 7 Method A: Select a Summary Report from the Dropdown Menu .............................. 7 Method B: Use a Sample Web Address:..................................................................... 8 Part 2: Create Summary Table for Graphing ................................................................ 12 Part 3: Create a Chart for Graph ................................................................................... 16 Part 4: Create a File with Another Measure.................................................................. 18 6. Advanced Use ............................................................................................................... 18 7. Troubleshooting ............................................................................................................ 20 Missing Cells ................................................................................................................ 20 Columns with Incorrect Titles ...................................................................................... 22 Graphing Errors: Problem One ..................................................................................... 23 Graphing Errors: Problem Two .................................................................................... 24 Share the UCB DataDude ............................................................................................. 27 8. Technical Support, Questions, and Feedback ............................................................... 27 Appendix 1: Determining Versions of Windows OS and Excel....................................... 28 Appendix 2: Enabling Macros in Microsoft Excel ........................................................... 28 Appendix 3: Obtaining a Sample Web Address ............................................................... 30
Transcript of “Dude, Where’s My Data?” UCB DataDude (v. 0.6.7) User...
UCB_DataDude_UserGuide_updated_Track Changes_WP.doc August 2006
1
“Dude, Where’s My Data?” UCB DataDude (v. 0.6.7) User Guide Center for Social Services Research University of California at Berkeley
http://cssr.berkeley.edu/ “Dude, Where’s My Data?”…The University of California, Berkeley (UCB) DataDude is freely available for the use of California counties and others who wish to download data from the CWS/CMS reports on the Center for Social Services Research website: http://cssr.berkeley.edu/cwscmsreports/ The DataDude (MS Excel) and Documentation for users are available at: http://cssr.berkeley.edu/datadude/ Contents 1. Introduction..................................................................................................................... 2 2. Set Up.............................................................................................................................. 2 3. Downloading the DataDude to use as a Template……………………………..……….3 4. Tour the DataDude.......................................................................................................... 3 5. Basic Use ........................................................................................................................ 7
Part 1: Get Data............................................................................................................... 7 Method A: Select a Summary Report from the Dropdown Menu .............................. 7 Method B: Use a Sample Web Address:..................................................................... 8
Part 2: Create Summary Table for Graphing ................................................................ 12 Part 3: Create a Chart for Graph ................................................................................... 16 Part 4: Create a File with Another Measure.................................................................. 18
6. Advanced Use ............................................................................................................... 18 7. Troubleshooting ............................................................................................................ 20
Missing Cells ................................................................................................................ 20 Columns with Incorrect Titles ...................................................................................... 22 Graphing Errors: Problem One ..................................................................................... 23 Graphing Errors: Problem Two .................................................................................... 24 Share the UCB DataDude ............................................................................................. 27
8. Technical Support, Questions, and Feedback ............................................................... 27 Appendix 1: Determining Versions of Windows OS and Excel....................................... 28 Appendix 2: Enabling Macros in Microsoft Excel ........................................................... 28 Appendix 3: Obtaining a Sample Web Address ............................................................... 30

UCB_DataDude_UserGuide_updated_Track Changes_WP.doc August 2006
2
This Guide Welcome to the UCB DataDude User Guide for v. 0.6.7. This guide offers information about the use of the University of California at Berkeley (UCB) DataDude version 0.6.7. This guide assumes a general familiarity with the UCB CWS/CMS reports website and the analysis of child welfare data. Instructions and screen captures are based on a Microsoft (MS) Windows 2000 Pro / MS Excel XP configuration. Other configurations should follow similar sequences and have a present screen appearance, but may differ in specifics. 1. Introduction The purpose of the UCB DataDude is to facilitate access to the information available in the CWS/CMS reports section of the Center for Social Services Research (CSSR) website. In particular, this tool allows users to review and summarize data across time periods for measures of interest. The DataDude is an Excel file that allows you to (1) download a report series from the UCB reports website, and (2) summarize selected information in a form suitable for review and/or graphing. A report series is a set of web pages that report the same information for various time periods, either a series of entry cohort reports or a series of point-in-time reports. 2. Set Up Checklist
Operating System (OS) and Software Requirements: Although resources have not allowed extensive testing, the DataDude should operate on all versions of MS Windows 95 and above and all versions of MS Excel 2000 and above. Note: The DataDude is not currently available for Excel 97. See ‘Appendix 1: Determining Versions of Windows OS and Excel’ for details. Consult Microsoft product documentation for Windows / Excel version compatibility.
MS Excel: Macros must be enabled in Excel for the DataDude to function. Please
see ‘Appendix 2: Enabling Macros in Microsoft Excel’ for details.
Internet Connection: You must be connected to the Internet for Part 1 (download a report series) to function. You can use Part 2 (summarize selected information) with or without an Internet connection.
Establish a template location: Establish a safe and convenient location to store the
DataDude template, such as your agency’s shared drive. If for any reason, your DataDude template (UCB_DataDude.xls) becomes corrupted or damaged, replace it with a fresh copy, downloaded from the website at: http://cssr.berkeley.edu/datadude/
UCB_DataDude_UserGuide_updated_Track Changes_WP.doc August 2006
3
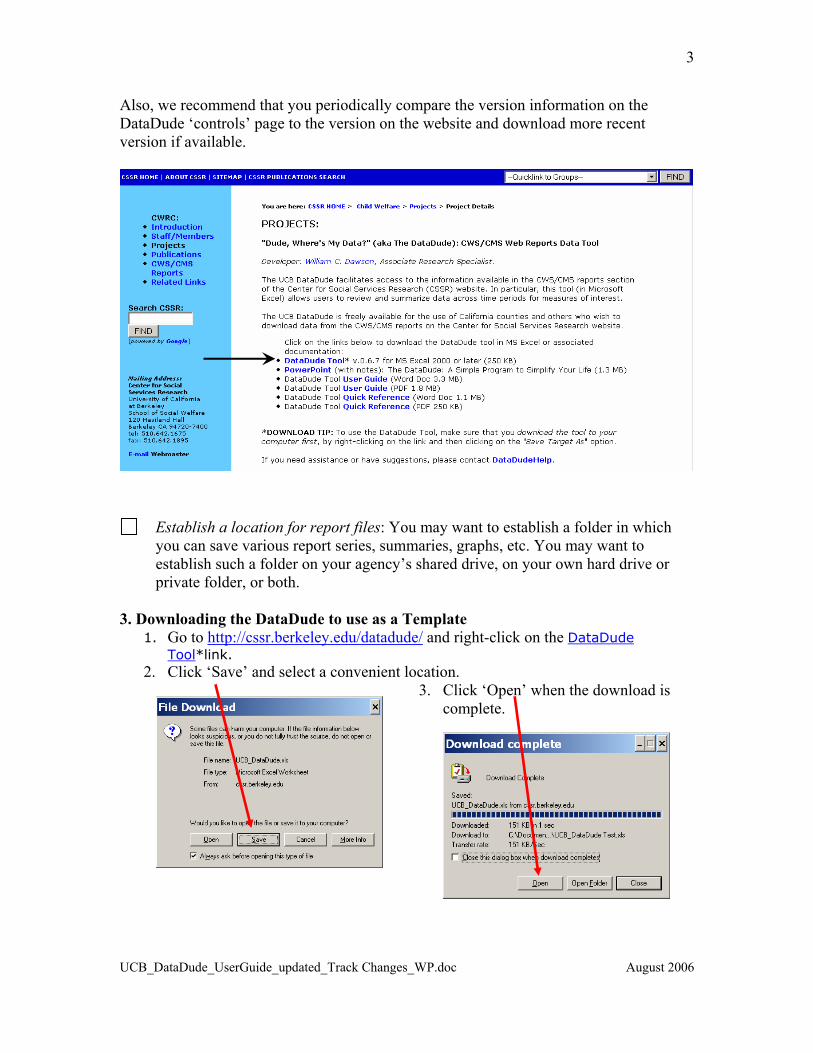
Also, we recommend that you periodically compare the version information on the DataDude ‘controls’ page to the version on the website and download more recent version if available.
Establish a location for report files: You may want to establish a folder in which you can save various report series, summaries, graphs, etc. You may want to establish such a folder on your agency’s shared drive, on your own hard drive or private folder, or both.
3. Downloading the DataDude to use as a Template
1. Go to http://cssr.berkeley.edu/datadude/ and right-click on the DataDude Tool*link.
2. Click ‘Save’ and select a convenient location. 3. Click ‘Open’ when the download is
complete.
UCB_DataDude_UserGuide_updated_Track Changes_WP.doc August 2006
4
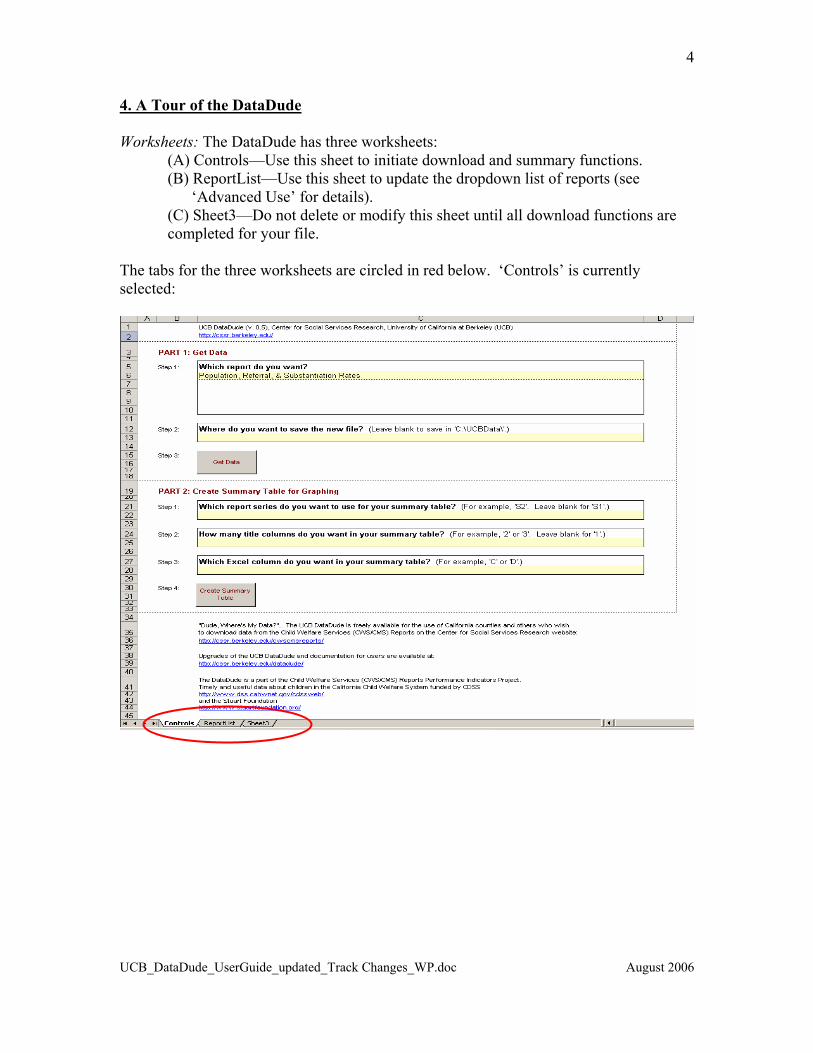
4. A Tour of the DataDude Worksheets: The DataDude has three worksheets:
(A) Controls—Use this sheet to initiate download and summary functions. (B) ReportList—Use this sheet to update the dropdown list of reports (see
‘Advanced Use’ for details). (C) Sheet3—Do not delete or modify this sheet until all download functions are completed for your file.
The tabs for the three worksheets are circled in red below. ‘Controls’ is currently selected:
UCB_DataDude_UserGuide_updated_Track Changes_WP.doc August 2006
5
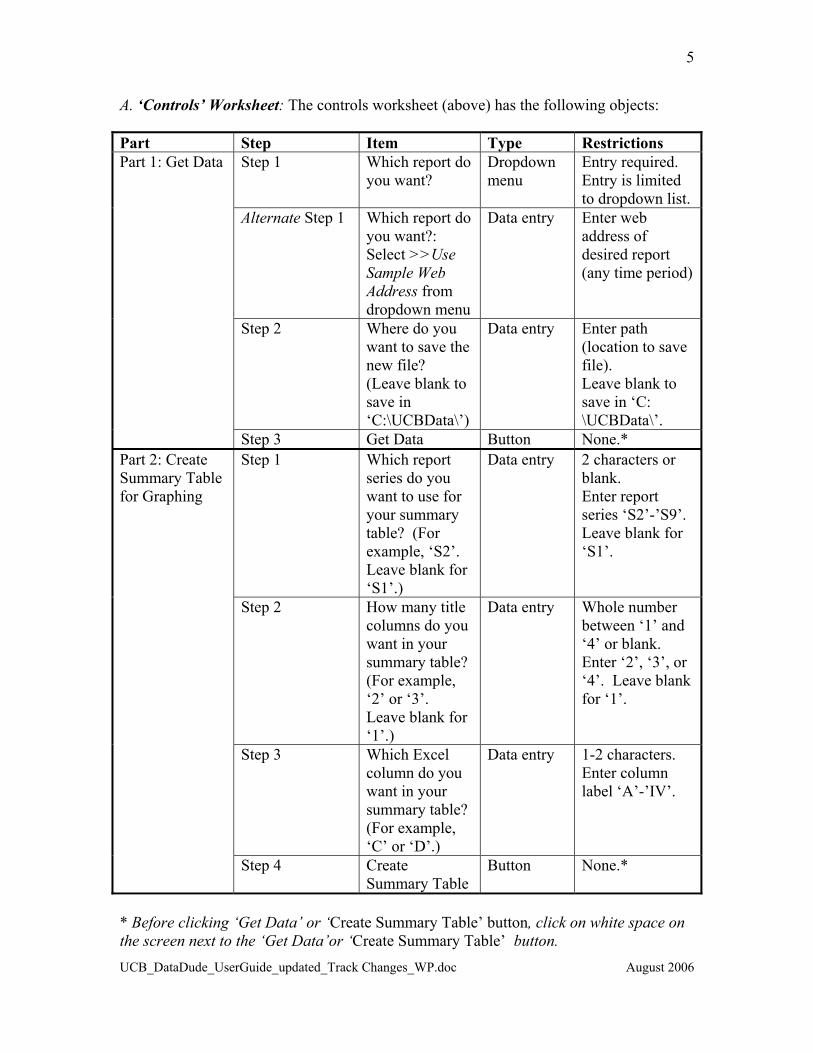
A. ‘Controls’ Worksheet: The controls worksheet (above) has the following objects: Part Step Item Type Restrictions
Step 1 Which report do you want?
Dropdown menu
Entry required. Entry is limited to dropdown list.
Alternate Step 1 Which report do you want?: Select >>Use Sample Web Address from dropdown menu
Data entry Enter web address of desired report (any time period)
Step 2 Where do you want to save the new file? (Leave blank to save in ‘C:\UCBData\’)
Data entry Enter path (location to save file). Leave blank to save in ‘C: \UCBData\’.
Part 1: Get Data
Step 3 Get Data Button None.* Step 1 Which report
series do you want to use for your summary table? (For example, ‘S2’. Leave blank for ‘S1’.)
Data entry 2 characters or blank. Enter report series ‘S2’-’S9’. Leave blank for ‘S1’.
Step 2 How many title columns do you want in your summary table? (For example, ‘2’ or ‘3’. Leave blank for ‘1’.)
Data entry Whole number between ‘1’ and ‘4’ or blank. Enter ‘2’, ‘3’, or ‘4’. Leave blank for ‘1’.
Step 3 Which Excel column do you want in your summary table? (For example, ‘C’ or ‘D’.)
Data entry 1-2 characters. Enter column label ‘A’-’IV’.
Part 2: Create Summary Table for Graphing
Step 4 Create Summary Table
Button None.*
* Before clicking ‘Get Data’ or ‘Create Summary Table’ button, click on white space on the screen next to the ‘Get Data’or ‘Create Summary Table’ button.
UCB_DataDude_UserGuide_updated_Track Changes_WP.doc August 2006
6
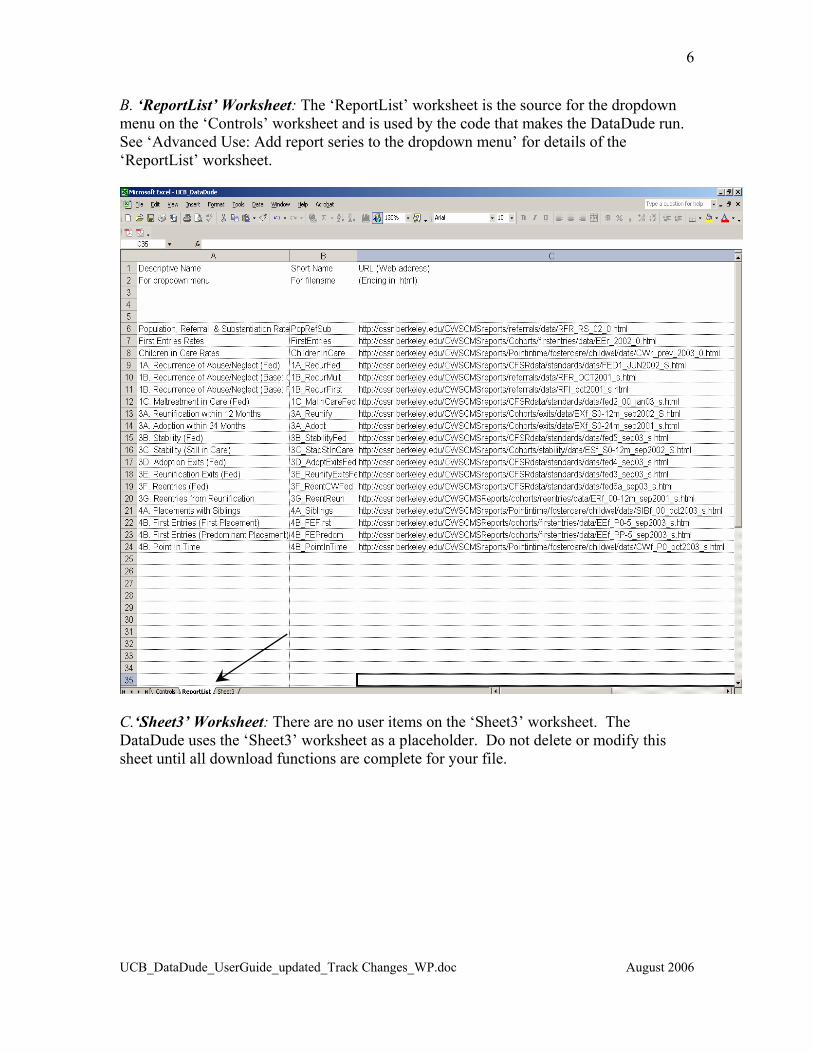
B. ‘ReportList’ Worksheet: The ‘ReportList’ worksheet is the source for the dropdown menu on the ‘Controls’ worksheet and is used by the code that makes the DataDude run. See ‘Advanced Use: Add report series to the dropdown menu’ for details of the ‘ReportList’ worksheet.
C.‘Sheet3’ Worksheet: There are no user items on the ‘Sheet3’ worksheet. The DataDude uses the ‘Sheet3’ worksheet as a placeholder. Do not delete or modify this sheet until all download functions are complete for your file.
UCB_DataDude_UserGuide_updated_Track Changes_WP.doc August 2006
7
5. Basic Use Open the DataDude as you would any other Excel file. Part 1: Get Data Step 1: Indicate the report series to download Enter the report series that you want to download with one of the following two methods: Method A: Select a summary report from the dropdown menu. Method B: Use a sample web address:
1. Scroll all the way to the top of the dropdown menu and select >>Use Sample Web Address
2. Enter the web address of any desired report (any time period).
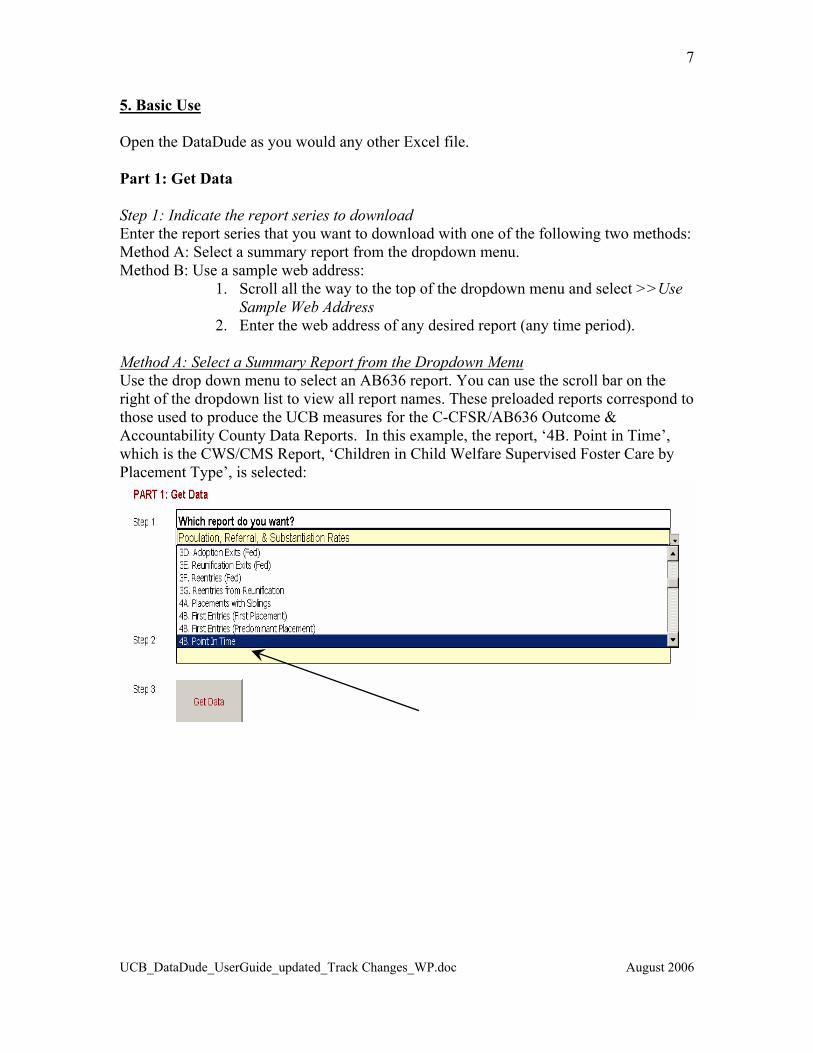
Method A: Select a Summary Report from the Dropdown Menu Use the drop down menu to select an AB636 report. You can use the scroll bar on the right of the dropdown list to view all report names. These preloaded reports correspond to those used to produce the UCB measures for the C-CFSR/AB636 Outcome & Accountability County Data Reports. In this example, the report, ‘4B. Point in Time’, which is the CWS/CMS Report, ‘Children in Child Welfare Supervised Foster Care by Placement Type’, is selected:
UCB_DataDude_UserGuide_updated_Track Changes_WP.doc August 2006
8
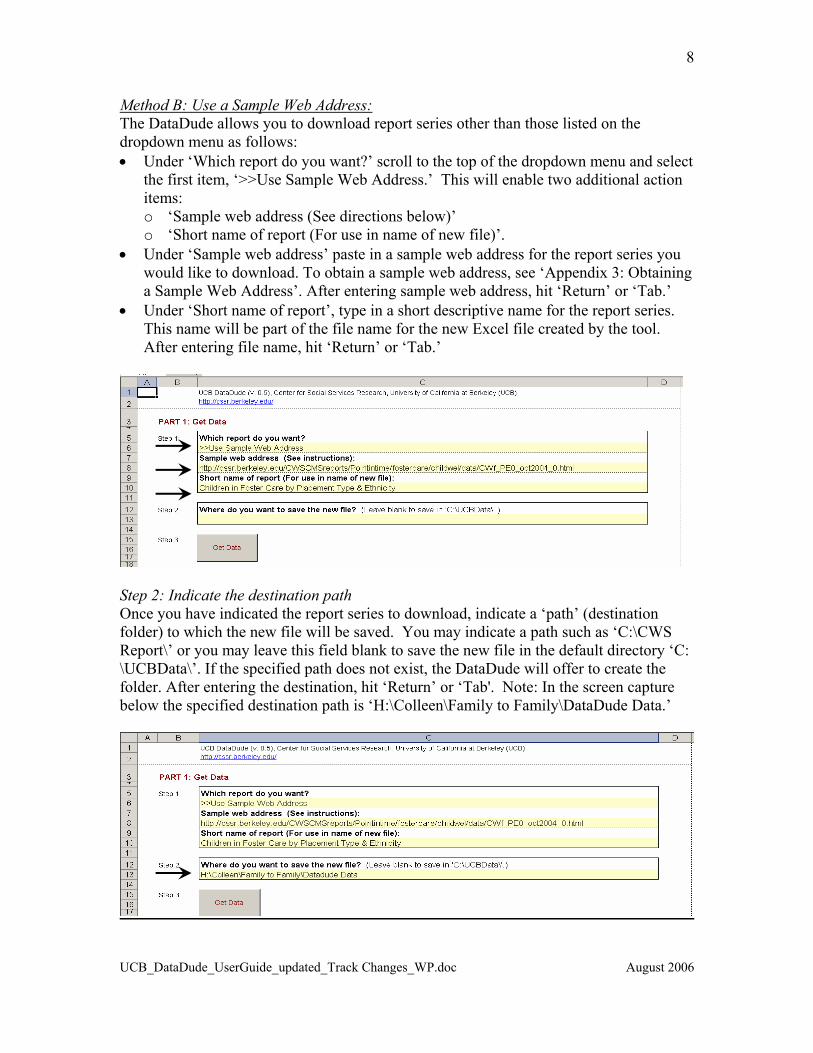
Method B: Use a Sample Web Address: The DataDude allows you to download report series other than those listed on the dropdown menu as follows: • Under ‘Which report do you want?’ scroll to the top of the dropdown menu and select
the first item, ‘>>Use Sample Web Address.’ This will enable two additional action items: o ‘Sample web address (See directions below)’ o ‘Short name of report (For use in name of new file)’.
• Under ‘Sample web address’ paste in a sample web address for the report series you would like to download. To obtain a sample web address, see ‘Appendix 3: Obtaining a Sample Web Address’. After entering sample web address, hit ‘Return’ or ‘Tab.’
• Under ‘Short name of report’, type in a short descriptive name for the report series. This name will be part of the file name for the new Excel file created by the tool. After entering file name, hit ‘Return’ or ‘Tab.’
Step 2: Indicate the destination path Once you have indicated the report series to download, indicate a ‘path’ (destination folder) to which the new file will be saved. You may indicate a path such as ‘C:\CWS Report\’ or you may leave this field blank to save the new file in the default directory ‘C: \UCBData\’. If the specified path does not exist, the DataDude will offer to create the folder. After entering the destination, hit ‘Return’ or ‘Tab'. Note: In the screen capture below the specified destination path is ‘H:\Colleen\Family to Family\DataDude Data.’
UCB_DataDude_UserGuide_updated_Track Changes_WP.doc August 2006
9
Step 3: Click the ‘Get Data’ button After you have clicked the ‘Get Data’ button, the DataDude: (a) Assigns a filename: ‘[short form of report name]_[‘S’ for Summary, ‘0’ for CA, or county #][_version #...if required].xls’.
• Method A: Assigns a preloaded short form of report name, e.g., ‘4B_PointInTime_S.xls’
• Method B: Assigns a user designated short form of report name, e.g., ‘Children in Foster Care by Placement Type & Ethnicity_0.xls’
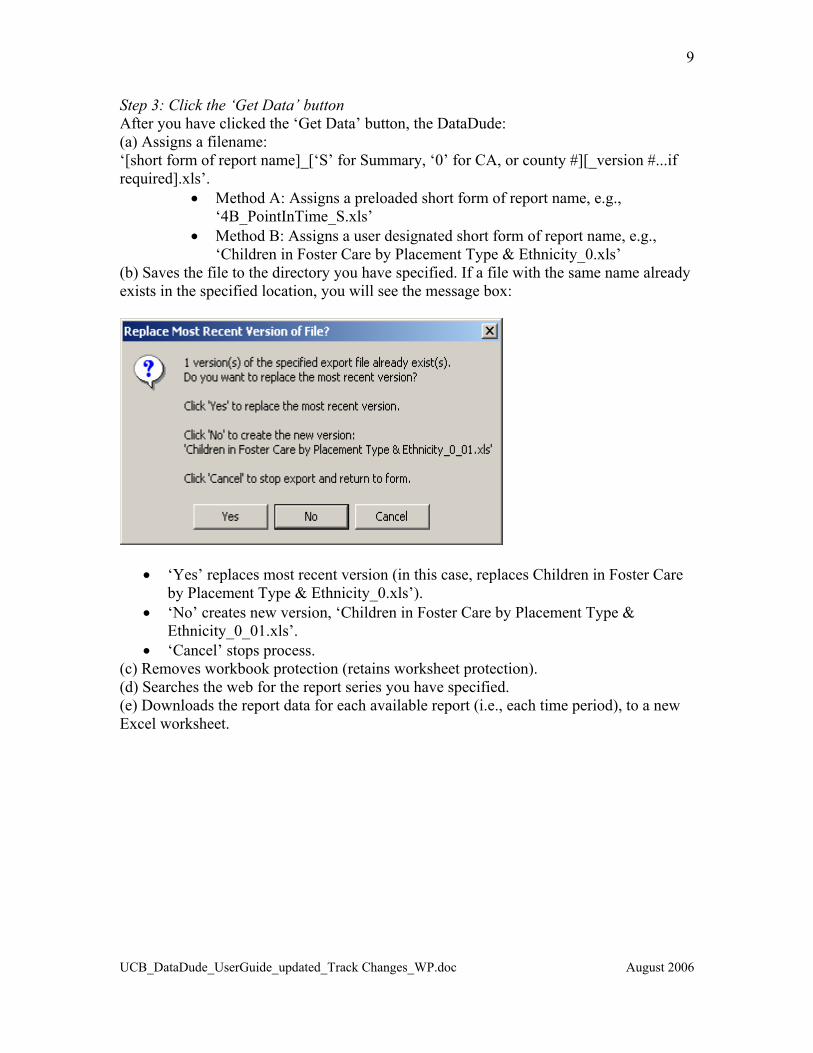
(b) Saves the file to the directory you have specified. If a file with the same name already exists in the specified location, you will see the message box:
• ‘Yes’ replaces most recent version (in this case, replaces Children in Foster Care by Placement Type & Ethnicity_0.xls’).
• ‘No’ creates new version, ‘Children in Foster Care by Placement Type & Ethnicity_0_01.xls’.
• ‘Cancel’ stops process. (c) Removes workbook protection (retains worksheet protection). (d) Searches the web for the report series you have specified. (e) Downloads the report data for each available report (i.e., each time period), to a new Excel worksheet.
UCB_DataDude_UserGuide_updated_Track Changes_WP.doc August 2006
10
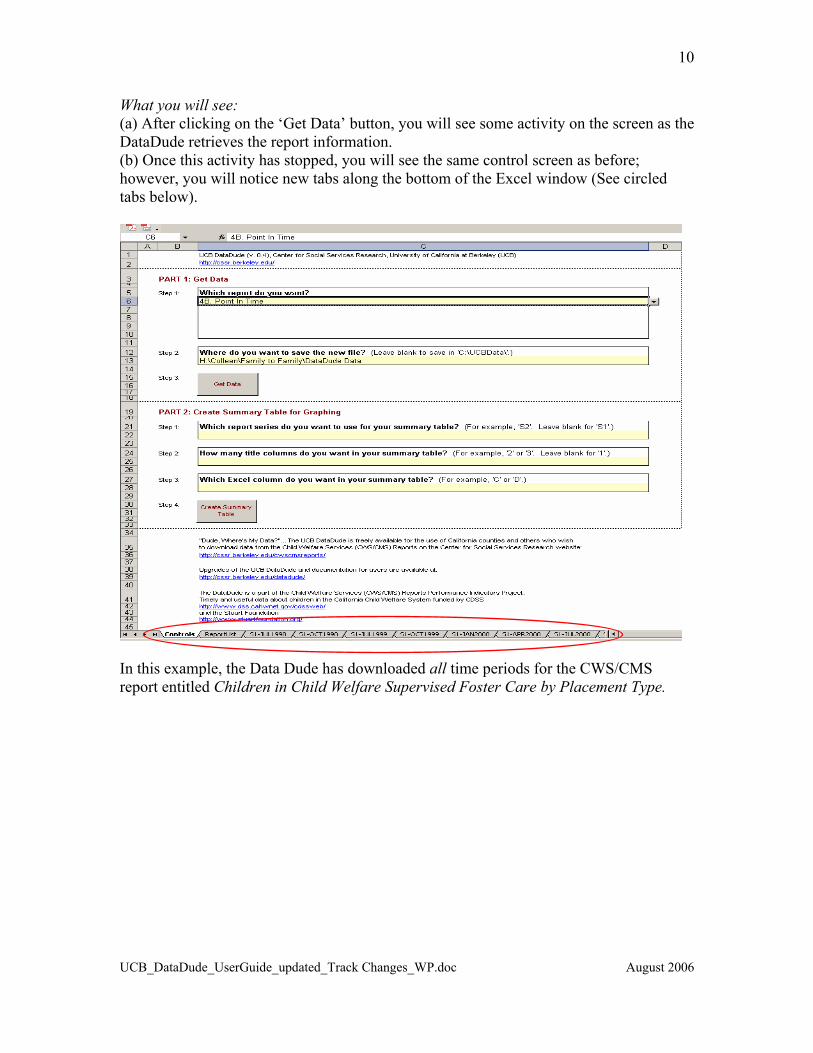
What you will see: (a) After clicking on the ‘Get Data’ button, you will see some activity on the screen as the DataDude retrieves the report information. (b) Once this activity has stopped, you will see the same control screen as before; however, you will notice new tabs along the bottom of the Excel window (See circled tabs below).
In this example, the Data Dude has downloaded all time periods for the CWS/CMS report entitled Children in Child Welfare Supervised Foster Care by Placement Type.
UCB_DataDude_UserGuide_updated_Track Changes_WP.doc August 2006
11
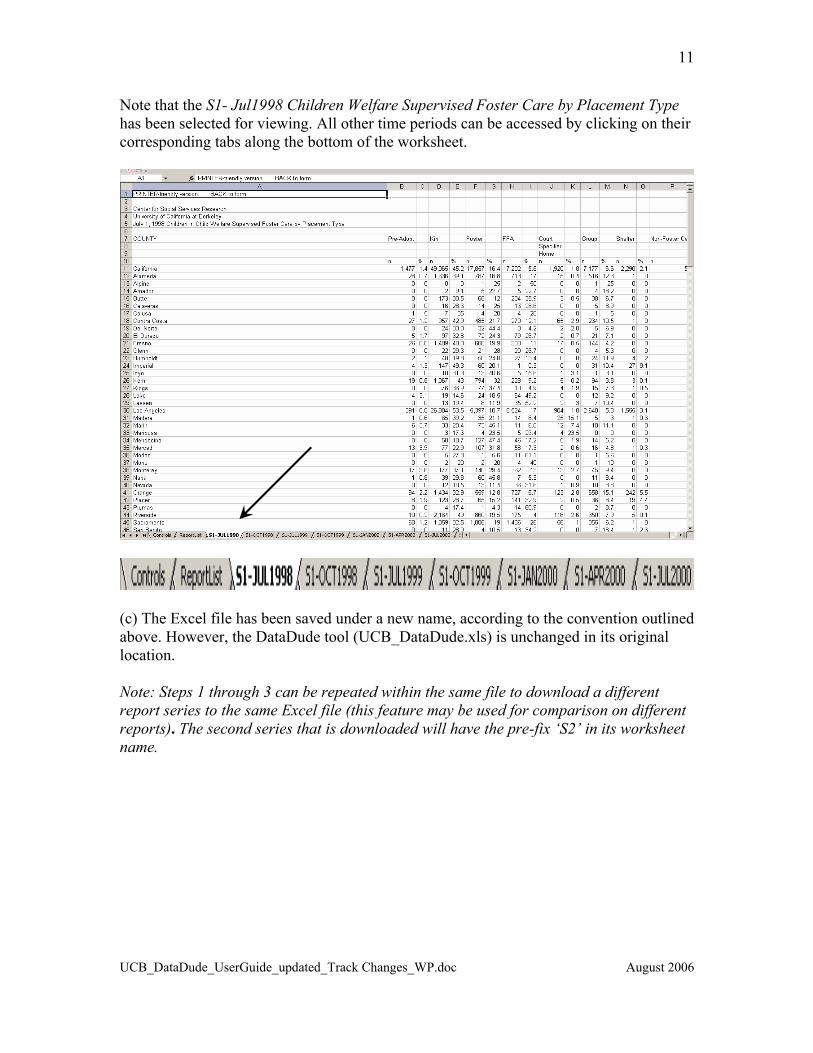
Note that the S1- Jul1998 Children Welfare Supervised Foster Care by Placement Type has been selected for viewing. All other time periods can be accessed by clicking on their corresponding tabs along the bottom of the worksheet.
(c) The Excel file has been saved under a new name, according to the convention outlined above. However, the DataDude tool (UCB_DataDude.xls) is unchanged in its original location. Note: Steps 1 through 3 can be repeated within the same file to download a different report series to the same Excel file (this feature may be used for comparison on different reports). The second series that is downloaded will have the pre-fix ‘S2’ in its worksheet name.
UCB_DataDude_UserGuide_updated_Track Changes_WP.doc August 2006
12
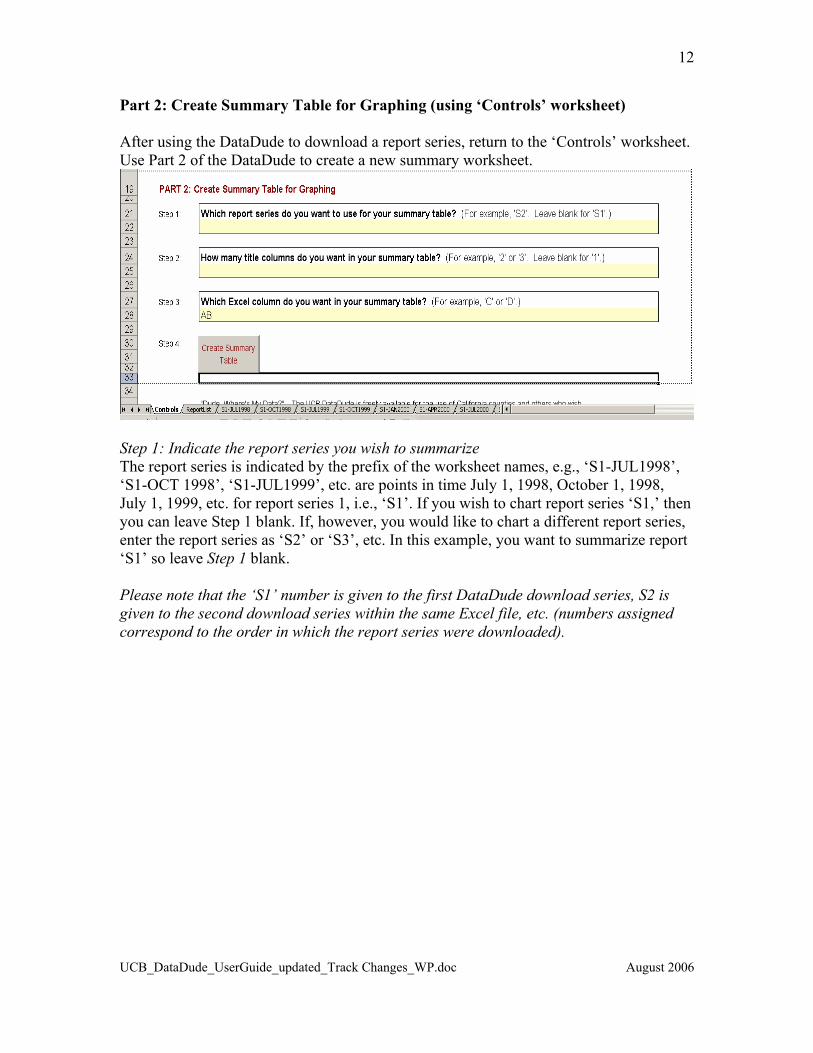
Part 2: Create Summary Table for Graphing (using ‘Controls’ worksheet) After using the DataDude to download a report series, return to the ‘Controls’ worksheet. Use Part 2 of the DataDude to create a new summary worksheet.
Step 1: Indicate the report series you wish to summarize The report series is indicated by the prefix of the worksheet names, e.g., ‘S1-JUL1998’, ‘S1-OCT 1998’, ‘S1-JUL1999’, etc. are points in time July 1, 1998, October 1, 1998, July 1, 1999, etc. for report series 1, i.e., ‘S1’. If you wish to chart report series ‘S1,’ then you can leave Step 1 blank. If, however, you would like to chart a different report series, enter the report series as ‘S2’ or ‘S3’, etc. In this example, you want to summarize report ‘S1’ so leave Step 1 blank. Please note that the ‘S1’ number is given to the first DataDude download series, S2 is given to the second download series within the same Excel file, etc. (numbers assigned correspond to the order in which the report series were downloaded).
UCB_DataDude_UserGuide_updated_Track Changes_WP.doc August 2006
13
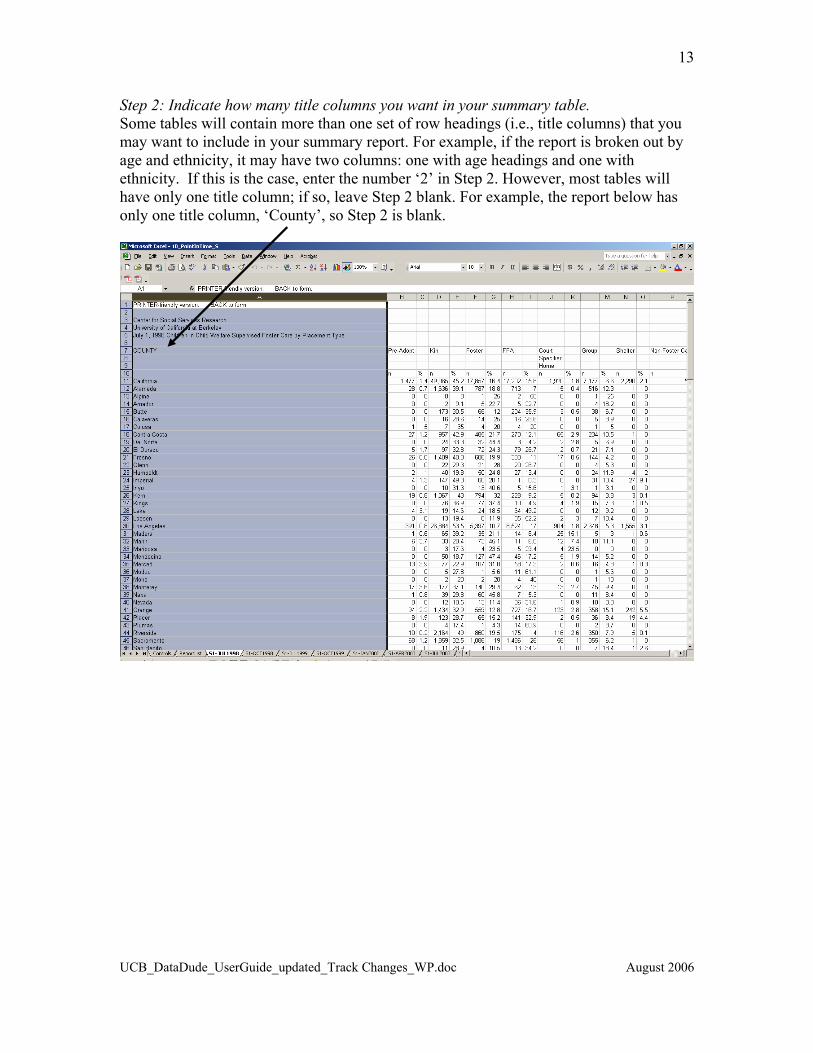
Step 2: Indicate how many title columns you want in your summary table. Some tables will contain more than one set of row headings (i.e., title columns) that you may want to include in your summary report. For example, if the report is broken out by age and ethnicity, it may have two columns: one with age headings and one with ethnicity. If this is the case, enter the number ‘2’ in Step 2. However, most tables will have only one title column; if so, leave Step 2 blank. For example, the report below has only one title column, ‘County’, so Step 2 is blank.
UCB_DataDude_UserGuide_updated_Track Changes_WP.doc August 2006
14
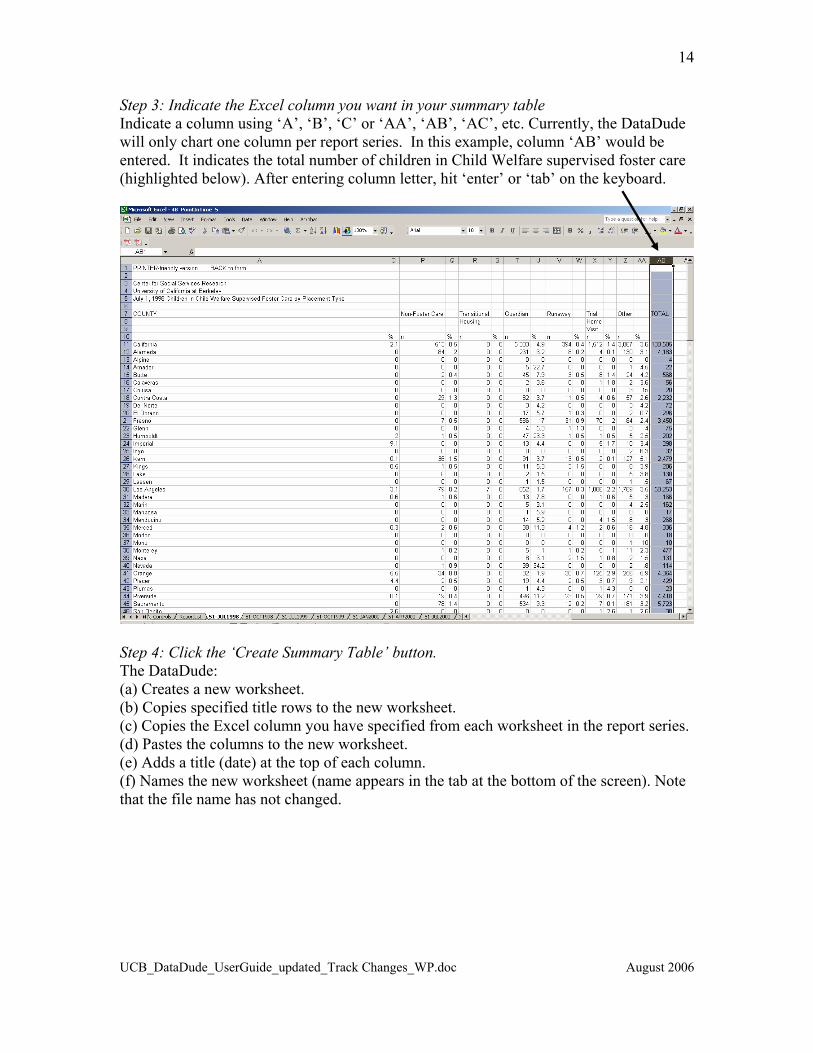
Step 3: Indicate the Excel column you want in your summary table Indicate a column using ‘A’, ‘B’, ‘C’ or ‘AA’, ‘AB’, ‘AC’, etc. Currently, the DataDude will only chart one column per report series. In this example, column ‘AB’ would be entered. It indicates the total number of children in Child Welfare supervised foster care (highlighted below). After entering column letter, hit ‘enter’ or ‘tab’ on the keyboard.
Step 4: Click the ‘Create Summary Table’ button. The DataDude: (a) Creates a new worksheet. (b) Copies specified title rows to the new worksheet. (c) Copies the Excel column you have specified from each worksheet in the report series. (d) Pastes the columns to the new worksheet. (e) Adds a title (date) at the top of each column. (f) Names the new worksheet (name appears in the tab at the bottom of the screen). Note that the file name has not changed.
UCB_DataDude_UserGuide_updated_Track Changes_WP.doc August 2006
15
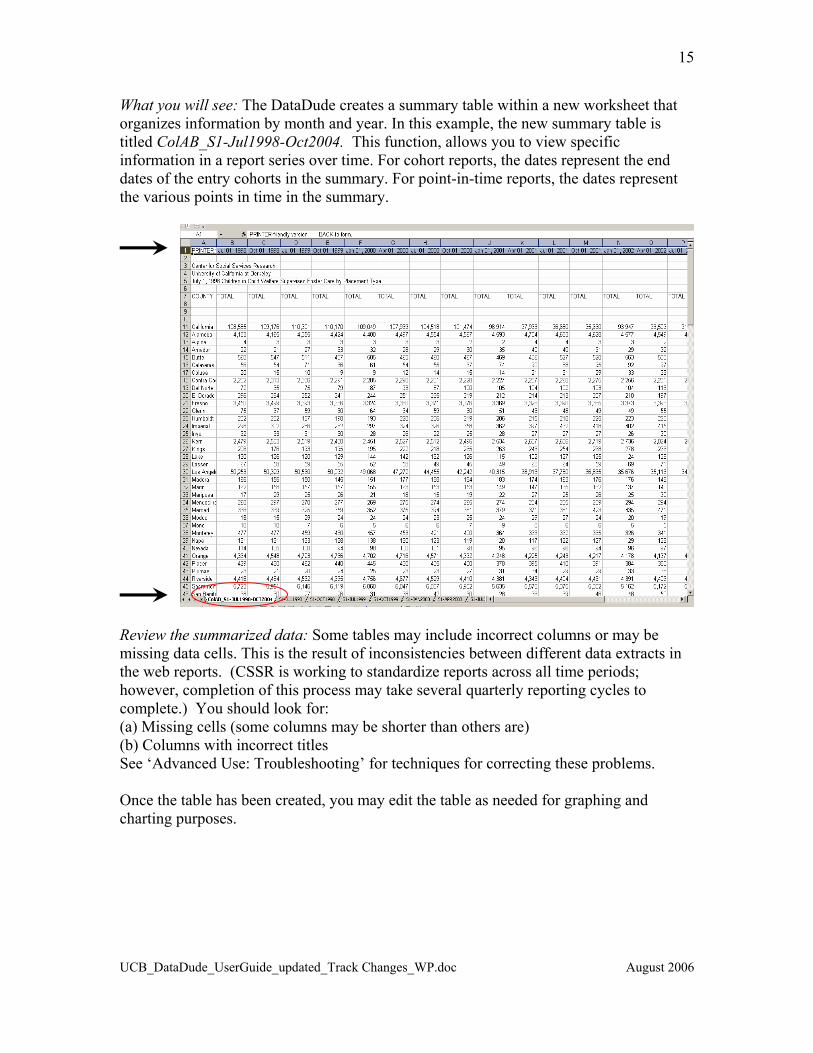
What you will see: The DataDude creates a summary table within a new worksheet that organizes information by month and year. In this example, the new summary table is titled ColAB_S1-Jul1998-Oct2004. This function, allows you to view specific information in a report series over time. For cohort reports, the dates represent the end dates of the entry cohorts in the summary. For point-in-time reports, the dates represent the various points in time in the summary.
Review the summarized data: Some tables may include incorrect columns or may be missing data cells. This is the result of inconsistencies between different data extracts in the web reports. (CSSR is working to standardize reports across all time periods; however, completion of this process may take several quarterly reporting cycles to complete.) You should look for: (a) Missing cells (some columns may be shorter than others are) (b) Columns with incorrect titles See ‘Advanced Use: Troubleshooting’ for techniques for correcting these problems. Once the table has been created, you may edit the table as needed for graphing and charting purposes.
UCB_DataDude_UserGuide_updated_Track Changes_WP.doc August 2006
16
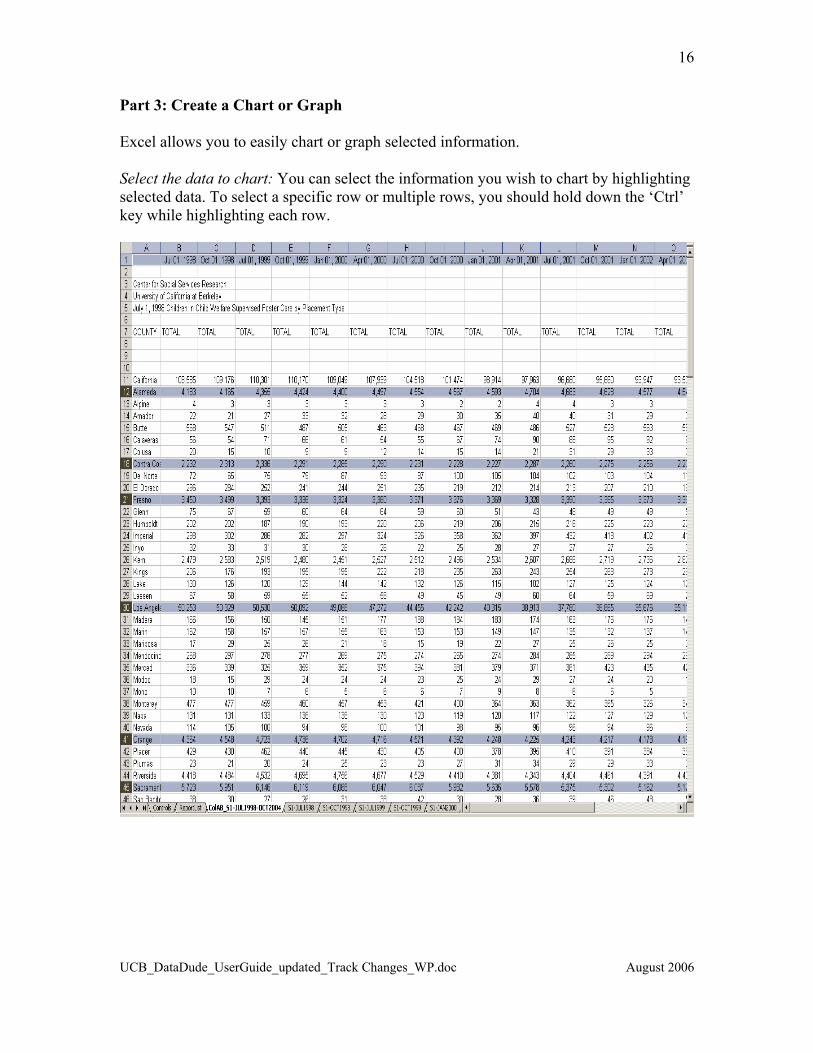
Part 3: Create a Chart or Graph Excel allows you to easily chart or graph selected information. Select the data to chart: You can select the information you wish to chart by highlighting selected data. To select a specific row or multiple rows, you should hold down the ‘Ctrl’ key while highlighting each row.
UCB_DataDude_UserGuide_updated_Track Changes_WP.doc August 2006
17
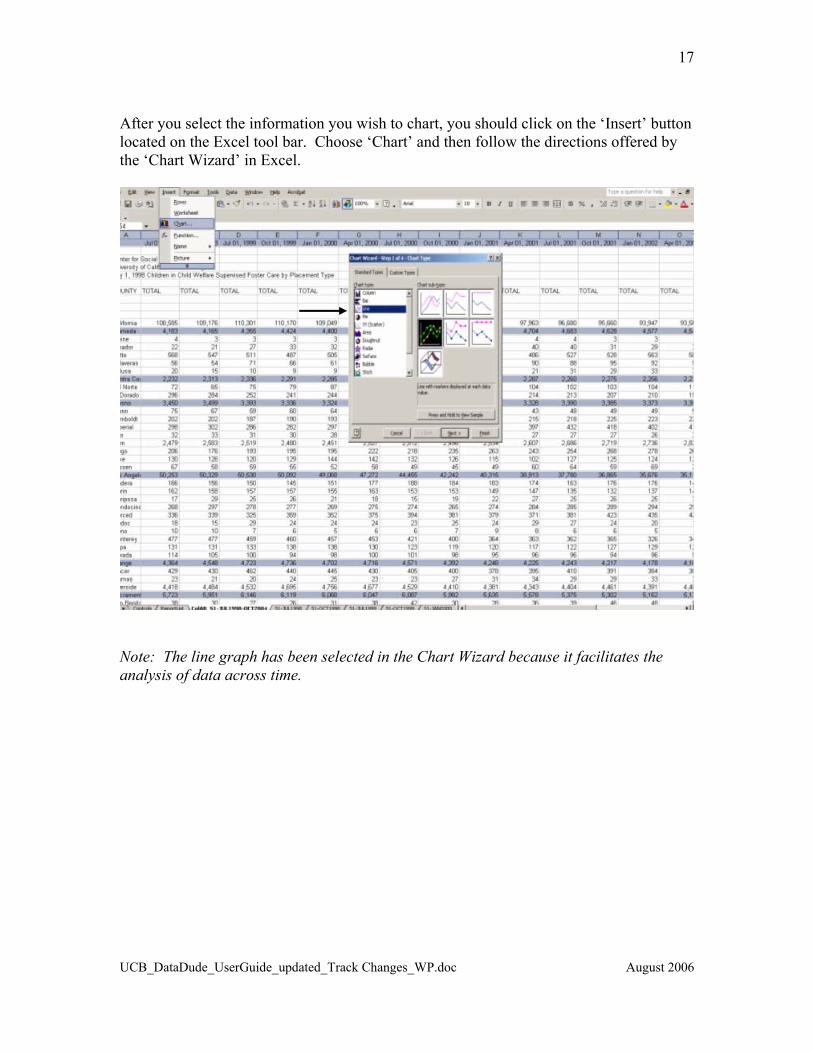
After you select the information you wish to chart, you should click on the ‘Insert’ button located on the Excel tool bar. Choose ‘Chart’ and then follow the directions offered by the ‘Chart Wizard’ in Excel.
Note: The line graph has been selected in the Chart Wizard because it facilitates the analysis of data across time.
UCB_DataDude_UserGuide_updated_Track Changes_WP.doc August 2006
18
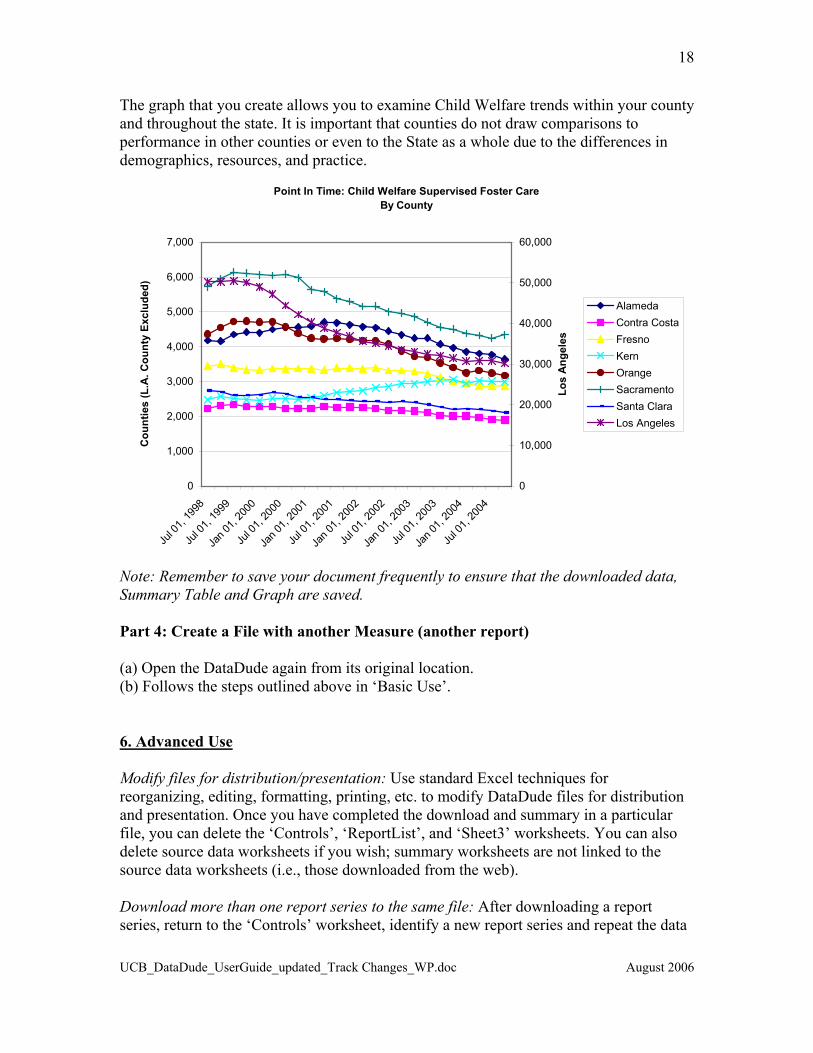
The graph that you create allows you to examine Child Welfare trends within your county and throughout the state. It is important that counties do not draw comparisons to performance in other counties or even to the State as a whole due to the differences in demographics, resources, and practice.
Point In Time: Child Welfare Supervised Foster Care By County
0
1,000
2,000
3,000
4,000
5,000
6,000
7,000
Jul 0
1, 19
98
Jul 0
1, 19
99
Jan 0
1, 20
00
Jul 0
1, 20
00
Jan 0
1, 20
01
Jul 0
1, 20
01
Jan 0
1, 20
02
Jul 0
1, 20
02
Jan 0
1, 20
03
Jul 0
1, 20
03
Jan 0
1, 20
04
Jul 0
1, 20
04
Cou
ntie
s (L
.A. C
ount
y Ex
clud
ed)
0
10,000
20,000
30,000
40,000
50,000
60,000
Los
Ang
eles
AlamedaContra CostaFresnoKernOrangeSacramentoSanta ClaraLos Angeles
Note: Remember to save your document frequently to ensure that the downloaded data, Summary Table and Graph are saved. Part 4: Create a File with another Measure (another report) (a) Open the DataDude again from its original location. (b) Follows the steps outlined above in ‘Basic Use’. 6. Advanced Use Modify files for distribution/presentation: Use standard Excel techniques for reorganizing, editing, formatting, printing, etc. to modify DataDude files for distribution and presentation. Once you have completed the download and summary in a particular file, you can delete the ‘Controls’, ‘ReportList’, and ‘Sheet3’ worksheets. You can also delete source data worksheets if you wish; summary worksheets are not linked to the source data worksheets (i.e., those downloaded from the web). Download more than one report series to the same file: After downloading a report series, return to the ‘Controls’ worksheet, identify a new report series and repeat the data
UCB_DataDude_UserGuide_updated_Track Changes_WP.doc August 2006
19
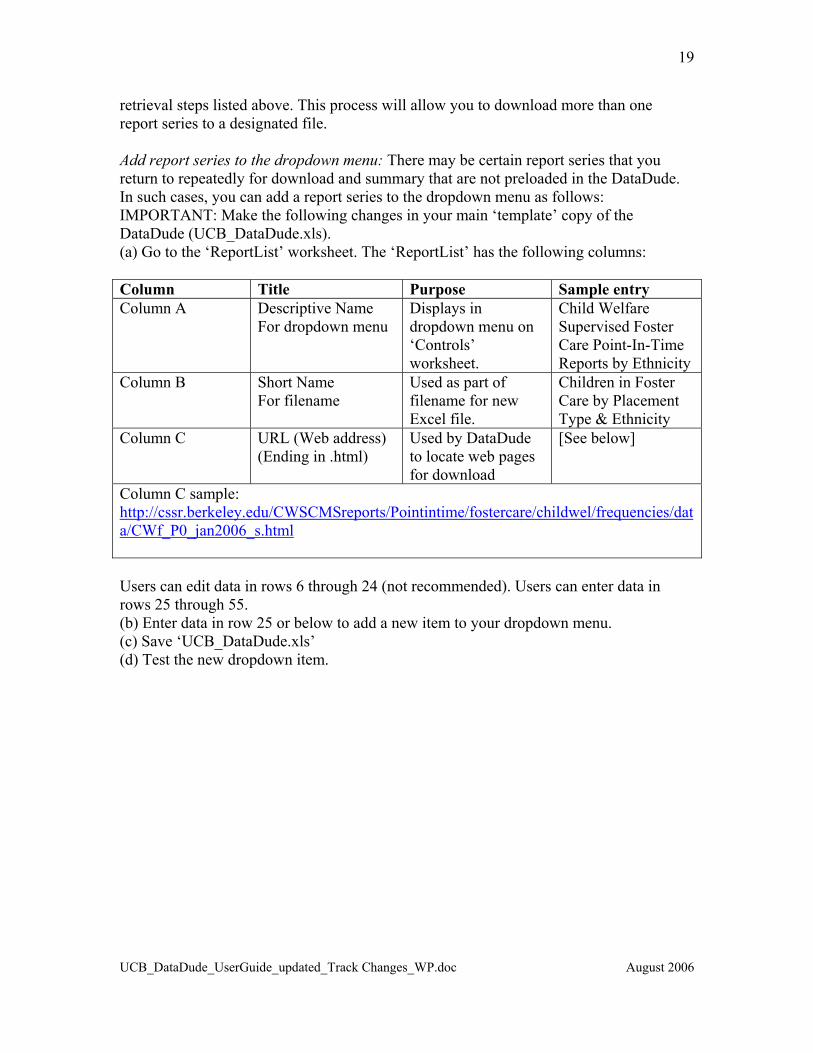
retrieval steps listed above. This process will allow you to download more than one report series to a designated file. Add report series to the dropdown menu: There may be certain report series that you return to repeatedly for download and summary that are not preloaded in the DataDude. In such cases, you can add a report series to the dropdown menu as follows: IMPORTANT: Make the following changes in your main ‘template’ copy of the DataDude (UCB_DataDude.xls). (a) Go to the ‘ReportList’ worksheet. The ‘ReportList’ has the following columns: Column Title Purpose Sample entry Column A Descriptive Name
For dropdown menu Displays in dropdown menu on ‘Controls’ worksheet.
Child Welfare Supervised Foster Care Point-In-Time Reports by Ethnicity
Column B Short Name For filename
Used as part of filename for new Excel file.
Children in Foster Care by Placement Type & Ethnicity
Column C URL (Web address) (Ending in .html)
Used by DataDude to locate web pages for download
[See below]
Column C sample: http://cssr.berkeley.edu/CWSCMSreports/Pointintime/fostercare/childwel/frequencies/data/CWf_P0_jan2006_s.html Users can edit data in rows 6 through 24 (not recommended). Users can enter data in rows 25 through 55. (b) Enter data in row 25 or below to add a new item to your dropdown menu. (c) Save ‘UCB_DataDude.xls’ (d) Test the new dropdown item.
UCB_DataDude_UserGuide_updated_Track Changes_WP.doc August 2006
20
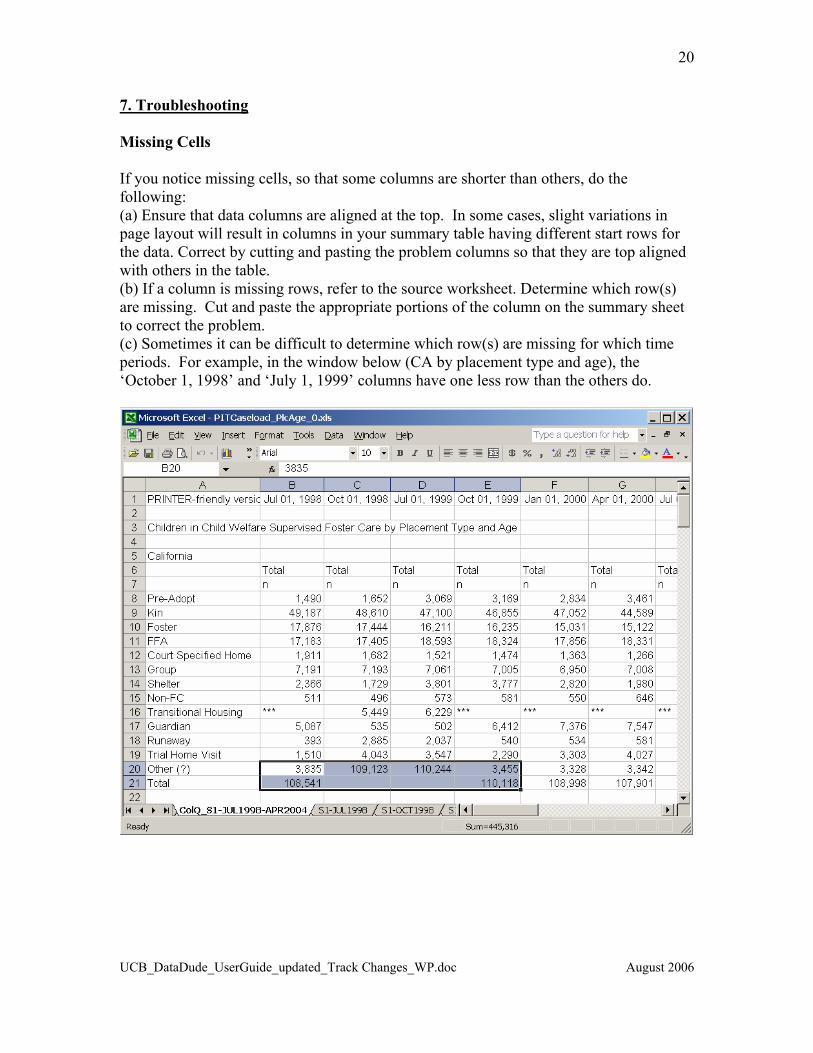
7. Troubleshooting Missing Cells If you notice missing cells, so that some columns are shorter than others, do the following: (a) Ensure that data columns are aligned at the top. In some cases, slight variations in page layout will result in columns in your summary table having different start rows for the data. Correct by cutting and pasting the problem columns so that they are top aligned with others in the table. (b) If a column is missing rows, refer to the source worksheet. Determine which row(s) are missing. Cut and paste the appropriate portions of the column on the summary sheet to correct the problem. (c) Sometimes it can be difficult to determine which row(s) are missing for which time periods. For example, in the window below (CA by placement type and age), the ‘October 1, 1998’ and ‘July 1, 1999’ columns have one less row than the others do.
UCB_DataDude_UserGuide_updated_Track Changes_WP.doc August 2006
21
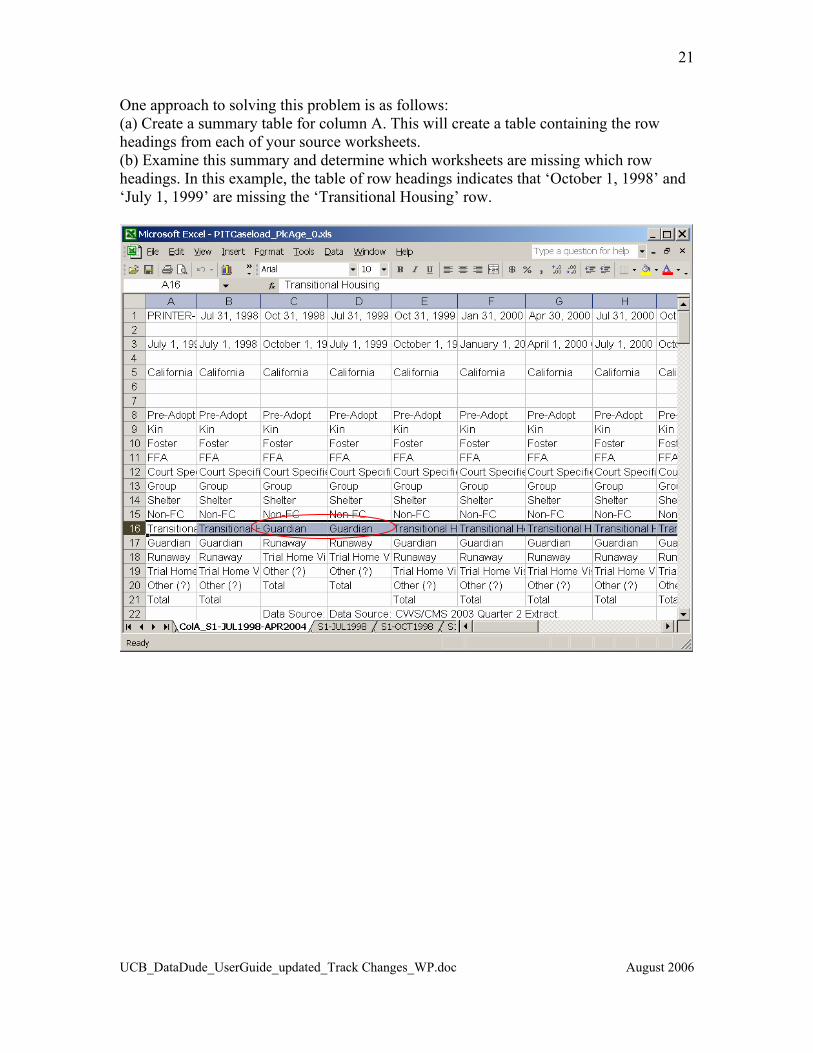
One approach to solving this problem is as follows: (a) Create a summary table for column A. This will create a table containing the row headings from each of your source worksheets. (b) Examine this summary and determine which worksheets are missing which row headings. In this example, the table of row headings indicates that ‘October 1, 1998’ and ‘July 1, 1999’ are missing the ‘Transitional Housing’ row.
UCB_DataDude_UserGuide_updated_Track Changes_WP.doc August 2006
22
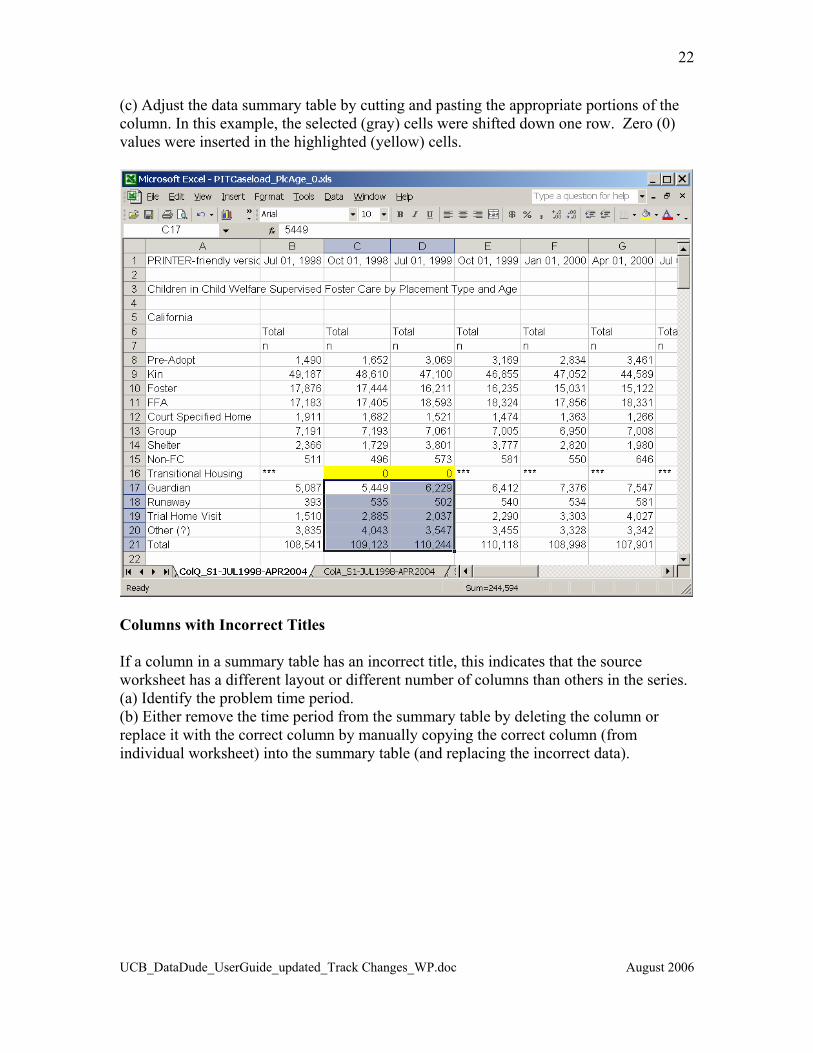
(c) Adjust the data summary table by cutting and pasting the appropriate portions of the column. In this example, the selected (gray) cells were shifted down one row. Zero (0) values were inserted in the highlighted (yellow) cells.
Columns with Incorrect Titles If a column in a summary table has an incorrect title, this indicates that the source worksheet has a different layout or different number of columns than others in the series. (a) Identify the problem time period. (b) Either remove the time period from the summary table by deleting the column or replace it with the correct column by manually copying the correct column (from individual worksheet) into the summary table (and replacing the incorrect data).
UCB_DataDude_UserGuide_updated_Track Changes_WP.doc August 2006
23
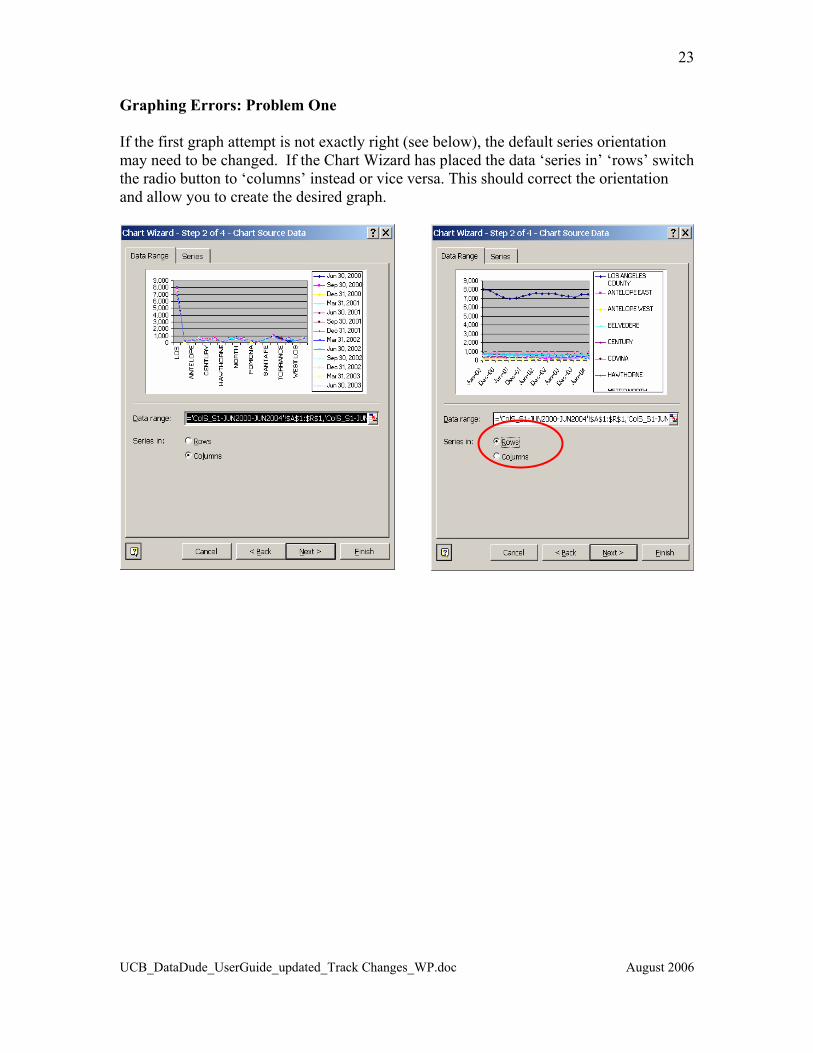
Graphing Errors: Problem One If the first graph attempt is not exactly right (see below), the default series orientation may need to be changed. If the Chart Wizard has placed the data ‘series in’ ‘rows’ switch the radio button to ‘columns’ instead or vice versa. This should correct the orientation and allow you to create the desired graph.
UCB_DataDude_UserGuide_updated_Track Changes_WP.doc August 2006
24
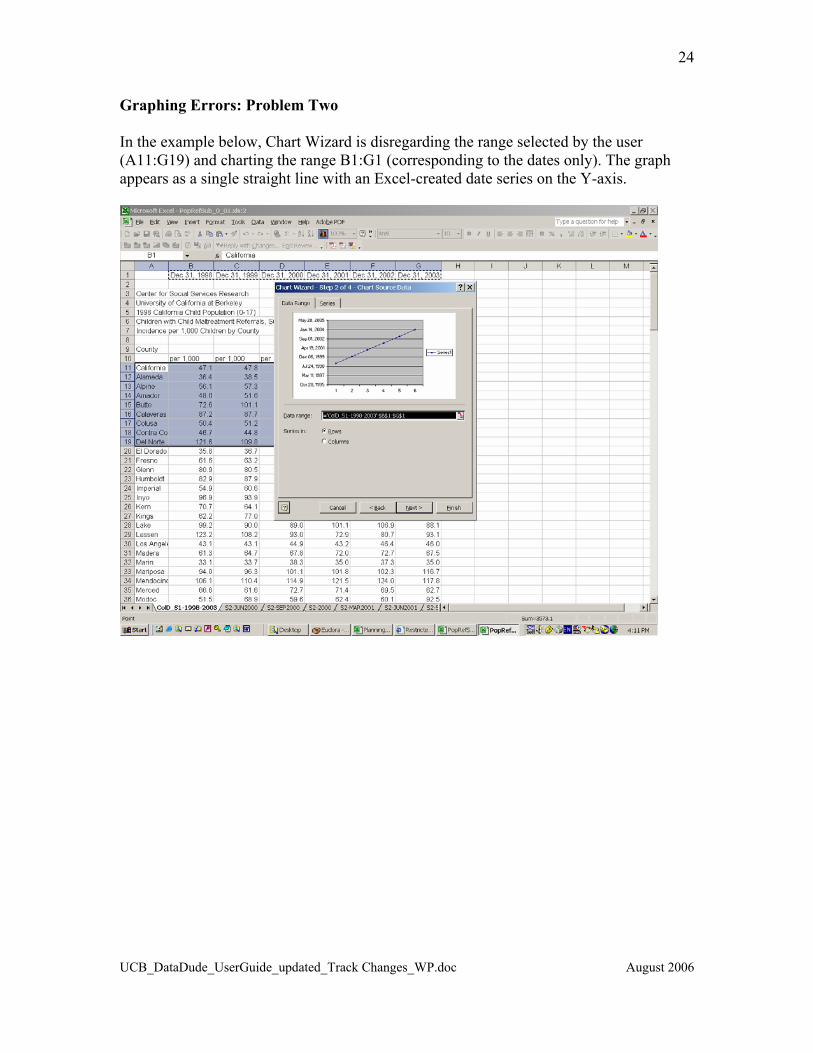
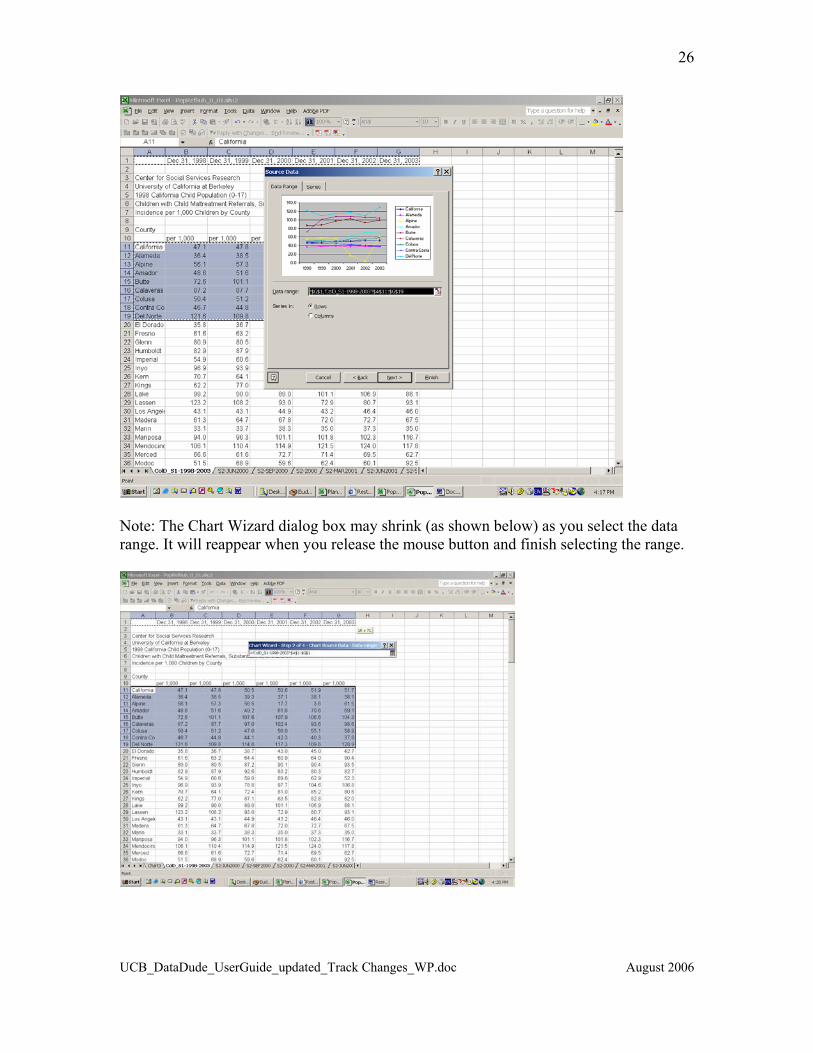
Graphing Errors: Problem Two In the example below, Chart Wizard is disregarding the range selected by the user (A11:G19) and charting the range B1:G1 (corresponding to the dates only). The graph appears as a single straight line with an Excel-created date series on the Y-axis.
UCB_DataDude_UserGuide_updated_Track Changes_WP.doc August 2006
25
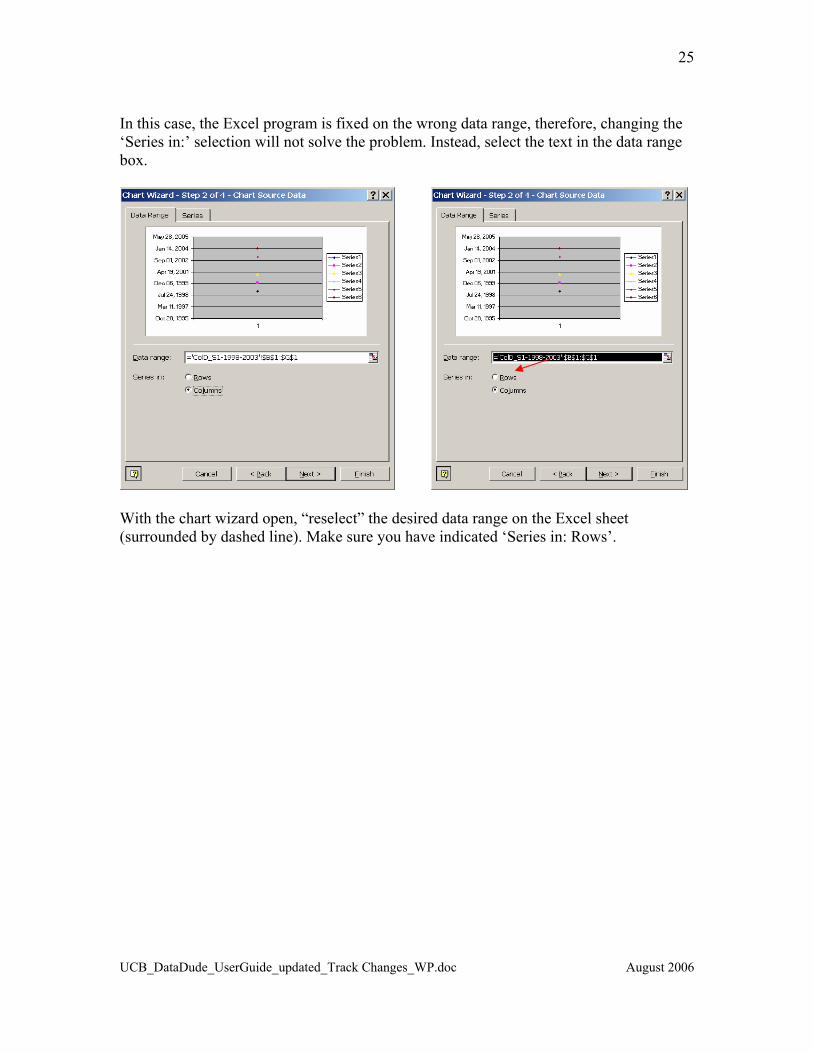
In this case, the Excel program is fixed on the wrong data range, therefore, changing the ‘Series in:’ selection will not solve the problem. Instead, select the text in the data range box.
With the chart wizard open, “reselect” the desired data range on the Excel sheet (surrounded by dashed line). Make sure you have indicated ‘Series in: Rows’.
UCB_DataDude_UserGuide_updated_Track Changes_WP.doc August 2006
26
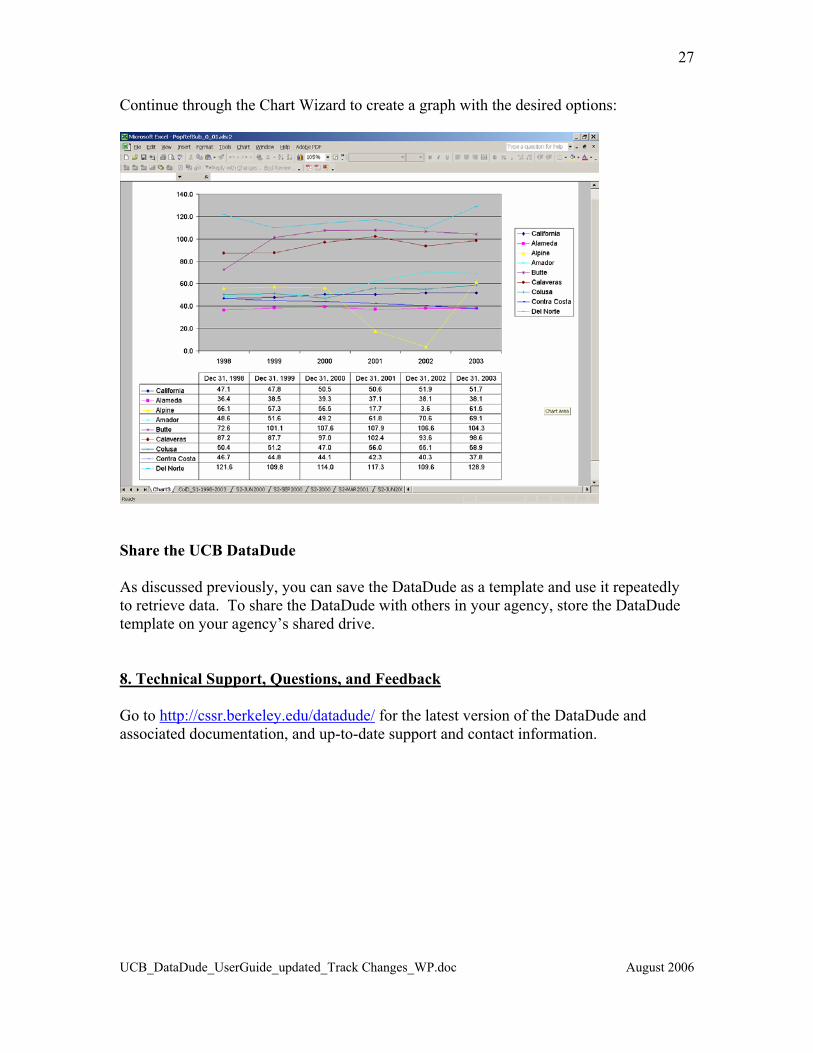
Note: The Chart Wizard dialog box may shrink (as shown below) as you select the data range. It will reappear when you release the mouse button and finish selecting the range.
UCB_DataDude_UserGuide_updated_Track Changes_WP.doc August 2006
27
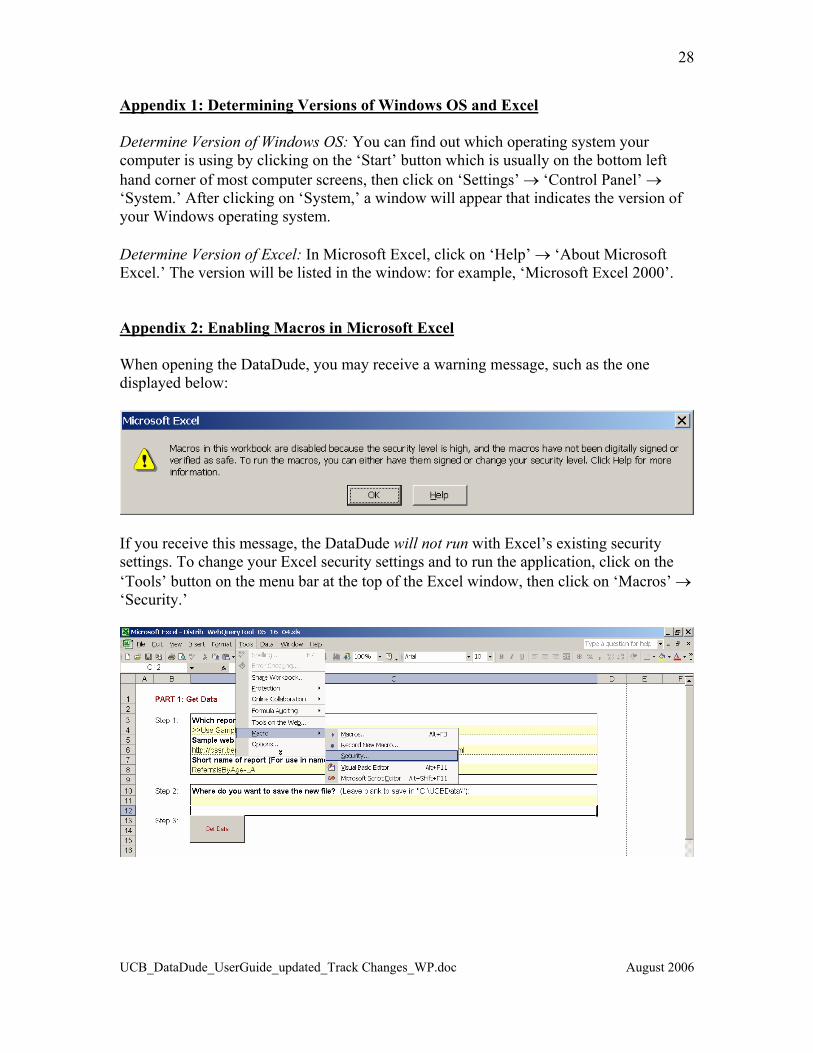
Continue through the Chart Wizard to create a graph with the desired options:
Share the UCB DataDude As discussed previously, you can save the DataDude as a template and use it repeatedly to retrieve data. To share the DataDude with others in your agency, store the DataDude template on your agency’s shared drive. 8. Technical Support, Questions, and Feedback Go to http://cssr.berkeley.edu/datadude/ for the latest version of the DataDude and associated documentation, and up-to-date support and contact information.
UCB_DataDude_UserGuide_updated_Track Changes_WP.doc August 2006
28
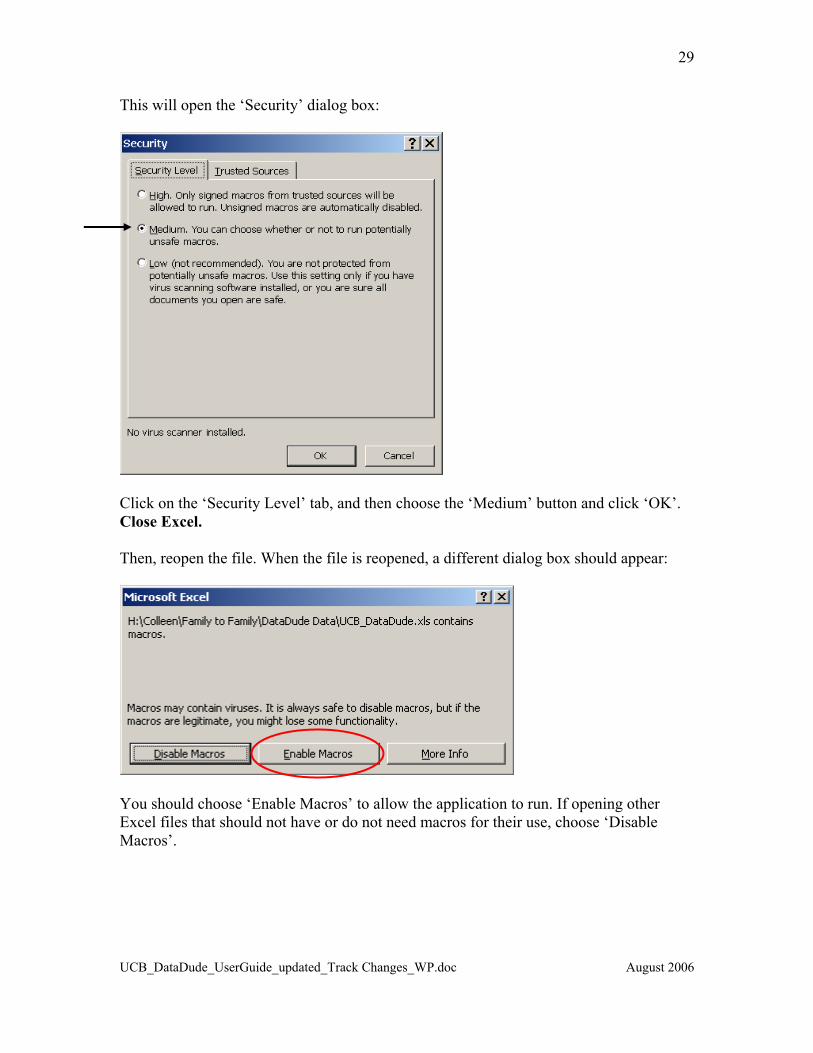
Appendix 1: Determining Versions of Windows OS and Excel Determine Version of Windows OS: You can find out which operating system your computer is using by clicking on the ‘Start’ button which is usually on the bottom left hand corner of most computer screens, then click on ‘Settings’ → ‘Control Panel’ → ‘System.’ After clicking on ‘System,’ a window will appear that indicates the version of your Windows operating system. Determine Version of Excel: In Microsoft Excel, click on ‘Help’ → ‘About Microsoft Excel.’ The version will be listed in the window: for example, ‘Microsoft Excel 2000’. Appendix 2: Enabling Macros in Microsoft Excel When opening the DataDude, you may receive a warning message, such as the one displayed below:
If you receive this message, the DataDude will not run with Excel’s existing security settings. To change your Excel security settings and to run the application, click on the ‘Tools’ button on the menu bar at the top of the Excel window, then click on ‘Macros’ → ‘Security.’
UCB_DataDude_UserGuide_updated_Track Changes_WP.doc August 2006
29
This will open the ‘Security’ dialog box:
Click on the ‘Security Level’ tab, and then choose the ‘Medium’ button and click ‘OK’. Close Excel. Then, reopen the file. When the file is reopened, a different dialog box should appear:
You should choose ‘Enable Macros’ to allow the application to run. If opening other Excel files that should not have or do not need macros for their use, choose ‘Disable Macros’.
UCB_DataDude_UserGuide_updated_Track Changes_WP.doc August 2006
30
Appendix 3: Obtaining a Sample Web Address To obtain a sample web address to paste into the DataDude: • Identify the report series that you would like to download.
For example, Monterey County Exits Per Year by Gender: From the main page: http://cssr.berkeley.edu/cwscmsreports/
o Click ‘POINT-IN-TIME’ in the gray navigation bar near the top of the page. This takes you to the foster care point-in-time index at:
o http://cssr.berkeley.edu/cwscmsreports/Pointintime/ o Click ‘Child Welfare’ below Foster Care title o Click ‘In Care Frequencies’ to get to the appropriate index page: o http://cssr.berkeley.edu/cwscmsreports/Pointintime/fostercare/childwel/agean
dethnic.asp
• Navigate to a sample report page. On the index page: http://cssr.berkeley.edu/cwscmsreports/Pointintime/fostercare/childwel/ageandethnic.asp Under ‘Summary Tables’, choose the following options:
o Time Period: January 1, 2006 (any time period will work to obtain sample address)
o Category: by Placement Type o Click ‘Find’.
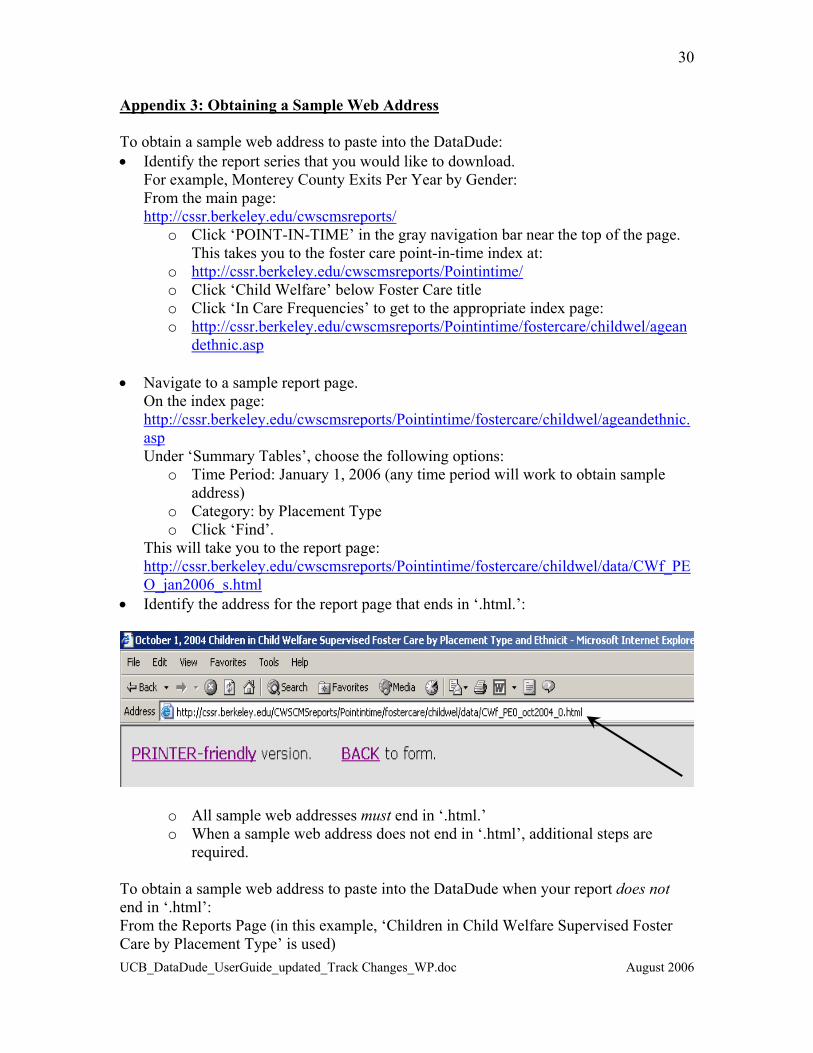
This will take you to the report page: http://cssr.berkeley.edu/cwscmsreports/Pointintime/fostercare/childwel/data/CWf_PEO_jan2006_s.html
• Identify the address for the report page that ends in ‘.html.’:
o All sample web addresses must end in ‘.html.’ o When a sample web address does not end in ‘.html’, additional steps are
required. To obtain a sample web address to paste into the DataDude when your report does not end in ‘.html’: From the Reports Page (in this example, ‘Children in Child Welfare Supervised Foster Care by Placement Type’ is used)
UCB_DataDude_UserGuide_updated_Track Changes_WP.doc August 2006
31
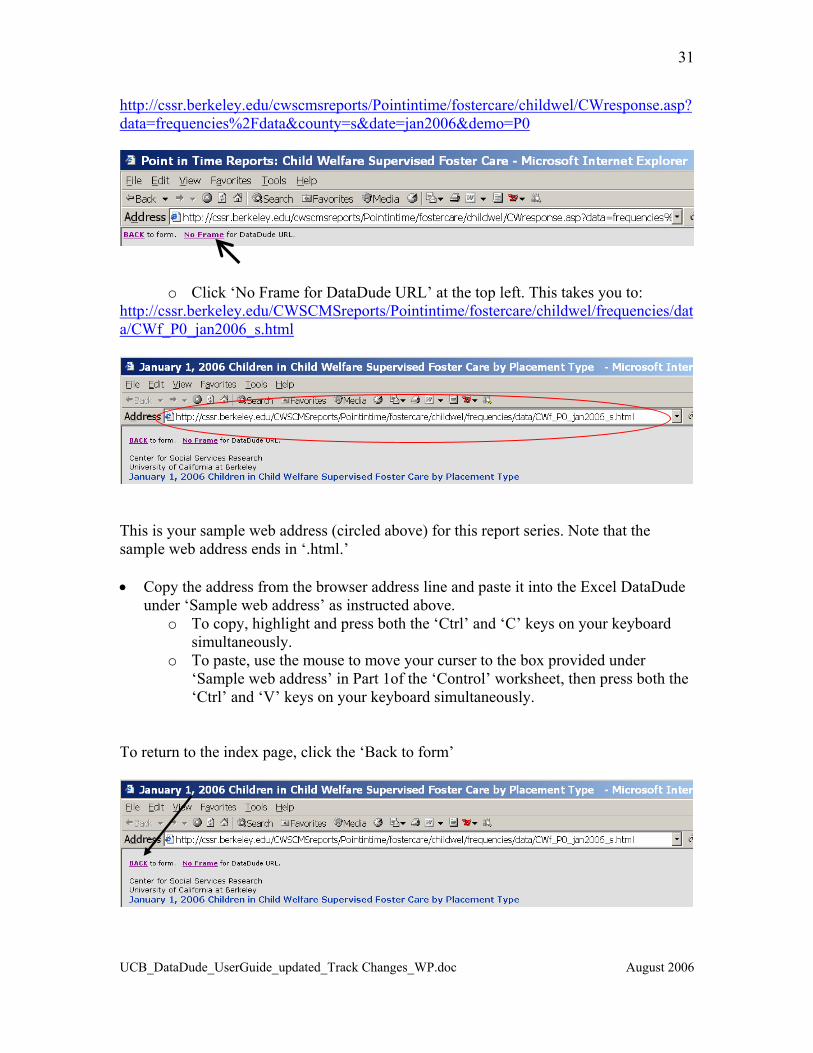
http://cssr.berkeley.edu/cwscmsreports/Pointintime/fostercare/childwel/CWresponse.asp?data=frequencies%2Fdata&county=s&date=jan2006&demo=P0
o Click ‘No Frame for DataDude URL’ at the top left. This takes you to: http://cssr.berkeley.edu/CWSCMSreports/Pointintime/fostercare/childwel/frequencies/data/CWf_P0_jan2006_s.html
This is your sample web address (circled above) for this report series. Note that the sample web address ends in ‘.html.’ • Copy the address from the browser address line and paste it into the Excel DataDude
under ‘Sample web address’ as instructed above. o To copy, highlight and press both the ‘Ctrl’ and ‘C’ keys on your keyboard
simultaneously. o To paste, use the mouse to move your curser to the box provided under
‘Sample web address’ in Part 1of the ‘Control’ worksheet, then press both the ‘Ctrl’ and ‘V’ keys on your keyboard simultaneously.
To return to the index page, click the ‘Back to form’