DUCTILITY OF HSC MEMBERS UNDER BENDING
15
Iranian Journal of Science & Technology, Transaction B, Engineering, Vol. 31, No. B2, pp. 209-223 Printed in The Islamic Republic of Iran, 2007 © Shiraz University DUCTILITY OF HSC MEMBERS UNDER BENDING * H. AKBARZADEH BENGAR AND A. A. MAGHSOUDI ** Dept. Of Civil Eng., Kerman University, Kerman, I. R. of Iran Email: [email protected] Abstract– In seismic areas, ductility is an important factor in the design of high strength concrete (HSC) members under flexure. In order to investigate this, here in this study, eight HSC beams with different percentages of ρ ρ ′ & were cast and incrementally loaded under bending. During the test, the strain on the concrete middle faces, the tension and compression bars, and also the deflection at different points of the span length were measured up to failure. Based on the obtained results, the serviceability and ultimate behavior, and especially the ductility of the HCS members are more deeply reviewed. Also a comparison between theoretical and experimental results are reported here. Keywords– Curvature and displacement ductility, HSC members, serviceability 1. INTRODUCTION Advances in concrete technology in many countries have now made the practical use of concrete with strengths up to 90 Mpa a possibility. High strength concrete, due to its very high compressive strength, is less ductile and as such creates a less ductile response in the structural members. It has been found that flexural ductility, in terms of the maximum curvatures attainable, may be smaller in high-strength concrete (HSC) beams [1-4]. HSC provides a better solution for reduced sizes and weights of structural elements [1, 5, 6]. This reduction in the cross section reflects on the reduced moment of inertia, I, which is required for the calculation of the deflection under the service load. The value of I (for both NSC and HSC) changes along the beam span from a maximum value of I g for an uncracked (gross) section, to a minimum value of I cr for the fully cracked (transformed) section. The variation of I along the span length makes the deflection calculation not only lengthy and tedious, but also less accurate. Hence, in a cracked member, to provide a smooth continuous transition between I g and I cr , over the entire length of a simply supported beam, ACI 318-2002 [7] recommends the following expression for the calculation of the effective moment of inertia cr 3 a cr g 3 a cr e I M M 1 I M M I − + = (1) where M a = maximum moment in a member at the stage that deflection is computed. M cr = cracking moment of beam. A few limited studies have been made on the adequacy of Eq.(1) for HSC [8-11]. Ashoore [11] believes that the utilization of HSC impacts the parameters involved in the deflection calculations. This includes concrete modules of elasticity and cracked moment of inertia. He modified the above Eq. (1) for the ∗ Received by the editors March 14, 2005; final revised form June 7, 2006. ∗∗ Corresponding author
Transcript of DUCTILITY OF HSC MEMBERS UNDER BENDING

Iranian Journal of Science & Technology, Transaction B, Engineering, Vol. 31, No. B2, pp. 209-223 Printed in The Islamic Republic of Iran, 2007 © Shiraz University
DUCTILITY OF HSC MEMBERS UNDER BENDING*
H. AKBARZADEH BENGAR AND A. A. MAGHSOUDI** Dept. Of Civil Eng., Kerman University, Kerman, I. R. of Iran
Email: [email protected]
Abstract– In seismic areas, ductility is an important factor in the design of high strength concrete (HSC) members under flexure. In order to investigate this, here in this study, eight HSC beams with different percentages of ρρ ′& were cast and incrementally loaded under bending. During the test, the strain on the concrete middle faces, the tension and compression bars, and also the deflection at different points of the span length were measured up to failure. Based on the obtained results, the serviceability and ultimate behavior, and especially the ductility of the HCS members are more deeply reviewed. Also a comparison between theoretical and experimental results are reported here.
Keywords– Curvature and displacement ductility, HSC members, serviceability
1. INTRODUCTION
Advances in concrete technology in many countries have now made the practical use of concrete with strengths up to 90 Mpa a possibility. High strength concrete, due to its very high compressive strength, is less ductile and as such creates a less ductile response in the structural members. It has been found that flexural ductility, in terms of the maximum curvatures attainable, may be smaller in high-strength concrete (HSC) beams [1-4].
HSC provides a better solution for reduced sizes and weights of structural elements [1, 5, 6]. This reduction in the cross section reflects on the reduced moment of inertia, I, which is required for the calculation of the deflection under the service load. The value of I (for both NSC and HSC) changes along the beam span from a maximum value of Ig for an uncracked (gross) section, to a minimum value of Icr for the fully cracked (transformed) section. The variation of I along the span length makes the deflection calculation not only lengthy and tedious, but also less accurate. Hence, in a cracked member, to provide a smooth continuous transition between Ig and Icr, over the entire length of a simply supported beam, ACI 318-2002 [7] recommends the following expression for the calculation of the effective moment of inertia
cr
3
a
crg
3
a
cre I
MM
1IMM
I
−+
= (1)
where Ma = maximum moment in a member at the stage that deflection is computed. Mcr = cracking moment of beam. A few limited studies have been made on the adequacy of Eq.(1) for HSC [8-11]. Ashoore [11] believes that the utilization of HSC impacts the parameters involved in the deflection calculations. This includes concrete modules of elasticity and cracked moment of inertia. He modified the above Eq. (1) for the ∗Received by the editors March 14, 2005; final revised form June 7, 2006. ∗∗Corresponding author
H. Akbarzadeh Bengar / A. A. Maghsoudi
Iranian Journal of Science & Technology, Volume 31, Number B2 April 2007
210
effective moment of inertia. The object of this research is to investigate the effect of ρ and ρ ′ on the ductility and deflection of HSC beams. The experimental and theoretical ductility values (recommended by Codes) are compared in this study. Also experimental and theoretical comparisons are made for beams under service loads.
2. EXPERIMENTAL PROGRAM a) Test specimens Eight HSC reinforced beams were cast and tested in this investigation. Fig. 1 shows the beam’s dimension, reinforcement details and loading arrangement. Four beams were singly reinforced and the other four doubly reinforced. Shear reinforcement was provided along the beam length except in the constant moment zone. The variables were the flexural tension and compression reinforcement ratio ρ and ρ ′ . Table 1 presents the detailed testing program. Thus for the beam numbers B1-B4 and BC1-BC4, letter B stands for singly reinforced beams and the letters BC represent the beams with compression bars, and numbers 1 to 4 indicate the variable amount of ρ and ρ ′ . For all of the doubly reinforced beams (except beam BC1), ρ was variable and the amount of ρ ′ in each beam was choosen as half of ρ. b) Materials
Locally available deformed bars were used as flexural and shear reinforcement. The bars were tested. The results obtained for fy are shown in Table 1. The concrete mix design is shown in Table 2 and the concrete compressive strength cf ′ for each beam is shown in Table 1. All beams and control specimens were cast and cured under similar conditions. The beams and specimens were kept covered under polyethylene sheets for 28 days until 24 hours before testing. c) Test procedure
All eight beams were tested under a simply supported condition and were subjected to four-point loading, as shown in Fig. 1. The distance between the two loading points was kept constant at 800 mm. The deflections were measured at different points as shown in Fig. 1, but only the midspan deflections are reported here. Strains in the tension and compression steel were measured by electrical strain gages. The demec points were fixed (see Fig. 1) for measuring the concrete strains. Again, only the midspan concrete strain are reported herein. The load was applied by means of a 1400 kN hydraulic testing machine. The load was applied in 20 to 25 increments up to failure. At the end of each load increment, observations, measurements and crack development and propagation on the beam surfaces were recorded.
3. TEST RESULTS AND DISCUSSIONS The beams were all designed to fail in flexure. All beams exhibited vertical flexural cracks in the constant moment region before final failure of the beams due to crushing of concrete. Fig. 2 shows the crack propagation under the load.
Table 3 presents the experimental and theoretical (ACI & CSA) cracking, yielding and ultimate moments of the test specimens. The experimental cracking moment, Mcr(exp), corresponds to the moment at which the moment–curvature curve deviates from its initial slope. The experimental yielding moment,
(exp)yM , corresponds to the moment at the beginning of the yielding flat plateau in the moment-curvature curve. The experimental ultimate moment, M (exp)u , is the moment corresponding to the testing ultimate load. The results obtained show that the experimental moments are higher than the theoretical values. A comparison between the two Codes (ACI & CSA) for the theoretical values also shows that for all beams tested, the ACI values are generally higher than the CSA [12] values.

Ductility of HSC members under bending
April 2007 Iranian Journal of Science & Technology, Volume 31, Number B2
211
a) Details of test beams
b) Testing arrangement
Fig. 1. Details of test beams and testing arrangement (all dimensions are in (mm))
Table 1. Testing program detail of the tested beams
Beam No.
f′c ( MPa)
fy ( MPa)
d (mm)
d′ (mm) As
ρ (%)
A′s ρ′ (%)
BC1 56.31 398 254 42 2Φ14 0.61 2Φ14 0.61 B1 69.50 398 254 - 2Φ14 0.61 - - BC2 63.48 401 250 47 2Φ20 1.25 2Φ14 0.61 B2 70.50 401 250 - 2Φ20 1.25 - - BC3 63.21 373 251 42 4Φ18 2.03 2Φ14+1Φ18 1.01 B3 70.80 373 251 - 4Φ18 2.03 - - BC4 71.45 401 250 47 4Φ20 2.51 2Φ14+1Φ20 1.24 B4 72.80 401 250 - 4Φ20 2.51 - -

H. Akbarzadeh Bengar / A. A. Maghsoudi
Iranian Journal of Science & Technology, Volume 31, Number B2 April 2007
212
Fig. 2. Crack propagation and failure of the beams under load
Table 2. Concrete mix proportion
Cement (kg/m3)
Microsilica (kg/m3)
Coarse agg. (kg/m3)
Fine agg. (kg/m3)
Super-plasticizer (kg/m3)
W/C ratio
648.98 55.10 723.50 645.92 11.22 0.32
Table 3. Experimental and theoretical bending moment of tested beams
Beam No.
Mu(exp) kN.m
My(exp) kN.m
Mcr(exp) kN.m
Mu(th-ACI) kN.m
Mu(th-CSA) kN.m
Mcr(th-ACI) kN.m
Mcr(th-CSA) kN.m
BC1 44.54 23.96 9.41 32.00 32.20 13.96 6.75 B1 36.93 18.39 9.40 30.37 30.29 15.51 7.50
BC2 71.00 47.334 11.99 60.87 60.69 14.82 7.17 B2 74.74 59.60 12.49 60.47 59.75 15.62 7.56
BC3 112.75 79.97 12.93 83.58 87.77 14.79 7.15 B3 93.59 75.84 7.63 89.44 88.58 15.65 7.57
BC4 127.75 93.49 8.09 115.79 114.84 15.72 7.61 B4 122.28 96.23 7.20 115.96 114.44 15.87 7.68
a) Cracking moment
The analytical evaluation of deflection depends greatly on the cracking moment of the beams. Cracking moment is usually estimated using the modulus of rupture as

Ductility of HSC members under bending
April 2007 Iranian Journal of Science & Technology, Volume 31, Number B2
213
M cr =t
gr
yIf .
(2)
where fr = the modulus of rupture, which is different in the two Codes (ACI & CSA) as MPa (ACI) and cr f3.0f ′= MPa (CSA). y t = the distance from the neutral axis to the extreme tensile fiber of the beam.
The value of fr usually depends on several factors such as the crack observation technique, sensitivity to residual stresses, etc., but here the experimental cracking moment, M (exp)cr , is used to determine the experimental cracking stress, fr(exp). The variation of fr(exp) as a function of only the reinforcement ratio is shown in Fig. 3. Figure 3 indicates that the experimental cracking stress for the doubly reinforced beams is more than the singly reinforced beams. It also shows that the experimental cracking stresses lie between the values predicted by CSA and ACI. In addition, the CSA code underestimates the experimental cracking stresses.
Fig. 3.The comparison between experimental and theoretical values of fr with variable ρ for the tested beams
b) Neutral axis depth
The experimental variation of the neutral axis, (N.A.) depth ″X″ in the constant moment zone is shown in Fig. 4 and Table 4. The depth ″X″ is obtained from the strain distribution that was measured experimentally in the concrete and the tension reinforcement. In the figure, the horizontal plateau shows that the depth of ″X″ does not vary between cracking and yielding levels. The results also show that, by adding ρ ′ to the singly reinforced beams, the depth of ″X″ at the ultimate state is decreased. The comparison is between the ratio of X/d versus loads for singly and doubly reinforced tested beams and is also presented in Fig. 4(b, c). It is clear from Figs. 4(b, c) and Table 4 that, by increasing the amount of ρ, the values of ″X″ are increased both for yield and ultimate conditions.
Table 4. Experimental neutral axis depth at cracking, yield and ultimate points of Fig. 4
Beam No. Xcr (cm) Xy (cm) Xu (cm) BC1 10.00 8.27 2.70 B1 10.80 10.00 3.00
BC2 11.56 8.77 2.72 B2 12.00 10.00 3.700
BC3 14.10 9.86 4.02 B3 17.20 11.50 4.90
BC4 17.50 11.85 5.20 B4 18.70 12.80 6.50
0123456
0 0.5 1 1.5 2 2.5 3
Tension reinforcement ratio, ρ (%)
BC
B
ACI
CSA
f r (M
Pa)

H. Akbarzadeh Bengar / A. A. Maghsoudi
Iranian Journal of Science & Technology, Volume 31, Number B2 April 2007
214
ρ=0.61 (%)
00.250.5
0.751
1.25
0 50 100 150 200
Load, P (kN)
X/d
BC1B1
ρ=1.25 (%)
00.25
0.50.75
11.25
0 100 200 300 400
Load, P (kN)
X/d
BC2B2
ρ=2.027 (%)
00.250.5
0.751
1.25
0 100 200 300 400 500 600
Load, P (kN)
X/d
BC3B3
ρ=2.51 (%)
00.250.5
0.751
1.25
0 100 200 300 400 500 600
Load, P (kN)
X/d
BC4B4
Fig. 4. a) Behavior of neutral axis depth under the load

Ductility of HSC members under bending
April 2007 Iranian Journal of Science & Technology, Volume 31, Number B2
215
0
0.2
0.4
0.6
0.8
1
1.2
0 100 200 300 400 500 600
Load, P (kN)
X/d
B1B2B3B4
Fig. 4. b) Comparison of neutral axis depth under the load for singly reinforced beams
Fig. 4. c) Comparison of neutral axis depth under the load for doubly reinforced beams c) Cracked moment of inertia
The calculation of deflection depends basically on the fully cracked moment of inertia, Icr. The experimental cracked moment of inertia based on the elastic deformation theory is obtained by considering
Icr(exp1) =expc
22y
E48)a4l3(a.P
∆−
(3)
where Py= the load that causes yielding in the steel reinforcement a = the shear arm (see Fig. 1). l = the clear span of the beam. Icr can also be defined as the slope of the line connecting the origin and point of initial yielding of tensile reinforcement in moment curvature curve [13&14]. This is given as
Icr(exp2) =yc
y
EM
φ (4)
where
yφ =d
sycy εε +=
csyε
cyε = the measured compression strain in the concrete at yielding of steel reinforcement. syε = the measured tensile strain in steel reinforcement at yielding stage.
c = neutral axis depth (see Fig. 5).
00.20.40.60.8
11.2
0 100 200 300 400 500 600
Load, P (kN)
X/d
BC1BC2BC3BC4

H. Akbarzadeh Bengar / A. A. Maghsoudi
Iranian Journal of Science & Technology, Volume 31, Number B2 April 2007
216
Fig. 5. Beam cross section and strain distribution
The traditional theoretical definition of Icr based on the cracked transformed section can be given as:
(a) Beams with single reinforcement
0dnAcnA2
bcss
2=−+ (5)
Icr = 2s
3)cd(nA
3bc
−+ (6) where cs EEn = and 6900f3200E cc +′= (MPa) (b) Beams doubly reinforced
0n)dAdA(nc)AA(2
bcssss
2=′′+−′++ (7)
2
s2
s
3
cr )dc(A)1n()cd(nA3
bcI ′−′−+−+= (8)
The results of the theoretical and experimental moment of inertia of the cracked section are presented in Table 5. It is clear that, for all the cases, the values of Icr(exp) are lower than the values of Icr(th). Also, Icr(exp2) is higher than Icr(exp1). The difference in values of Icr(exp1) and Icr(exp2) is expected due to the great variation in the curvature distribution along the beam, especially due to the peaks in curvature at the cracks location. Based on this, the graphical representation of gcr II for both the theoretical and experimental values versus ρ are shown in Fig. 6. By increasing the percentage of ρ, the value of Icr is increased. Also, by comparing the results of beams, BC, and B, for either experimental or theoretical values, it is obvious that although ρ ′ is a variable in BC-beams, the values Icr of BC-beams are higher than that of the B-beams, but the increase is not too high.
Table 5. Theoretical and experimental cracked moment of inertia
Beam No.
Icr(th)×106
(mm4) Icr(exp1) ×106
(mm4) Icr(exp2) ×106
(mm4) BC1 90.66 38.54 57.68 B1 84.05 33.77 44.31
BC2 150.23 83.00 117.42 B2 143.78 72.18 107.11
BC3 220.93 116.88 157.81 B3 206.38 101.88 134.39
BC4 248.76 104.63 172.57 B4 234.671 104.24 159.76

Ductility of HSC members under bending
April 2007 Iranian Journal of Science & Technology, Volume 31, Number B2
217
00.10.20.30.40.50.6
0.5 1 1.5 2 2.5 3
Tension reinforcement ratio, ρ(%)
Icr/Ig
BC(exp1)B(exp1)BC(exp2)B(exp2)BC(th)B(th)
Fig. 6. Effect of ρ on the Icr for the tested beams
d) Ductility
Ductility is the capacity to undergo inelastic deformation and absorb energy. Several forms of ductility are often considered [15]. These include curvature, rotational and displacement ductility. In this research, displacement ductility and curvature ductility are investigated.
Displacement ductility--Displacement ductility is defined as the ratio of deflection at ultimate load to the deflection at the first yielding of tensile steel. Ultimate load is the maximum load that can be applied to a beam during testing [3, 16 and 17].
In Fig. 7, the load deflection curves are presented. Table 6 presents the value of deflections at the yielding of tensile reinforcement, ∆y, and at ultimate load, ∆u. In general, ∆u increases as ρ decreases. Also, by adding ρ′ in a section, ∆u will increase. It is obvious that ∆y increases as ρ increases and ∆y
decreases as ρ′ increases in the section. In Fig. 8, the effect of ρ on displacement ductility is presented. As expected, the displacement
ductility is decreased as ρ is increased. It can also be seen that, by adding ρ ′ , in addition to the moment increase, the ductility will also be increased for HSC beams.
A displacement ductility, dµ , in the range of 3 to 5 is considered imperative for adequate ductility, especially for seismic design and the redistribution of moments [3]. Therefore, assuming that a dµ value of 3 represents an acceptable lower bound for the ductile behavior of flexural members, it appears that the singly reinforced beams with reinforcement ratios ρ greater than 2.0% would not meet that requirement (Fig. 8). Whereas, in doubly reinforced beams with an even greater amount of ρ, more than an acceptable lower bound ductility (for BC4, µd=4.56) is attainable.
Curvature ductility--Perhaps the most simple and general definition for ductility is defined as the curvature ductility [15]. For design, the usual equations for the curvatures at yield load (φy) and at ultimate (φu) load (see Fig. 9) are: a) Beams with Singly reinforced
)K1(dEf
s
yy −
=φ (9)
2122 ]nn2[nK ρρρ ++−= (10)
u
cuu X
εφ = (11)
c1
yu f
dfX
′=
αβ
ρ (12)

H. Akbarzadeh Bengar / A. A. Maghsoudi
Iranian Journal of Science & Technology, Volume 31, Number B2 April 2007
218
2y
2122sc1cu
y
u
f))nn2(n1(E)f(
ρ
ρρραβεφφ
µ+−+′
== (13)
Fig. 7. Load-deflection curves of the tested beams
ρ =1.25 (%)
0
100
200
300
0 10 20 30 40 50
Mid span deflection (mm)
BC2
B2
Load
, P (k
N)
ρ =2.03 (%)
0100200300400500
0 10 20 30 40 50 60
Mid span deflection (mm)
BC3
B3
Load
, P (k
N)
ρ =0.61 (%)
050
100150200
0 10 20 30 40 50 60 70
Mid span deflection (mm)
BC1
B1
Load
, P(k
N)
ρ =2.51 (%)
0100200300400500600
0 10 20 30 40 50
Mid span deflection (mm)
BC4
B4
Load
, P (k
N)
Ductility of HSC members under bending
April 2007 Iranian Journal of Science & Technology, Volume 31, Number B2
219
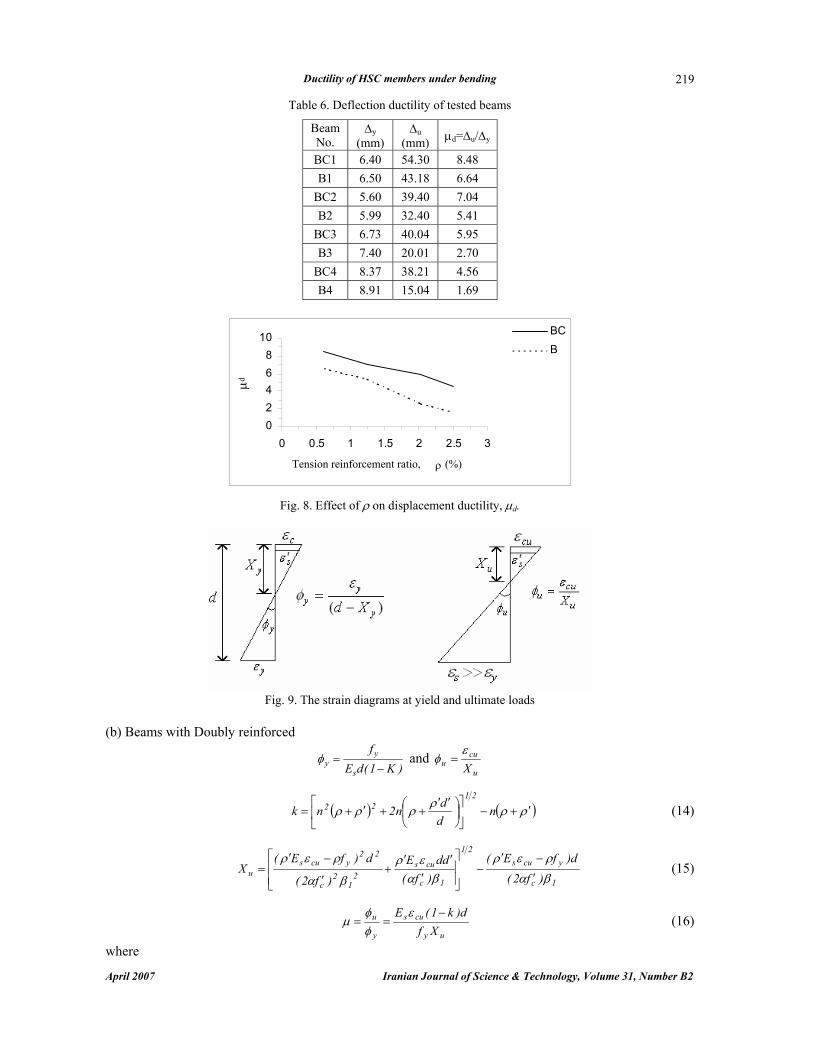
Table 6. Deflection ductility of tested beams
Beam No.
∆y (mm)
∆u (mm) µd=∆u/∆y
BC1 6.40 54.30 8.48 B1 6.50 43.18 6.64
BC2 5.60 39.40 7.04 B2 5.99 32.40 5.41
BC3 6.73 40.04 5.95 B3 7.40 20.01 2.70
BC4 8.37 38.21 4.56 B4 8.91 15.04 1.69
02468
10
0 0.5 1 1.5 2 2.5 3
Tension reinforcement ratio, ρ (%)
µd
BC
B
Fig. 8. Effect of ρ on displacement ductility, µd.
Fig. 9. The strain diagrams at yield and ultimate loads
(b) Beams with Doubly reinforced
)K1(dEf
s
yy −
=φ and u
cuu X
εφ =
( ) ( )ρρρ
ρρρ ′+−
′′++′+= n
ddn2nk
2122 (14)
1c
ycus21
1c
cus2
12
c
22ycus
u )f2(d)fE(
)f(ddE
)f2(
d)fE(X
βα
ρερ
βαερ
βα
ρερ′
−′−
′′′
+′
−′= (15)
uy
cus
y
u
Xfd)k1(E −
==ε
φφ
µ (16)
where

H. Akbarzadeh Bengar / A. A. Maghsoudi
Iranian Journal of Science & Technology, Volume 31, Number B2 April 2007
220
Xu = Distance from the neutral axis to the extreme compressive fiber at ultimate. Xy = Distance from the neutral axis to the extreme compressive fiber at yield. α = the stress block coefficient.
1β = the ratio between the height of the stress block and X. Es = module of elasticity of steel.
The moment-curvature curves at mid-span sections of the tested beams are shown in Fig. 10. For the tested beams, the theoretical and experimental values of ductility at yield and ultimate conditions and also their curvature ductilities are given in Table 7. For both conditions, the values of φy are increased as ρ is increased. By comparing the theoretical and experimental results of beams B1-B4 with the BC1-BC4, the value of φy is decreased with the addition of ρ ′ . For all tested beams, the amount of φy(th) are lower than the φy(exp). By increasing ρ, the value of φu is decreased. Again by comparing the theoretical and experimental results of beams B1-B4 with the results of beams BC1-BC4, the value of φυ is increased when ρ ′ is added.
Fig. 10. Mid-span moment-curvature curves for tested beams
Table 7. Comparison of experimental and theoretical curvature ductility
Experimental Theoretical (ACI) Theoretical (CSA) Beam
No. φy×10-5 φu×10-5 µφ φy×10-5 φu×10-5 µφ φy×10-5 φu×10-5 µφ
BC1 1.31 15.50 11.84 0.98 9.70 9.89 0.98 11.69 11.91 B1 1.20 12.30 10.25 0.98 18.80 19.13 0.98 23.57 23.98
BC2 1.21 8.27 6.84 1.12 7.44 6.68 1.12 9.07 8.13 B2 1.60 8.60 5.38 1.13 9.26 8.22 1.13 11.62 10.31
BC3 1.52 8.75 5.75 1.12 6.20 5.53 1.12 7.71 6.87 B3 1.62 7.33 4.52 1.16 6.17 5.34 1.16 7.69 6.65
BC4 1.55 8.68 5.60 1.25 5.93 4.75 1.25 7.32 5.87 B4 1.71 4.83 2.82 1.31 4.78 3.64 1.31 5.89 4.48
For almost all beams, the φu(th) values based on the ACI method [7], are lower than the φu(exp). Whereas
the φu(th) based on the CSA method [12], for the doubly reinforced beams, are lower than the φu(exp), but for the singly reinforced beams (B1-B4), these values are higher than the φu(exp) values.
ρ = 1.25 (%)
020406080
0 2 4 6 8 10
BC2
B2
φ×10-5 (1/mm)
Mom
ent ×
106
(N.m
m)
ρ = 0.61 (%)
01020304050
0 2 4 6 8 10 12 14 16 18
BC1
B1
φ×10-5 (1/mm)
Mom
ent ×
106
(N.m
m)
ρ = 2.03 (%)
020406080
100120
0 2 4 6 8 10
BC3
B3
φ×10-5 (1/mm)
Mom
ent ×
106
(N.m
m)
ρ =2.51 (%)
020406080
100120140
0 2 4 6 8 10
BC4B4
Mom
ent
×106
φ×10-5 (1/mm)

Ductility of HSC members under bending
April 2007 Iranian Journal of Science & Technology, Volume 31, Number B2
221
The effect of ρ on the curvature ductility, µφ for the tested beams and their theoretical and experimental comparison are plotted in Fig. 11. As can be seen, the theoretical values obtained by the CSA method are higher than the theoretical values of ACI as well as the experimental results. For a lower percentage of ρ (up to 0.2ρb), the CSA values are very close to the experimental results, whereas the ACI values are lower than the experimental results. In Fig. 12, a comparison of displacement ductility for HSC beams with both the theoretical and experimental values of the curvature ductility are presented. The results show that except for beams B1 and BC1 which contained ρmin, the difference between the curvature and displacement (both theoretically and experimentally) values of ductility are quite small.
05
10152025
0 0.5 1 1.5 2 2.5 3Tension reinforcement ratio, ρ (%)
µ φ
BC(exp)BC(th-ACI)BC(th-CSA)B(exp)B(th-ACI)B(th-CSA)
Fig. 11. Effect of ρ on curvature ductility, µφ
Fig. 12. Comparison ductility for tested beams e) Comparison of the experimental results with the ABA An attempt was made to compare the experimental research reported here with the latest version of the Iranian Concrete Standard called ABA but, as the ABA is silent with high strength concrete (HSC), such a comparison was not possible. However, as general comment, it remains that, for seismic areas, the ductility design of structures is preferred while compared to the limit states design considered in ABA.
4. CONCLUSION The following conclusions can be drawn based on the test results:
0
5
10
15
20
25
1 2 3 4 5 6 7 8
Duc
tility
,
µδ
mf(exp)
mf(th-ACI)
mf(th-CSA)
BC1 BC2 B3B1 B2BC4 B4BC3
µd
µφ (exp)
µφ (th-ACI)
µφ (th-CSA)
H. Akbarzadeh Bengar / A. A. Maghsoudi
Iranian Journal of Science & Technology, Volume 31, Number B2 April 2007
222
1. The experimental cracking stress for the doubly reinforced beams is more than that of the singly reinforced beams. The experimental cracking stresses lie between the values predicted by CSA and ACI. In addition, the CSA code underestimates the experimental cracking stresses.
2. By increasing the amount of ρ, the N.A. depth is increased both for yield and ultimate conditions. The results also show that, by adding ρ ′ to the singly reinforced beams, the depth of N.A. at ultimate state is decreased.
3. As it was expected, the values of Icr(exp) are lower than the values of Icr(th). 4. Although the use of ρ ′ in the singly reinforced beams causes an increase in Icr, the increased
amount is not significant. 5. It appears that, for the singly reinforced HSC beams with reinforcement ratios ρ greater than
2.0%, the ductility requirement would not be satisfied. However, for doubly reinforced beams with even greater amounts of ρ, more than an acceptable lower bound ductility was possible.
6. The theoretical curvature ductility values based on the CSA method are higher than the theoretical values of ACI, as well as the experimental results. For lower percentages of ρ (up to 0.2ρb), the CSA values are very close to the experimental results, whereas the ACI values are lower than the experimental results.
7. Except for the beams which contained ρmin, the curvature ductility and the displacement ductility values are almost similar in the HSC beams tested here.
REFERENCES
1. ACI Committee 363 (1992). Review of ACI code for possible revisions for high-strength concrete (ACI 362R-92). American Concrete Institute, Detroit.
2. Ozbakkaloglu, T. & Saatcioglu, M. (2004). Rectangular stress block for high-strength concrete. ACI Structural Journal, 101(4), July-Agust, 475-483.
3. Ahmad, S. H. & Barker, R. (1991). Flexural behavior of reinforced high strength lightweight concrete beams. ACI Materials Journal, 88(1), 69-77.
4. Ashour, S. A. & Wafa, F. F. (1993). Flexural behavior of high strengh fiber reinforced concrete beams. ACI Structural Journal, 90(3), 279-287.
5. Nilson, A. H. (1987). Design implication of current research on high strength concrete. High-Strength Concrete, ACI SP-87. American Concrete Institute, Detroit, 85-109.
6. Swamy, R. N. (1987). High strength concrete–material properties and structural behavior. High-Strength Concrete, ACI SP-87. American Concrete Institute, Detroit, 110-146.
7. ACI Committee 318 (2002). Building code requirements for structural concrete and commentary. ACI 318-02 and ACI 318R-02.
8. Khuntia, M. & Ghosh, S. K. (2004). Flexural stiffness of reinforced concrete columns and beams. ACI Structural Journal, 101(3), 351-363.
9. Ashour, A. A., Wafa, F. F. & Kamal, M. I. (2000). Effect of the concrete compressive strength and tensile reinforcement ratio on the flexural behavior of fibrous concrete beams. Engng. Struct. J., 1133-1146.
10. Leslie, K. E., Rajagopalan, K. S. & Everard, N. J. (1976). Flexural behavior of high-strength concrete beams. ACI Structural Journal, 73(9), 517-521.
11. Ashour, A.A. (2000). Effect of compressive strength and tensile reinforcement ratio flexural behavior of high-strength concrete beams. Journal of Structural Engineering, ASCE, 2000, 413-423.
12. CAN3-A23.3-94 (1994). Design of concrete structures for building. Canadian Standards Association, Ontario, Canada, 199.

Ductility of HSC members under bending
April 2007 Iranian Journal of Science & Technology, Volume 31, Number B2
223
13. Ghali, A. (1993). Deflection of reinforced concrete members, a critical review. ACI Structural Journal, 90(4), 364-373.
14. Macgregor, I. G. (1988). Reinforced concrete mechanics and design. New Jersey (U.S.A.), Prentice-Hall International.
15. Maghsoudi, A. A. (1996). Design for ductility of structures. Shaheed Bahonar University Publications. 16. Paster, J. A., Nilson, A. H. & Slate, F. O. (1984). Behavior of high-strength concrete beams. Report No. 84-
3, Department of Structural Engineering, Cornell University, Ithaca, NY, 311. 17. Akbarzadeh Bengar, H. (2004). Effect of tensile and compressive rainforced ratio on ductility and behavior
of high-strength concrete rainforced. MSc. Desertation, Shahid Bahonar University of Kerman, Kerman, Iran.