Duck Valley Resident Fish Stocking Program - …/67531/metadc743326/m2/1/high... · duck valley...
20
DUCK VALLEY RESIDENT FISH STOCKING PROGRAM THIS IS INVISIBLE TEXT TO KEEP VERTICAL ALIGNMENT THIS IS INVISIBLE TEXT TO KEEP VERTICAL ALIGNMENT THIS IS INVISIBLE TEXT TO KEEP VERTICAL ALIGNMENT THIS IS INVISIBLE TEXT TO KEEP VERTICAL ALIGNMENT THIS IS INVISIBLE TEXT TO KEEP VERTICAL ALIGNMENT Final Annual Report 2000 DOE/BP-00004762-1
Transcript of Duck Valley Resident Fish Stocking Program - …/67531/metadc743326/m2/1/high... · duck valley...
DUCK VALLEY RESIDENT FISH
STOCKING PROGRAM
THIS IS INVISIBLE TEXT TO KEEP VERTICAL ALIGNMENT THIS IS INVISIBLE TEXT TO KEEP VERTICAL ALIGNMENT THIS IS INVISIBLE TEXT TO KEEP VERTICAL ALIGNMENT THIS IS INVISIBLE TEXT TO KEEP VERTICAL ALIGNMENT THIS IS INVISIBLE TEXT TO KEEP VERTICAL ALIGNMENT
Final Annual Report 2000
DOE/BP-00004762-1

This report was funded by the Bonneville Power Administration (BPA), U.S. Department of Energy, aspart of BPA's program to protect, mitigate, and enhance fish and wildlife affected by the developmentand operation of hydroelectric facilities on the Columbia River and its tributaries. The views of thisreport are the author's and do not necessarily represent the views of BPA.
This document should be cited as follows: Pero, Vincent - Shoshone-Paiute Nation Duck Valley Indian Reservation, Duck Valley Resident Fish Stocking ProgramFinal Annual Report 2000, Report to Bonneville Power Administration, Contract No. 00004762, Project No. 19881560,20 electronic pages (BPA Report DOE/BP-00004762-1)
This report and other BPA Fish and Wildlife Publications are available on the Internet at:
http://www.efw.bpa.gov/cgi-bin/efw/FW/publications.cgi
For other information on electronic documents or other printed media, contact or write to:
Bonneville Power AdministrationEnvironment, Fish and Wildlife Division
P.O. Box 3621905 N.E. 11th Avenue
Portland, OR 97208-3621
Please include title, author, and DOE/BP number in the request.

Duck Valley Resident Fish Stocking Program
1988-156-01
Final Annual Report 2000
Guy Dodson Sr. - Project Director Vincent Pero - Principle Biologist
Shoshone-Paiute Nation Duck Valley Indian Reservation
Department of Habitat, Parks, Fish and Game Box 219
Owyhee, NV 89832 208-759-3246
1

TABLE OF CONTENTS Page
List of Attachments 3
Abstract 4
Introduction 5
Methods 6 Results 8
Discussion 10
2

LIST OF ATTACHMENTS Attachment Page #1 Mt. View Reservoir Water Quality 14 #2 Sheep Creek Reservoir Water Quality 15 #3 Creel Survey form 16
3

Abstract
The Shoshone-Paiute Tribes fish-stocking program was begun in 1988 and is intended to provide a subsistence fishery for the tribal members. The program stocks catchable and fingerling size trout in Mt. View and Sheep Creek Reservoirs. Rainbow trout are purchased from only certified disease-free facilities to be stocked in our reservoirs. This project will help restore a fishery for tribal members that historically depended on wild salmon and steelhead in the Owyhee and Bruneau Rivers and their tributaries for their culture as well as for subsistence. This project is partial substitution for loss of anadromous fish production due to construction and operation of hydroelectric dams on the Columbia and Snake Rivers. Until anadromous fish can be returned to the Owyhee and Bruneau Rivers this project will continue indefinitely. As part of this project the Shoshone-Paiute Tribes will also receive income in the form of fees from non-tribal members who come to fish these reservoirs. Regular monitoring and evaluation of the fishery will include sampling for length/weight/condition and for signs of disease. A detailed Monitoring and evaluation plan has been put in place for this project. However due to budget limitations on this project only the fishery surveys and limited water quality work can be completed. A creel survey was initiated in 1998 and we are following the monitoring and evaluation schedule for this program (as budget allows) as well as managing the budget and personnel. This program has been very successful in the past decade and has provided enjoyment and sustenance for both tribal and non-tribal members. All biological data and stocking rates will be including in the Annual reports to Bonneville Power Administration (BPA).
4

INTRODUCTION The entire Owyhee Basin (including the Duck Valley Indian Reservation (DVIR)) is classified as a blocked area in the Northwest Power Planning Councils (NWPPC) Fish and Wildlife Program (NWPPC 1995; Section 10.8). The Owyhee River sub basin is in the Upper Snake River Basin and once supported a large diverse community of native anadromous and resident fish populations. The complete extirpation of anadromous fish from this area reduced the native salmonid assemblage and greatly impacted the culture, religion, and livelihood of the Shoshone-Paiute people. Resident fish and wildlife species in the subbasin were also impacted through lost productivity (absence of nutrient component attributed to anadromous fish) and related land use practices (grazing, logging, mining, municipal development) facilitated by the hydropower development in the region.
Since 1956, reservoirs and streams on the DVIR have been stocked with catchable trout under the auspices of the US Fish and Wildlife Service (Burge and Miller 1990). During 1956 to 1990, Sheep Creek Reservoir was stocked with over 3 million rainbow trout ranging in size from 2-11 inches. Stocking of Mountain View reservoir began in 1970. Through 1990 over 2.5 million trout ranging in size from 2-13 inches have been released in Mt. View Reservoir. During 1966-1981, the East Fork Owyhee River was stocked with over 72,000 rainbow trout ranging in length from 8-11 inches.
From 1990 to present the Tribes have stocked roughly 46,000 lbs of catchable size trout in the reservoirs each year. Stocking in the Owyhee River and its tributaries ceased when the Tribes took over the stocking program. Accurate creel data and water quality data is not available for the years prior to 1997. The data presented in this report will therefore be used as baseline data to help determine future management decision regarding the Tribes stocking program.
In 2000 the Shoshone-Paiute Tribes stocked 19,750 lbs. of catchable size (9-13 inches) rainbow trout into Mt. View Reservoir and 19,750 lbs. of catchable size rainbow (9-13 inches) trout into Sheep Creek Reservoir. Along with this stocking the Tribes stocked 53,000 fingerling (5-7 inches) size rainbow trout into each reservoir. We increased the number of larger size fish in order to help avoid predation on the fingerlings due to the numerous waterfowl on the Reservation (ie. Pelicans, Terns).
5

METHODS
Fish Stocking The work completed at Mt. View and Sheep Creek Reservoirs entails the stocking of fish from two different private sources as well as biological and limnological sampling by the Shoshone-Paiute Tribes fisheries biologist and crew.
The fish stocked by College of Southern Idaho (CSI) were transported in five different loads of fish beginning in fall of 2000 with the last load being delivered in May of 2001. The fish were transported in a tanker truck with Oxygenated water from Twin Falls Idaho to the DVIR. We received 4044 pounds of fish sizes from 5-8 inches in length (1.5 –2.5 fish/lb.). The fish were split between the two reservoirs with two loads going to Mt. View and three loads going to Sheep Creek Reservoir. The justification behind the division of fish is that Sheep Creek is a larger reservoir and has greater carrying capacity than Mt. View. Water temperatures were checked in the truck and the lake and if there was a difference of greater than 3 degrees the fish were acclimated in the truck with reservoir water until temperatures reached equilibrium. This usually takes approximately 35-80 minutes depending on conditions. The fish are then put into the lake from the truck via a tube from the tanker truck.
Fish are checked for condition and health prior to being put into the reservoirs. To complete this work we take three random dip-net samples from the truck and inspect the fish for disease signs or any lesions or deformities. As part of this sampling, we also check to ensure that we have an average of 20-40 fish per pound.
The other supplier of fish for the DVIR is Black Canyon Trout farm from Grace, Idaho.
We received 39,500 pounds of catchable size (9-13 inches) rainbow trout and 100,000 fingerling sized trout (3-6 inches). As with CSI the fish were delivered in an oxygenated tanker truck from Black Canyon to the DVIR. There are approximately 1.5 fish per pound of the catchable size fish and 60 fish per pound of the fingerling size trout. Water temperatures were checked in the truck and the lake and if there was a difference of greater than 3 degrees the fish were acclimated in the truck with reservoir water until temperatures reached equilibrium. Fish are also checked for signs of disease and stress before entering our reservoirs. This is accomplished through three random dip-net samples taken under crowded conditions from the tanker truck.
Stocking began in late fall 2000 with the final stocking taking place in early May 2001. Biological The biological sampling of the reservoirs takes place biannually, and in December of 1998 we began under ice sampling to determine how our waters are reacting to the winter months. This information will aid in management decisions as well as help us should we see problems in the spring with our fishery.
The sampling includes water temperature, dissolved oxygen, Ph, conductivity and secci readings. The water sampling is done using the YSI 600XL water quality meter. The reservoirs are sampled at three different locations. Locations have GPS points taken and are marked on a map in order to repeat these sites in future sampling. The samples are taken from a boat with the first sample taken off the bottom and readings taken every 4-6 feet until we reach the surface (Falter
6

1998 personnel communication). Under ice sampling was taken at approximately the same locations as from the boat. A hole was drilled in the ice and readings taken according to the sampling plan. This will occur every winter, conditions permitting. The meter is calibrated before each outing using the protocol in the YSI instruction manual (YSI inc. 1998). This work is completed at both Mt. View and Sheep Creek Reservoirs.
As part of this work we also collect plankton samples at the same three locations for each reservoir. Samples are collected using a plankton net thrown from the boat and pulled in at approximately 3 feet/sec. Beginning in 2000 plankton samples were analyzed for species composition by the Pyramid Lake Paiute Tribe. Future analysis may include density and abundance of plankton by species.
Gill Netting Gill netting occurs in the spring and fall to determine populations and fish health.
One 100 foot gill nets are set overnight at each reservoir. One net is an experimental net while the other net is ¾ inch opening net. Nets are set in the early evening and pulled the following morning. Fish captured are weighed, length taken, physical observation made, and scales samples taken for future work.
All information is recorded and will be included in the “results” section of this report.
Creel Survey Creel surveys are taken as time permits. Both a roving creel survey and access point surveys have been utilized in 2000. The creel surveys are taken by game wardens, temporary employees, and staff as time permits. In 1999 an intensive creel survey was initiated. Information from 2000 - 2001 will be compared with the 1999 data to determine success of the fishery. This data will also be compared with the limited data from 1997 and 1998. This information helps us determine numbers of fishing being caught, sizes, health, and other information offered by the persons fishing.
7

RESULTS
Fish Stocking The stocking for 2000 was very successful. All fish that arrived from both vendors arrived in excellent condition and were released with no problems. The fish were observed throughout the day of release and all appeared to disperse in less than two hours after release. We observed a mortality rate on the stocked fish to be <1% after initial stocking. These results were consistent at both reservoirs. One problem that occurred was a fish kill during the winter/early spring of 2000/01. Data from under ice sampling in late winter of 2001 indicated low oxygen levels at Mt. View Reservoir. During the spring of 2001 approximately 300-500 trout were found washed up on the shore of Mt. View Reservoir. The likely cause was low under ice dissolved oxygen. Part of this problem occurred from not having Mt. View water levels at full pool in late fall 2000. This problem was reported to administration but due to the irrigation of the Tribal farm land, we were not able to get enough water in the reservoir before it iced over. Biological Results from the 2000 sampling are included as Attachment 1 (Mt. View Reservoir water quality) and Attachment 2 (Sheep Creek Reservoir water quality). The information collected is conducive to a trout fishery (Bennett 1997) in regards to temperature and oxygen requirements. However low oxygen levels were observed during under ice sampling in early 2001. Further information on this is included in the “discussion” section.
Gill Netting
Results of the gill netting are included as Attachment 3 (Mt. View Reservoir gill netting) and Attachment 4 (Sheep Creek Reservoir gill netting). Both reservoirs contained limited numbers of non-game fish (tui chub). These were the only two species of fish captured in both reservoirs.
The gill netting information results give a relative abundance of fish for each reservoir. This information will be discussed further in the report and compared to other data captured in 2000.
Mt. View Reservoir Net 1 One net overnight 2 rainbow 11 tui chub Sheep Creek Reservoir One net overnight – 17 rainbow trout 6 tui chub Creel Survey The creel survey (Attachment 5) data collected resulted in the following catch-per-unit-effort (CPUE) information. Approximately 440+ hours of creel data were collected in 2000. This is compared with only 80+ hours of creel survey collected in 1999. The creel survey information is important in determining how many people are fishing and for how long. The information gathered is for catch data only. Many of the fishermen (especially at Sheep Creek) are catch and release fishermen. Therefore the data presented is not necessarily fish kept, only fish caught. The data collected resulted in the following CPUE information. 8

CPUE 1999 2000 Mt. View Reservoir CPUE 0.60 CPUE 1.29 Sheep Creek Reservoir CPUE 0.72 CPUE 3.84
9
DISCUSSION Fish Stocking The fish stocking was very successful in 2000. Each load of fish arrived in excellent condition with <1% mortality. All fish appeared healthy and with little or no outward signs of disease or trauma. The fish were evenly distributed between Mt. View and Sheep Creek Reservoirs. Fish were stocked in October 2000 and again in the spring season with approximately four loads of catchable size fish and five loads of fingerling size fish being delivered in the spring and one load of fish being delivered in early spring 2001.
In 2000 fish were evaluated once through the use of gill netting in order to determine size and health of fish. The trout captured ranged in size from 10” to 19” in length. These fish are likely a combination of the catchable trout stocked in spring of 1999 and holdover fish from 1997 and 1998 stocking. Also, during many creel surveys we discovered wild fish in the creel. These fish had all fins in place and were of better color and size than the stocked fish. Natural reproduction has been observed in two creeks that drain into Sheep Creek Reservoir as well as one that enters Mt. View Reservoir. This is a very encouraging sign especially considering that Burge and Miller (1990) stated that there was no natural reproduction occurring in the reservoirs. We have initiated redd counts in 1999 and continued them in 2000. Redd counts were taken on Sheep Creek and Lambs reservoir drain. This information will be obtained through visual surveys of redds and through snorkel surveys to estimate juvenile survival and reproductive success of the spawning trout. Redds were observed in Little Sheep Creek, however low water during the summer of 2000 made it difficult to determine if these fish made it to swim-up or dried up before they made it into the reservoir. No fry were observed in the lower portions of this creek, though more sampling will occur in the fall to determine the survival of these redds.
Sheep Creek reservoirs maintained a full pool for the majority of the year (90% of the year). This aided the trout to better survive the warm summer months and to some degree helped control the weed population in the Reservoirs. Mt. View Reservoir was well below full-pool for most of the summer and as cited early in this report we experienced a fish kill of about 300-500 trout during the winter/early spring of 2001. Data from under ice sampling during the winter of 2001 alerted us that this might be a possibility. It is highly recommended to keep both reservoirs at full pool for as long as possible throughout the year. In doing this it should help to alleviate some of the aquatic vegetation that is sometimes a nuisance to fishermen. Also, in keeping the water levels high it will aid in keeping water temperatures cooler and oxygen levels higher. Once the ice arrives on these reservoirs, the aquatic vegetation begins to die, and in the process uses up a lot of Oxygen during the process. If the reservoirs water level is low when this occurs, fish that are in the shallow portions of the lake will die, as occurred in winter 2001.
10
Two problems encountered with the stocking program in 1998, were somewhat eliminated or controlled in 1999, and have decreased more in 2000, they were avian predation and over fishing. To what extent these problems resulted in fish mortality is unknown at this time. The avian predation problem is apparent by watching the numerous birds after a load of fish is placed in the reservoir. Numerous American white pelicans (Pelecanus erythrorhynchos), great blue herons (Ardea herodias), and other waterfowl and shorebirds, flock to the area and begin

feeding. This predation is documented through photographs and through in-house memorandums. No estimates of the number of fish eaten has been done, nor has any stomach samples of these birds been taken. The problem seemed to be less in 2000 as we stocked earlier in the spring and later in the fall after many of the migratory birds had left or not arrived. Some changes we made to the program were we stocked in early spring before many of the migratory birds arrived, and we also stocked less numbers of fingerlings than in 1998. This seemed to lessen the numbers of predatory birds at the time of stocking. The stocking will be continually monitored to see if our hypothesis is correct on stocking times and sizes.
The problem of over fishing in 1998 is related to individuals who take over the 5-fish per day limit at the reservoirs. No persons have ever been arrested or cited for this reason, however many reports have come into the fish and game office describing some of the infractions. To solve this problem our department proposed to increase game warden coverage at the reservoirs. Increased coverage and posting of fishing regulations has aided in keeping people from taking more than the regulated limit of five fish per person per day. The new regulations, increased creel surveys, and increased coverage have seemed to help this problem. Fewer reports of illegal fishing and take have come to our offices. As the data shows, a more intensive creel survey in 2000 has helped with the reports of overfishing. Again, we will monitor this throughout the life of the project.
Biological From the data collected in 2000 both Mt. View and Sheep Creek Reservoir seem suited for trout survival. Mt. View Reservoir with a maximum depth of approximately 18 feet with summer time (6-28-00) water temperatures from a high of 22 degrees C at the surface to 18 degrees C at the bottom. The dissolved oxygen levels range from over 10 near the surface to a low of 1.5 near the bottom in one location. These temperatures and oxygen levels are more than suitable for trout survival. However, at the lower depths the Oxygen levels are much lower than observed in 1999. These levels may have resulted in the fish kill in early spring 2001. Water levels of the reservoir were well below what we had hoped, most likely due to the irrigation of the Tribal farm land. Attempts were made to put more water in the reservoir but we were not successful in filling the reservoir before it iced over in winter of 2000. Changes to the stocking of Mt. View for 2001 will likely occur if we cannot be guaranteed sufficient water during 2001.
Sheep Creek Reservoir with a maximum depth of approximately 26 feet has water temperatures from 21 degrees C at/near the surface to 16 degrees at/near the bottom. The oxygen levels taken in late June 2000 ranged from 9.9ppm near the surface to 3.6ppm near the bottom. These levels are a suitable for trout survival. The Oxygen levels recorded in 2000 are better than those in 1999. The water temperatures are somewhat warmer than in 1999. This is likely due to the time of year that sampling took place. These levels are within the range for trout and we believe there is no problem or cause for alarm, continued monitoring will be done.
Dissolved oxygen, temperature, and other biological factors will be checked in other reservoirs in 2001 to determine if it is feasible to stock fish in other closed systems on the Duck Valley Indian Reservation. If this is possible, it may help relieve some fishing pressure in the Owyhee River, Mt. View and Sheep Creek reservoirs.
11

Gill Netting Gill netting was completed in early spring 200l. This work help to give an estimate of how well are fish are surviving and what their health is. Also, this helps us get an idea of the age classes of fish in both reservoirs. From work completed in 1999 and 2000 we determined that the fish in Sheep Creek reservoir are healthy and average from ¾ lb. to 2 lb. In Mt. View reservoir the fish average approximately 1.4 lb. (from creel surveys) and also are very healthy. The main diet of the fish (from stomach samples) seem to consist of mostly snails, zooplankton, and small fish. With snails being the main diet, then zooplankton and small fish also included in their diet.
Creel Survey The 2000 creel survey numbers were encouraging compared to 1999. The CPUE for both reservoirs is very respectable and in the creel we discovered fish as big as 9 lbs being taken out of Sheep Creek Reservoir in early spring of 2001, with a 7.4 lb. fish being caught at Mt. View Reservoir. A new creel survey form was utilized in 2000 in order to more accurately determine the CPUE as well as locations of visitors and Tribal member fishing effort.
Our data for 2000 shows Mt. View with 1.29 fish/hr (an increase from 1998, .54/hr, 00 at 0.60 fish/hour), and Sheep Creek with 3.84 fish/hr (an increase from 1998 .74/hr and 00 0.72/hour). As the data shows, Sheep Creek Reservoir has improved in fishing quality since 1982, and Mt. View has increased.
There is also creel data that does not have a reservoir name listed on the sheet. In talking with staff that took creel surveys, those sheets are visitors that fished both reservoirs during the same day. That data shows a CPUE of 1.45 fish/hour.
A total of 440+ hours of creel data were collected in just 5 months of collection. In 2001 we hope to collect creel data year round. Of the 440+ hours of data, 819 fish were collected for a total CPUE of 1.86 fish/hour for both Mt. View and Sheep Creek Reservoirs combined.
12

13
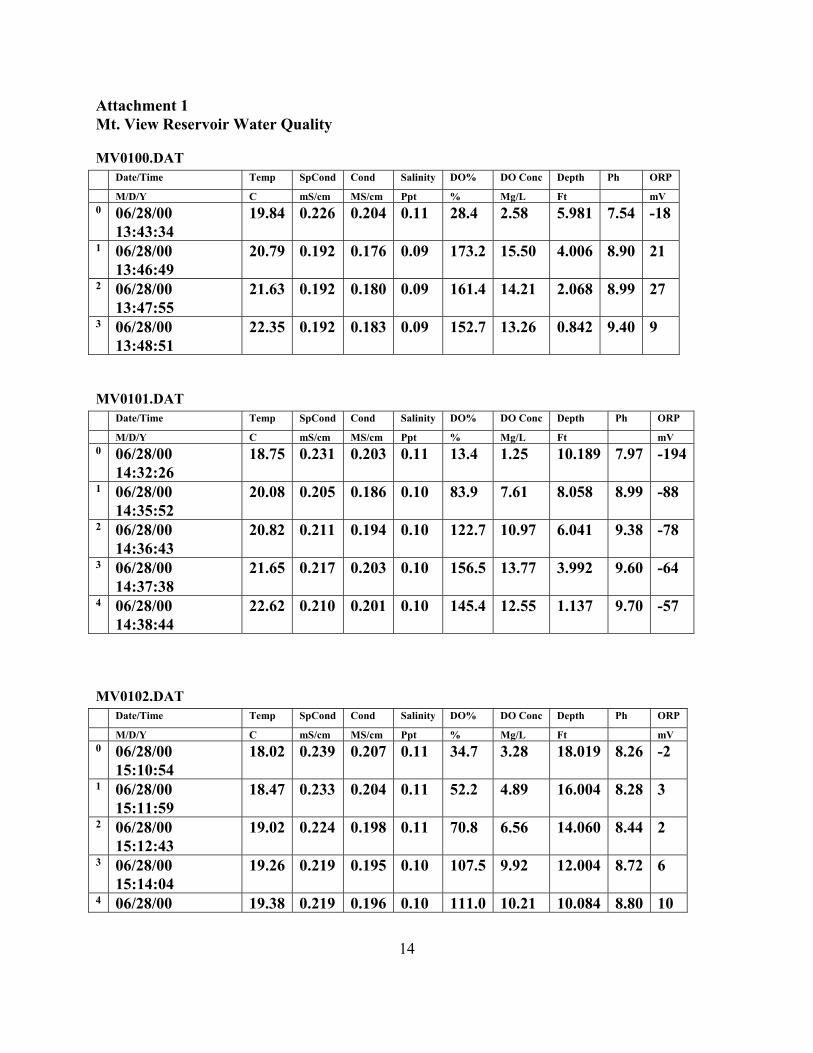
Attachment 1 Mt. View Reservoir Water Quality
MV0100.DAT Date/Time Temp SpCond Cond Salinity DO% DO Conc Depth Ph ORP
M/D/Y C mS/cm MS/cm Ppt % Mg/L Ft mV 0 06/28/00
13:43:34 19.84 0.226 0.204 0.11 28.4 2.58 5.981 7.54 -18
1 06/28/00 13:46:49
20.79 0.192 0.176 0.09 173.2 15.50 4.006 8.90 21
2 06/28/00 13:47:55
21.63 0.192 0.180 0.09 161.4 14.21 2.068 8.99 27
3 06/28/00 13:48:51
22.35 0.192 0.183 0.09 152.7 13.26 0.842 9.40 9
MV0101.DAT Date/Time Temp SpCond Cond Salinity DO% DO Conc Depth Ph ORP
M/D/Y C mS/cm MS/cm Ppt % Mg/L Ft mV 0 06/28/00
14:32:26 18.75 0.231 0.203 0.11 13.4 1.25 10.189 7.97 -194
1 06/28/00 14:35:52
20.08 0.205 0.186 0.10 83.9 7.61 8.058 8.99 -88
2 06/28/00 14:36:43
20.82 0.211 0.194 0.10 122.7 10.97 6.041 9.38 -78
3 06/28/00 14:37:38
21.65 0.217 0.203 0.10 156.5 13.77 3.992 9.60 -64
4 06/28/00 14:38:44
22.62 0.210 0.201 0.10 145.4 12.55 1.137 9.70 -57
MV0102.DAT Date/Time Temp SpCond Cond Salinity DO% DO Conc Depth Ph ORP
M/D/Y C mS/cm MS/cm Ppt % Mg/L Ft mV 0 06/28/00
15:10:54 18.02 0.239 0.207 0.11 34.7 3.28 18.019 8.26 -2
1 06/28/00 15:11:59
18.47 0.233 0.204 0.11 52.2 4.89 16.004 8.28 3
2 06/28/00 15:12:43
19.02 0.224 0.198 0.11 70.8 6.56 14.060 8.44 2
3 06/28/00 15:14:04
19.26 0.219 0.195 0.10 107.5 9.92 12.004 8.72 6
4 06/28/00 19.38 0.219 0.196 0.10 111.0 10.21 10.084 8.80 10
14

15:15:03 5 06/28/00
15:15:59 19.56 0.220 0.197 0.10 111.7 10.24 8.087 8.83 13
6 06/28/00 15:17:11
19.80 0.219 0.197 0.10 114.9 10.48 6.049 8.91 15
7 06/28/00 15:17:57
20.03 0.219 0.198 0.10 114.8 10.42 4.075 8.94 15
8 06/28/00 15:18:43
20.31 0.218 0.198 0.10 116.1 10.49 2.053 8.99 15
9 06/28/00 15:19:27
20.88 0.219 0.202 0.10 115.5 10.32 1.140 8.99 17
15

Attachment II Sheep Creek Water Quality
SC0100.DAT Date/Time Temp SpCond Cond Salinity DO% DO Conc Depth Ph ORP
M/D/Y C mS/cm MS/cm Ppt % Mg/L Ft mV 0 06/28/00
10:38:42 17.95 0.175 0.152 0.08 38.1 3.61 14.822 7.13 208
1 06/28/00 10:40:35
18.52 0.173 0.152 0.08 44.0 4.12 13.052 7.14 200
2 06/28/00 10:41:38
19.41 0.169 0.151 0.08 81.5 7.49 11.053 7.52 178
3 06/28/00 10:43:21
19.60 0.170 0.152 0.08 92.0 8.43 9.089 7.88 167
4 06/28/00 10:44:39
19.74 0.170 0.153 0.08 93.3 8.52 7.027 8.06 160
5 06/28/00 10:46:03
19.82 0.170 0.153 0.08 94.2 8.60 5.006 8.21 154
6 06/28/00 10:47:10
19.94 0.170 0.153 0.08 96.6 8.79 3.064 8.31 149
7 06/28/00 10:48:05
21.21 0.171 0.158 0.08 103.1 9.15 0.979 8.43 145
SC0101.DAT Date/Time Temp SpCond Cond Salinity DO% DO Conc Depth Ph ORP
M/D/Y C mS/cm MS/cm Ppt % Mg/L Ft mV 0 06/28/00
11:17:38 18.23 0.163 0.142 0.08 81.0 7.63 5.268 8.58 119
1 06/28/00 11:18:52
18.43 0.153 0.133 0.07 100.0 9.38 3.042 8.39 133
2 06/28/00 11:19:40
19.19 0.152 0.135 0.07 107.4 9.92 0.651 8.48 134
3
SC0102.DAT Date/Time Temp SpCond Cond Salinity DO% DO Conc Depth Ph ORP
M/D/Y C mS/cm MS/cm Ppt % Mg/L Ft mV 0 06/28/00
11:57:11 16.50 0.183 0.154 0.09 32.4 3.16 18.760 7.47 102
1 06/28/00 11:59:08
17.12 0.179 0.152 0.08 32.5 3.14 17.097 7.39 107
16

2 06/28/00 11:59:54
17.47 0.177 0.152 0.08 38.7 3.70 15.045 7.42 97
3 06/28/00 12:01:55
18.60 0.173 0.152 0.08 59.7 5.58 13.086 7.59 89
4 06/28/00 12:03:43
19.50 0.170 0.152 0.08 84.0 7.71 11.046 7.94 79
5 06/28/00 12:05:04
19.77 0.170 0.153 0.08 93.1 8.50 9.039 8.22 69
6 06/28/00 12:06:57
19.80 0.170 0.153 0.08 94.0 8.58 7.057 8.43 63
7 06/28/00 12:08:39
20.60 0.171 0.157 0.08 98.5 8.85 5.003 8.60 59
8 06/28/00 12:10:02
21.03 0.171 0.158 0.08 103.3 9.20 3.008 8.73 55
9 06/28/00 12:12:21
21.83 0.171 0.161 0.08 105.8 9+.28 1.284 8.92 49
Attachment 3 Creel Survey Form
Duck Valley Indian Reservation Creel Survey Form
Date : ______________ Mtn View Sheep Creek
Number in Party ______ Tribal Member Boat / Shore Yes No Fishermen from Where?______________________ Length of stay at Duck Valley__________________ Have fishermen been to Duck Valley before?
Yes No Time started fishing Time ended fishing
_______ _______ Done fishing for the day? Yes No ____ # Trout caught Sizes of fish kept ____ # Trout kept ___________ 17

Fishermen’s preference? To catch a lot of fish
A few large fish
Fishermen’s overall rating of fishing trip to Duck Valley?
Poor Fair Good Very Good Excellent
Other comments:
18