Dual-Thrust Rocket Motor with an intermediate Nozzle at ... · if the propellant characteristics...
15
Paper: ASAT-16-040-PP 16 th International Conference on AEROSPACE SCIENCES & AVIATION TECHNOLOGY, ASAT - 16 – May 26 - 28, 2015, E-Mail: [email protected] Military Technical College, Kobry Elkobbah, Cairo, Egypt Tel : +(202) 24025292 – 24036138, Fax: +(202) 22621908 1 Egyptian Armed Forces, [email protected] 2 Modern Academy at Maadi, Cairo, Egypt. 3 Egyptian Armed Forces. Dual-Thrust Rocket Motor with an intermediate Nozzle at the condition of higher boosting pressure than the sustaining pressure Amr M. El-Nady 1 Ahmed M. Sarhan 2 Mohamed A. Al-Sanabawy 3 and Mahmoud Y. Mohamed 3 Abstract: Boost-sustain solid propellant rocket motors have been used to meet the demand for short and medium range tactical missiles. These motors obtain a wide variety of thrust-time profiles if the propellant characteristics and grain geometry are properly selected. These Dual Thrust Rocket Motors (DTRM) can have various designs; the DTRM with an intermediate nozzle is one design that yields a high boost-sustain thrust ratio with a stable operation. Under certain conditions, the flow through the intermediate nozzle at the start of motor operation can be reversed. The present paper is intended to understand the phenomena and determine the operating parameters of DTRM with the reverse flow intermediate nozzle. In this study, a mathematical model describing the performance is derived from the main governing equations of internal ballistics (IB). Also, a set of experiments are conducted so as to inspect the details of the physics of such configuration DTRM. The experimental findings are utilized to validate the mathematical model. Results of the theoretical and experimental investigation explain most of the IB characteristics that were not discussed before in the open literature. Keywords: Internal Ballistics, Solid Propulsion, Dual Thrust Rocket Motor, Test Rocket Motor. 1. Introduction: Compared with other rocket propulsion systems, solid propellant rocket motors (SPRM) are easier to manufacture, handle and store, and lighter in weight. In addition, SPRMs do not require maintenance for their entire shelf life and they contain less components so their reliability is higher. All these advantages make them superior to all other propulsion systems for various military applications. Traditional designs of SPRM yield a monotonic thrust-time profile namely, either progressive, regressive, or neutral [1]. However, if the motor design, propellant characteristics, and grain geometry are properly selected, SPRM can provide a wide variety of thrust-time profiles. Dual (high-low or boost-sustain) thrust profiles have been developed to meet the demands for anti-tank guided missiles. DTRMs can have various designs; each of which has a range of operation depending on the resulting thrust ratio (boost-to-sustain thrust ratio) [2]. DTRM with an intermediate nozzle is a special design that is argued to yield a high thrust ratio with a stable operation. As shown in Fig. 1, DTRM consists of two chambers containing solid propellant grains separated by an intermediate nozzle and final main external nozzle.
Transcript of Dual-Thrust Rocket Motor with an intermediate Nozzle at ... · if the propellant characteristics...
Paper: ASAT-16-040-PP
16th
International Conference on
AEROSPACE SCIENCES & AVIATION TECHNOLOGY,
ASAT - 16 – May 26 - 28, 2015, E-Mail: [email protected]
Military Technical College, Kobry Elkobbah, Cairo, Egypt
Tel : +(202) 24025292 – 24036138, Fax: +(202) 22621908
1 Egyptian Armed Forces, [email protected]
2 Modern Academy at Maadi, Cairo, Egypt.
3 Egyptian Armed Forces.
Dual-Thrust Rocket Motor with an intermediate Nozzle at the
condition of higher boosting pressure than the sustaining pressure
Amr M. El-Nady1 Ahmed M. Sarhan
2 Mohamed A. Al-Sanabawy
3
and
Mahmoud Y. Mohamed 3
Abstract:
Boost-sustain solid propellant rocket motors have been used to meet the demand for short
and medium range tactical missiles. These motors obtain a wide variety of thrust-time profiles
if the propellant characteristics and grain geometry are properly selected. These Dual Thrust
Rocket Motors (DTRM) can have various designs; the DTRM with an intermediate nozzle is
one design that yields a high boost-sustain thrust ratio with a stable operation. Under certain
conditions, the flow through the intermediate nozzle at the start of motor operation can be
reversed.
The present paper is intended to understand the phenomena and determine the operating
parameters of DTRM with the reverse flow intermediate nozzle. In this study, a mathematical
model describing the performance is derived from the main governing equations of internal
ballistics (IB). Also, a set of experiments are conducted so as to inspect the details of the
physics of such configuration DTRM. The experimental findings are utilized to validate the
mathematical model.
Results of the theoretical and experimental investigation explain most of the IB
characteristics that were not discussed before in the open literature.
Keywords: Internal Ballistics, Solid Propulsion, Dual Thrust Rocket Motor, Test Rocket
Motor.
1. Introduction:
Compared with other rocket propulsion systems, solid propellant rocket motors (SPRM)
are easier to manufacture, handle and store, and lighter in weight. In addition, SPRMs do not
require maintenance for their entire shelf life and they contain less components so their
reliability is higher. All these advantages make them superior to all other propulsion systems
for various military applications.
Traditional designs of SPRM yield a monotonic thrust-time profile namely, either
progressive, regressive, or neutral [1]. However, if the motor design, propellant
characteristics, and grain geometry are properly selected, SPRM can provide a wide variety of
thrust-time profiles. Dual (high-low or boost-sustain) thrust profiles have been developed to
meet the demands for anti-tank guided missiles. DTRMs can have various designs; each of
which has a range of operation depending on the resulting thrust ratio (boost-to-sustain thrust
ratio) [2].
DTRM with an intermediate nozzle is a special design that is argued to yield a high thrust
ratio with a stable operation. As shown in Fig. 1, DTRM consists of two chambers containing
solid propellant grains separated by an intermediate nozzle and final main external nozzle.

Paper: ASAT-16-040-PP
Figure 1 DTRM with an intermediate nozzle.
Both of the grains are ignited simultaneously starting the boost phase. The sustain phase
follows as the booster grain burns out. During the boost (common function) phase, the
combustion gas products flow through the intermediate nozzle and eventually through the
main nozzle producing thrust. Depending on the internal flow conditions, the flow through the
intermediate nozzle can be sonic, subsonic or reversed.
To the authors’ best knowledge of the open literature, there has been no comprehensive
study that investigated the phenomena in the DTRM with an intermediate nozzle. McFillin et
al. [3] and Carrier et al. [4] focused on the internal ballistics of DTRM in the sustaining phase
only. Only Manda [5] discussed the common operation of DTRM with an intermediate
nozzle. However, the study was too concise to explain the rich details of this type of motors.
This clear shortage of knowledge was the motivation behind the present study.
The objective of this paper is to understand the internal ballistics and phenomena of
DTRM with reverse flow through the intermediate nozzle. In this study, a mathematical
model describing the performance of DTRM in concern is derived from the main governing
equations of IB. In addition, a set of experiments is conducted so as to reveal the details of the
physics of this type of DTRM in both phases and assess the mathematical model validity.
2. Theoretical Investigation:
The developed mathematical model is based on satisfying the main governing
principles of the gas thermo-fluid dynamics under the following assumptions [6]:
1. Combustion gases obey the perfect gas law.
2. Combustion gases are homogenous.
3. Steady state conditions.
4. Combustion gases flow is one dimensional, and isentropic.
5. Erosive burning and nozzle erosion are ignored.
6. Boosting and sustaining grains are made of the same propellant.
During the common function (boost phase), the pressure ( ) is initially lower than the
pressure ( ) inducing a reverse gas flow occurs from the boosting chamber to the
sustaining one through the intermediate nozzle where the pressure ratio obeys the following
inequality:
( ) (1)
By time, the pressure ( ) increases causing a reverse flow to diminish and eventually
stops. In this case, It can be assumed that the sustaining pressure ( ) is equal to the boosting
pressure ( ) at this moment. Practically, it means that the intermediate nozzle is ineffective
and we deal with the SPRM as if it were a one chamber containing two propellant charges
Paper: ASAT-16-040-PP
with different geometry common in the main outer nozzle. The pressure can be calculated
under the following condition:
(
) (2)
where and are the throat area of the main and intermediate nozzle, respectively.
and are the burning surface areas of the boosting and sustaining grain, respectively. In this
case, the pressure can be calculated directly from the following equation:
(3)
where is the blocking factor in both boosting and sustaining chamber. and , are the
propellant density and characteristic velocity, respectively. and are the burning rate
constant and pressure exponent, respectively.
On the other hand, during the sustaining phase, the pressures in both boosting and
sustaining chambers; and ,respectively, can be simply calculated using the following
relations:
(4)
(5)
Equations (3), (4) and (5) are used to estimate the combustion gas pressures in both
boosting and sustaining chambers during both boost and sustain phases.
Finally, the thrust ( ) in both phases can be determined utilizing the following
relation:
(6)
where is function of specific heat ratio , is the main nozzle exit area, and are the
total and exit pressures of the combustion gases, respectively, and is the atmospheric
pressure.
3. Experimental Investigation:
The objective of this experimental investigation is twofold. On the one hand, to
comprehend the physics of internal ballistics taking place in a real DTRM. On the other hand,
results of experiments are implemented to assess the validity of the developed mathematical
model. For the latter objective, more than four experimental tests have been conducted for the
operation of DTRM with reverse flow intermediate nozzle. The burning law for the selected
propellant has been predicted based on experimental measurements and thermochemical
calculations.

Paper: ASAT-16-040-PP
3.1 Characteristics and burning law of the used propellant:
A Double-Base (DB) solid propellant is utilized in the experiments. The burning law
of the used propellant was determined experimentally using a standard static firing test motor
and was eventually found to have the form:
(8)
where [ºC] is the propellant temperature, [Pa] is the pressure of the combustion gases,
and [m/s] is the burning rate.
3.2 The proposed test rocket motor:
In the literature and in practice, there exist well-defined standard test motors for
conventional, single thrust solid propulsion applications. However, as far as dual-thrust
applications are concerned, there exist no specific definitions for a standard test motor in the
open literature. This motivated the authors to develop a proposed test rocket motor TRM for
applications involving DTRM with intermediate nozzle.
The preliminary design for this proposed TRM should include 4 main blocks which
are the sustaining chamber, the intermediate nozzle, the boosting chamber, and the main
nozzle.
To reach the final detailed design of the TRM, in addition to technical and practical
considerations, a number of constraints has been specified:
1. Utilizing available on-shelf raw materials,
2. Satisfying maximum and minimum operating pressures,
3. Satisfying the reverse flow through the intermediate nozzle.
4. Providing neutral thrust in both boost and sustain phases.
The detailed design of the TRM is obtained as shown in Fig. 2. The boosting charge is
made as tubular grain inhibited from the ends whereas the sustaining charge is a cigarette
burning grain. Motor ignition is undertaken using one igniter placed in the sustaining chamber
(upstream of the intermediate nozzle). A secondary igniter charge is placed downstream of the
intermediate nozzle to insure ignition of the boosting grain.
Figure 2 Design drawing of TRM

Paper: ASAT-16-040-PP
3.3 Design of static firing tests:
Horizontal test stand along with a set of measuring instruments were used in
examining the TRM. The main function of this test facility is to measure the main loads
acting on the TRM which are the internal pressure and the axial thrust force.
Four different main static firing tests were planned. Prior to performing these main
tests, two preliminary static firing tests were conducted namely, a function static test and a
sustaining static test. All these six tests were conducted in the same nominal environmental
conditions namely, temperature of 20ºC and pressure of 1 bar. Description and objective of
each of the six tests are summarized in Table, 1.
Table 1 Plan of static firing tests
Test No. Description Objectives
Function static test 1
TRM fully equipped with
propellant charges without
measurement of any internal
ballistic parameters
To verify the safe operation
and that the TRM will
withstand the ballistics,
structural and thermal
stresses
Sustaining static test 1
TRM containing sustaining
grain only while the boosting
chamber is empty. All sensors
are connected and are
functioning during the test
To verify the propellant
internal ballistic parameters.
To check safety and
measurement possibilities.
Main static tests 2
TRM fully equipped with
propellant charges. All sensors
are connected and are
functioning during the test. The
test is repeated to assess the
measurements
To validate the theoretical
model condition ( ) where strong reverse
flow is expected.
Modified static tests 2
Minor modifications to the
grains and nozzles dimensions
of the basic test of the sonic
case.
To demonstrate the upper
limit of the TRM operation
by making the pressure in
the sustaining chamber
slightly lower than and
almost equal to the pressure
in the boosting chamber.
4. Results and Discussions:
4.1 Sustaining phase static test:
The results (pressures and thrust time curves) of the sustaining static test case are
presented in figures 3 and 4, respectively.
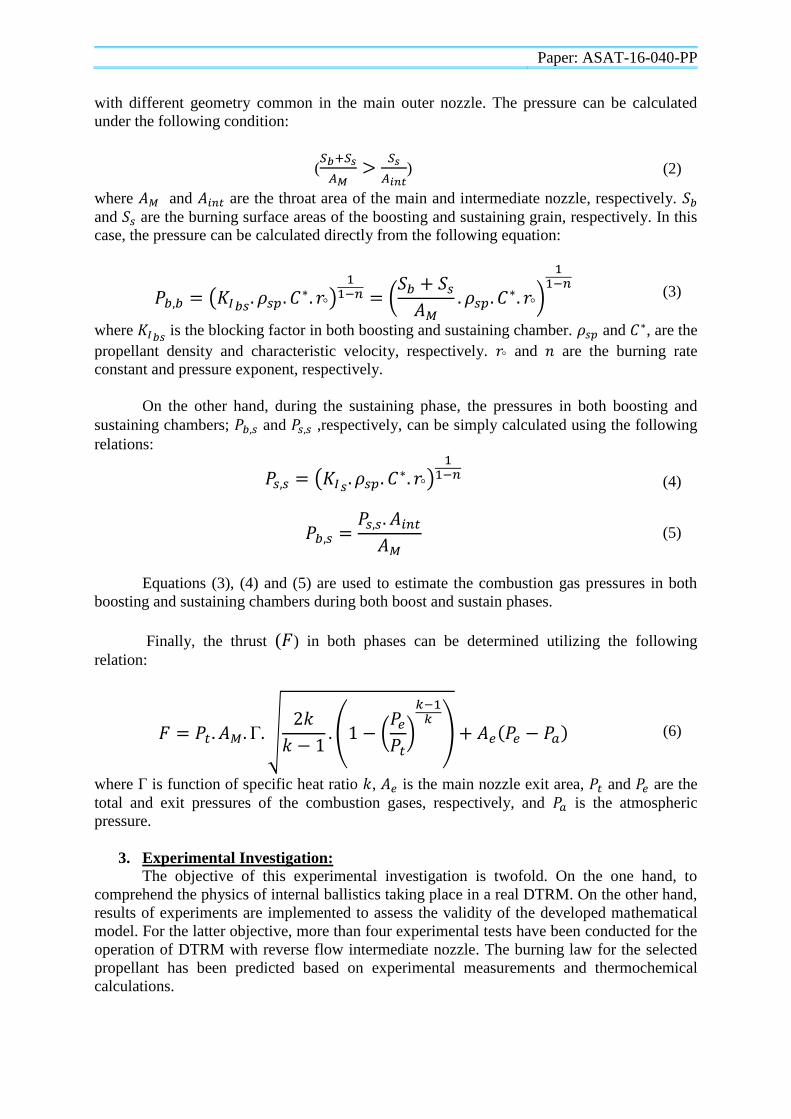
In fig. 3, the sharp pressure rise at the start of motor operation is caused by the ignition
charge located in the sustaining chamber reaching a value of about 226 bar. The gases
produced by sustaining grain in the ignition phase expand through the intermediate nozzle to a
much lower value of about 31 bar that is sensed in the boosting chamber with time lag of
about 0.035 seconds. After ignition phase, the sustaining grain starts burning yielding a
combustion pressure of about 103 bar (similar to theoretical approach) that is reduced via
expansion to about 21 bar in the boosting chamber (less than the theoretical approach). The
sustaining chamber pressure increases gradually to a value of about 116 bar at 1.3 seconds of
the motor function time and drops gradually afterwards until it reaches a value of about 68
Paper: ASAT-16-040-PP
bar. The tail-off phase of the pressure-time curves starts at about 2.8 seconds taking
approximately 0.3 seconds.
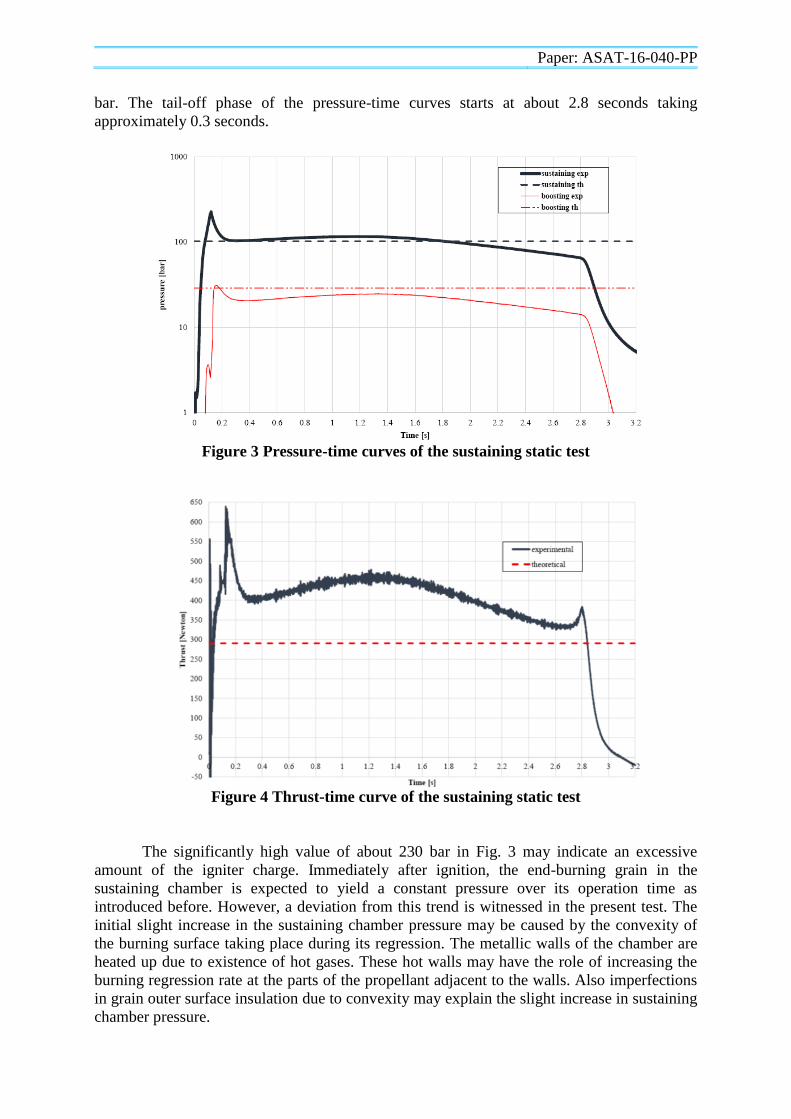
Figure 3 Pressure-time curves of the sustaining static test
Figure 4 Thrust-time curve of the sustaining static test
The significantly high value of about 230 bar in Fig. 3 may indicate an excessive
amount of the igniter charge. Immediately after ignition, the end-burning grain in the
sustaining chamber is expected to yield a constant pressure over its operation time as
introduced before. However, a deviation from this trend is witnessed in the present test. The
initial slight increase in the sustaining chamber pressure may be caused by the convexity of
the burning surface taking place during its regression. The metallic walls of the chamber are
heated up due to existence of hot gases. These hot walls may have the role of increasing the
burning regression rate at the parts of the propellant adjacent to the walls. Also imperfections
in grain outer surface insulation due to convexity may explain the slight increase in sustaining
chamber pressure.

Paper: ASAT-16-040-PP
On the other hand, as the grain surface burns back, the free volume inside the chamber
increases, the chamber pressure tends to decrease, and the burning rate drop down. The
convexity of the burning surface is assumed to yield a zone of sliver which increases the free
volume and reduces the actual burning surface. The combined effect of these factors may
explain the gradual but significant drop (about 48 bar) in the sustaining chamber pressure
towards the burnout of the grain.
Immediately after burnout, the accumulated gases exit the sustaining chamber causing
the sharp drop in the chamber pressure. The intermediate nozzle has the continuing role of
throttling the exhaust gases into the boosting chamber where they expand to a much lower
pressure. The time lag of about 0.035 seconds can be addressed throughout the motor
operation time.
Comparing the approaches (experimental and theoretical) in Fig. 3, it can be seen that
the average experimental sustaining chamber pressure almost coincides with the theoretical
one while the experimental boosting chamber pressure is always less than the theoretical one.
This may be owed to three factors. On the one hand, the losses in the TRM are not accounted
for in the underlying isentropic assumptions of the theoretical model. This isentropic
assumption leads to shorter burning times for the theoretical approach than those in the
experimental one. On the other hand, convexity of the surface of burning may cause the slight
increase in pressure that appears in the experimental reading. More importantly, the location
of the pressure transducer in the boosting chamber may not be the proper one to measure the
correct boosting pressure. An explanation of this aspect is attempted below.
Due to design constraint, the pressure transducer port inside the boosting chamber is
located in the shadow of the jet exiting the intermediate nozzle as shown in fig. 5. The gas
flow in the vicinity of the port may generate a vortex structure, leading to lower pressure.
Figure 5 Location of the pressure transducer in boosting chamber
In fig. 4, the thrust follows fairly the same trend of boosting chamber pressure. The
persisting rebels in thrust curve and the sudden spire at the onset of tail-off phase (at about 2.8
seconds) may all be owed to improper fixation of the TRM on the test bed. The sustaining
thrust values (average 395N) are higher than the designed theoretical ones (250:300N).
Further analysis showed that this discrepancy maybe owed to two factors.
On the one hand, the transducer that is used in the experiments with upper limit
10000N has 1000N limit for first-order measurements or 500N limit for second-order
measurements. So the designed sustaining thrust lies in the nonlinearity zone for the used
transducer. On the other hand, the fixation of the TRM on the test bed followed by the over
preloading value is the other cause for increasing the experimental sustaining thrust than the
theoretical one. Normally, the preloading value should not exceed 30% of the expected thrust
Paper: ASAT-16-040-PP
to be measured. This rule is violated due to the available fixation technique. This is more
pronounced in the sustaining phase where the maximum expected thrust is about 300N (30%
of the preloading value). The available facilities dictate using a pressurized air circuit having a
clear leakage in the circuit. To overcome this leakage, over preloading value (0.7:0.92v;
equivalent to 900N) ought to be applied.
It should be noted that, since the present experiments deal with DTRM, rules for the
presetting loads would have been violated especially during the sustaining phase in all cases.
In fact, designing a presetting technique that automatically changes the presetting load value
may be unattainable.
4.2 Main static tests:
A basic firing test is carried out for the designed TRM and is repeated to confirm and
assess the results. Dimensions of grains and nozzles are listed in Table 2, followed by the
pressure and thrust time curves for each test (figures 6 to 11). For the sake of comparison, the
corresponding theoretical results for the basic and repeated tests are plotted in these figures.
Table 2 Grains and nozzles dimensions for DTRM
Name Value
Sustaining grain (outer diameter x its length) [mm] 110 x 25
Boosting grain (outer diameter x inner diameter x its length) [mm] 63.6 x 24.6 x 136
Main nozzle (throat diameter x exit diameter) [mm] 9.37 x 20
Intermediate nozzle (throat diameter) [mm] 4.98
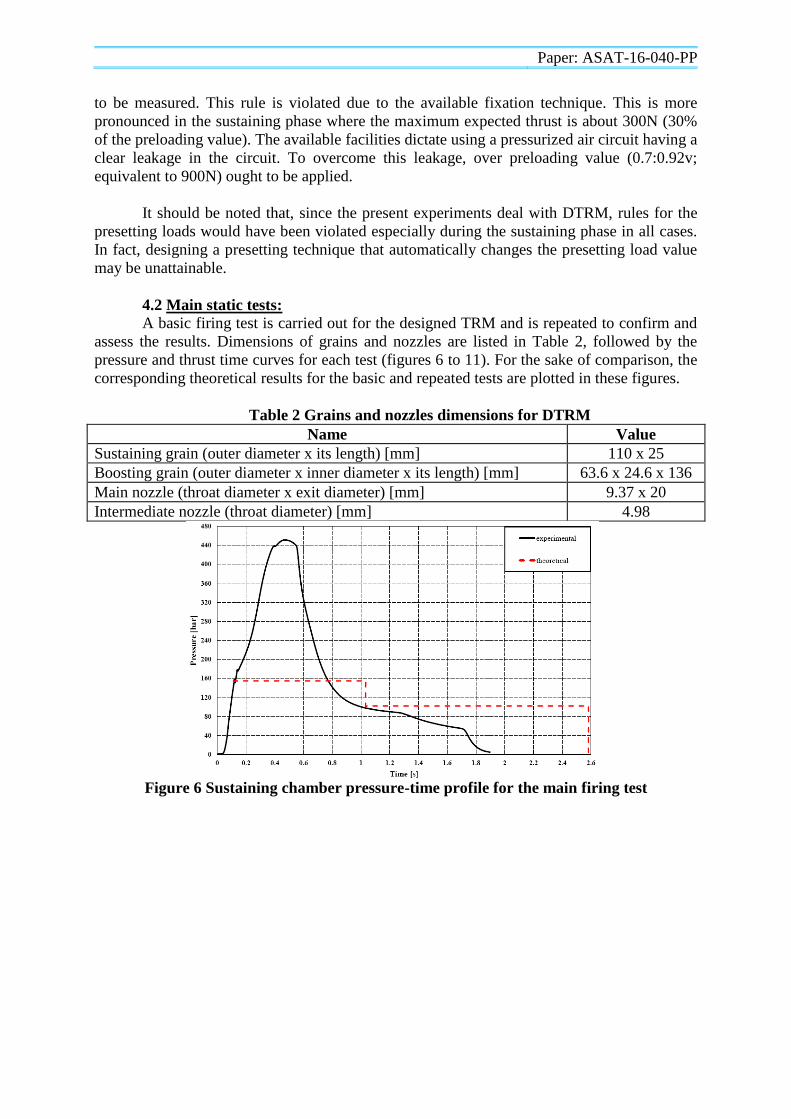
Figure 6 Sustaining chamber pressure-time profile for the main firing test
Paper: ASAT-16-040-PP
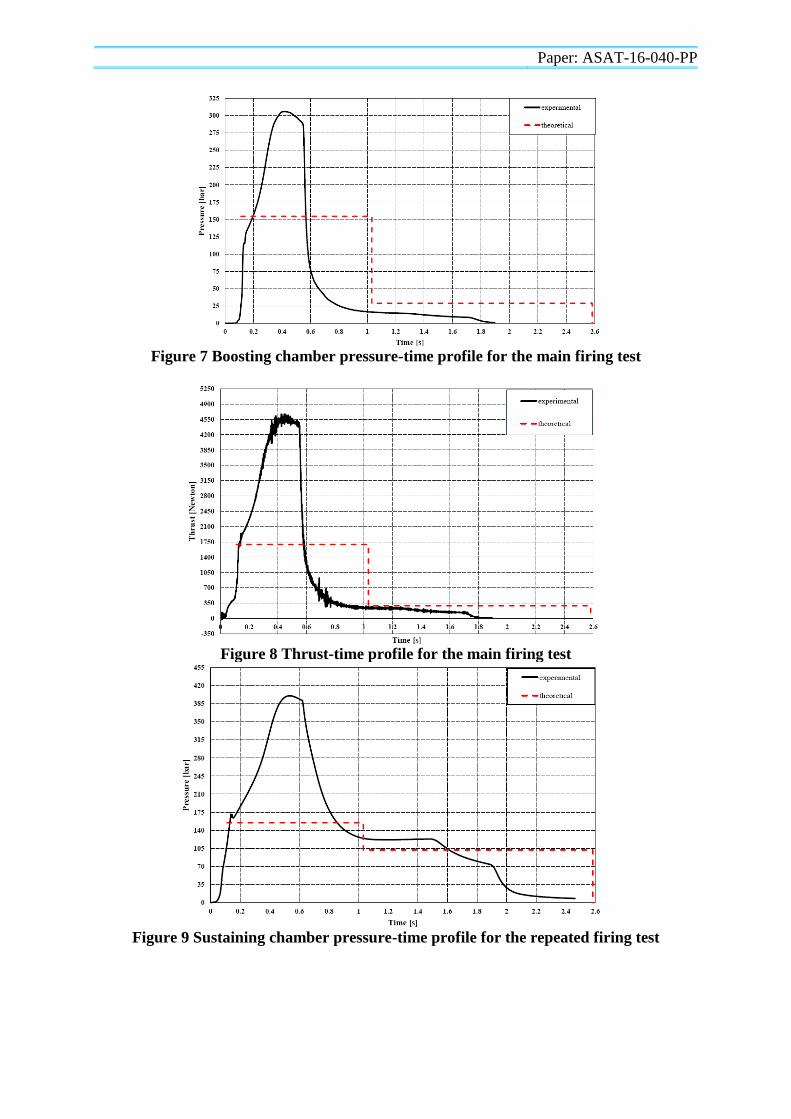
Figure 7 Boosting chamber pressure-time profile for the main firing test
Figure 8 Thrust-time profile for the main firing test
Figure 9 Sustaining chamber pressure-time profile for the repeated firing test

Paper: ASAT-16-040-PP
Figure 10 Boosting chamber pressure-time profile for the repeated firing test
Figure 11 Thrust-time profile for the repeated firing test
Pressure-time curves of the sustaining chamber from the experiment and the
corresponding theoretical prediction are shown in Fig. 6. The theoretical curve appears
constant at operating pressure 154.5 bar taking a time of operation of about 1.03 seconds then
sharply fall down to 102 bar of a constant operating pressure during the sustaining phase
which terminates at 2.58 seconds. In contrast, the experimental curve ascends sharply in
approximately 0.1 seconds during the ignition phase. The boosting phase starts operating at
150 bar that increases sharply to about 450 bar and lasts for nearly 0.7 seconds operating time
then the sustaining phase operates at approximately average pressure of 82 bar till the
propellant burnout at 1.7 seconds operating time. Looking at the tail-off phase, the measured
pressure decreases sharply in about 0.12 seconds as the propellant grain is burned out.
Figure 7 shows the pressure-time curves of the boosting chamber for the experimental
measurement and theoretical prediction. The theoretical curve starts with a constant operating
pressure 154.5 bar taking 1.03 seconds operating time during the boosting phase then sharply
falls down to 28.85 bar of a constant operating pressure during the sustaining phase which
terminates at 2.58 seconds. In the experimental reading, the boosting phase starts operating at
116 bar that increases sharply to about 306 bar and lasts for nearly 0.6 seconds operating time
Paper: ASAT-16-040-PP
then the sustaining phase operates at a nearly constant pressure of 15.5 bar till the propellant
burnout at 1.82 seconds operating time.
Finally, the theoretical and experimental thrust-time curves are shown in Fig. 8. The
theoretical thrust-time curve appears constant at 1692.8 N during the boosting phase time of
1.03 seconds. In the sustaining phase, the thrust falls down to 290.4 N and terminates after
2.58 second. In the boosting phase of the experiment, the thrust increases sharply from 1750
N to about 4500 N for 0.6 seconds while the sustaining phase produces 250 N thrust for 1.15
seconds of operating time. Figures 10 to 12 have the same trend similar to figures 7 to 9
respectively.
The sharp and high increase of the pressure in the sustaining chamber is due to the
reverse flow of the combustion gases from the boosting chamber to the sustaining chamber
which was not accounted for in the theoretical model calculations. To improve the
experimental values due to the reverse flow in the intermediate nozzle, another two modified
tests are conducted, the first modified test is designed where the pressure ( ) in the
sustaining chamber is slightly less than the pressure ( ) in the boosting chamber. The
second modified one is designed where the pressure ( ) in the sustaining chamber is
approximately equal the pressure ( ) in the boosting chamber. This is achieved with some
modifications to the grains and nozzles dimensions of the basic test. The length of the
boosting grain is decreased and the critical diameter of the main and intermediate nozzles are
slightly increased such that the condition in equation (1) is still valid. Grains and nozzles
dimensions for the modified cases are listed in tables 3 and 4 for the first and second modified
tests respectively. The pressure and thrust time curves for TRM are presented in figures 13 to
15 for the first modified test and figures 16 to 18 for the second one.
Table 3 Grains and nozzles dimensions for the first modified DTRM
Name Value
Sustaining grain (outer diameter x its length) [mm] 110 x 25
Boosting grain (outer diameter x inner diameter x its length) [mm] 63.6 x 24.6 x 101
Main nozzle (throat diameter x exit diameter) [mm] 9.7 x 20
Intermediate nozzle (throat diameter) [mm] 5.7
Table 4 Grains and nozzles dimensions for the second modified DTRM
Name Value
Sustaining grain (outer diameter x its length) [mm] 110 x 25
Boosting grain (outer diameter x inner diameter x its length) [mm] 63.6 x 24.6 x 101
Main nozzle (throat diameter x exit diameter) [mm] 9.8 x 20
Intermediate nozzle (throat diameter) [mm] 5.7
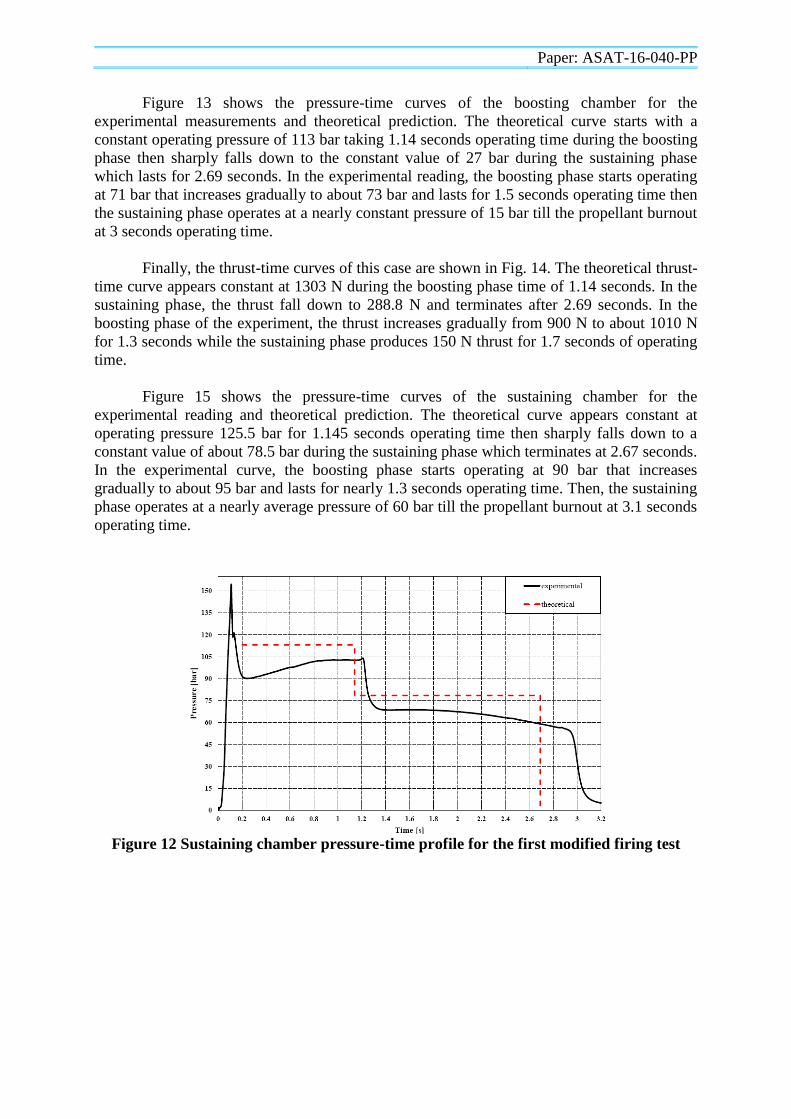
Figure 12 shows the pressure-time curves of the sustaining chamber for the
experimental reading and theoretical prediction. The theoretical curve appears constant at
operating pressure 113 bar for 1.14 seconds operating time then sharply falls down to a
constant value of about 78.5 bar during the sustaining phase which terminates at 2.69 seconds.
In the experimental curve, the boosting phase starts operating at 90 bar that increases
gradually to about 103 bar and lasts for nearly 1.25 seconds operating time. Then, the
sustaining phase operates at a nearly average pressure of 65 bar till the propellant burnout at 3
seconds operating time.
Paper: ASAT-16-040-PP
Figure 13 shows the pressure-time curves of the boosting chamber for the
experimental measurements and theoretical prediction. The theoretical curve starts with a
constant operating pressure of 113 bar taking 1.14 seconds operating time during the boosting
phase then sharply falls down to the constant value of 27 bar during the sustaining phase
which lasts for 2.69 seconds. In the experimental reading, the boosting phase starts operating
at 71 bar that increases gradually to about 73 bar and lasts for 1.5 seconds operating time then
the sustaining phase operates at a nearly constant pressure of 15 bar till the propellant burnout
at 3 seconds operating time.
Finally, the thrust-time curves of this case are shown in Fig. 14. The theoretical thrust-
time curve appears constant at 1303 N during the boosting phase time of 1.14 seconds. In the
sustaining phase, the thrust fall down to 288.8 N and terminates after 2.69 seconds. In the
boosting phase of the experiment, the thrust increases gradually from 900 N to about 1010 N
for 1.3 seconds while the sustaining phase produces 150 N thrust for 1.7 seconds of operating
time.
Figure 15 shows the pressure-time curves of the sustaining chamber for the
experimental reading and theoretical prediction. The theoretical curve appears constant at
operating pressure 125.5 bar for 1.145 seconds operating time then sharply falls down to a
constant value of about 78.5 bar during the sustaining phase which terminates at 2.67 seconds.
In the experimental curve, the boosting phase starts operating at 90 bar that increases
gradually to about 95 bar and lasts for nearly 1.3 seconds operating time. Then, the sustaining
phase operates at a nearly average pressure of 60 bar till the propellant burnout at 3.1 seconds
operating time.
Figure 12 Sustaining chamber pressure-time profile for the first modified firing test
Paper: ASAT-16-040-PP
Figure 13 Boosting chamber pressure-time profile for the first modified firing test
Figure 14 Thrust-time profile for the first modified firing test
Figure 15 Sustaining chamber pressure-time profile for the second modified firing test
Paper: ASAT-16-040-PP
Figure 16 Boosting chamber pressure-time profile for the second modified firing test
Figure 17 Thrust-time profile for the second modified firing test
Figure 16 shows the pressure-time curves of the boosting chamber for the
experimental measurements and theoretical prediction. The theoretical curve starts with a
constant operating pressure of 110 bar taking 1.145 seconds operating time during the
boosting phase then sharply falls down to the constant value of 26.57 bar during the
sustaining phase which lasts for 2.67 seconds. In the experimental reading, the boosting phase
starts operating at 63 bar that increases gradually to about 70 bar and lasts for 1.3 seconds
operating time then the sustaining phase operates at a nearly constant pressure of 13 bar till
the propellant burnout at 3.1 seconds operating time.
Finally, the thrust-time curves of this case are shown in Fig. 17. The theoretical thrust-
time curve appears constant at 1303 N during the boosting phase time of 1.145 seconds. In the
sustaining phase, the thrust fall down to 288.2 N and terminates after 2.67 seconds. In the
boosting phase of the experiment, the thrust increases gradually from 1035 N to about 1080 N
for 1.3 seconds while the sustaining phase produces 165 N thrust for 1.8 seconds of operating
time.
As shown in figures 6, 9, 12 and 15, the differentiation between the boosting and
sustaining phases are clear. In figures 6 and 9, due to the significant pressure difference
between the sustaining and boosting chambers and the reverse flow which occurs, there is a
startling increase in the experimental pressure values in the boosting phase cannot be
calculated and can easily cause an explosion. In Fig. 12, where the boosting pressure is only
Paper: ASAT-16-040-PP
slightly higher than that of the sustaining pressure, there is no sever reverse flow and the
pressure of the sustaining chamber is only slightly increased. So, the experimental pressure
values improved perfectly than that in figures 6 and 9 after the modification is made. In Fig.
15, where the boosting pressure is approximately equal to the sustaining pressure, there is a
slight difference between the theoretical and experimental pressure values. The experimental
pressure data has lower values than the theoretical approach due to the losses in the TRM and
the isentropic assumption of the theoretical investigation that explained earlier.
Also in figures 7, 10, 13 and 16, the differentiation between the two phases is clear.
By similarity, figures 7 and 10 have the same trend of figures 6 and 9. It is also clear that
there is a steady fall between theoretical approach and experimental one. It can be seen also
that this pressure-time trend in figures 7, 10, 13 and 16 yields the thrust time trends shown in
figures 8, 11, 14 and 17, respectively. The TRM produces a thrust ratio 18 for the basic and
repeated test and approximately 7 for the modified tests.
In figures 13 and 16, it is apparent that the experimental results improved and became
smoother in comparison with the data listed in figures 7 and 10. Comparing the approaches
(experimental and theoretical) in figures 13 and 16, it can be seen that the experimental
boosting chamber pressures is almost always less than the theoretical one.
5. Conclusions:
The objective of the present study was to understand the physics of internal ballistics
of DTRM in the specific case where the reverse flow takes place through the intermediate
nozzle.
A mathematical model has been developed and a set of static firing tests have
conducted in a specially-designed TRM. The main conclusions of this study are as follows:
1. DTRM with ( ) induced a strong reverse flow. This strong flow
causes dramatic increase in the sustaining chamber pressure.
2. The modified static tests ( ) or ( ) gave considerable high
thrust ratio ( ), but the thrust was smooth and good agreement with the
computed results is noticed.
3. The four tests shows that the best design regime of this case is done when
( ).
The present study can be extended in view of investigating theoretically the transient
case of the reverse flow through the intermediate nozzle.
References:
[1] G. Sutton, Rocket Propulsion Elements, seventh ed.: JOHN WILEY & SONS, INC.,
2001
[2] H. M. Darwell, "Solid Propellant Dual-Thrust Motors," Proceeding of the 1st Rocket
Propulsion Symposium, 1961.
[3] McFillin, J. F., Van Brocklin, S. T., Beakley, J. E., and Netzer, D. W., “Dual-Chamber
Roicekt Motor Operating Characteristics,” Journal of Space Craft and Rockets, Vol.
21, No. 2, 1984, pp. 168- 174.
[4] Carrier, J. L., Constantinou, T., Harris, P. G., and Smith, D. L., “Dual-Interrupted-
Thrust Pulse Motor,” Journal of Propulsion and Power, Vol. 3, No. 4, 1987, pp. 308-
312.
[5] Manda, L. J., “Boost-Phase Equilibrium Pressures in a Dual-Thrust Soil-Propellant
Rocket Motor,” Journal of Spacecraft and Rockets, Vol. 2, No. 4, 1965, pp.607-609.
[6] M. Barrerre, Rocket Propulsion: Elsevier Pub. Co., 1960.
[7] B. P. Dunn. (2013, Cited Jan. 2013). “Rocket Engine Specific Impulse Program,”
http://www.dunnspace.com/isp.htm.