Dual Enrollment and Postsecondary Outcomes … Dual Enrollment and Postsecondary Outcomes ......
23
Georgia Dual Enrollment and Postsecondary Outcomes A Longitudinal Analysis of Dual Enrollment Outcomes from 2008 to 2016 November 2017 Prepared by: Sam Rauschenberg Kanti Chalasani
Transcript of Dual Enrollment and Postsecondary Outcomes … Dual Enrollment and Postsecondary Outcomes ......
Georgia Dual Enrollment and Postsecondary Outcomes
A Longitudinal Analysis of Dual Enrollment Outcomes from 2008 to 2016
November 2017
Prepared by:
Sam Rauschenberg
Kanti Chalasani

This page intentionally left blank.

Dual Enrollment and Postsecondary Outcomes
i
Executive Summary
Background
Dual enrollment provides opportunities for Georgia high school students to take postsecondary courses
and earn concurrent credit toward both a high school diploma and a college degree. While other states
have examined the postsecondary outcomes of dual enrollment students, Georgia has not done so. Over
the last decade, the recession, as well as changes in laws and policies regarding dual enrollment
availability and funding, have affected student participation (these changes are outlined in detail in the
Dual Enrollment Background section). Most notably, in 2015, the General Assembly made significant
changes to dual enrollment with the passage of Senate Bills 2 and 132, which consolidated dual
enrollment funding sources, streamlined policies, and created a new high school graduation option for
dual enrollees. These changes have resulted in a significant increase in participation, as well as an
increased interest in dual enrollment student outcomes.
Using linked data from GA-AWARDS data system, housed at the Governor’s Office of Student
Achievement, this report provides trends in public school dual enrollment participation, course-taking,
high school graduation, postsecondary enrollment, and degree earning between 2008 and 2016.1
Key Findings
The goal of this report is to provide descriptive information on dual enrollment participants. It does not
identify whether dual enrollment changes a student’s likelihood of graduating from high school, going to
college, or earning a credential.
Participation
• Dual enrollment participation decreased from 2007-2008 to 2011-2012, likely in part due to the
economic recession and school systems not receiving state FTE funding for dual enrollment
students during this period.
• Since 2011-2012, course enrollments have increased in conjunction with the economic recovery,
several legislative changes, and the inclusion of dual enrollment in the state’s K-12 accountability
system for the first time.
• In 2015-2016, 23,693 public school students participated in dual enrollment, an increase of 181%
from four years earlier. High school enrollment increased by only 8% over that time.
• Despite changes in enrollment, between 85% and 91% of dual enrollment courses resulted in the
student earning credit each year.
• While the percentage of male and female high school students was evenly split across the state,
female students were more likely to participate in dual enrollment.
• White students were overrepresented in dual enrollment courses relative to the population of high
school students, while black and Hispanic students were underrepresented.
• Students eligible for free/reduced price lunch were underrepresented in dual enrollment courses,
but this gap has narrowed as enrollment has grown over the last four years.
1 Private school and homeschool participants are excluded because school enrollment and the timing of graduation
cannot be verified.

Dual Enrollment and Postsecondary Outcomes
ii
Course-Taking Patterns
• Nearly two-thirds of dual enrollment courses taken by public high school students were in the
four core subject areas of Social Studies, English/Language Arts and Literature, Mathematics,
and Science.
• From 2011-2012 to 2015-2016, increases in core subject courses have outpaced other subject
areas in terms of number of courses taken. However, less common subject areas have seen larger
proportional growth than the core subject areas.
• The five subject areas with the highest growth were Arts, Business/Management/Marketing,
Physical Education/Health, Business Computer Applications, and Engineering/Design.
High School Graduation and Courses Completed Before Graduating
• More than 90% of high school students with dual enrollment credit graduated within four years.
• From 2011-2012 to 2015-2016, the percentage of dual enrollment students eligible for
free/reduced price lunch who graduated within four years increased from 83.5% to 94.8%.
• More than half of high school graduates with dual enrollment credit earned 10 or fewer credit
hours. Only 4% earn more than 30 credit hours.
Postsecondary Enrollment
• In the class of 2015, 83% of high school graduates who participated in dual enrollment were
enrolled in some form of postsecondary within a year of graduating, compared to 64% of all high
school graduates. This gap has widened steadily since the class of 2008.
• Between 2008 and 2015, dual enrollment participants increasingly enroll in Georgia public
colleges/universities (from 48% to 57%), while the proportion who enroll in Georgia public
technical colleges has decreased (18% to 11%).
Postsecondary Progression and Degrees
• Four years after high school graduation, 29% of dual enrollees had earned a postsecondary
credential, compared to only 17% of all high school graduates. Roughly a third of dual enrollees
and all high school graduates were still enrolled in postsecondary.
• After six years, nearly half of dual enrollees had earned a credential, compared to only 36% of
high school graduates.
• Still, six years after graduation, more than one in four dual enrollees who graduated from high
school were working in Georgia without either a postsecondary credential or being enrolled in
postsecondary courses.
While the results indicate that dual enrollees are more likely to achieve postsecondary success than other
high school graduates, these results do not indicate that participating in dual enrollment increases a
student’s likelihood of earning a postsecondary credential. Dual enrollment students must meet minimum
admissions criteria in order to participate in courses, which makes them not directly comparable to other
high school graduates who do not meet the criteria.
Looking forward, participation in dual enrollment increased further in 2016-2017 in the second year after
the most recent legislative changes. Once data become available in GA-AWARDS, further analysis
should examine whether the population of students participating in dual enrollment changes and whether
the outcomes change relative to prior years. In addition, more rigorous research is needed to determine
how much of these trends are caused by students participating in dual enrollment and how much are a
reflection of the characteristics of dual enrollment students compared to those who do not participate.

Dual Enrollment and Postsecondary Outcomes
iii
Table of Contents
Executive Summary ....................................................................................................................................... i
Background ................................................................................................................................................ i
Key Findings .............................................................................................................................................. i
Participation ........................................................................................................................................... i
Course-Taking Patterns ......................................................................................................................... ii
High School Graduation and Courses Completed Before Graduating .................................................. ii
Postsecondary Enrollment..................................................................................................................... ii
Postsecondary Progression and Degrees ............................................................................................... ii
Dual Enrollment Background ....................................................................................................................... 4
Data Definitions and Methodology ............................................................................................................... 6
Dual Enrollment Trends from 2008 to 2016 ................................................................................................. 8
Statewide Course Enrollment and Completion Trends ............................................................................. 8
Enrollment Trends by Subgroups ........................................................................................................... 10
Gender ................................................................................................................................................. 10
Race/Ethnicity ..................................................................................................................................... 11
Free/Reduced Price Lunch Status (Low-income Status) .................................................................... 12
Dual Enrollment Course-Taking Patterns ................................................................................................... 13
High School Graduation ............................................................................................................................. 15
Number of Credit Hours Dual Enrollees Earn Before Graduation ............................................................. 16
Postsecondary Enrollment .......................................................................................................................... 17
Postsecondary Progression and Degrees ..................................................................................................... 18
Conclusion .................................................................................................................................................. 19
Appendix I: Dual Enrollment Programs Prior to 2015 Senate Bill 132 ...................................................... 20
Appendix II: Dual Enrollment Courses by Subject Area ............................................................................ 21

Dual Enrollment and Postsecondary Outcomes
4
Dual Enrollment Background
Dual enrollment provides opportunities for high school students to take postsecondary courses and earn
concurrent credit toward a high school diploma and a college degree. Proponents of dual enrollment
maintain that participation increases postsecondary enrollment and degree completion for students.
Several studies in recent years have found that dual enrollment students are more likely to earn
postsecondary degrees, especially low-income students and those who begin at community or technical
colleges.2
Georgia high school students have participated in dual enrollment for many years, but limited research
has been conducted to track participant outcomes. Over the last decade, the recession, in combination
with changes to dual enrollment laws and funding mechanisms, have affected student participation in dual
enrollment. This report examines dual enrollment outcomes as a whole rather than by program, but
understanding how dual enrollment options have changed is important to contextualize the findings.
Until 2009, dual enrollment participants comprised a mixture of students who either paid for tuition or
participated in one of several state-funded programs that either fully or partially funded tuition and fees
(e.g., Accel, HOPE Grant). Each program had different eligibility requirements and funding structures,
which at times created confusion for prospective students.3 In addition, rules for awarding and receiving
dual enrollment credit between institutions did not exist. From a funding perspective, school systems
could not count a dual enrollment student as enrolled for a segment associated with the college course and
in turn did not receive state FTE funding for those segments.
In spring 2009, the General Assembly added another dual enrollment option, Move On When Ready
(MOWR), for high school juniors and seniors through House Bill 149. Participating students enrolled
full-time (12 or more semester credit hours) in postsecondary institutions, and a student’s state K-12 FTE
funding paid for the costs. As such, school systems did not earn FTE funds for students who participated.
MOWR credit hours did not count against the HOPE Scholarship credit hour eligibility.
To create more uniformity in dual enrollment options and address K-12 funding concerns, in spring 2011
the General Assembly passed House Bill 186. This legislation required the GaDOE, TCSG, and USG to
jointly develop policies for student participation in dual enrollment. It also required high schools to award
credit for approved courses and postsecondary institutions to accept credit without charging additional
fees. Finally, the bill shifted the funding source from lottery to state funds, allowing school systems to
count dual enrollment students as enrolled in the high school for any dual enrollment segment. This
adjustment allowed schools to still earn FTE funding unless a student was enrolled full-time in a
postsecondary institution through MOWR.4
2 An B. P. (2013). The impact of dual enrollment on college degree attainment: Do low-SES students benefit?
Educational Evaluation and Policy Analysis, 35(1), 57–75.
Blankenberger B., Lichtenberger E., With M. A. (2017) Dual Credit, College Type, and Enhanced Degree
Attainment. Educational Researcher, 46(5), 259-263.
3 Appendix I provides a more complete summary of the various dual enrollment options. 4 For a summary of what led to HB 186: Georgia State University Law Review (2012) "Education HB 186,"
Georgia State University Law Review: 28(1), Article 7. http://readingroom.law.gsu.edu/gsulr/vol28/iss1/7

Dual Enrollment and Postsecondary Outcomes
5
Two years later in May 2013, the GaDOE released the first College and Career Ready Performance Index
(CCRPI), a comprehensive rating system on all Georgia public schools. The high school formula included
a measure for the percentage of high school graduates who earned at least one high school credit in
Advanced Placement, International Baccalaureate, or dual enrollment courses. This indicator represented
the first time that participation in dual enrollment was included in the state’s accountability system for
high schools.
In 2014, Governor Deal created a dual enrollment task force to make recommendations on how to
improve and streamline dual enrollment processes. The task force culminated in the introduction and
passage of Senate Bills 2 and 132 in spring 2015.
• Senate Bill 132, titled the “Move on When Ready Act,” consolidated all dual enrollment
programs into a new Move On When Ready (MOWR) program, which:
o Is open to all high school students enrolled in public schools, private schools, or approved
home study programs,
o Eliminates the cost to the student for tuition, fees, and books,
o Allows part- or full-time enrollment students, and
o Does not affect high schools’ FTE funding.
• Senate Bill 2 created a new option for dual enrollment students to earn a high school diploma
through:
o Completing high school courses and taking associated end-of-course assessments in two
English/language arts, mathematics, science, and social studies as well as one
health/physical education course (courses typically taken by the end of 10th grade),
o Meeting admissions requirements of a MOWR-eligible postsecondary institution, and
o Enrolling in that institution and earning an associate’s degree, technical diploma, or two
technical certificates in one pathway.
By reducing confusion, streamlining funding, and opening opportunities for more students and courses,
the two bills have reduced barriers to dual enrollment participation. These revisions went into effect
during the 2015-2016 academic year, which is the final year included in this report.
In an effort to increase clarity for parents and students interested in participation, in August 2017
Governor Deal changed the name from Move On When Ready to dual enrollment.

Dual Enrollment and Postsecondary Outcomes
6
Data Definitions and Methodology
This report uses longitudinal student data from the GA-AWARDS Data System, housed at the Governor’s
Office of Student Achievement. GA-AWARDS links student- and teacher-level data from 2007 to 2016
from all state education agencies, the Georgia Department of Labor, the National Student Clearinghouse,
the College Board (SAT/Advanced Placement), ACT, and the Georgia Independent Colleges Association
(GICA). This report uses K-12, postsecondary, and labor market data from 2007-2008 to 2015-2016.
Below are the definitions and business rules used for this report.
Dual Enrolled Student
A student is considered “dual enrolled” if he/she was enrolled in a Georgia public high school and meets
at least one of the following criteria in the same academic term:
• Has a dual enrolled/MOWR financial aid invoice reported by the Georgia Student Finance
Commission, or
• Is reported as a dual enrolled student by either a Technical College System of Georgia (TCSG),
University System of Georgia (USG), or Georgia Independent College Association (GICA)
postsecondary institution.5
Other than confirming whether a student is enrolled in a public high school, Georgia Department of
Education (GaDOE) data on course enrollment and dual enrollment participation are not used in this
report. Private school and homeschool participants are excluded because enrollment and timing of
graduation cannot be verified with available data. Joint enrollment students who are enrolled in
postsecondary courses but do not receive high school credit are excluded.
Dual Enrolled Course Completer
A student is considered to have completed dual enrollment if he/she meets the definition of dual enrolled
student above and has earned at least one credit in a dual enrollment course as reported by
USG/GICA/TCSG in the school year.
Exceptions
• Students who graduate from high school prior to the postsecondary term enrollment are not
counted as dual enrollment course completers using the following rules:
o For students who graduate from high school in the beginning of the school year (July and
August) the analysis excludes postsecondary courses taken in both fall and spring terms
of that academic year.
o For students who graduate from high school between September and December of the
school year, the analysis excludes postsecondary courses taken in spring term of that
academic year.
• Course grades reported as “NR-Not Reported” were counted as attempted but not earned credit
hours. As a result, if a student only had courses that had grades of “NR-Not Reported,” he/she
5 Private postsecondary institutions voluntarily provide data to GA-AWARDS through GICA. This analysis does not
include course records for students in institutions that do not provide data, which are Brewton-Parker College,
Emory University, Life University, Savannah College of Art and Design, Shorter University, Thomas University,
and Truett McConnell University. Georgia Military College (GMC) is also not included at this time, but its historical
data will be added to GA-AWARDS in December 2017.

Dual Enrollment and Postsecondary Outcomes
7
would not be counted as a dual enrollment course completer for the purposes of this report
because no credit was reported as earned.
High School Graduates
High school graduates are students that the school districts designated as graduates using the withdrawn
code of “G.” In addition, the students must have been enrolled in grades 11 or 12 and must have earned
the diploma types below:
• For 2011 and earlier, diploma type V, B, C
• For 2012 and after, diploma type V, B, C, or G
High School Graduate Who Participated in Dual Enrollment
Students must meet the definitions of Dual Enrolled Course Completer and High School Graduate above
to be considered a participant in dual enrollment who graduates from high school. Students who
participated in dual enrollment but did not earn at least one credit hour are excluded. In addition, this
calculation only includes students who graduate from high school within four years of first entering as a
ninth grade student. Students who transfer to out-of-state schools, private schools, or homeschools are
excluded. This definition is close, but not identical, to the high school graduation rate calculation. As
such, comparisons with the published graduation rates are not feasible.
Dual Enrollment Participant Earning a Postsecondary Credential
These students are those who meet the definition of a Dual Enrolled Course Completer and earn at least
one postsecondary credential between 2007 and 2016. Within Georgia, the credential can be from any
USG, TCSG, or GICA institution. Outside of Georgia, the credential can be from any private or public
institution as maintained in the National Student Clearinghouse (NSC).

Dual Enrollment and Postsecondary Outcomes
8
Dual Enrollment Trends from 2008 to 2016
Statewide Course Enrollment and Completion Trends
As outlined in the Dual Enrollment Background section, the economic recession and several key policy
changes affected dual enrollment participation over the last decade. As seen in the figure below, dual
enrollment participation decreased from 2007-2008 to 2011-2012 before sharply increasing for the
following four years.
• From 2007-2008 to 2011-2012, both the number of students participating and the total number of
courses attempted decreased (see next page), likely in part due to the economic recession, as well
as school systems not receiving state FTE funding for dual enrollment students during this period.
• Course enrollments began to increase in 2011-2012 after the passage of House Bill 186 and the
inclusion of dual enrollment in the GaDOE’s College and Career Ready Performance Index
(CCRPI) in 2013.
• In 2015-2016, 23,693 students participated in dual enrollment, an increase of 181% from four
years earlier. High school enrollment increased by only 8% over that time.6
• The increase was largest from 2014-2015 to 2015-2016, which followed the passage of Senate
Bills 2 and 132 that streamlined dual enrollment programs and created a new high school diploma
option for dual enrollment students.
6 Of these participants, 95.2% had course records in GA-AWARDS. The remaining 4.8% were present in GSFC
invoicing data, meaning that they enrolled in coursework in either Georgia Military College or one of the private
colleges that does not provided data to GA-AWARDS. In all years, the percentage of students with enrollment
records remained between 95% and 97%. See Data Definitions and Methodology for more details.
10,5839,494
8,558 8,819 8,438
10,945
13,608
17,661
23,693
0
5,000
10,000
15,000
20,000
25,000
2007-08 2008-09 2009-10 2010-11 2011-12 2012-13 2013-14 2014-15 2015-16
Academic Year
Number of Public School Students Participating in Dual Enrollment
HB 186 creates
streamlined DE policies
and allows K-12 schools to retain FTE funding.
HB 149 creates
Move On When
Ready Program for
full-time DE
students.
The Great Recession
begins.
The CCRPI, the
state's accountability
system, includes dual
enrollment measure
for the first time.
SB 2 and 132 collapse dual
enrollment into one
program and create new
high school diploma
option.
181%
increase
from
2011-12
to
2015-16

Dual Enrollment and Postsecondary Outcomes
9
The number of dual enrollment courses attempted and completed also increased by similar percentages as
the number of students participating.
• Given the proportional increase from 2011-2012 to 2015-2016, the increased participation is
mostly the result of new students participating rather than existing students taking more courses
than in the past.
• In 2015-2016, 86.3% of dual enrollment courses attempted were completed, meaning that the
student earned credit. This percentage is slightly higher than the prior year (84.7%).
• The completion rate has remained between 85% and 91% each year during the last decade despite
the significant enrollment changes.
35,965 34,817 31,721 32,233 30,57339,291
50,859
65,619
88,344
0
25,000
50,000
75,000
100,000
2007-08 2008-09 2009-10 2010-11 2011-12 2012-13 2013-14 2014-15 2015-16
Academic Year
Number of Dual Enrollment Courses Attempted by Public High School Students
*Only includes students attending institutions that
contribute data to GA-AWARDS (95-97% each year).
32,469 31,73528,652 28,249 26,833
34,275
43,732
55,557
76,239
0
25,000
50,000
75,000
100,000
2007-08 2008-09 2009-10 2010-11 2011-12 2012-13 2013-14 2014-15 2015-16
Academic Year
Number of Dual Enrollment Courses Completed by Public High School Students
*Only includes students attending institutions that
contribute data to GA-AWARDS (95-97% each year).
189%
increase
from
2012 to
2016
184%
increase
from
2012 to
2016

Dual Enrollment and Postsecondary Outcomes
10
Enrollment Trends by Subgroups
Over the last decade, the distribution of public school students participating in dual enrollment has shifted
in terms of gender, race/ethnicity, and free/reduced lunch status. The following charts compare those
trends to public high school enrollment over that time.
Gender
• While the percentage of male and female high school students was evenly split across the state,
female students were more likely to participate in dual enrollment.
• During the last six years, over 60% of public school dual enrollment students were female.
• The percentage of female students decreased slightly during each of the last three years, as dual
enrollment participation grew.
61.5%
62.0%
62.6%
64.1%
61.6%
60.6%
59.2%
57.1%
56.3%
38.5%
38.0%
37.4%
35.9%
38.4%
39.4%
40.8%
42.9%
43.7%
2015-16
2014-15
2013-14
2012-13
2011-12
2010-11
2009-10
2008-09
2007-08
Dual Enrollment Trends by Gender
Percent of Courses Attempted by Females Percent of Courses Attempted by Males
49.3%
49.3%
49.3%
49.3%
49.3%
49.3%
49.4%
49.6%
49.7%
50.7%
50.7%
50.7%
50.7%
50.7%
50.7%
50.6%
50.4%
50.3%
2015-16
2014-15
2013-14
2012-13
2011-12
2010-11
2009-10
2008-09
2007-08
Public High School Enrollment Trends by Gender
Percent Female Students Percent Male Students
Dual Enrollment and Postsecondary Outcomes
11
Race/Ethnicity
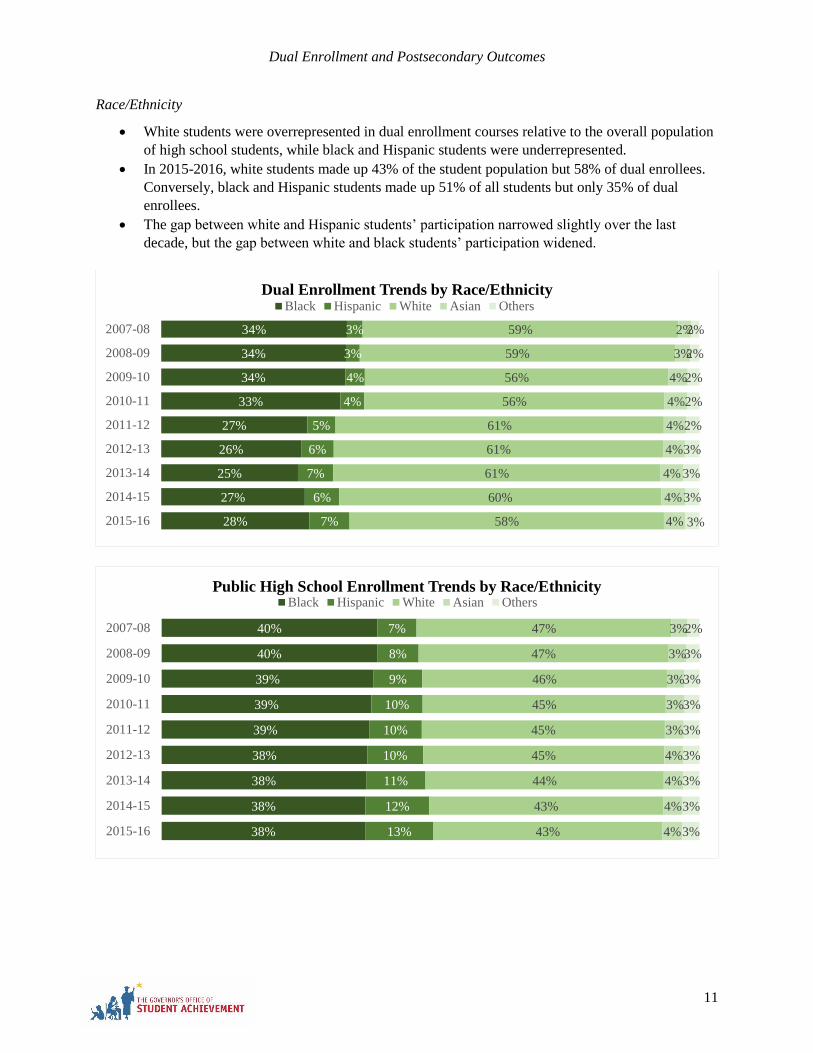
• White students were overrepresented in dual enrollment courses relative to the overall population
of high school students, while black and Hispanic students were underrepresented.
• In 2015-2016, white students made up 43% of the student population but 58% of dual enrollees.
Conversely, black and Hispanic students made up 51% of all students but only 35% of dual
enrollees.
• The gap between white and Hispanic students’ participation narrowed slightly over the last
decade, but the gap between white and black students’ participation widened.
28%
27%
25%
26%
27%
33%
34%
34%
34%
7%
6%
7%
6%
5%
4%
4%
3%
3%
58%
60%
61%
61%
61%
56%
56%
59%
59%
4%
4%
4%
4%
4%
4%
4%
3%
2%
3%
3%
3%
3%
2%
2%
2%
2%
2%
2015-16
2014-15
2013-14
2012-13
2011-12
2010-11
2009-10
2008-09
2007-08
Dual Enrollment Trends by Race/EthnicityBlack Hispanic White Asian Others
38%
38%
38%
38%
39%
39%
39%
40%
40%
13%
12%
11%
10%
10%
10%
9%
8%
7%
43%
43%
44%
45%
45%
45%
46%
47%
47%
4%
4%
4%
4%
3%
3%
3%
3%
3%
3%
3%
3%
3%
3%
3%
3%
3%
2%
2015-16
2014-15
2013-14
2012-13
2011-12
2010-11
2009-10
2008-09
2007-08
Public High School Enrollment Trends by Race/EthnicityBlack Hispanic White Asian Others

Dual Enrollment and Postsecondary Outcomes
12
Free/Reduced Price Lunch Status (Low-income Status)7
• Low-income students were underrepresented in dual enrollment courses, but this gap narrowed as
enrollment grew over the last four years. At least part of the increase in low-income students may
be the result of more schools offering schoolwide free lunch through the National School Lunch
Program’s Community Eligibility Provision rather than an actual increase in low-income student
participation.
• In 2015-2016, 57.9% of high school students were eligible for free/reduced price lunch, but only
51.6% of dual enrollees were eligible.
• Since 2012-2013, the share of low-income dual enrollees increased sharply from 38.1% to 51.6%,
while the statewide percentage only increased from 52.6% to 57.9%.
7 During the 2013-2014 school year, the National School Lunch Program expanded its Community Eligibility
Provision (CEP) to allow schools and districts that have more than 40% of students who are directly certified for
free lunch to count all students as eligible for free lunch. This change is part of the reason FRL percentages have
increased over the last three years. Increasing in dual enrollees who are eligible for FRL could be partially due to
previously non-FRL students attending a school that became eligible for CEP.
51.6%
47.4%
45.8%
38.1%
38.7%
41.7%
42.5%
41.4%
38.5%
48.4%
52.6%
54.2%
61.9%
61.3%
58.3%
57.5%
58.6%
61.5%
2015-16
2014-15
2013-14
2012-13
2011-12
2010-11
2009-10
2008-09
2007-08
Dual Enrollment Trends by Free/Reduced Price Lunch Status
Percent of Courses Attempted by FRL Percent of Courses Attempted by Non-FRL
57.9%
57.2%
55.6%
52.6%
52.8%
50.3%
49.2%
45.9%
43.7%
42.1%
42.8%
44.4%
47.4%
47.2%
49.7%
50.8%
54.1%
56.3%
2015-16
2014-15
2013-14
2012-13
2011-12
2010-11
2009-10
2008-09
2007-08
Public High School Enrollment Trends by Free/Reduced Lunch Status
Percent FRL Percent Non-FRL

Dual Enrollment and Postsecondary Outcomes
13
Dual Enrollment Course-Taking Patterns
Students enroll in dual enrollment courses for a variety of reasons—some to get a head start on core
courses and others to explore courses related to a career that interests them. In 2015-2016, a majority of
courses taken fell into four core subject areas, while a considerable number of courses belonged to one of
seven remaining areas.
• Nearly two-thirds of dual enrollment courses taken by public high school students were in the
four core subject areas of Social Studies, English/Language Arts and Literature, Mathematics,
and Science.
• One in five dual enrollment courses were in Social Studies, and another 20% were in
English/Language Arts and Literature.
• 15% of courses were in Mathematics.
• Career/Tech/Maintenance/Industry courses made up 10% of courses taken.
Appendix II includes a full list of course subject enrollment in 2007-2008, 2011-2012, and 2015-2016.
As the dual enrollment options changed over the last decade, the types of courses students take has also
shifted. The changes have been particularly stark since 2012 after the passage of House Bill 186 in 2011
that streamlined policies and funding mechanisms. The following page includes charts of the most
common subject areas and those with the largest growth.
Social Studies
21%
English/Language
Arts and
Literature
20%
Mathematics
15%
Career/Tech/
Maintenance/Industry
10%
Health Science
& Services
9%
Science
7%
Criminal Justice/ Human
Services
4%
Business/ Management/
Marketing
3%
Communication/
Journalism
2%
World
Languages
2%
All Others
7%
What Courses Did 2015-2016 Public School Dual Enrollment Students Take?
88,344courses

Dual Enrollment and Postsecondary Outcomes
14
• The increase in core subject courses outpaced other subject areas. For example, since 2011-2012,
the number of Social Studies courses increased from 5,165 to 18,881 (266% increase).
• However, less common subject areas have seen larger proportional growth than the core subject
areas, as seen in the table at the bottom of this page.
• While only 1,088 Arts courses were taken in 2015-2016, Arts course enrollment increased by
621% over the last four years.
• The five subject areas with the highest growth were Arts, Business/Management/Marketing,
Physical Education/Health, Business Computer Applications, and Engineering/Design.
• Career/Tech/Maintenance/Industry course enrollment dropped significantly between 2007-2008
and 2011-2012, likely due to a lack of funding for dual enrollment technical college course. The
courses increased from 2011-2012 to 2015-2016 but are still below 2007-2008 levels.
Subject Areas with Largest Increases in Dual Enrollment from 2012 to 2016
Subject Area Number of Courses
in 2015-2016
Percent Increase
Since 2011-2012
Arts 1,088 621%
Business/Management/Marketing 3,000 427%
Physical Education and Health 637 394%
Business Computer Applications 260 294%
Engineering/Design 414 280%
Social Studies 18,881 266%
Communication/Journalism 2,108 251%
English/Language Arts and Literature 17,893 248%
Mathematics 13,213 239%
Science 6,023 163%
385
2,038
1,647
1,319
4,655
9,514
2,033
4,025
2,994
600
569
1,610
2,287
4,420
3,851
3,902
5,136
5,165
2,108
3,000
3,670
6,023
7,423
8,344
13,213
17,893
18,881
0 5,000 10,000 15,000 20,000
Communication/Journalism
Business/Management/Marketing
Criminal Justice/Human Services
Science
Health Science and Services
Career/Tech/Maintenance/Industry
Mathematics
English/Language Arts and Literature
Social Studies
Trends in the 10 Most Common Dual Enrollment Courses
2015-2016
2011-2012
2007-2008
Dual Enrollment and Postsecondary Outcomes
15
High School Graduation
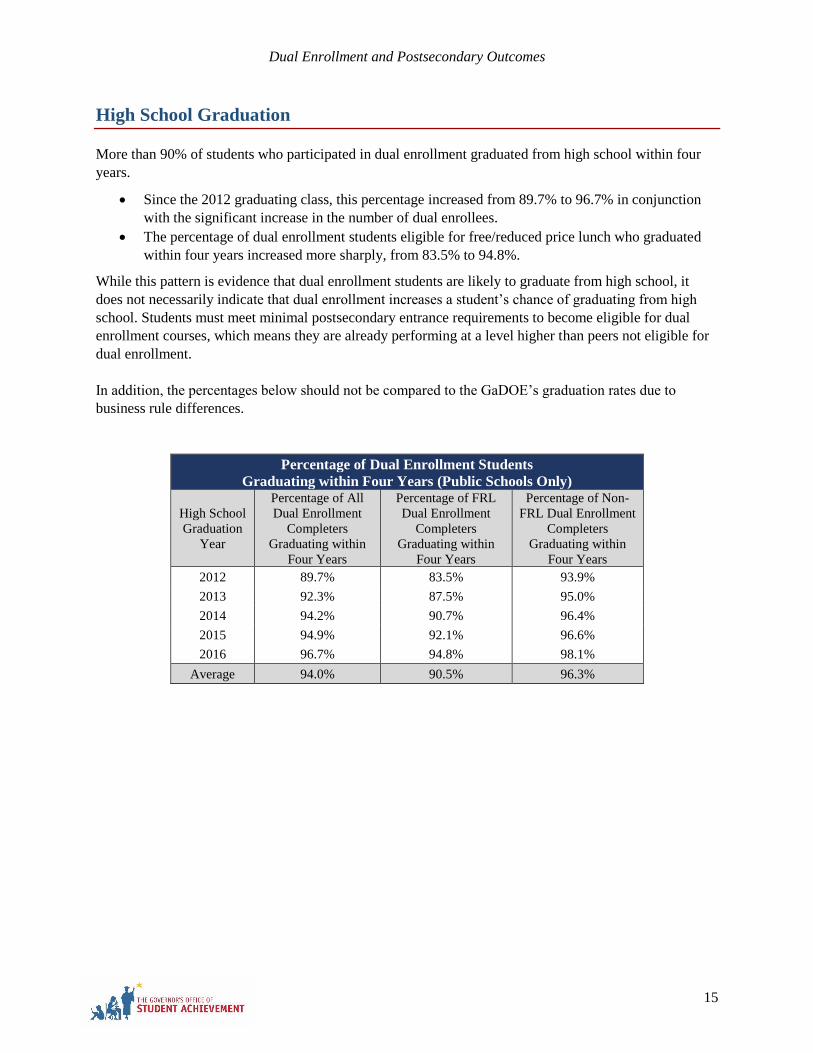
More than 90% of students who participated in dual enrollment graduated from high school within four
years.
• Since the 2012 graduating class, this percentage increased from 89.7% to 96.7% in conjunction
with the significant increase in the number of dual enrollees.
• The percentage of dual enrollment students eligible for free/reduced price lunch who graduated
within four years increased more sharply, from 83.5% to 94.8%.
While this pattern is evidence that dual enrollment students are likely to graduate from high school, it
does not necessarily indicate that dual enrollment increases a student’s chance of graduating from high
school. Students must meet minimal postsecondary entrance requirements to become eligible for dual
enrollment courses, which means they are already performing at a level higher than peers not eligible for
dual enrollment.
In addition, the percentages below should not be compared to the GaDOE’s graduation rates due to
business rule differences.
Percentage of Dual Enrollment Students
Graduating within Four Years (Public Schools Only)
High School
Graduation
Year
Percentage of All
Dual Enrollment
Completers
Graduating within
Four Years
Percentage of FRL
Dual Enrollment
Completers
Graduating within
Four Years
Percentage of Non-
FRL Dual Enrollment
Completers
Graduating within
Four Years
2012 89.7% 83.5% 93.9%
2013 92.3% 87.5% 95.0%
2014 94.2% 90.7% 96.4%
2015 94.9% 92.1% 96.6%
2016 96.7% 94.8% 98.1%
Average 94.0% 90.5% 96.3%

Dual Enrollment and Postsecondary Outcomes
16
Number of Credit Hours Dual Enrollees Earn Before Graduation
Overall, dual enrollees generally seem to take a small number of courses rather than enrolling full-time.
Prior to 2015, the MOWR program was available to students who enrolled full-time, but the overall
proportion of dual enrollees participating in this option was small.
Of 2012 to 2016 high school students who earned dual enrollment credit and graduated within four years:
• Forty percent earned between 6 and 10 credits, roughly equivalent to between two and four
courses.
• Twelve percent took five or fewer courses.
• One in four graduates earned between 11 and 15 credits, roughly equivalent to a semester of full-
time study.
• Only 4% earned more than 30 credit hours.
1 to 5
12%
6 to 10
40%11 to 15
25%
16 to 20
8%
21 to 30
11%
31 to 40
2%
41+
2%
Credits Earned by High School Graduates Who Participate in
Dual Enrollment
High School
Graduates Between
2012 and 2016

Dual Enrollment and Postsecondary Outcomes
17
Postsecondary Enrollment
A common question regarding dual enrollment is whether students who participate in it continue their
postsecondary studies after graduation. As seen in the charts below, dual enrollment participants are more
likely to attend college within one year of graduating compared to high school graduates across the state.
• In the class of 2015, 83% of high school graduates who participated in dual enrollment were
enrolled in some form of postsecondary within a year of graduating, compared to 64% of all high
school graduates. This gap has widened steadily since the class of 2008.
• Between 2008 and 2015, an increasing percentage of dual enrollment participants enrolled in
Georgia public colleges/universities. While the percentage of Georgia public technical colleges
enrollees decreased, actual numbers of dual enrollment students in technical colleges have still
increased since 2012.
• The percentage of students enrolling in Georgia private colleges and out-of-state colleges was
roughly the same between dual enrollees and all high school graduates.
• Half as many dual enrollee graduates were working but not enrolled in postsecondary compared
to the state’s graduates.8
8 Department of Labor data only include employers that report data to the unemployment insurance system. As such,
it does not include individuals who are self-employed or who work in out-of-state, contract, military, or federal
government jobs.
57%
55%
55%
55%
53%
50%
48%
48%
11%
12%
14%
13%
14%
18%
19%
18%
6%
6%
6%
5%
5%
4%
4%
4%
10%
10%
10%
11%
9%
8%
9%
9%
10%
12%
11%
11%
12%
13%
13%
15%
7%
5%
5%
5%
6%
7%
7%
6%
2015
2014
2013
2012
2011
2010
2009
2008
Hig
h S
cho
ol
Gra
duat
ing C
lass
Postsecondary Enrollment Trends of Public High School Graduates Who
Earned Dual Enrollment CreditEnrolled in Georgia public college/university Enrolled in Georgia public technical collegeEnrolled in Georgia private college/university Enrolled in college/university outside of GeorgiaWorking in Georgia, not enrolled in college Unknown
41%
43%
43%
44%
45%
45%
46%
46%
8%
9%
9%
8%
9%
10%
11%
10%
5%
6%
6%
6%
5%
5%
5%
5%
10%
10%
10%
10%
10%
9%
9%
10%
21%
21%
20%
18%
18%
17%
16%
18%
15%
11%
13%
13%
14%
14%
14%
12%
2015
2014
2013
2012
2011
2010
2009
2008
Hig
h S
cho
ol
Gra
duat
ing C
lass
Postsecondary Enrollment Trends of Statewide Public High School GraduatesEnrolled in Georgia public college/university Enrolled in Georgia public technical collegeEnrolled in Georgia private college/university Enrolled in college/university outside of GeorgiaWorking in Georgia, not enrolled in college Unknown

Dual Enrollment and Postsecondary Outcomes
18
Postsecondary Progression and Degrees
Dual enrollment participants also are more likely to earn a postsecondary credential with two, four, and
six years compared to statewide high school graduates.9
• Within two years, 6% of dual enrollee high school graduates had earned a credential, compared to
only 2% of high school graduates statewide. In addition, 70% were still enrolled in postsecondary
studies, compared to 62% of all graduates.
• Four years after graduation, 29% of dual enrollees had earned a credential, compared to only 17%
of all high school graduates. Roughly a third of dual enrollees and all high school graduates were
still enrolled in postsecondary.
• After six years, nearly half of dual enrollees had earned a credential, compared to only 36% of
high school graduates.
• Still, six years after graduation, 27% of dual enrollees who graduated from high school were
working in Georgia without a postsecondary credential or being enrolled in school. This
percentage is four percentage points below all high school graduates.
While dual enrollees are more likely to enroll in and complete postsecondary studies, these results do not
indicate that participating in dual enrollment increases a student’s likelihood of earning a postsecondary
credential. As stated previously, dual enrollment students must meet minimum admissions criteria in
order to participate in courses, which makes them not directly comparable to all other high school
graduates.
9 For credentials earned within two years, high school graduating classes between 2008 and 2014 are included. For
credentials earned within four years, graduating classes between 2008 and 2012 are included. For credentials earned
within six years, graduating classes between 2008 and 2010 are included.
48%
29%
6%
11%
33%
70%
27%
24%
16%
14%
14%
8%
Within
6 Years
Within
4 Years
Within
2 Years
Postsecondary Progression of Dual Enrollment Students
after High School GraduationEarned Postsecondary Credential Enrolled in Postsecondary Working without Postsecondary Credential or Enrollment Unknown
36%
17%
2%
13%
35%
62%
31%
29%
21%
21%
20%
14%
Within
6 Years
Within
4 Years
Within
2 Years
Postsecondary Progression of Statewide Students
after High School GraduationEarned Postsecondary Credential Enrolled in Postsecondary Working without Postsecondary Credential or Enrollment Unknown

Dual Enrollment and Postsecondary Outcomes
19
Conclusion
Dual enrollment provides opportunities for Georgia high school students to take postsecondary courses
and earn concurrent credit toward both a high school diploma and a college degree. This report uses
longitudinal data to shed light on outcomes of students who have participated in dual enrollment over the
last decade. Most notably, it finds that students who participate in dual enrollment are likely to graduate
from high school within four years. Those who graduate are more likely to enroll in postsecondary
coursework and complete a postsecondary credential relative to other high school graduates. More
rigorous research is needed to determine whether those differences are more the result of participating in
dual enrollment or a reflection of the characteristics of the students who dually enroll.
Based upon GSFC invoice data, dual enrollment participation increased further in 2016-2017, the second
year after the most recent legislative changes. Once matched data become available in GA-AWARDS,
further analysis should examine whether the population of students participating in dual enrollment
changes and whether the outcomes change relative to prior years.

Dual Enrollment and Postsecondary Outcomes
20
Appendix I: Dual Enrollment Programs Prior to 2015 Senate Bill 132
The Accel Program—Used lottery funds to pay for dual enrollment courses that were part of core
graduation requirements (English/Language Arts, Mathematics, Social Studies, Science, and Foreign
Languages). Between 2008 and 2015, credit hours counted against a student’s HOPE scholarship credit
hour eligibility in some years but not in others. In 2011, the funding source was moved from lottery funds
to state funds.
Move on When Ready—Open to 11th and 12th grade students who enrolled full-time (12 or more
semester credit hours) in postsecondary institutions. The program was funded through the student’s
allocation of state K-12 FTE funding. MOWR credit hours did not count against the HOPE Scholarship
credit hour eligibility.
The HOPE Grant— Provided non-need based assistance to Georgia residents seeking technical
certificates or diplomas from TCSG and USG eligible postsecondary institutions. For dual enrollment, the
Hope Grant Program covered most of the cost of attending and was funded with lottery funds. Between
2008 and 2015, credit hours counted against a student’s HOPE scholarship credit hour eligibility in some
years but not in others. After the 2015 changes, the HOPE grant still exists for postsecondary students
seeking technical certificates and diplomas, but it is not a dual enrollment program.
A small subset of students also earned dual enrollment credit through Early College, Gateway to
College, and Residential Programs.
For further details on each program’s structure are available in the GaDOE’s 2010 Dual Enrollment
Guidance.
Dual Enrollment and Postsecondary Outcomes
21
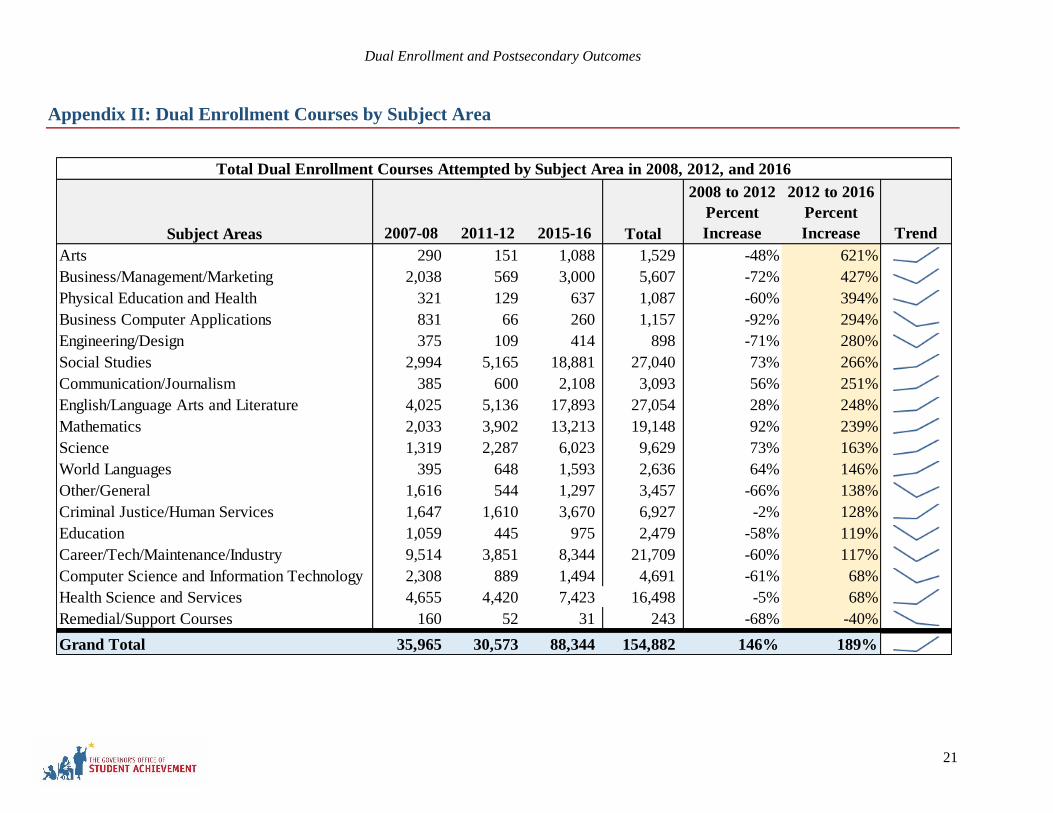
Appendix II: Dual Enrollment Courses by Subject Area
Subject Areas 2007-08 2011-12 2015-16 Total
2008 to 2012
Percent
Increase
2012 to 2016
Percent
Increase Trend
Arts 290 151 1,088 1,529 -48% 621%
Business/Management/Marketing 2,038 569 3,000 5,607 -72% 427%
Physical Education and Health 321 129 637 1,087 -60% 394%
Business Computer Applications 831 66 260 1,157 -92% 294%
Engineering/Design 375 109 414 898 -71% 280%
Social Studies 2,994 5,165 18,881 27,040 73% 266%
Communication/Journalism 385 600 2,108 3,093 56% 251%
English/Language Arts and Literature 4,025 5,136 17,893 27,054 28% 248%
Mathematics 2,033 3,902 13,213 19,148 92% 239%
Science 1,319 2,287 6,023 9,629 73% 163%
World Languages 395 648 1,593 2,636 64% 146%
Other/General 1,616 544 1,297 3,457 -66% 138%
Criminal Justice/Human Services 1,647 1,610 3,670 6,927 -2% 128%
Education 1,059 445 975 2,479 -58% 119%
Career/Tech/Maintenance/Industry 9,514 3,851 8,344 21,709 -60% 117%
Computer Science and Information Technology 2,308 889 1,494 4,691 -61% 68%
Health Science and Services 4,655 4,420 7,423 16,498 -5% 68%
Remedial/Support Courses 160 52 31 243 -68% -40%
Grand Total 35,965 30,573 88,344 154,882 146% 189%
Total Dual Enrollment Courses Attempted by Subject Area in 2008, 2012, and 2016