
DTrace for Linux · DTrace for Linux TomasJedlicka 2018-02-03Sat
37
Transcript of DTrace for Linux · DTrace for Linux TomasJedlicka 2018-02-03Sat

Introduction
Overview
DTrace has been released in 2005 for Sun’s Solaris operatingsystem.
Today it has become adopted by other operating systems aswell
• Apple’s Mac Os X
• Joyent’s Smart OS
• FreeBSD
• Oracle’s Linux . . . WIP
1
Why another Linux tracer?
• It is not a Linux only tracer
• Can trace kernel and user space
• Tracing happens directly in kernel
• Very simple and powerful syntax
• Used for over a decade on production machines (Solaris)
• Lot of books/examples about the tool
• No need for compilation/additonal kernel module loading
2

Architecture
High-level overview
Workflow:
1. User writes a tracing script in D language
2. The script is compiled into intermediate bytecode (DIF)
3. The bytecode is sent to the kernel and verified for safety
4. Kernel enables probes and starts action processing andrecording to in-kernel buffers.
5. Userspace periodically extracts the buffers and processesrecords
3
Components
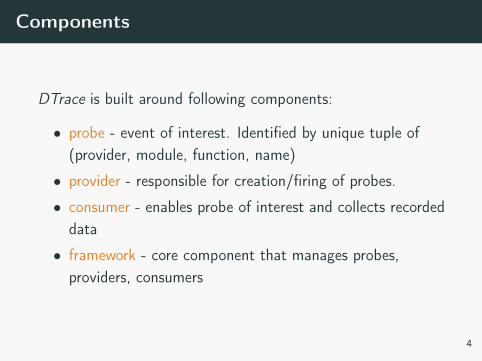
DTrace is built around following components:
• probe - event of interest. Identified by unique tuple of(provider, module, function, name)
• provider - responsible for creation/firing of probes.
• consumer - enables probe of interest and collects recordeddata
• framework - core component that manages probes,providers, consumers
4
DTrace providers
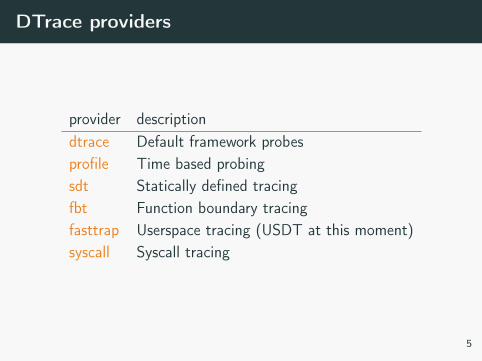
provider descriptiondtrace Default framework probesprofile Time based probingsdt Statically defined tracingfbt Function boundary tracingfasttrap Userspace tracing (USDT at this moment)syscall Syscall tracing
5
Subsystems
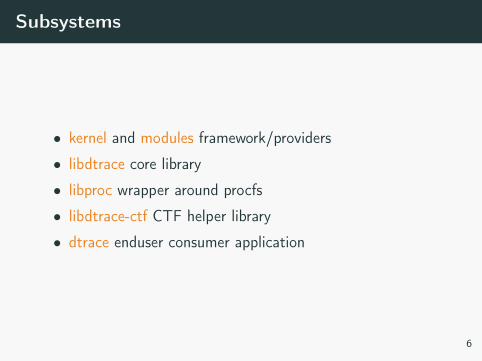
• kernel and modules framework/providers
• libdtrace core library
• libproc wrapper around procfs
• libdtrace-ctf CTF helper library
• dtrace enduser consumer application
6
Source code
For more details check the opensource project page:
https://oss.oracle.com/projects/DTrace/
7
How to use DTrace
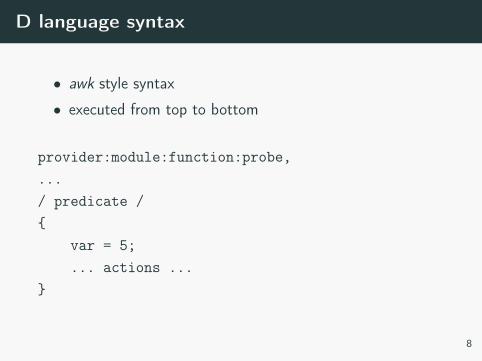
D language syntax
• awk style syntax
• executed from top to bottom
provider:module:function:probe,.../ predicate /{
var = 5;... actions ...
}
8
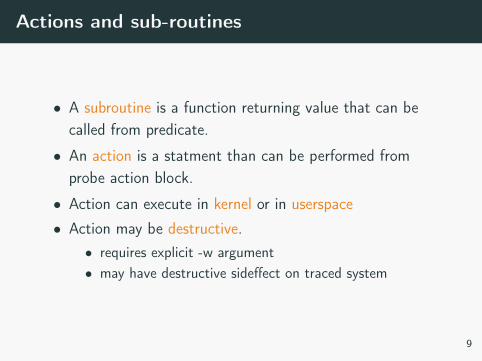
Actions and sub-routines
• A subroutine is a function returning value that can becalled from predicate.
• An action is a statment than can be performed fromprobe action block.
• Action can execute in kernel or in userspace
• Action may be destructive.• requires explicit -w argument• may have destructive sideffect on traced system
9
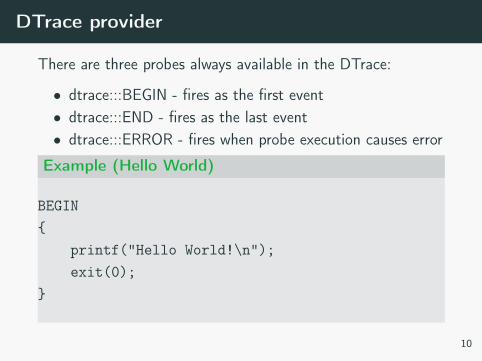
DTrace provider
There are three probes always available in the DTrace:
• dtrace:::BEGIN - fires as the first event• dtrace:::END - fires as the last event• dtrace:::ERROR - fires when probe execution causes error
Example (Hello World)
BEGIN{
printf("Hello World!\n");exit(0);
}
10
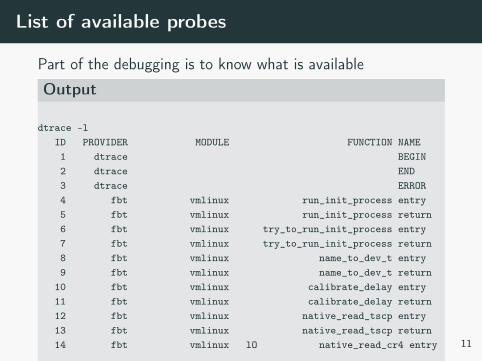
List of available probes
Part of the debugging is to know what is available
Output
dtrace -lID PROVIDER MODULE FUNCTION NAME1 dtrace BEGIN2 dtrace END3 dtrace ERROR4 fbt vmlinux run_init_process entry5 fbt vmlinux run_init_process return6 fbt vmlinux try_to_run_init_process entry7 fbt vmlinux try_to_run_init_process return8 fbt vmlinux name_to_dev_t entry9 fbt vmlinux name_to_dev_t return
10 fbt vmlinux calibrate_delay entry11 fbt vmlinux calibrate_delay return12 fbt vmlinux native_read_tscp entry13 fbt vmlinux native_read_tscp return14 fbt vmlinux lO native_read_cr4 entry
...11
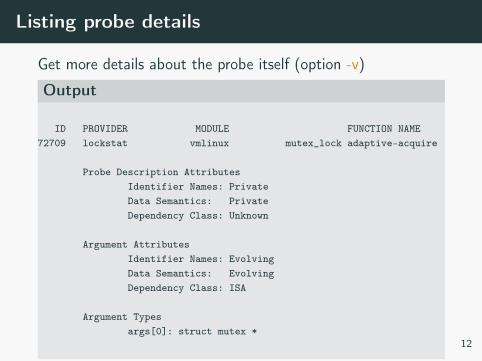
Listing probe details
Get more details about the probe itself (option -v)
Output
ID PROVIDER MODULE FUNCTION NAME72709 lockstat vmlinux mutex_lock adaptive-acquire
Probe Description AttributesIdentifier Names: PrivateData Semantics: PrivateDependency Class: Unknown
Argument AttributesIdentifier Names: EvolvingData Semantics: EvolvingDependency Class: ISA
Argument Typesargs[0]: struct mutex *
12
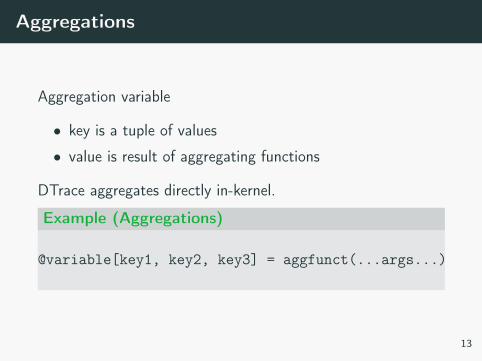
Aggregations
Aggregation variable
• key is a tuple of values
• value is result of aggregating functions
DTrace aggregates directly in-kernel.
Example (Aggregations)
@variable[key1, key2, key3] = aggfunct(...args...)
13
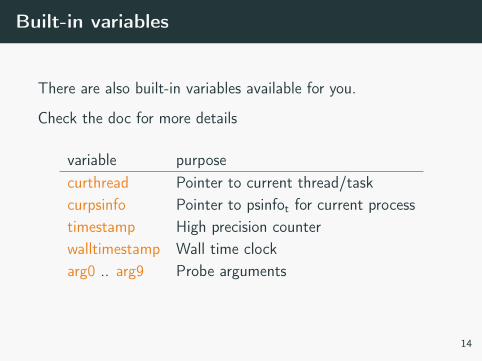
Built-in variables
There are also built-in variables available for you.
Check the doc for more details
variable purposecurthread Pointer to current thread/taskcurpsinfo Pointer to psinfot for current processtimestamp High precision counterwalltimestamp Wall time clockarg0 .. arg9 Probe arguments
14
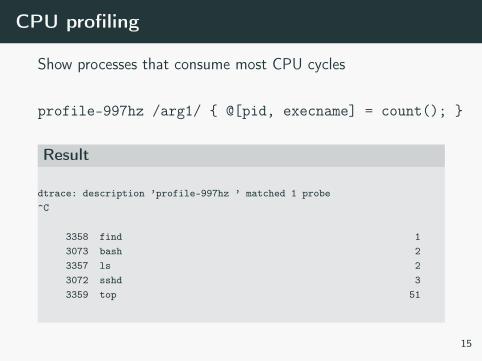
CPU profiling
Show processes that consume most CPU cycles
profile-997hz /arg1/ { @[pid, execname] = count(); }
Result
dtrace: description ’profile-997hz ’ matched 1 probe^C
3358 find 13073 bash 23357 ls 23072 sshd 33359 top 51
15
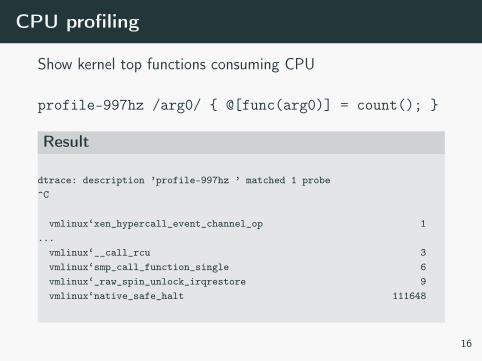
CPU profiling
Show kernel top functions consuming CPU
profile-997hz /arg0/ { @[func(arg0)] = count(); }
Result
dtrace: description ’profile-997hz ’ matched 1 probe^C
vmlinux‘xen_hypercall_event_channel_op 1...
vmlinux‘__call_rcu 3vmlinux‘smp_call_function_single 6vmlinux‘_raw_spin_unlock_irqrestore 9vmlinux‘native_safe_halt 111648
16
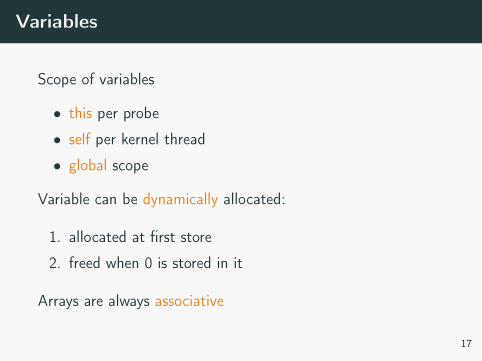
Variables
Scope of variables
• this per probe
• self per kernel thread
• global scope
Variable can be dynamically allocated:
1. allocated at first store
2. freed when 0 is stored in it
Arrays are always associative
17
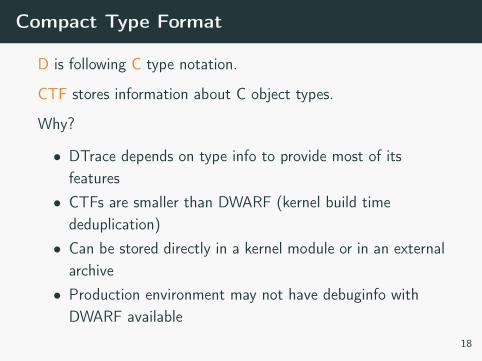
Compact Type Format
D is following C type notation.
CTF stores information about C object types.
Why?
• DTrace depends on type info to provide most of itsfeatures
• CTFs are smaller than DWARF (kernel build timededuplication)
• Can be stored directly in a kernel module or in an externalarchive
• Production environment may not have debuginfo withDWARF available
18
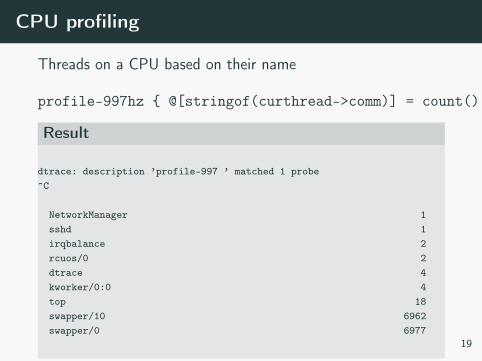
CPU profiling
Threads on a CPU based on their name
profile-997hz { @[stringof(curthread->comm)] = count(); }
Result
dtrace: description ’profile-997 ’ matched 1 probe^C
NetworkManager 1sshd 1irqbalance 2rcuos/0 2dtrace 4kworker/0:0 4top 18swapper/10 6962swapper/0 6977
19
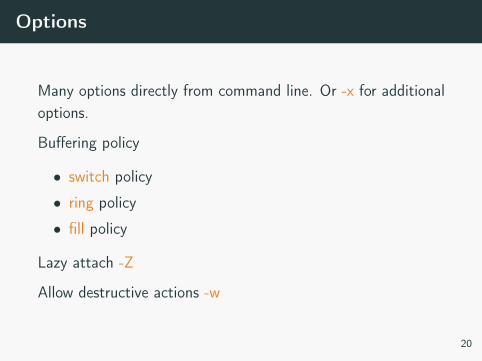
Options
Many options directly from command line. Or -x for additionaloptions.
Buffering policy
• switch policy
• ring policy
• fill policy
Lazy attach -Z
Allow destructive actions -w
20
Speculative tracing
Allows tracing of data but decide later to keep it or discard it.
1. Allocate alternate buffers with speculation subroutine
2. Switch output to alternate set of buffers by speculate
3. Later decide to keep data or not (commit or discard)
21
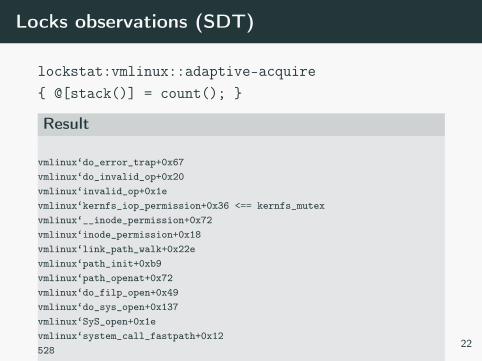
Locks observations (SDT)
lockstat:vmlinux::adaptive-acquire{ @[stack()] = count(); }
Result
vmlinux‘do_error_trap+0x67vmlinux‘do_invalid_op+0x20vmlinux‘invalid_op+0x1evmlinux‘kernfs_iop_permission+0x36 <== kernfs_mutexvmlinux‘__inode_permission+0x72vmlinux‘inode_permission+0x18vmlinux‘link_path_walk+0x22evmlinux‘path_init+0xb9vmlinux‘path_openat+0x72vmlinux‘do_filp_open+0x49vmlinux‘do_sys_open+0x137vmlinux‘SyS_open+0x1evmlinux‘system_call_fastpath+0x12528
22
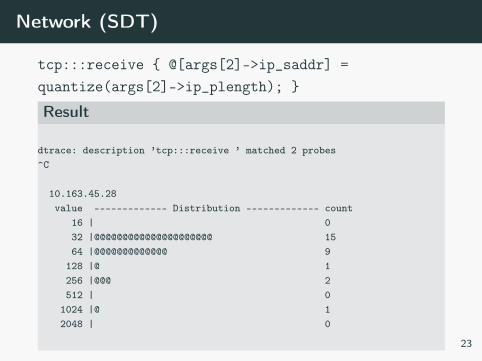
Network (SDT)
tcp:::receive { @[args[2]->ip_saddr] =quantize(args[2]->ip_plength); }
Result
dtrace: description ’tcp:::receive ’ matched 2 probes^C
10.163.45.28value ------------- Distribution ------------- count
16 | 032 |@@@@@@@@@@@@@@@@@@@@@ 1564 |@@@@@@@@@@@@@ 9
128 |@ 1256 |@@@ 2512 | 0
1024 |@ 12048 | 0
23
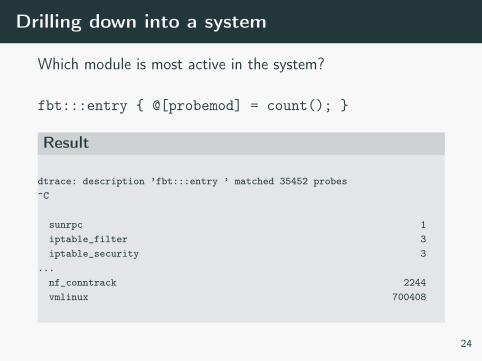
Drilling down into a system
Which module is most active in the system?
fbt:::entry { @[probemod] = count(); }
Result
dtrace: description ’fbt:::entry ’ matched 35452 probes^C
sunrpc 1iptable_filter 3iptable_security 3
...nf_conntrack 2244vmlinux 700408
24
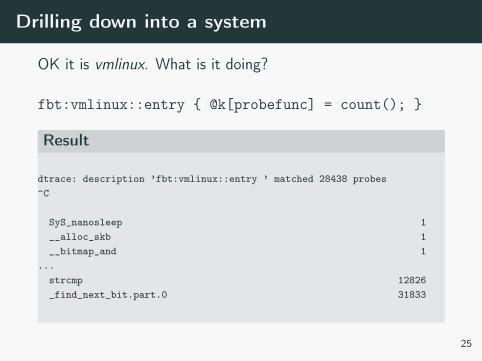
Drilling down into a system
OK it is vmlinux. What is it doing?
fbt:vmlinux::entry { @k[probefunc] = count(); }
Result
dtrace: description ’fbt:vmlinux::entry ’ matched 28438 probes^C
SyS_nanosleep 1__alloc_skb 1__bitmap_and 1
...strcmp 12826_find_next_bit.part.0 31833
25
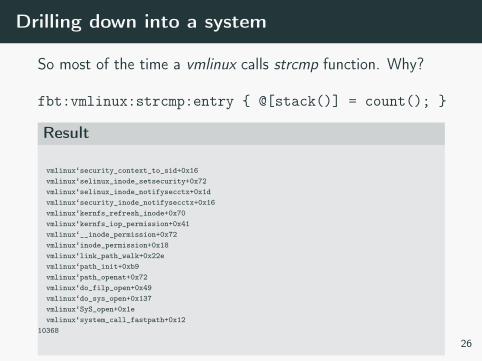
Drilling down into a system
So most of the time a vmlinux calls strcmp function. Why?
fbt:vmlinux:strcmp:entry { @[stack()] = count(); }
Result
vmlinux‘security_context_to_sid+0x16vmlinux‘selinux_inode_setsecurity+0x72vmlinux‘selinux_inode_notifysecctx+0x1dvmlinux‘security_inode_notifysecctx+0x16vmlinux‘kernfs_refresh_inode+0x70vmlinux‘kernfs_iop_permission+0x41vmlinux‘__inode_permission+0x72vmlinux‘inode_permission+0x18vmlinux‘link_path_walk+0x22evmlinux‘path_init+0xb9vmlinux‘path_openat+0x72vmlinux‘do_filp_open+0x49vmlinux‘do_sys_open+0x137vmlinux‘SyS_open+0x1evmlinux‘system_call_fastpath+0x12
10368
26
Drilling down into a system
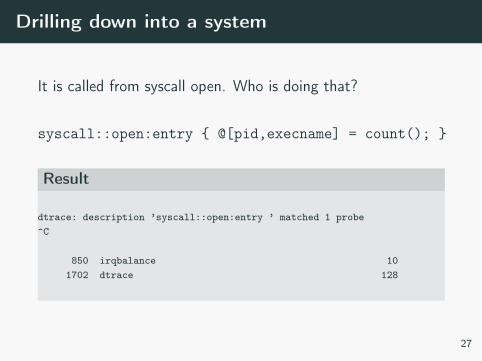
It is called from syscall open. Who is doing that?
syscall::open:entry { @[pid,execname] = count(); }
Result
dtrace: description ’syscall::open:entry ’ matched 1 probe^C
850 irqbalance 101702 dtrace 128
27
Drilling down into a system
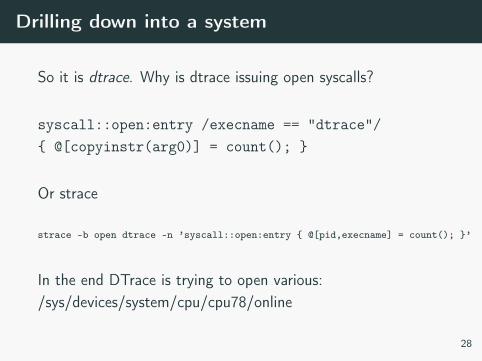
So it is dtrace. Why is dtrace issuing open syscalls?
syscall::open:entry /execname == "dtrace"/{ @[copyinstr(arg0)] = count(); }
Or strace
strace -b open dtrace -n ’syscall::open:entry { @[pid,execname] = count(); }’
In the end DTrace is trying to open various:/sys/devices/system/cpu/cpu78/online
28
Flow tracing (script)
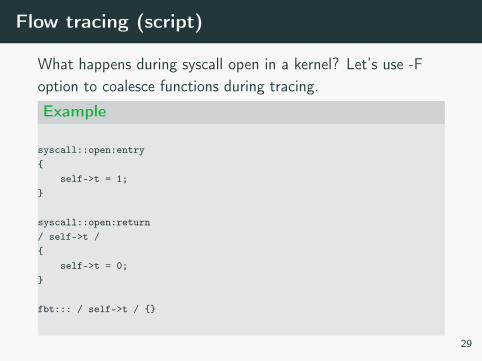
What happens during syscall open in a kernel? Let’s use -Foption to coalesce functions during tracing.
Example
syscall::open:entry{
self->t = 1;}
syscall::open:return/ self->t /{
self->t = 0;}
fbt::: / self->t / {}
29
Flow tracing (result)
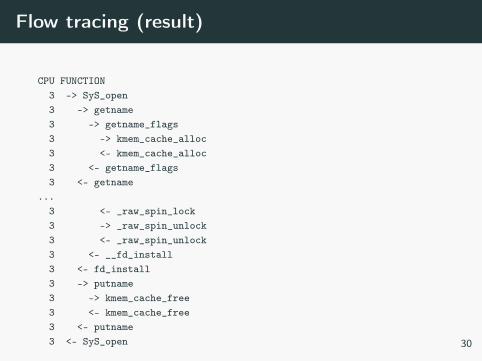
CPU FUNCTION3 -> SyS_open3 -> getname3 -> getname_flags3 -> kmem_cache_alloc3 <- kmem_cache_alloc3 <- getname_flags3 <- getname
...3 <- _raw_spin_lock3 -> _raw_spin_unlock3 <- _raw_spin_unlock3 <- __fd_install3 <- fd_install3 -> putname3 -> kmem_cache_free3 <- kmem_cache_free3 <- putname3 <- SyS_open 30
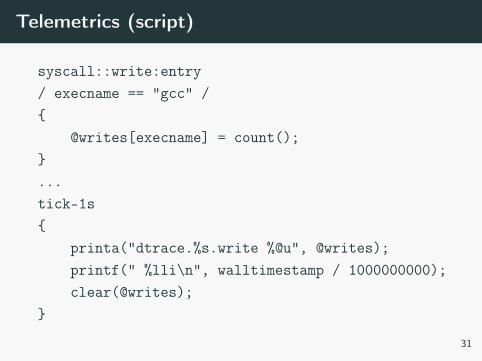
Telemetrics (script)
syscall::write:entry/ execname == "gcc" /{
@writes[execname] = count();}...tick-1s{
printa("dtrace.%s.write %@u", @writes);printf(" %lli\n", walltimestamp / 1000000000);clear(@writes);
}
31
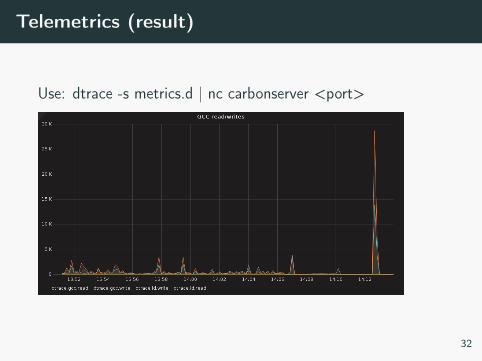
Telemetrics (result)
Use: dtrace -s metrics.d | nc carbonserver <port>
32

Thank you!
32