DSMC Simulations of Disturbance Torque to ISS during Airlock Depressurization · 2015-10-03 ·...
25
Abstract DSMC15: Kapaa, Kauai, Hawaii USA; September 13-17, 2015 DSMC Simulations of Disturbance Torque to ISS during Airlock Depressurization F. E. Lumpkin III and B. S. Stewart Applied Aeroscience and CFD Branch NASA Johnson Space Center Houston, TX 77058-3963 USA [email protected] The primary attitude control system on the International Space Station (ISS) is part of the United States On-orbit Segment (USOS) and uses Control Moment Gyroscopes (CMG). The secondary system is part of the Russian On- orbit Segment (RSOS) and uses a combination of gyroscopes and thrusters. Historically, events with significant disturbances such as the airlock depressurizations associated with extra-vehicular activity (EVA) have been performed using the RSOS attitude control system. This avoids excessive propulsive “de-saturations” of the CMGs. However, transfer of attitude control is labor intensive and requires significant propellant. Predictions employing NASA’s DSMC Analysis Code (DAC) of the disturbance torque to the ISS for depressurization of the Pirs airlock on the RSOS will be presented [1]. These predictions were performed to assess the feasibility of using USOS control during these events. The ISS Pirs airlock is vented using a device known as a “T-vent” as shown in the inset in figure 1. By orienting two equal streams of gas in opposite directions, this device is intended to have no propulsive effect. However, disturbance force and torque to the ISS do occur due to plume impingement. The disturbance torque resulting from the Pirs depressurization during EVAs is estimated by using a loosely coupled CFD/DSMC technique [2]. CFD is used to simulate the flow field in the nozzle and the near field plume. DSMC is used to simulate the remaining flow field using the CFD results to create an in flow boundary to the DSMC simulation. Due to the highly continuum nature of flow field near the T-vent, two loosely coupled DSMC domains are employed. An 88.2 cubic meter inner domain contains the Pirs airlock and the T-vent. Inner domain results are used to create an in flow boundary for an outer domain containing the remaining portions of the ISS. Several orientations of the ISS solar arrays and radiators have been investigated to find cases that result in minimal disturbance torque. Figure 1 shows surface pressure contours on the ISS and a plane of number density contours for a particular case. Figure 1. Surface pressure and flow field number density contours for depressurization of the ISS Pirs module. [1] G. J. LeBeau, “A parallel implementation of the direct simulation Monte Carlo method,” Computer Methods in Applied Mechanics and Engineering, 174 (3-4), 319-337 (1999). [2] F. E. Lumpkin III, P. C. Stewart, and G. J. LeBeau, “Enhanced Analyses of Plume Impingement During Shuttle-Mir Docking Using a Combined CFD and DSMC Methodology,” AIAA-96-1877, Reston, VA (1996). https://ntrs.nasa.gov/search.jsp?R=20150018577 2018-07-09T03:39:40+00:00Z
Transcript of DSMC Simulations of Disturbance Torque to ISS during Airlock Depressurization · 2015-10-03 ·...

Abstract DSMC15: Kapaa, Kauai, Hawaii USA; September 13-17, 2015
DSMC Simulations of Disturbance Torque to ISS during Airlock Depressurization
F. E. Lumpkin III and B. S. Stewart
Applied Aeroscience and CFD Branch NASA Johnson Space Center
Houston, TX 77058-3963 USA [email protected]
The primary attitude control system on the International Space Station (ISS) is part of the United States On-orbit Segment (USOS) and uses Control Moment Gyroscopes (CMG). The secondary system is part of the Russian On-orbit Segment (RSOS) and uses a combination of gyroscopes and thrusters. Historically, events with significant disturbances such as the airlock depressurizations associated with extra-vehicular activity (EVA) have been performed using the RSOS attitude control system. This avoids excessive propulsive “de-saturations” of the CMGs. However, transfer of attitude control is labor intensive and requires significant propellant. Predictions employing NASA’s DSMC Analysis Code (DAC) of the disturbance torque to the ISS for depressurization of the Pirs airlock on the RSOS will be presented [1]. These predictions were performed to assess the feasibility of using USOS control during these events. The ISS Pirs airlock is vented using a device known as a “T-vent” as shown in the inset in figure 1. By orienting two equal streams of gas in opposite directions, this device is intended to have no propulsive effect. However, disturbance force and torque to the ISS do occur due to plume impingement. The disturbance torque resulting from the Pirs depressurization during EVAs is estimated by using a loosely coupled CFD/DSMC technique [2]. CFD is used to simulate the flow field in the nozzle and the near field plume. DSMC is used to simulate the remaining flow field using the CFD results to create an in flow boundary to the DSMC simulation. Due to the highly continuum nature of flow field near the T-vent, two loosely coupled DSMC domains are employed. An 88.2 cubic meter inner domain contains the Pirs airlock and the T-vent. Inner domain results are used to create an in flow boundary for an outer domain containing the remaining portions of the ISS. Several orientations of the ISS solar arrays and radiators have been investigated to find cases that result in minimal disturbance torque. Figure 1 shows surface pressure contours on the ISS and a plane of number density contours for a particular case.
Figure 1. Surface pressure and flow field number density contours for depressurization of the ISS Pirs module. [1] G. J. LeBeau, “A parallel implementation of the direct simulation Monte Carlo method,” Computer Methods in
Applied Mechanics and Engineering, 174 (3-4), 319-337 (1999). [2] F. E. Lumpkin III, P. C. Stewart, and G. J. LeBeau, “Enhanced Analyses of Plume Impingement During
Shuttle-Mir Docking Using a Combined CFD and DSMC Methodology,” AIAA-96-1877, Reston, VA (1996).
https://ntrs.nasa.gov/search.jsp?R=20150018577 2018-07-09T03:39:40+00:00Z
DSMC Simulations of Disturbance Torques to ISS during Airlock Depressurization
Forrest E. Lumpkin III, Ph.D. & Benedicte D. Stewart, Ph.D.
Applied Aeroscience and CFD Branch NASA Johnson Space Center
DSMC 2015
September 15, 2015
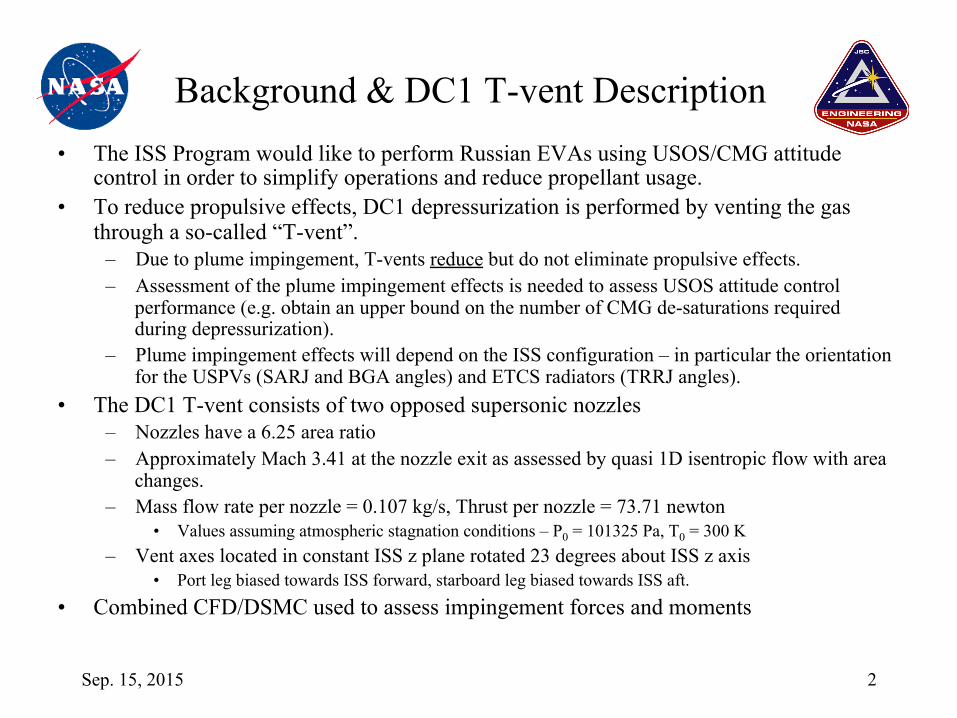
Background & DC1 T-vent Description • The ISS Program would like to perform Russian EVAs using USOS/CMG attitude
control in order to simplify operations and reduce propellant usage. • To reduce propulsive effects, DC1 depressurization is performed by venting the gas
through a so-called “T-vent”. – Due to plume impingement, T-vents reduce but do not eliminate propulsive effects. – Assessment of the plume impingement effects is needed to assess USOS attitude control
performance (e.g. obtain an upper bound on the number of CMG de-saturations required during depressurization).
– Plume impingement effects will depend on the ISS configuration – in particular the orientation for the USPVs (SARJ and BGA angles) and ETCS radiators (TRRJ angles).
• The DC1 T-vent consists of two opposed supersonic nozzles – Nozzles have a 6.25 area ratio – Approximately Mach 3.41 at the nozzle exit as assessed by quasi 1D isentropic flow with area
changes. – Mass flow rate per nozzle = 0.107 kg/s, Thrust per nozzle = 73.71 newton
• Values assuming atmospheric stagnation conditions – P0 = 101325 Pa, T0 = 300 K – Vent axes located in constant ISS z plane rotated 23 degrees about ISS z axis
• Port leg biased towards ISS forward, starboard leg biased towards ISS aft.
• Combined CFD/DSMC used to assess impingement forces and moments
Sep. 15, 2015 2

DC1 T-vent
Sep. 15, 2015 3

JSC DSMC Analysis Code (DAC97)
Sep. 15, 2015 4
• Developed as a general purpose DSMC code, but with the plume impingement problem as a key capability.
– Generalized surface with non-uniform inflow conditions (ρ, ū, Ttotal) • Allows a plume boundary with conditions interpolated from a CFD (or another DSMC)
simulation to be employed. • Assumes the in flow distributions are Maxwellian.
– Advanced features to handle flows with large density gradients • Two level Cartesian mesh allows for refinement in areas with higher densities. • Scaling of real to simulated molecule ratio (FNUM) allows for nearly uniform number of
simulated molecules per cell (goal ~10 for optimal performance and accuracy) • Time step scaling. • Nearest neighbor collision partner selection allows a slight relaxation of the mean free path cell
size requirement
• Other notes on DAC97 – Domain decomposition parallel implementation (MPI) with dynamic load balancing – Finite rate thermo-chemistry – Distribution 14 just released to users with significant enhancements
• Ported from Fortran 77 to Fortran 90 (eliminated need for Cray style pointers) • Scalar and parallel source files combined (improves source code maintainability) • Now capable of simulations in excess of 231-1 (2,147,483,647) simulated molecules

Simulation Strategy
• After some trial and error, the high fidelity simulation was divided into three regions – A nozzle and very near plume region simulated using traditional Navier-Stokes based CFD
• Single nozzle, axisymmetric flow using NASA Ames DPLR code. Grid size: 135,168 cells – A near DC1 region simulated using Direct Simulation Monte Carlo (DSMC)
• Region contained two “in-flow” boundary conditions based upon the results from the CFD sim. • “In-flow” boundaries were positioned upstream of any interactions with the DC1 • 4.2 by 5.0 by 4.2 meters domain contained the complete DC1 but not the rest of ISS • 434 million cells, 15.95 billion molecules (after two solution adaptions)
– A “rest of ISS” region simulated using Direct Simulation Monte Carlo (DSMC) • Region contained “in-flow” boundary conditions based upon the results near DC1 DSMC
simulation – typical domain size 60 by 102 by 74 meters – “In flow” boundary was attached to DC1 with an appropriate hole cut in the DC1 surface – The rest of the ISS was included with case appropriate angles for SARJ, BGA, & TRRJ angles
• Typically 116 million cells, 1.67 billion molecules – Advantage: only the “rest of ISS” needs to be re-run for each SARJ, BGA, TRRJ case.
• Simulation performed for atmospheric conditions in the DC1 at event initiation – P0 = 101325 Pa, T0 = 300 K – Resulting forces and moments time histories scaled by DC1 pressure for GN&C analysis
Sep. 15, 2015 5

Simulation Strategy: Illustration
Sep. 15, 2015 6

CFD Simulation Detailed Description
• NASA Ames DPLR CFD code employed • Gas modeled as single species, perfect gas air. • Axi-symmetric simulation • Assumed atmospheric stagnation conditions
– P0 = 101325 Pa, T0 = 300 K – Conservative as assumes no losses in the plumbing between the DC1 chamber and
nozzle entrance. – Four point matched finite volume grids
• Grid 1: 65 by 257, subsonic portion of nozzle • Grid 2: 193 by 257, supersonic portion of nozzle • Grid 3: 257 by 257, main plume • Grid 4: 17 by 257, plume back flow
– Mass flow rate = 0.10667 kg/s, Thrust = 73.293 newton • Assume that estimates for moments at this condition can be scaled linearly by
time history of the DC1 pressure to estimate the time dependent moments during the depressurization event(s).
Sep. 15, 2015 7

CFD grid
Sep. 15, 2015 8

CFD Results: Pressure Contours (Pascal)
Sep. 15, 2015 9

Inner DSMC Region Detailed Description
• 4.2 by 5.0 by 4.2 meters region containing DC1 and CFD derived in flow surfaces • CFD surfaces placed upstream of any interactions with DC1 as required by this
loosely coupled technique – Very near the 2×10²² number density value
• Very challenging problem due to the significant continuum nature of this region – Strong shock-shock interaction with DC1 geometry
• Number densities about an order of magnitude higher in this area than on CFD inflow surface – Significant adaption required to remove simulation artifacts due to under resolved cell
network • Final simulation statistics
– Target mean free path resolution: 8.0 MFP/cell • After two adaptions
– 434 million cells, 15.95 billion molecules – Worst case cell resolution: 34.5 MFP/cell (due to small movement of shock-shock
structure between adaptations)
Sep. 15, 2015 10

CFD Result Inner DSMC region boundary determination
Sep. 15, 2015 11

Inner DSMC Region In flow boundaries and DC1
Sep. 15, 2015 12

Inner DSMC Region Number Density Contours
Sep. 15, 2015 13

Inner DSMC Region Detail: Shock-Shock Interaction
Sep. 15, 2015 14

Inner DSMC Region Surface Pressure Contours on DC1
Sep. 15, 2015 15

Outer DSMC Region Detailed Description
• A “rest of ISS” region typically about 60 by 102 by 74 meters in size • In flow boundary attached to DC1
– Hole cut in DC1 to attach in-flow boundary • Low density on in flow surface • Outward flow orientation on in flow surface
– In-flow boundary reused for each “rest of ISS” case considered • Several cases of ISS configuration considered
– Varying SARJ, BGA, and TRRJ angles has significant effect on plume induced forces and moments
• Five cases presented: Cases 00, 01, 02, 07, 08 • Significantly less resources required
– Target MFP resolution: 2.5 MFP/Cell – Typically 116 million cells, 1.67 billion molecules – Worst case cell resolution: 15.25 MFP/cell
Sep. 15, 2015 16

Outer DSMC Region In flow boundary, Mean free path contours
Sep. 15, 2015 17

Case Matrix (all angles in degrees)
Sep. 15, 2015 18
Case 00 01 02 07 08
Port SARJ 0.0 270.0 270.0 270.0 270.0
2A BGA 0.0 35.0 -57.0 35.0 35.0
4A BGA 0.0 -35.0 -35.0 -35.0 -35.0
4B BGA 0.0 25.0 -66.0 25.0 25.0
2B BGA 0.0 -25.0 -25.0 -25.0 -25.0
Stbd SARJ 0.0 90.0 0.0 90.0 90.0
3A BGA 0.0 -35.0 0.0 -35.0 -35.0
1A BGA 0.0 35.0 0.0 35.0 35.0
1B BGA 0.0 -25.0 0.0 -25.0 -25.0
3B BGA 0.0 25.0 0.0 25.0 25.0
Port TRRJ 90.0 -40.0 27.3 27.3 27.3
Stbd TRRJ 90.0 25.0 90.0 25.0 90.0

Case 01 (Nominal)
Sep. 15, 2015 19

Case 08 (Recommended)
Sep. 15, 2015 20

Summary Results
Case Fx (N) Fy (N) Fz (N) Mx (N-m) My (N-m) Mz (N-m) MRSS (N-m)
00 -‐1.899 -‐20.392 -‐6.938 35.256 -‐139.638 332.507 362.357
01 11.136 -‐29.801 -‐17.251 358.884 -‐121.382 596.805 706.900
02 2.377 -‐2.914 -‐5.425 37.964 -‐129.304 2.827 134.792
07 11.104 -‐21.840 -‐6.174 142.166 -‐31.224 511.848 532.142
08 11.261 -‐18.787 -‐4.504 167.441 -‐3.574 457.504 487.195
Sep. 15, 2015 21

Case 01 - Detailed Results (Moments about ISS Center of Mass)
Component Fx (N) Fy (N) Fz (N) Mx (N-m) My (N-m) Mz (N-m)
DC1 -‐6.2920 -‐4.2977 -‐0.6316 18.92170 -‐41.76330 90.68420
ISS 4.8328 -‐1.0014 -‐1.4889 13.88010 -‐10.20550 48.56290
S. ETCS 0.2235 1.6502 -‐2.3515 -‐34.30960 -‐40.55680 -‐31.69610
P. ETCS 1.9239 -‐11.9524 -‐13.1666 161.42900 -‐168.01000 177.83800
SM Port SA -‐0.1312 -‐0.0852 -‐0.1014 0.92074 -‐2.59169 0.99535
SM Stbd SA -‐1.1361 0.7184 0.3039 2.00700 5.84919 -‐6.84133
Stbd USPV 0.8842 1.2579 0.0193 -‐4.17968 3.87634 -‐34.57710
Port USPV 10.8306 -‐16.0907 0.1652 200.21500 132.02000 351.83900
Total 11.1356 -‐29.8010 -‐17.2514 358.88426 -‐121.38176 596.80492
Sep. 15, 2015 22

Case 08 - Detailed Results (Moments about ISS Center of Mass)
Component Fx (N) Fy (N) Fz (N) Mx (N-m) My (N-m) Mz (N-m)
DC1 -‐6.292 -‐4.298 -‐0.632 18.922 -‐41.763 90.684
ISS 4.539 -‐1.948 -‐1.800 14.704 -‐12.665 49.303
Progress -‐0.078 -‐0.001 0.111 0.084 1.600 0.076
S. ETCS 0.325 4.911 -‐0.695 -‐7.380 -‐12.647 -‐90.307
P. ETCS 0.772 -‐1.367 -‐1.000 9.650 -‐13.044 28.241
SM Port SA -‐0.128 -‐0.086 -‐0.104 0.942 -‐2.644 1.059
SM Stbd SA -‐1.134 0.717 0.303 2.003 5.832 -‐6.832
S4S6 Truss 0.048 0.021 -‐0.043 -‐1.548 0.024 -‐1.759
3A1B USPV 0.569 0.841 0.166 -‐4.819 7.363 -‐22.324
1A3B USPV 0.129 0.186 -‐0.090 -‐0.159 -‐2.359 -‐5.137
P4P6 Truss 1.644 -‐0.846 -‐0.901 28.429 -‐0.737 55.261
2A4B USPV 8.516 -‐13.262 1.461 121.347 108.246 274.356
4A2B USPV 2.352 -‐3.653 -‐1.280 -‐14.734 -‐40.778 84.882
Total 11.261 -‐18.787 -‐4.504 167.441 -‐3.574 457.504
Sep. 15, 2015 23

Conclusions & Flight Results • Challenging high fidelity simulation of plume impingement to ISS for a Russian
EVA depressurization from DC1/Pirs has been accomplished. – Resulted in enhancements to JSC’s DSMC code
• Ability to perform problems with more than 231-1 molecules • Ability to enhance refinement only near inflow surfaces (useful for initial DSMC run) • Found bug resulting in problems with more than about 8 million Level-I cells to fail at times
• ISS radiator and array orientations have a significant effect on the resulting plume impingement forces and moments.
– As much as a factor of ~5.25 between Case 01 (nominal) and Case 02 (optimized) – With additional analysis, it could be possible to find an ISS configuration which results in
zero plume impingement induced torques. • Results for recommended case (Case 08) were analyzed by GN&C team
– Number of CMG desaturations predicted was from 7-15 depending on GN&C assumptions
• EVA was performed on Aug. 10, 2015 – Program allowed modification of nominal radiator settings but not nominal array settings – Radiator settings were near those recommended – Eight CMG desaturations occurred compared to GN&C preference of <15.
Sep. 15, 2015 24