DRYING KINETICS AND THE EFFECTS OF DRYING METHODS ON ...
86
DRYING KINETICS AND THE EFFECTS OF DRYING METHODS ON QUALITY (CBD, TERPENES AND COLOR) OF HEMP (Cannabis sativa L.) BUDS By Sai Kiran Reddy Challa Submitted in partial fulfilment of the requirements for the degree of Master of Science at Dalhousie University Halifax, Nova Scotia March 2020 © Copyright by Sai Kiran Reddy Challa, 2020.
Transcript of DRYING KINETICS AND THE EFFECTS OF DRYING METHODS ON ...
DRYING KINETICS AND THE EFFECTS OF DRYING
METHODS ON QUALITY (CBD, TERPENES AND COLOR) OF
HEMP (Cannabis sativa L.) BUDS
By
Sai Kiran Reddy Challa
Submitted in partial fulfilment of the requirements
for the degree of Master of Science
at
Dalhousie University
Halifax, Nova Scotia
March 2020
© Copyright by Sai Kiran Reddy Challa, 2020.
ii
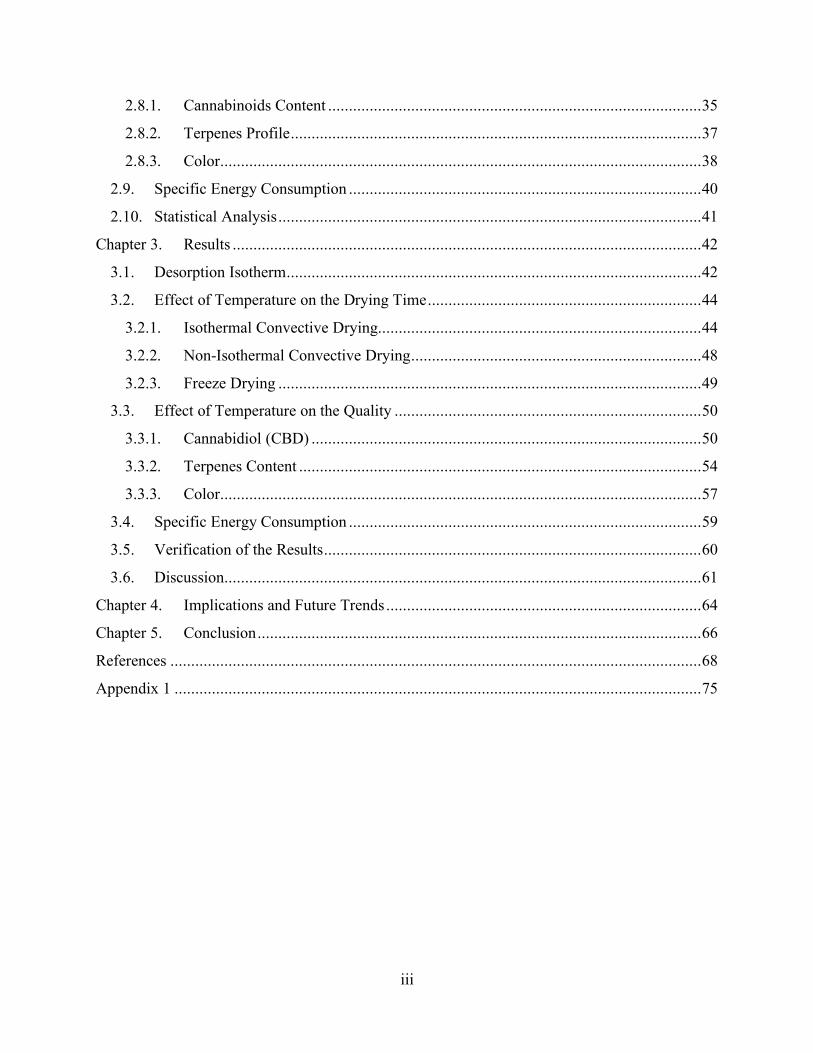
Table of Contents List of Tables ............................................................................................................................ iv
List of Figures .............................................................................................................................v
Abstract ................................................................................................................................... vii
List of Abbreviations and Symbols Used ................................................................................. viii
Acknowledgements .....................................................................................................................x
Chapter 1. Introduction ...........................................................................................................1
1.1. State of Hemp Industry- Products, Uses and Applications .............................................1
1.2. Hemp Chemistry ...........................................................................................................5
1.3. Location of Cannabinoids in Plant .................................................................................8
1.4. Physiological Significance of Cannabinoids in Plants ....................................................9
1.5. Postharvest Processing ................................................................................................ 10
1.5.1. Equilibrium Moisture Content (EMC) and Water Activity (aw) ............................ 10
1.5.2. Moisture Sorption Isotherms ................................................................................ 12
1.5.3. Industrial Drying of Hemp ................................................................................... 14
1.5.4. Relevant Drying Technologies ............................................................................. 16
1.6. Problem Statement ...................................................................................................... 20
1.7. Objectives ................................................................................................................... 21
Chapter 2. Materials and Methods ......................................................................................... 22
2.1. Experimental Setup ..................................................................................................... 22
2.2. Samples Preparation .................................................................................................... 23
2.3. Desorption Isotherm .................................................................................................... 24
2.4. Drying Experiments .................................................................................................... 27
2.4.1. Isothermal Convective Drying.............................................................................. 27
2.4.2. Non-Isothermal (Stepwise) Drying ....................................................................... 29
2.4.3. Freeze Drying ...................................................................................................... 30
2.5. Mathematical Modelling of Drying Kinetics ............................................................... 31
2.6. Effective Moisture Diffusivity (Deff) ............................................................................ 33
2.7. Activation Energy (Ea) ................................................................................................ 34
2.8. Quality Analysis ......................................................................................................... 35
iii
2.8.1. Cannabinoids Content .......................................................................................... 35
2.8.2. Terpenes Profile ................................................................................................... 37
2.8.3. Color.................................................................................................................... 38
2.9. Specific Energy Consumption ..................................................................................... 40
2.10. Statistical Analysis ...................................................................................................... 41
Chapter 3. Results ................................................................................................................. 42
3.1. Desorption Isotherm .................................................................................................... 42
3.2. Effect of Temperature on the Drying Time .................................................................. 44
3.2.1. Isothermal Convective Drying.............................................................................. 44
3.2.2. Non-Isothermal Convective Drying ...................................................................... 48
3.2.3. Freeze Drying ...................................................................................................... 49
3.3. Effect of Temperature on the Quality .......................................................................... 50
3.3.1. Cannabidiol (CBD) .............................................................................................. 50
3.3.2. Terpenes Content ................................................................................................. 54
3.3.3. Color.................................................................................................................... 57
3.4. Specific Energy Consumption ..................................................................................... 59
3.5. Verification of the Results ........................................................................................... 60
3.6. Discussion................................................................................................................... 61
Chapter 4. Implications and Future Trends ............................................................................ 64
Chapter 5. Conclusion ........................................................................................................... 66
References ................................................................................................................................ 68
Appendix 1 ............................................................................................................................... 75
iv
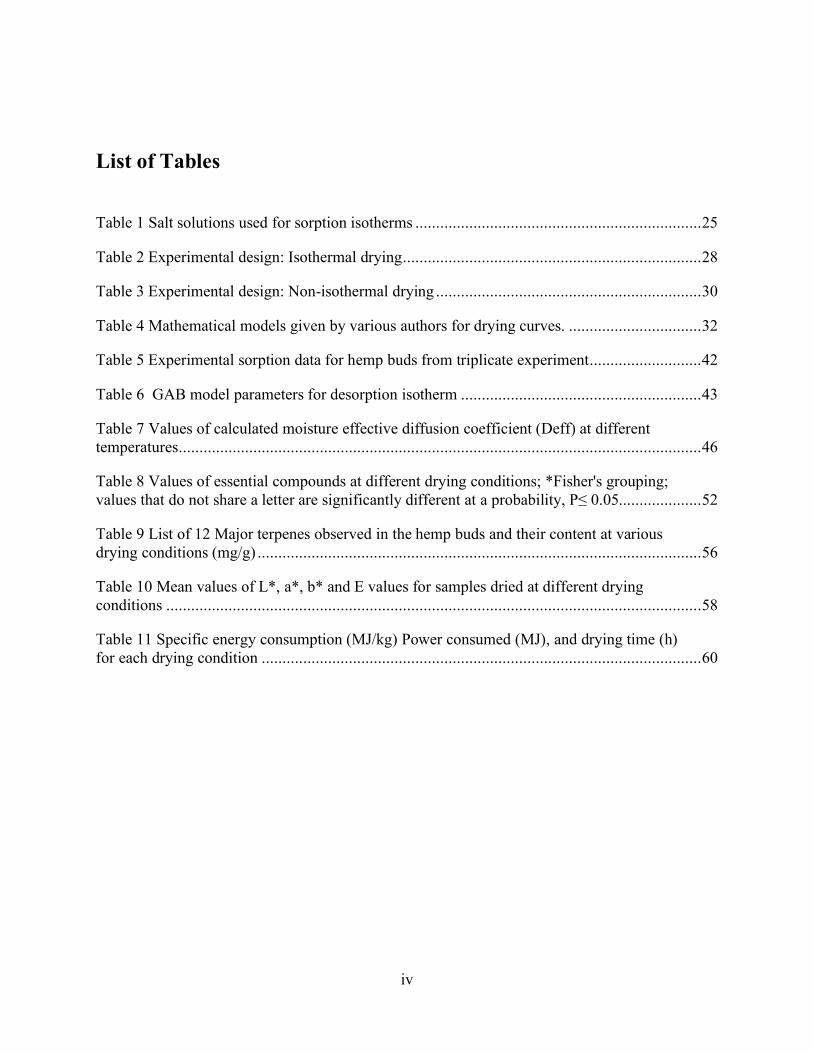
List of Tables
Table 1 Salt solutions used for sorption isotherms ..................................................................... 25
Table 2 Experimental design: Isothermal drying ........................................................................ 28
Table 3 Experimental design: Non-isothermal drying ................................................................ 30
Table 4 Mathematical models given by various authors for drying curves. ................................ 32
Table 5 Experimental sorption data for hemp buds from triplicate experiment ........................... 42
Table 6 GAB model parameters for desorption isotherm .......................................................... 43
Table 7 Values of calculated moisture effective diffusion coefficient (Deff) at different
temperatures .............................................................................................................................. 46
Table 8 Values of essential compounds at different drying conditions; *Fisher's grouping;
values that do not share a letter are significantly different at a probability, P≤ 0.05.................... 52
Table 9 List of 12 Major terpenes observed in the hemp buds and their content at various
drying conditions (mg/g) ........................................................................................................... 56
Table 10 Mean values of L*, a*, b* and E values for samples dried at different drying
conditions ................................................................................................................................. 58
Table 11 Specific energy consumption (MJ/kg) Power consumed (MJ), and drying time (h)
for each drying condition .......................................................................................................... 60
v
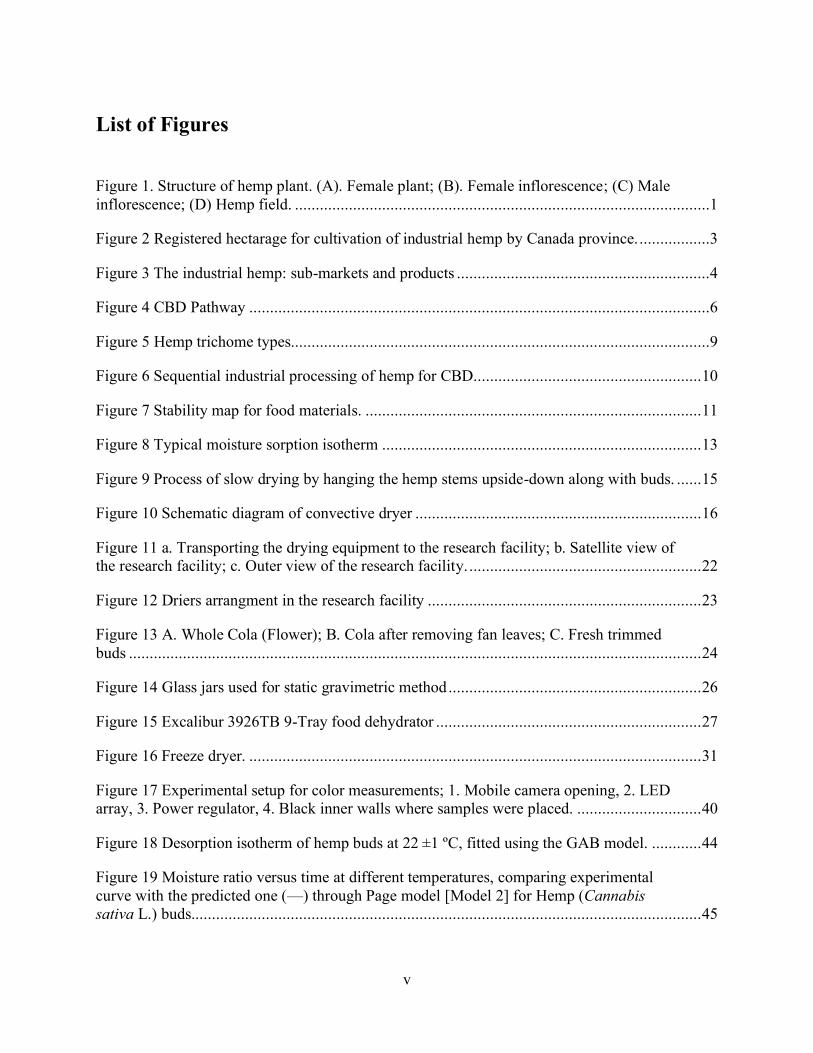
List of Figures
Figure 1. Structure of hemp plant. (A). Female plant; (B). Female inflorescence; (C) Male
inflorescence; (D) Hemp field. ....................................................................................................1
Figure 2 Registered hectarage for cultivation of industrial hemp by Canada province. .................3
Figure 3 The industrial hemp: sub-markets and products .............................................................4
Figure 4 CBD Pathway ...............................................................................................................6
Figure 5 Hemp trichome types.....................................................................................................9
Figure 6 Sequential industrial processing of hemp for CBD....................................................... 10
Figure 7 Stability map for food materials. ................................................................................. 11
Figure 8 Typical moisture sorption isotherm ............................................................................. 13
Figure 9 Process of slow drying by hanging the hemp stems upside-down along with buds. ...... 15
Figure 10 Schematic diagram of convective dryer ..................................................................... 16
Figure 11 a. Transporting the drying equipment to the research facility; b. Satellite view of
the research facility; c. Outer view of the research facility. ........................................................ 22
Figure 12 Driers arrangment in the research facility .................................................................. 23
Figure 13 A. Whole Cola (Flower); B. Cola after removing fan leaves; C. Fresh trimmed
buds .......................................................................................................................................... 24
Figure 14 Glass jars used for static gravimetric method ............................................................. 26
Figure 15 Excalibur 3926TB 9-Tray food dehydrator ................................................................ 27
Figure 16 Freeze dryer. ............................................................................................................. 31
Figure 17 Experimental setup for color measurements; 1. Mobile camera opening, 2. LED
array, 3. Power regulator, 4. Black inner walls where samples were placed. .............................. 40
Figure 18 Desorption isotherm of hemp buds at 22 ±1 ºC, fitted using the GAB model. ............ 44
Figure 19 Moisture ratio versus time at different temperatures, comparing experimental
curve with the predicted one (—) through Page model [Model 2] for Hemp (Cannabis
sativa L.) buds........................................................................................................................... 45
vi
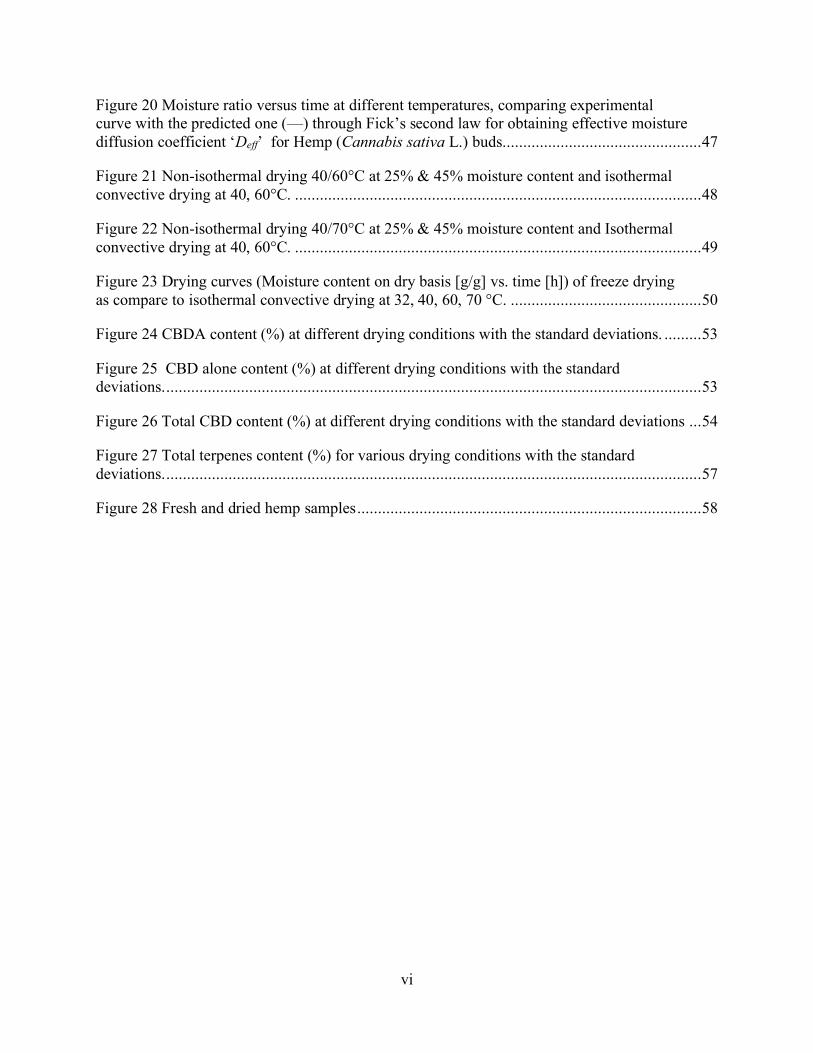
Figure 20 Moisture ratio versus time at different temperatures, comparing experimental
curve with the predicted one (—) through Fick’s second law for obtaining effective moisture
diffusion coefficient ‘Deff’ for Hemp (Cannabis sativa L.) buds. ............................................... 47
Figure 21 Non-isothermal drying 40/60°C at 25% & 45% moisture content and isothermal
convective drying at 40, 60°C. .................................................................................................. 48
Figure 22 Non-isothermal drying 40/70°C at 25% & 45% moisture content and Isothermal
convective drying at 40, 60°C. .................................................................................................. 49
Figure 23 Drying curves (Moisture content on dry basis [g/g] vs. time [h]) of freeze drying
as compare to isothermal convective drying at 32, 40, 60, 70 °C. .............................................. 50
Figure 24 CBDA content (%) at different drying conditions with the standard deviations. ......... 53
Figure 25 CBD alone content (%) at different drying conditions with the standard
deviations. ................................................................................................................................. 53
Figure 26 Total CBD content (%) at different drying conditions with the standard deviations ... 54
Figure 27 Total terpenes content (%) for various drying conditions with the standard
deviations. ................................................................................................................................. 57
Figure 28 Fresh and dried hemp samples ................................................................................... 58
vii
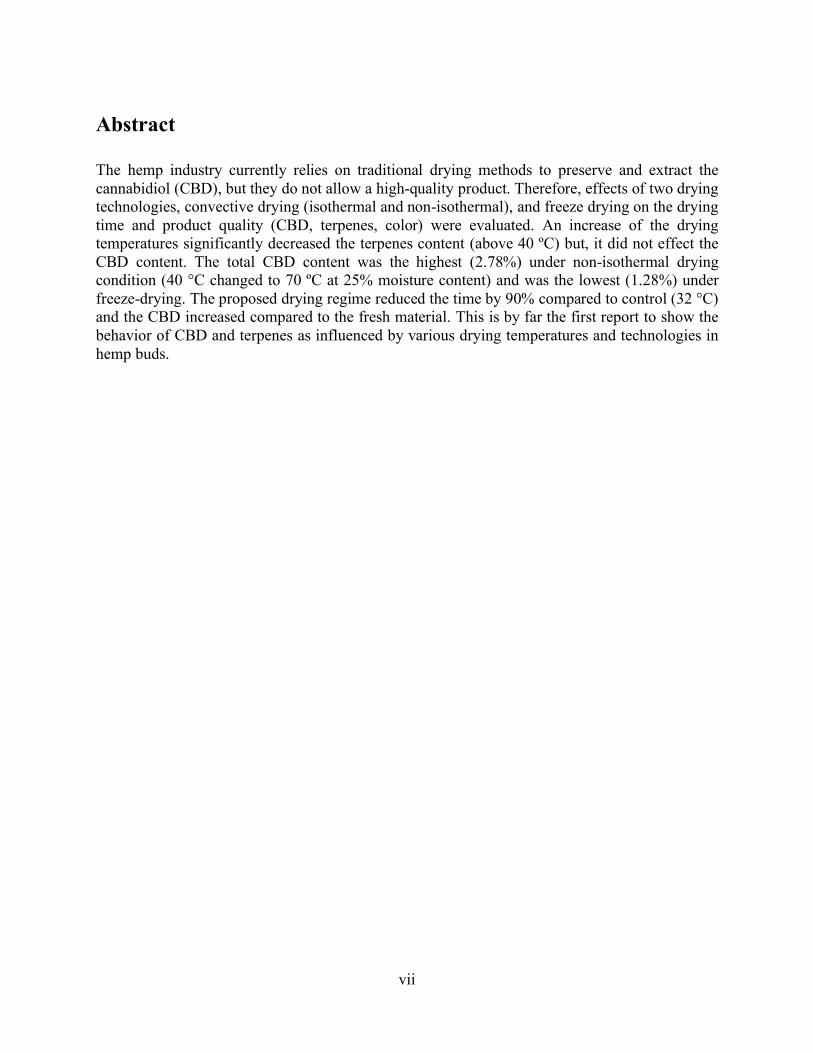
Abstract
The hemp industry currently relies on traditional drying methods to preserve and extract the
cannabidiol (CBD), but they do not allow a high-quality product. Therefore, effects of two drying
technologies, convective drying (isothermal and non-isothermal), and freeze drying on the drying
time and product quality (CBD, terpenes, color) were evaluated. An increase of the drying
temperatures significantly decreased the terpenes content (above 40 ºC) but, it did not effect the
CBD content. The total CBD content was the highest (2.78%) under non-isothermal drying
condition (40 °C changed to 70 ºC at 25% moisture content) and was the lowest (1.28%) under
freeze-drying. The proposed drying regime reduced the time by 90% compared to control (32 °C)
and the CBD increased compared to the fresh material. This is by far the first report to show the
behavior of CBD and terpenes as influenced by various drying temperatures and technologies in
hemp buds.
viii
List of Abbreviations and Symbols Used
aw Water activity
CBCA Cannabichromenic acid
CBD Cannabidiol
CBDA Cannabidiolic acid
CBGA Cannabigerolic acid
CRD Completely randomized design
d.b. Dry basis (gram H2O/gram dry solids)
Deff Effective moisture diffusion coefficient (m2/s)
DOX Deoxyxylulose pathway
Ea Activation energy (kJ/mol)
EHD Electrohydrodynamic drying
EMC Equilibrium moisture content
ΔE Total color difference
FD Freeze drying
FDA Food and Drug Administration
GAB Guggenheim-Anderson-de Boer model
GLC Gas-liquid Chromatography
GOT Geranylpyrophosphate:olivetolate transferase
GPP Geranylpyrophosphate
HPLC High Performance-Liquid Chromatography
k Drying rate constant
ix
K Kelvin
MC Moisture content
MR Moisture ratio
OA Olivetolic acid
PPO Polyphenol oxidase
PUFAs Polyunsaturated fatty acids
R Universal gas constant (J/mol/K)
�̅�2 Adjusted coefficient of determination
RH Relative humidity
RMSE Root mean square error
THC Δ9-tetrahydrocannabinol
w.b. Wet basis (%)
X Moisture content (% or g/g)
x
Acknowledgements
This work was supported by Mitacs through the Mitacs Accelerate program (grant IT 16241). I
would like to thank the Truro Cannabis Co. for the financial support and for providing the
opportunity to do this research.
I would like to express my deep gratitude to Dr. Alex Martynenko my research supervisor for
accepting and encouraging me to pursue this master’s program and for offering his support and
guidance throughout my journey in this university. I feel immense privileged to work with him.
His contributions are sincerely appreciated and gratefully acknowledged.
I would like to specially thank Dr. Nrusimha-Nath Misra for his patient guidance, encouragement
and useful critics of this project. His knowledge, support and willingness to help made this project
to complete successfully on time.
I would like to thank Dr. Rajasekaran Lada for helping me with the term papers, which greatly
helped in building my thesis. His useful critics, guidance and immense support towards the project
is indeed appreciated. Also, I would like to thank Dr. Peter Havard, for his contribution, support
and useful critics to this project.
To all relatives, friends and others who, in one way or another, shared their support, thank you.
This thesis is dedicated to all.
1
Chapter 1. Introduction
1.1. State of Hemp Industry- Products, Uses and Applications
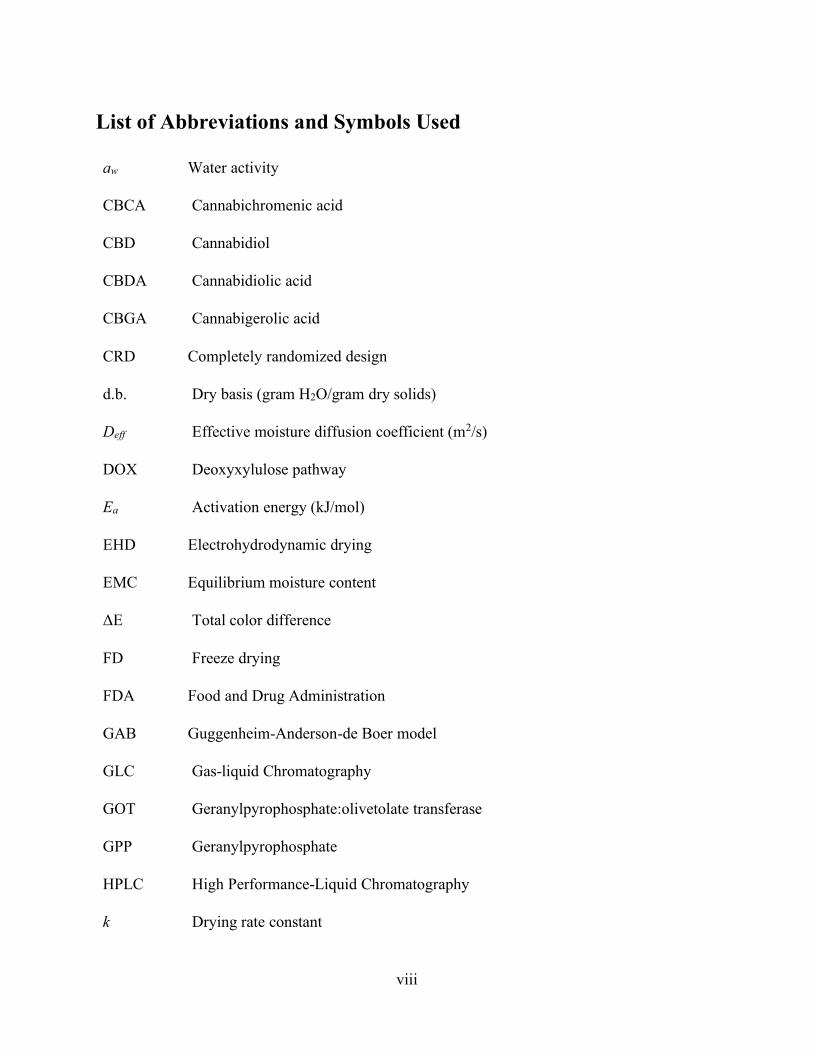
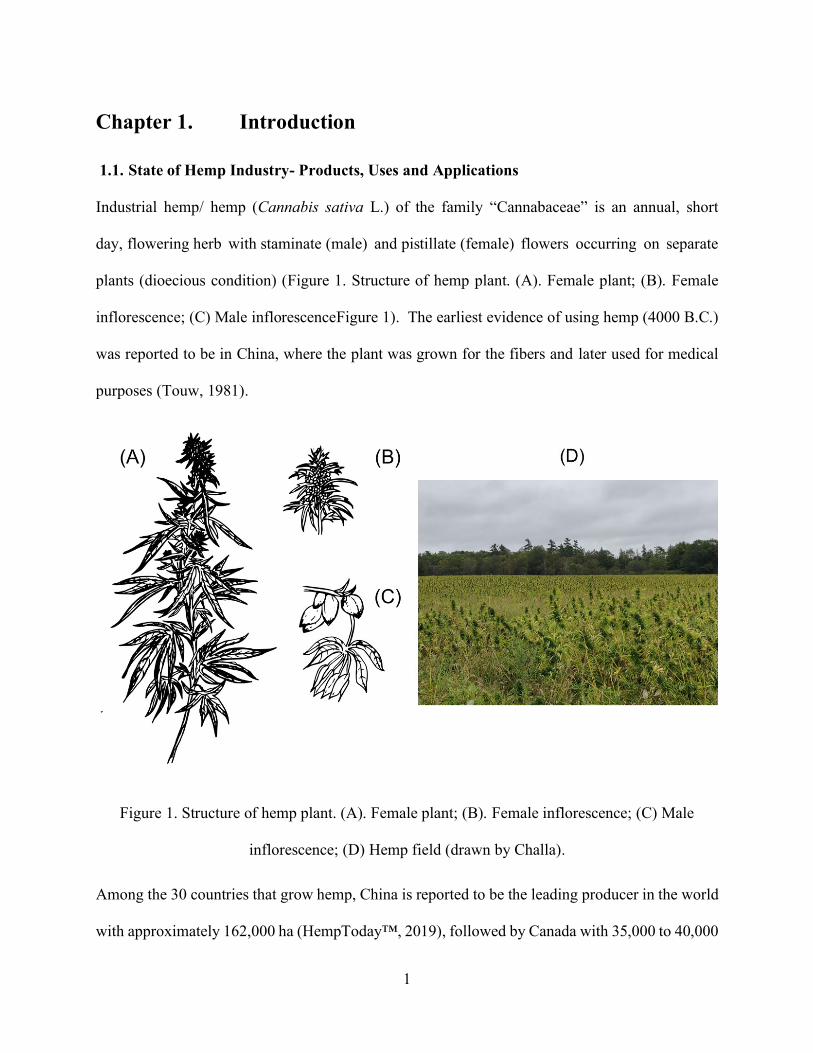
Industrial hemp/ hemp (Cannabis sativa L.) of the family “Cannabaceae” is an annual, short
day, flowering herb with staminate (male) and pistillate (female) flowers occurring on separate
plants (dioecious condition) (Figure 1. Structure of hemp plant. (A). Female plant; (B). Female
inflorescence; (C) Male inflorescenceFigure 1). The earliest evidence of using hemp (4000 B.C.)
was reported to be in China, where the plant was grown for the fibers and later used for medical
purposes (Touw, 1981).
Figure 1. Structure of hemp plant. (A). Female plant; (B). Female inflorescence; (C) Male
inflorescence; (D) Hemp field (drawn by Challa).
Among the 30 countries that grow hemp, China is reported to be the leading producer in the world
with approximately 162,000 ha (HempToday™, 2019), followed by Canada with 35,000 to 40,000
2
ha as per 2019 data (HealthCanada, 2019). USA with 31,000 ha, has been estimated to have
quadrupled to 206,900 ha in 2020 with 455% increase in the cultivation compared to the 2018
census (Angell, 2019), signaling high interest and investment in the hemp market. France, the
Europe’s leading grower of hemp, has about 17,000 ha under hemp, making it the fourth leading
nation (HempToday™, 2019). Effective cannabis legalization and the shift of hemp production
specifically for the cannabidiol (CBD) products, a massive increase in the cultivation of hemp and
cannabis in Canada was observed. About 80% of the total hemp in the U.S. and majority of the
hemp in Canada was grown for the CBD in the year 2019 (Arnason, 2019; AssociatedPress, 2020).
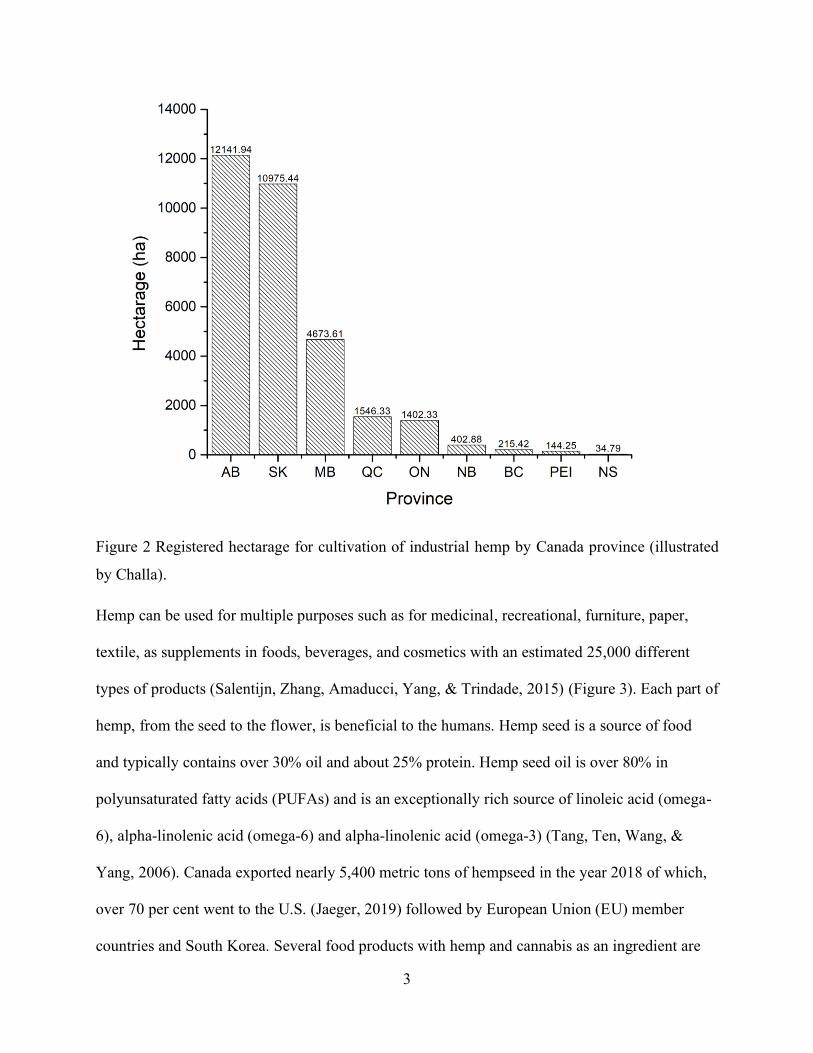
With a total coverage of 12,142 ha, Alberta province was reported to be the leading cultivator of
hemp in Canada followed by Saskatchewan with 10,975 ha (Figure 2) (HealthCanada, 2019).
Annual sales of CBD from hemp could potentially be larger than those of marijuana, because of
the large number of products in which it can be used. The market in North America is expected to
grow with annual growth rate of 16.9% from 2018 to 2025 due to increasing CBD oil and fiber-
based products (Craig Giammona, 2019).
3
Figure 2 Registered hectarage for cultivation of industrial hemp by Canada province (illustrated
by Challa).
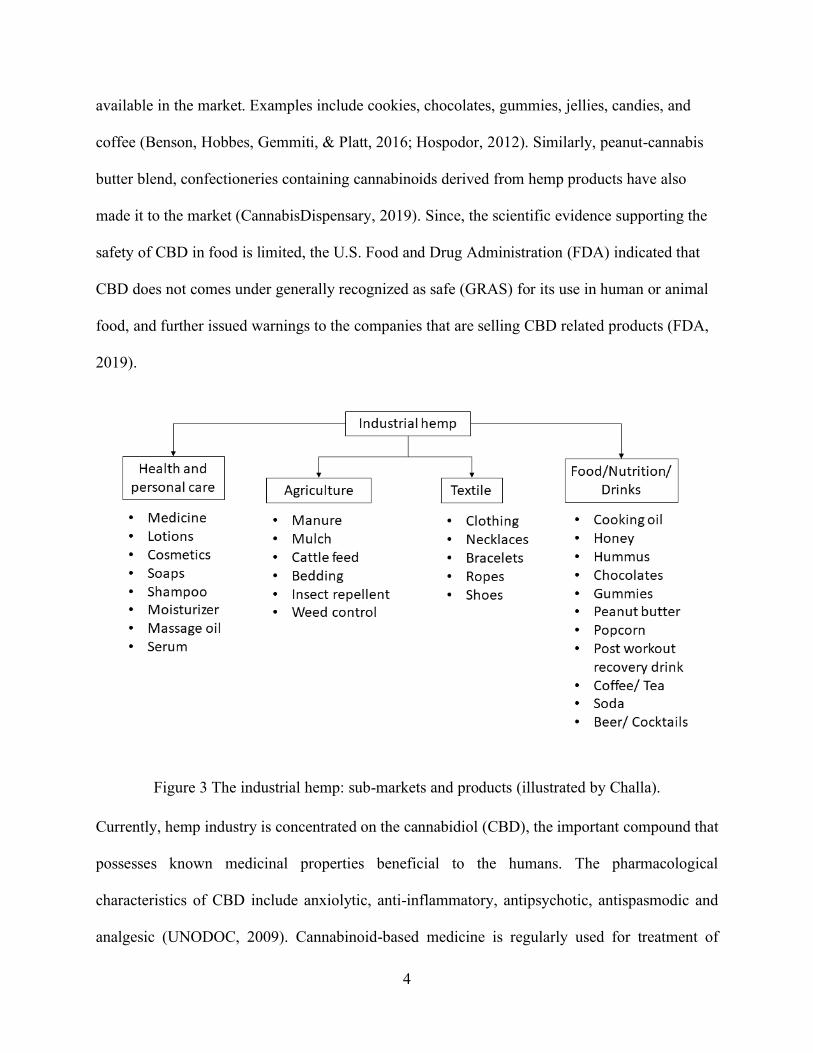
Hemp can be used for multiple purposes such as for medicinal, recreational, furniture, paper,
textile, as supplements in foods, beverages, and cosmetics with an estimated 25,000 different
types of products (Salentijn, Zhang, Amaducci, Yang, & Trindade, 2015) (Figure 3). Each part of
hemp, from the seed to the flower, is beneficial to the humans. Hemp seed is a source of food
and typically contains over 30% oil and about 25% protein. Hemp seed oil is over 80% in
polyunsaturated fatty acids (PUFAs) and is an exceptionally rich source of linoleic acid (omega-
6), alpha-linolenic acid (omega-6) and alpha-linolenic acid (omega-3) (Tang, Ten, Wang, &
Yang, 2006). Canada exported nearly 5,400 metric tons of hempseed in the year 2018 of which,
over 70 per cent went to the U.S. (Jaeger, 2019) followed by European Union (EU) member
countries and South Korea. Several food products with hemp and cannabis as an ingredient are
4
available in the market. Examples include cookies, chocolates, gummies, jellies, candies, and
coffee (Benson, Hobbes, Gemmiti, & Platt, 2016; Hospodor, 2012). Similarly, peanut-cannabis
butter blend, confectioneries containing cannabinoids derived from hemp products have also
made it to the market (CannabisDispensary, 2019). Since, the scientific evidence supporting the
safety of CBD in food is limited, the U.S. Food and Drug Administration (FDA) indicated that
CBD does not comes under generally recognized as safe (GRAS) for its use in human or animal
food, and further issued warnings to the companies that are selling CBD related products (FDA,
2019).
Figure 3 The industrial hemp: sub-markets and products (illustrated by Challa).
Currently, hemp industry is concentrated on the cannabidiol (CBD), the important compound that
possesses known medicinal properties beneficial to the humans. The pharmacological
characteristics of CBD include anxiolytic, anti-inflammatory, antipsychotic, antispasmodic and
analgesic (UNODOC, 2009). Cannabinoid-based medicine is regularly used for treatment of
5
several illnesses, for example to improve hunger/appetite in AIDS (acquired immuno-deficiency
syndrome) patients, to decrease nausea and vomiting in chemotherapy (Tramèr et al., 2001), and
for treating muscle spasms and chronic pain (Borgelt, Franson, Nussbaum, & Wang, 2013;
Whiting et al., 2015). The use of CBD (Epidolex) for effective alleviation of seizures in children
with epilepsy who do not respond to other medications is also well documented (Friedman &
Devinsky, 2015). A mixture of Δ-9THC and CBD is approved in Europe and Canada for treating
spasticity and neuropathic pain associated with multiple sclerosis (Pertwee, 2012).
Therefore, the multiple uses and applications makes hemp a potential plant to explore in different
areas to improve its production and processing. This project mainly explored the literature
pertaining to the CBD, the beneficial and commercial compound of hemp, and different aspects of
drying technologies, which facilitate CBD retention in the product.
1.2. Hemp Chemistry
Cannabidiol (CBD), being the principle cannabinoid responsible for hemp’s unique medicinal
properties, information on the areas of CBD production in the plant (via the chemical pathway),
its location in the buds, and its role and significance besides other cannabinoids in hemp, is crucial.
Hemp and cannabis plants contain several phyto-cannabinoids, which are a class of
terpenophenolic compounds that modulate the neurotransmitter release in the brain by acting on
the cannabinoid receptors in cells. Among the cannabinoids, Δ9-tetrahydrocannabinol (Δ9-THC/
THC), responsible for the psychotic properties, and cannabidiol (CBD), responsible for medicinal
properties are the most potent (Turner, Hemphill, & Mahlberg, 1980). Modern hemp has been
selectively bred to produce low levels of THC (0.3% in the dried material) (Small & Marcus, 2002)
and high levels of fiber, seed, and, more recently, cannabidiol (CBD) (2-5%) (Hartsel, Eades,
Hickory, & Makriyannis, 2016).

6
The monoterpenoid precursors, predominantly geranylpyrophosphate (GPP), that originate from
the deoxyxylulose (DOX) pathway, and the phenolic precursors mostly olivetolic acid (OA),
generated by polyketide pathway are subsequently condensed to form cannabigerolic acid (CBGA)
by the prenyltransferase enzyme geranylpyrophosphate:olivetolate transferase (GOT) (Fellermeier
& Zenk, 1998; Sirikantaramas et al., 2004) (Figure 4). CBGA and its homologues are the central
intermediates in the cannabinoid pathway. The CBGA thus formed, undergoes oxidative
cyclization reactions to form various alkyl homologues of tetrahydrocannabinolic acid (THCA),
cannabidiolic acid (CBDA), and cannabichromenic acid (CBCA) catalyzed by the respective
synthase enzymes (Pertwee, 2014).
Figure 4 CBD Pathway (illustrated by Challa)
Turner and Mahlberg (1984) conducted experiments on the effect of drying temperature on
cannabinoids. Samples were dried for 24 h at 37 °C and 60 °C and CBD content was separated
and analyzed using both Gas-liquid Chromatography (GLC) and High-Performance Liquid
Chromatography (HPLC). Analyses revealed that samples dried at 60 °C have both acid and
7
neutral cannabinoids, while only cannabinoid acids were found in samples dried at 37 °C, has
shown that decarboxylation occurred only at high (above 37°C) temperature. Hence, in plants,
cannabinoids are mainly stored in the form of acids such as, Δ9-tetrahydrocannabinolic acid (THC-
A), cannabidiolic acid (CBD-A) (Taschwer & Schmid, 2015), and small amounts of
decarboxylated forms, such as THC and CBD that occurred due to spontaneous decarboxylation
during the cultivation process.
Total CBD level (w/w %) is typically calculated as:
Total CBD = (0.877 × CBDA) + CBD … (1)
where 0.877 is the scaling factor accounting for the difference in molecular weight between CBDA
and CBD (w/w %). Total CBD content (standard way of reporting) refers to the maximum potential
CBD content of a hemp product, assuming 100% decarboxylation of cannabinoid acids (Jikomes
& Zoorob, 2018).
Apart from cannabidiol, hemp contains numerous terpenes which are the main contributors to the
plant's unique aroma. The fragrance of various plants is mainly due to the monoterpenes, which
contribute to distinctive smell of trees (e.g. α- and β-pinene from pines), mints (e.g. menthol from
peppermint), fruits (e.g. limonene from citrus) and flowers (e.g. geraniol from roses) (Singsaas,
2000). Among the hemp terpenes, popular and abundant are alpha and beta pinene, myrcene,
terpineol, limonene, geranyl acetate and caryophyllene oxide. Out of these, 75% of the volatiles
noticed are pinenes and limonene in the surrounding atmosphere, making 7% of the essential oil
(Hood, Dames, & Barry, 1973).
8
1.3. Location of Cannabinoids in Plant
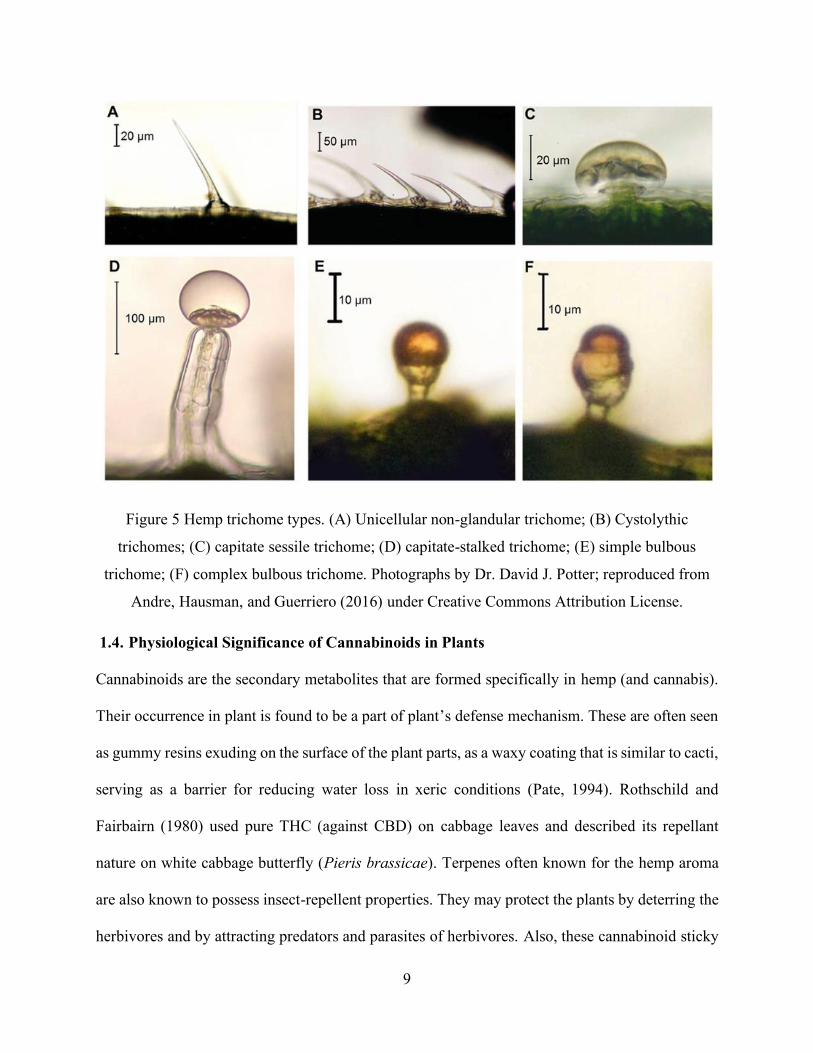
C. sativa shoots bear various types of glandular and non-glandular epidermal appendages called
Trichomes (Briosi and Tognini (1894, 1897). These glandular hairs occur in both male and female
plants but are found more profusely on pistillate (female) plants. In flowers, morphologically three
different types of glandular hairs are observed. They are capitate-stalked, capitate-sessile and
bulbous (Figure 5). Bulbous and capitate-sessile type glands can be observed on almost all
vegetative and flowering shoots parts, but capitate-stalked glands are limited to flowering regions.
As the bracts mature, these glands increase in density, become translucent and store high quantities
of cannabinoids. In a gland, cannabinoids are chemically bounded with the cell walls, secretory
vesicles and fibrillar material in the secretory cavity of the disc cell (Hammond & Mahlberg,
1973). Cannabinoids are mainly genetically controlled and depend on plant variety. However,
there is a significant dependence of cannabinoids formation from the environmental conditions.
Reportedly, cannabinoids occurred comparatively abundant in the plants grown under low
humidity, less rainfall and sunny climatic conditions (Murari, Lombardi, & Romagnoli, 1988; Pate,
1994; Sharma, 1975).
9
Figure 5 Hemp trichome types. (A) Unicellular non-glandular trichome; (B) Cystolythic
trichomes; (C) capitate sessile trichome; (D) capitate-stalked trichome; (E) simple bulbous
trichome; (F) complex bulbous trichome. Photographs by Dr. David J. Potter; reproduced from
Andre, Hausman, and Guerriero (2016) under Creative Commons Attribution License.
1.4. Physiological Significance of Cannabinoids in Plants
Cannabinoids are the secondary metabolites that are formed specifically in hemp (and cannabis).
Their occurrence in plant is found to be a part of plant’s defense mechanism. These are often seen
as gummy resins exuding on the surface of the plant parts, as a waxy coating that is similar to cacti,
serving as a barrier for reducing water loss in xeric conditions (Pate, 1994). Rothschild and
Fairbairn (1980) used pure THC (against CBD) on cabbage leaves and described its repellant
nature on white cabbage butterfly (Pieris brassicae). Terpenes often known for the hemp aroma
are also known to possess insect-repellent properties. They may protect the plants by deterring the
herbivores and by attracting predators and parasites of herbivores. Also, these cannabinoid sticky
10
resins are tough for a considerable insect to chew, along with trichomes, thus, acting as a
mechanical defense like many other plant species (Levin, 1973).
1.5. Postharvest Processing
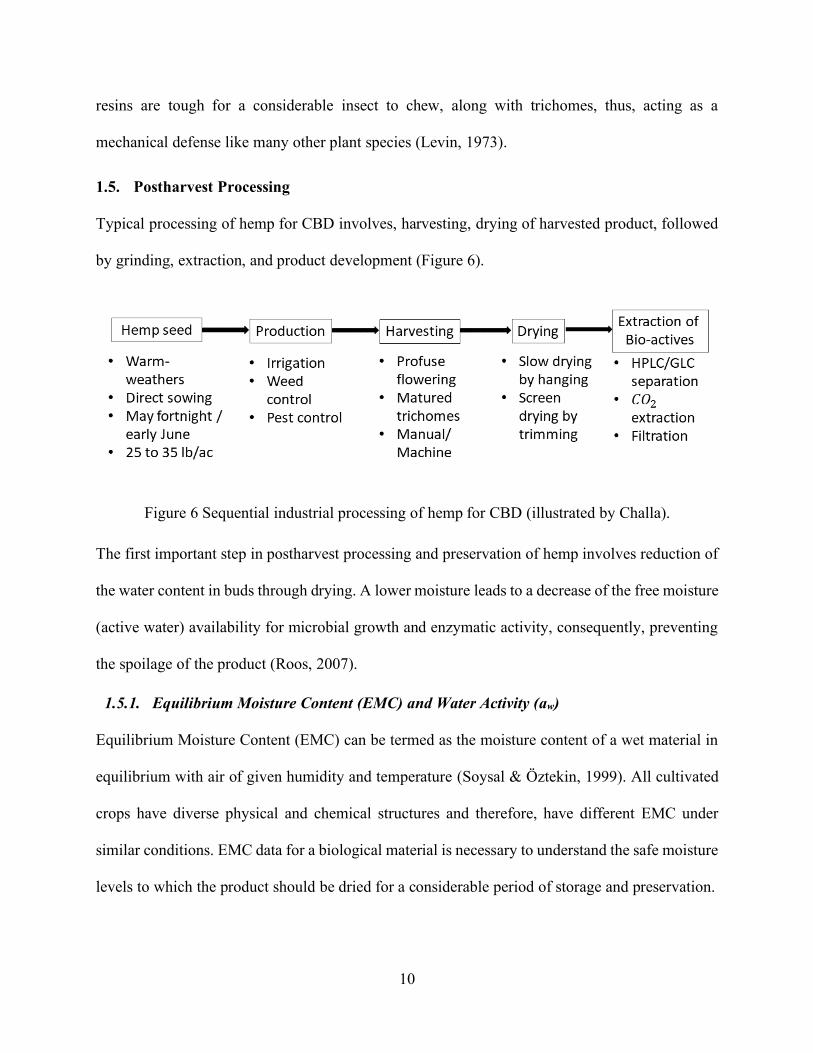
Typical processing of hemp for CBD involves, harvesting, drying of harvested product, followed
by grinding, extraction, and product development (Figure 6).
Figure 6 Sequential industrial processing of hemp for CBD (illustrated by Challa).
The first important step in postharvest processing and preservation of hemp involves reduction of
the water content in buds through drying. A lower moisture leads to a decrease of the free moisture
(active water) availability for microbial growth and enzymatic activity, consequently, preventing
the spoilage of the product (Roos, 2007).
1.5.1. Equilibrium Moisture Content (EMC) and Water Activity (aw)
Equilibrium Moisture Content (EMC) can be termed as the moisture content of a wet material in
equilibrium with air of given humidity and temperature (Soysal & Öztekin, 1999). All cultivated
crops have diverse physical and chemical structures and therefore, have different EMC under
similar conditions. EMC data for a biological material is necessary to understand the safe moisture
levels to which the product should be dried for a considerable period of storage and preservation.
11
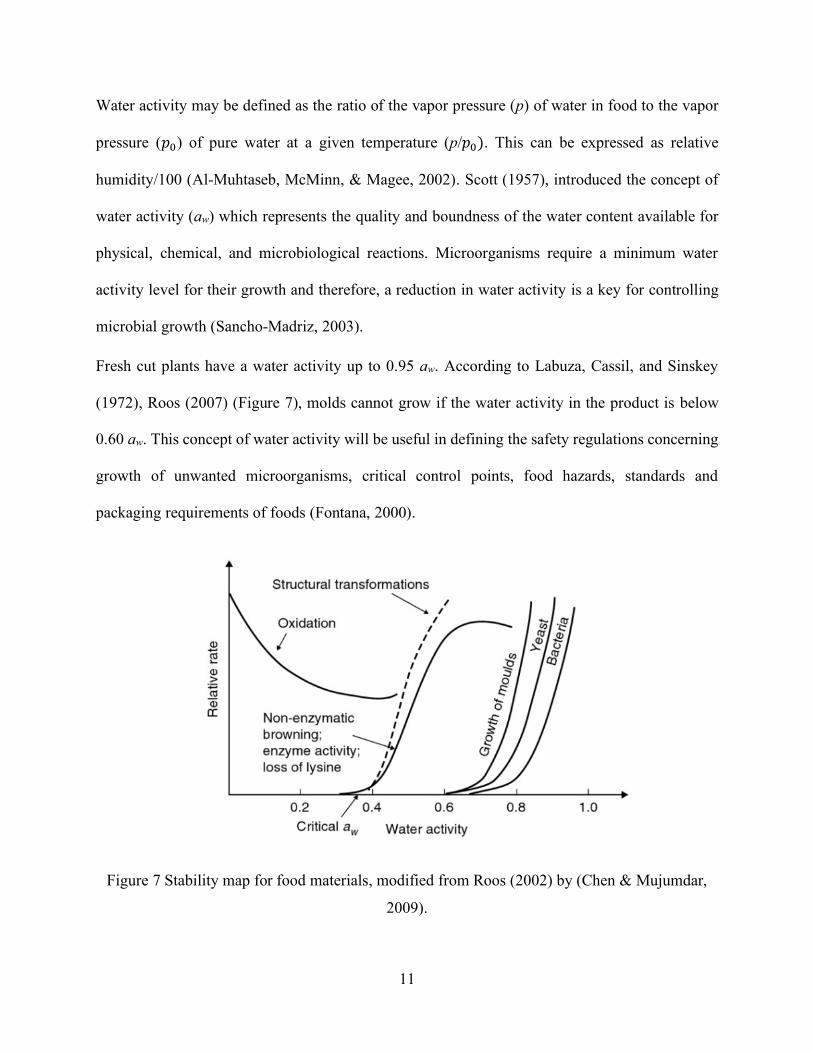
Water activity may be defined as the ratio of the vapor pressure (p) of water in food to the vapor
pressure (𝑝0) of pure water at a given temperature (p/𝑝0). This can be expressed as relative
humidity/100 (Al-Muhtaseb, McMinn, & Magee, 2002). Scott (1957), introduced the concept of
water activity (aw) which represents the quality and boundness of the water content available for
physical, chemical, and microbiological reactions. Microorganisms require a minimum water
activity level for their growth and therefore, a reduction in water activity is a key for controlling
microbial growth (Sancho-Madriz, 2003).
Fresh cut plants have a water activity up to 0.95 aw. According to Labuza, Cassil, and Sinskey
(1972), Roos (2007) (Figure 7), molds cannot grow if the water activity in the product is below
0.60 aw. This concept of water activity will be useful in defining the safety regulations concerning
growth of unwanted microorganisms, critical control points, food hazards, standards and
packaging requirements of foods (Fontana, 2000).
Figure 7 Stability map for food materials, modified from Roos (2002) by (Chen & Mujumdar,
2009).
12
1.5.2. Moisture Sorption Isotherms
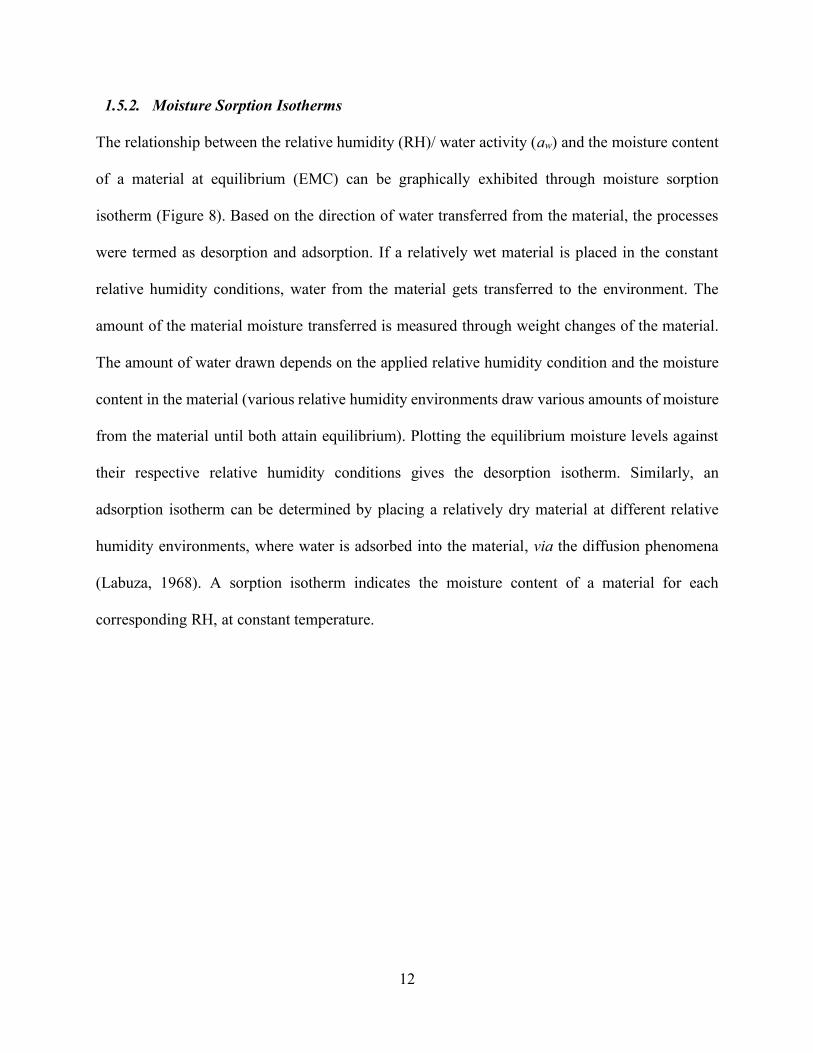
The relationship between the relative humidity (RH)/ water activity (aw) and the moisture content
of a material at equilibrium (EMC) can be graphically exhibited through moisture sorption
isotherm (Figure 8). Based on the direction of water transferred from the material, the processes
were termed as desorption and adsorption. If a relatively wet material is placed in the constant
relative humidity conditions, water from the material gets transferred to the environment. The
amount of the material moisture transferred is measured through weight changes of the material.
The amount of water drawn depends on the applied relative humidity condition and the moisture
content in the material (various relative humidity environments draw various amounts of moisture
from the material until both attain equilibrium). Plotting the equilibrium moisture levels against
their respective relative humidity conditions gives the desorption isotherm. Similarly, an
adsorption isotherm can be determined by placing a relatively dry material at different relative
humidity environments, where water is adsorbed into the material, via the diffusion phenomena
(Labuza, 1968). A sorption isotherm indicates the moisture content of a material for each
corresponding RH, at constant temperature.
13
Figure 8 Typical moisture sorption isotherm (drawn by Challa).
Moisture sorption isotherm for a typical food system can be divided into three main regions.
Region A (aw 0.0 to 2.0) denotes strongly bound water and the water molecules in this region are
said to be unfreezable. This water is not available for chemical reactions. Region B (aw 0.2 to 0.6)
represents less firmly bound water molecules that are held in the solid matrix by capillary
condensation and are present as multilayers above the monolayer. Region C (aw 0.6 to 1.0)
represents water present in macro-capillaries and exhibits nearly all the properties of bulk water.
Micro-organisms utilize this water causing the contamination to the product (Al-Muhtaseb et al.,
2002).
Owing to this phenomenon, moisture sorption isotherms of most foods are sigmoidal in shape and
have been classified as Type II isotherms (Gregg et al., 1967). In this project, only desorption
isotherm of hemp was explored to determine the moisture content at 0.6 aw and EMC for safe
preservation.
14
1.5.3. Industrial Drying of Hemp
Hemp has been so far dried and used predominantly for fiber production. However, with the recent
legalization of hemp and cannabis for medicinal and recreational purposes, demand for hemp CBD
has been significantly increasing. The substantial growth in the cultivation of hemp demands
appropriate drying technology for product preservation and for CBD extraction. Drying of hemp
and cannabis has evolved over years as more of an art than technology, perhaps, due to the taboos
associated and illegal status in most countries.
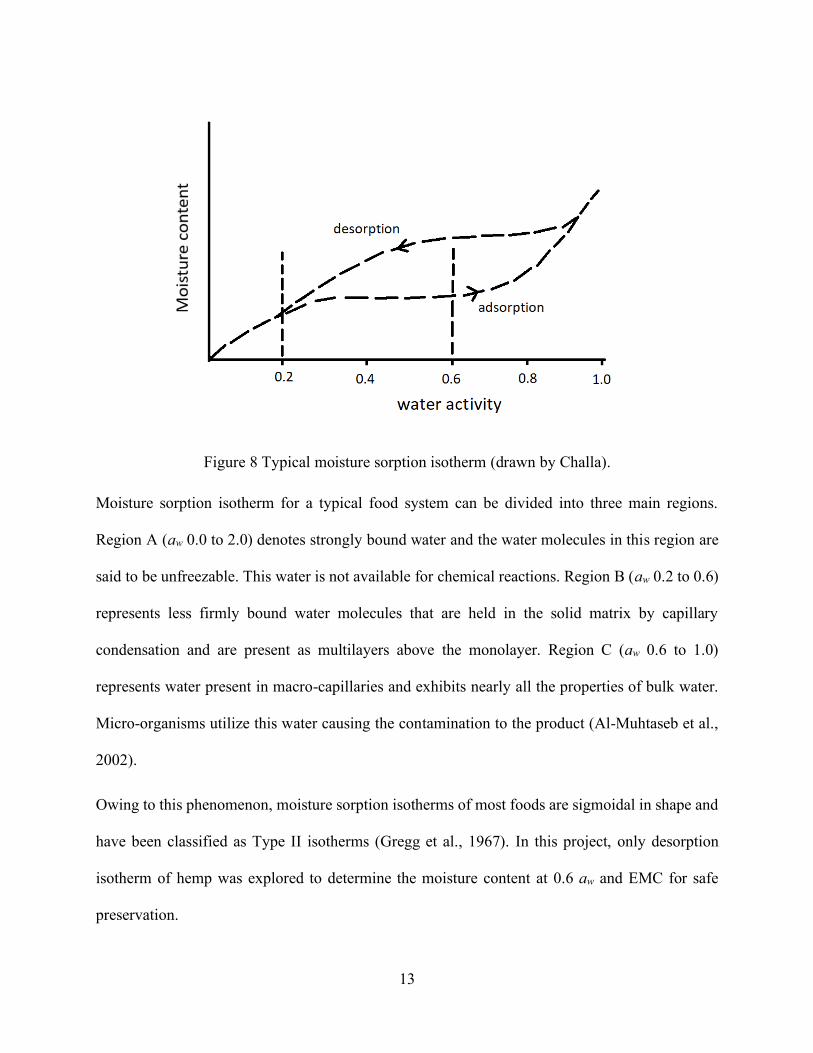
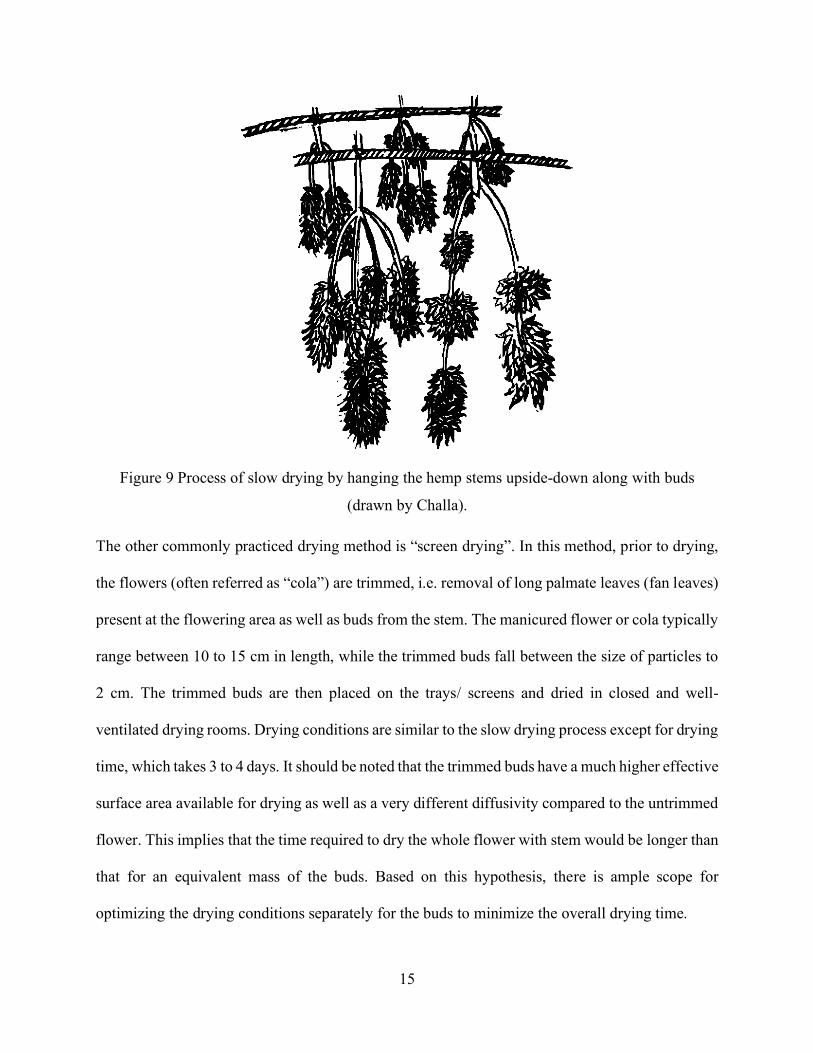
The commonly practiced traditional drying method is “slow drying”. In this method, either the
whole plant or the branches with flower buds are hung upside down (Figure 9). Consequently,
water from the stem slowly migrates into the buds as water evaporates and thus, increases the
drying time. A variation of slow drying known as “cage drying”, involves hanging of buds from
wire cages instead of static wires is also in practice. This modification allows to move the cages
closer or away from dehumidifiers or heaters in a drying room. Drying is carried out in closed and
well-ventilated drying rooms that employ dehumidifiers. The average temperature in the drying
room is maintained between 18-21 °C, while the relative humidity is set in the range of 50-55%.
Under these conditions, the total time required to dry the buds as well as the trims to final moisture
content is about 5 to 6 days. Currently, there does not exist any model to predict the endpoint of
drying or the overall drying time. Most growers and industries predict that the product is dried
based on the texture and crispness of the bud. An issue that is often encountered with current
methods of drying is mold growth due to inadequate control over the slow process (Hawes &
Cohen, 2015).
15
Figure 9 Process of slow drying by hanging the hemp stems upside-down along with buds
(drawn by Challa).
The other commonly practiced drying method is “screen drying”. In this method, prior to drying,
the flowers (often referred as “cola”) are trimmed, i.e. removal of long palmate leaves (fan leaves)
present at the flowering area as well as buds from the stem. The manicured flower or cola typically
range between 10 to 15 cm in length, while the trimmed buds fall between the size of particles to
2 cm. The trimmed buds are then placed on the trays/ screens and dried in closed and well-
ventilated drying rooms. Drying conditions are similar to the slow drying process except for drying
time, which takes 3 to 4 days. It should be noted that the trimmed buds have a much higher effective
surface area available for drying as well as a very different diffusivity compared to the untrimmed
flower. This implies that the time required to dry the whole flower with stem would be longer than
that for an equivalent mass of the buds. Based on this hypothesis, there is ample scope for
optimizing the drying conditions separately for the buds to minimize the overall drying time.
16
1.5.4. Relevant Drying Technologies
1.5.4.1. Convective Drying
Convective drying technology is the most commonly used drying method in the food processing
industry due to its simple operation and low cost (Mujumdar, 2014; Müller, 2007). The principle
of convective/ hot air drying lies in heat transfer from air to the wet material and consequently,
conjugate mass transfer from the material to gas phase (evaporation). Convection systems lower
the relative humidity by raising the temperature of the air passing through the product, thereby,
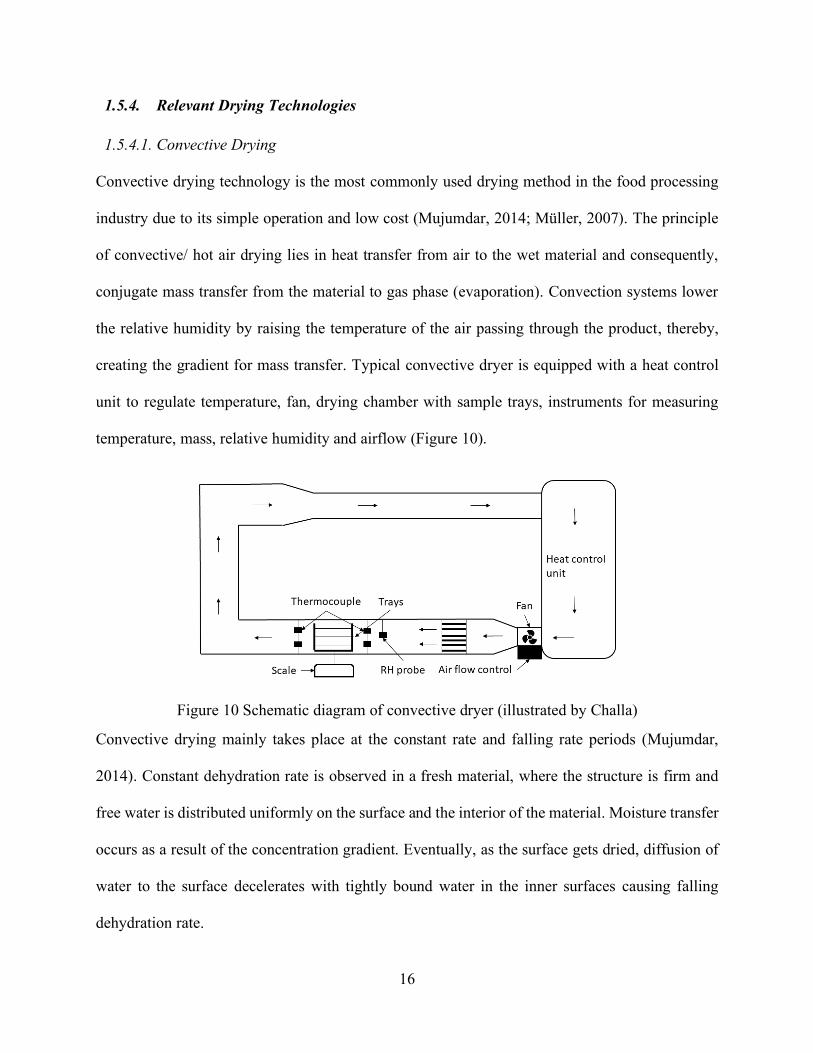
creating the gradient for mass transfer. Typical convective dryer is equipped with a heat control
unit to regulate temperature, fan, drying chamber with sample trays, instruments for measuring
temperature, mass, relative humidity and airflow (Figure 10).
Figure 10 Schematic diagram of convective dryer (illustrated by Challa)
Convective drying mainly takes place at the constant rate and falling rate periods (Mujumdar,
2014). Constant dehydration rate is observed in a fresh material, where the structure is firm and
free water is distributed uniformly on the surface and the interior of the material. Moisture transfer
occurs as a result of the concentration gradient. Eventually, as the surface gets dried, diffusion of
water to the surface decelerates with tightly bound water in the inner surfaces causing falling
dehydration rate.
17
Controlled variables in convective drying are mainly temperature, relative humidity and air
velocity. In an earlier study, the effect of air velocity on drying kinetics was observed to be
negligible at high air velocities (Berna, Rosselo, Canellas, & Mulet, 1990; Kaymak‐Ertekin, 2002;
Mulet, Berna, Borr, & Pinaga, 1987). Further, the critical air velocity value at which drying rate is
not affected was found to range from 1 to 1.5 m/s. Increase in the air temperature has a significant
effect on drying rate and is the major determinant of product quality (Martynenko & Janaszek,
2014; Ozguven, Tarhan, Polatci, & Telci, 2016).
Over 85% of industrial dryers are convective, using either hot air or combustion gases as the media
for heat transfer. The traditional methods associated with the drying of hemp are based on the same
phenomenon. However, there is no relevant study on the effect of drying temperatures on CBD
retention. This void certainly merits to carry out suitable research to determine CBD and terpenes
behavior as a function of temperature.
1.5.4.2. Intermittent Drying/ Non-Isothermal Drying
Modern drying technologies like intermittent/ non-isothermal drying, which is proven to reduce
drying time at minimum loss of quality and good energy efficiency can be used as an alternative
to conventional isothermal drying at low temperatures. Non-isothermal drying involves suitable
fluctuation (increase/decrease) of drying conditions (temperature and humidity) to facilitate
redistribution of thermal gradients and levelling of moisture within the material (Martynenko &
Kudra, 2015). Non-isothermal drying has been successfully applied for the drying of sensitive
herbaceous materials that have potential implications for hemp drying. For example, Ozguven et
al. (2016) used stepwise drying of peppermint by incremental rise of drying air temperature from
35 °C to 55 °C in 4 hours and then maintained the temperature at 55 °C. This approach not only
retained the quality of the product that is similar to 35 °C, but also accelerated drying. Similar
18
experiments were conducted by Cuervo-Andrade and Hensel (2016), with Lemon balm drying,
where a combination of 40 °C and 50 °C, with change point at 20% moisture content showed
nearly no change in quality and reduced energy consumption by 10% and drying time by 28.5%
compared to standard drying at 40 °C. Therefore, non-isothermal stepwise drying could be a good
alternative to traditional convective drying of hemp at constant temperature. In fact, in a recent
patent, Hawes and Cohen (2015) describe an intermittent drying process for cannabis involving
three stages of drying. They claim that relatively higher initial temperatures (between 50 to 60 °C)
and higher humidity (< 80% RH) for up to 5 hours will result in inactivation of mold spores while
preventing rapid evaporation from the material. Subsequently, they suggest that in the second stage
the temperature and humidity should be dropped to prevent any thermal denaturation, while
ensuring constant drying. Finally, the patent suggests further lowering of humidity, while keeping
the temperature relatively constant in the final stage of drying to reach the equilibrium moisture
content of about 8 to 9%. Noticeably, while the patent by Hawes and Cohen (2015) exploits non-
isothermal drying conditions for inactivation of mold spores, it does not shed light on the reduction
in the overall drying time or CBD retention. Thus, effect of temperature and moisture content on
the overall drying time and CBD retention needs to be further explored.
1.5.4.3. Freeze Drying
Freeze drying is a method of drying materials by sublimation under vacuum (Liapis & Bruttini,
2006). Operating at low temperatures, freeze drying technology potentially reduces the volatile
losses, resulting in premium quality dried product. Freeze drying can be divided into primary and
secondary drying stages. Primary drying stage involves lowering of pressure, through vacuum, and
applying heat, by conduction or radiation, to the material for sublimating ice. The secondary drying
stage involves removal of unfrozen water. Temperature will be higher in this phase compared to

19
primary drying for breaking any physico-chemical interactions formed between the frozen material
and water molecules (Liapis & Bruttini, 2006). Essential components of a freeze dryer usually
include vacuum chamber, condenser, shelves, refrigeration system, shelf-fluid system, control
system, and vacuum system.
Freeze drying is progressively developing into an important preservation method for highly
delicate and heat-sensitive biological products, as it retains the quality of the fresh material. Drying
is done at low temperatures with a minimum loss of flavor, valuable compounds and minor
shrinkage (Gardeli, Evageliou, Poulos, Yanniotis, & Komaitis, 2010). Due to the low processing
temperature and less oxygen availability, freeze drying can preserve the product quality better than
other drying techniques (Litvin, Mannheim, & Miltz, 1998; Strumillo & Adamiec, 1996).
Energy consumption in freeze drying is a significant factor, with the energy losses and long drying
time (usually 10-15 hours) dictating the overall cost-economics. Energy losses include loss of
radiant energy to dryer walls, losses within the product, energy dissipation in vacuum pumps, and
energy released to the environment from freezers and freeze dryer units (Díaz‐Maroto, Sánchez
Palomo, Castro, González Viñas, & Pérez‐Coello, 2004). The drying time is mostly limited by
slow heat transfer. The problem of inefficient heat transfer could be resolved with microwave
heating. Microwave Freeze Drying (MFD) is widely recognized due to 50–75% less time to drying
vis-à-vis freeze drying (Duan, Zhang, Mujumdar, & Wang, 2010). MFD however, poses
challenges for industrial implementation owing to non-uniform heating of the dry zones in product,
thereby negatively impacting the product quality (Wang & Shi, 1999). The cost of freeze drying
is about four to ten times higher than that of convective hot air drying (Liapis & Bruttini, 2006).
Since freeze drying is an expensive process, the use of freeze drying at industrial level is limited
20
to high-value products, such as hemp. Thus, freeze drying could be another potential technology
that can preserve the CBD and terpenes content and therefore necessitates further research.
1.6. Problem Statement
As hemp industry relies on traditional drying practices for CBD extraction, which often take 3 to
4 days, problems such as excessive energy consumption, poor quality product and also, mold
development that occurs due to the uneven/ incomplete drying of buds (George-Cosh, 2018). A
systematic study is certainly required to understand the effect of different drying technologies on
CBD degradation. This leads to the specific research questions: what is the equilibrium moisture
content for safe preservation, and how the different drying temperatures and drying time influence
the CBD and terpenes retention? Drying of hemp buds for further extraction of bioactive
compounds (CBD and terpenes) is a bottleneck to the entire production cycle. Proper research is
necessary to address such problems which would help the growing hemp industry to select suitable
drying method that enable high throughput.
So, my hypotheses are that desorption isotherm can be used to determine the moisture content at
0.6 aw and EMC for safe preservation. Quality parameters such as, CBD, terpenes and color
behavior against various temperatures aid in selecting an appropriate convective drying
temperature. Non-isothermal drying, where an increase in the drying temperature in the middle of
the process, could save considerable amount of time and energy besides ensure quality retention.
Freeze drying, which is proven to be an effective technology for quality retention, would retain
maximum hemp buds’ quality.
21
1.7. Objectives
This study involves objectives to:
1. Determine the desorption isotherm of hemp, and thereby, to determine the equilibrium
moisture contents in hemp buds for a safe preservation.
2. Determine the effect of convective drying temperatures (25, 32, 40, 50, 60 and 70 ºC) on
drying time and product quality (CBD and terpenes).
3. Determine the best fitted model that expresses drying kinetics of convective drying and the
effective moisture diffusivity (Deff).
4. Determine the ability of non-isothermal drying to decrease the drying time with maximum
quality retention.
5. Determine the effects of freeze drying on drying time and quality.
6. Compare the effect of convective vs. freeze drying on product quality and specific energy
consumption.
7. Evaluate the above drying technologies and identify the best drying condition beneficial for
the industry.
22
Chapter 2. Materials and Methods
2.1. Experimental Setup
All the drying experiments of hemp buds were conducted at a farm site in Middle Musquodoboit
(45.053973, -63.127794), NS, Canada (Figure 11) due to the unavailability of a license to grow
hemp/ cannabis for research at the university. The temporary research lab was established at a
farmhouse near to 100-acre hemp fields. The facility is equipped with an adjustable thermostat for
ambient temperature control. Ventilation, relative humidity regulation, commuting to the facility
(located 60 km away from the university), food and other resources, were some of the major
challenges faced during the research. The drying equipment required for the experiments were
transported from Dalhousie University (September 11, 2019) to the research facility. The two
convective driers (3926TB 9-Tray food dehydrator, Excalibur, Sacramento, California, USA) and
the freeze drier (Harvest Right, Salt Lake City, Utah, USA) were placed in the individual rooms
(Figure 12).
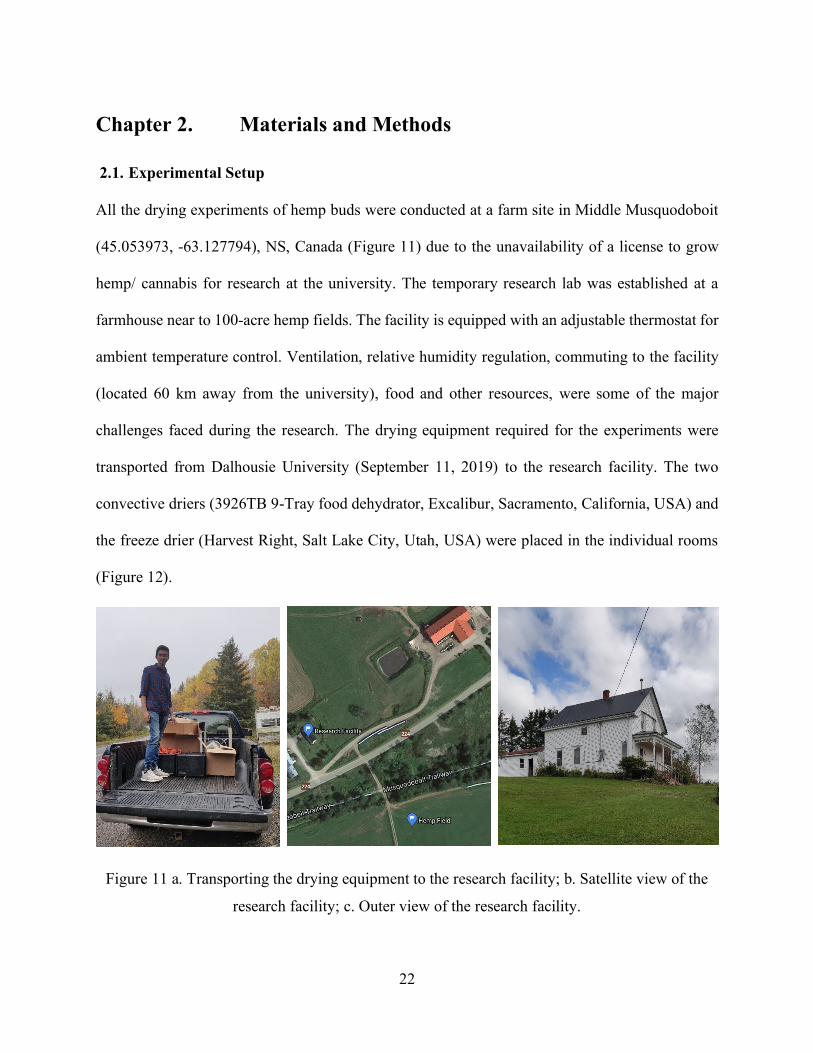
Figure 11 a. Transporting the drying equipment to the research facility; b. Satellite view of the
research facility; c. Outer view of the research facility.
23
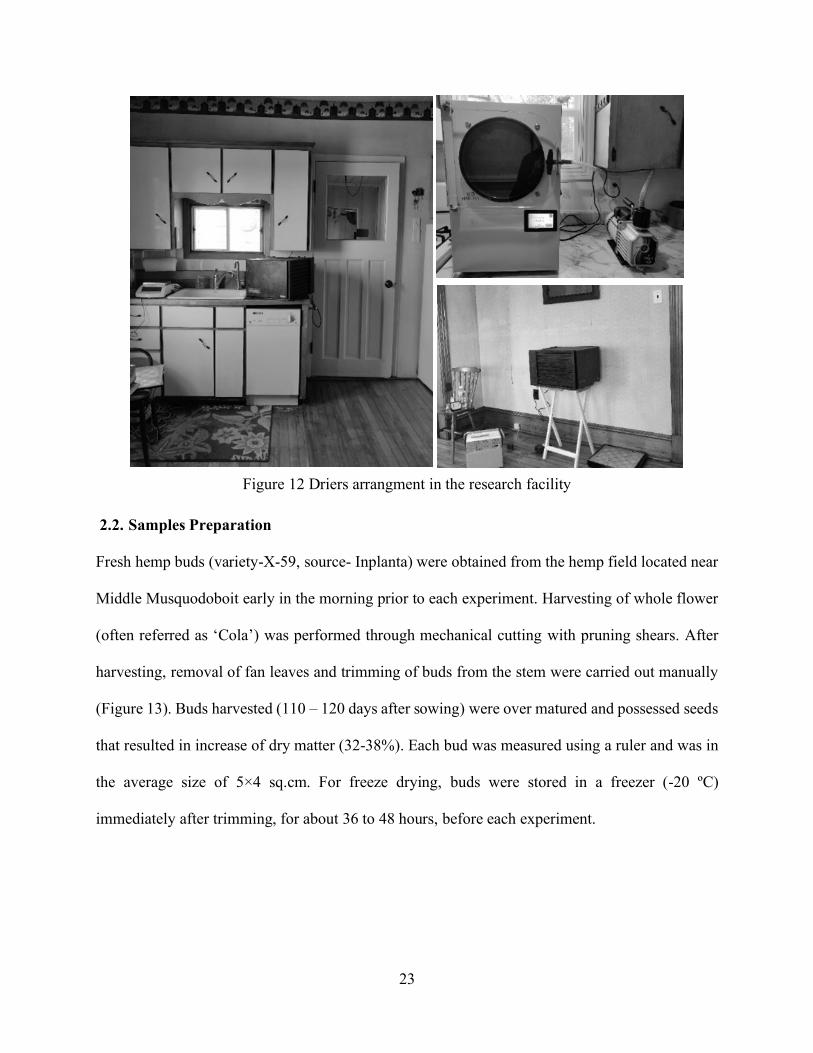
Figure 12 Driers arrangment in the research facility
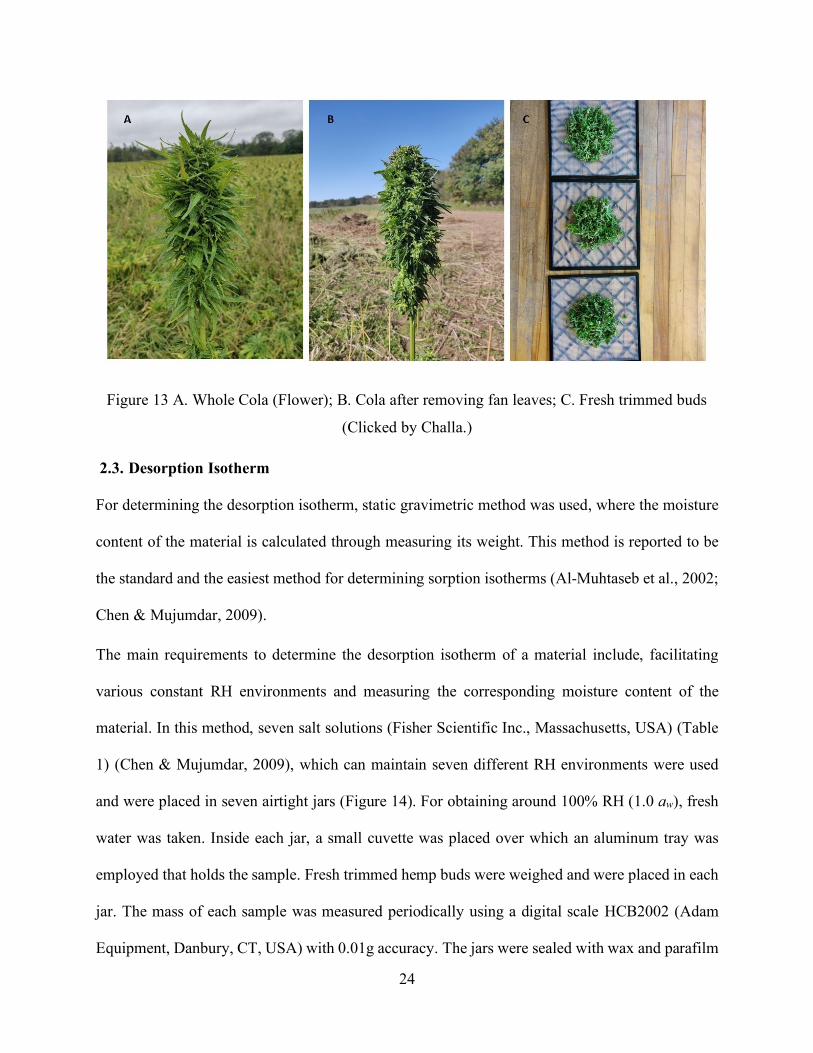
2.2. Samples Preparation
Fresh hemp buds (variety-X-59, source- Inplanta) were obtained from the hemp field located near
Middle Musquodoboit early in the morning prior to each experiment. Harvesting of whole flower
(often referred as ‘Cola’) was performed through mechanical cutting with pruning shears. After
harvesting, removal of fan leaves and trimming of buds from the stem were carried out manually
(Figure 13). Buds harvested (110 – 120 days after sowing) were over matured and possessed seeds
that resulted in increase of dry matter (32-38%). Each bud was measured using a ruler and was in
the average size of 5×4 sq.cm. For freeze drying, buds were stored in a freezer (-20 ºC)
immediately after trimming, for about 36 to 48 hours, before each experiment.
24
Figure 13 A. Whole Cola (Flower); B. Cola after removing fan leaves; C. Fresh trimmed buds
(Clicked by Challa.)
2.3. Desorption Isotherm
For determining the desorption isotherm, static gravimetric method was used, where the moisture
content of the material is calculated through measuring its weight. This method is reported to be
the standard and the easiest method for determining sorption isotherms (Al-Muhtaseb et al., 2002;
Chen & Mujumdar, 2009).
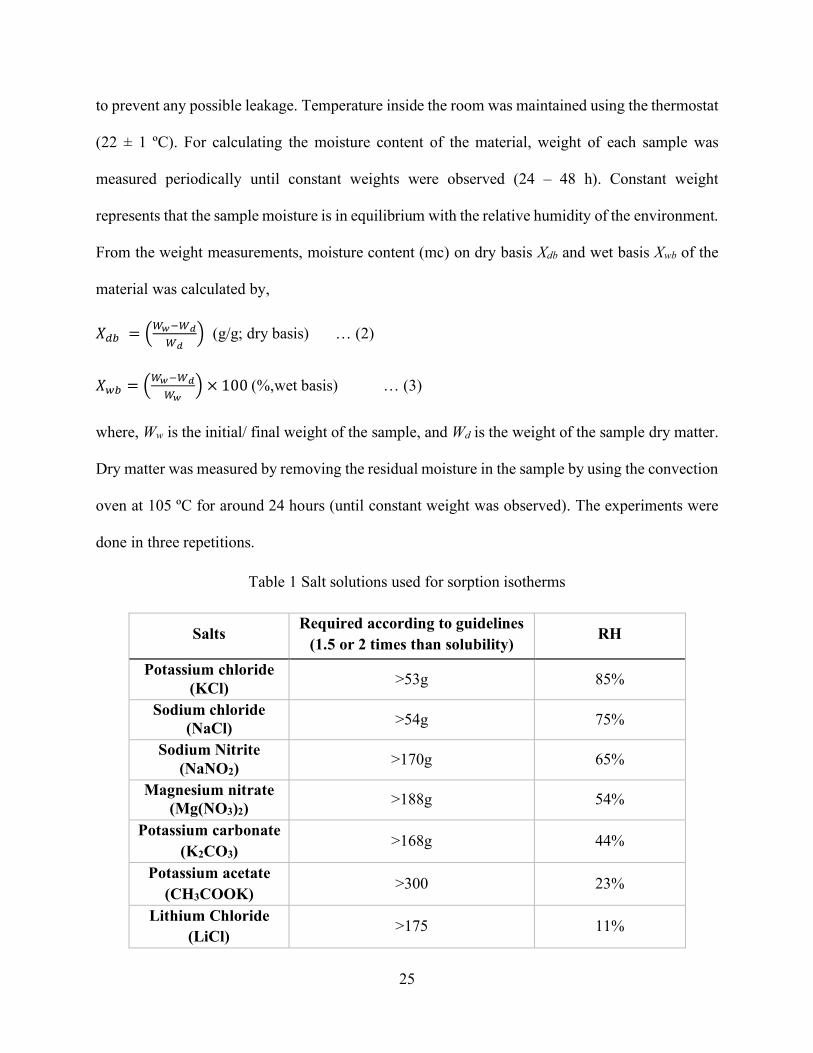
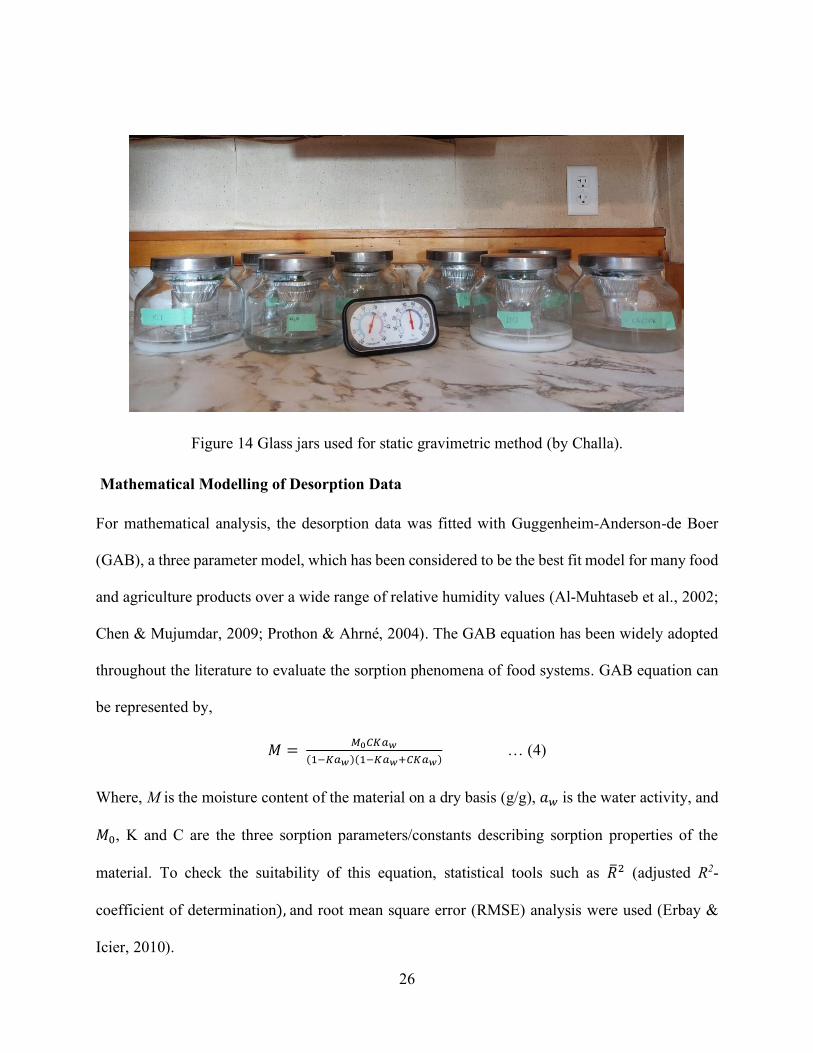
The main requirements to determine the desorption isotherm of a material include, facilitating
various constant RH environments and measuring the corresponding moisture content of the
material. In this method, seven salt solutions (Fisher Scientific Inc., Massachusetts, USA) (Table
1) (Chen & Mujumdar, 2009), which can maintain seven different RH environments were used
and were placed in seven airtight jars (Figure 14). For obtaining around 100% RH (1.0 aw), fresh
water was taken. Inside each jar, a small cuvette was placed over which an aluminum tray was
employed that holds the sample. Fresh trimmed hemp buds were weighed and were placed in each
jar. The mass of each sample was measured periodically using a digital scale HCB2002 (Adam
Equipment, Danbury, CT, USA) with 0.01g accuracy. The jars were sealed with wax and parafilm
25
to prevent any possible leakage. Temperature inside the room was maintained using the thermostat
(22 ± 1 ºC). For calculating the moisture content of the material, weight of each sample was
measured periodically until constant weights were observed (24 – 48 h). Constant weight
represents that the sample moisture is in equilibrium with the relative humidity of the environment.
From the weight measurements, moisture content (mc) on dry basis Xdb and wet basis Xwb of the
material was calculated by,
𝑋𝑑𝑏 = (𝑊𝑤−𝑊𝑑
𝑊𝑑) (g/g; dry basis) … (2)
𝑋𝑤𝑏 = (𝑊𝑤−𝑊𝑑
𝑊𝑤) × 100 (%,wet basis) … (3)
where, Ww is the initial/ final weight of the sample, and Wd is the weight of the sample dry matter.
Dry matter was measured by removing the residual moisture in the sample by using the convection
oven at 105 ºC for around 24 hours (until constant weight was observed). The experiments were
done in three repetitions.
Table 1 Salt solutions used for sorption isotherms
Salts Required according to guidelines
(1.5 or 2 times than solubility) RH
Potassium chloride
(KCl) >53g 85%
Sodium chloride
(NaCl) >54g 75%
Sodium Nitrite
(NaNO2) >170g 65%
Magnesium nitrate
(Mg(NO3)2) >188g 54%
Potassium carbonate
(K2CO3) >168g 44%
Potassium acetate
(CH3COOK) >300 23%
Lithium Chloride
(LiCl) >175 11%
26
Figure 14 Glass jars used for static gravimetric method (by Challa).
Mathematical Modelling of Desorption Data
For mathematical analysis, the desorption data was fitted with Guggenheim-Anderson-de Boer
(GAB), a three parameter model, which has been considered to be the best fit model for many food
and agriculture products over a wide range of relative humidity values (Al-Muhtaseb et al., 2002;
Chen & Mujumdar, 2009; Prothon & Ahrné, 2004). The GAB equation has been widely adopted
throughout the literature to evaluate the sorption phenomena of food systems. GAB equation can
be represented by,
𝑀 = 𝑀0𝐶𝐾𝑎𝑤
(1−𝐾𝑎𝑤)(1−𝐾𝑎𝑤+𝐶𝐾𝑎𝑤) … (4)
Where, M is the moisture content of the material on a dry basis (g/g), 𝑎𝑤 is the water activity, and
𝑀0, K and C are the three sorption parameters/constants describing sorption properties of the
material. To check the suitability of this equation, statistical tools such as �̅�2 (adjusted R2-
coefficient of determination), and root mean square error (RMSE) analysis were used (Erbay &
Icier, 2010).
27
Since, the main objective is solely for studying the EMCs at target aw values, with the available
time and resources, the study was limited only to the exploration of the desorption isotherm of
hemp buds fitted with the widely used GAB model.
2.4. Drying Experiments
2.4.1. Isothermal Convective Drying
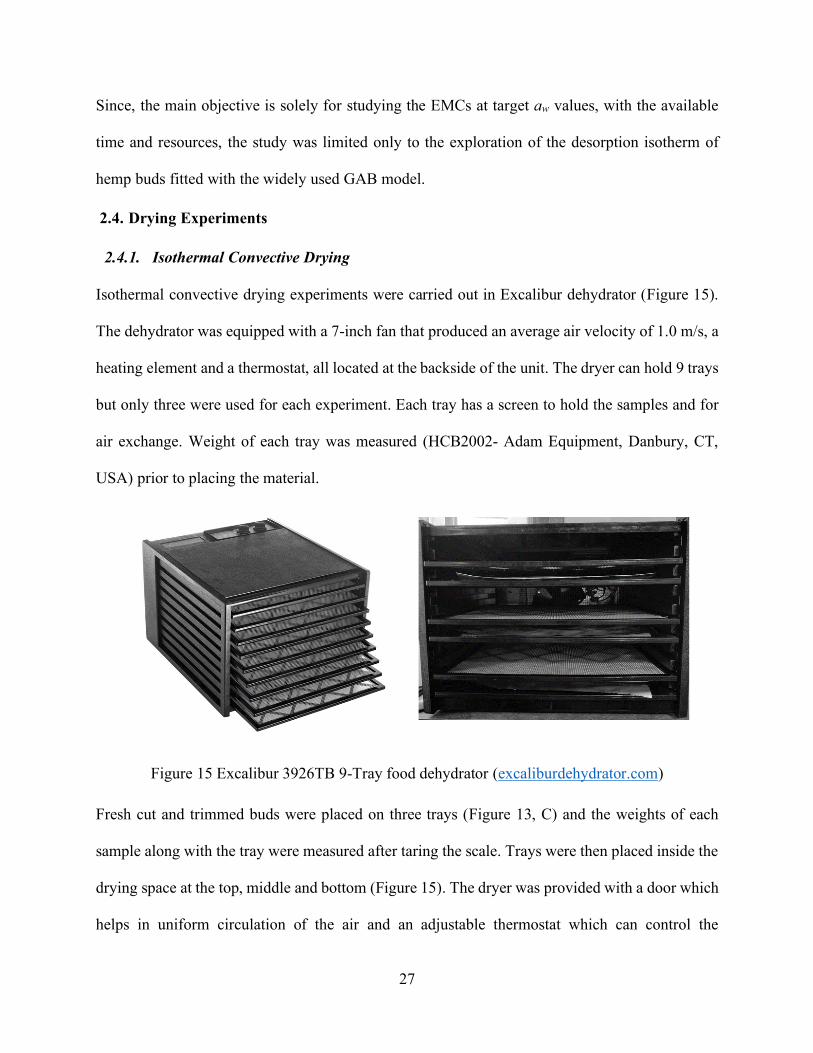
Isothermal convective drying experiments were carried out in Excalibur dehydrator (Figure 15).
The dehydrator was equipped with a 7-inch fan that produced an average air velocity of 1.0 m/s, a
heating element and a thermostat, all located at the backside of the unit. The dryer can hold 9 trays
but only three were used for each experiment. Each tray has a screen to hold the samples and for
air exchange. Weight of each tray was measured (HCB2002- Adam Equipment, Danbury, CT,
USA) prior to placing the material.
Figure 15 Excalibur 3926TB 9-Tray food dehydrator (excaliburdehydrator.com)
Fresh cut and trimmed buds were placed on three trays (Figure 13, C) and the weights of each
sample along with the tray were measured after taring the scale. Trays were then placed inside the
drying space at the top, middle and bottom (Figure 15). The dryer was provided with a door which
helps in uniform circulation of the air and an adjustable thermostat which can control the
28
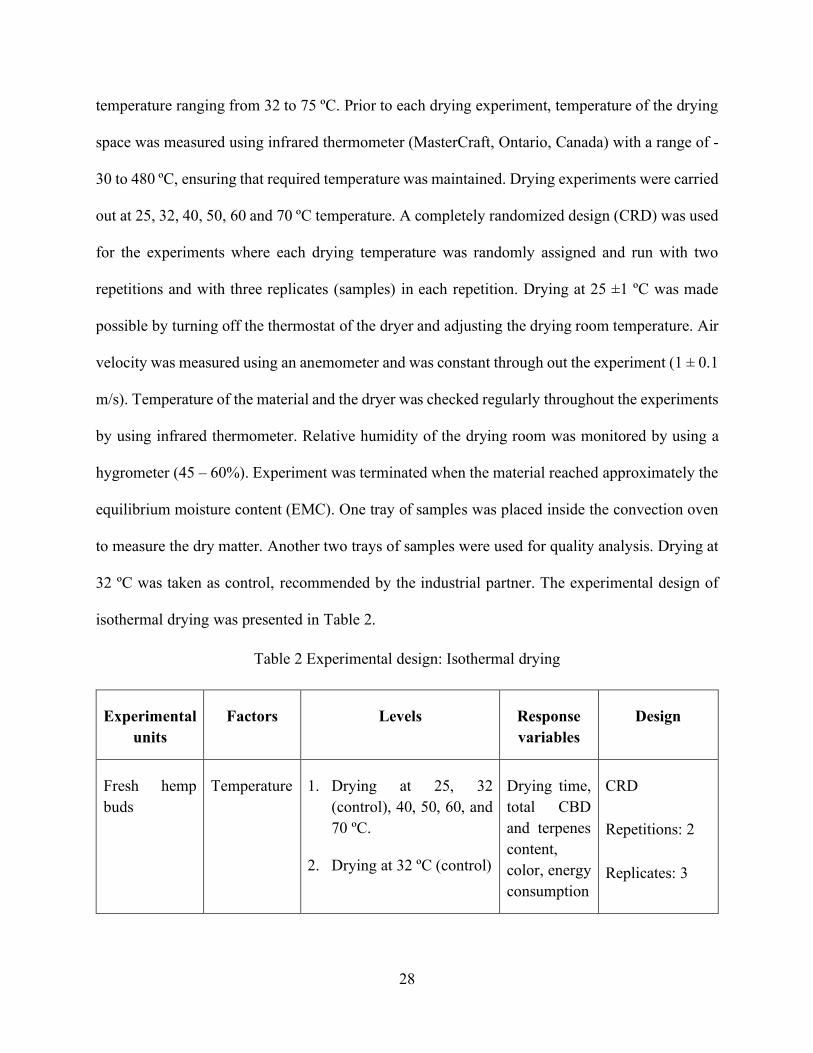
temperature ranging from 32 to 75 ºC. Prior to each drying experiment, temperature of the drying
space was measured using infrared thermometer (MasterCraft, Ontario, Canada) with a range of -
30 to 480 ºC, ensuring that required temperature was maintained. Drying experiments were carried
out at 25, 32, 40, 50, 60 and 70 ºC temperature. A completely randomized design (CRD) was used
for the experiments where each drying temperature was randomly assigned and run with two
repetitions and with three replicates (samples) in each repetition. Drying at 25 ±1 ºC was made
possible by turning off the thermostat of the dryer and adjusting the drying room temperature. Air
velocity was measured using an anemometer and was constant through out the experiment (1 ± 0.1
m/s). Temperature of the material and the dryer was checked regularly throughout the experiments
by using infrared thermometer. Relative humidity of the drying room was monitored by using a
hygrometer (45 – 60%). Experiment was terminated when the material reached approximately the
equilibrium moisture content (EMC). One tray of samples was placed inside the convection oven
to measure the dry matter. Another two trays of samples were used for quality analysis. Drying at
32 ºC was taken as control, recommended by the industrial partner. The experimental design of
isothermal drying was presented in Table 2.
Table 2 Experimental design: Isothermal drying
Experimental
units
Factors Levels Response
variables
Design
Fresh hemp
buds
Temperature 1. Drying at 25, 32
(control), 40, 50, 60, and
70 ºC.
2. Drying at 32 ºC (control)
Drying time,
total CBD
and terpenes
content,
color, energy
consumption
CRD
Repetitions: 2
Replicates: 3

29
2.4.2. Non-Isothermal (Stepwise) Drying
In this work, the method of stepwise drying was presented as an alternative to the conventional
drying that uses a constant temperature during the whole process. The objective of stepwise drying
is to decrease the drying time and thereby, reduce the overall energy consumption with maximum
quality retention. Drying of hemp was notably faster in the initial stage compared to the later
stages. Hence, higher temperatures were applied during the later stages or falling rate periods
thereby reducing the total drying time. The temperature change points chosen in the experiments
are based on the moisture content of the product on a wet basis (w.b.) (Table 3). In the first set of
experiments, initial temperature was set at 40 ºC and later increased to 70 ℃ when the product
reached the moisture content of 45% (w.b.). Whereas, in the following set, the temperature was
increased (from 40 to 70 ℃) when the product MC reached 25%. Similarly, the temperature was
first set at 40 ºC and increased quickly to 60 ℃ using the thermostat when the product reached
45%, and 25% (respective moisture contents were predicted using the weight to moisture content
data of hemp buds from the preliminary experiments). Drying at 32 ºC was taken as control since
it was close to the drying temperature practiced by the industrial partner. Experiments were done
in duplicates with three set of samples in each replicate. Non-isothermal drying experiments were
done in the same convective dryer that was used for the isothermal drying (Figure 15).
30
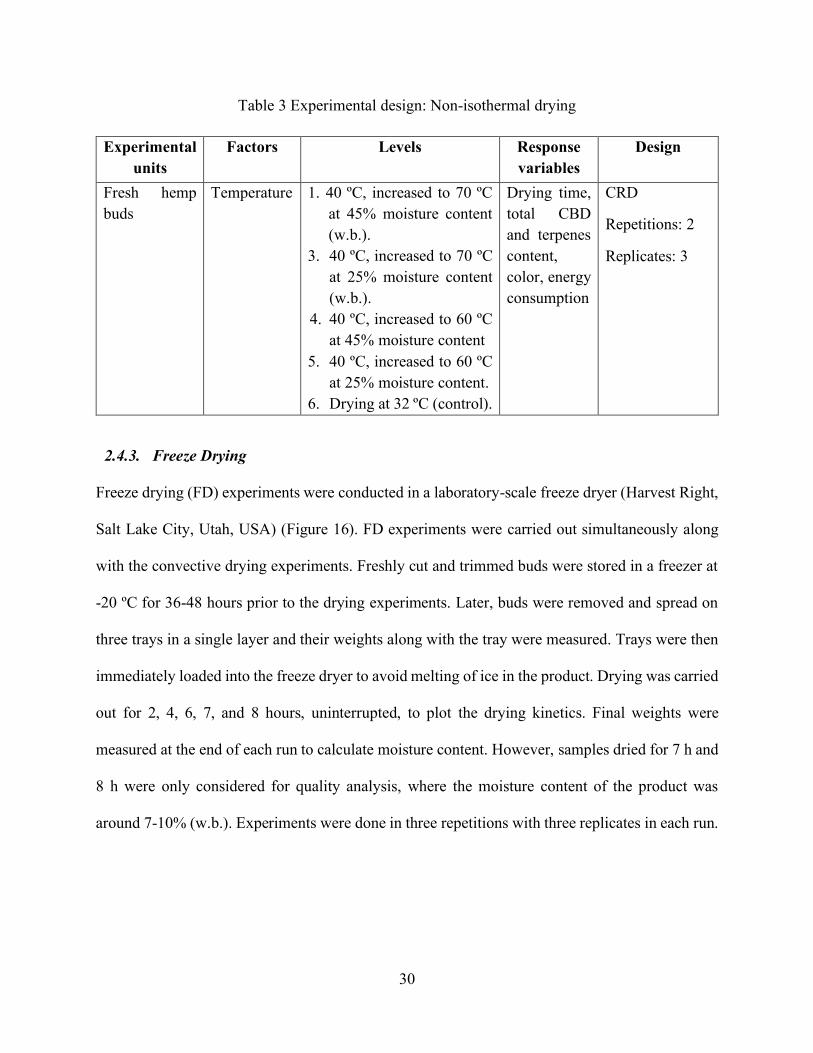
Table 3 Experimental design: Non-isothermal drying
Experimental
units
Factors Levels Response
variables
Design
Fresh hemp
buds
Temperature 1. 40 ºC, increased to 70 ºC
at 45% moisture content
(w.b.).
3. 40 ºC, increased to 70 ºC
at 25% moisture content
(w.b.).
4. 40 ºC, increased to 60 ºC
at 45% moisture content
5. 40 ºC, increased to 60 ºC
at 25% moisture content.
6. Drying at 32 ºC (control).
Drying time,
total CBD
and terpenes
content,
color, energy
consumption
CRD
Repetitions: 2
Replicates: 3
2.4.3. Freeze Drying
Freeze drying (FD) experiments were conducted in a laboratory-scale freeze dryer (Harvest Right,
Salt Lake City, Utah, USA) (Figure 16). FD experiments were carried out simultaneously along
with the convective drying experiments. Freshly cut and trimmed buds were stored in a freezer at
-20 ºC for 36-48 hours prior to the drying experiments. Later, buds were removed and spread on
three trays in a single layer and their weights along with the tray were measured. Trays were then
immediately loaded into the freeze dryer to avoid melting of ice in the product. Drying was carried
out for 2, 4, 6, 7, and 8 hours, uninterrupted, to plot the drying kinetics. Final weights were
measured at the end of each run to calculate moisture content. However, samples dried for 7 h and
8 h were only considered for quality analysis, where the moisture content of the product was
around 7-10% (w.b.). Experiments were done in three repetitions with three replicates in each run.
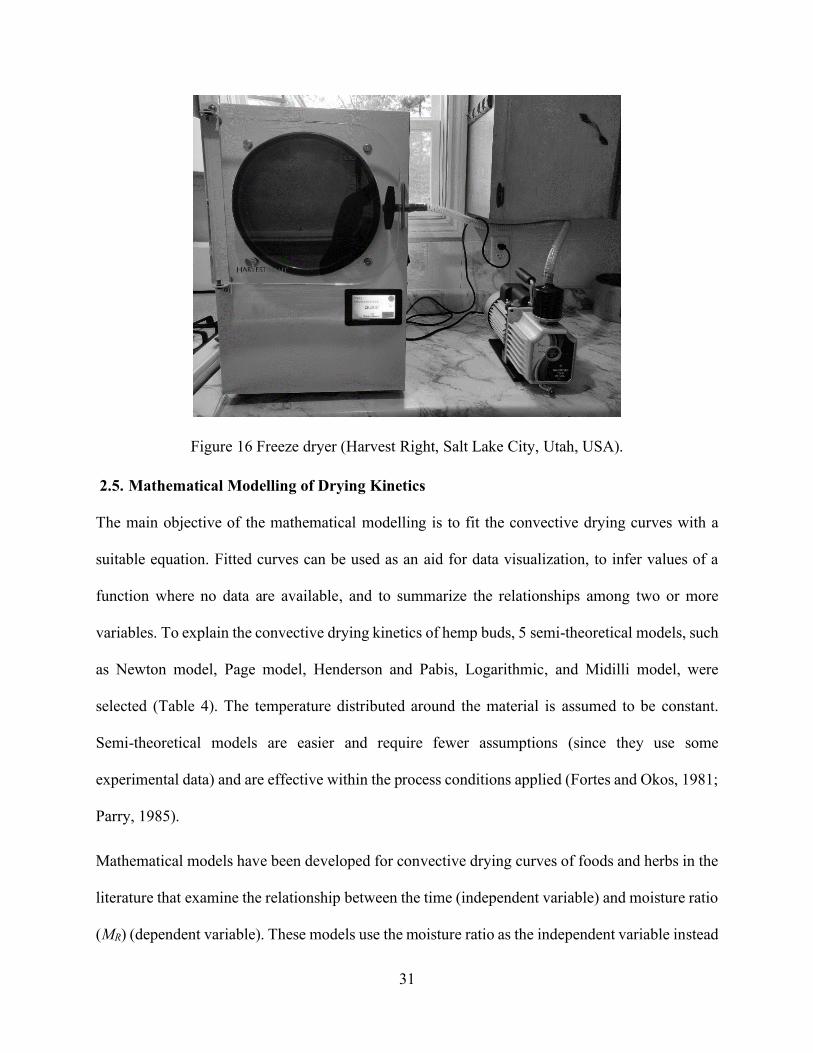
31
Figure 16 Freeze dryer (Harvest Right, Salt Lake City, Utah, USA).
2.5. Mathematical Modelling of Drying Kinetics
The main objective of the mathematical modelling is to fit the convective drying curves with a
suitable equation. Fitted curves can be used as an aid for data visualization, to infer values of a
function where no data are available, and to summarize the relationships among two or more
variables. To explain the convective drying kinetics of hemp buds, 5 semi-theoretical models, such
as Newton model, Page model, Henderson and Pabis, Logarithmic, and Midilli model, were
selected (Table 4). The temperature distributed around the material is assumed to be constant.
Semi-theoretical models are easier and require fewer assumptions (since they use some
experimental data) and are effective within the process conditions applied (Fortes and Okos, 1981;
Parry, 1985).
Mathematical models have been developed for convective drying curves of foods and herbs in the
literature that examine the relationship between the time (independent variable) and moisture ratio
(MR) (dependent variable). These models use the moisture ratio as the independent variable instead
32
of the moisture content of the material since, all the respective material might not have the same
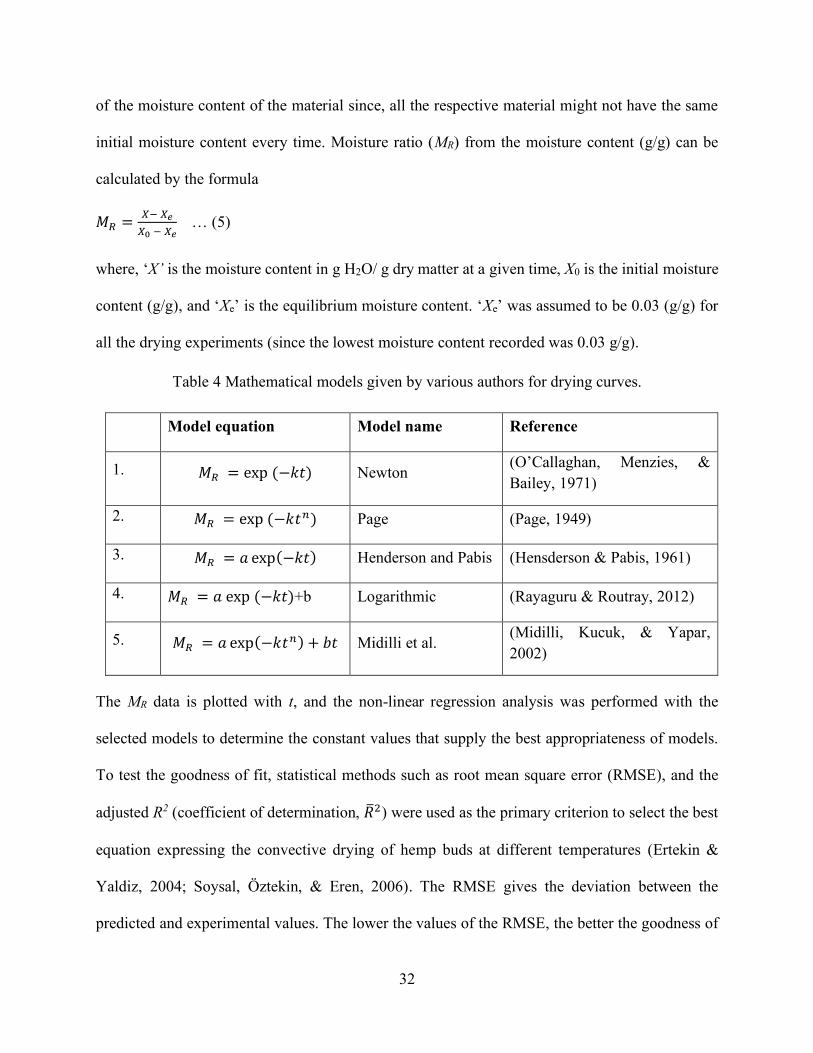
initial moisture content every time. Moisture ratio (MR) from the moisture content (g/g) can be
calculated by the formula
𝑀𝑅 =𝑋− 𝑋𝑒
𝑋0 − 𝑋𝑒 … (5)
where, ‘X’ is the moisture content in g H2O/ g dry matter at a given time, X0 is the initial moisture
content (g/g), and ‘Xe’ is the equilibrium moisture content. ‘Xe’ was assumed to be 0.03 (g/g) for
all the drying experiments (since the lowest moisture content recorded was 0.03 g/g).
Table 4 Mathematical models given by various authors for drying curves.
Model equation Model name Reference
1. 𝑀𝑅 = exp (−𝑘𝑡) Newton (O’Callaghan, Menzies, &
Bailey, 1971)
2. 𝑀𝑅 = exp (−𝑘𝑡𝑛) Page (Page, 1949)
3. 𝑀𝑅 = 𝑎 exp(−𝑘𝑡) Henderson and Pabis (Hensderson & Pabis, 1961)
4. 𝑀𝑅 = 𝑎 exp (−𝑘𝑡)+b Logarithmic (Rayaguru & Routray, 2012)
5. 𝑀𝑅 = 𝑎 exp(−𝑘𝑡𝑛) + 𝑏𝑡 Midilli et al. (Midilli, Kucuk, & Yapar,
2002)
The MR data is plotted with t, and the non-linear regression analysis was performed with the
selected models to determine the constant values that supply the best appropriateness of models.
To test the goodness of fit, statistical methods such as root mean square error (RMSE), and the
adjusted R2 (coefficient of determination, �̅�2) were used as the primary criterion to select the best
equation expressing the convective drying of hemp buds at different temperatures (Ertekin &
Yaldiz, 2004; Soysal, Öztekin, & Eren, 2006). The RMSE gives the deviation between the
predicted and experimental values. The lower the values of the RMSE, the better the goodness of
33
fit. The �̅�2, on the other hand, gives the percentage of variation explained by the independent
variables that affect the dependent variable (shows the proportion of variation explained by the
fitted line) and needed to be close to 1 for the better results. These statistical criterions can be
calculated as follows:
𝑅𝑀𝑆𝐸 = [1
𝑁∑ (𝑀𝑅,𝑐𝑎𝑙,𝑖 − 𝑀𝑅,𝑒𝑥𝑝,𝑖)
2𝑁𝑖=1 ]
12⁄
… (6)
R̅2 = 1 − (1 − R2)n−1
n−p−1 … (7)
where ‘p’ is the total number of explanatory variables in the model (not including the constant
term), and ‘n’ is the sample size. Eq. 7 can also be represented as:
R̅2 = 1 −
SSresdfe
⁄
SStotdft
⁄ … (8)
where ‘dft’ is the degrees of freedom (n – 1) of the estimate of the population variance of the
dependent variable, and ‘dfe’ is the degrees of freedom (n – p – 1) of the estimate of the underlying
population error variance.
2.6. Effective Moisture Diffusivity (Deff)
Diffusion in solids is an important and the main transport mechanism involved in the moisture
removal from foods. The overall diffusion phenomenon is combined into single term and named
as effective moisture diffusivity (Deff) (Erbay & Icier, 2010). Initially evaporation of water takes
place through capillary action at a constant drying rate which is similar to the drying of free water
on a surface. However, as the upper layers dry, a gradient among the upper and the underneath
layers arise which leads to diffusion of water. This phenomenon is associated with the increase of
product temperature (based on the surrounding temperature) and decline in the drying rate.
Certainly, the concave form of drying curves is a result of variation of the moisture content and
34
Deff during drying. Hence, the slopes of these curves can be derived from linear regression of
ln(MR)-t data (Mujumdar, 2014). Deff varies mainly with the product’s internal conditions such as
temperature, moisture content, and structure. External factors such as air temperature and velocity
on the other hand are insignificant in some ranges compared to the internal conditions. Therefore,
for clarifying the drying characteristics of hemp buds, it is important to calculate Deff (Erbay &
Icier, 2010).
The analytical solution to Fick’s second law was used for estimation of the effective moisture
diffusion coefficient Deff in hemp buds (Crank, 1979):
𝑀𝑅 =8
𝜋2∑
1
(2𝑖+1)2 𝑒𝑥𝑝 (−(2𝑖+1)2𝜋2𝐷𝑒𝑓𝑓𝑡
4𝐿2 )∞𝑖=0 … (9)
where, MR is the moisture ratio, L is the sample thickness, t is the temperature, and Deff is the
moisture diffusivity. The value of Deff was used as an empirical parameter that characterises the
drying rate, despite limited restrictions in the diffusion theory in describing the experimental
drying data (Hamdami, Monteau, & Le Bail, 2004). The first five terms in the series expansion of
Eq. 9 were considered in the least square fitting procedure (i = 0 to 4), since there was no change
in the third decimal of R̅2 and RMSE beyond the fifth term (Lebovka, Shynkaryk, & Vorobiev,
2007).
2.7. Activation Energy (Ea)
The amount of energy required to initiate a chemical reaction is termed as activation energy
(Martynenko & Janaszek, 2014). Physical and thermal properties of biological products, such as
moisture diffusion, and activation energy, are necessary for the standard dryer design (Aghbashlo
& Samimi-Akhijahani, 2008). The relationship between drying temperature, effective diffusion
coefficient, and activation energy is determined by the Arrhenius model.
35
𝐷𝑒𝑓𝑓 = 𝐷∞𝑒𝑥𝑝 (𝐸𝑎
𝑅𝑇) … (10)
where 𝐷∞ is the Arrhenius constant, Ea is the activation energy and R is the universal gas constant
(8.314 J/mol/K). Therefore, the activation energy of drying was determined from effective
diffusion coefficients at two different temperatures (25 ºC and 70 ºC) using the following equation
(Martynenko & Janaszek, 2014):
Ea = R ln (D2
D1) .
T1T2
T2−T1 … (11)
where, D2 and D1 are the moisture effective diffusion coefficients at 343.15 K (T2, 70 ºC) and
298.15 K (T1, 25 ºC) respectively. The value of Ea denotes the sensibility of the diffusivity against
temperature. The greater value of Ea represents more sensibility of Deff to temperature (Kaymak‐
Ertekin, 2002).
2.8. Quality Analysis
2.8.1. Cannabinoids Content
The analytical methods for cannabidiol content and terpenes profile were adopted from the
published method of United Nations Office on Drugs & Crime with minor modifications
(UNODOC, 2009).
An Agilent 1220 Infinite high-performance liquid chromatography (HPLC) coupled with an
Agilent 1260 Infinity II Diode-array detector (DAD) was used for the analysis of cannabinoids.
Parameters:
- Column type: 250x4mm RP-8 (5 μm); pre-column 4x4mm RP-8 (5 μm)
- Injection: 10 / 20 μL
- Column temperature: 30°C
- Gradient Pump: Isocratic

36
- Mobile Phase: Acetonitrile : water (8:2 v/v).
- Flow: 1 ml/min
- Wavelength detection: 220 to 240 nm
Sample preparation and extraction:
Two grams of representative sample received was placed aside for calculating the moisture content
(g/g). The remainder of the representative sample was dipped in liquid nitrogen and frozen before
grinding. Then sample was ground and equilibrated to room temperature. One gram of the ground
sample was weighed, ensuring that the liquid nitrogen has completely evaporated from the sample,
and was added to a 50 mL Falcon tube. This sample was extracted (double extraction, 40x dilution)
with 10 - 20 mL methanol/ methanol : chloroform (9:1 v/v) on a vortex for 15 - 20 minutes. The
sample was then filtered using Whatman™ filter paper for 15 - 20 minutes. The double methanol
extraction results in 99.5% extraction of the cannabinoids.
Calibration:
Stock solution: Nine Standard solutions- 100 μL each of Δ9-THC, CBD, Δ-8THC, CBC, CBG,
CBN, THCV, THCA and CBDA.
Dilution 1: 100 μL stock solution in 900 μL methanol = 0.1 mg/ml.
Dilution 2: 100 μL of dilution 1 in 900 μL methanol = 0.1 mg/ml.
Quantifications of cannabinoids were achieved by comparing the ratio of sample/ISTD with the
ratio of the external standard (ESTD)/ISTD at the target concentration. Retention time for CBD is
4.9 min at 220 to 240 nm wavelengths. Cannabinoid analysis results were reported individually as
CBDA, CBD, and total CBD content (w/w %).

37
2.8.2. Terpenes Profile
An Agilent 7820A gas chromatographer (GC) coupled with an Agilent 7693 autosampler and
flame ionization detector (FID) was used for the analysis of terpenes. An Agilent DB-5 column
(30m x 0.250 mm, 0.25 micron) was used for the separation of terpenes.
GC parameters:
- Injection: 5/ 10 μL
- Equilibration time: 1.5 - 2 min
- Oven/column temperature:
• Initial: 35 °C – hold 4 min
• Ramp 1: 10 °C/min up to 105 °C – hold 0 min
• Ramp 2: 15 °C/min up to 205 °C – hold 0 min
• Ramp 3: 35 °C/min up to 270 °C – hold 5 min
FID:
- Heater: 340 °C
- Compressed gas flow: 400 mL/min
- H2 gas flow: 40 mL/min
- Make-up gas flow: 5 mL/min
Terpene certified reference materials (CRMs) were used as received (2.5 mg/mL, LGC standards
and Sigma Aldrich). All gases used were obtained from Air Liquide.
Sample preparation:
Two grams of representative sample received was placed aside for calculating the moisture content
(g/g). The remainder of the representative sample was dipped in liquid nitrogen and frozen before
grinding. Then sample was ground and equilibrated to room temperature. One gram of the ground
38
sample was weighed, ensuring that, all the liquid nitrogen has evaporated from the sample, and
was added to a 50 mL Falcon tube. This sample was extracted (double extraction, 40x dilution)
with 20 mL methanol and vortexed for 20 minutes at 500 rpm. The sample was then filtered using
Whatman™ filter paper for 20 minutes. The double methanol extraction results in 99.5%
extraction of the cannabinoids. No further dilutions were performed, and 1 mL of the extract was
pipetted into a clean GC vial for analysis.
Calibration:
Standards of 35 common terpenes found in hemp and cannabis, (α-pinene, Camphene, Sabinene,
β-pinene, Myrcene, α-phellandrene, 3-carene, α-terpinene, p-cymene, Limonene, Eucalyptol,
Ocimene, g-terpinene, Sabinene, Hydrate, Terpinolene, Linalool, Fenchol, Camphor, Isoborneol,
Borneol, Menthol, α-terpineol, Nerol, Pulegone, Geraniol, Geranyl Acetate, α-cedrene, β-
Caryophyllene, α-Humulene, Valencene, Nerolidol, Caryophyllene Oxide, Guaiol, Cedrol, α-
bisabolol), were prepared, at 7 different concentrations of 1 to 25 μg/mL to obtain a 7 points
calibrations curve for the terpene quantification.
Quantifications of terpenes were achieved by comparing the ratio of sample/ISTD with the ratio
of ESTD/ISTD at the target concentration. Terpene analysis results were reported as total terpenes
content (w/w%). The methods have been validated by Perennia (www.perennia.ca) in Truro.
2.8.3. Color
Color of medicinal and aromatic plants is considered as a primary quality criterion to the
consumers, who prefer the buds with a natural appearance. Degradation of color or browning can
be indirectly related to quality deterioration due to enzymatic reactions caused by the activity of
polyphenol oxidase (PPO) during postharvest handling (Argyropoulos & Müller, 2014a, 2014b).
39
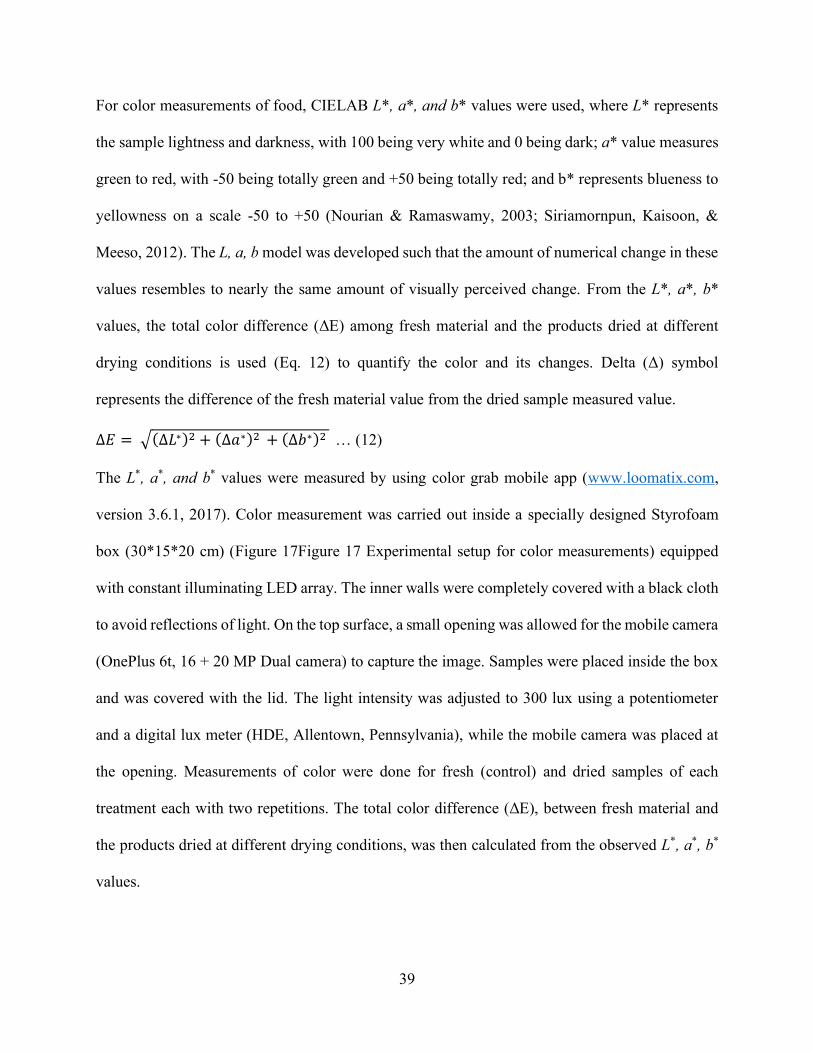
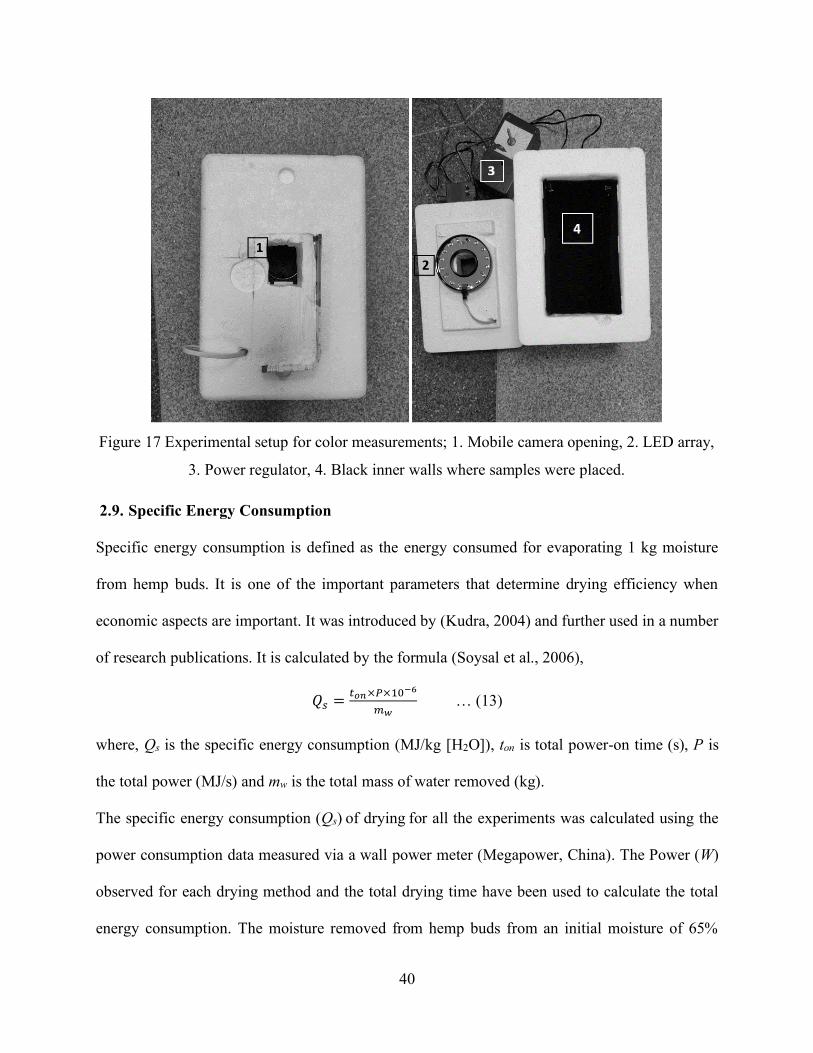
For color measurements of food, CIELAB L*, a*, and b* values were used, where L* represents
the sample lightness and darkness, with 100 being very white and 0 being dark; a* value measures
green to red, with -50 being totally green and +50 being totally red; and b* represents blueness to
yellowness on a scale -50 to +50 (Nourian & Ramaswamy, 2003; Siriamornpun, Kaisoon, &
Meeso, 2012). The L, a, b model was developed such that the amount of numerical change in these
values resembles to nearly the same amount of visually perceived change. From the L*, a*, b*
values, the total color difference (ΔE) among fresh material and the products dried at different
drying conditions is used (Eq. 12) to quantify the color and its changes. Delta (Δ) symbol
represents the difference of the fresh material value from the dried sample measured value.
∆𝐸 = √(∆𝐿∗)2 + (∆𝑎∗)2 + (∆𝑏∗)2 … (12)
The L*, a*, and b* values were measured by using color grab mobile app (www.loomatix.com,
version 3.6.1, 2017). Color measurement was carried out inside a specially designed Styrofoam
box (30*15*20 cm) (Figure 17Figure 17 Experimental setup for color measurements) equipped
with constant illuminating LED array. The inner walls were completely covered with a black cloth
to avoid reflections of light. On the top surface, a small opening was allowed for the mobile camera
(OnePlus 6t, 16 + 20 MP Dual camera) to capture the image. Samples were placed inside the box
and was covered with the lid. The light intensity was adjusted to 300 lux using a potentiometer
and a digital lux meter (HDE, Allentown, Pennsylvania), while the mobile camera was placed at
the opening. Measurements of color were done for fresh (control) and dried samples of each
treatment each with two repetitions. The total color difference (ΔE), between fresh material and
the products dried at different drying conditions, was then calculated from the observed L*, a*, b*
values.
40
Figure 17 Experimental setup for color measurements; 1. Mobile camera opening, 2. LED array,
3. Power regulator, 4. Black inner walls where samples were placed.
2.9. Specific Energy Consumption
Specific energy consumption is defined as the energy consumed for evaporating 1 kg moisture
from hemp buds. It is one of the important parameters that determine drying efficiency when
economic aspects are important. It was introduced by (Kudra, 2004) and further used in a number
of research publications. It is calculated by the formula (Soysal et al., 2006),
𝑄𝑠 =𝑡𝑜𝑛×𝑃×10−6
𝑚𝑤 … (13)
where, Qs is the specific energy consumption (MJ/kg [H2O]), ton is total power-on time (s), P is
the total power (MJ/s) and mw is the total mass of water removed (kg).
The specific energy consumption (Qs) of drying for all the experiments was calculated using the
power consumption data measured via a wall power meter (Megapower, China). The Power (W)
observed for each drying method and the total drying time have been used to calculate the total
energy consumption. The moisture removed from hemp buds from an initial moisture of 65%
41
(since average initial moisture of hemp buds is ≈ 65%) to a final moisture of 10%, was assumed
to be constant in all the drying treatments. The specific energy consumption was thus calculated
by dividing the total energy with the total moisture removed (0.055 kg).
2.10. Statistical Analysis
A completely randomized design (CRD) was used to carry out drying experiments. All the
isothermal drying experiments at different temperatures were conducted randomly followed by
non-isothermal drying experiments. Freeze drying experiments were conducted simultaneously.
Considering the short harvest period available, thereby for conducting the experiments, and
keeping in mind the costs for analysing CBD and terpenes content, there was very little possibility
to conduct experiments with more than two repetitions. However, the results that showed high
CBD content were again verified with two replications as mentioned in section 3.5. The effect of
the 11 drying conditions on total CBD content (%), and total terpenes content (%) was determined
using one-way analysis of variance (ANOVA). The validity of the model assumptions (normal
distribution and constant variance of the error terms) for each response was verified by examining
the residuals (Montgomery, 2017). To verify the normal distribution assumption, normal
probability plot of the residuals and the Anderson–Darling test for normality were used. To verify
the constant variance assumption, plot of the residuals vs. fitted values was used. Independence
assumption was ensured by randomization. Since the effect of drying temperature on the total
terpenes content was significant (P < 0.05), multiple means comparison was conducted using
Fisher’s least significant difference (LSD) test at 5% level of significance to compare the total
terpenes content among each treatment. For color, analysis of variance was used to compare the
mean ΔE values at 5% significance level. The analysis was carried out using Minitab software
(Minitab LLC, 2019).
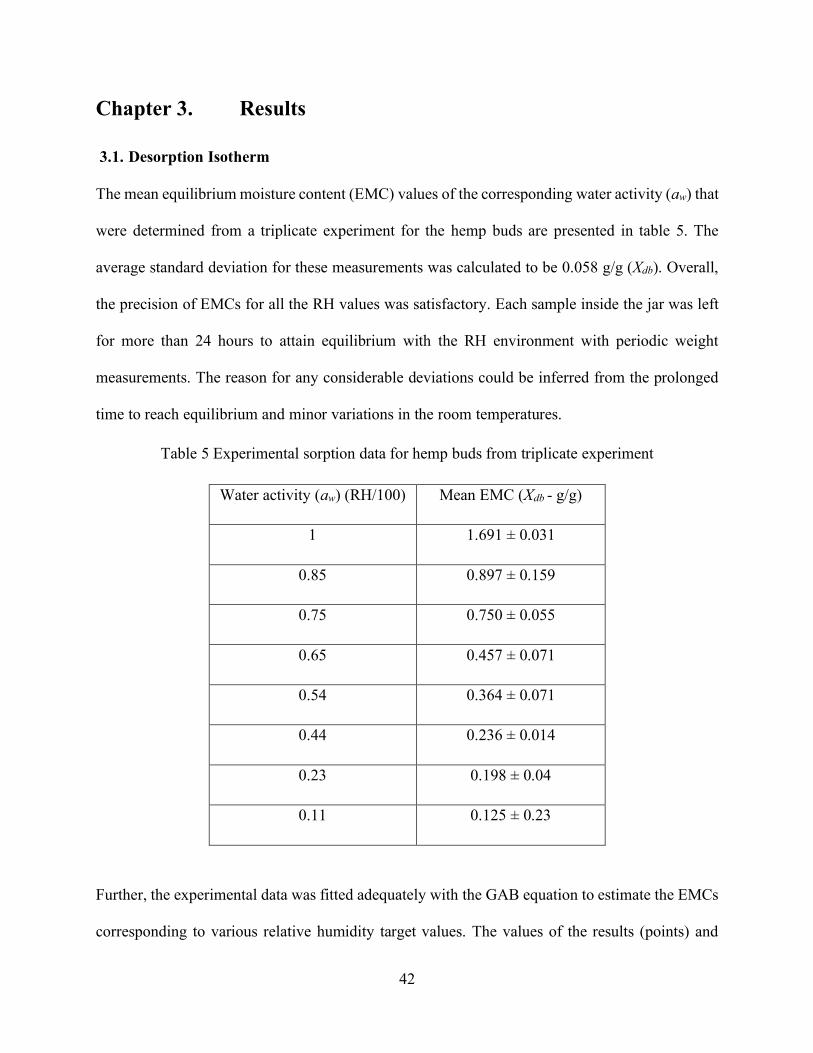
42
Chapter 3. Results
3.1. Desorption Isotherm
The mean equilibrium moisture content (EMC) values of the corresponding water activity (aw) that
were determined from a triplicate experiment for the hemp buds are presented in table 5. The
average standard deviation for these measurements was calculated to be 0.058 g/g (Xdb). Overall,
the precision of EMCs for all the RH values was satisfactory. Each sample inside the jar was left
for more than 24 hours to attain equilibrium with the RH environment with periodic weight
measurements. The reason for any considerable deviations could be inferred from the prolonged
time to reach equilibrium and minor variations in the room temperatures.
Table 5 Experimental sorption data for hemp buds from triplicate experiment
Water activity (aw) (RH/100) Mean EMC (Xdb - g/g)
1 1.691 ± 0.031
0.85 0.897 ± 0.159
0.75 0.750 ± 0.055
0.65 0.457 ± 0.071
0.54 0.364 ± 0.071
0.44 0.236 ± 0.014
0.23 0.198 ± 0.04
0.11 0.125 ± 0.23
Further, the experimental data was fitted adequately with the GAB equation to estimate the EMCs
corresponding to various relative humidity target values. The values of the results (points) and
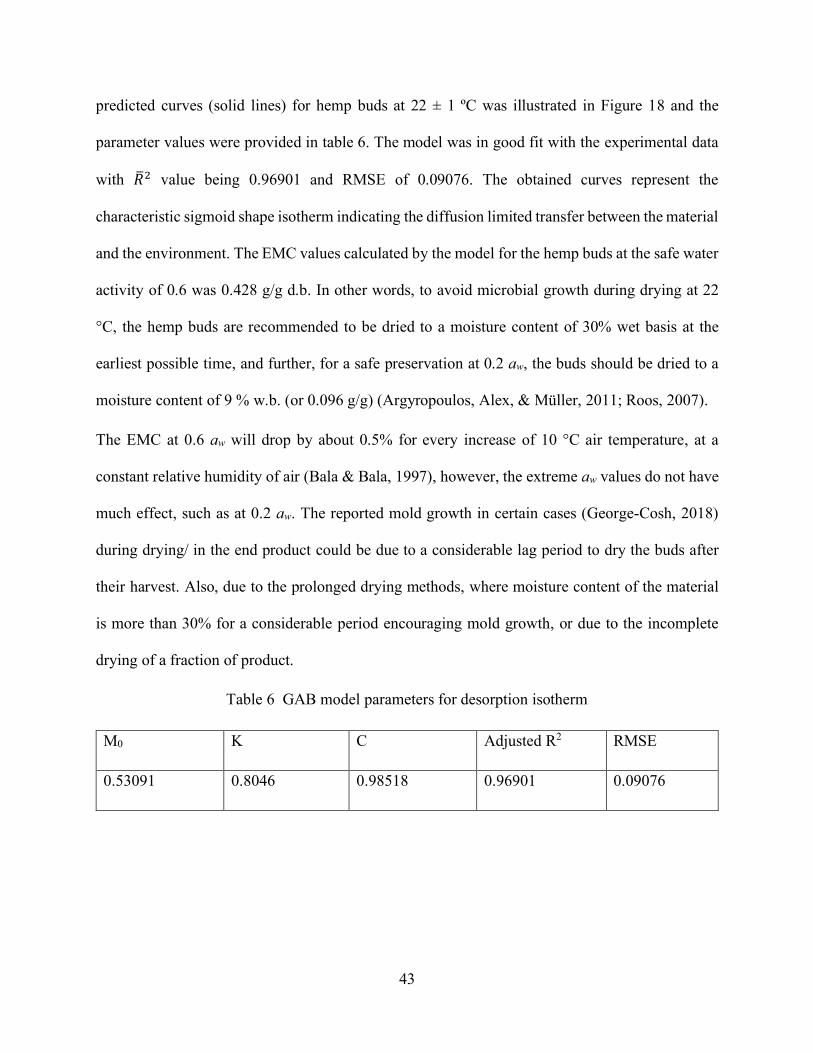
43
predicted curves (solid lines) for hemp buds at 22 ± 1 ºC was illustrated in Figure 18 and the
parameter values were provided in table 6. The model was in good fit with the experimental data
with �̅�2 value being 0.96901 and RMSE of 0.09076. The obtained curves represent the
characteristic sigmoid shape isotherm indicating the diffusion limited transfer between the material
and the environment. The EMC values calculated by the model for the hemp buds at the safe water
activity of 0.6 was 0.428 g/g d.b. In other words, to avoid microbial growth during drying at 22
°C, the hemp buds are recommended to be dried to a moisture content of 30% wet basis at the
earliest possible time, and further, for a safe preservation at 0.2 aw, the buds should be dried to a
moisture content of 9 % w.b. (or 0.096 g/g) (Argyropoulos, Alex, & Müller, 2011; Roos, 2007).
The EMC at 0.6 aw will drop by about 0.5% for every increase of 10 °C air temperature, at a
constant relative humidity of air (Bala & Bala, 1997), however, the extreme aw values do not have
much effect, such as at 0.2 aw. The reported mold growth in certain cases (George-Cosh, 2018)
during drying/ in the end product could be due to a considerable lag period to dry the buds after
their harvest. Also, due to the prolonged drying methods, where moisture content of the material
is more than 30% for a considerable period encouraging mold growth, or due to the incomplete
drying of a fraction of product.
Table 6 GAB model parameters for desorption isotherm
M0 K C Adjusted R2 RMSE
0.53091 0.8046 0.98518 0.96901 0.09076
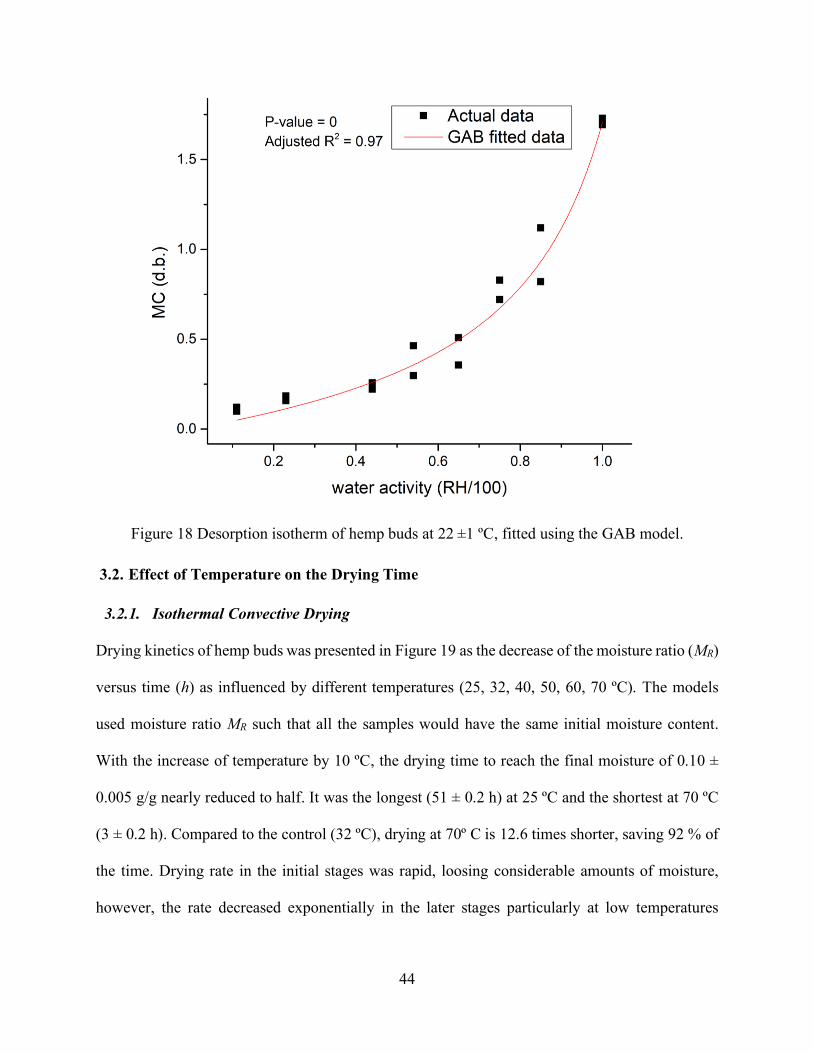
44
Figure 18 Desorption isotherm of hemp buds at 22 ±1 ºC, fitted using the GAB model.
3.2. Effect of Temperature on the Drying Time
3.2.1. Isothermal Convective Drying
Drying kinetics of hemp buds was presented in Figure 19 as the decrease of the moisture ratio (MR)
versus time (h) as influenced by different temperatures (25, 32, 40, 50, 60, 70 ºC). The models
used moisture ratio MR such that all the samples would have the same initial moisture content.
With the increase of temperature by 10 ºC, the drying time to reach the final moisture of 0.10 ±
0.005 g/g nearly reduced to half. It was the longest (51 ± 0.2 h) at 25 ºC and the shortest at 70 ºC
(3 ± 0.2 h). Compared to the control (32 ºC), drying at 70º C is 12.6 times shorter, saving 92 % of
the time. Drying rate in the initial stages was rapid, loosing considerable amounts of moisture,
however, the rate decreased exponentially in the later stages particularly at low temperatures
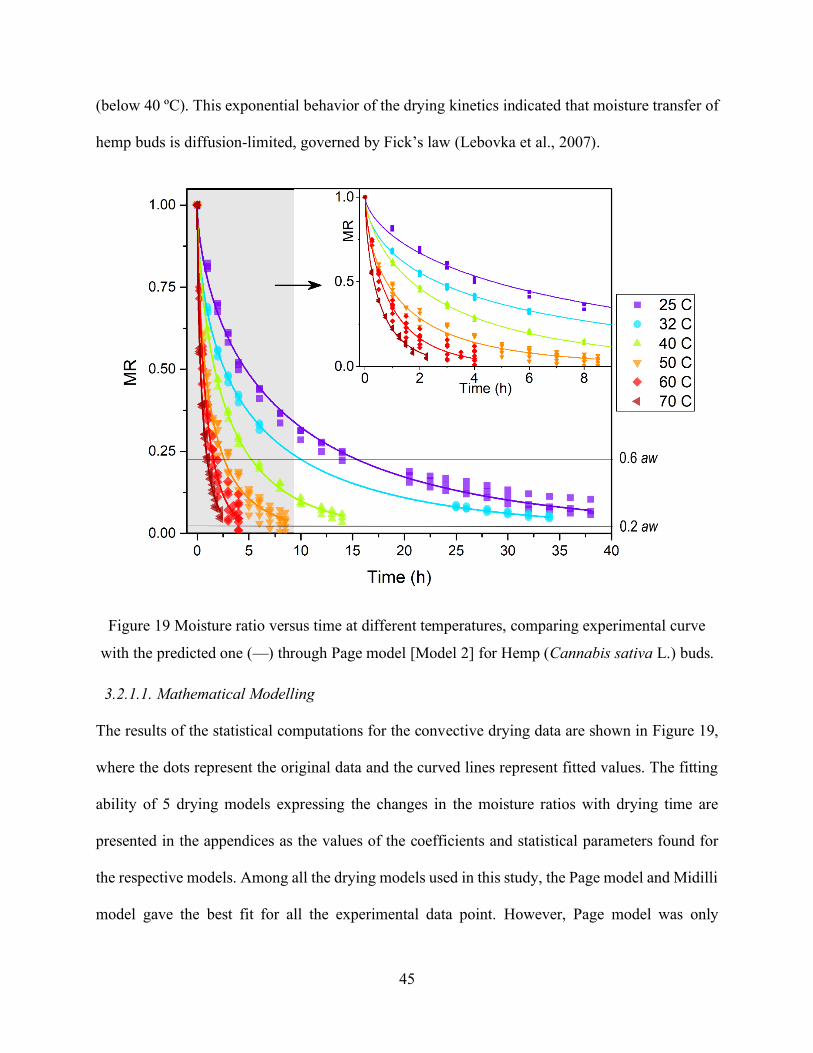
45
(below 40 ºC). This exponential behavior of the drying kinetics indicated that moisture transfer of
hemp buds is diffusion-limited, governed by Fick’s law (Lebovka et al., 2007).
Figure 19 Moisture ratio versus time at different temperatures, comparing experimental curve
with the predicted one (—) through Page model [Model 2] for Hemp (Cannabis sativa L.) buds.
3.2.1.1. Mathematical Modelling
The results of the statistical computations for the convective drying data are shown in Figure 19,
where the dots represent the original data and the curved lines represent fitted values. The fitting
ability of 5 drying models expressing the changes in the moisture ratios with drying time are
presented in the appendices as the values of the coefficients and statistical parameters found for
the respective models. Among all the drying models used in this study, the Page model and Midilli
model gave the best fit for all the experimental data point. However, Page model was only
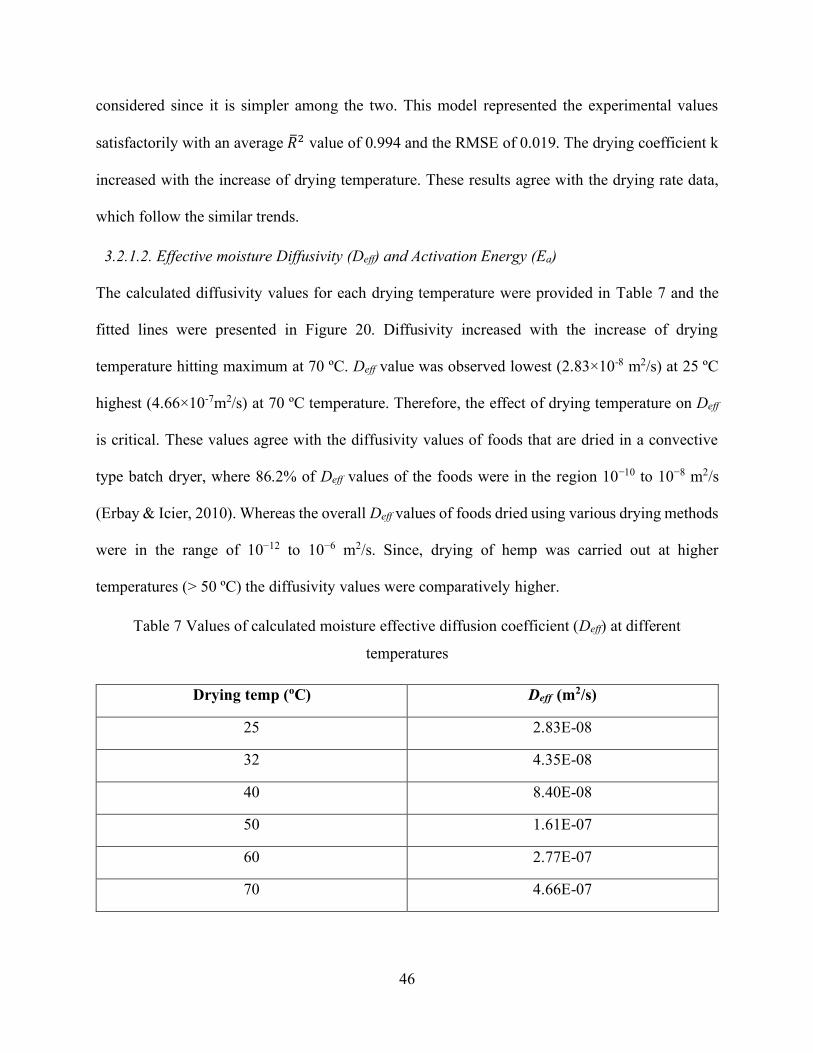
46
considered since it is simpler among the two. This model represented the experimental values
satisfactorily with an average �̅�2 value of 0.994 and the RMSE of 0.019. The drying coefficient k
increased with the increase of drying temperature. These results agree with the drying rate data,
which follow the similar trends.
3.2.1.2. Effective moisture Diffusivity (Deff) and Activation Energy (Ea)
The calculated diffusivity values for each drying temperature were provided in Table 7 and the
fitted lines were presented in Figure 20. Diffusivity increased with the increase of drying
temperature hitting maximum at 70 ºC. Deff value was observed lowest (2.83×10⁻⁸ m2/s) at 25 ºC
highest (4.66×10⁻⁷m2/s) at 70 ºC temperature. Therefore, the effect of drying temperature on Deff
is critical. These values agree with the diffusivity values of foods that are dried in a convective
type batch dryer, where 86.2% of Deff values of the foods were in the region 10−10 to 10−8 m2/s
(Erbay & Icier, 2010). Whereas the overall Deff values of foods dried using various drying methods
were in the range of 10−12 to 10−6 m2/s. Since, drying of hemp was carried out at higher
temperatures (> 50 ºC) the diffusivity values were comparatively higher.
Table 7 Values of calculated moisture effective diffusion coefficient (Deff) at different
temperatures
Drying temp (oC) Deff (m2/s)
25 2.83E-08
32 4.35E-08
40 8.40E-08
50 1.61E-07
60 2.77E-07
70 4.66E-07
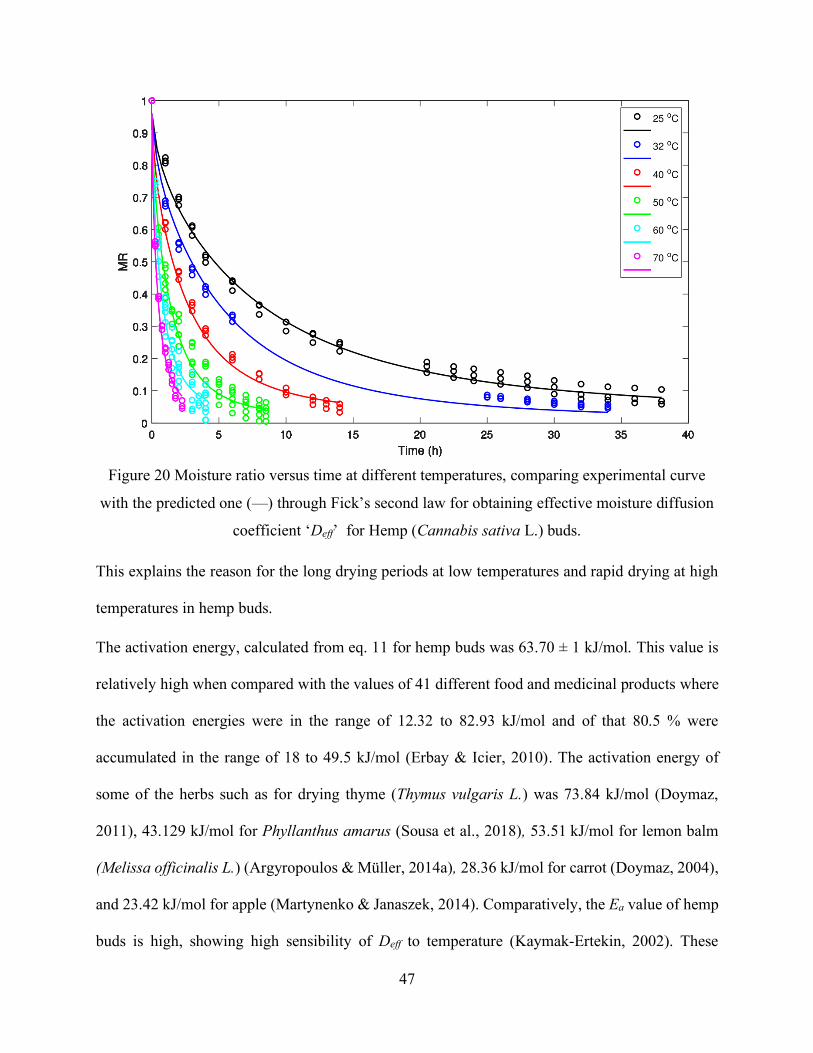
47
Figure 20 Moisture ratio versus time at different temperatures, comparing experimental curve
with the predicted one (—) through Fick’s second law for obtaining effective moisture diffusion
coefficient ‘Deff’ for Hemp (Cannabis sativa L.) buds.
This explains the reason for the long drying periods at low temperatures and rapid drying at high
temperatures in hemp buds.
The activation energy, calculated from eq. 11 for hemp buds was 63.70 ± 1 kJ/mol. This value is
relatively high when compared with the values of 41 different food and medicinal products where
the activation energies were in the range of 12.32 to 82.93 kJ/mol and of that 80.5 % were
accumulated in the range of 18 to 49.5 kJ/mol (Erbay & Icier, 2010). The activation energy of
some of the herbs such as for drying thyme (Thymus vulgaris L.) was 73.84 kJ/mol (Doymaz,
2011), 43.129 kJ/mol for Phyllanthus amarus (Sousa et al., 2018), 53.51 kJ/mol for lemon balm
(Melissa officinalis L.) (Argyropoulos & Müller, 2014a), 28.36 kJ/mol for carrot (Doymaz, 2004),
and 23.42 kJ/mol for apple (Martynenko & Janaszek, 2014). Comparatively, the Ea value of hemp
buds is high, showing high sensibility of Deff to temperature (Kaymak‐Ertekin, 2002). These
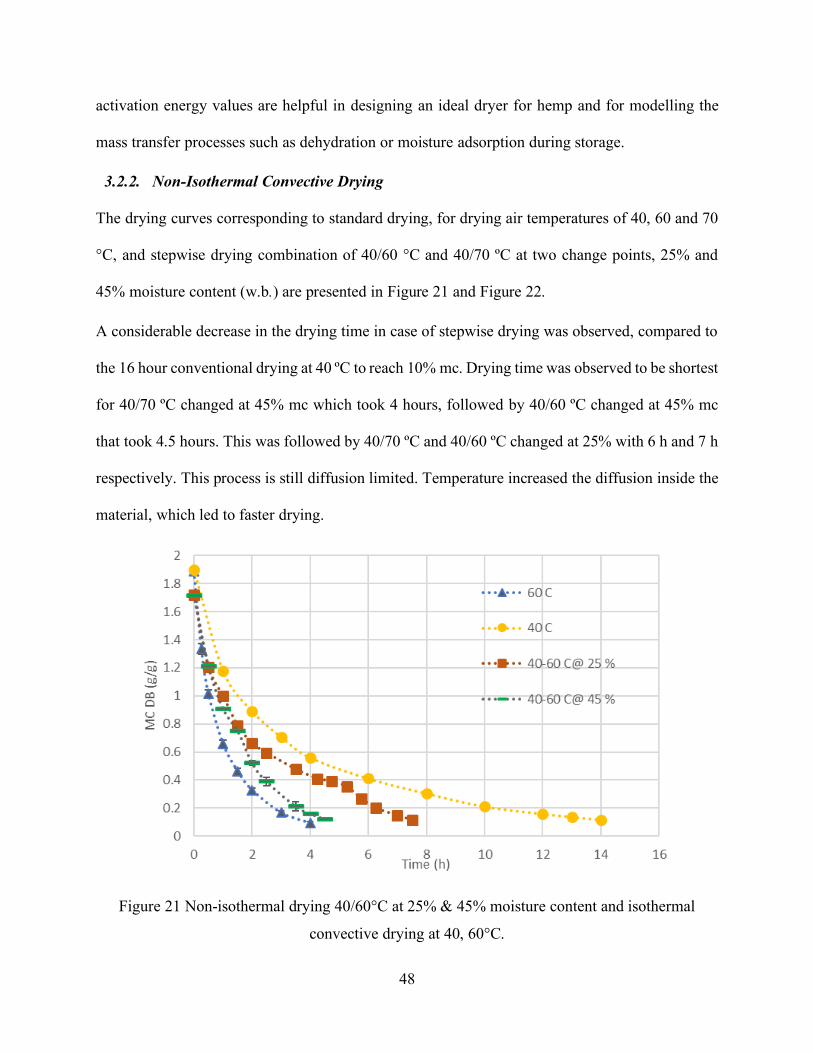
48
activation energy values are helpful in designing an ideal dryer for hemp and for modelling the
mass transfer processes such as dehydration or moisture adsorption during storage.
3.2.2. Non-Isothermal Convective Drying
The drying curves corresponding to standard drying, for drying air temperatures of 40, 60 and 70
°C, and stepwise drying combination of 40/60 °C and 40/70 ºC at two change points, 25% and
45% moisture content (w.b.) are presented in Figure 21 and Figure 22.
A considerable decrease in the drying time in case of stepwise drying was observed, compared to
the 16 hour conventional drying at 40 ºC to reach 10% mc. Drying time was observed to be shortest
for 40/70 ºC changed at 45% mc which took 4 hours, followed by 40/60 ºC changed at 45% mc
that took 4.5 hours. This was followed by 40/70 ºC and 40/60 ºC changed at 25% with 6 h and 7 h
respectively. This process is still diffusion limited. Temperature increased the diffusion inside the
material, which led to faster drying.
Figure 21 Non-isothermal drying 40/60°C at 25% & 45% moisture content and isothermal
convective drying at 40, 60°C.
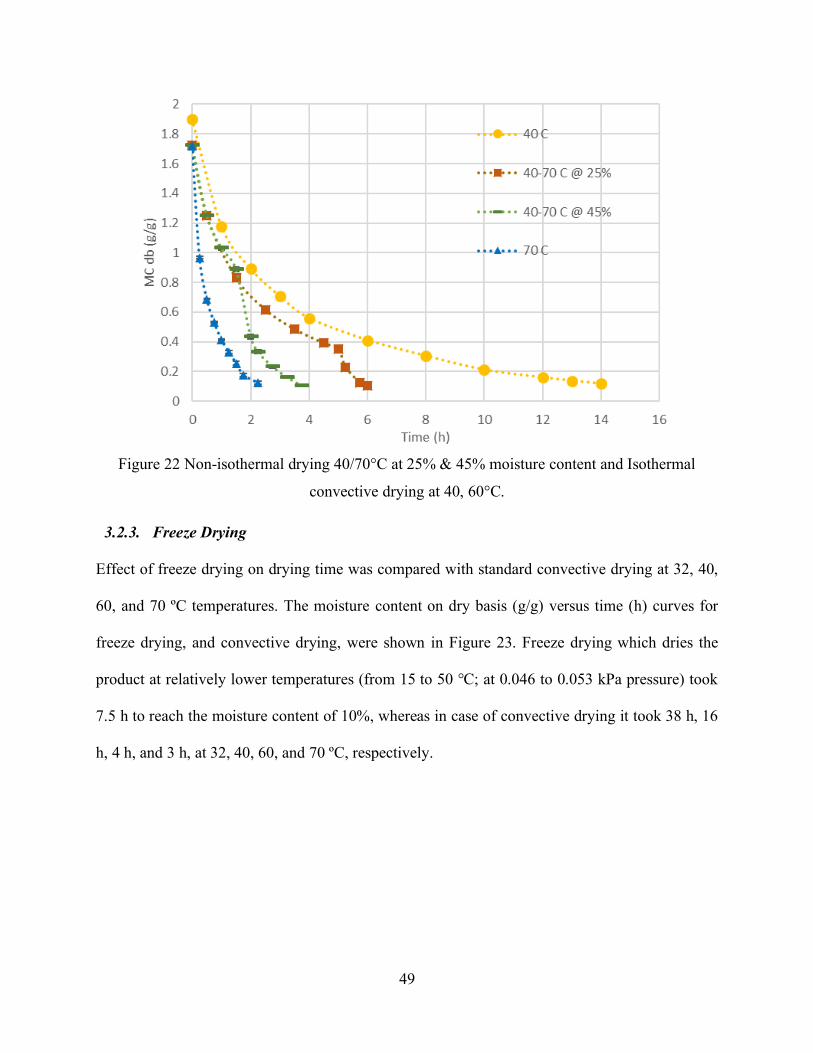
49
Figure 22 Non-isothermal drying 40/70°C at 25% & 45% moisture content and Isothermal
convective drying at 40, 60°C.
3.2.3. Freeze Drying
Effect of freeze drying on drying time was compared with standard convective drying at 32, 40,
60, and 70 ºC temperatures. The moisture content on dry basis (g/g) versus time (h) curves for
freeze drying, and convective drying, were shown in Figure 23. Freeze drying which dries the
product at relatively lower temperatures (from 15 to 50 ℃; at 0.046 to 0.053 kPa pressure) took
7.5 h to reach the moisture content of 10%, whereas in case of convective drying it took 38 h, 16
h, 4 h, and 3 h, at 32, 40, 60, and 70 ºC, respectively.
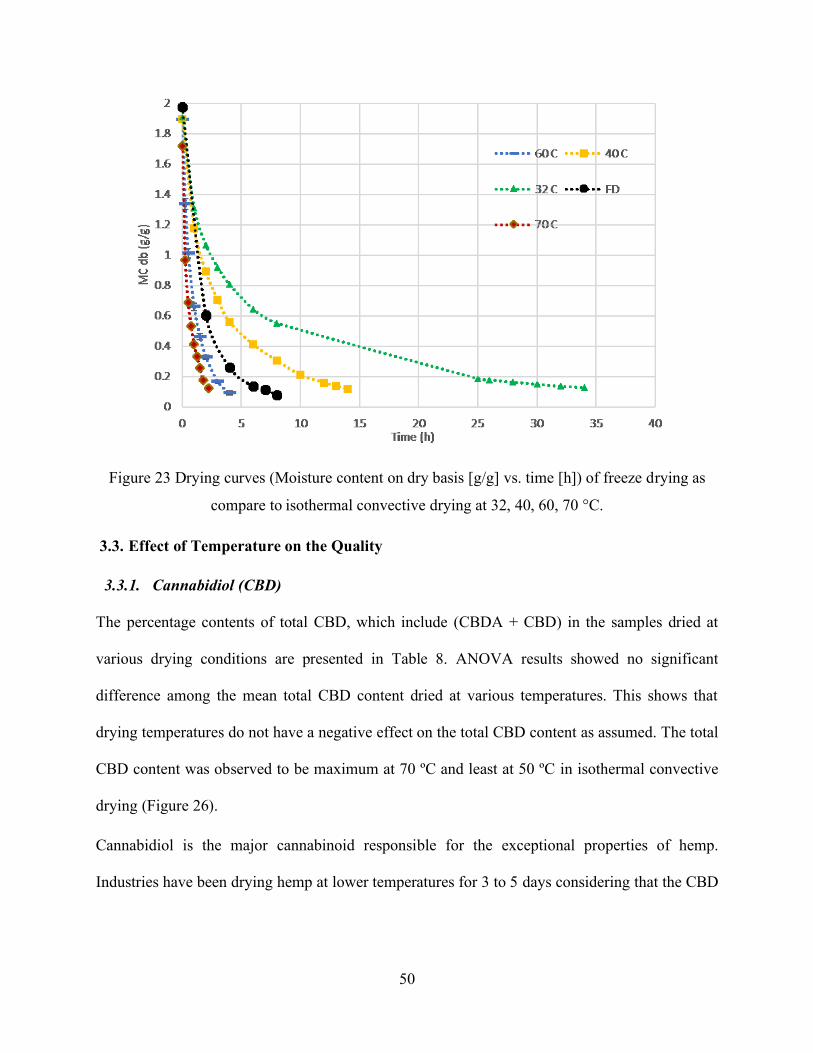
50
Figure 23 Drying curves (Moisture content on dry basis [g/g] vs. time [h]) of freeze drying as
compare to isothermal convective drying at 32, 40, 60, 70 °C.
3.3. Effect of Temperature on the Quality
3.3.1. Cannabidiol (CBD)
The percentage contents of total CBD, which include (CBDA + CBD) in the samples dried at
various drying conditions are presented in Table 8. ANOVA results showed no significant
difference among the mean total CBD content dried at various temperatures. This shows that
drying temperatures do not have a negative effect on the total CBD content as assumed. The total
CBD content was observed to be maximum at 70 ºC and least at 50 ºC in isothermal convective
drying (Figure 26).
Cannabidiol is the major cannabinoid responsible for the exceptional properties of hemp.
Industries have been drying hemp at lower temperatures for 3 to 5 days considering that the CBD
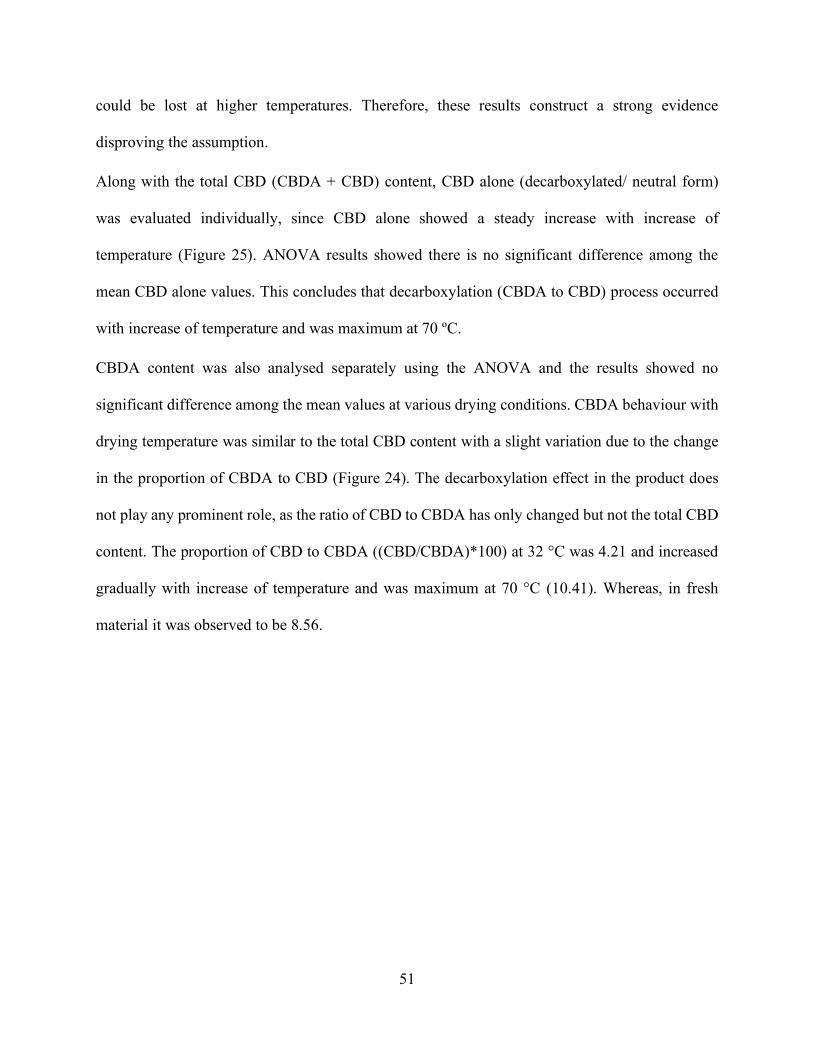
51
could be lost at higher temperatures. Therefore, these results construct a strong evidence
disproving the assumption.
Along with the total CBD (CBDA + CBD) content, CBD alone (decarboxylated/ neutral form)
was evaluated individually, since CBD alone showed a steady increase with increase of
temperature (Figure 25). ANOVA results showed there is no significant difference among the
mean CBD alone values. This concludes that decarboxylation (CBDA to CBD) process occurred
with increase of temperature and was maximum at 70 ºC.
CBDA content was also analysed separately using the ANOVA and the results showed no
significant difference among the mean values at various drying conditions. CBDA behaviour with
drying temperature was similar to the total CBD content with a slight variation due to the change
in the proportion of CBDA to CBD (Figure 24). The decarboxylation effect in the product does
not play any prominent role, as the ratio of CBD to CBDA has only changed but not the total CBD
content. The proportion of CBD to CBDA ((CBD/CBDA)*100) at 32 °C was 4.21 and increased
gradually with increase of temperature and was maximum at 70 °C (10.41). Whereas, in fresh
material it was observed to be 8.56.
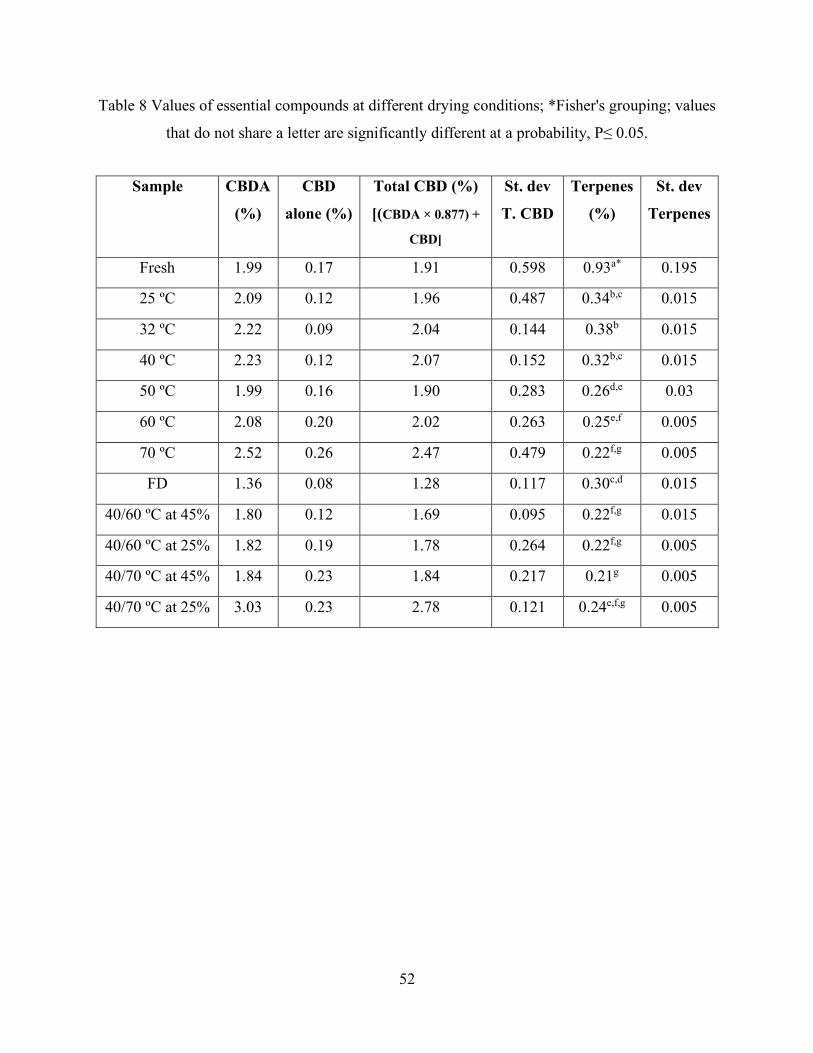
52
Table 8 Values of essential compounds at different drying conditions; *Fisher's grouping; values
that do not share a letter are significantly different at a probability, P≤ 0.05.
Sample CBDA
(%)
CBD
alone (%)
Total CBD (%)
[(CBDA × 0.877) +
CBD]
St. dev
T. CBD
Terpenes
(%)
St. dev
Terpenes
Fresh 1.99 0.17 1.91 0.598 0.93a* 0.195
25 ºC 2.09 0.12 1.96 0.487 0.34b,c 0.015
32 ºC 2.22 0.09 2.04 0.144 0.38b 0.015
40 ºC 2.23 0.12 2.07 0.152 0.32b,c 0.015
50 ºC 1.99 0.16 1.90 0.283 0.26d,e 0.03
60 ºC 2.08 0.20 2.02 0.263 0.25e,f 0.005
70 ºC 2.52 0.26 2.47 0.479 0.22f,g 0.005
FD 1.36 0.08 1.28 0.117 0.30c,d 0.015
40/60 ºC at 45% 1.80 0.12 1.69 0.095 0.22f,g 0.015
40/60 ºC at 25% 1.82 0.19 1.78 0.264 0.22f,g 0.005
40/70 ºC at 45% 1.84 0.23 1.84 0.217 0.21g 0.005
40/70 ºC at 25% 3.03 0.23 2.78 0.121 0.24e,f,g 0.005
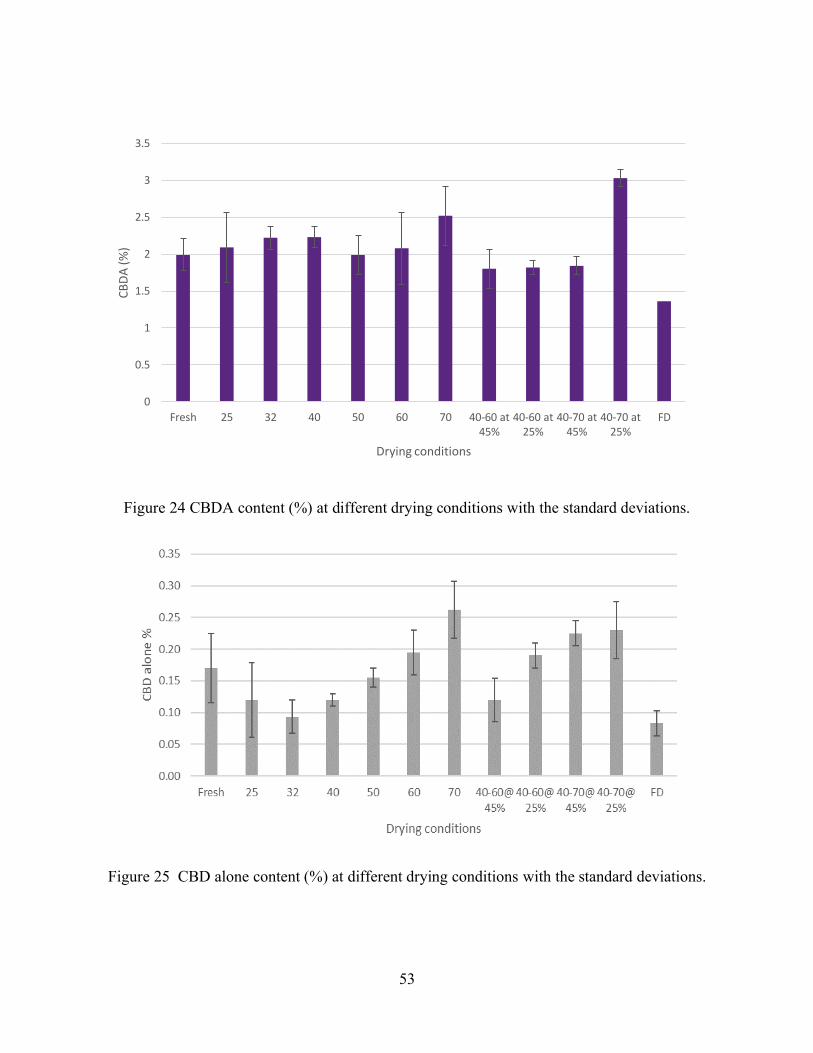
53
Figure 24 CBDA content (%) at different drying conditions with the standard deviations.
Figure 25 CBD alone content (%) at different drying conditions with the standard deviations.
0
0.5
1
1.5
2
2.5
3
3.5
Fresh 25 32 40 50 60 70 40-60 at45%
40-60 at25%
40-70 at45%
40-70 at25%
FD
CB
DA
(%
)
Drying conditions
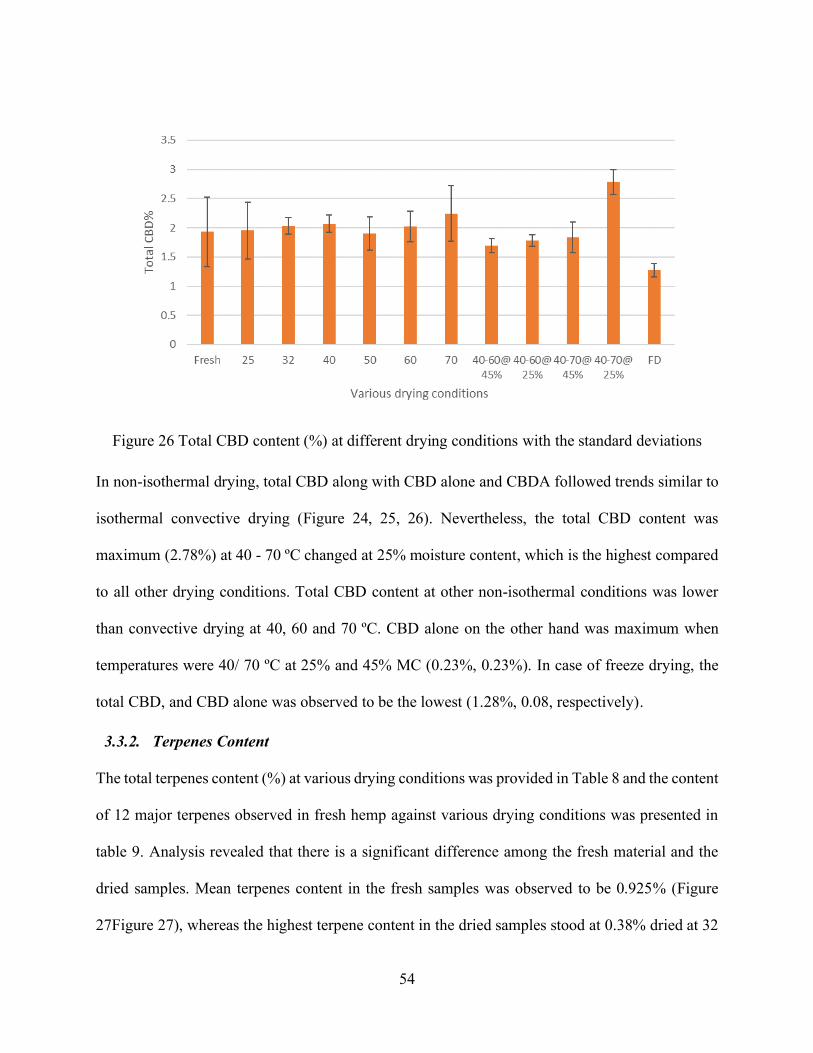
54
Figure 26 Total CBD content (%) at different drying conditions with the standard deviations
In non-isothermal drying, total CBD along with CBD alone and CBDA followed trends similar to
isothermal convective drying (Figure 24, 25, 26). Nevertheless, the total CBD content was
maximum (2.78%) at 40 - 70 ºC changed at 25% moisture content, which is the highest compared
to all other drying conditions. Total CBD content at other non-isothermal conditions was lower
than convective drying at 40, 60 and 70 ºC. CBD alone on the other hand was maximum when
temperatures were 40/ 70 ºC at 25% and 45% MC (0.23%, 0.23%). In case of freeze drying, the
total CBD, and CBD alone was observed to be the lowest (1.28%, 0.08, respectively).
3.3.2. Terpenes Content
The total terpenes content (%) at various drying conditions was provided in Table 8 and the content
of 12 major terpenes observed in fresh hemp against various drying conditions was presented in
table 9. Analysis revealed that there is a significant difference among the fresh material and the
dried samples. Mean terpenes content in the fresh samples was observed to be 0.925% (Figure
27Figure 27), whereas the highest terpene content in the dried samples stood at 0.38% dried at 32
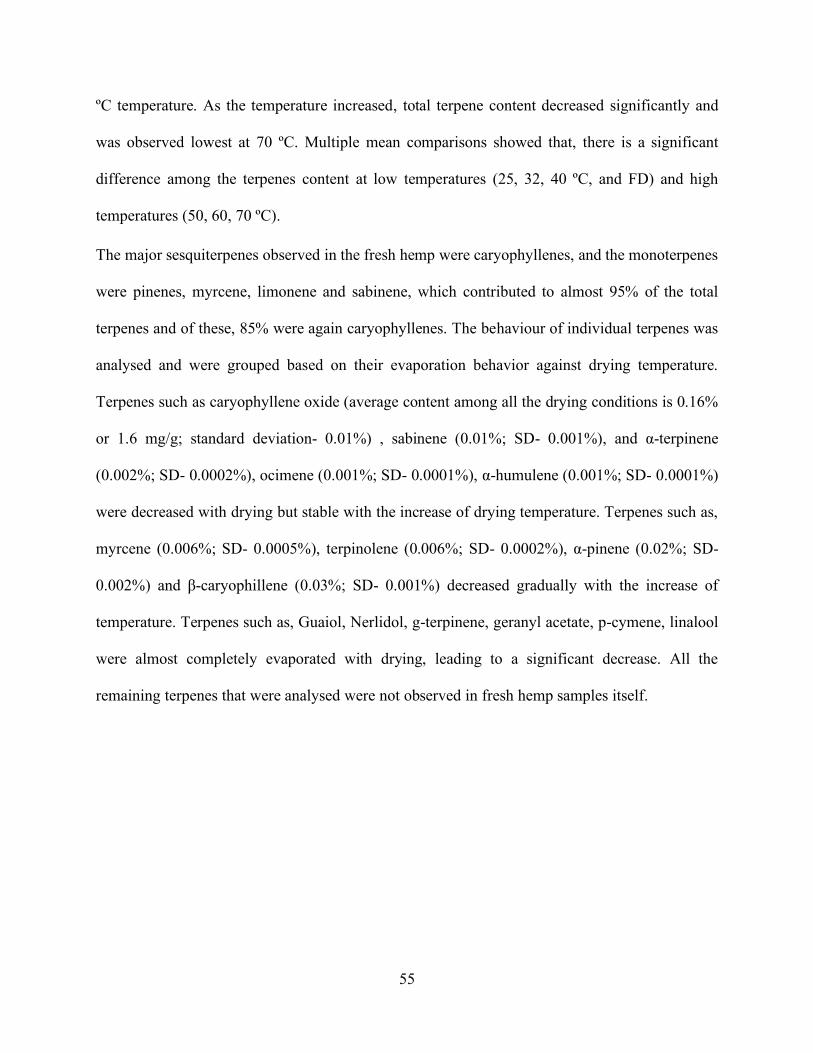
55
ºC temperature. As the temperature increased, total terpene content decreased significantly and
was observed lowest at 70 ºC. Multiple mean comparisons showed that, there is a significant
difference among the terpenes content at low temperatures (25, 32, 40 ºC, and FD) and high
temperatures (50, 60, 70 ºC).
The major sesquiterpenes observed in the fresh hemp were caryophyllenes, and the monoterpenes
were pinenes, myrcene, limonene and sabinene, which contributed to almost 95% of the total
terpenes and of these, 85% were again caryophyllenes. The behaviour of individual terpenes was
analysed and were grouped based on their evaporation behavior against drying temperature.
Terpenes such as caryophyllene oxide (average content among all the drying conditions is 0.16%
or 1.6 mg/g; standard deviation- 0.01%) , sabinene (0.01%; SD- 0.001%), and α-terpinene
(0.002%; SD- 0.0002%), ocimene (0.001%; SD- 0.0001%), α-humulene (0.001%; SD- 0.0001%)
were decreased with drying but stable with the increase of drying temperature. Terpenes such as,
myrcene (0.006%; SD- 0.0005%), terpinolene (0.006%; SD- 0.0002%), α-pinene (0.02%; SD-
0.002%) and β-caryophillene (0.03%; SD- 0.001%) decreased gradually with the increase of
temperature. Terpenes such as, Guaiol, Nerlidol, g-terpinene, geranyl acetate, p-cymene, linalool
were almost completely evaporated with drying, leading to a significant decrease. All the
remaining terpenes that were analysed were not observed in fresh hemp samples itself.
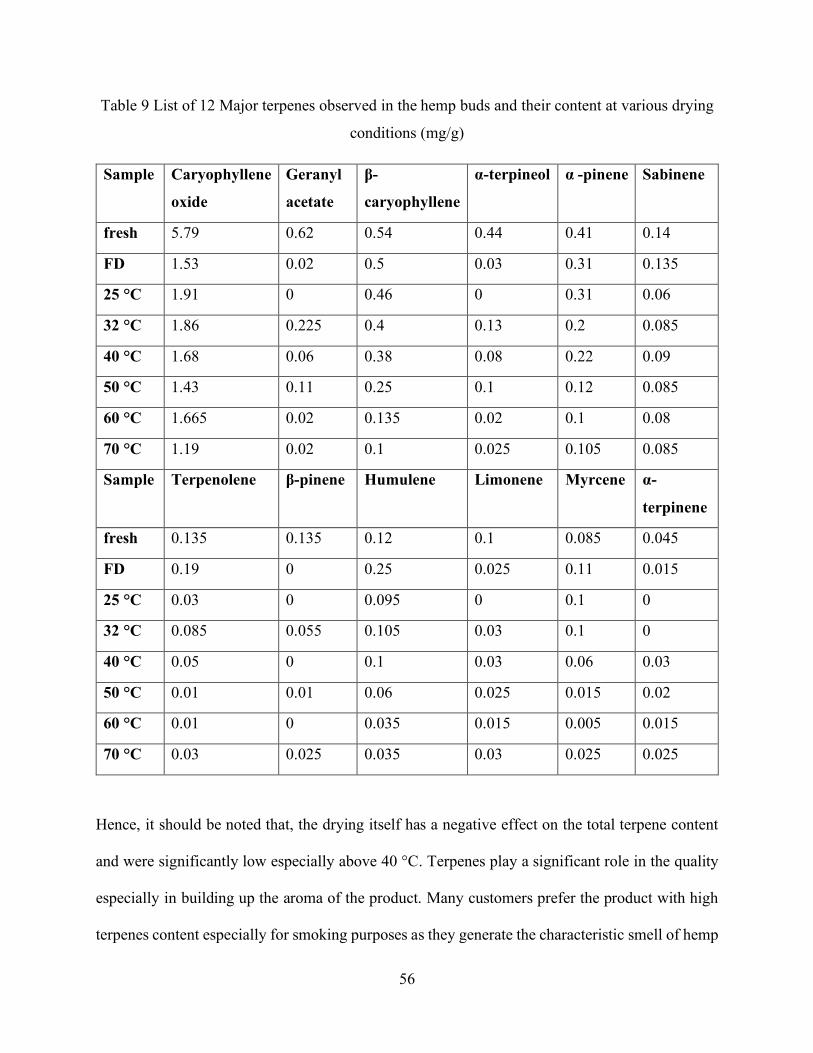
56
Table 9 List of 12 Major terpenes observed in the hemp buds and their content at various drying
conditions (mg/g)
Sample Caryophyllene
oxide
Geranyl
acetate
β-
caryophyllene
α-terpineol α -pinene Sabinene
fresh 5.79 0.62 0.54 0.44 0.41 0.14
FD 1.53 0.02 0.5 0.03 0.31 0.135
25 °C 1.91 0 0.46 0 0.31 0.06
32 °C 1.86 0.225 0.4 0.13 0.2 0.085
40 °C 1.68 0.06 0.38 0.08 0.22 0.09
50 °C 1.43 0.11 0.25 0.1 0.12 0.085
60 °C 1.665 0.02 0.135 0.02 0.1 0.08
70 °C 1.19 0.02 0.1 0.025 0.105 0.085
Sample Terpenolene β-pinene Humulene Limonene Myrcene α-
terpinene
fresh 0.135 0.135 0.12 0.1 0.085 0.045
FD 0.19 0 0.25 0.025 0.11 0.015
25 °C 0.03 0 0.095 0 0.1 0
32 °C 0.085 0.055 0.105 0.03 0.1 0
40 °C 0.05 0 0.1 0.03 0.06 0.03
50 °C 0.01 0.01 0.06 0.025 0.015 0.02
60 °C 0.01 0 0.035 0.015 0.005 0.015
70 °C 0.03 0.025 0.035 0.03 0.025 0.025
Hence, it should be noted that, the drying itself has a negative effect on the total terpene content
and were significantly low especially above 40 °C. Terpenes play a significant role in the quality
especially in building up the aroma of the product. Many customers prefer the product with high
terpenes content especially for smoking purposes as they generate the characteristic smell of hemp
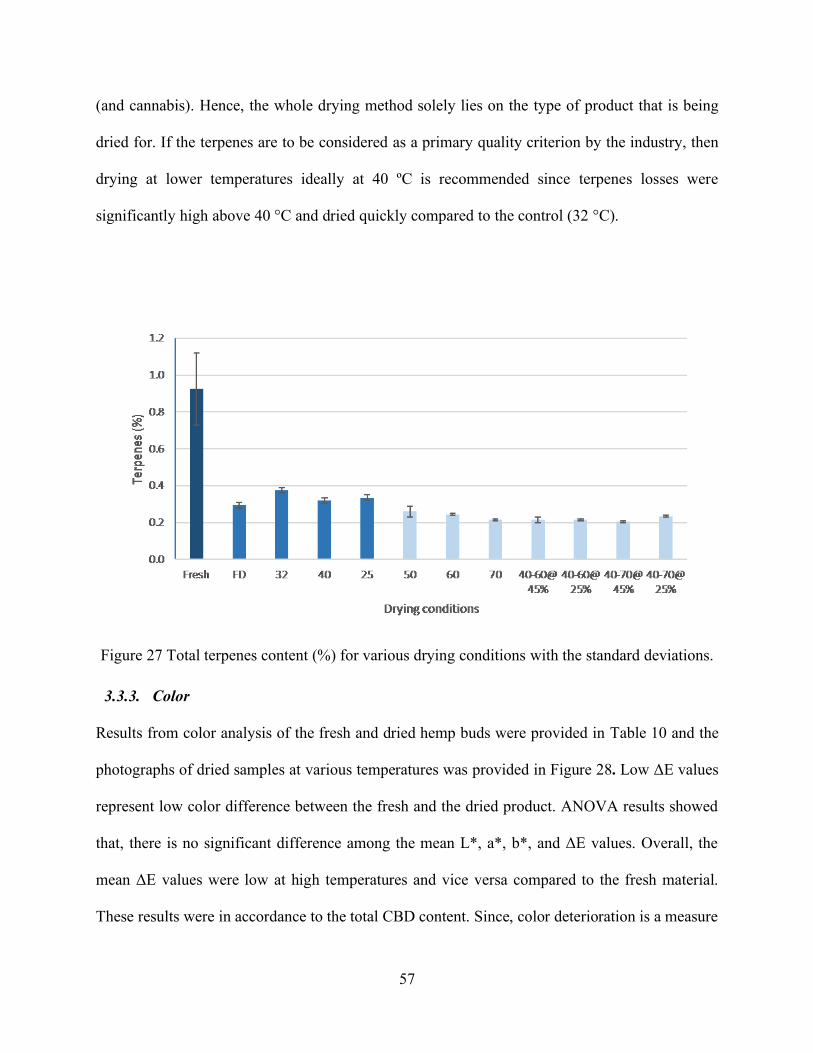
57
(and cannabis). Hence, the whole drying method solely lies on the type of product that is being
dried for. If the terpenes are to be considered as a primary quality criterion by the industry, then
drying at lower temperatures ideally at 40 ºC is recommended since terpenes losses were
significantly high above 40 °C and dried quickly compared to the control (32 °C).
Figure 27 Total terpenes content (%) for various drying conditions with the standard deviations.
3.3.3. Color
Results from color analysis of the fresh and dried hemp buds were provided in Table 10 and the
photographs of dried samples at various temperatures was provided in Figure 28. Low ΔE values
represent low color difference between the fresh and the dried product. ANOVA results showed
that, there is no significant difference among the mean L*, a*, b*, and ΔE values. Overall, the
mean ΔE values were low at high temperatures and vice versa compared to the fresh material.
These results were in accordance to the total CBD content. Since, color deterioration is a measure
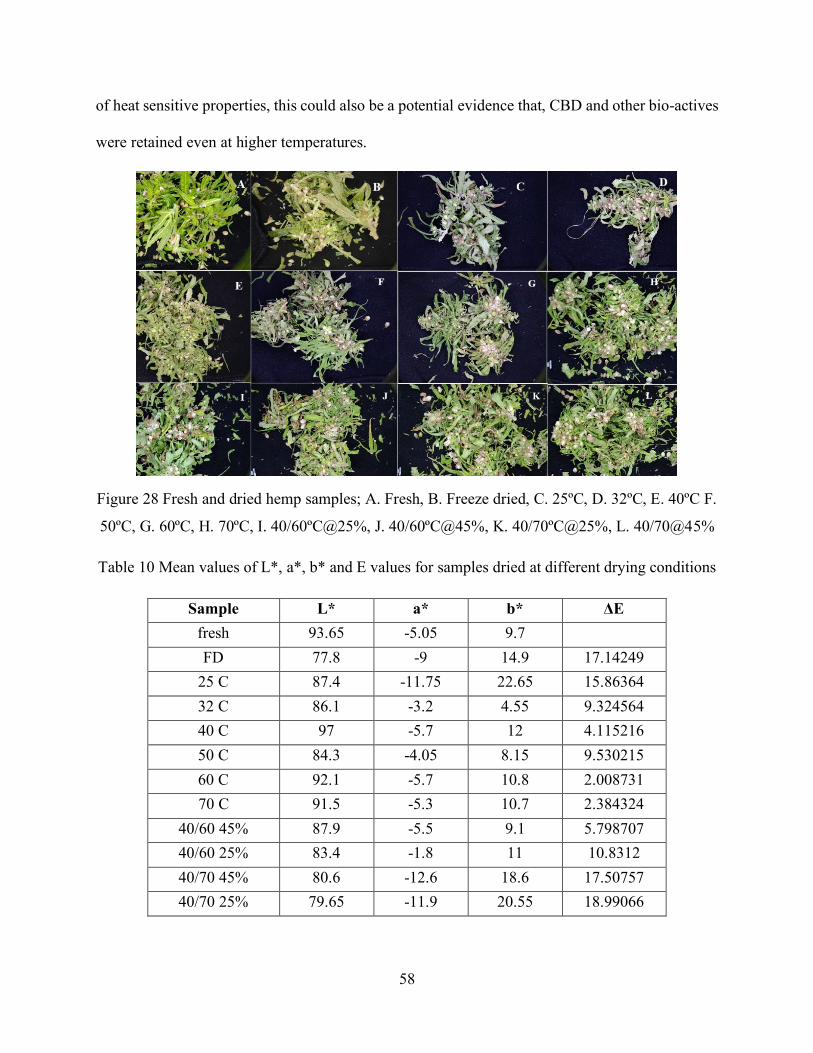
58
of heat sensitive properties, this could also be a potential evidence that, CBD and other bio-actives
were retained even at higher temperatures.
Figure 28 Fresh and dried hemp samples; A. Fresh, B. Freeze dried, C. 25ºC, D. 32ºC, E. 40ºC F.
50ºC, G. 60ºC, H. 70ºC, I. 40/60ºC@25%, J. 40/60ºC@45%, K. 40/70ºC@25%, L. 40/70@45%
Table 10 Mean values of L*, a*, b* and E values for samples dried at different drying conditions
Sample L* a* b* ΔE
fresh 93.65 -5.05 9.7
FD 77.8 -9 14.9 17.14249
25 C 87.4 -11.75 22.65 15.86364
32 C 86.1 -3.2 4.55 9.324564
40 C 97 -5.7 12 4.115216
50 C 84.3 -4.05 8.15 9.530215
60 C 92.1 -5.7 10.8 2.008731
70 C 91.5 -5.3 10.7 2.384324
40/60 45% 87.9 -5.5 9.1 5.798707
40/60 25% 83.4 -1.8 11 10.8312
40/70 45% 80.6 -12.6 18.6 17.50757
40/70 25% 79.65 -11.9 20.55 18.99066
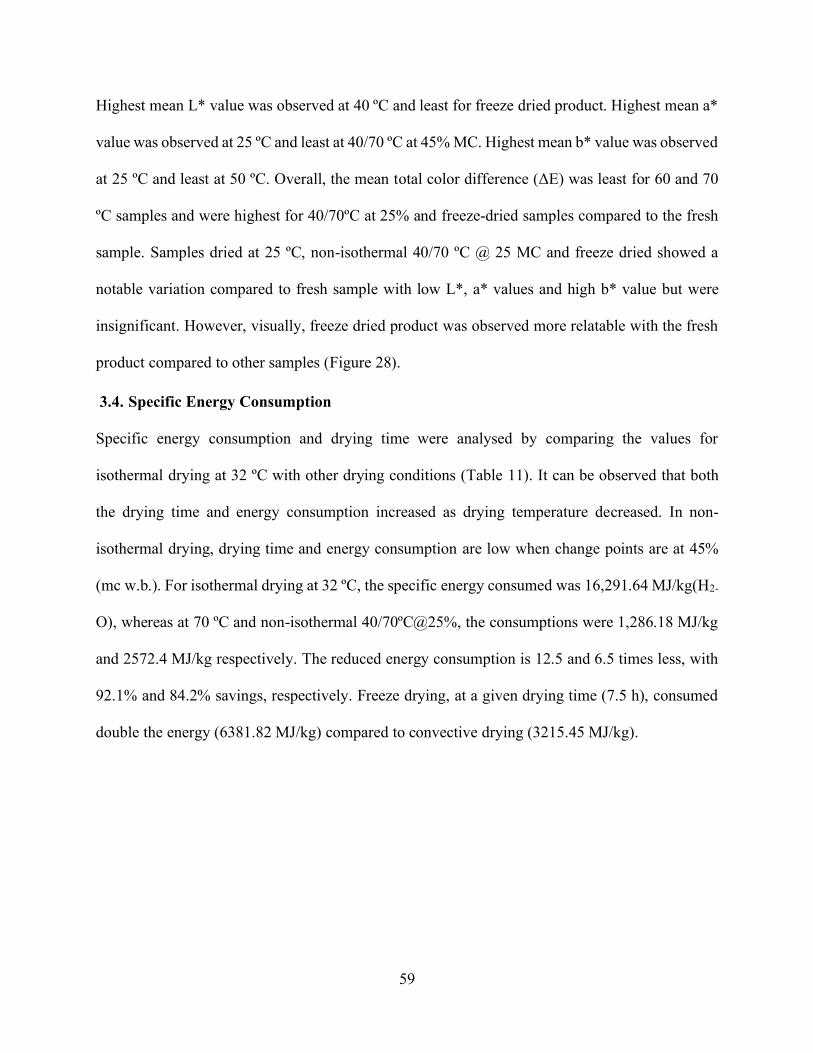
59
Highest mean L* value was observed at 40 ºC and least for freeze dried product. Highest mean a*
value was observed at 25 ºC and least at 40/70 ºC at 45% MC. Highest mean b* value was observed
at 25 ºC and least at 50 ºC. Overall, the mean total color difference (ΔE) was least for 60 and 70
ºC samples and were highest for 40/70ºC at 25% and freeze-dried samples compared to the fresh
sample. Samples dried at 25 ºC, non-isothermal 40/70 ºC @ 25 MC and freeze dried showed a
notable variation compared to fresh sample with low L*, a* values and high b* value but were
insignificant. However, visually, freeze dried product was observed more relatable with the fresh
product compared to other samples (Figure 28).
3.4. Specific Energy Consumption
Specific energy consumption and drying time were analysed by comparing the values for
isothermal drying at 32 ºC with other drying conditions (Table 11). It can be observed that both
the drying time and energy consumption increased as drying temperature decreased. In non-
isothermal drying, drying time and energy consumption are low when change points are at 45%
(mc w.b.). For isothermal drying at 32 ºC, the specific energy consumed was 16,291.64 MJ/kg(H2-
O), whereas at 70 ºC and non-isothermal 40/70ºC@25%, the consumptions were 1,286.18 MJ/kg
and 2572.4 MJ/kg respectively. The reduced energy consumption is 12.5 and 6.5 times less, with
92.1% and 84.2% savings, respectively. Freeze drying, at a given drying time (7.5 h), consumed
double the energy (6381.82 MJ/kg) compared to convective drying (3215.45 MJ/kg).
60
Table 11 Specific energy consumption (MJ/kg) Power consumed (MJ), and drying time (h) for
each drying condition
Drying condition Drying time (h) Power (MJ)
Specific energy
consumption
(MJ/kg)
70 ºC 3 70.7 1286.2
60 ºC 4 94.3 1714.9
40/70 ºC@45% 4 94.3 1714.9
40/60 ºC@45% 4.5 106.1 1929.3
40/70 ºC@25% 6 141.5 2572.4
40/60 ºC@25% 7 165.1 3001.1
50 ºC 9 212.2 3858.6
40 ºC 16 377.3 6859.6
32 ºC 38 896.0 16291.6
25 ºC 51 1202.6 21865.1
FD 7.5 351.0 6381.8
3.5. Verification of the Results
It was expected that, the freeze drying, or low temperature drying methods would possibly show
better results since traditional drying methods have adopted low temperatures. Since, the results
obtained were in contrast with the literature, fresh samples of hemp buds were again harvested,
mixed, and were divided into 8 equal batches (100 g ± 1/ batch). Then convective drying at 70 ºC,
40 ºC/70 ºC at 25% mc, and freeze-drying experiments were carried out in duplicates and were
compared with the CBD content of fresh material. The results showed similar trends with
maximum CBD content being in non-isothermal 40 ºC/70 ºC at 25% mc condition.

61
3.6. Discussion
Increase of temperature by 10 ºC in convective drying nearly reduced the drying time to half, to
reach the final moisture of 0.10 ± 0.005 g/g of hemp buds. This shows that, temperature had a great
influence on the drying rate. These outcomes are obvious and agree with numerous literatures
concerning drying of foods. The prolonged exponential behaviour of drying kinetics of hemp buds
in the later stages shows that water present in the beneath layers are hard to remove. This could be
because water in the underneath layers are tightly bound. When the non-isothermal conditions
were applied, where the temperatures were increased after a certain period of drying, the drying
rate considerably increased. Further, diffusivity (Deff) values showed that diffusion was rapid with
the increase of temperatures. Therefore, the hemp buds should be dried with an additional external
force, such as high temperatures or low RH, in the later stages (roughly after 40 ± 5% MC w.b.)
to considerably reduce the total drying period. Considering the energy consumption and CBD
retention besides drying time, the non-isothermal drying condition: 40 ºC changed to 70 ºC at 25%
MC w.b. showed the best results. Freeze drying dried the buds in 7.5 h which is relatively faster
than the low temperature convective drying. However, considering the high energy consumption
(double than convective drying) and the low CBD retention (least), FD would not be an appropriate
technology for drying hemp buds.
The results of CBD content are comparable with the results of Turner and Mahlberg (1984), where
cannabis samples were dried for 24 h in oven at 37 °C and 60 °C. They observed that samples
dried at 60 °C had both acid and neutral cannabinoids, while at 37 °C only cannabinoid acids were
found, showing that decarboxylation took place only at 60 °C. Also, the overall change in the
cannabinoid content was insignificant. They also noted an increasing trend in the cannabinoid
content with the prolonged drying (past 24 hours). This confirms the non-volatile nature of CBD,

62
and possibly other sticky resinous cannabinoids at these temperatures. Cannabinoids are secondary
metabolites that play a crucial role in plant’s defense mechanism. Since, drying is an induced
stress, the CBD content might have increased as a part of defense. However, on the other hand,
the freeze-dried product showed the lowest CBD. It should be noted that, the fresh material is
immediately frozen in the freezer and then allowed for drying under vacuum. Certainly, the
production of CBD by the material might be seized due to freezing temperatures. Hence, the stress
induced due to high temperature seems to be critical for rapid production of CBD.
Further, the moisture content of the product might also have a significant role in CBD production.
If temperature is alone considered as critical factor that increased CBD content, then consequently,
the non-isothermal condition 40 ºC/70 ºC at 45% should retain maximum CBD, since, the material
is subjected to high temperatures for longer time (40 ºC changed to 70 ºC when product reached
45% moisture). However, the condition 40 ºC/70 ºC at 25% moisture content showed highest CBD
content contrasting with the previous assumption.
One possible reason could be an increased function of prenyltransferase enzymes or CBD
synthases with the increase of temperature resulting in rapid production of CBD content. However,
there is no systematic study on the function of these enzymes with respect to temperature so far.
Nevertheless, the cannabinoid content was observed higher in the plants grown in tropical and
xeric conditions with low humidity and sparse rainfall (De Faubert Maunder, 1976; Murari et al.,
1988; Paris, Boucher, & Cosson, 1975; Sharma, 1975)
Increase of temperature showed a significant negative effect on terpenes indicating their volatile
nature. Total terpenes content was analysed, and it was observed that, drying significantly
decreased the terpenes content and more significantly above 40 °C. This could be because terpenes
are naturally volatile which is a part of plant’s defense mechanism such as, for repelling the insects
63
(Pate, 1994), for the suppression of the growth of surrounding vegetation (C. H. Muller, Muller,
& Haines, 1964; W. H. Muller & Hauge, 1967). Terpenes behaviour was described by Hawes and
Cohen (2015) who stated that, excess drying and/or drying at high temperatures evaporate some
of the volatile oils (terpenes) that give hemp and cannabis its unique taste and aroma. This could
be the possible reason for the practice of low temperature traditional drying methods for cannabis.
A report by ‘The Medical Cannabis Awareness Association (MCAA)’ stated that, the most volatile
terpenes found in the cannabis/ hemp plant start to evaporate around 21 ºC and can be noticed with
pungent aroma in the air.

64
Chapter 4. Implications and Future Trends
Produced data help industry to design suitable drying methods that ensures rapid drying and
maximum quality retention at minimal costs. Proposed drying method accelerates postharvest
processing leading to high productivity ultimately conserving energy and expenses.
The project would help in satisfying current demand for health-promoting CBD products. A
considerable segment of Canadian society needs CBD-based drugs for medicinal purpose. The
outcome from this project will facilitate meeting the consumer demands in a timely manner. Also,
an increased export potential and revenue is envisaged. Enabling high throughput of hemp based
medicinal products would increase efficiency and support indirect job creation. Drying of hemp
for further extraction of bioactive compounds (CBD and terpenes) is a bottleneck to the entire
production cycle. The optimal drying technology recommended will reduce quality losses for the
industry that will in turn translate into high value product. The effect of drying temperature on the
terpene profile helps the cannabis industry to choose appropriate drying temperature. This project
would further encourage the hemp industry in building partnership with the Dalhousie university
providing access to the expertise of researchers/ engineers.
This research would open doors to the future research in areas of processing of hemp buds and
hemp product development. Moisture sorption isotherms of hemp buds at various temperatures
fitted with various models would help in prolonged storage and designing various drying
technologies. Use of other novel technologies such as microwave-vacuum drying that dry the
product at short period of time, various types of intermittent drying, can be explored. Further
experiments on convective drying beyond 70 ºC temperatures, outdoor vs. indoor grown hemp,
drying at various RH, chemical analysis and production pathway of CBD/ THC as influenced by
65
drying temperatures, would reveal concealed results. The water that was removed via vacuum
suction in freeze drying could contain evaporated terpenes. This water can be collected, and the
terpenes can be further extracted/ used. Harvesting, that takes three weeks, trimming of buds from
the stem, which is laborious and time-taking, thermostable pesticide residues that get concentrated
through drying, are some of the other issues being faced by the industry in the processing sector.
Besides the technological advancements required, there are other political issues to be addressed.
Although cannabis and hemp are legal in Canada, obtaining license for research is challenging and
a major limitation to further studies.
66
Chapter 5. Conclusion
Increase in drying temperature reduced the total drying time of hemp buds by 92% (at 70 ºC)
compared to control (32 ºC). Page model fitted the best that explains the drying kinetics of hemp
buds. Diffusivity (Deff) increased with the increase of temperatures and activation energy was 63.70
± 1 kJ/mol. The hemp buds are recommended to be dried to a moisture content of 30% (at 22 °C)
wet basis at the earliest possible time to avoid possible microbial growth during drying, and further,
for a safe preservation and long term storage, the buds should be dried to a moisture content of 9
% w.b.
Increase of drying temperatures marginally increased the total CBD content with highest (2.783%)
being in non-isothermal drying mode (40/70ºC @ 25% moisture content) and lowest (1.276%) in
freeze dried product. Decarboxylation process occurred with the increase of temperatures leading
to increase in CBD to CBDA ratio. Increase in temperature significantly decreased the total
terpenes content. Terpenes were significantly high when dried at low temperatures including FD.
In case of color, no significant change was observed at higher temperatures. Isothermal drying at
70 ºC and non-isothermal 40/70ºC @25% consumed 12.5 and 6.5 times less energy than control.
The suitable drying method to be recommended for the hemp buds merely depends on the product
of interest developed by the industry. If the product requires only the total CBD content (such as
CBD oil, supplements, edibles, body care, drinks), then drying at 70 ºC or 40/ 70ºC @ 25% is
recommended. However, if the product (such as for smoking/ recreation which require aroma/
flavor) demands terpenes content along with the CBD, then drying at 40 ºC is recommended, since
temperatures above 40 ºC significantly lost terpenes. This project revealed the important
characteristics of CBD and terpenes as influenced by drying temperatures and technologies. This

67
research would help the cannabis industry to optimize the existing drying methods allowing
maximum energy savings and product quality.
68
References
Aghbashlo, M., & Samimi-Akhijahani, H. (2008). Influence of drying conditions on the effective
moisture diffusivity, energy of activation and energy consumption during the thin-layer
drying of berberis fruit (Berberidaceae). Energy Conversion and Management, 49(10),
2865-2871.
Al-Muhtaseb, A., McMinn, W., & Magee, T. (2002). Moisture sorption isotherm characteristics
of food products: a review. Food and bioproducts processing, 80(2), 118-128.
Andre, C. M., Hausman, J.-F., & Guerriero, G. (2016). Cannabis sativa: the plant of the thousand
and one molecules. Frontiers in plant science, 7(1), 19-29.
Angell, T. (2019). Hemp Farming Quadrupled In The U.S. This Year, New Report Shows.
Retrieved from https://www.forbes.com/sites/tomangell/2019/09/05/hemp-farming-
quadrupled-in-the-u-s-this-year-new-report-shows/#1f14fdcb487d
Argyropoulos, D., Alex, R., & Müller, J. (2011). Equilibrium moisture contents of a medicinal
herb (Melissa officinalis) and a medicinal mushroom (Lentinula edodes) determined by
dynamic vapour sorption. Procedia Food Science, 1(1), 165-172.
Argyropoulos, D., & Müller, J. (2014a). Changes of essential oil content and composition during
convective drying of lemon balm (Melissa officinalis L.). Industrial Crops and Products,
52(1), 118-124.
Argyropoulos, D., & Müller, J. (2014b). Kinetics of change in colour and rosmarinic acid
equivalents during convective drying of lemon balm (Melissa officinalis L.). Journal of
Applied Research on Medicinal and Aromatic Plants, 1(1), e15-e22.
Arnason, R. (2019). Canadian exporters have hopes for hemp. Retrieved from
https://www.producer.com/2019/08/canadian-exporters-have-hopes-for-hemp/
AssociatedPress. (2020). High anxiety: Proposed U.S. hemp rules worry industry. Retrieved from
https://www.nbcnews.com/politics/politics-news/high-anxiety-proposed-us-hemp-rules-
worry-industry-n1114321
Bala, B. K., & Bala, B. (1997). Drying and storage of cereal grains: Wiley Online Library.
Benson, R. S., Hobbes, P., Gemmiti, C., & Platt, I. D. (2016). US9480647B2. USPTO.
Berna, A., Rosselo, C., Canellas, J., & Mulet, A. (1990). Drying kinetics of apricots. Engineering
and food. Barking: Elsevier Science Publishing, 1(1), 628-636.
Borgelt, L. M., Franson, K. L., Nussbaum, A. M., & Wang, G. S. (2013). The Pharmacologic and
Clinical Effects of Medical Cannabis. Pharmacotherapy: The Journal of Human
Pharmacology and Drug Therapy, 33(2), 195-209.
69
CannabisDispensary. (2019). Marijuana Edibles. Retrieved from
https://www.ecannabisdispensary.com/product-category/marijuana-edibles/
Chen, X. D., & Mujumdar, A. S. (2009). Drying technologies in food processing: John Wiley &
Sons.
Craig Giammona, B. E. (2019). Booming Demand for CBD Is Making Hemp the Cannabis Cash
Crop. Retrieved from https://www.bloomberg.com/news/articles/2019-07-18/booming-
demand-for-cbd-is-making-hemp-the-cannabis-cash-crop
Crank, J. (1979). The mathematics of diffusion (2nd ed.). London: Oxford University Press.
Cuervo-Andrade, S., & Hensel, O. (2016). Stepwise drying of medicinal plants as alternative to
reduce time and energy processing. IOP Conference Series: Materials Science and
Engineering, 138(1), 012014.
De Faubert Maunder, M. (1976). The forensic significance of the age and origin of Cannabis.
Medicine, Science and the Law, 16(2), 78-90.
Díaz‐Maroto, M. C., Sánchez Palomo, E., Castro, L., González Viñas, M., & Pérez‐Coello, M. S.
(2004). Changes produced in the aroma compounds and structural integrity of basil
(Ocimum basilicum L) during drying. Journal of the Science of Food and Agriculture,
84(15), 2070-2076.
Doymaz, I. (2004). Convective air drying characteristics of thin layer carrots. Journal of food
engineering, 61(3), 359-364.
Doymaz, I. (2011). Drying of thyme (Thymus Vulgaris L.) and selection of a suitable thin‐layer
drying model. Journal of Food Processing and Preservation, 35(4), 458-465.
Duan, X., Zhang, M., Mujumdar, A., & Wang, R. (2010). Trends in microwave-assisted freeze
drying of foods. Drying Technology, 28(4), 444-453.
Erbay, Z., & Icier, F. (2010). A review of thin layer drying of foods: theory, modeling, and
experimental results. Critical reviews in food science and nutrition, 50(5), 441-464.
Ertekin, C., & Yaldiz, O. (2004). Drying of eggplant and selection of a suitable thin layer drying
model. Journal of food engineering, 63(3), 349-359.
FDA. (2019). FDA warns 15 companies for illegally selling various products containing
cannabidiol as agency details safety concerns [Press release]. Retrieved from
https://www.fda.gov/news-events/press-announcements/fda-warns-15-companies-
illegally-selling-various-products-containing-cannabidiol-agency-details
Fellermeier, M., & Zenk, M. H. (1998). Prenylation of olivetolate by a hemp transferase yields
cannabigerolic acid, the precursor of tetrahydrocannabinol. FEBS letters, 427(2), 283-285.
70
Fontana, A. J. (2000). Understanding the importance of water activity in food. Cereal foods world,
45(1), 7-10.
Friedman, D., & Devinsky, O. (2015). Cannabinoids in the treatment of epilepsy. New England
Journal of Medicine, 373(11), 1048-1058.
Gardeli, C., Evageliou, V., Poulos, C., Yanniotis, S., & Komaitis, M. (2010). Drying of fennel
plants: Oven, freeze drying, effect of freeze-drying time, and use of biopolymers. Drying
Technology, 28(4), 542-549.
George-Cosh, D. (2018). RedeCan recalls pot in Ontario after mould reports. Retrieved from
https://www.bnnbloomberg.ca/mould-reports-spark-pot-producer-redecan-recall-
1.1172506
Hamdami, N., Monteau, J.-Y., & Le Bail, A. (2004). Transport properties of a high porosity model
food at above and sub-freezing temperatures. Part 2: Evaluation of the effective moisture
diffusivity from drying data. Journal of food engineering, 62(4), 385-392.
Hammond, C. T., & Mahlberg, P. G. (1973). Morphology of glandular hairs of Cannabis sativa
from scanning electron microscopy. American journal of botany, 60(6), 524-528.
Hartsel, J. A., Eades, J., Hickory, B., & Makriyannis, A. (2016). Cannabis sativa and Hemp.
Nutraceuticals, 53(1), 735-754.
Hawes, M. D., & Cohen, M. R. (2015). USA Patent No. US20150096189A1. USPTO.
HealthCanada. (2019). Industrial hemp licensing statistics for 2018. Retrieved from
https://www.canada.ca/en/health-canada/services/drugs-medication/cannabis/producing-
selling-hemp/about-hemp-canada-hemp-industry/statistics-reports-fact-sheets-hemp.html
HempToday™. (2019). U.S. jumps to No. 3 among top hemp growing nations. Retrieved from
https://hemptoday.net/us-third-biggest-hemp-grower/
Hensderson, S. M., & Pabis, S. (1961). Grain drying theory II: Temperature effects on drying
coefficients. Journal of Agricultural Engineering Research, 6(4), 169 -174.
Hood, L., Dames, M., & Barry, G. (1973). Headspace volatiles of marijuana. Nature, 242(5397),
402.
Hospodor, A. D. (2012). US20120043242A1. USPTO.
Jaeger, K. (2019). USDA Releases Report On Status Of Canada’s Hemp Industry. Retrieved from
https://www.marijuanamoment.net/usda-releases-report-on-status-of-canadas-hemp-
industry/
Jikomes, N., & Zoorob, M. (2018). The cannabinoid content of legal cannabis in Washington State
varies systematically across testing facilities and popular consumer products. Scientific
reports, 8(1), 4519-4529.
71
Kaymak‐Ertekin, F. (2002). Drying and rehydrating kinetics of green and red peppers. Journal of
Food science, 67(1), 168-175.
Kudra, T. (2004). Energy aspects in drying. Drying Technology, 22(5), 917-932.
Labuza, T., Cassil, S., & Sinskey, A. (1972). Stability of intermediate moisture foods. 2.
Microbiology. Journal of Food science, 37(1), 160-162.
Lebovka, N. I., Shynkaryk, N. V., & Vorobiev, E. (2007). Pulsed electric field enhanced drying of
potato tissue. Journal of food engineering, 78(2), 606-613.
Levin, D. A. (1973). The role of trichomes in plant defense. The quarterly review of biology, 48(1),
3-15.
Liapis, A. I., & Bruttini, R. (2006). Freeze drying Handbook of industrial drying (pp. 282-309):
CRC press.
Litvin, S., Mannheim, C., & Miltz, J. (1998). Dehydration of carrots by a combination of freeze
drying, microwave heating and air or vacuum drying. Journal of food engineering, 36(1),
103-111.
Martynenko, A., & Janaszek, M. A. (2014). Texture changes during drying of apple slices. Drying
Technology, 32(5), 567-577.
Martynenko, A., & Kudra, T. (2015). Non-isothermal drying of medicinal plants. Drying
Technology, 33(13), 1550-1559.
MCAA. Cannabis Terpenes. Retrieved from https://www.themcaa.net/terpenes-overview--
flavor-wheel.html
Midilli, A., Kucuk, H., & Yapar, Z. (2002). A new model for single-layer drying. Drying
Technology, 20(7), 1503-1513.
Minitab LLC. (2019). Getting Started with Minitab 19. Retrieved from www.minitab.com
Misra, D. N. (1984). Adsorption on and surface chemistry of hydroxyapatite: Springer.
Montgomery, D. C. (2017). Design and analysis of experiments: John wiley & sons.
Mujumdar, A. S. (2014). Handbook of industrial drying: CRC press.
Mulet, A., Berna, A., Borr, M., & Pinaga, F. (1987). Effect of air flow rate on carrot drying. Drying
Technology, 5(2), 245-258.
Muller, C. H., Muller, W. H., & Haines, B. L. (1964). Volatile growth inhibitors produced by
aromatic shrubs. Science, 143(3605), 471-473.
Müller, J. (2007). Convective drying of medicinal, aromatic and spice plants: a review. Stewart
Postharvest Review, 4(2), 1-7.
72
Muller, W. H., & Hauge, R. (1967). Volatile growth inhibitors produced by Salvia leucophylla:
effect on seedling anatomy. Bulletin of the torrey botanical club, 63(2), 182-191.
Murari, G., Lombardi, S., & Romagnoli, C. (1988). Morphine and Δ9-tetrahydrocannabinol:
Cross-tolerance for behavioral responses in rats prenatally administred cannabis sativa L.
extract. Pharmacological Research Communications, 20(1), 260-267.
Nourian, F., & Ramaswamy, H. (2003). Kinetics of quality change during cooking and frying of
potatoes: Part I. Texture. Journal of food process engineering, 26(4), 377-394.
O’Callaghan, J., Menzies, D., & Bailey, P. (1971). Digital simulation of agricultural drier
performance. Journal of Agricultural Engineering Research, 16(3), 223-244.
Ozguven, M., Tarhan, S., Polatci, H., & Telci, I. (2016). A new way to improve the drying kinetics
and final quality of peppermint. Journal of Essential Oil Bearing Plants, 19(6), 1368-1379.
Page, G. E. (1949). Factors Influencing the Maximum Rates of Air Drying Shelled corn in Thin
Layers. (M.Sc. Master's thesis), Purdue University, West Lafayette, Indiana.
Paris, M., Boucher, F., & Cosson, L. (1975). The constituents ofCannabis sativa pollen. Economic
Botany, 29(3), 245-253.
Pate, D. W. (1994). Chemical ecology of Cannabis. Journal of the International Hemp Association,
2(29), 32-37.
Pertwee, R. G. (2012). Targeting the endocannabinoid system with cannabinoid receptor agonists:
pharmacological strategies and therapeutic possibilities. Philosophical Transactions of the
Royal Society B: Biological Sciences, 367(1607), 3353-3363.
Pertwee, R. G. (2014). Handbook of Cannabis (Vol. 58). USA: Oxford University Press.
Prothon, F., & Ahrné, L. l. M. (2004). Application of the Guggenheim, Anderson and De Boer
model to correlate water activity and moisture content during osmotic dehydration of
apples. Journal of food engineering, 61(3), 467-470.
Rayaguru, K., & Routray, W. (2012). Mathematical modeling of thin layer drying kinetics of stone
apple slices. International Food Research Journal (Malaysia), 19 (4), 1503-1510.
Roos, Y. H. (2002). Importance of glass transition and water activity to spray drying and stability
of dairy powders. Le Lait, 82(4), 475-484.
Roos, Y. H. (2007). Water activity and glass transition. Water activity in foods: Fundamentals and
applications, 13(1), 29-45.
Rothschild, M., & Fairbairn, J. (1980). Ovipositing butterfly (Pieris brassicae L.) distinguishes
between aqueous extracts of two strains of Cannabis sativa L. and THC and CBD. Nature,
286(5768), 56-59.
73
Salentijn, E. M., Zhang, Q., Amaducci, S., Yang, M., & Trindade, L. M. (2015). New
developments in fiber hemp (Cannabis sativa L.) breeding. Industrial Crops and Products,
68(1), 32-41.
Sancho-Madriz, M. F. (2003). Preservation of food Encyclopedia of Food Sciences and Nutrition
(pp. 4766-4772). Oxford: Academic press.
Scott, W. (1957). Water relations of food spoilage microorganisms. Advances in food research,
7(1), 83-127.
Sharma, G. (1975). Altitudinal variaton in leaf epidermal patterns of Cannabis sativa. Bulletin of
the torrey botanical club, 102(4), 199-200.
Singsaas, E. L. (2000). Terpenes and the thermotolerance of photosynthesis. The New Phytologist,
146(1), 1-4.
Siriamornpun, S., Kaisoon, O., & Meeso, N. (2012). Changes in colour, antioxidant activities and
carotenoids (lycopene, β-carotene, lutein) of marigold flower (Tagetes erecta L.) resulting
from different drying processes. Journal of Functional Foods, 4(4), 757-766.
Sirikantaramas, S., Morimoto, S., Shoyama, Y., Ishikawa, Y., Wada, Y., Shoyama, Y., & Taura,
F. (2004). The gene controlling marijuana psychoactivity molecular cloning and
heterologous expression of Δ1-tetrahydrocannabinolic acid synthase from Cannabis sativa
L. Journal of Biological Chemistry, 279(38), 39767-39774.
Small, E., & Marcus, D. (2002). Hemp: a new crop with new uses for North America. Trends in
new crops and new uses, 24(5), 284-326.
Sousa, A. D., Ribeiro, P. R. V., Canuto, K. M., Zocolo, G. J., Pereira, R. d. C. A., Fernandes, F.
A. N., & Sousa de Brito, E. (2018). Drying kinetics and effect of air-drying temperature on
chemical composition of Phyllanthus amarus and Phyllanthus niruri. Drying Technology,
36(5), 609-616.
Soysal, Y., & Öztekin, S. (1999). Equilibrium moisture content equations for some medicinal and
aromatic plants. Journal of Agricultural Engineering Research, 74(3), 317-324.
Soysal, Y., Öztekin, S., & Eren, Ö. (2006). Microwave drying of parsley: modelling, kinetics, and
energy aspects. Biosystems Engineering, 93(4), 403-413.
Strumillo, C., & Adamiec, J. (1996). Energy and quality aspects of food drying. Drying
Technology, 14(2), 423-448.
Tang, C.-H., Ten, Z., Wang, X.-S., & Yang, X.-Q. (2006). Physicochemical and functional
properties of hemp (Cannabis sativa L.) protein isolate. Journal of agricultural and food
chemistry, 54(23), 8945-8950.
74
Taschwer, M., & Schmid, M. G. (2015). Determination of the relative percentage distribution of
THCA and Δ9-THC in herbal cannabis seized in Austria–Impact of different storage
temperatures on stability. Forensic science international, 254(4), 167-171.
Touw, M. (1981). The religious and medicinal uses of Cannabis in China, India and Tibet. Journal
of psychoactive drugs, 13(1), 23-34.
Tramèr, M. R., Carroll, D., Campbell, F. A., Reynolds, D. J. M., Moore, R. A., & McQuay, H. J.
(2001). Cannabinoids for control of chemotherapy induced nausea and vomiting:
quantitative systematic review. British Medical Journal, 323(7303), 16-21.
Turner, J. C., Hemphill, J. K., & Mahlberg, P. G. (1980). Trichomes and cannabinoid content of
developing leaves and bracts of Cannabis sativa L.(Cannabaceae). American Journal of
Botany, 67(10), 1397-1406.
Turner, J. C., & Mahlberg, P. G. (1984). Effects of sample treatment on chromatographic analysis
of cannabinoids in Cannabis sativa L.(Cannabaceae). Journal of Chromatography A,
283(10), 165-171.
UNODOC. (2009). Recommended Methods for the Identification and Analysis of Cannabis and
Cannabis Products: Manual for Use by National Drug Testing Laboratories: United
Nations Publications.
Wang, Z. H., & Shi, M. H. (1999). Microwave freeze drying characteristics of beef. Drying
Technology, 17(3), 434-447.
Whiting, P. F., Wolff, R. F., Deshpande, S., Di Nisio, M., Duffy, S., Hernandez, A. V., . . . Ryder,
S. (2015). Cannabinoids for medical use: a systematic review and meta-analysis. Journal
of Addiction Medicine, 313(24), 2456-2473.
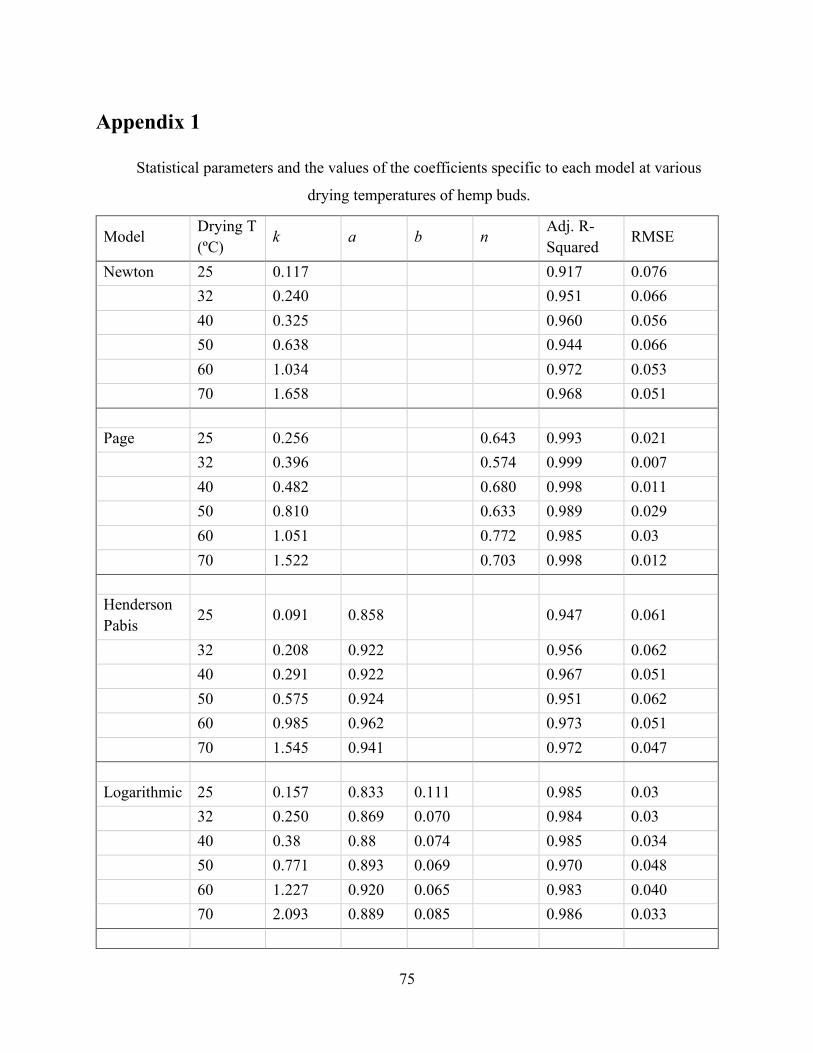
75
Appendix 1
Statistical parameters and the values of the coefficients specific to each model at various
drying temperatures of hemp buds.
Model Drying T
(ºC) k a b n
Adj. R-
Squared RMSE
Newton 25 0.117 0.917 0.076
32 0.240 0.951 0.066
40 0.325 0.960 0.056
50 0.638 0.944 0.066
60 1.034 0.972 0.053
70 1.658 0.968 0.051
Page 25 0.256 0.643 0.993 0.021
32 0.396 0.574 0.999 0.007
40 0.482 0.680 0.998 0.011
50 0.810 0.633 0.989 0.029
60 1.051 0.772 0.985 0.03
70 1.522 0.703 0.998 0.012
Henderson
Pabis 25 0.091 0.858 0.947 0.061
32 0.208 0.922 0.956 0.062
40 0.291 0.922 0.967 0.051
50 0.575 0.924 0.951 0.062
60 0.985 0.962 0.973 0.051
70 1.545 0.941 0.972 0.047
Logarithmic 25 0.157 0.833 0.111 0.985 0.03
32 0.250 0.869 0.070 0.984 0.03
40 0.38 0.88 0.074 0.985 0.034
50 0.771 0.893 0.069 0.970 0.048
60 1.227 0.920 0.065 0.983 0.040
70 2.093 0.889 0.085 0.986 0.033
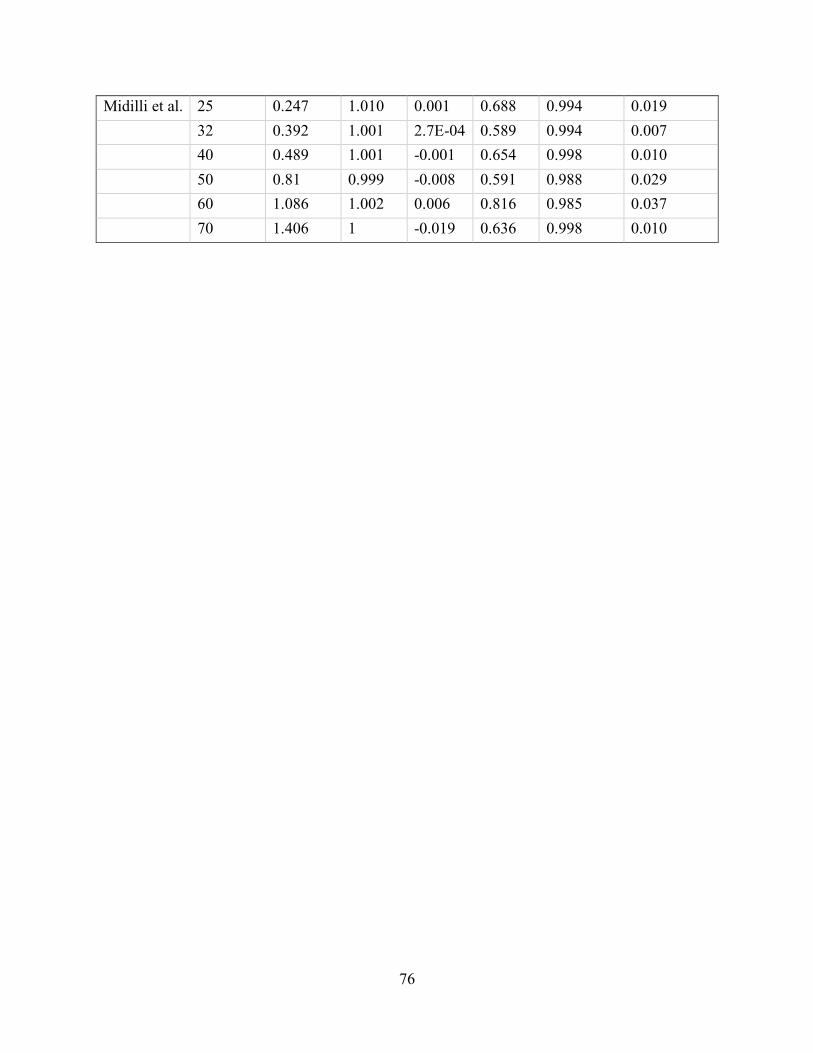
76
Midilli et al. 25 0.247 1.010 0.001 0.688 0.994 0.019
32 0.392 1.001 2.7E-04 0.589 0.994 0.007
40 0.489 1.001 -0.001 0.654 0.998 0.010
50 0.81 0.999 -0.008 0.591 0.988 0.029
60 1.086 1.002 0.006 0.816 0.985 0.037
70 1.406 1 -0.019 0.636 0.998 0.010