
DROUGHT MONITORING AND ASSESSMENT USING SPACE...
11
REGIONAL WORKSHOP ON AGRICULTURAL DROUGHT MONITORING AND ASSESSMENT USING SPACE TECHNOLOGY ". . (} l May 3-7, 2004 NATIONAL REMOTE SENSING AGENCY (Dept. of Space, Govt. of India) and THE 1I1\JITED NATIONS ECONOMIC AI\JD SOCIAL COMMISSION FOR ASIA AND PACIFIC
Transcript of DROUGHT MONITORING AND ASSESSMENT USING SPACE...
REGIONAL WORKSHOP ON AGRICULTURAL DROUGHT MONITORING AND ASSESSMENT USING SPACE TECHNOLOGY
nrs~
~ ". . (}
l
May 3-7, 2004
NATIONAL REMOTE SENSING AGENCY (Dept. of Space, Govt. of India)
and THE 1I1\JITED NATIONS ECONOMIC AI\JD
SOCIAL COMMISSION FOR ASIA AND PACIFIC

COMBATING DROUGHT THROUGH INTEGRATED WATERSHED MANAGEMENT FOR SUSTAINABLE DRYLAND AGRICULTURE
S.P. WANI, S.S. BALLOLl, A.V.R. KESAVA RAO AND T.K. SREEDEVI
International Crops Research Institute for the Semi-Arid Trop ics (lCRISAT). Patancheru, India
Abstract
In a country like India, where 69% of arable land is rainfed, drought is a constant threat in one or another part of country. Drought is a recurring phenomenon and we need to manage drought effectively using the new knowledge and technology rather than dealing with as a disaster. Historical weather data helps in understanding the patterns of drought occurrence as well as establishing the length of the growing season and fItting the suitable cropping systems accordingly. The nexus between drought, land degradation and poverty could be broken by adopting integrated watershed development approach. The ICRISAT and partners developed an innovative farmer participatory consortium model for efficient and sustainable management of natural resources in the watersheds. The approach adopted is integrated genetic and natural resource management (lGNRM) and watersheds are used as entry points for improving the livelihoods. The results of a case study and scaling-up activities under the Andhra Pradesh Rural Livelihoods Program are discussed.
Introduction
The Indian agriculture sectof, which provides nearly 28% to the GDP of the country, is largely affected by droughts. In the SAT, d4e to the large year-to-year variation in the amount and distribution of rainfall, occurrence of drought is inevitable. Basic requirement for drought management is drought characterizati9n and monitoring. There are five distinct categories of drought affecting crop production. These are 1 )Early·season drought, 2) Midseason drought, 3)Late-season or terminal drought, 4}Apparent drought and 5)Permanent drought
Early-season droughts occur in association with the delay in commencement of sowing rains. Mid-season droughts occur in association with th e breaks in the southwest monsoon. Late season or terminal droughts are associated with the early cessation of rainy season and may lead to increase in temperature, hastening crop development and forced maturi ty. Apparent drought conditions prevail due to the mismatching of cropping patterns to rainfall in some reg ions. Permanent drought conditions are common in arid regions and even the drought-resistant crops may fail in certain years.
Droughts have a major impact on the agricultural economy and the underlying natural resources of the region. Both cropland and forestland are affected by drought. Many a time. the land degradation problems are aggravated by drought due to inadequate or totally absent vegetation cover over an area. Erosion of the top fertile soil by wind during drought conditions can reach alarming proportions. Dust storms occurring during drought period can remove huge quantities of fertil e topsoil. During drought years, both irrigated and dry croplands suffer with the result that there will be extreme production losses in dry areas and considerable losses in irrigated croplands. An analysis of avoidable impacts from future droughts is important for planning for drought.
Drought is a creepIng phenomenon. The risk associated with drought is due to the meteorologIcal phenomenon of anomalies in the global circulation paftern and the vulnerability of the region determined by population, landuse, water-use patterns etc. There is very little scope to tame the weather to suit our requirements on a large scale; however. it Is inevitable to make adjustment with the weather to extract the maximum benefit from this resource. Thus, planning for drought management and reducing the \(ulnerability of a region to drought is critical and needs immediate attention.
UNESCAP / NRSA Region.11 WM'st'lop OII.4fJI'CliIlJ~j Drought Montlonng & Asse.ssmt!(ll tJSQ7g SpaC8 TecJ111OIogy, May J-1, 2OIN, Hyderabad, Indta 39

decision support forewarning that enables preparedness for various appropriate
POLICY .L> .... L.L. INTERVENTIONS
development of drought affected into short / immediate, medium and long-term strategies, which are 1'10't'!f",'lnO,r1
Short I Immediate Term II Need based oriented «:'1"1"''''' .... ''0'''
II Supply of drinking water, II Planned mIning places
II water for drinking, agriculture, etc. drought resistance crops, etc.
Mid • • .. .. .. • .. .. .. • ..
R&D Institutional reforms Improving infrastructure and market institutions Replicating successful watershed projects Greater role for states Diversification 'and farming systems !:Iinru'n~:lf"h Institutions mechanisms for water n:::;u'\IC'~1 Artificial recharge of ground Afforestation
use
.. to.f"nnlll"'.:::.1 knowledge: Encoura'ging NGO participation
.. (NAP)
411 Creation surface storage 411 Integrating small reservoirs with major reservoirs • Integrated basin • inter basin transfer • Increasing water aVc::lIIaOlllty areas through watershed development
Governmental .... 91', ........ ~iE'
• Crop weather watch nation and state revels • through buffer stocks • for relief compensation
<:Ir'l\,'ar'c!~o. impact of drought on the ecosystems can be mitigated by understanding characteristics of drought that enable the selection of appropriate strategies to be
Implemented at the field level. for an integrated considering all the natural resources, including the socia-economic profile of involving people in the efforts towards combating technologies that have immense potential could
UNESCAP / NRSA Tec/J'noI0f..7J: May 3-1, 2004, Hyderabad, India 38

Characterization of drought
It is important to understand drought characteristics, frequency and severily, and a region's changing vUlnerability. Presentation of results of drought climatology in a simple, yet scientific way will help comprehend the drought situations for risk-based drought management.
Almost every year, India experiences drought in some part or the other. Different criteria are followed to identify meteorological drought at different scales of area and time. When the whoie country is considered, droughts are classified as severe, if 39.5% to 47.6% of area is affected and as phenomenal, if more than 47.7% of the country is under drought (Kulshrestha, 1997).
Table 1. All India Monsoon Droughts during 1950-2003
._---- -----Drought category Calendar year (s)
1-.-'" Moderate 1951. 19S6.1968, 1974, 1982 and198S Severe 1965.1979,2000 and 2001 I Phenomena! I 1972, 1987 and 2002
. I
It can be seen from the Table 1 that there were 13 droughts of different intensities in india since 1950, in which phenomenal droughts occurred in 1972, 1987 and the latest in 2002. The monsoon drought of 1987 was one of the worst in history with rainfall deficiency exceeding 1.50 SD (Sikka, 1999). India Meteorological Department has officially declared that the year 2002 has been "the first-ever all-India drought year" since 1987. The phenomenal drought situation in 2002 was mainly caused by the dry spell in July, with the rainfall deficiency of 49 per cent during the month being "the worst in the history of recorded observations". Only on two previous occasions in the past (1911 and 1918) did rainfall deficiency exceed 45 per cent in July.
Realistic visualization of drought scenario of India is possible with the knowledge of monsoon rainfall is combined with the spatial distribution of drought-proneness in the country. Considering the Report of the National Commission on Agriculture and additional data from the Central Water Commission of India, 8agchi (1991) has identified 100 districts in India as drought-prone (Table 2).
Table 2. Drought Prone Districts of India as identified by 8agchi (1991)
!
---------i p·opulation affected State No. of Drought~prone Area affected (%)
districts i (%) I Andhra Pradesh 8 42 I 35 I I--B-fh-ar--------------------~ -----~ -------- ------------------------~-..
--1 7 26 22 I Gu[arat 12 79 68 I I Haryana
.~---.
I I ~1 4 33 32 Jammu & Kashmir I 2 I . -Karnataka 14 74 . -Madhya Pradesh
. 11 .. -
Maharashtra 9 40 36 Orissa 2 15 -
i Ra:aslhan 13 63 45 :-Tamll Nadu
------------
9 64 .. i .. ----~ -------------------------------------------._---- ..
I Uttar Pradesh 6 15 12 I West Bengal 3 31 20 I
Earlier approach for drought management was to wait until an event occurs and try to mitigate its consequences by whatever means available (Ramakrishna et ai, 2002). Drought is always managed as a disaster however, knowing that in India, 69 per cent of arable area is rainfed and large number of dislricts (100) are drought prone. we must adopt a systematic drought management approach for minimizing the impact on livelihoods and natural resources. Integrated watershed management could be the best solution in this direction for combating drought, achieving sustainable agricultural productivity, minimizing land degradation and affecting livelihoods in the region.
UNESCAP / NR,SA Roghna/ WO,kShOp on Agricultural Drought Mom7ormg & Assessment [}smg 'pace Ted!nOlOgy, May J-l, 2004, liy./orabad, Indta 40

It is seen that there is a great year-to-year variation in both the beginning and end of crop-growing season at Kacharam. In the years 1985 and 2000, crop-growing season started as early as end of May. Beginning was most delayed in 1975, when it started in the last week· of July. Crop-growing season ended very early by middle of September in 1980, making this year to have shortest growing period of only 14 weeks. Total duration was longest (26 weeks) during 1987 and 1993, in which the season ended as late as third week of December. It is generally observed that variability in the beginning of the season is high compared to the variability in the end. However, no definite relationship between the beginning of season and the total crop-growing period could be observed. Probability for the beginning and end of CGS at Kacharam based on data of 31 years are presented below:
BeginnIng of CGS at Meteorological week Kacharam 22 I 23 I 24 I 25 I 26 I 27 I 28 I 29 I 30 I 31
ProbabIlity (% 6 I 23 I 52 I 58 I 71 I 90 I 94 I 94 I 97 I 100
End DIGGS Meteorological week At Kacharam 41 I 42 I 43 144 I 45 I 46 I 47 I 48 I 49 I 50 Probability (%) 94 I 94 I 84 I 81 I 74 I 65 I 42 I 26 I 13 16
II can be seen from Ihe above that al Kacharam, there is 50% probability Ihat the crop-growing season begins by the middle of June (24'" week) and 70% probability that it begins by the end of June. One can be 90% sure that the CGS begins by 2ih week. There is 90% probability that the CGS ends by 42"" week (3'd week of October) and 70% chance that it ends by 2nd week of November (45'h week). It is interesting to note that the probability jumps from 70% to 90% in just one week for the beginning of CGS, while it takes three to four weeks to fall from 90% to 70% for the end of CGS.
This indicates a sharp beginning of CGS and the need for critical planning of sowing related operations. During the CGS, if the IMA value falls below 20%, soil moisture availability to crops becomes ne9ligible; if this condition continues for two or more weeks, disastrous drought conditions prevail. It is observed that at Kacharam, such drought conditions occurred in eight years (1971,1972,1976,1985,1986,1998,1999 and 2001) out of the 31-year study period. Classic examples are the years 197.2 and 1976 during which the drought occurred in fiowering and maturity stages; the year 2001 in which early-season disastrous drought led to total crop loss.
Monitoring of moisture availability to crops at the APRLP-ICRISAT watersheds during the year 2003 was carried out using' the water balance technique and the results are presented in Fig. 2. Longest CGS of 26 weeks is observed at Kacharam, however, it suffered from early-season drought of three-week duration. Mentapally experienced shortest CGS of only 14 weeks, but without any disastrous drought spell.
N~mmlllil
KacnlulIl\
lturumlllapLlfam
SlIpUl'ilm
MenlllpllJly
Malieboillptlily
ApDatHpally
Kanvemola
NlllldswJam
MeteroIogJcal week n ~ a ~ ~ ~ ~ ~ ~ ~o G ~~ ..
=-,------,
Dry spell class
11'1 Disastrous r==J Se .... ere c=:J Moderate t;~ Mild iaI Nil
Fig. 2 Drought monitoring at APRLP watersheds during 2003
" so 02 I , , I .-
1--i , I
UNESCAP / NRSA RegfOf1a/ Wcv*sbop on Aom:vllvral Drought Monflonng & Assessmenlllsing Space Technol09Y, May 3-7, 2004, Hyderabed, indIa 43

• Capacity building of local farmers and NGOs for effective dissemination of technologies • Empowerment of communities, individuals and the strengthening of village institutions • Initiation of income generating micro-enterprises involving youth, women and landless
people • Continuous monitoring and participatory evaluation by researchers and stakeholders
Combating Drought Impacts through Integrated watershed management practices
The besl way \0 deal with the recurnng drought particularlY in drylandlrainfed areas is to learn to live with II by minimizing its impacts. Sound agricultural planning/strategies can help in minimizing the drought impacts. Some of the sound integrated watershed management strategies that have developed by ICRISAT in partnership with NARSs by conducting on-station trials and on-farm tnals in different watersheds for overcoming hydrological, agricultural and socio-economic droughts are discussed.
Characterizatlon and monitoring of droughts through agroclimatic approach:
Out 01 these eight districts, under the APRLP-ICRISAT Project, automatic weather stations were installed at the nucleus watersheds during the year 2002 in Nalgonda, Mahabubnagar and Kumool districts. Weather data is mOnitored continuously and a database is being developed Long-period rainfall data of the watershed locations is collected and analysed lor identifying the beginning and end of rainled crop-growing season (CGS), Following the methods of Penman and Thornthwa.te, weekiy potenbal evapotranspiration and water balances were computed for these watersheds. Based on the' Index of Moisture Adequacy (lMA, the ratio of actual evapotranspiration to potential evapotranspiration), the beginning and end of crop-growing season lor 31 years (1971-2001) was determined for the Kacharam watershed (Fig.1). Determination of the beginning, end and length of crop-growing season is a pre-requisite lor understanding 11le drought severity conditions in the cropgrowing period,
Mete;otoglca! week
~ ~ • • • ~ ~ ~ M • G ~ ~ • M ~
''''
"" .w. ISIH
"" ",. 'OJ"
1$91
Year Ory spoil class
Fig. 1 Length of crop-growing season and drought spells at Kacharam
IJNESCAP INRSA Reg/OIl.; WO!I:sl1op on AgflcuQvral {)foyg.lI Mofllionfl{l &AS!If!SSIIIenl tJSttIfI SIJilC!! Tet!tnoklgy, Mey 3-1, 2IJIflI, Hydsta/Jad, lnd.. 42
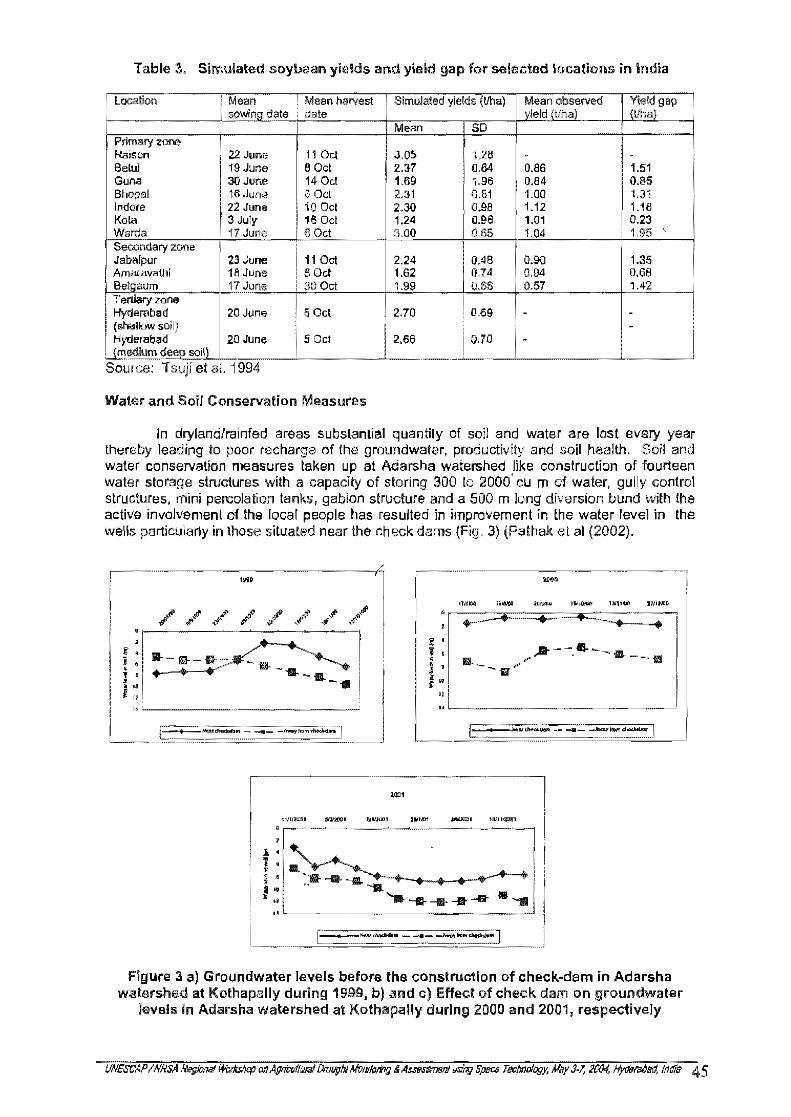
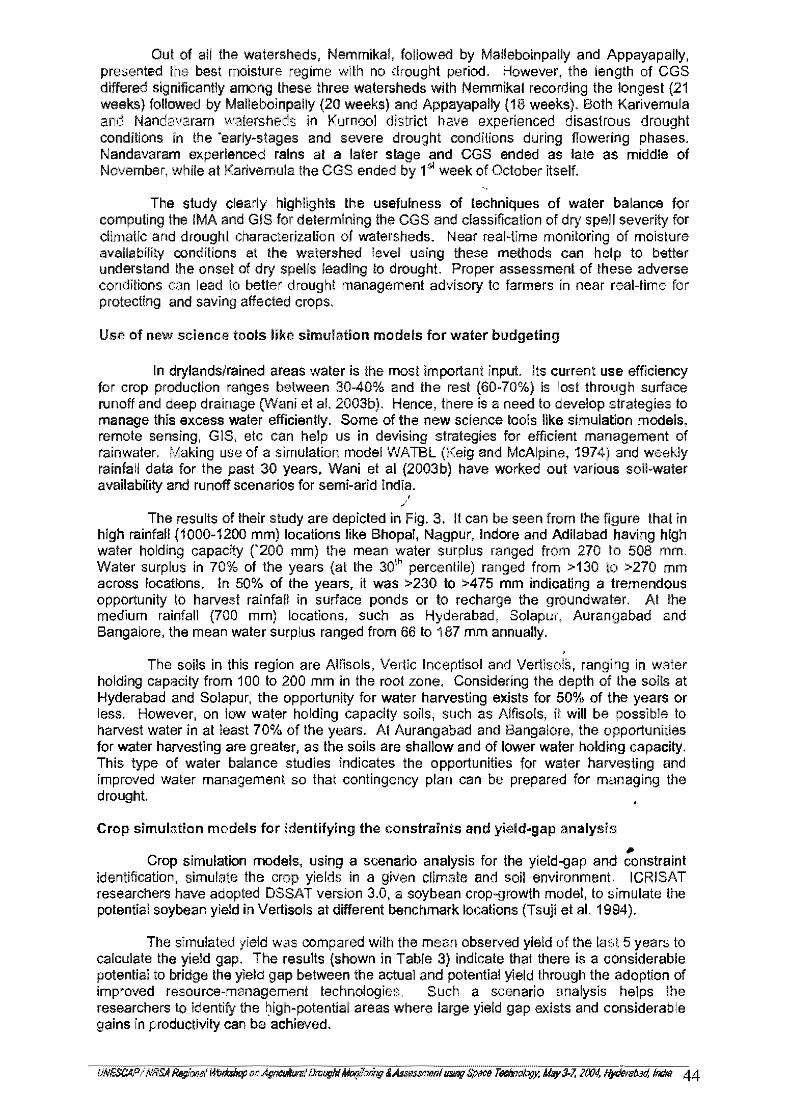
Table 3. Simulated soybean yields and yield gap for selected locations in India
i Mean : Mean harvest I Simulated yields (Uha) Mean observed Yi.1d g'? i sol'li~il2ate ; date ~eld3tlh'~t (tlha) .
Mean SD Primary Z1Jfle
i 22 June Raisen 11 Oct 3.05 1.26 - -8elul 19 JUi'ie 8 Oct 2.37 0.64 0.86 1.S1 Guna 13!J June 14 Del . 1.69 1,95 0.84 0.85 Bhopal 16 June , B OCl 2.31 0.01 1.00 1.31 Il"Idare 22 June i 10 Oct 2.30 0.98 1.12 1.18 Kala : 3 July 18 Oct 1.24 0.96 1.01 0.23 Warda I 17 June 6 Oct 3.00 0.65 1.04 1.95 .
[-Secondary 20l1e -
Jabafpur 23.June 11 Dot 2.24 0.48 I 0.90 1.35 Amacavalili 18 June BOct 1.62 0.74 I 0.94 0.68 iletQaum 1? .. ~.t!ne SOOci 1.99 O.SS 0.57 1.42 T ertlary zone
I 5 Oct Hydembad 2(1 June , 2.70 I 0.69 . - -(shatlow soil)
12
.68 ! 0.70
-: H}1£lerabad 20 June I 5 Oct -lJ:!1.G<liumdeep sell) .. Source: TSUJI at al. 1994
Water and Soil Conservation Measures
In dryland!rainfad areas substantial quantily of soil and water are lost every year thereby leading to poor recharge of the groundwater, productivity and soil hea:L~. Soil and waler conservation measures laken up at Adarsha watershed like construction of fourteen water storage structures with a capacity of storir.g 300 10 2000' cu m of water, gully control structures. mir.i percolation tanks, gabion structure and a sao m long diversion bund with the active involvement 01 the local people has resulted in improvement in the water level in Ihe wells particularly in Ihose situated near the check dams (fig. 3) (Pathak et al (2002).
~-I
, f. III-! ~ -"-G--l , • ! ,.
; " ,,~-----.... ------~
! ]1 . , >Ii
...- . uLI ____ _
•
Figure 3 a) Groundwater levels before the construction of check-dam in Adarsha watershed at Kothapally during 1999, b) and c) Effect of check dam on groundwater
level" in Adarsha watershed at Kothapally during 2000 and 2001, respectively
I
Out of ali the watersheds, Nemmikal, followed by Malleboinpally and Appayapally, presented the best moisture regime with no drought period, However, the iength of CGS differed significantly aroong these three watersheds with Nemmikal recording the longest (21 weeks) followed by Malleboinpally (20 weeks) and Appayapally (18 weeks), Both Karivemula and Nandavaram watersheds in Kurnool district have experienced disastrous drought conditions in the "early-slages and severe drought conditions during flowering phases, Nandavaram experienced rains at a later slage and CGS ended as late as middle of November, while al Karivemula the CGS ended by 1" week of October itself.
The study clearly highlights the usefulness of techniques of water balance for computing the IMA and GIS for determining the CGS and classification of dry spell severity for Climatic and droughl Characterization of watersheds. Near real-time monitoring of moisture availability conditions at the watershed level using these methods can help to better understand the onset of dry spells leading to drought. Proper assessment of these adverse conditions can lead to better drought management advisory to farmers In near real·time for protecting and saving affected crops,
Use of new science toots like simulation models for water budgeting
In drylandslrained areas water is the most important Input. Its current use efficiency for crop production ranges between 30-40% and the rest (60·70%) is lost through surface runoff and deep drainage (Wani et al. 2003b). Hence, there is a need to develop strategies to manage this excess waler efficiently. Some of the new science tools like simUlation models, remole sensing, GIS, etc can help us in devising strategies for efficient management of rainwater, Making use of a simUlation model WATBL (Keig and McAlpine, 1974) and weekly rainfall dala for Ihe past 30 years, Wani et al (2003b) have worked oul various soll·water availability and runoff scenariOS for semi·arid India. ,
,/
The results of their study are depicted in Fig, 3, It can be seen from Ihe figure that in high rainfall (1000-1200 mm) locations like Bhopal, Nagpur, Indore and Adilabad having high waler holding capacity ('200 mm) the mean water surplus ranged from 270 to 508 mm, Water surplus in 70% of the years (at the 30'" percentile) ranged from >130 to >270 mm across locations, In 50% of the years, it was >230 to >475 mm indicating a tremendous opportunity to harvest rainfall in surface ponds or to reCharge the groundwater. At the medium rainfall (700 mm) locations, such as Hyderabad, Solapur, Aurangabad and Bangalore, the mean water surplus ranged from 66 10 187 mm annually,
The soils in this region are Alfisols, Vertic Inceptisol and Vertisols, ranging in water holding capacity from 100 to 200 mm in the root zone. Considering the depth of the soils at Hyderabad and Solapur, the opportunity for water harvesting exists for 50% of the years or less, However, on tow water holding capacity soils, such as Alfisols, it will be possible to harvest water in al least 70% of the years. AI Aurangabad and Bangalore, the opportunities for water harvesting are greater, as Ihe soils are shallow and of lower waler holding capacity, This type of water balance stUdies indicates the opportunities for water harvesting and Improved water management so that contingency plan can be prepared for managing the drought
Crop simulation models for identifying the constraints and yield-gap analysis II>
Crop simulation models, using a scenario analysis for the yield-gap and constrainl identification, simulate the crop yields in a given climate and soil environment. ICRISAT researchers have adopted DSSAT version 3,0, a soybean crop-growth model, to simUlate the potential soybean yield in Vertisols at different benchmark locations (Tsuji et at. 1994),
The simulated yield was compared with the mean observed yield of the last 5 years to calculate the yield gap. The results (shown in Table 3) indicate that there is a considerable potential to bridge the yield gap between the actual and potential yield through the adoption of improved resource-management technologies. Such a scenario analysis helps the researchers to identify the high-potential areas where large yield gap exists and considerable gains in productivity can be achieved.
Integrated soil fertility management
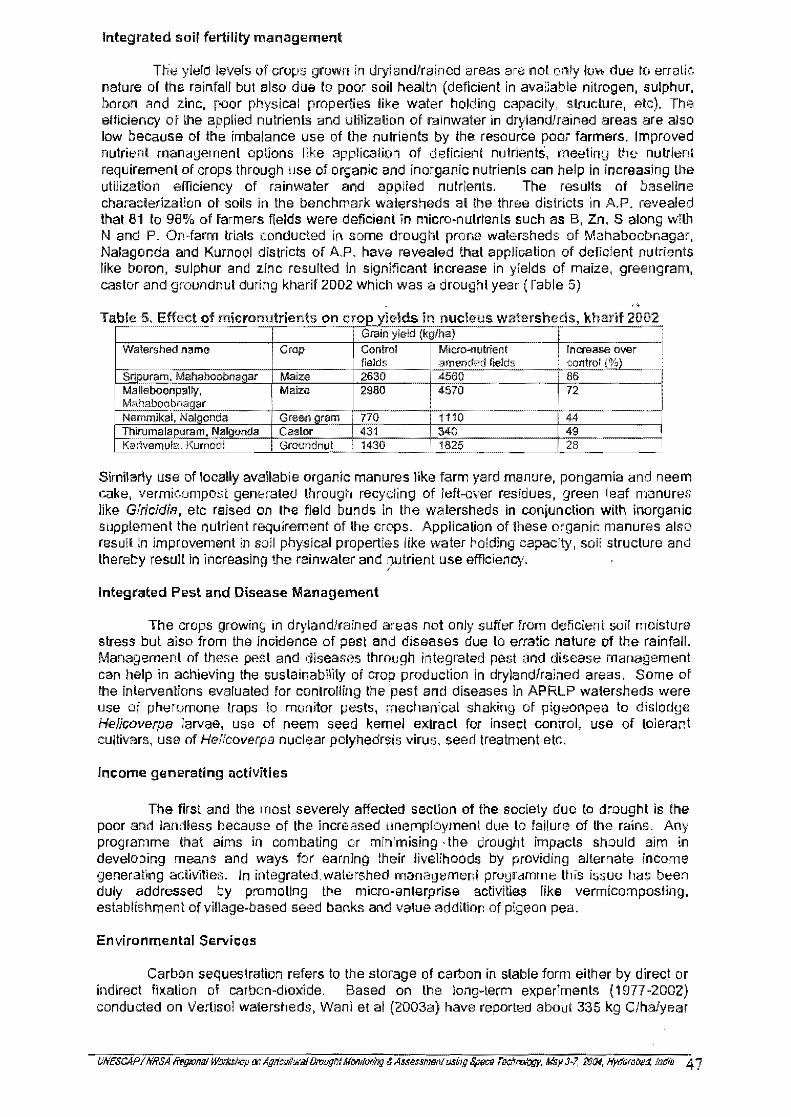
The yield levels of crops grown in drylandlrained areas are not only low due 10 erralic nature of the rainfall but also due to poor soil health (deficient in avaDable nitrogen, sulphur, boron and zinc, poor physical properties like water holding capacity, structure, etc). The efficiency of the applied nutrients and utilization of rainwater in dryland!rained areas are also low because of the imbalance use of the nutrients by the resource poor farmers. Improved nutrient management options like application of deficienl nutrients, meeting the nutrient requirement of crops through use of organic and inorganic nutrienls can help in increasing the utiiization efficiency of rainwater and applied nutrients. The results of baseline chara:::lerizalion of soils in the benchmarK watersheds al the three dislricts in A.P. revealed Ihat 81 10 98% of farmers fields were deficienl in micro-nutrienls such as S, Zn, S along wrth Nand P. On-farm trials conducted in some drought prone watersheds of Mahaboobnagar, Nalagoncia and K~rnool districts of AP. have revealed that appliGation of deficient nutrients like Doron, sulphur and zinc resulted in signi~cant increase in yields of maize, greengram, Gas tor and groundr.ut during kl1arif 2002 which was a droughl year (Table 5)
T able 5. Effect of micronutrlents on crop yields in nucleus watersheds, kharif 2002 : GIain yield (kg/ha) I
------~
Watershed n;:,mo Crap Control Micro~ui~:~~s : Increase over fields : control {%)
~ .•.................. . __ .. ~~r~m! Mahaboobnagar Maize 2630 4560 • 86 : MaliaboenpaHy. ! Maize 2980 4570 172 : Mahaboobnagar
i Greengr~m : Nemmikal, Nalgonda 770 1110 44 ~~~r!!.maJa puram, _~a!Qonda Gastor • 431 340 49 I
Karivemu!a. KutnooJ Groundnu.t 1430 1825 28
Similarly use of locally available organic manures like farm yard manure, pongamia and neem cake, vermicompost generated through recycling of left-over residues, green leaf manures like Glricidi8, etc raised on Ihe field bunds in the walersheds in coniunction with inorganic supplement the nutrient requirement of the crops. Application of these organic manures also resull in improvement in so:! physical properties like water holding capacity, soH structuro and thereby result in increasing the rainwater and ;,tutrient ~se efficiency.
Integrated Pest and Disease Management
The crops growing in dryland!ra:ned areas not only suffer from deficient soH moisture stress but also from the inGidence of pest and diseases due to erratic nalure of the rainfall. Management of these pest and diseases through integrated pest and disease management can help in achieving the sustainab1Jjty of :::rop production in drylandlrained areas. Some of the inlervenlions evaluated for conlrolling Ihe pest ami diseases in APRlP watersheds were use of pheromone traps to monitor pests, mechanical shaking of plgeonpea to dislodge HeliCDVe~lJa larvae, USB of neem seed kernel extract for insect centrol, use of tolerant cuilivars, use of He/icoverpa nuclear polyhedrsis virus, seed trealment etc.
Income generating activities
The first "nel the most severely affecled section of the society duo to dmughl is Ihe poor and landless because of the increased unemployment due to failure of the rains. Any programme thai aims in combating or minimising· the drought impacts shOuld aim in developing means and ways for earning their livelihoods by providing alternate income generating aclivities. In integrated. walershed management programme this issue has been duty addressed by promoting the micro-enterprise activities like vermicomposting, establishment of village-based seed banks and val~e addition of pigeon pea.
Environmental Servi~as
Carbon sequestration refers to the storage of carbon in stable form either by direct or indirect fixation of Galban-dioxide. Based on the long-term experiments (1 8n -2GGZ) conducted on Vertiso: watersheds, Wani et al (2003a) have reported about 335 kg Clhalyear
The water level in these wells was consistently higher (around <3m) even during below normal rainy season, whereas the water level in wells located away from the checkdams was about 6 m deep, Due to increased water availability, a total of 200 ha in post kharif and 100 ha in post rabi season was brought under cultivation, These soil and water conservation measures also resulted in reduction of soil and runoff loss, Similarly at Lalatora watershed, Vidisha district, Madhya Pradesh the water level in open wells was about 6,5-9,5 m before the implementation of the watershed activities ie 1998-99, After the implementation of the integrated watershed activities the water level increased substantially, During 2000, the mean water level in the wells near the check dams was consistently around 1,5 to 2 m up to October whereas water level in the wells located away (about 1000 m) from the checkdams was about 8,5 m throughout the year (Pathak et al 2002),
Crop diversification
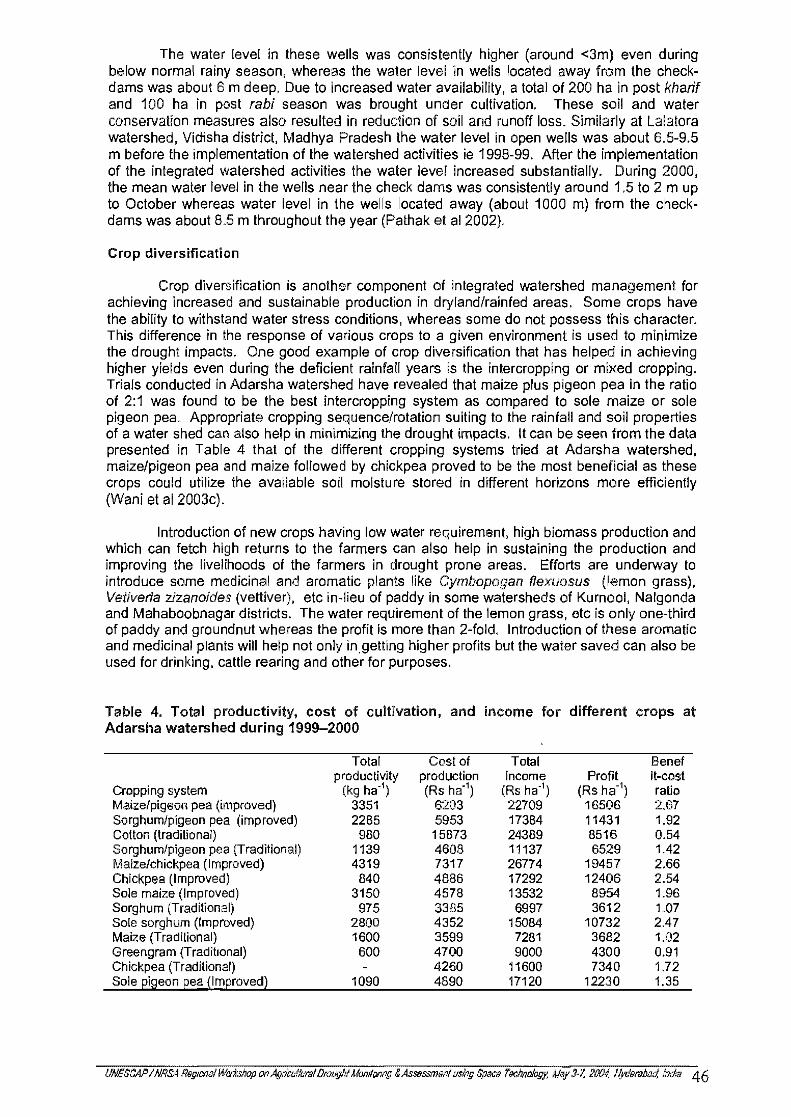
Crop diversification is another component of integrated watershed management for achieving increased and sustainable production in dryland/rainfed areas, Some crops have the ability to withstand water stress conditions, whereas some do not possess this character. This difference in the response of various crops to a given environment is used to minimize the drought impacts, One good example of crop diversification that has helped in achieving higher yields even during the deficient rainfall years is the intercropping or mixed cropping, Trials conducted in Adarsha watershed have revealed that maize plus pigeon pea in the ratio of 2:1 was found to be the best intercropping system as compared to sole maize or sole pigeon pea, Appropriate cropping sequence/rotation suiting to the rainfali and soil properties of a water shed can also help in minimizing the drought impacts, It can be seen from the data presented in Table 4 that of the different cropping systems tried at Adarsha watershed, maize/pigeon pea and maize followed by chickpea proved to be the most beneficial as these crops could utilize the available soil moisture stored in different horizons more efficiently (Wani et aI2003c),
Introduction of new crops having low water requirement, high biomass production and which can fetch high returns to the farmers can also help in sustaining the production and improving the livelihoods of the farmers in drought prone areas, Efforts are underway to introduce some medicinal and aromatic plants like Cymbopogan flexuosus (lemon grass), Vetiveria zjzanoides (vettiver), etc in-lieu of paddy in some watersheds of Kurnool, Nalgonda and Mahaboobnagar districts, The water requirement of the lemon grass, etc is only one-third of paddy and groundnut whereas the profit is more than 2-fold, Introduction of these aromatic and medicinal plants will help not only in getting higher profits but the water saved can also be used for drinking, cattle rearing and other for purposes,
Table 4, Total productivity, cost of cultivation, and income for different crops at Adarsha watershed during 1999-2000
Total Cost of Total Benef productivity production income Profit It-cost
Cropping system (kg ha") (Rs ha") (Rs ha") (Rs ha-') ratio Maize/pigeon pea (improved) 3351 6203 22709 16506 2.67 Sorghum/pigeon pea (improved) 2285 5953 17384 11431 1.92 Cotton (traditional) 980 15873 24389 8516 0.54 Sorghum/pigeon pea (Traditional) 1139 4608 11137 6529 1.42 Maize/chickpea (Improved) 4319 7317 26774 19457 2,66 Chickpea (Improved) 840 4886 17292 12406 2.54 Sale maize (Improved) 3150 4578 13532 8954 1.96 Sorghum (Traditional) 975 3385 6997 3612 1.07 Sale sorghum (Improved) 2800 4352 15084 10732 2.47 Maize (Tradilional) 1600 3599 7281 3682 1.02 Greengram (Traditional) 600 4700 9000 4300 0.91 Chickpea (Traditional) 4260 11600 7340 1.72 Sale ~i~eon ~ea ilm2roved) 1090 4890 17120 12230 1,35
UNESCAP I NRSA RegIonal WQfflsnop (}(J Agn"clillliral Drolight MOI1llonng & Assessment us/Pg Space Techn%gy, May 3-1, 2004, Hydera/Jad, Indta 46

can be sequestered by employing integrated watershed management practices along with pigeon pea - based systems. Conservation of this carbon in soils heips in building up the soi[ organic matter, Improving the soli physical properties like structure, water holding capacity, aggregate stability etc and also reduce the level of gree~ house gases In the atmosphere. I~
the community watersheds through SWNM options, degraded lands are being rehabilitaled using fo,age grasses and biodiesel plantations using Pongamia pinnata and Jalropha caracus. These plants a:50 help in saving C emissions to the environment through C switch from fossil fuel to vegetable oil and also sequester C in soil (D'silva e! aI" 2004).
References Sagchi, K.S. 1991. Drought Prone India - Problem and Perspectives. Vol. I & II, Agricole
Publishing Academy, New Delhi Emmanuel D'Silva, Suhas P. Wani and Basre Nagnath. 2004. The Making of a New
Powerguda CommunIty Empowerment and New Technologies Transform a Problem Village in Andhra Pradesh. In Press,
Keig, G. and McAlpine, J. R. (1974) WATBAL: a computer s~'Stem for the estimation and analysis of soil moisture regimes from simple data, 2"' Technical Memorandum, 7417, Australian Division of Land ResearCh, CSIRO, Canberra
Kulshreslha, S,M. 1997. Drought Management in India and Polential Contribulion of ClimatePrediction. Joint COLA/CARE Technical Report No.1.
Pathak. P., Wani, S.P., Piara Singh, Sudi, R. and Srinivasa Rao, Ch. (2002) Hydrological Characlerization of benCh mark agricullural watersheds in India, Thailand, Vietanam, Global Theme 3, Report no.2. Patancheru 502 324, Andhra Pradesh, India: International Crop Research Institute for the Semi-Arid Tropics.52p
Ramakrishna. Y.S" Sharma, K.D., Rao, G.G.S.N. and Kesava Rao, AV.R. 2002, Climalalogical Aspects of Droughts and their Management. Proc. Recent Trends in Drought Assessment, Monitoring and Management, CSRE, liT, Bombay. Pp.8-15.
Sikka, D.R. 1999. Monsoon drought in India. Joint COLA/CARE Technical Report No,2. Tsuji. G.Y., Jones, J. W., and Balas, S:'(eds)(1994) DSSAT v.3 U~iversfly of Hawaii, Honolulu, Hawaii.
Wani, S.P" Rego, T.J, and Pathak, P (eds) (2002) Improving management of natural resources for sustainable rained agriculture. Proceedings of the traimng workshop on On-farm Participatory Research Methodology. 26-31 July 2001, Khon Kaen, 8angkok, Thailand, ICRISAT, Pa'ancheru, .lIndhra Pradesh, India pp.68
Wani, S.P., Pathak" P., Jangawad, LS" Eswaran, H. and Singh, P. (2003a), Improved management 01 Vertisols in the semi-arid tropics for increased productivity and soii carbon sequestration. Soil Use and Management (2003) 19, 217-222.
Wani, S.P., Pathak, p" Sreedevi, T. K., Singh, H.P and Singh, P (2D03b) Efficient management of rainwater for increased productivity and groundwater recharge in Asia, In Water Productivity in Agriculut~re: limits and Opportunities for Improvement (eds J. W.Krjne, R Barker and D Molden) CAB International. 2003
Wani, S.P., Singh, HoP., Sreedevi, T.K., Pathak, P., Rego, T.j" Shiferaw, S. and Iyer, SR. (2003c) Farmer-participatory integrated watershed management:Adarsha watershed, KothapalJy india. An innovative and upscalable approach, In Research Towards Integrated Natural Resources Management (eds .R. R. Harwood and A. I-t, Kassam) Interim Sciene Council, Centre Directors Committee on Integrated Natural Resources Management, Rome 2003,