Driving Nutrition, Health & Wellness...Disclaimer This presentation may contain statements which...
31
Nestlé India Limited (NIL) Gurgaon, 15 th May 2009 Driving Nutrition, Health & Wellness 15 th Financial Analysts’ Meet
Transcript of Driving Nutrition, Health & Wellness...Disclaimer This presentation may contain statements which...

1
Nestlé India Limited (NIL)
Gurgaon, 15th May 2009
Driving Nutrition, Health & Wellness
15th Financial Analysts’ Meet
DisclaimerThis presentation may contain statements which reflect Management’s current views and estimates and could be construed as forward looking statements. The future involves certain risks and uncertainties that could cause actual results to differ materially from the current views being expressed. Potential risks and uncertainties include such factors as general economic conditions, commodities and currency fluctuations, competitive product and pricing pressures, industrial relations and regulatory developments.Responses can only be given to questions, which are not price sensitive.
Calculations in this presentation are based on non-rounded figures.
Real Internal Growth (RIG) and Organic Growth (OG) are in relation to
third party sales only

2009
RIG OGNet Sales
INR 12.7 Bio
INR 10.9 Bio
+ 16.0% + 170bps
21.9%
20.2%
Volumes
& Prices
11.8%16.0%
28.1%26.5%
OPBIT
+ 26.4%
INR 2.8 Bio
INR 2.2 Bio
1st Quarter highlights
All calculations are based on non-rounded figures
2008Economic
Profit
+ 25.0%
INR 1.6 Bio
INR 1.3 Bio
Includes Figures from Nestlé Internal Reporting Standards
+ INR 1.8 Bio
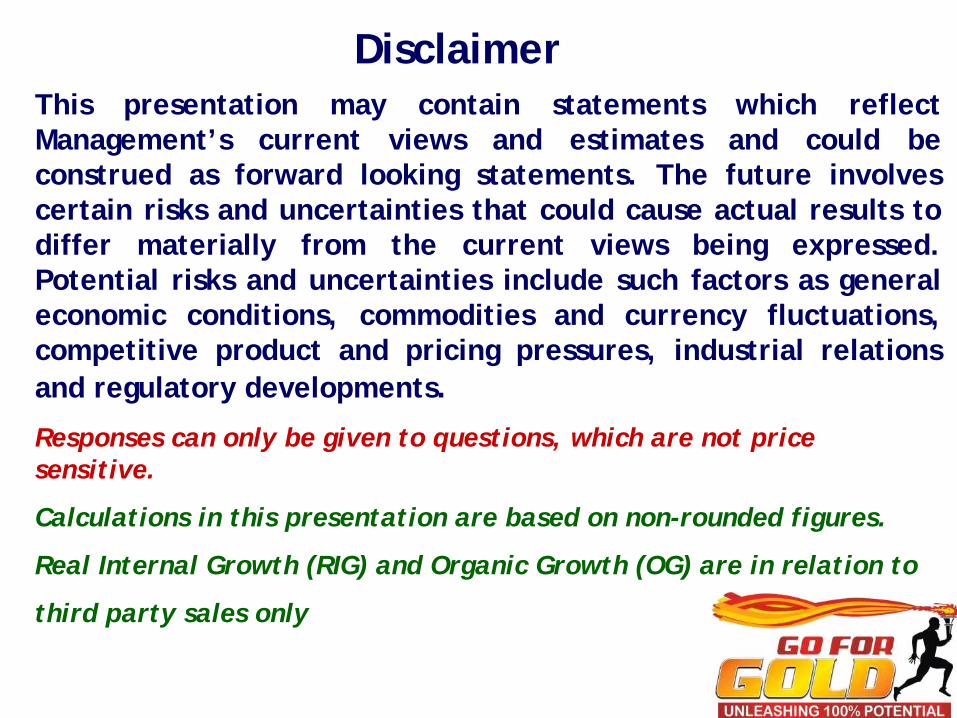
• Exports
• Key Accounts
• Portfolio
Rationalization
• Out Of Home
1st Quarter performance Impacted by
•Mix &
Realisations
•Commodities
•Exports Incentives
•FOREX
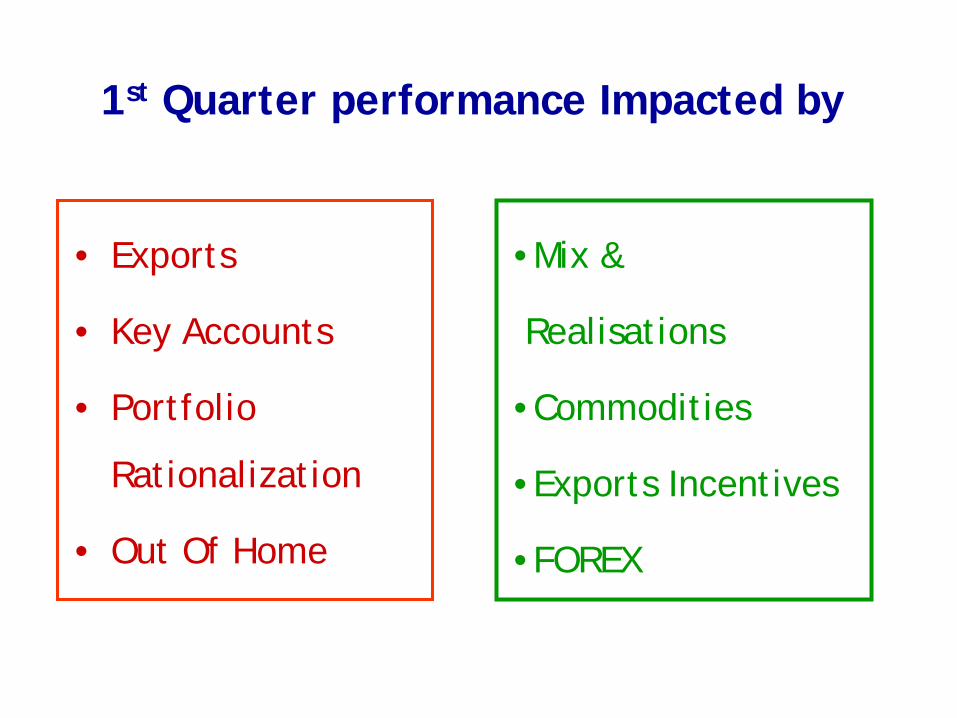
12.710.49.18.6 8.4 10.99.0 11.1 10.9
27.7 23.2 25.5 21.6 26.4 23.5 22.2 21.7 16.0
Sustained performance over quarters
1.6 1.5 1.8 1.4 2.3 1.7 1.8 1.9 2.8
Q1 Q2 Q3 Q4
EBIT
(IN
R Bi
o)N
ET S
ALE
S (I
NR
Bio)
2007 2008 2009
2007 2008 2009
% QoQ growth
18.8 17.5 19.3 15.3 20.9 16.7 16.6 16.7 22.4% of Net Sales

28.2 35.0 43.2 10.9 12.7
2006 2007 2008 Q1 08 Q1 09
Net Sales INR Bio
Continue on the growth trajectory
Includes Figures from Nestlé Internal Reporting Standards
12.1
23.3
24.2
28.116.0
9.7
19.8
20.0
26.511.8
Organic Growth (%) Real Internal Growth (%)

Strong domestic sales performance
All calculations are based on non-rounded figures
Domestic Sales
74.0 81.9
Q1 08 Q1 09
4.6 3.4
Q1 08 Q1 09
10.0 11.9
Q1 08 Q1 09
Export Sales
0.9 0.7
Q1 08 Q1 09% share of domestic volumes increases
from 94.2 to 96.0 ~ 180bp% share of domestic value increases from 92.0 to 94.2 ~ 220bp
+10.7% +18.7%
-25.3%-15.1%
Volume (000’ Tons)
Volume (000’ Tons) Value (INR Bio)
Value (INR Bio)
All calculations are based on non-rounded figures

46.347.0
17.815.8
21.823.3
14.113.9
Q1 09 Q1 08
% Share
Multiple growth drivers are in place
% ShareChocolate &
Confectionery
Prepared Dishes& Cooking Aids
Beverages
Milk Products & Nutrition
Net Sales
- 0.2%
+ 1.5%
- 2.0%
+ 0.7%
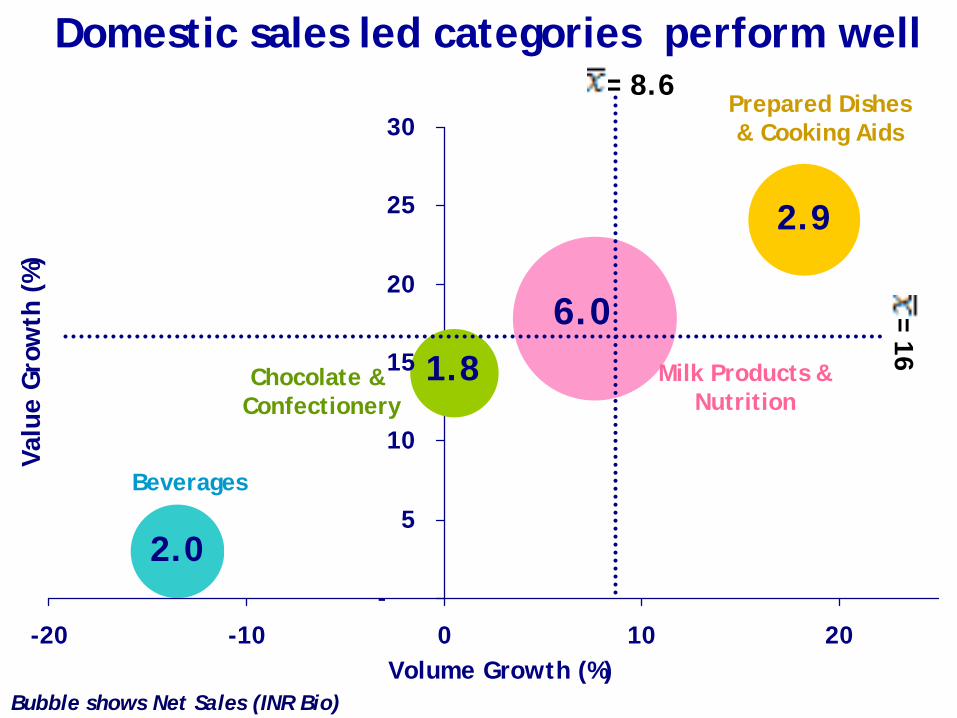
6.0
2.9
2.0
1.8
-
5
10
15
20
25
30
-20 -10 0 10 20Volume Growth (%)
Valu
e G
row
th (
%)
Domestic sales led categories perform well
Bubble shows Net Sales (INR Bio)
= 16= 8.6
Chocolate & Confectionery
Beverages
Milk Products & Nutrition
Prepared Dishes & Cooking Aids

31.6 34.0
Q1 08 Q1 09
5.1 6.0
Q1 08 Q1 09
Milk Products & Nutrition
Sales (000’ tons)
+7.6%
Sales (INR Bio)
+17.8%
Market Position (Value)
• No. 1 in Baby Foods & Infant Formula
• No. 1 in Dairy Whitener.• Strong presence in
Sweetened Condensed Milk
• Good presence in Fresh Dairy
Innovation & Renovation
Contribution 47%
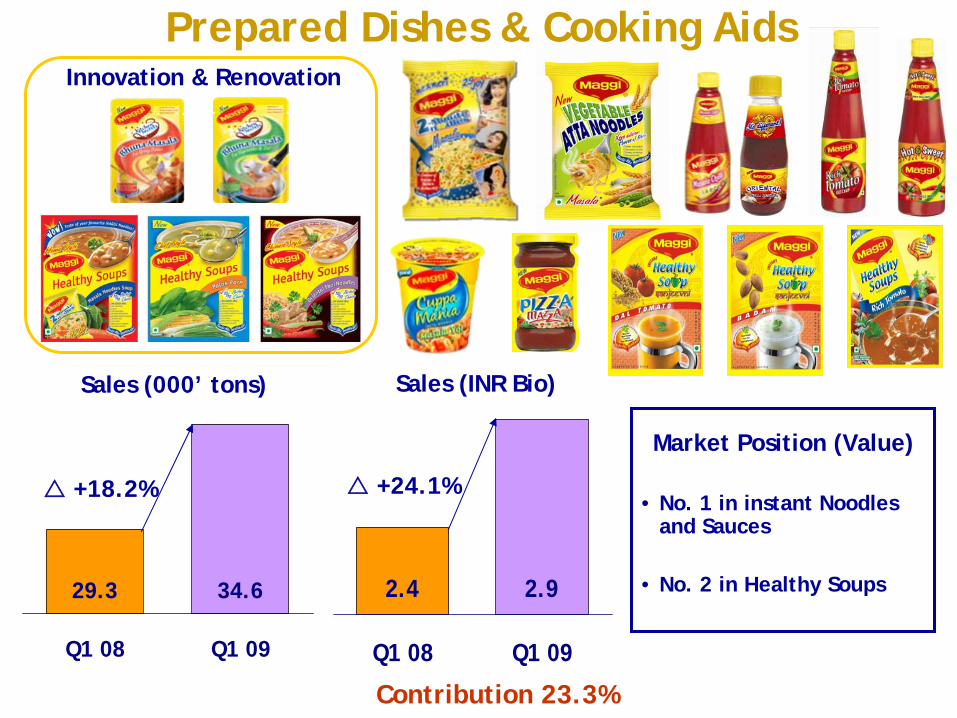
Sales (INR Bio)
2.4 2.9
Q1 08 Q1 09
+24.1%
29.3 34.6
Q1 08 Q1 09
Sales (000’ tons)
Prepared Dishes & Cooking Aids
+18.2%
Market Position (Value)
• No. 1 in instant Noodles and Sauces
• No. 2 in Healthy Soups
Innovation & Renovation
Contribution 23.3%

1.9 2.0
Q1 08 Q1 09
6.8 5.9
Q1 08 Q1 09
Sales (000’ tons) Sales (INR Bio)
+3.0%
-13.5%
BeveragesInnovation & Renovation
Market Position (Value)
• No. 1 in Instant Coffee
• Very strong presence in Vending
Contribution 15.8%
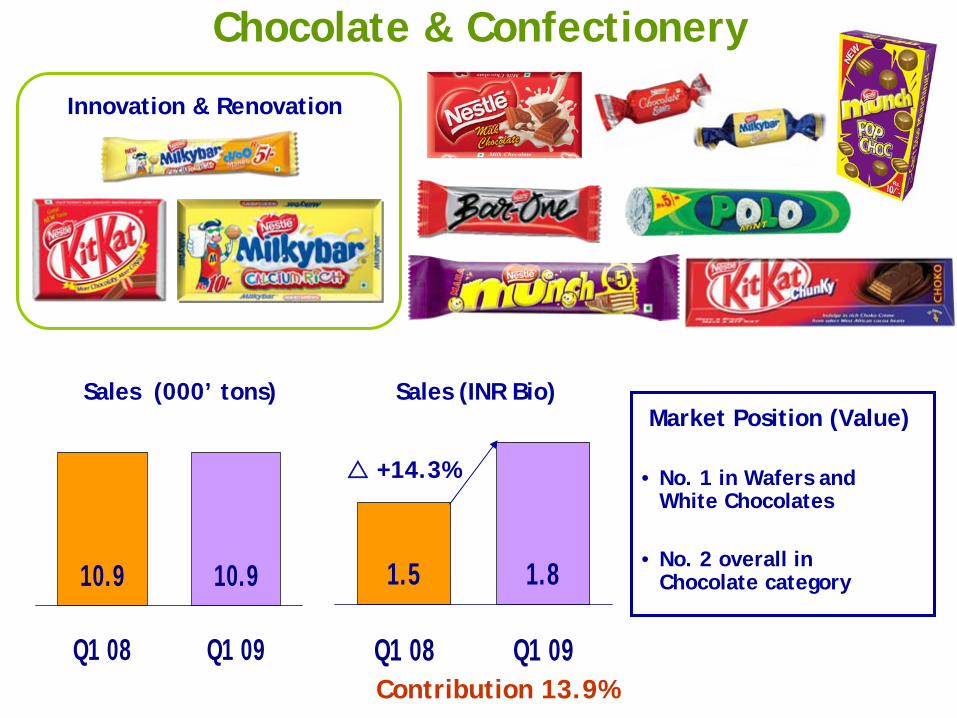
1.81.5
Q1 08 Q1 09
10.9 10.9
Q1 08 Q1 09
Chocolate & Confectionery
Sales (000’ tons) Sales (INR Bio)
+14.3%
Market Position (Value)
• No. 1 in Wafers and White Chocolates
• No. 2 overall in Chocolate category
Innovation & Renovation
Contribution 13.9%

37.5
52.0
8.02.5
Balancing the export portfolio
20.4
17.4
8.52.16.4
45.2
Q1 2009
Chocolate & Confectionery
Prepared Dishes& Cooking Aids
BeveragesMilk Products & Nutrition
South Asia
Russia
Europe
Asia-Oceania
AfricaAmerica
Geography Product Category

Total ExpenditureDriving value out of cost
INR Mio.
Figures have been regrouped / reclassified to make them comparable.
Description Q1 2009% to OP Income
Q1 2008% to OP Income
Var.
Expenditure excl.Impairments/ Contingencies from Operations
9,818 77.3 8,630 78.9 13.8
Materials 5,977 47.0 5,201 47.6 14.9 Staff Cost 874 6.9 752 6.9 16.2
Depreciation 256 2.0 211 1.9 21.6 Advt + Sales Promotion 598 4.7 459 4.2 30.4
Distribution 567 4.5 477 4.4 19.0
Power & Fuel 333 2.6 379 3.5 (12.2)

5.4 8.6 2.82.5 3.17.0 6.2 7.7 2.34.8
19.219.9 20.0
22.824.5
22.420.9
17.817.716.9
2006 2007 2008 Q1 08 Q1 09EBITD (INR Bio) EBIT (INR Bio)EBITD % of Net Sales EBIT % of Net Sales
Healthy operating margins

1.6 1.6 2.3 0.6 0.8
33.7 33.9 34.0 34.034.0
29.8
33.6 33.5
27.2
29.9
2006 2007 2008 Q1 08 Q1 09
Tax Expense (INR Bio) Marginal Tax Rate (%) Effective Tax Rate (%)
Excludes Fringe Benefit & Dividend Distribution Tax
Income Tax

2.01.65.34.13.2
11.211.8
14.715.6
12.4
2006 2007 2008 Q1 08 Q1 09
Amount (INR Bio) % of Net Sales
Maintaining net profit margins

1.7 2.9 0.3 0.41.6
5.7 5.9
6.7
2.4
5.0
5.5
3.2
6.6
5.95.8
2006 2007 2008 Q1 2008 Q1 2009
Capex (INR Bio) Capex as % of Net sales FA Rotation
Investing in fixed assets for growth
Dep. 0.56 0.64 0.82 0.18 0.23(INR Bio)
Fixed Assets exclude Intangibles

Average operating working capital
2.0 2.3 2.4 2.61.3
5.1
6.05.65.4
4.3
2006 2007 2008 Q1 2008 Q1 2009
Amount (INR Bio) % of Sales
Basis Nestlé Internal Reporting Standards
Operating Working Capital = Inventories + Debtors – Trade Payables (excluding Staff Costs, Contingencies, Capex & Taxes)Sales are on rolling 4 quarters basis and Operating Working capital is average for rolling 4 quarters

Operating cash flows
5.2 6.7 0.90.64.2
5.97.5
14.814.9 15.5
2006 2007 2008 # Q1 2008 # Q1 2009Amount (INR Bio) % of Net Sales
# excluding exceptional inflows

2.7 3.6 4.5 1.3 1.6
71
59
70
9186
2006 2007 2008 Q1 08 Q1 09
Economic Profit (INR Bio) Economic Profitability (%)
Basis Nestlé Internal Reporting Standards
Creating strong economic value
ACC % 10.5 11.3 11.6 11.6 12.7
Risk Free 7.2 7.7 7.9 7.9 8.5rate %

25.5 33.0 42.5 8.5 9.032.7 42.9 55.4 16.6 20.5
111118
81
99
113
2006 2007 2008 Q1 08 Q1 09
DPS (INR) EPS (INR) ROE %
Managing shareholders’ expectations
2.5 3.2 4.1 0.8 0.9Dividend(INR Bio)
2008 - Includes special dividend of Rs. 7.5/Share

THANK YOU

15.2
7.0
15.9
40.7
1.0
6.6
0
7
14
21
28
35
42
Inde
xed
cos
t in
crea
se %
Commodity Costs - Ongoing Challenge
Q1 2008
Reference point - Jan-Mar 2008 prices
Green Coffee
Fresh Milk
Wheat Flour
RBD Palm Oil
Sugar
Q1 2009
Cocoa

105.2
110.7
100.0
115.2
111.6
123.3
119.6
116.2
119.3
Q 1 Q2 Q3 Q4
2007 2008 2009
+7.0%
Evolution – Fresh Milk Fat Prices
122.7Current
Indexed with base Q1-07
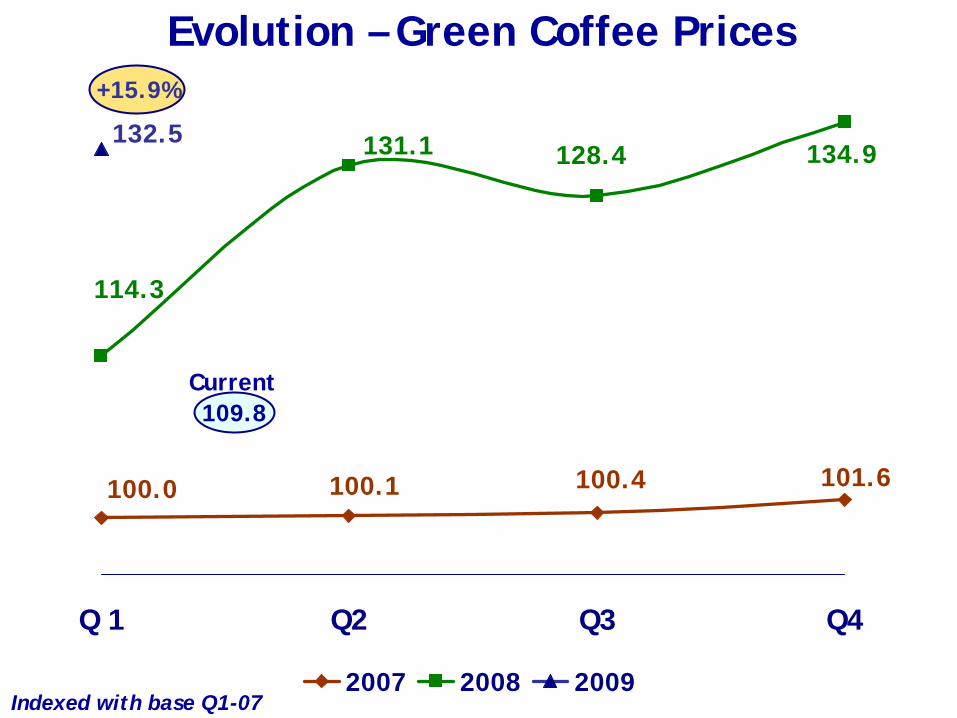
100.0 100.1 100.4 101.6
128.4 134.9131.1
114.3
132.5
Q 1 Q2 Q3 Q4
2007 2008 2009
Evolution – Green Coffee Prices
109.8
+15.9%
Indexed with base Q1-07
Current

89.3
107.1
116.0
100.0
84.091.1
92.9
97.0
130.2
Q 1 Q2 Q3 Q4
2007 2008 2009
Evolution - Sugar Prices
147.9
+40.7%
Indexed with base Q1-07
Current
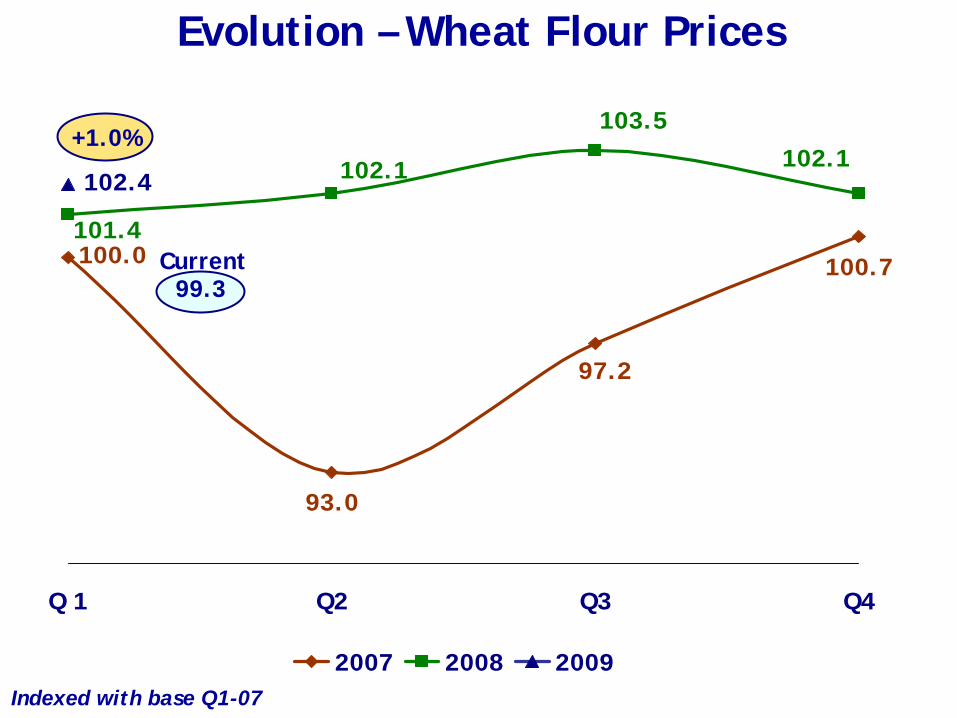
93.0
100.7
97.2
100.0101.4
102.1102.1
103.5
102.4
Q 1 Q2 Q3 Q4
2007 2008 2009
Evolution – Wheat Flour Prices
Indexed with base Q1-07
99.3Current
+1.0%

102.099.7100.1100.0
119.7 119.2121.2
107.3
114.4
Q 1 Q2 Q3 Q4
2007 2008 2009
Evolution – RBD Palm Oil Prices
Indexed with base Q1-07
106.8Current
+6.6%

Mean Q1 08- 96.8 USD/Barrel
Mean Q1 09- 48.6 USD/Barrel
Evolution – Crude Oil Prices