DRIVER ATTRIBS RECRASHrev
29
U.S. Department of Transportation National Highway Traffic Safety Administration DOT HS 809 540 March 2003 Technical Report DRIVER ATTRIBUTES AND REAR-END CRASH INVOLVEMENT PROPENSITY Published By: National Center for Statistics and Analysis Advanced Research and Analysis This document is available to the public from the National Technical Information Service, Springfield, Virginia, VA 22161
Transcript of DRIVER ATTRIBS RECRASHrev
U.S. Department of Transportation National Highway Traffic Safety Administration
DOT HS 809 540 March 2003
Technical Report
DRIVER ATTRIBUTES AND REAR-END CRASH INVOLVEMENT PROPENSITY
Published By:
National Center for Statistics and Analysis Advanced Research and Analysis
This document is available to the public from the National Technical Information Service, Springfield, Virginia, VA 22161

This publication is distributed by the U.S. Department of Transportation, National Highway Traffic Safety Administration, in the interest of information exchange. The opinions, findings and conclusions expressed in this publication are those of the author(s) and not necessarily those of the Department of Transportation or the National Highway Traffic Safety Administration. The United States Government assumes no liability for its contents or use thereof. If trade or manufacturers' names are mentioned, it is only because they are considered essential to the object of the publication and should not be construed as an endorsement. The United States Government does not endorse products or manufacturers.
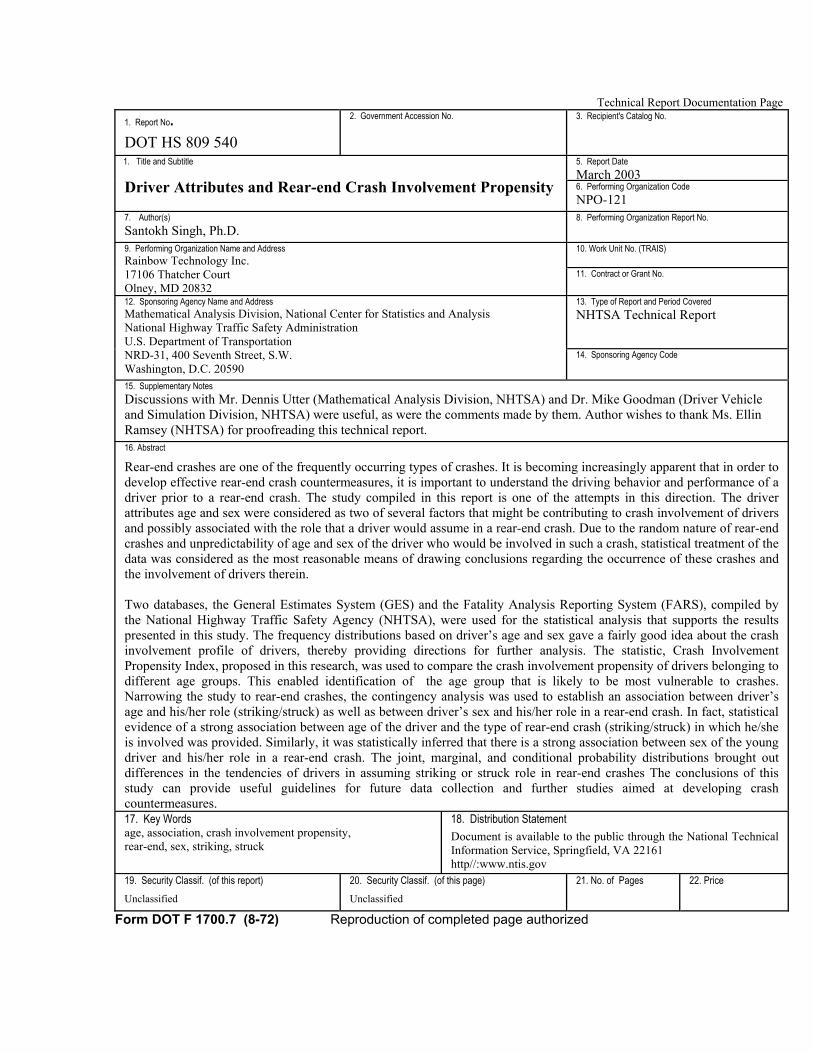
Technical Report Documentation Page 1. Report No. DOT HS 809 540
2. Government Accession No.
3. Recipient's Catalog No.
5. Report Date March 2003
1. Title and Subtitle
Driver Attributes and Rear-end Crash Involvement Propensity 6. Performing Organization Code NPO-121
7. Author(s) Santokh Singh, Ph.D.
8. Performing Organization Report No.
10. Work Unit No. (TRAIS) 9. Performing Organization Name and Address Rainbow Technology Inc. 17106 Thatcher Court Olney, MD 20832
11. Contract or Grant No.
13. Type of Report and Period Covered NHTSA Technical Report
12. Sponsoring Agency Name and Address Mathematical Analysis Division, National Center for Statistics and Analysis National Highway Traffic Safety Administration U.S. Department of Transportation NRD-31, 400 Seventh Street, S.W. Washington, D.C. 20590
14. Sponsoring Agency Code
15. Supplementary Notes Discussions with Mr. Dennis Utter (Mathematical Analysis Division, NHTSA) and Dr. Mike Goodman (Driver Vehicle and Simulation Division, NHTSA) were useful, as were the comments made by them. Author wishes to thank Ms. Ellin Ramsey (NHTSA) for proofreading this technical report. 16. Abstract
Rear-end crashes are one of the frequently occurring types of crashes. It is becoming increasingly apparent that in order to develop effective rear-end crash countermeasures, it is important to understand the driving behavior and performance of a driver prior to a rear-end crash. The study compiled in this report is one of the attempts in this direction. The driver attributes age and sex were considered as two of several factors that might be contributing to crash involvement of drivers and possibly associated with the role that a driver would assume in a rear-end crash. Due to the random nature of rear-end crashes and unpredictability of age and sex of the driver who would be involved in such a crash, statistical treatment of the data was considered as the most reasonable means of drawing conclusions regarding the occurrence of these crashes and the involvement of drivers therein. Two databases, the General Estimates System (GES) and the Fatality Analysis Reporting System (FARS), compiled by the National Highway Traffic Safety Agency (NHTSA), were used for the statistical analysis that supports the results presented in this study. The frequency distributions based on driver’s age and sex gave a fairly good idea about the crash involvement profile of drivers, thereby providing directions for further analysis. The statistic, Crash Involvement Propensity Index, proposed in this research, was used to compare the crash involvement propensity of drivers belonging to different age groups. This enabled identification of the age group that is likely to be most vulnerable to crashes. Narrowing the study to rear-end crashes, the contingency analysis was used to establish an association between driver’s age and his/her role (striking/struck) as well as between driver’s sex and his/her role in a rear-end crash. In fact, statistical evidence of a strong association between age of the driver and the type of rear-end crash (striking/struck) in which he/she is involved was provided. Similarly, it was statistically inferred that there is a strong association between sex of the young driver and his/her role in a rear-end crash. The joint, marginal, and conditional probability distributions brought out differences in the tendencies of drivers in assuming striking or struck role in rear-end crashes The conclusions of this study can provide useful guidelines for future data collection and further studies aimed at developing crash countermeasures. 17. Key Words age, association, crash involvement propensity, rear-end, sex, striking, struck
18. Distribution Statement Document is available to the public through the National Technical Information Service, Springfield, VA 22161 http//:www.ntis.gov
19. Security Classif. (of this report)
Unclassified 20. Security Classif. (of this page)
Unclassified 21. No. of Pages
22. Price
Form DOT F 1700.7 (8-72) Reproduction of completed page authorized
Table of contents
EXECUTIVE SUMMARY ……..………………………………………………………….. ii 1. Introduction. ..……………………………………………………………………… 1
2. Driver attributes and crash involvement ………………………………………… 2
2.1. Driver’s age and crash involvement. ………………………………………… 2
2.2. Driver’s sex and crash involvement …..…………………………………….. 4
2.3. Crash involvement propensity of drivers ……………………………………… 6
3. Association between driver attributes and his/her role in a rear-end crash ……… 9
4. Driver attributes and likelihood of his/her role in a rear-end crash. …………….. 10
4.1. Driver’s age and likelihood of rear-end crash involvement …………………… 11
4.2. Sex of young driver and likelihood of rear-end crash involvement …………… 13
5. Conclusions and recommendations. …………………………… …………………. 15
6. Appendix A. Tables. ………………………………………………………………... 17
7. Appendix B. Analytical details of Crash Involvement Propensity Index ………… 19
8. References. …………………………………………………………………………… 21
National Center for Statistics and Analysis ♦ 400 Seventh St., S.W., Washington, D.C. 20590
ii
EXECUTIVE SUMMARY
Background and objectives Rear-end crashes are not only one of the frequently occurring types of crashes, but also are responsible for a large number of injuries and fatalities and substantial property damage every year. In order to develop effective rear-end crash countermeasures, a better understanding of the driving behavior and performance associated with the response to driving conflicts or imminent crash situations is needed. However, it is clear that the involvement of a driver in a crash depends on his/her perception of the complex scenario that emerges prior to a crash and that resolution of the driving conflicts, that have occurred, depends on driver’s pre-crash behavior and performance. These facts suggest that the driver attributes, such as age and sex, could possibly be two of several factors that contribute to a driver’s involvement in a crash, in general, and in determining the role (striking/struck) he/she assumes in a rear-end crash, in particular. The objective of this study is to investigate if there is a crash involvement profile of drivers of different age groups and of young drivers based on driver’s sex. Narrowing the study to rear-end crashes, the study aims at providing statistical evidence of the association between the driver attributes and his/her role in a rear-end crash. Data and methodology Two databases, the General Estimates System (GES) and the Fatality Analysis Reporting System (FARS), compiled by the National Highway Traffic Safety Administration (NHTSA), were used in the analysis. Statistical methods were used to arrive at the conclusions drawn in this report. Simple statistics, such as percent frequencies, were used for the purpose of preliminary analysis. The statistic Crash Involvement Propensity Index, proposed in this study, proved to be a useful tool for comparison between different age groups with respect to their propensity of being involved in a crash. In addition, the contingency analysis was used to test hypotheses about the association between driver’s attributes and driver’s role in a rear-end crash. Finally, the joint, marginal, and conditional probabilities were used to bring out the differences among categories of drivers with respect to driver’s role in a rear-end crash. Results and conclusions Based on GES and FARS data for the year 2000, it was found that drivers younger than 18 years were most vulnerable to roadway crashes, followed by 18 to 24 year old drivers. In fact, the propensity of drivers involved in crashes showed a decreasing trend with increasing age. This, however, was observed up to the age of 69, after which the drivers again showed a higher crash involvement propensity as compared to the drivers who were 25 to 69 year old. Young (18 to 24 year old) drivers were treated as a special group in this study. So far as driver’s attribute sex is concerned, among this group of drivers, male drivers were found to be more prone to crash involvement as compared to their female counterparts.
National Center for Statistics and Analysis ♦ 400 Seventh St., S.W., Washington, D.C. 20590
iii
Narrowing the study to rear-end crashes, it could be established that there was strong evidence of an association between age of the driver and driver’s role (striking/struck) in a rear-end crash, as was of an association between sex of the young driver and driver’s role. It was also found that in rear-end crashes drivers up to the age of 25 years or so are more likely to be in the striking role than in the struck role. In fact, as drivers get older, they tend to be in the striking role less often than in the struck role. Furthermore, young male drivers are more likely to be in the striking role as compared to young female drivers. The results of this study strongly support the use of driver attributes, age and sex, as stratification variables in data collection and analysis that are directed towards the development of effective rear-end crash countermeasures.

National Center for Statistics and Analysis ♦ 400 Seventh St., S.W., Washington, D.C. 20590
1
1. Introduction A rear-end crash refers to a crash in which the front of one vehicle collides with the rear of another vehicle. Thus, a driver involved in such a crash may be the driver of a striking vehicle, of the struck vehicle, or of the vehicle that both struck and was struck. Rear-end crashes are not only one of the frequently occurring types of crashes, but also are responsible for a large number of injuries and fatalities and substantial property damage every year. In fact, based on the General Estimates System (GES) of the National Automotive Sampling System (NASS) and the Fatality Analysis Reporting System (FARS) data, compiled by the National Highway Traffic Safety Administration (NHTSA), approximately 29.7% of all crashes in the year 2000 were rear-end crashes. These crashes were responsible for 30% of all injuries and 29.7% of the property damage. So far as the involvement of drivers in rear-end crashes is concerned, of the 190,625,023 licensed drivers (Federal Highway Administration (FHWA)) in 2000, approximately 2.2% were involved in rear-end crashes. Further, of the 6% of licensed drivers involved in all types of crashes, 36% were involved in rear-end crashes alone. This significant involvement of drivers in rear-end crashes alone is a matter of great concern. It is becoming increasingly apparent that in order to develop effective rear-end crash countermeasures, a better understanding of the driving behavior and performance associated with response to driving conflict or imminent crash situations is needed. The present study is an attempt to identify some of the driver-related factors to which crash involvement and driver’s role (striking/struck) in a rear-end crash can be attributed. This information can subsequently be used, for example, in stratifying the population of drivers for the purpose of designing a sample for data collection on driver related parameters in rear-end crashes. In general, the involvement of a driver in a crash depends on his/her perception of the complex scenario that has emerged prior to a crash. Equally important are the driver’s pre-crash behavior and performance to resolve the driving conflicts that have occurred. These facts suggest that the driver attributes, such as age and gender, could possibly be the factors, among others, that contribute to a driver’s involvement in a crash, in general, and in determining his/her role in a rear-end crash, in particular. Given a rear-end crash, the questions that immediately and naturally come to one’s mind are: Who struck and who was struck and what was the age/gender of the striking and the struck drivers? The answers to these questions lie in GES and FARS databases, which contain a great deal of information about crashes, including the role (striking/struck) of vehicles and hence of the drivers involved in rear-end crashes as well as about their age and gender. What needs to be done, however, from the point of view of driving behavior and performance of a driver prior to a crash, is to find out if the driver attributes, such as age and gender have any impact on his/her involvement in a crash. Pertinent to this study is to further determine if there is an association between these attributes and his/her role (striking/struck) in a rear-end crash. The tendencies of drivers of different age groups and gender, with respect to the role they are likely to assume in rear-end crashes, will also be brought out. Complying with the
National Center for Statistics and Analysis ♦ 400 Seventh St., S.W., Washington, D.C. 20590
2
variables naming convention of GES and FARS databases, the driver attributes age and gender will henceforth be referred to as age and sex of the driver. In order to seek directions for investigating into the possible relationship between driver attributes and rear-end crash involvement, this study first conducts a preliminary analysis to look at the crash involvement profile of drivers belonging to different groups based on driver’s age and sex. Some studies in this direction have been done in the past (e.g., [1], [2], [3]). An important point that needs to be borne in mind, in this regard, is that the crash involvement rates for such groups with reference to the entire population of licensed drivers do not give a true picture. The smallest number of drivers of a category involved in crashes may not mean that this category of drivers is least prone to crash involvement, as this may merely be due to the smallest size of the category in question. The idea is to see which groups contribute disproportionately to crash involvement and hence the rates should have reference to the respective groups rather than to the entire population. Based on this fact, a frequency approach is used for developing the methodology used in this study. The statistical analysis conducted and the resulting conclusions drawn in this study are based on the information/data retrieved from the following sources: 1. Age/sex distribution of licensed drivers for 2000, reported by the FHWA
2. Drivers involved in all crashes and those involved in rear-end crashes in 2000, reported in GES (excluding fatal crashes that have been considered through FARS)
3. Drivers involved in fatal crashes in 2000, reported in FARS.
2. Driver attributes and crash involvement As a first step, a preliminary analysis of GES and FARS data for the year 2000 was conducted to obtain an idea of the incidence of crashes and the role that the driver attributes age and sex might have played in driver’s involvement in a crash. In the following analysis, several subpopulations will be defined based on certain criteria so as to look at the problem of crash involvement from various angles. 2.1. Driver’s age and crash involvement Based on a pilot study conducted for the development of rear-end crash countermeasures, the population of drivers was partitioned into five age groups: drivers under 18 (Age group 1), 18 to 24 (Age group 2), 25 to 49 (Age group 3), 50 to 69 (Age group 4), and 70 and older (Age group 5), to be also referred to as A1, A2, A3, A4, and A5. The frequencies of crash-involved drivers from each age group (category) were calculated using GES and FARS databases. The results, including the frequencies of licensed drivers falling in each category, are summarized in Table A.1 (Appendix A) and are presented in the Venn diagram (Figure 1). This figure represents the population of Licensed Drivers: D (universal set) as a union of the subpopulations A1, A2, A3, A4, and A5 (subsets of D) and their intersections with the subpopulation C of crash-involved drivers. It may be noted that the areas (with different
National Center for Statistics and Analysis ♦ 400 Seventh St., S.W., Washington, D.C. 20590
3
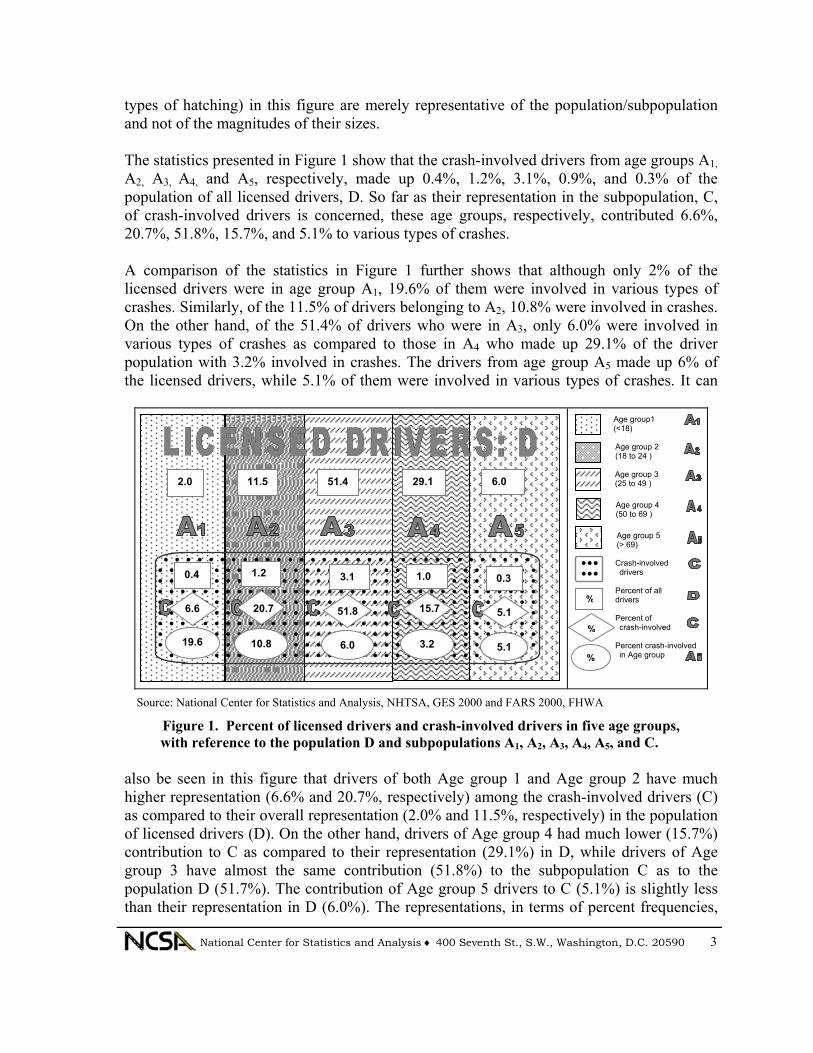
types of hatching) in this figure are merely representative of the population/subpopulation and not of the magnitudes of their sizes. The statistics presented in Figure 1 show that the crash-involved drivers from age groups A1, A2, A3, A4, and A5, respectively, made up 0.4%, 1.2%, 3.1%, 0.9%, and 0.3% of the population of all licensed drivers, D. So far as their representation in the subpopulation, C, of crash-involved drivers is concerned, these age groups, respectively, contributed 6.6%, 20.7%, 51.8%, 15.7%, and 5.1% to various types of crashes. A comparison of the statistics in Figure 1 further shows that although only 2% of the licensed drivers were in age group A1, 19.6% of them were involved in various types of crashes. Similarly, of the 11.5% of drivers belonging to A2, 10.8% were involved in crashes. On the other hand, of the 51.4% of drivers who were in A3, only 6.0% were involved in various types of crashes as compared to those in A4 who made up 29.1% of the driver population with 3.2% involved in crashes. The drivers from age group A5 made up 6% of the licensed drivers, while 5.1% of them were involved in various types of crashes. It can
Age group1 (<18) Age group 2 (18 to 24 )
Age group 3 (25 to 49 ) Age group 4 (50 to 69 ) Age group 5 (> 69) Crash-involved drivers
Percent of all drivers Percent of crash-involved
Percent crash-involved in Age group
Source: National Center for Statistics and Analysis, NHTSA, GES 2000 and FARS 2000, FHWA
Figure 1. Percent of licensed drivers and crash-involved drivers in five age groups, with reference to the population D and subpopulations A1, A2, A3, A4, A5, and C. also be seen in this figure that drivers of both Age group 1 and Age group 2 have much higher representation (6.6% and 20.7%, respectively) among the crash-involved drivers (C) as compared to their overall representation (2.0% and 11.5%, respectively) in the population of licensed drivers (D). On the other hand, drivers of Age group 4 had much lower (15.7%) contribution to C as compared to their representation (29.1%) in D, while drivers of Age group 3 have almost the same contribution (51.8%) to the subpopulation C as to the population D (51.7%). The contribution of Age group 5 drivers to C (5.1%) is slightly less than their representation in D (6.0%). The representations, in terms of percent frequencies,
%
%
%
2.0 11.5 51.4 29.1 6.0
. . . . . . . . . . . . . . . . . . . . . . . . . . . . . . . . .. . . . . . . . . . . . . . . . . . . . . . . . . . . . . . . . . .. . . . . . . . . . . . . . . . . . . . . . . . . . . . . . . . . .. . . . . . . . . . . . . . . . . . . . . . . . . . . . . . . . . .. . . . . . . . . . . . . . . . . . . . . . . . . . . . . . . . . .. . . . . . . . . . . . . . . . . . . . . . . . . . . . . . . . . .. . . . . . . . . . . . . . . . . . . . . . . . . . . . . . . . . .. . . . . . . . . . . . . . . . . . . . . . . . . . . . . . . . . .. . . . . . . . . . . . . . . . . . . . . . . . . . . . . . . . . . . . . . . . . . . . . . . . . . . . . . . . . . . . . . . . . .
1.2 3.1 1.0 0.30.4
6.6 20.7 5.151.8 15.7
3.2 5.110.8 6.019.6
... ...
National Center for Statistics and Analysis ♦ 400 Seventh St., S.W., Washington, D.C. 20590
4
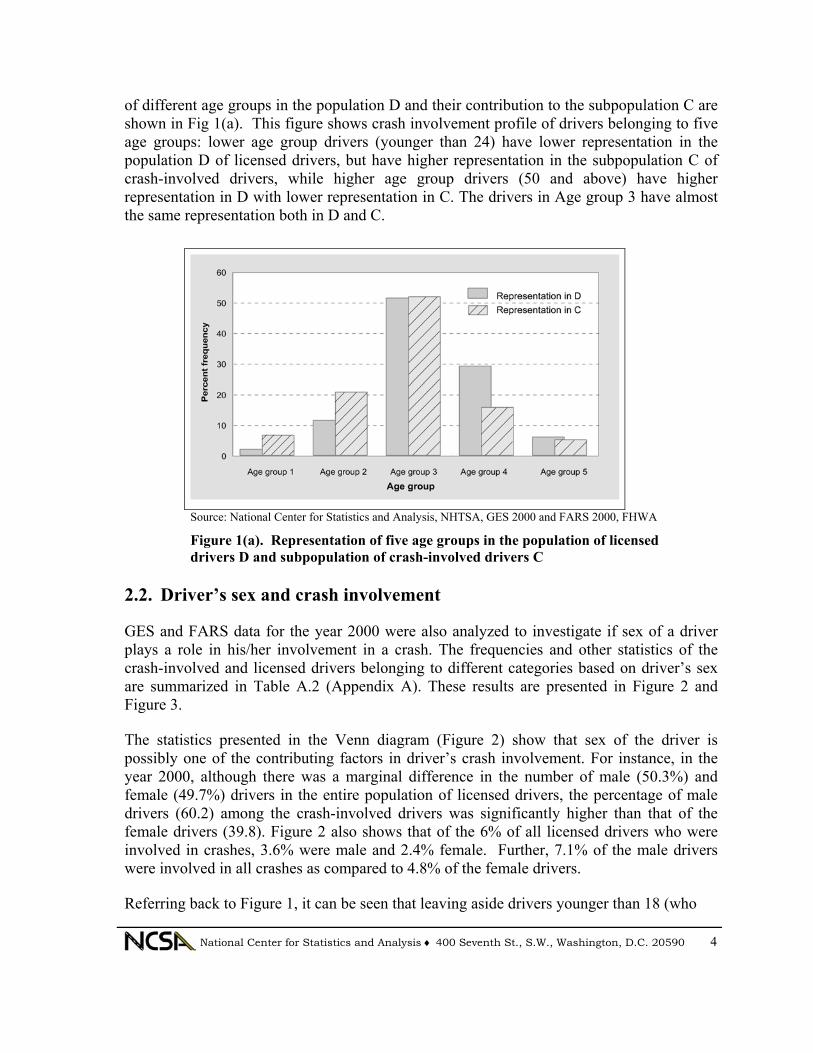
of different age groups in the population D and their contribution to the subpopulation C are shown in Fig 1(a). This figure shows crash involvement profile of drivers belonging to five age groups: lower age group drivers (younger than 24) have lower representation in the population D of licensed drivers, but have higher representation in the subpopulation C of crash-involved drivers, while higher age group drivers (50 and above) have higher representation in D with lower representation in C. The drivers in Age group 3 have almost the same representation both in D and C.
Source: National Center for Statistics and Analysis, NHTSA, GES 2000 and FARS 2000, FHWA
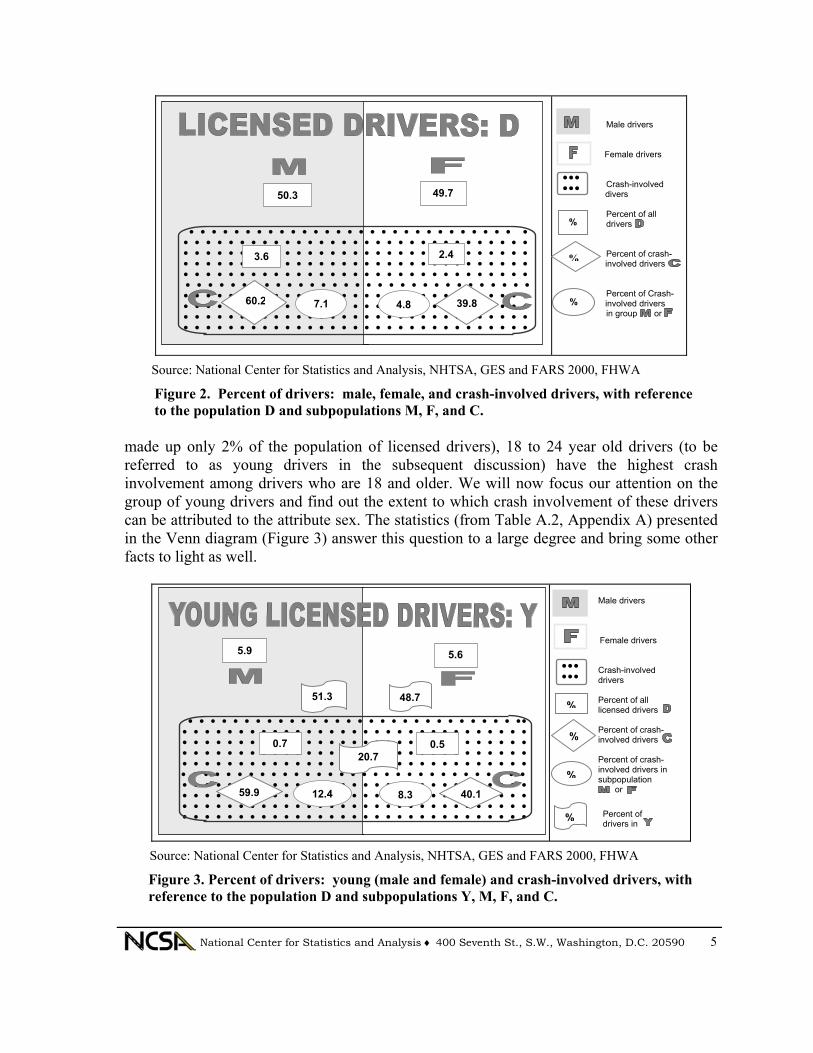
Figure 1(a). Representation of five age groups in the population of licensed drivers D and subpopulation of crash-involved drivers C 2.2. Driver’s sex and crash involvement GES and FARS data for the year 2000 were also analyzed to investigate if sex of a driver plays a role in his/her involvement in a crash. The frequencies and other statistics of the crash-involved and licensed drivers belonging to different categories based on driver’s sex are summarized in Table A.2 (Appendix A). These results are presented in Figure 2 and Figure 3. The statistics presented in the Venn diagram (Figure 2) show that sex of the driver is possibly one of the contributing factors in driver’s crash involvement. For instance, in the year 2000, although there was a marginal difference in the number of male (50.3%) and female (49.7%) drivers in the entire population of licensed drivers, the percentage of male drivers (60.2) among the crash-involved drivers was significantly higher than that of the female drivers (39.8). Figure 2 also shows that of the 6% of all licensed drivers who were involved in crashes, 3.6% were male and 2.4% female. Further, 7.1% of the male drivers were involved in all crashes as compared to 4.8% of the female drivers. Referring back to Figure 1, it can be seen that leaving aside drivers younger than 18 (who
National Center for Statistics and Analysis ♦ 400 Seventh St., S.W., Washington, D.C. 20590
5
Male drivers
Female drivers Crash-involved divers Percent of all drivers Percent of crash- involved drivers Percent of Crash-involved drivers in group or
Source: National Center for Statistics and Analysis, NHTSA, GES and FARS 2000, FHWA
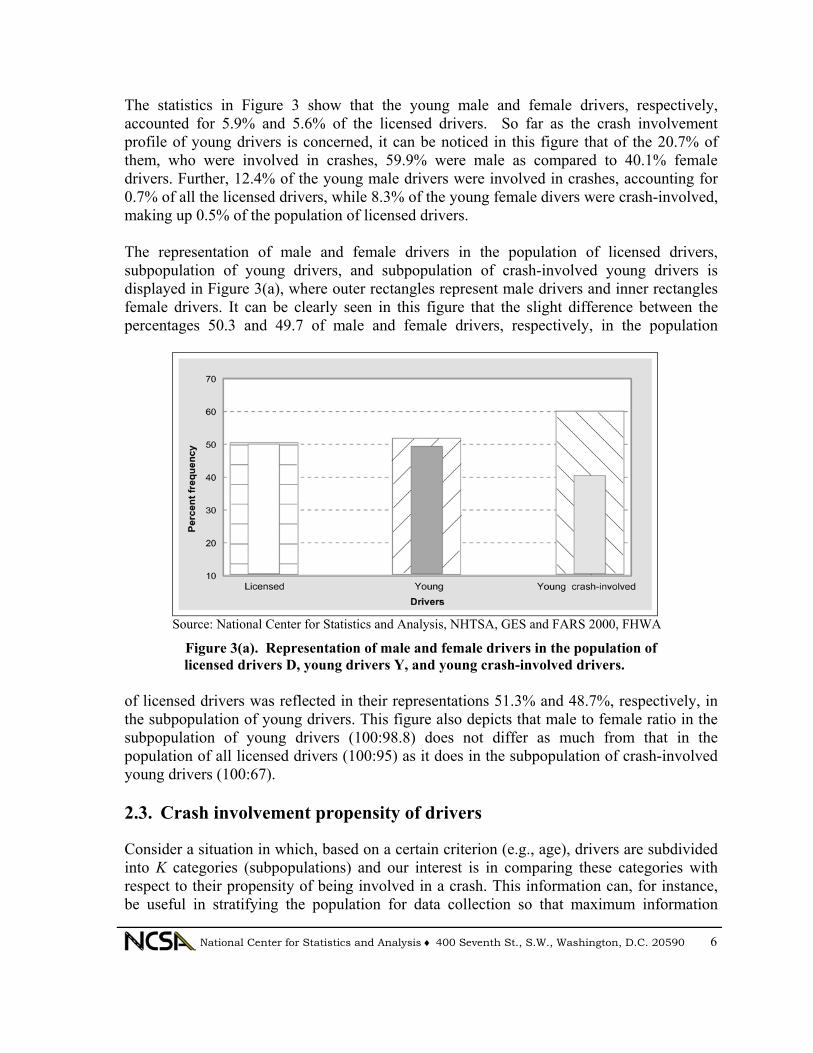
Figure 2. Percent of drivers: male, female, and crash-involved drivers, with reference to the population D and subpopulations M, F, and C. made up only 2% of the population of licensed drivers), 18 to 24 year old drivers (to be referred to as young drivers in the subsequent discussion) have the highest crash involvement among drivers who are 18 and older. We will now focus our attention on the group of young drivers and find out the extent to which crash involvement of these drivers can be attributed to the attribute sex. The statistics (from Table A.2, Appendix A) presented in the Venn diagram (Figure 3) answer this question to a large degree and bring some other facts to light as well.
Male drivers Female drivers Crash-involved drivers Percent of all licensed drivers Percent of crash-involved drivers Percent of crash-involved drivers in subpopulation or
Percent of drivers in
Source: National Center for Statistics and Analysis, NHTSA, GES and FARS 2000, FHWA
Figure 3. Percent of drivers: young (male and female) and crash-involved drivers, with reference to the population D and subpopulations Y, M, F, and C.
%
%
%
%
%
%
... ...
......49.7 50.3
. . . . . . . . . . . . . . . . . . . . . . . . . . . . . . . . . . . . . . . . . . . . . . . . . . . . . . . . . . . . . . . . . . . . . . . . . . . . . . . . . . . . . . . . . . . . . . . . . . . . . . . . . . . . . . . . . . . . . . . . . . . . . . . . . . . . . . . . . . . . . . . . . . . . . . . . . . . . . . . . . . . . . . . . . . . . . . . . . . . . . . . . . . . . . . . . . . . . . . . . . . . . . . . . . . . . . . . . . . . . . . . . . . . . . . . . . . . . . . . . . . . . . . . . . . . . . . . . . . . . . . . . . . . . . . . . . . . . . . . . . . . . . . . . . . . . . . . . . . . . . . . . . . . . .
3.6 2.4
7.1 4.8 39.860.2
5.9 5.6
. . . . . . . . . . . . . . . . . . . . . . . . . . . . . .. . . . . . . . . . . . . . . . . . . . . . . . . . . . . . . . . . . . . . . . . . . . . . . . . . . . . . . . . . . . . . . . . . . . . . . . . . . . . . . . . . . . . . . . . . . . . . . . . . . . . . . . . . . . . . . . . . . . . . . . . . . . . . . . . . . . . . . . . . . . . . . . . . . . . . . . . . . . . . . . . . . . . . . . . . . . . . . . . . . . . . . . . . . . . . . . . . . . . . . . . . . . . . . . . . . . . . . . . . . . . . . . . . . . . . . . . . . . . . . . . . . . . . . . . . . . . . . . . . . . . . . . . . . . . . . . . . . . . . . .
0.7
59.9 12.4 40.1
0.5
8.3
51.3 48.7
20.7
%
National Center for Statistics and Analysis ♦ 400 Seventh St., S.W., Washington, D.C. 20590
6
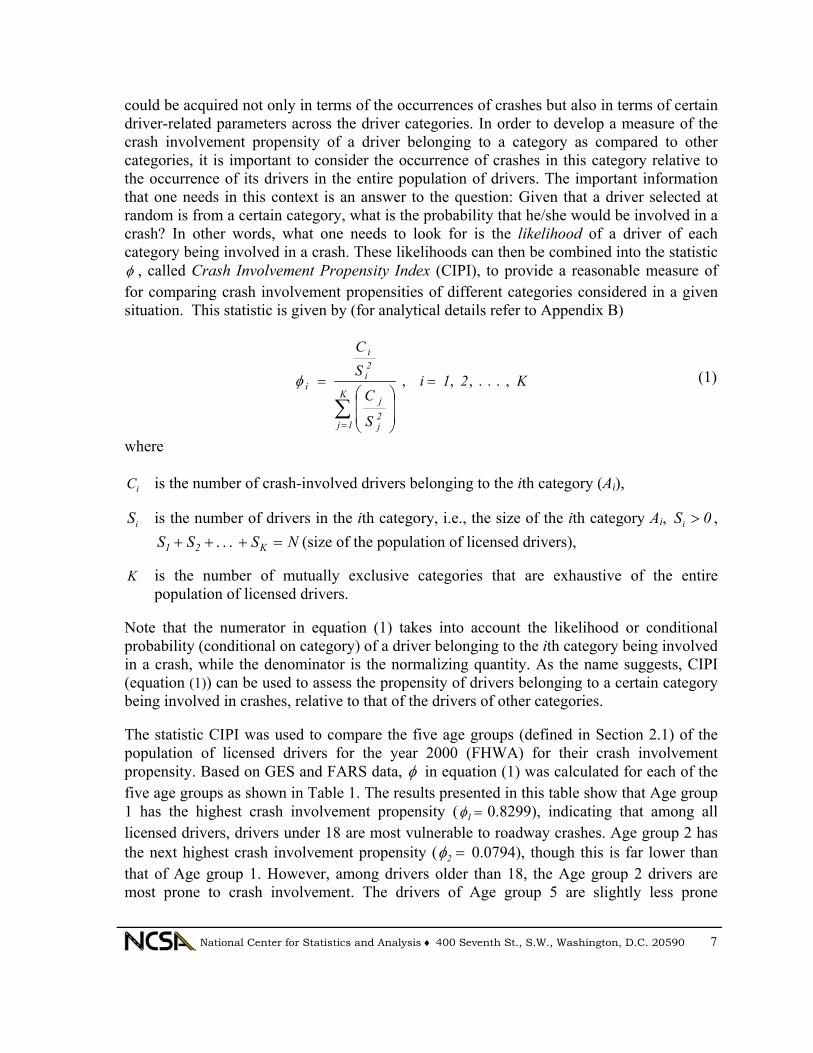
The statistics in Figure 3 show that the young male and female drivers, respectively, accounted for 5.9% and 5.6% of the licensed drivers. So far as the crash involvement profile of young drivers is concerned, it can be noticed in this figure that of the 20.7% of them, who were involved in crashes, 59.9% were male as compared to 40.1% female drivers. Further, 12.4% of the young male drivers were involved in crashes, accounting for 0.7% of all the licensed drivers, while 8.3% of the young female divers were crash-involved, making up 0.5% of the population of licensed drivers. The representation of male and female drivers in the population of licensed drivers, subpopulation of young drivers, and subpopulation of crash-involved young drivers is displayed in Figure 3(a), where outer rectangles represent male drivers and inner rectangles female drivers. It can be clearly seen in this figure that the slight difference between the percentages 50.3 and 49.7 of male and female drivers, respectively, in the population
Source: National Center for Statistics and Analysis, NHTSA, GES and FARS 2000, FHWA
Figure 3(a). Representation of male and female drivers in the population of licensed drivers D, young drivers Y, and young crash-involved drivers. of licensed drivers was reflected in their representations 51.3% and 48.7%, respectively, in the subpopulation of young drivers. This figure also depicts that male to female ratio in the subpopulation of young drivers (100:98.8) does not differ as much from that in the population of all licensed drivers (100:95) as it does in the subpopulation of crash-involved young drivers (100:67). 2.3. Crash involvement propensity of drivers Consider a situation in which, based on a certain criterion (e.g., age), drivers are subdivided into K categories (subpopulations) and our interest is in comparing these categories with respect to their propensity of being involved in a crash. This information can, for instance, be useful in stratifying the population for data collection so that maximum information
National Center for Statistics and Analysis ♦ 400 Seventh St., S.W., Washington, D.C. 20590
7
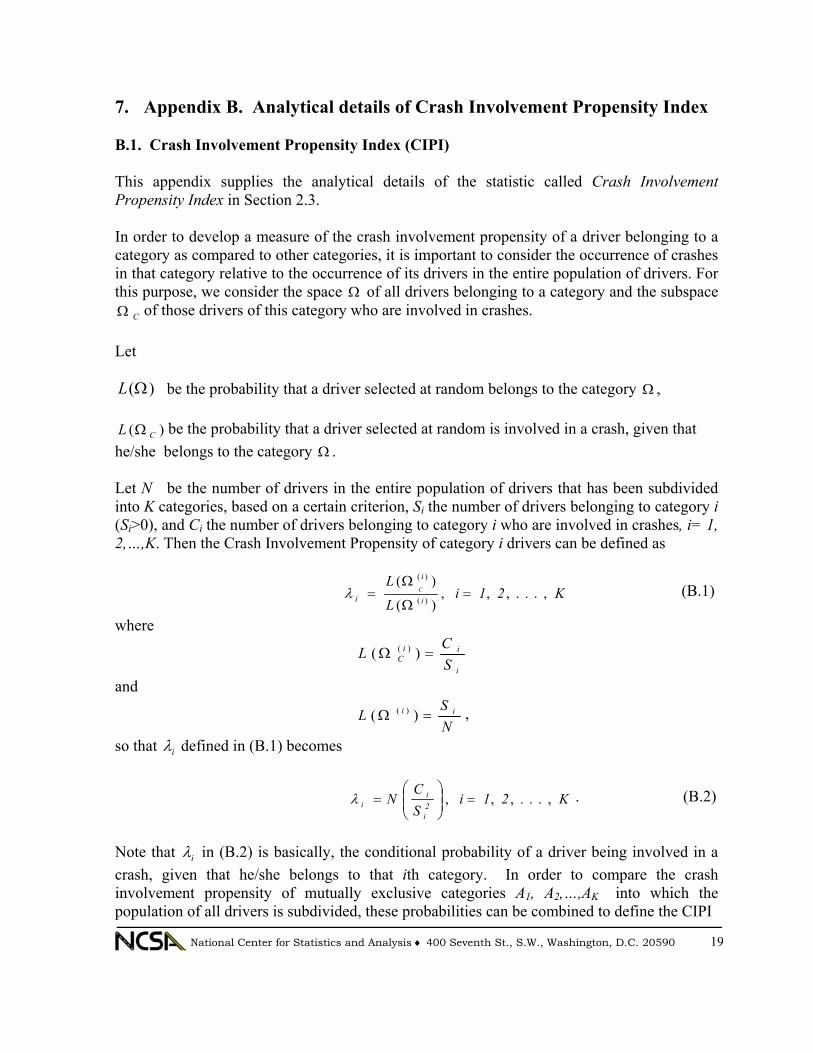
could be acquired not only in terms of the occurrences of crashes but also in terms of certain driver-related parameters across the driver categories. In order to develop a measure of the crash involvement propensity of a driver belonging to a category as compared to other categories, it is important to consider the occurrence of crashes in this category relative to the occurrence of its drivers in the entire population of drivers. The important information that one needs in this context is an answer to the question: Given that a driver selected at random is from a certain category, what is the probability that he/she would be involved in a crash? In other words, what one needs to look for is the likelihood of a driver of each category being involved in a crash. These likelihoods can then be combined into the statistic φ , called Crash Involvement Propensity Index (CIPI), to provide a reasonable measure of for comparing crash involvement propensities of different categories considered in a given situation. This statistic is given by (for analytical details refer to Appendix B)
K21i
S
C
SC
K
1j2j
j
2i
i
i ,...,,, =
=
∑=
φ (1)
where
iC is the number of crash-involved drivers belonging to the ith category (Ai),
iS is the number of drivers in the ith category, i.e., the size of the ith category Ai, 0Si > , NSSS K21 =+++ ... (size of the population of licensed drivers),
K is the number of mutually exclusive categories that are exhaustive of the entire
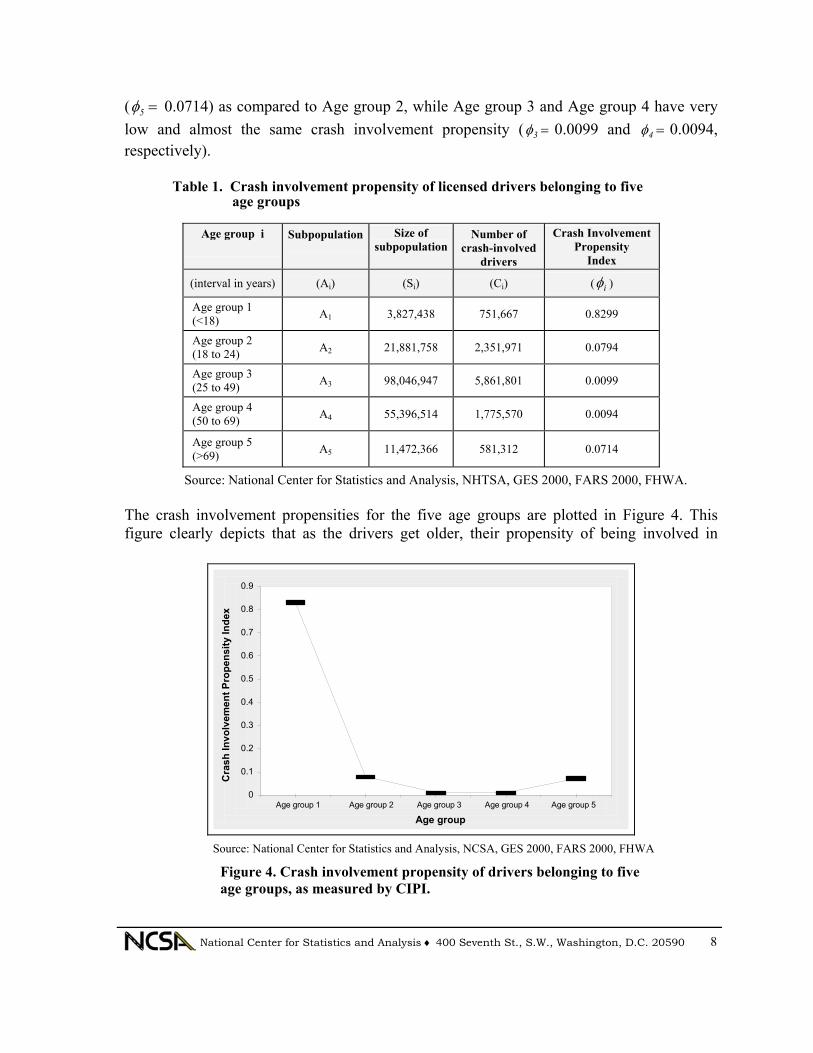
population of licensed drivers. Note that the numerator in equation (1) takes into account the likelihood or conditional probability (conditional on category) of a driver belonging to the ith category being involved in a crash, while the denominator is the normalizing quantity. As the name suggests, CIPI (equation (1)) can be used to assess the propensity of drivers belonging to a certain category being involved in crashes, relative to that of the drivers of other categories. The statistic CIPI was used to compare the five age groups (defined in Section 2.1) of the population of licensed drivers for the year 2000 (FHWA) for their crash involvement propensity. Based on GES and FARS data, φ in equation (1) was calculated for each of the five age groups as shown in Table 1. The results presented in this table show that Age group 1 has the highest crash involvement propensity ( =1φ 0.8299), indicating that among all licensed drivers, drivers under 18 are most vulnerable to roadway crashes. Age group 2 has the next highest crash involvement propensity ( =2φ 0.0794), though this is far lower than that of Age group 1. However, among drivers older than 18, the Age group 2 drivers are most prone to crash involvement. The drivers of Age group 5 are slightly less prone
National Center for Statistics and Analysis ♦ 400 Seventh St., S.W., Washington, D.C. 20590
8
( =5φ 0.0714) as compared to Age group 2, while Age group 3 and Age group 4 have very low and almost the same crash involvement propensity ( =3φ 0.0099 and =4φ 0.0094, respectively). Table 1. Crash involvement propensity of licensed drivers belonging to five age groups
Age group i
Subpopulation
Size of subpopulation
Number of crash-involved
drivers
Crash Involvement Propensity
Index
(interval in years) (Ai) (Si) (Ci) ( iφ )
Age group 1 (<18) A1 3,827,438 751,667 0.8299
Age group 2 (18 to 24) A2 21,881,758 2,351,971 0.0794
Age group 3 (25 to 49) A3 98,046,947 5,861,801 0.0099
Age group 4 (50 to 69) A4 55,396,514 1,775,570 0.0094
Age group 5 (>69) A5 11,472,366 581,312 0.0714
Source: National Center for Statistics and Analysis, NHTSA, GES 2000, FARS 2000, FHWA. The crash involvement propensities for the five age groups are plotted in Figure 4. This figure clearly depicts that as the drivers get older, their propensity of being involved in
0
0.1
0.2
0.3
0.4
0.5
0.6
0.7
0.8
0.9
Age group
Cra
sh In
volv
emen
t Pro
pens
ity In
dex
Age group 1 Age group 2 Age group 3 Age group 4 Age group 5
Source: National Center for Statistics and Analysis, NCSA, GES 2000, FARS 2000, FHWA
Figure 4. Crash involvement propensity of drivers belonging to five age groups, as measured by CIPI.

National Center for Statistics and Analysis ♦ 400 Seventh St., S.W., Washington, D.C. 20590
9
crashes keeps decreasing (with a noticeably sharp decrease from Age group 1 to Age group 2). It can also be noticed in this figure that the crash involvement propensity increases again when the drivers get older (70 and above). In fact, it reaches almost the same level as of the young (18 to 24) drivers. 3. Association between driver attributes and his/her role in a rear-end
crash The statistics presented thus far provide a clear idea about the variation that exists in the crash involvement propensity of drivers belonging to different age and sex groups. We now focus our attention on rear-end crashes and seek statistical justification to the possible association between age/sex of the driver and his/her role (striking/struck) in a rear-end crash. As a first step, based on the preliminary analysis conducted in the previous sections, the population of drivers was classified with respect to three factors: Age of the driver, Sex of the young driver, and Role of the driver in a rear-end crash. Specifically, the following modes of classification were used in the subsequent analysis. • Classification of drivers based on Age of the driver:
Age group 1 (younger than 18) Age group 2 (18 to 24 ) Age group 3 (25 to 49 ) Age group 4 (50 to 69 ) Age group 5 (70 and older)
• Classification of drivers based on Sex of the young driver:
Young male (18 to 24 male drivers ) Young female (18 to 24 female drivers)
• Classification of drivers based on driver’s Role in a rear-end crash:
Rear-end striking (drivers involved as striking drivers in rear-end crashes) Rear-end struck (drivers involved as struck drivers in rear-end crashes)
The contingency analysis [4] was carried out to test the hypothesis: H1: There is no association between Age of the driver and his/her Role in a rear-end crash. Contingency analysis is one of the useful statistical techniques for testing independence between two or more factors and can be performed on the data that may be meaningfully
National Center for Statistics and Analysis ♦ 400 Seventh St., S.W., Washington, D.C. 20590
10
classified in a contingency table, such as Table A.3 (Appendix A). Since GES data are based on three-stage sampling, the statistical software SUDAAN 8.01 was used for carrying out the contingency analysis, which takes into account the underlying sampling design. The contingency analysis of GES data for the year 2000 was carried out to test the hypothesis H1. The results are presented in the contingency table (Table A.3, Appendix A.) that yield 2χ = 169.7 with 4 degrees of freedom. Since 95th percentile, 9.49, of 2χ distribution with 4 degrees of freedom is far less than 169.7, there is strong evidence of the association between Age of the driver and his/her Role in a rear-end crash. As seen earlier in Section 2.1, drivers under the age of 18 made up only 2% of the total population of licensed drivers, and among drivers older than 17, drivers of age 18 to 24 were most prone to crash involvement (Section 2.3). Based on this profile, we will now focus our attention on the age group: 18 to 24 (young drivers) and test the hypothesis: H2: There is no association between Sex of the young driver and his/her Role as striking or
struck driver. The contingency analysis was carried out to test the hypothesis H2, using the statistical software SUDAAN 8.01 for the same reason as in testing the hypothesis H1. The results are presented in the contingency table, Table A.4, (Appendix A) which yield 2χ = 33.1 with 1 degree of freedom. Since 95th percentile, 3.84, of 2χ distribution with 1 degree of freedom is much less than 33.1, we would reject the hypothesis of independence between Sex of the young driver and his/her Role in a rear-end crash and conclude that there is an association between these two factors. Thus, the above analysis justifies partitioning of the population of drivers into subpopulations based on (i) age of the driver, and (ii) sex of the driver. A finer analysis conducted in the following sections can provide more insight into the likelihood of the role that a driver of a category (based on age/sex) would assume in a rear-end crash. 4. Driver attributes and likelihood of his/her role in a rear-end crash Considered as events, a rear-end crash, and age and sex of the driver involved in a crash cannot be predicted in advance and hence are random events. The phenomenon of the occurrence of rear-end crashes and the involvement of drivers, therefore, submits itself to a probabilistic treatment. For that purpose, we define discrete random variables: X1 that assumes values, depending on the driver’s age; X2 that assumes values, depending on sex of the driver (with focus on young drivers); and Y that assumes values, depending on the driver’s role in a rear-end crash. Specifically, these random variables were defined as:
National Center for Statistics and Analysis ♦ 400 Seventh St., S.W., Washington, D.C. 20590
11
X1 driver’s Age
= 1, if driver’s age is younger than 18, = 2, if driver’s age is 18 to 24, = 3, if driver’s age is 25 to 49, = 4, if driver’s age is 50 to 69, = 5, if driver is older than 69.
X2 driver’s Sex = 1, if young (18 to 24) driver is male,
= 2, if young (18 to 24) driver is female, = 3, otherwise (if driver of either sex is under 18 or is older than 24).
Y driver’ Role
= 1, if driver is striking in the rear-end crash, = 2, if driver is struck in the rear-end crash, = 3, otherwise (i.e., if the driver is either involved in a crash other than rear-end or not at
all). Based on GES and FARS data for the year 2000, the joint, marginal, and conditional probability distributions of the random variables X1, X2, and Y were evaluated, in order to look at the crash involvement profile of drivers categorized on the basis of age and sex 4.1. Driver’s age and likelihood of rear-end crash involvement Table 4 shows the conditional probability distributions: (i) of X1, given Y, i.e., of age group, conditional on driver’s role (striking/struck) in a rear-end crash (Table 4(a)), (ii) of Y given, X1, i.e., of driver’s role in a rear-end crash, conditional on driver’s age group (Table 4(b)). These probability distributions provide useful information about the crash involvement profile of drivers belonging to different age groups in rear-end striking and struck crashes. The conditional probabilities of driver’s age groups, given driver’s role, as shown in Table 4(a), are plotted in Figure 5. This figure also shows the probability distribution of licensed drivers over different age groups. By comparing the distributions of licensed drivers (Figure 5(a)), of the striking drivers (Figure 5(b)), and of the struck drivers (Figure 5(c)) with the normal distribution (dotted line), it can be seen that all these distributions are in close proximity to each other.
National Center for Statistics and Analysis ♦ 400 Seventh St., S.W., Washington, D.C. 20590
12
Table 4. Conditional probability distributions of the discrete random variables X1 and Y
(a) Conditional probability distribution of Driver’s age group, given Driver’s role P(X1=i / Y=j)
X1 (Driver’s age group) Y (Driver’s role)
1 2 3 4 5
1 0.08168 0.229445 0.523402 0.12792 0.03755
2 0.04298 0.16352 0.56647 0.18819 0.03884
3 0.01907 0.11283 0.51360 0.29379 0.06071
(b) Conditional probability distribution of Driver’s role, given Driver’s age group P( Y=j / X1=i )
X1 (Driver’s age group) Y (Driver’s role) 1 2 3 4 5
1 0.04786 0.02352 0.01197 0.00518 0.00734
2 0.02502 0.01666 0.01288 0.00757 0.00755
3 0.92711 0.95983 0.97515 0.98725 0.98511
Source: National Center for Statistics and Analysis, NHTSA, GES 2000, FARS 2000, FHWA
Source: National Center for Statistics and Analysis, NHTSA, GES 2000, FARS 2000, FHWA
Figure 5. Probability distributions of All, Rear-end striking, and Rear-end struck drivers over Age groups.
Also, the conditional probabilities of driver’s roles: striking (thick line) and struck (dotted line), given his/her age group, as shown in Table 4(b), are plotted in Figure 6. This figure shows that among five age groups, the incidence of rear-end striking crashes is most probable for drivers of Age group 1 (younger than 18). The tendency of drivers of Age group 2 (18 to 24) is no different from that of Age group 1 drivers, i.e., of being in the striking role more often than in the struck role, though comparatively Age group 2 drivers
National Center for Statistics and Analysis ♦ 400 Seventh St., S.W., Washington, D.C. 20590
13
0
0.01
0.02
0.03
0.04
0.05
0.06
Driver's age group
Cra
sh in
volv
emen
t lik
elih
ood
Age group 1 Age group 2 Age group 3 Age group 4 Age group 5
Source: National Center for Statistics and Analysis, NHTSA, GES2000, FARS 2000
Figure 6. Rear-end (striking and struck) crash involvement likelihood of drivers belonging to five age groups.
tend to get involved in rear-end striking crashes less often. Additionally, Figure 6 shows that as the drivers get older, they tend to be in the striking role less often than in the struck role. It is also interesting to note in this figure that drivers of Age group 5 (70 and above) are likely to get involved in striking crashes as often as in struck crashes. 4.2. Sex of young driver and likelihood of rear-end crash involvement We now focus our attention on the subpopulation of young drivers and compare the likelihood of rear-end crash involvement of male and female drivers of this subpopulation. Of special interest will be to bring out the difference between the tendencies of male and female drivers in this group, if any, in assuming the role (striking/struck) in a rear-end crash. For that purpose, the joint, marginal, and conditional probability distributions of the random variables X2 and Y were evaluated using GES and FARS data for the year 2000. The results are presented in Table 5. The joint and marginal probabilities (Table 5(a)) for young male and young female drivers are also displayed in Figure 7. The important conclusion that one can draw from this figure is that relative to the likelihood of a driver being male or female in the population of licensed drivers, the likelihood of involvement of young male drivers in rear-end striking crashes was 1.5 times greater than that of the young female drivers, while the likelihood of involvement of young male drivers in rear-end struck crashes was only slightly greater (1.1 times) than that of young female drivers.
Striking
Struck
National Center for Statistics and Analysis ♦ 400 Seventh St., S.W., Washington, D.C. 20590
14
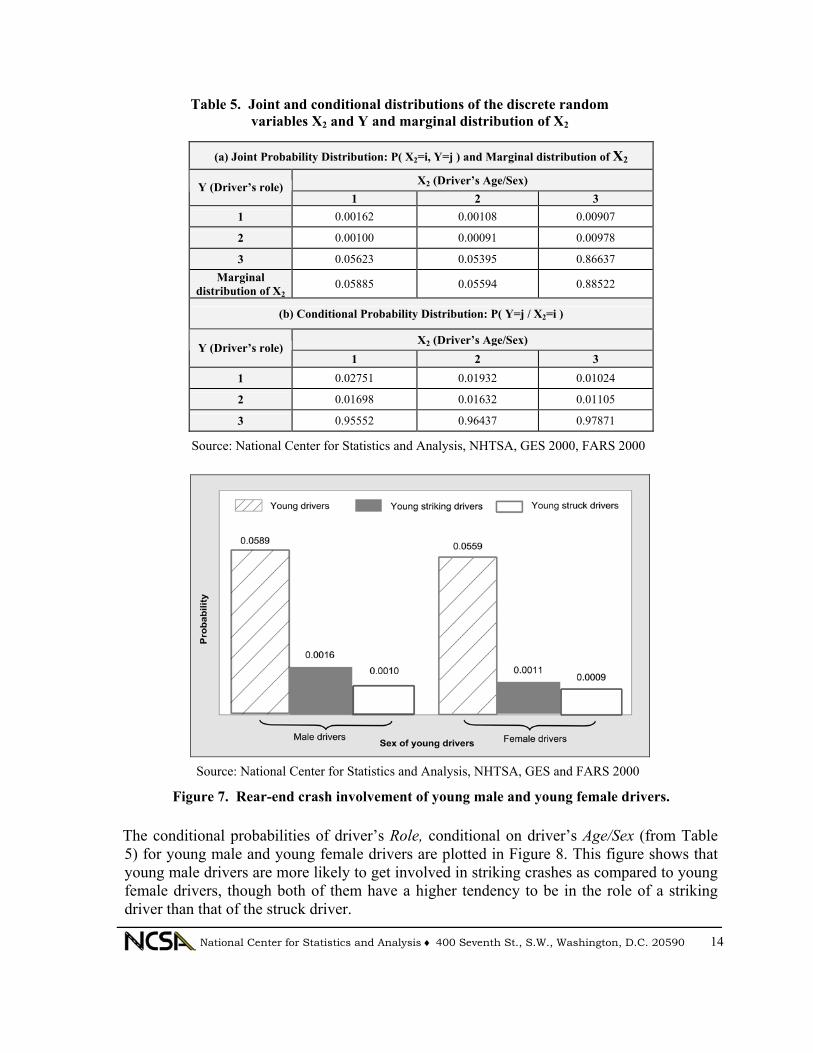
Table 5. Joint and conditional distributions of the discrete random variables X2 and Y and marginal distribution of X2
(a) Joint Probability Distribution: P( X2=i, Y=j ) and Marginal distribution of X2
X2 (Driver’s Age/Sex) Y (Driver’s role) 1 2 3
1 0.00162 0.00108 0.00907
2 0.00100 0.00091 0.00978
3 0.05623 0.05395 0.86637 Marginal
distribution of X2 0.05885 0.05594 0.88522
(b) Conditional Probability Distribution: P( Y=j / X2=i )
X2 (Driver’s Age/Sex) Y (Driver’s role)
1 2 3 1 0.02751 0.01932 0.01024
2 0.01698 0.01632 0.01105
3 0.95552 0.96437 0.97871
Source: National Center for Statistics and Analysis, NHTSA, GES 2000, FARS 2000
Source: National Center for Statistics and Analysis, NHTSA, GES and FARS 2000
Figure 7. Rear-end crash involvement of young male and young female drivers.
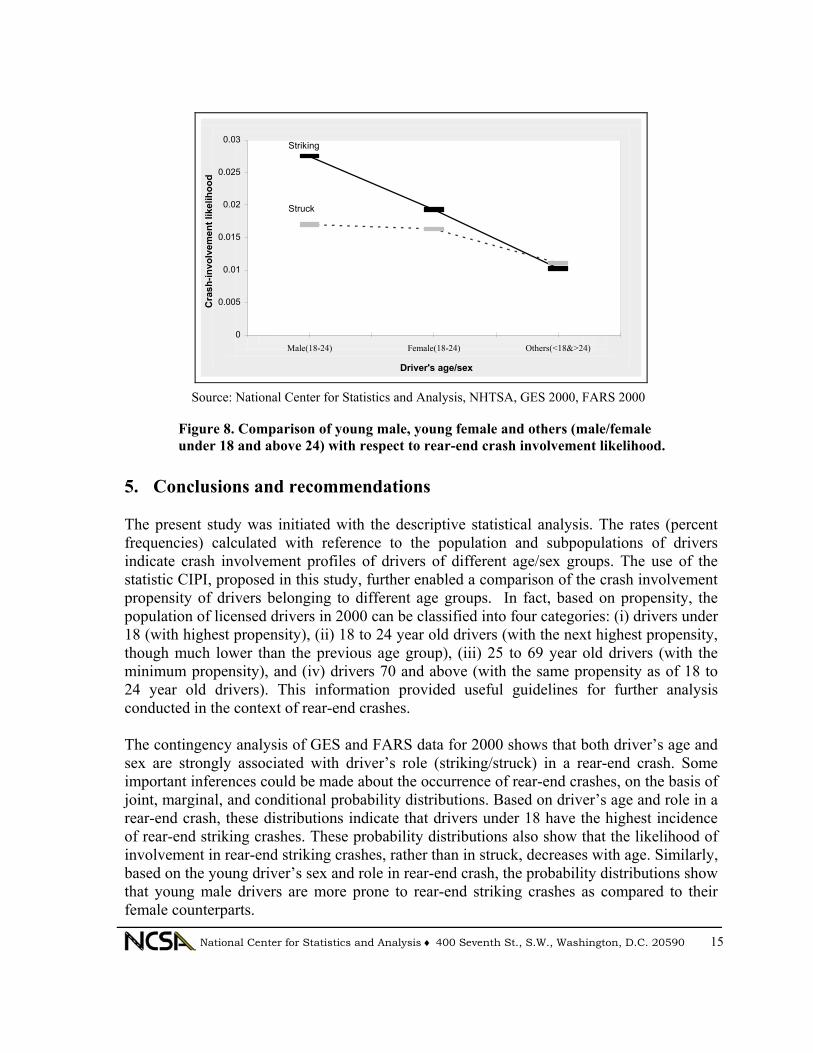
The conditional probabilities of driver’s Role, conditional on driver’s Age/Sex (from Table 5) for young male and young female drivers are plotted in Figure 8. This figure shows that young male drivers are more likely to get involved in striking crashes as compared to young female drivers, though both of them have a higher tendency to be in the role of a striking driver than that of the struck driver.
National Center for Statistics and Analysis ♦ 400 Seventh St., S.W., Washington, D.C. 20590
15
0
0.005
0.01
0.015
0.02
0.025
0.03
Male(18-24) Female(18-24) Others(<18&>24)
Driver's age/sex
Cra
sh-in
volv
emen
t lik
elih
ood
Striking
Struck
Source: National Center for Statistics and Analysis, NHTSA, GES 2000, FARS 2000
Figure 8. Comparison of young male, young female and others (male/female under 18 and above 24) with respect to rear-end crash involvement likelihood.
5. Conclusions and recommendations The present study was initiated with the descriptive statistical analysis. The rates (percent frequencies) calculated with reference to the population and subpopulations of drivers indicate crash involvement profiles of drivers of different age/sex groups. The use of the statistic CIPI, proposed in this study, further enabled a comparison of the crash involvement propensity of drivers belonging to different age groups. In fact, based on propensity, the population of licensed drivers in 2000 can be classified into four categories: (i) drivers under 18 (with highest propensity), (ii) 18 to 24 year old drivers (with the next highest propensity, though much lower than the previous age group), (iii) 25 to 69 year old drivers (with the minimum propensity), and (iv) drivers 70 and above (with the same propensity as of 18 to 24 year old drivers). This information provided useful guidelines for further analysis conducted in the context of rear-end crashes. The contingency analysis of GES and FARS data for 2000 shows that both driver’s age and sex are strongly associated with driver’s role (striking/struck) in a rear-end crash. Some important inferences could be made about the occurrence of rear-end crashes, on the basis of joint, marginal, and conditional probability distributions. Based on driver’s age and role in a rear-end crash, these distributions indicate that drivers under 18 have the highest incidence of rear-end striking crashes. These probability distributions also show that the likelihood of involvement in rear-end striking crashes, rather than in struck, decreases with age. Similarly, based on the young driver’s sex and role in rear-end crash, the probability distributions show that young male drivers are more prone to rear-end striking crashes as compared to their female counterparts.

National Center for Statistics and Analysis ♦ 400 Seventh St., S.W., Washington, D.C. 20590
16
The statistics presented in this study show that the involvement of drivers in crashes, in general, and the role that a driver may assume in a rear-end crash, can be attributed to driver attributes age and sex. This, in turn, strongly supports the use of these attributes as stratification factors in data collection and analysis that are directed towards development of effective rear-end crash countermeasures.
National Center for Statistics and Analysis ♦ 400 Seventh St., S.W., Washington, D.C. 20590
17
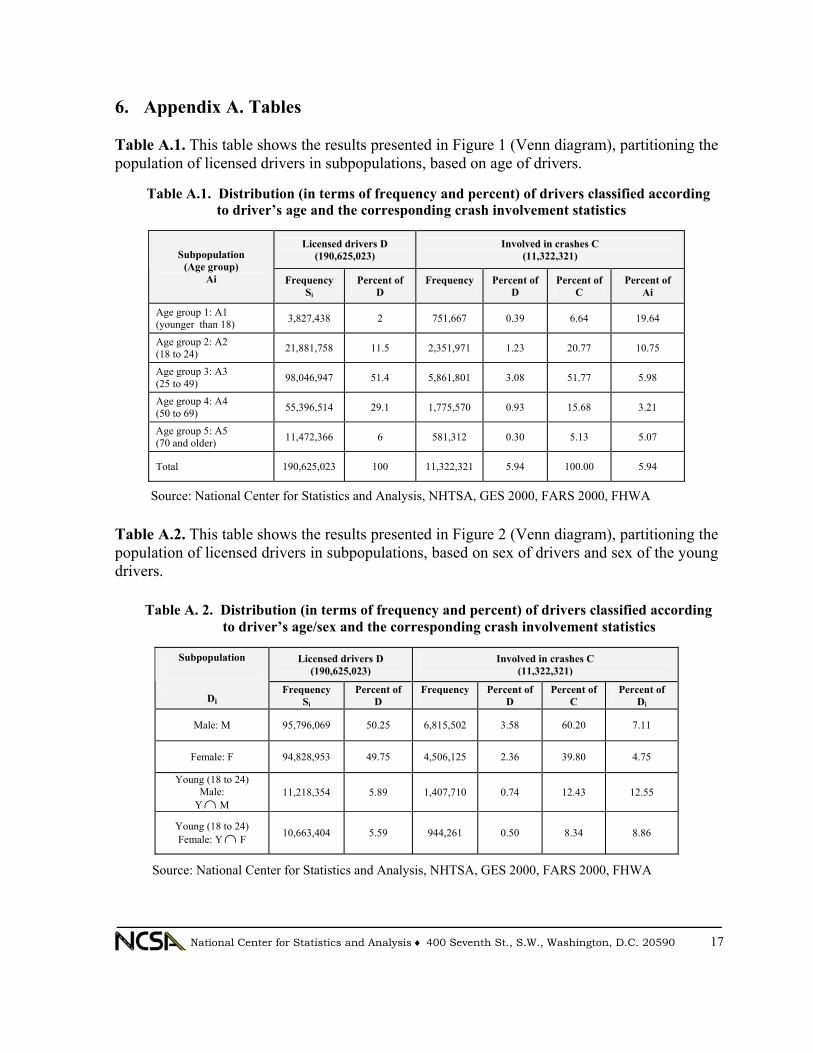
6. Appendix A. Tables Table A.1. This table shows the results presented in Figure 1 (Venn diagram), partitioning the population of licensed drivers in subpopulations, based on age of drivers. Table A.1. Distribution (in terms of frequency and percent) of drivers classified according to driver’s age and the corresponding crash involvement statistics
Licensed drivers D (190,625,023)
Involved in crashes C (11,322,321) Subpopulation
(Age group) Ai Frequency
Si
Percent of D
Frequency
Percent of D
Percent of C
Percent of Ai
Age group 1: A1 (younger than 18) 3,827,438 2 751,667 0.39 6.64 19.64
Age group 2: A2 (18 to 24) 21,881,758 11.5 2,351,971 1.23 20.77 10.75
Age group 3: A3 (25 to 49) 98,046,947 51.4 5,861,801 3.08 51.77 5.98
Age group 4: A4 (50 to 69) 55,396,514 29.1 1,775,570 0.93 15.68 3.21
Age group 5: A5 (70 and older) 11,472,366 6 581,312 0.30 5.13 5.07
Total 190,625,023 100 11,322,321 5.94 100.00 5.94
Source: National Center for Statistics and Analysis, NHTSA, GES 2000, FARS 2000, FHWA Table A.2. This table shows the results presented in Figure 2 (Venn diagram), partitioning the population of licensed drivers in subpopulations, based on sex of drivers and sex of the young drivers. Table A. 2. Distribution (in terms of frequency and percent) of drivers classified according to driver’s age/sex and the corresponding crash involvement statistics
Licensed drivers D (190,625,023)
Involved in crashes C (11,322,321)
Subpopulation
Di Frequency
Si Percent of
D Frequency
Percent of
D Percent of
C Percent of
Di
Male: M 95,796,069 50.25 6,815,502 3.58 60.20 7.11
Female: F 94,828,953 49.75 4,506,125 2.36 39.80 4.75
Young (18 to 24) Male:
Y ∩ M 11,218,354 5.89 1,407,710 0.74 12.43 12.55
Young (18 to 24) Female: Y ∩ F 10,663,404 5.59 944,261 0.50 8.34 8.86
Source: National Center for Statistics and Analysis, NHTSA, GES 2000, FARS 2000, FHWA

National Center for Statistics and Analysis ♦ 400 Seventh St., S.W., Washington, D.C. 20590
18
Table A.3. This table shows sample size and weighted size for each category (age group) that were computed by SUDDAN while carrying out the contingency analysis for testing the association between driver’s Age and driver’s Role in a rear-end crash (Section 3). Table A.3. Contingency table: Driver’s Age vs. Driver’s Role in a rear-end crash
Driver’s role Driver’s age group
Statistics
Rear-end striking Rear-end struck Total
Age group 1 (younger than 18)
Sample size Weighted size
1079 147982
471 66179
1550 214161
Age group 2 (18 to 24)
Sample size Weighted size
3418 437657
2204 292887
5622 730544
Age group 3 (25 to 49)
Sample size Weighted size
7484 896980
8621 1053726
16105 1950705
Age group 4 (50 to 69)
Sample size Weighted size
1954 219596
2935 357328
4889 576924
Age group 5 (70 and older)
Sample size Weighted size
1337 200681
937 118743
2274 319424
Total Sample size Weighted size
15272 1902896
15168 1888863
30440 3791758
Source: National Center for Statistics and Analysis, NHTSA, GES 2000, FARS 2000, FHWA Table A.4. This table shows sample size and weighted size for each category (sex of young driver), that were computed by SUDDAN while carrying out the contingency analysis for testing the association between Sex of the young driver and driver’s Role in a rear-end crash (Section 3).
Table A.4. Contingency table: Young driver’s Sex vs. Driver’s Role in a rear-end crash
Driver’s role Young driver’s
Sex Statistics
Rear-end striking Rear-end struck Total
Young (18 to 24)
Male
Sample size Weighted size
2185 271079
1198 153791
3383 424870
Young (18 to 24) Female
Sample size Weighted size
1233 166578
1006 139096
2239 305674
Total Sample size
Weighted size 3418
437657 2204
292887 5622
730544
Source: National Center for Statistics and Analysis, NHTSA, GES 2000, FARS 2000, FHWA
National Center for Statistics and Analysis ♦ 400 Seventh St., S.W., Washington, D.C. 20590
19
7. Appendix B. Analytical details of Crash Involvement Propensity Index B.1. Crash Involvement Propensity Index (CIPI) This appendix supplies the analytical details of the statistic called Crash Involvement Propensity Index in Section 2.3. In order to develop a measure of the crash involvement propensity of a driver belonging to a category as compared to other categories, it is important to consider the occurrence of crashes in that category relative to the occurrence of its drivers in the entire population of drivers. For this purpose, we consider the space Ω of all drivers belonging to a category and the subspace
CΩ of those drivers of this category who are involved in crashes. Let
)(ΩL be the probability that a driver selected at random belongs to the category Ω ,
)( CL Ω be the probability that a driver selected at random is involved in a crash, given that he/she belongs to the category Ω . Let N be the number of drivers in the entire population of drivers that has been subdivided into K categories, based on a certain criterion, Si the number of drivers belonging to category i (Si>0), and Ci the number of drivers belonging to category i who are involved in crashes, i= 1, 2,…,K. Then the Crash Involvement Propensity of category i drivers can be defined as
K21iL
Li
i
iC ,...,,,
)(
)()(
)(
=Ω
Ω=λ (B.1)
where
i
iiC S
CL =Ω )( )(
and
NS
L ii =Ω )( )( ,
so that iλ defined in (B.1) becomes
K21iSC
N 2i
ii ,...,,, =
=λ . (B.2)
Note that iλ in (B.2) is basically, the conditional probability of a driver being involved in a crash, given that he/she belongs to that ith category. In order to compare the crash involvement propensity of mutually exclusive categories A1, A2,…,AK into which the population of all drivers is subdivided, these probabilities can be combined to define the CIPI
National Center for Statistics and Analysis ♦ 400 Seventh St., S.W., Washington, D.C. 20590
20
K21iK
1jj
ii ,...,,, ==
∑=
λ
λφ .
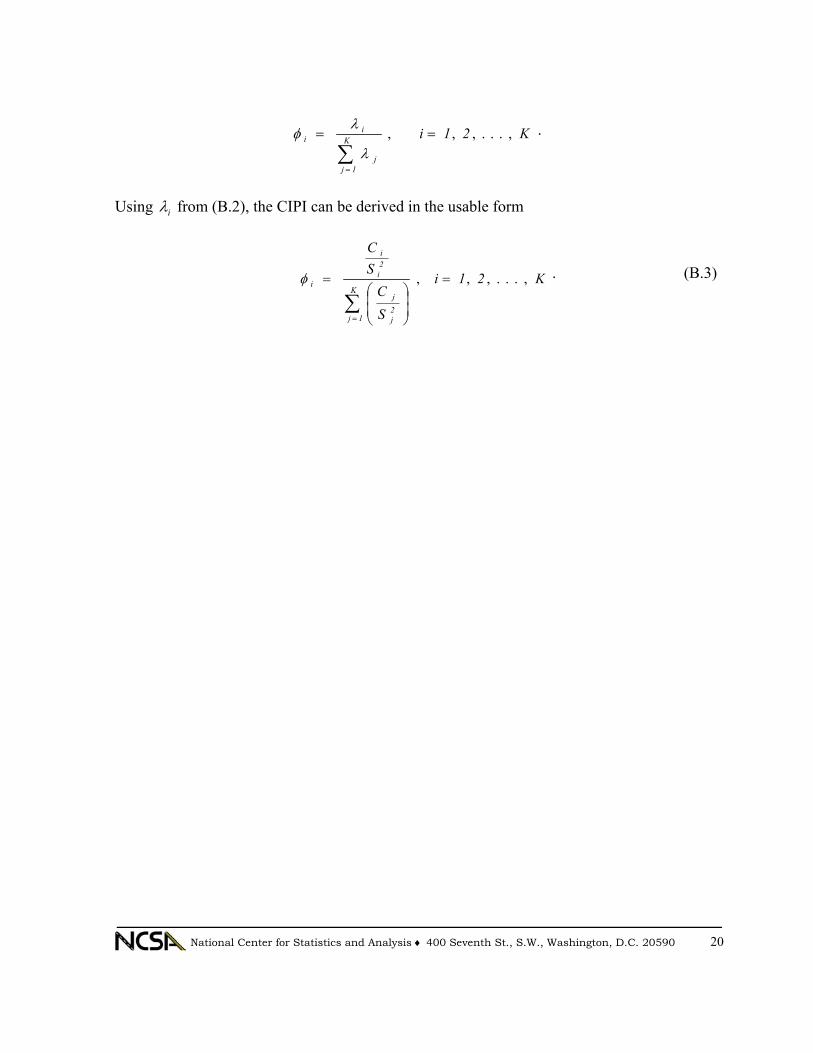
Using iλ from (B.2), the CIPI can be derived in the usable form
K21i
SC
SC
K
1j2j
j
2i
i
i ,...,,, =
=
∑=
φ . (B.3)
National Center for Statistics and Analysis ♦ 400 Seventh St., S.W., Washington, D.C. 20590
21
8. References [1] NHTSA, Crash Data and Rates for Age-Sex Groups of Drivers, Research Note, US
Department of Transportation, Washington DC, 1992. [2] NHTSA, Crash Data and Rates for Age-Sex Groups of Drivers, Research Note, US
Department of Transportation, Washington DC, 1996. [3] NHTSA, Crash Data and Rates for Age-Sex Groups of Drivers, Research Note, US
Department of Transportation, Washington DC, 1998. [4] Rohatgi, V. K., An Introduction to Probability Theory and Mathematical Statistics, John Wiley and Sons, New York (1976).


DOT HS 809 540March 2003