Drewry marine terminal finance investment summit 2015
17
www.drewry.co.uk Global dynamics changing the landscape of cargo flows Dinesh Sharma, Senior Manager Marine Terminal Finance and Investment Summit 2015
-
Upload
drewrymarketing -
Category
Business
-
view
388 -
download
4
Transcript of Drewry marine terminal finance investment summit 2015

www.drewry.co.uk
Global dynamics changing the
landscape of cargo flows
Dinesh Sharma, Senior Manager
Marine Terminal Finance and
Investment Summit 2015

www.drewry.co.uk 2 Overview of global container port and shipping trends | © Drewry 2015
Two dynamic aspects of demand…
…both affect capacity needs and investment decisions
Demand
growth
1. Growth rate %
2. Size of market
Changes in
the nature of
demand
1. Ship size growth
2. Carrier alliances and partnerships
TERMINAL
CAPACITY
requirements

www.drewry.co.uk 3 Overview of global container port and shipping trends | © Drewry 2015
Global container port traffic 2000-2014
Market is growing but at a much slower pace
249 279
315
363
399
443
497 525
478
548
596 625
645 678
713 749
2001 2002 2003 2004 2005 2006 2007 2008 2009 2010 2011 2012 2013 2014 2015 (f) 2016 (f)
Source Drewry Maritime Research
Million teu
CAGR 11.3% CAGR 5.3%

www.drewry.co.uk 4 Overview of global container port and shipping trends | © Drewry 2015
Global container port traffic growth
Increased volatility: 5% seems to be the floor
-15%
-10%
-5%
0%
5%
10%
15%
20%
Source Drewry Maritime Research
www.drewry.co.uk 5 Overview of global container port and shipping trends | © Drewry 2015
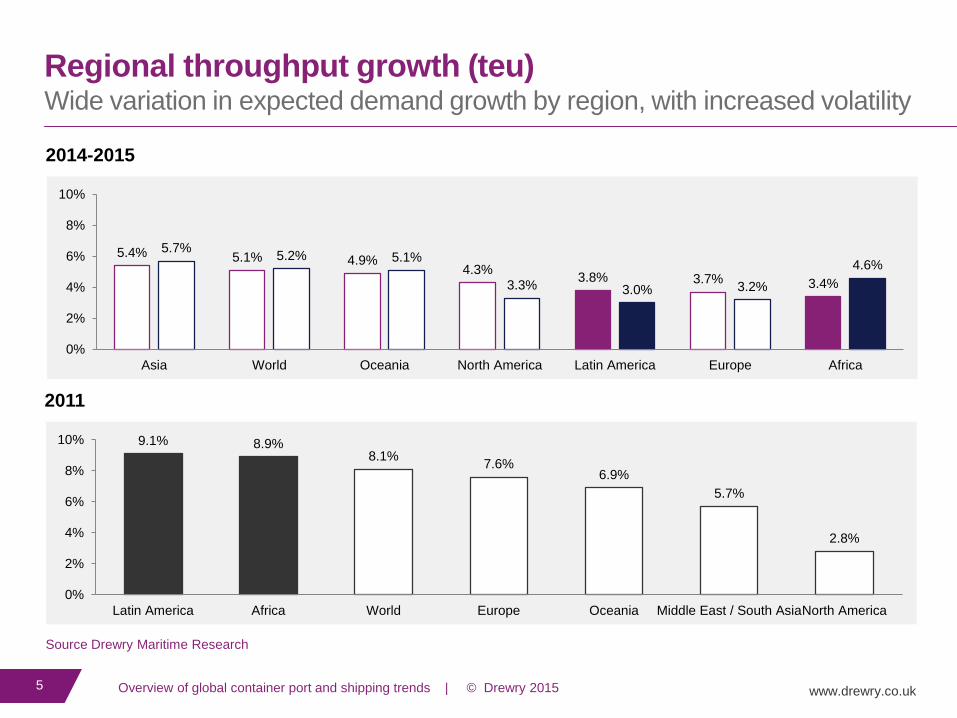
Regional throughput growth (teu) Wide variation in expected demand growth by region, with increased volatility
5.4% 5.1% 4.9% 4.3%
3.8% 3.7% 3.4%
5.7% 5.2% 5.1%
3.3% 3.0% 3.2%
4.6%
0%
2%
4%
6%
8%
10%
Asia World Oceania North America Latin America Europe Africa
Source Drewry Maritime Research
2014-2015
9.1% 8.9% 8.1%
7.6% 6.9%
5.7%
2.8%
0%
2%
4%
6%
8%
10%
Latin America Africa World Europe Oceania Middle East / South AsiaNorth America
2011

www.drewry.co.uk 6 Overview of global container port and shipping trends | © Drewry 2015
Global containership size development Rapid move towards bigger ships; 2015 - scheduled delivery of 1.9 million teu and 60 ULCVs
-5%
0%
5%
10%
15%
20%
25%
30%
35%
<4000 4,000-4,999 5,000-5,999 6,000-6,999 7,000-7,999 8,000-9,999 10,000 +
1Q 2014 1Q 2015 Change
• Ships of 10,000 teu or above comprise 18% of the global fleet by capacity (14% a year ago)
• Ships of 8,000 teu or above comprise 37% of the global fleet by capacity (33% a year ago)
• Ships of less than 5,000 comprise 46% of the global fleet by capacity (43% a year ago)
www.drewry.co.uk 7 Overview of global container port and shipping trends | © Drewry 2015
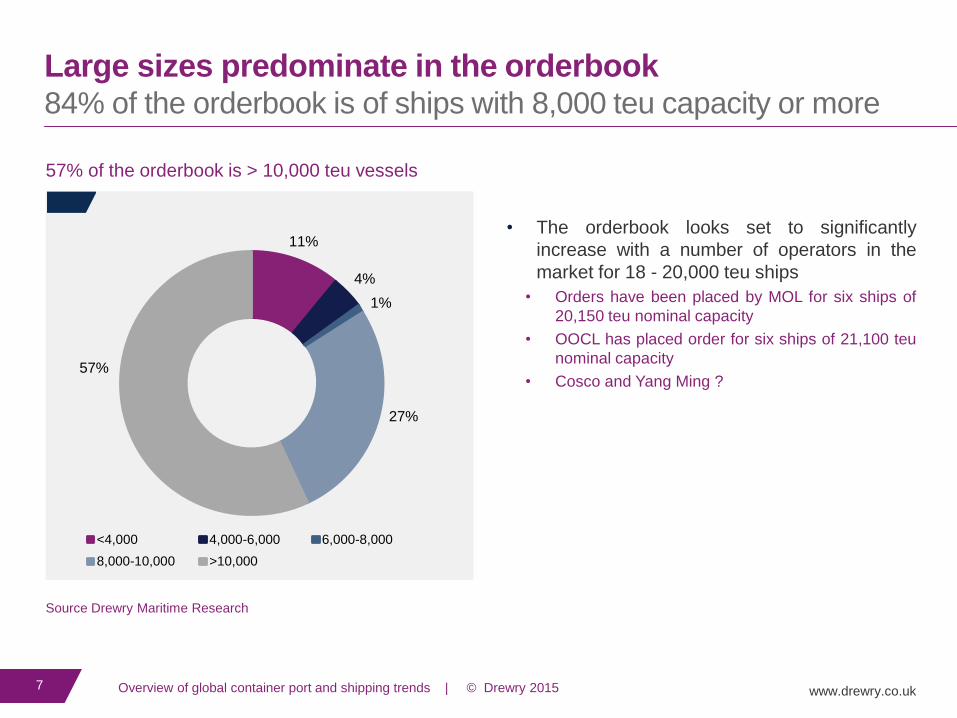
Large sizes predominate in the orderbook 84% of the orderbook is of ships with 8,000 teu capacity or more
11%
4%
1%
27%
57%
<4,000 4,000-6,000 6,000-8,000
8,000-10,000 >10,000
• The orderbook looks set to significantly
increase with a number of operators in the
market for 18 - 20,000 teu ships
• Orders have been placed by MOL for six ships of
20,150 teu nominal capacity
• OOCL has placed order for six ships of 21,100 teu
nominal capacity
• Cosco and Yang Ming ?
Source Drewry Maritime Research
57% of the orderbook is > 10,000 teu vessels
www.drewry.co.uk 8 Overview of global container port and shipping trends | © Drewry 2015
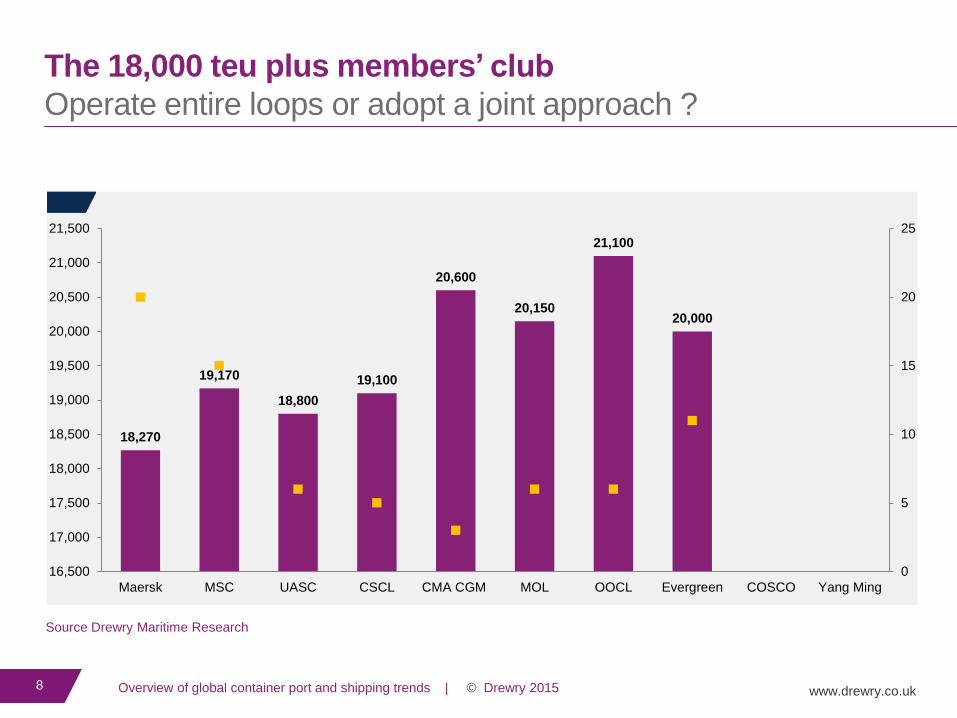
The 18,000 teu plus members’ club
Operate entire loops or adopt a joint approach ?
18,270
19,170
18,800
19,100
20,600
20,150
21,100
20,000
0
5
10
15
20
25
16,500
17,000
17,500
18,000
18,500
19,000
19,500
20,000
20,500
21,000
21,500
Maersk MSC UASC CSCL CMA CGM MOL OOCL Evergreen COSCO Yang Ming
Source Drewry Maritime Research

www.drewry.co.uk 9 Overview of global container port and shipping trends | © Drewry 2015
Increase in average container ship size, 1Q2013 - 1Q2015 Increase in ship size on all trade lanes…significant upsizing on certain trades
80%
37%
34%
32%
21%
19%
15%
15%
14%
10%
9%
9%
8%
8%
6%
0% 10% 20% 30% 40% 50% 60% 70% 80% 90%
Europe-S Africa
Asia-ECSA
Asia-W Africa
Europe- W Africa
Europe-ECSA
Asia-N Europe
Asia-USEC (Suez)
Asia-USWC
N Europe-Gulf/Mex
Asia-S Africa
SE Asia-Aus
N Europe- N Atlantic
Asia-WCSA
Asia-Med
N Asia-Aus
Source Drewry Maritime Research

www.drewry.co.uk 10 Overview of global container port and shipping trends | © Drewry 2015
Average ship size
More than 6,000 teu on most trade lanes
8,625
7,444
7,390
7,386
7,375
7,188
6,861
6,569
4,702
4,606
4,467
4,393
4,066
3,828
3,613
3,556
2,470
0 1,000 2,000 3,000 4,000 5,000 6,000 7,000 8,000 9,000 10,000
Asia-Med
Europe-ECSA
Asia-USWC
Asia-ECSA
Asia-USEC (Suez)
Europe-S Africa
Asia-WCSA
Asia-S Africa
N Europe- N Atlantic
Asia-USEC (Panama)
N Asia-Aus
N Europe-Gulf/Mex
Asia-W Africa
SE Asia-Aus
Europe-WCSA
N Europe-Montreal
Europe- W Africa
Source Drewry Maritime Research

www.drewry.co.uk 11 Overview of global container port and shipping trends | © Drewry 2015
Alliances
Fragmented terminal capacity is a challenge at many ports
Lines
Terminal Operators

www.drewry.co.uk 12 Overview of global container port and shipping trends | © Drewry 2015
Changing nature of cargo flows Bigger ships resulting in changing day to day flow of cargo and peaking of volumes
7,109
7,528
8,144
122
114
109
1Q 2013 1Q 2014 1Q 2015
Average ship size and number of weekly loops on main East West trades
Typically the same number of ports called at per loop, but less frequently
Greater peaks and troughs at terminals (shipside and landside)

www.drewry.co.uk 13 Overview of global container port and shipping trends | © Drewry 2015
Changing nature of cargo flows
Transhipment; bigger ships and alliances increase the need

www.drewry.co.uk 14 Overview of global container port and shipping trends | © Drewry 2015
Changing nature of cargo flows Terminal performance is critical to achieving benefits of largest ships; who pays?
Lines Expect:
• Reliability
‒ Departure on schedule
‒ Connectivity with feeders/relay services at
hubs
‒ All containers loaded (including empties)
‒ No constraints/congestion on landside
service
• Productivity
‒ Speed of vessel turnaround is important.
As vessel size increases, port time is
maintained, in spite of increased container
exchange
• Efficiency
‒ Largest vessels for the trade/route to be
handled without physical constraints
‒ Unit handling costs are maintained –
requires a competitive environment

www.drewry.co.uk 15 Overview of global container port and shipping trends | © Drewry 2015
Key Takeaways
A. Global container port demand growth at its lowest (excluding 2009), wide
variation and increased volatility in demand growth by region
B. Influx of Ultra large container vessels on key trade routes is resulting in cascading
of bigger ships on all trade lanes with significant upsizing on certain trades
C. This is resulting in changing nature of cargo flows at container terminals and
posing key challenges terminal operators. Cascading is passing these
challenges throughout the global port network and throughout the supply
chain

Header
Sub header
www.drewry.co.uk
Panel Discussion
Demand outlook - Global implications on the relative attractiveness of
container terminal investments in selected geographies
Very Large Container Ships - The implications on container terminal
operators’ existing and future investments
Where is the value for terminal operators in making investment in infrastructure
to handle large container ships and global consortia
www.drewry.co.uk
UK
15-17 Christopher Street
London
EC2A 2BS
United Kingdom
India
209 Vipul Square
Sushant Lok - 1
Gurgaon 122002
India
Singapore
#13-02 Tower Fifteen
15 Hoe Chiang Road
Singapore 089316
China
Office 555, 4th floor
Standard Chartered Tower
201 Shi Ji Avenue
Pudong District, Shanghai
China, 200120
T +44 20 7538 0191 T +91 124 497 4979 T +65 6220 9890 T +86 (0) 21 6182 6759
From our origins in 1970 London to a 21st
century maritime and shipping consultancy,
Drewry has established itself as one of the most
widely used and respected sources of impartial
market insight and industry analysis. This in-
depth understanding and objectivity provides our
clients with the actionable advice and
recommendations they need to achieve their
ambitions and stay ahead of the market.
Our advisors have been involved in 400 port
assignments in 50 countries over the past 10 years
Since 2010, we have provided commercial and due
diligence advice in port M&A and financing projects
with a value of approximately $20bn
In the last 5 years we have provided advice on
vessel valuations with combined asset value of
more than $180bn
We have advised on container shipping industry
investments totalling $6bn in the last 5 years