DRAFT The Cost of Education and Proposed UH Analytical Metrics to Promote Greater Efficiency and...
36
DRAFT The Cost of Education and Proposed UH Analytical Metrics to Promote Greater Efficiency and Productivity Presented to the Board of Regents March 21, 2013 Office of Institutional Research & Analysis
-
Upload
iris-palmer -
Category
Documents
-
view
214 -
download
1
Transcript of DRAFT The Cost of Education and Proposed UH Analytical Metrics to Promote Greater Efficiency and...

DRAFTThe Cost of Education andProposed UH Analytical Metrics to Promote
Greater Efficiency and Productivity
Presented to the Board of RegentsMarch 21, 2013
Office of Institutional Research & Analysis
DRAFT
2
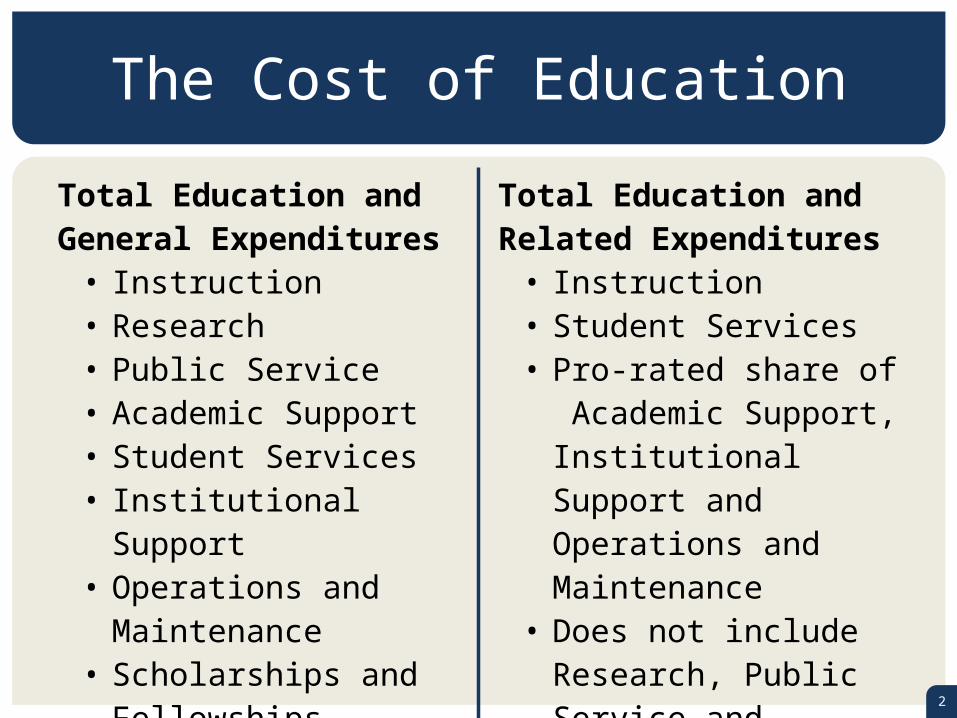
The Cost of Education
Total Education and General Expenditures
• Instruction• Research• Public Service• Academic Support• Student Services• Institutional Support• Operations and
Maintenance• Scholarships and
Fellowships expenses
Total Education and Related Expenditures
• Instruction• Student Services• Pro-rated share of
Academic Support, Institutional Support and Operations and Maintenance
• Does not include Research, Public Service and Scholarships and Fellowships expenses
DRAFT
3
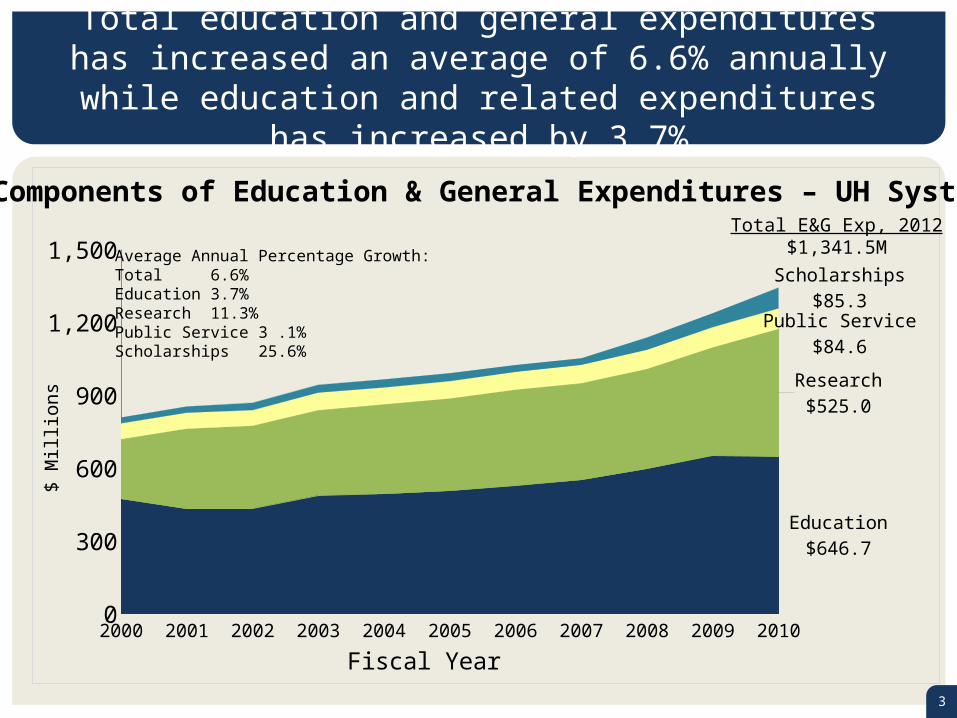
Total education and general expenditures has increased an average of 6.6% annually while education and related
expenditures has increased by 3.7%
2000 2001 2002 2003 2004 2005 2006 2007 2008 2009 20100
300
600
900
1,200
1,500
Education$646.7
Research$525.0
Public Service$84.6
Scholarships$85.3
Fiscal Year
$ M
illio
ns
Average Annual Percentage Growth:Total 6.6%Education 3.7%Research 11.3%Public Service 3 .1%Scholarships 25.6%
Components of Education & General Expenditures – UH SystemTotal E&G Exp, 2012
$1,341.5M
DRAFT
4
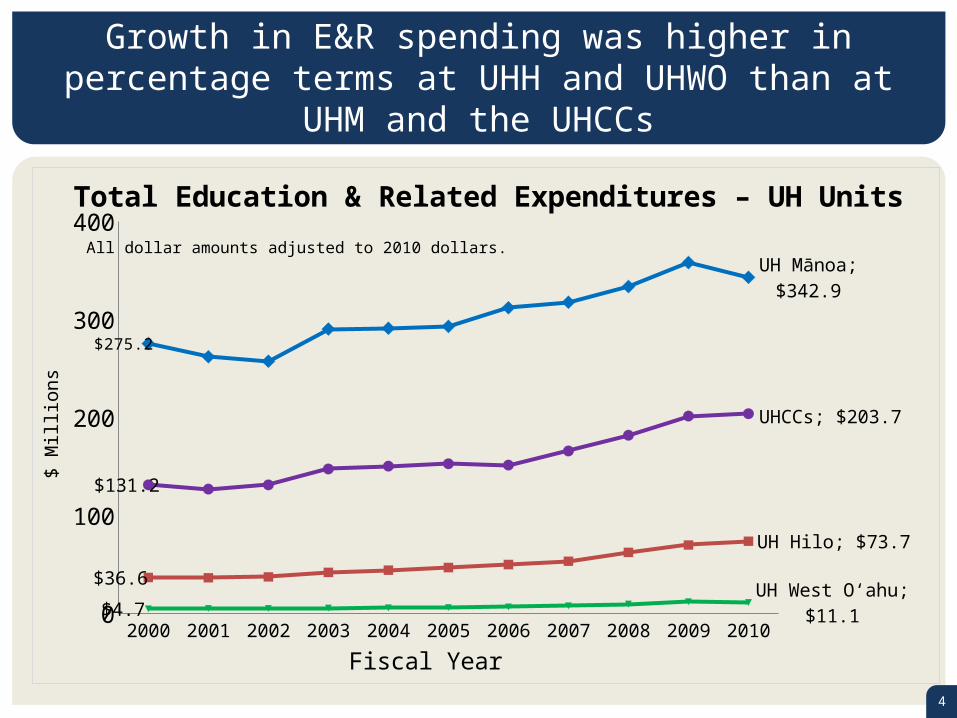
Growth in E&R spending was higher in percentage terms at UHH and UHWO than at UHM and the UHCCs
2000 2001 2002 2003 2004 2005 2006 2007 2008 2009 20100
100
200
300
400
$275.2
UH Mānoa; $342.9
$36.6
UH Hilo; $73.7
$4.7 UH West O‘ahu; $11.1
$131.2
UHCCs; $203.7
Fiscal Year
$ M
illio
ns
Total Education & Related Expenditures – UH Units
All dollar amounts adjusted to 2010 dollars.

DRAFT
5
Instruction expenditures comprises 75% oftotal E&R expenditures for UH Mānoa
2000 2001 2002 2003 2004 2005 2006 2007 2008 2009 20100
100
200
300
400
$275.2$261.8 $257.2
$290.1 $290.9 $292.8$311.8 $317.4
$333.4$357.9
$342.9
E&R Expenditures by Type – UH Mānoa
Instruction Student Services Academic SupportInstitutional Support Operation & Maintenance
Fiscal Year
$ M
illio
ns
All dollar amounts adjusted to 2010 dollars.
DRAFT
6
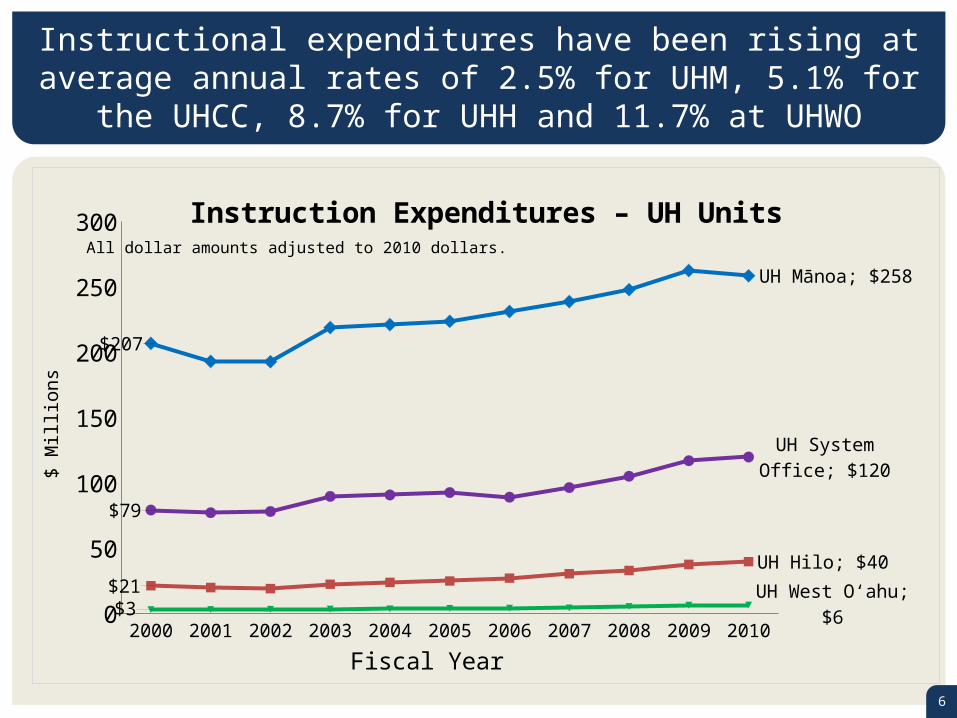
Instructional expenditures have been rising at average annual rates of 2.5% for UHM, 5.1% for the UHCC, 8.7% for UHH and 11.7% at UHWO
2000 2001 2002 2003 2004 2005 2006 2007 2008 2009 20100
50
100
150
200
250
300
$207
UH Mānoa; $258
$21UH Hilo; $40
$3 UH West O‘ahu; $6
$79
UHCCs; $120
Instruction Expenditures – UH Units
Fiscal Year
$ M
illio
ns
All dollar amounts adjusted to 2010 dollars.
DRAFT
7
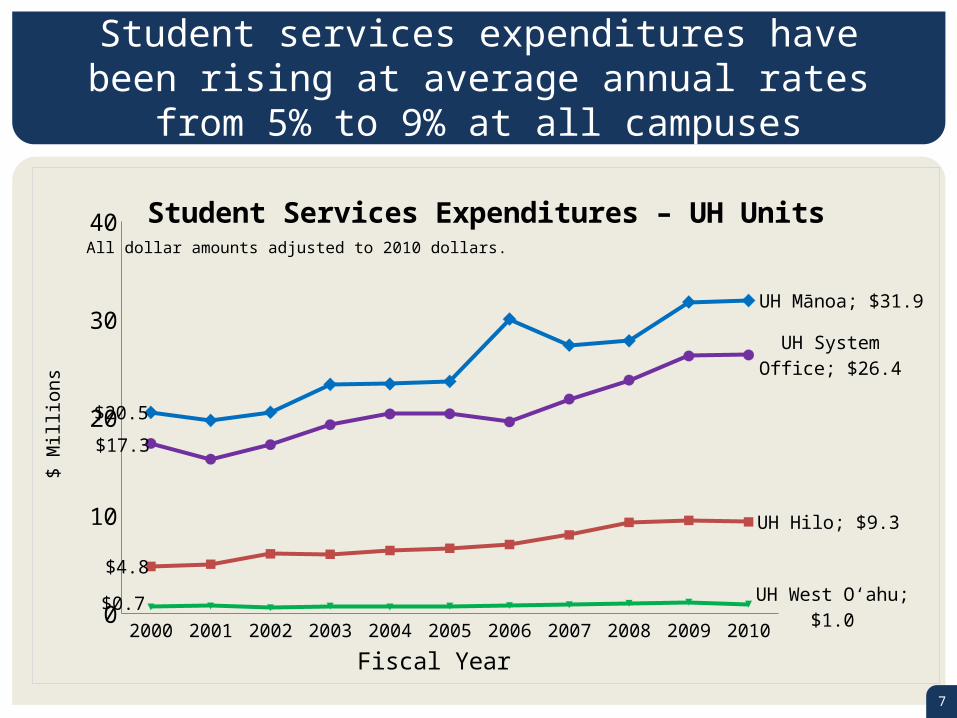
Student services expenditures have been rising at average annual rates from 5% to 9% at all campuses
2000 2001 2002 2003 2004 2005 2006 2007 2008 2009 20100
10
20
30
40
$20.5
UH Mānoa; $31.9
$4.8
UH Hilo; $9.3
$0.7 UH West O‘ahu; $1.0
$17.3
UHCCs; $26.4
Student Services Expenditures – UH Units
Fiscal Year
$ M
illio
ns
All dollar amounts adjusted to 2010 dollars.

DRAFT
8
Academic support expenditures have been rising by 3% to 4% at UHM and the UHCCs, but by more than 11% at UHH and UHWO
2000 2001 2002 2003 2004 2005 2006 2007 2008 2009 20100
20
40
60
80
$48.8
UH Mānoa; $65.5
$4.1UH Hilo; $9.2
$0.6 UH West O‘ahu; $1.2
$16.8
UHCCs; $24.0
Academic Support Expenditures – UH Units
Fiscal Year
$ M
illio
ns
All dollar amounts adjusted to 2010 dollars.

DRAFT
9
Institutional support expenditures have been rising sharply at all campuses, except at UH Mānoa
2000 2001 2002 2003 2004 2005 2006 2007 2008 2009 20100
5
10
15
20
25
$10.6
UH Mānoa; $8.0
$3.5
UH Hilo; $12.2
$0.4
UH West O‘ahu; $2.3
$14.5
UHCCs; $22.5
Institutional Support Expenditures – UH Units
Fiscal Year
$ M
illio
ns
All dollar amounts adjusted to 2010 dollars.

DRAFT
10
Operations and maintenance expenditures have been rising modestly, with the largest percentage increases
at the UHCCs and UHWO
2000 2001 2002 2003 2004 2005 2006 2007 2008 2009 20100
10
20
30
40
50
$35.1
UH Mānoa; $41.1
$5.8UH Hilo; $8.6
$0.2 UH West O‘ahu; $0.3
$10.2
UHCCs; $19.5
Operation and Maintenance Expenditures – UH Units
Fiscal Year
$ M
illio
ns
All dollar amounts adjusted to 2010 dollars.

DRAFT
11
Introduction: Analytical Metrics to Promote Greater Efficiency and Productivity
Goal: To produce metrics and goals annually which promote greater efficiency and productivity
Summary of Proposed Categories1. Cost of Completion2. Student / Staff Ratios3. Student Success Rates
Major source of data: Use common national data, US Department of Education, Integrated Postsecondary Education Data System (IPEDS), to allow for comparisons with peer institutions.

DRAFT
12
Campus Revision date Peers
UH Mānoa 2012Colorado State University; Mississippi State University; Oregon State University; University of Arizona; University of Illinois at Chicago; University of Kentucky; University of New Mexico, Albuquerque; University of South Florida; University of Utah
UH HiloProposed
2013
California State University-Channel Islands; Delaware State University; Langston University; New Jersey City University; SUNY College of Environmental Science and Forestry; SUNY College at Potsdam; SUNY at Purchase College; Tennessee State University; University of Alaska Southeast; University of Baltimore; University of Washington-Tacoma Campus
UH West O‘ahu 2001
California State University – Monterey Bay; Eastern Oregon University; Great Basin College; Texas A&M University – Texarkana; The Evergreen State College; University of Hawai‘i at Hilo; University of Washington – Bothell Campus; University of Washington – Tacoma Campus
UHCC System 1998
City College of San Francisco; College of DuPage; Cuyahoga Community College District; Kirkwood Community College; Lane Community College; Mesa Community College; Miami-Dade College; Milwaukee Area Technical College; Montgomery College; Mt. Hood Community College; Nassau Community College; Portland Community College; Saint Louis Community College – Forest Park
Peer Institutions

DRAFT
13
Cost of Completion
Education and Related (E&R) Spending per Completion
Goal: Increase productivity (more completions per $)Source: US Department of Education, Integrated Postsecondary Education
Data System (IPEDS)
Definitions:
• Completions = Certificates >1 year and all degrees
• E&R Spending = Cost of instruction (salaries and wages, fringe benefits, other expenditures), student services, and the instructional share of academic support, institutional support and operations & maintenance (excludes cost of research, public services and CIP)

DRAFT
14
Inflation adjusted costs for E&R spending per completion have been relatively stable overtime, with the exception of UH West O‘ahu with its new lower
division and UH Hilo with its new College of Pharmacy
2000 2001 2002 2003 2004 2005 2006 2007 2008 2009 20100
20
40
60
80
100
120
140
$69.8UH Mānoa; $77.7
$81.9
UH Hilo; $122.6
$24.3
UH West O‘ahu; $46.1
$58.4
UHCC Average; $73.2
Fiscal Year
$ Th
ousa
nds
Education & Related Expenditures per Completion – UH Units
All dollar amounts adjusted to 2010 dollars.Completion excludes Certificates <1 Year.

DRAFT
15
In 2010, UH Mānoa’s E&R expenditures per completion were 36% higher than its peers
2000 2001 2002 2003 2004 2005 2006 2007 2008 2009 20100
20
40
60
80
100
120
140
$69.8UH Mānoa; $77.7
$58.9 Peer Group; $57.2
Education & Related Expenditures per CompletionUH Mānoa Comparison Group
Fiscal Year
$ Th
ousa
nds
All dollar amounts adjusted to 2010 dollars.Completion excludes Certificates <1 Year.

DRAFT
16
Student/Staff Ratios
1. FTE Students per FTE Instructional Faculty2. FTE Students per Executive / Managerial3. FTE Students per Professional / Technical 4. Student Semester Hours (SSH=credits per class X number of
students X number of classes) per FTE Instructional Faculty5. Class Size: % with under 10 and over 25 students Goals:• Increase ratio of students per instructional faculty comparable
to peers• Increase SSH production per instructional faculty• Decrease percentage of classes with <10 students and
increase percentage of classes with over 25 students
DRAFT
17
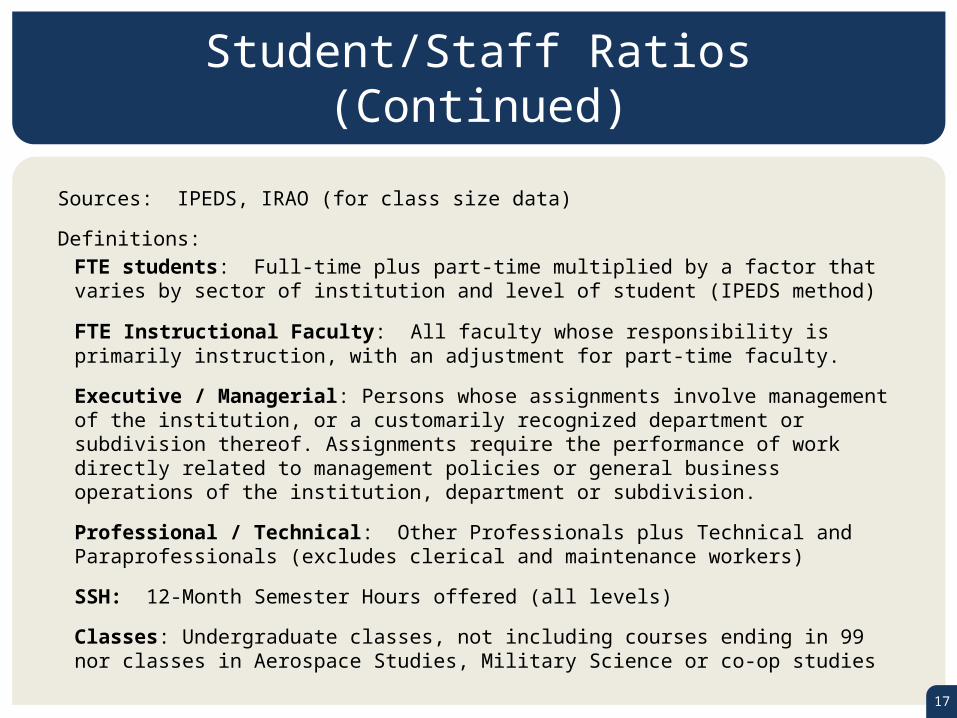
Sources: IPEDS, IRAO (for class size data)
Definitions:FTE students: Full-time plus part-time multiplied by a factor that varies by sector of institution and level of student (IPEDS method)
FTE Instructional Faculty: All faculty whose responsibility is primarily instruction, with an adjustment for part-time faculty.
Executive / Managerial: Persons whose assignments involve management of the institution, or a customarily recognized department or subdivision thereof. Assignments require the performance of work directly related to management policies or general business operations of the institution, department or subdivision.
Professional / Technical: Other Professionals plus Technical and Paraprofessionals (excludes clerical and maintenance workers)
SSH: 12-Month Semester Hours offered (all levels)
Classes: Undergraduate classes, not including courses ending in 99 nor classes in Aerospace Studies, Military Science or co-op studies
Student/Staff Ratios (Continued)

DRAFT
18
FTE students per FTE faculty have increased slightly in recent years and are highest at UHCC (19.4) and lowest at UHM (11.9)
2004 2005 2006 2007 2008 2009 2010 2011 20125
10
15
20
25
11.7 UH Mānoa; 11.9
14.7 UH Hilo; 14.8
18.7UH West O‘ahu; 17.617.1
UHCC Average; 19.4
FTE Students per FTE Instructional Faculty – UH Units
Academic Year

DRAFT
19
2004 2005 2006 2007 2008 2009 2010 2011 20125
10
15
20
25
11.7 UH Mānoa; 11.9
16.9Peer Group; 17.5
FTE Students per FTE Instructional FacultyUH Mānoa Comparison Group
Academic Year
FTE students per FTE faculty measured 11.9 for UH Mānoaand 17.5 for its peers in 2012, or 32% lower than its peers

DRAFT
20
FTE students per E/M has been flat at UH Hilo andUH Mānoa but increasing at UHCC and UH West O‘ahu
2003 2004 2005 2006 2007 2008 2009 2010 2011 20120
100
200
300
400
200UH Mānoa; 186
156 UH Hilo; 165173
UH West O‘ahu; 242
307
UHCC Average; 369
FTE Students per Executive / Managerial – UH Units
Academic Year

DRAFT
21
UH Mānoa has 91% more studentsper E/M than its peers
2003 2004 2005 2006 2007 2008 2009 2010 2011 20120
100
200
300
400
200UH Mānoa; 186
106 Peer Group; 97
FTE Students per Executive / Managerial UH Mānoa Comparison Group
Academic Year

DRAFT
22
FTE students per professional staff is the one area where all campuses have exhibited a decreasing ratio
2003 2004 2005 2006 2007 2008 2009 2010 2011 20120
10
20
30
40
50
60
11.1UH Mānoa; 9.0
22.0UH Hilo; 19.5
43.3
UH West O‘ahu; 18.6
41.5
UHCC Average; 32.3
FTE Students per Professional Staff – UH Units
Academic Year

DRAFT
23
UH Mānoa, with 9 FTE students per professional staff, is comparable to its peers
2003 2004 2005 2006 2007 2008 2009 2010 2011 20120
10
20
30
40
50
60
11.1 UH Mānoa; 9.08.1 Peer Group; 8.5
FTE Students per Professional StaffUH Mānoa Comparison Group
Academic Year

DRAFT
24
2004 2005 2006 2007 2008 2009 2010 2011 2012200
300
400
500
600
700
800
333 UH Mānoa; 332
431UH Hilo; 389
553 UH West O‘ahu; 536493
UHCC Average; 558
12-Month SSH per FTE Instructional Faculty – UH Units
Academic Year
Faculty at the UHCCs generate 558 student semester hours per year (students X credit hours carried) while UH Mānoa faculty generate 332

DRAFT
25
UH Mānoa faculty generate 39% fewer student semester hours per FTE instructional faculty than their peers
2004 2005 2006 2007 2008 2009 2010 2011 2012200
300
400
500
600
700
800
333 UH Mānoa; 332
520Peer Group; 545
12-Month SSH per FTE Instructional FacultyUH Mānoa Comparison Group
Academic Year
DRAFT
26
2005 2006 2007 2008 2009 2010 2011 20120%
10%
20%
30%
40%
50%
60%
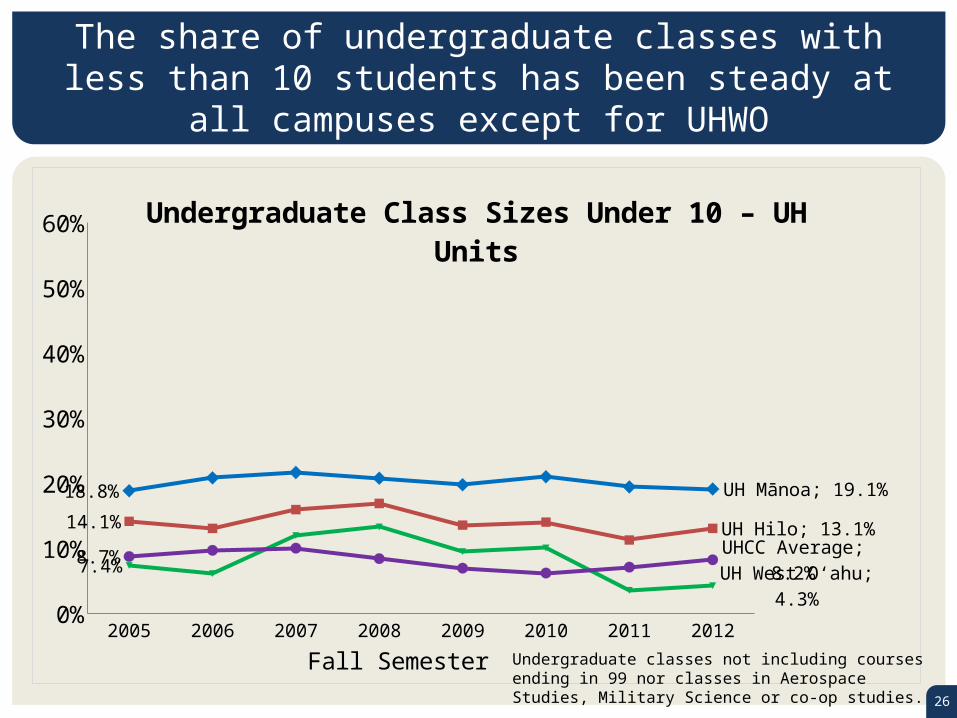
18.8% UH Mānoa; 19.1%
14.1% UH Hilo; 13.1%
7.4%UH West O‘ahu; 4.3%
8.7% UHCC Average; 8.2%
Undergraduate Class Sizes Under 10 – UH Units
Fall Semester Undergraduate classes not including courses ending in 99 nor classes in Aerospace Studies, Military Science or co-op studies.
The share of undergraduate classes with less than 10 students has been steady at all campuses except for UHWO

DRAFT
27
2005 2006 2007 2008 2009 2010 2011 20120%
10%
20%
30%
40%
50%
60%
23.7% UH Mānoa; 23.5%
27.8% UH Hilo; 26.5%
45.3%
UH West O‘ahu; 49.1%
29.0%
UHCC Average; 24.5%
Undergraduate Class Sizes Over 25 – UH Units
Fall Semester Undergraduate classes not including courses ending in 99 nor classes in Aerospace Studies, Military Science or co-op studies.
The share of undergraduate classes over 25 has been increasing at UHWO and decreasing at the UHCCs

DRAFT
28
2005 2006 2007 2008 2009 2010 2011 20120%
10%
20%
30%
40%
50%
60%
11.4%UHM Lower; 9.5%8.7%UHH Lower; 10.0%
24.7% UHM Upper; 26.4%22.1%
UHH Upper; 17.3%
Undergraduate Class Sizes Under 10 by DivisionUH Four Years
Fall Semester Undergraduate classes not including courses ending in 99 nor classes in Aerospace Studies, Military Science or co-op studies.
UHH has reduced the share of upper division classes with less than 10 students in recent years, while UHM’s share has been steady
DRAFT
29
2005 2006 2007 2008 2009 2010 2011 20120%
10%
20%
30%
40%
50%
60%
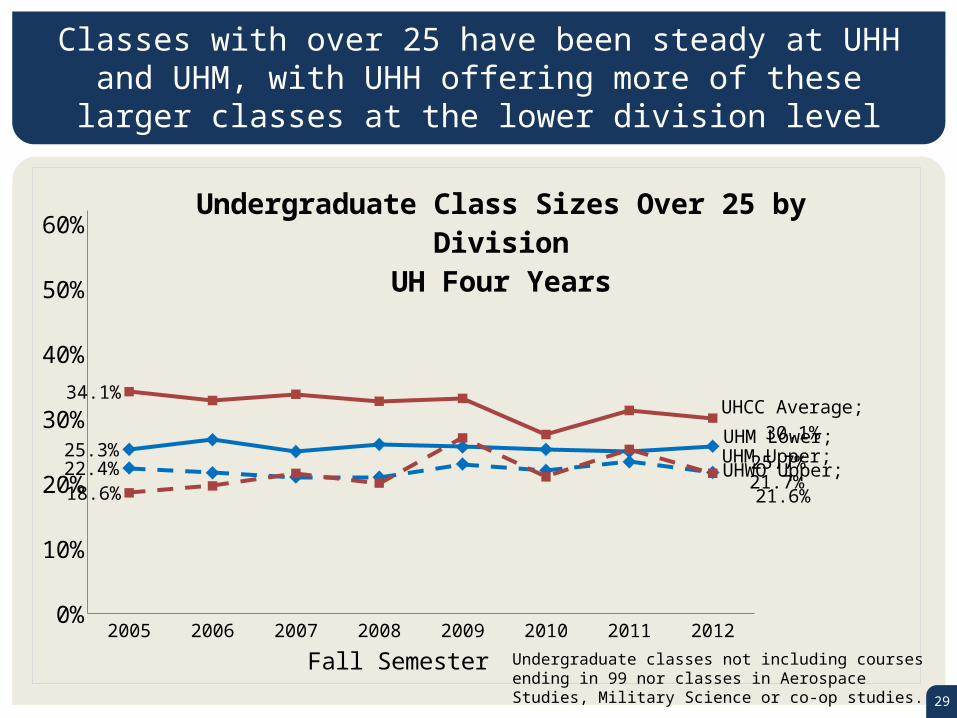
25.3% UHM Lower; 25.7%
34.1%UHH Lower; 30.1%
22.4% UHM Upper; 21.7%18.6% UHH Upper; 21.6%
Undergraduate Class Sizes Over 25 by DivisionUH Four Years
Fall Semester Undergraduate classes not including courses ending in 99 nor classes in Aerospace Studies, Military Science or co-op studies.
Classes with over 25 have been steady at UHH and UHM, with UHH offering more of these larger classes at the lower division level
DRAFT
30
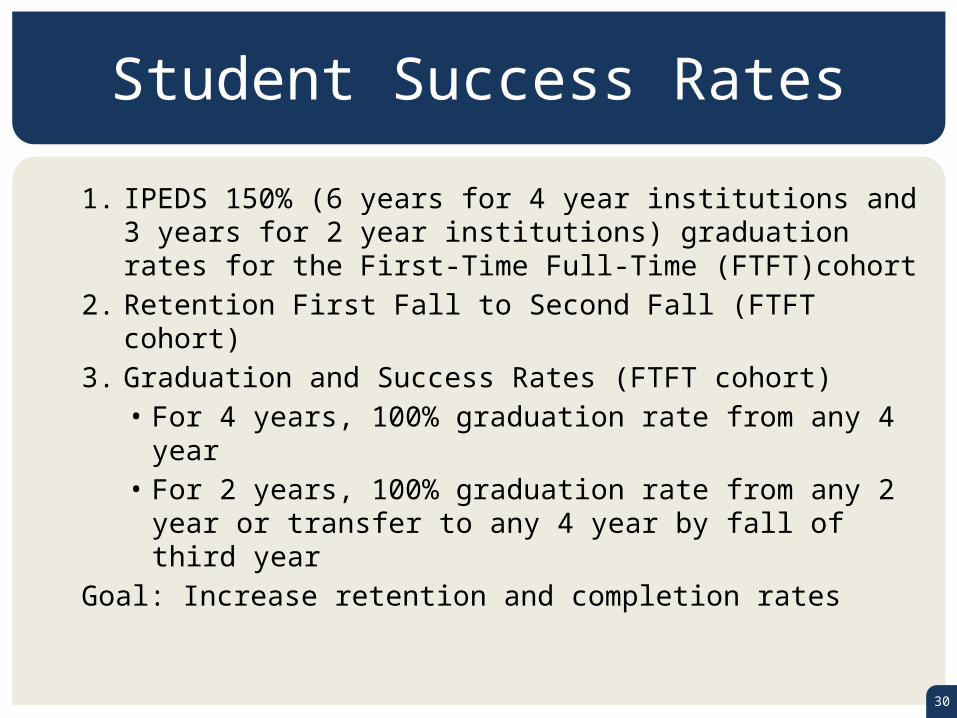
Student Success Rates
1. IPEDS 150% (6 years for 4 year institutions and 3 years for 2 year institutions) graduation rates for the First-Time Full-Time (FTFT)cohort
2. Retention First Fall to Second Fall (FTFT cohort)3. Graduation and Success Rates (FTFT cohort)
• For 4 years, 100% graduation rate from any 4 year• For 2 years, 100% graduation rate from any 2 year
or transfer to any 4 year by fall of third yearGoal: Increase retention and completion rates
DRAFT
31
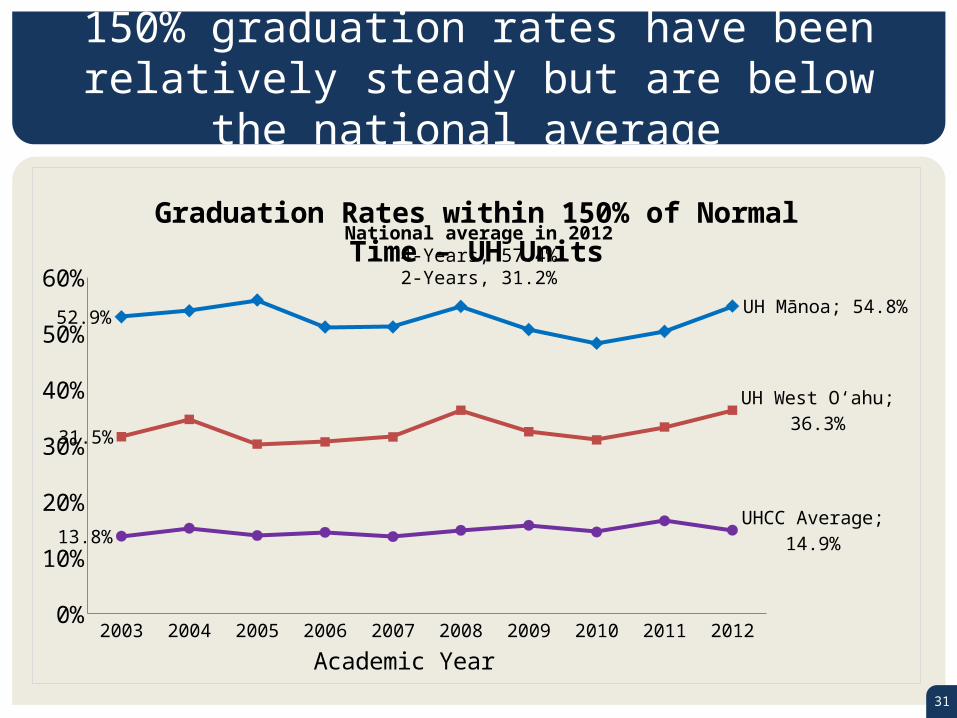
150% graduation rates have been relatively steady but are below the national average
2003 2004 2005 2006 2007 2008 2009 2010 2011 20120%
10%
20%
30%
40%
50%
60%
52.9% UH Mānoa; 54.8%
31.5%UH Hilo; 36.3%
13.8% UHCC Average; 14.9%
Graduation Rates within 150% of Normal Time – UH Units
Academic Year
National average in 20124-Years, 57.4%2-Years, 31.2%

DRAFT
32
UH Mānoa’s six-year graduation rate isslightly below its peers at 54.8%
2003 2004 2005 2006 2007 2008 2009 2010 2011 20120%
10%
20%
30%
40%
50%
60%
52.9% UH Mānoa; 54.8%52.7%
Peer Group; 56.9%
Graduation Rates within 150% of Normal TimeUH Mānoa Comparison Group
Academic Year

DRAFT
33
First fall to second fall retention rates have been steady at all campuses, except for UH West O‘ahu
2005 2006 2007 2008 2009 2010 2011 201220%
40%
60%
80%
100%
75%UH Mānoa; 79%
64%UH Hilo; 69%
0.630000000000001
UH West O‘ahu; 0.37
58% UHCC Average; 60%
Retention Rates – Initial Full-Time Cohorts – UH Units
Academic Year
Retention data were first collected in the 2004–05 IPEDS Fall Enrollment Survey.First cohort at UH West O‘ahu was Fall 2007.
DRAFT
34
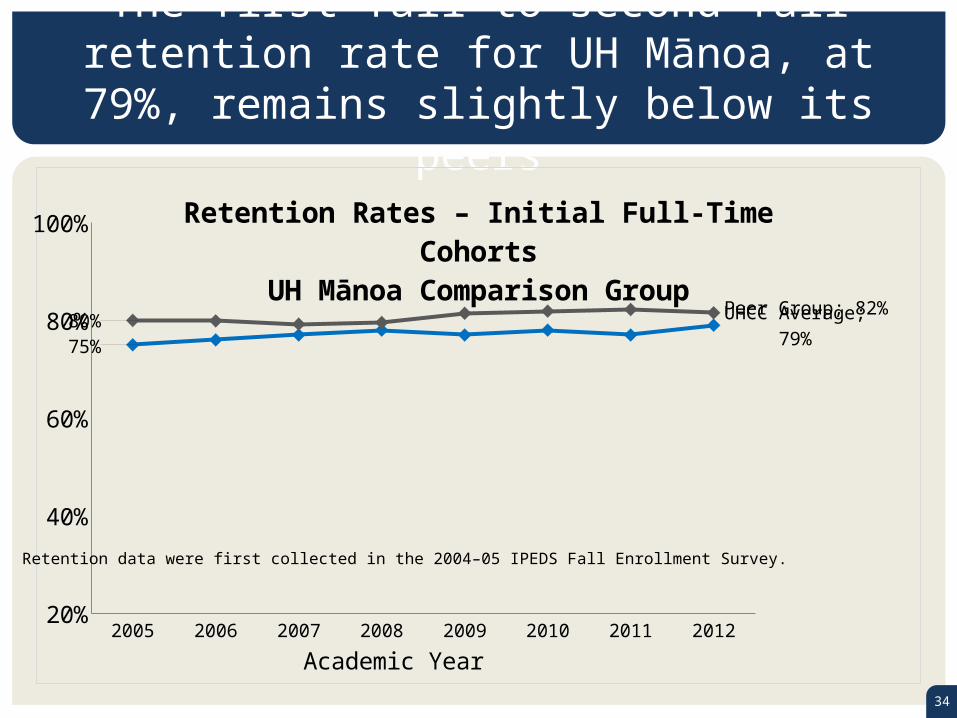
The first fall to second fall retention rate for UH Mānoa, at 79%, remains slightly below its peers
2005 2006 2007 2008 2009 2010 2011 201220%
40%
60%
80%
100%
75%UH Mānoa; 79%80%Peer Group; 82%
Retention Rates – Initial Full-Time CohortsUH Mānoa Comparison Group
Academic Year
Retention data were first collected in the 2004–05 IPEDS Fall Enrollment Survey.
DRAFT
35
Graduation and Success Rate
To be completed

DRAFT
36
Concluding Remarks
• This is a work in progress• Comments are welcome• E-mail: [email protected]