Draft Research Test Procedure Performability Assessment ...
71
Draft Research Test Procedure Performability Assessment for Five ADAS Variants DOT HS 812 983 October 2021
Transcript of Draft Research Test Procedure Performability Assessment ...

Draft Research Test Procedure Performability Assessment for Five ADAS Variants
DOT HS 812 983 October 2021

DISCLAIMER
This publication is distributed by the U.S. Department of Transportation, National Highway Traffic Safety Administration, in the interest of information exchange. The opinions, findings, and conclusions expressed in this publication are those of the authors and not necessarily those of the Department of Transportation or the National Highway Traffic Safety Administration. The United States Government assumes no liability for its contents or use thereof. If trade or manufacturers’ names or products are mentioned, it is because they are considered essential to the object of the publication and should not be construed as an endorsement. The United States Government does not endorse products or manufacturers.
NOTE: This report is published in the interest of advancing motor vehicle safety research. While the report may provide results from research or tests using specifically identified motor vehicle models, it is not intended to make conclusions about the safety performance or safety compliance of those motor vehicles, and no such conclusions should be drawn.
Suggested APA format citation:
Arquette, T. E., Davis, I. J., Fogle, E. E., Forkenbrock, G. J., & Manahan, T. R. (2021, October). Draft research test procedure performability assessment for five ADAS variants (Report No DOT HS 812 983). National Highway Traffic Safety Administration.

i
Technical Report Documentation Page
1. Report No.
DOT HS 812 983 2. Government Accession No. 3. Recipient's Catalog No.
4. Title and Subtitle
Draft Research Test Procedure Performability Assessment for Five ADAS Variants 5. Report Date
October 2021
6. Performing
NSR-120 Organization Code
7. Authors
Tyler E. Arquette, Ian J. Davis, Erin E. Fogle,
Transportation Research Center, Inc.
Garrick J. Forkenbrock, NHTSA
and Taylor R. Manahan, 8. Performing No.
Organization Report
9. Performing Organization Name and Address
NHTSA Vehicle Research and Test Center
P.O. Box 37
East Liberty, OH 43319
10. Work Unit No. (TRAIS)
11. Contract or Grant No.
12. Sponsoring Agency Name and Address
National Highway Traffic Safety Administration
1200 New Jersey Avenue SE
Washington, DC 20590
13. Type
Final of Report and Period:
14. Sponsoring Agency Code
15. Supplementary Notes
16. Abstract
This report summarizes an evaluation of five NHTSA draft research test procedures designed to evaluate the test
track performance of light vehicles equipped with advanced driver assistance systems (ADAS): active park assist
(APA), intersection safety assist (ISA), blind spot intervention (BSI), traffic jam assist (TJA), and opposing traffic
safety assist (OTSA). These draft research procedures were released on November 18, 2019, in Docket No.
NHTSA-2019-0102. A 2017 Mercedes-Benz E300 was used as the subject vehicle for the APA tests, whereas a
2019 Audi A6 was used for the ISA, BSD, TJA, and OTSA evaluations.
The tests defined within each draft research test procedure were found to be performable, and all test validity
conditions specified within them were satisfied. That said, addition of a tolerance to specify permissible subject
vehicle or principal other vehicle accelerations during ISA test conditions where the vehicle must be moved from
rest is recommended, as no tolerance is provided in the September 2019 ISA draft research test procedure. Use of
the ±0.05g principal other vehicle acceleration tolerance specified in the October 2019 TJA draft research test
procedure is one option, as the range was used successfully during the lead vehicle decelerates, accelerates, then
decelerates TJA trials described in this report.
17. Key Words:
active park assist, APA, advanced crash avoidance system,
ADAS, blind spot intervention, BSI, traffic jam assist, TJA,
intersection safety assist, ISA, opposing traffic safety assist,
OTSA, draft research test procedure
18. Distribution Statement:
Document is available to the public from the DOT,
BTS, National Transportation Library, Repository
& Open Science Access Portal, rosap.ntl.bts.gov.
19. Security Classif. (of this report)
Unclassified 20. Security Classif. (of this page)
Unclassified 21. No. of Pages
71 22. Price
Form DOT F 1700.7 (8-72) Reproduction of completed page authorized

ii
Table of Contents
List of Figures ................................................................................................................................ v
List of Tables ............................................................................................................................... vii Executive Summary ...................................................................................................................... 1
1 Introduction .............................................................................................................................. 4
2 Test Protocol ............................................................................................................................. 5
2.1 Subject Vehicles ................................................................................................................ 5
2.1.1 2019 Audi A6........................................................................................................... 5
2.1.2 2017 Mercedes-Benz E300 ..................................................................................... 6
2.2 Principal Other Vehicle ..................................................................................................... 6
2.3 Parked, Lead, and Secondary Other Vehicles ................................................................... 7
2.4 Surrogate Pedestrian .......................................................................................................... 7
2.5 Test Facility ....................................................................................................................... 8
2.5.1 VDA Parking Spaces ............................................................................................... 8
2.5.2 VDA Intersection ..................................................................................................... 8
2.5.3 Skid Pad .................................................................................................................. 9
2.6 Test Equipment .................................................................................................................. 9
2.6.1 Steering Robot ......................................................................................................... 9
2.6.2 Brake and Accelerator Robot................................................................................ 10
2.6.3 Inertial and GPS data ........................................................................................... 10
3 Active Park Assist .................................................................................................................. 11
3.1 Test Scenarios and Assessment Criteria .......................................................................... 13
3.1.1 Active Park Assist Performance Assessment ........................................................ 13
3.1.2 Encroaching Pedestrian Detection Assessment .................................................... 14
3.1.3 Obstructing Vehicle Detection Assessment ........................................................... 15
3.1.4 System Override Assessment ................................................................................. 15
3.1.5 Validity Criteria .................................................................................................... 17
3.2 Results ............................................................................................................................. 18
3.2.1 Active Park Assist Performance Assessment ........................................................ 18
3.2.2 Encroaching Pedestrian Detection Assessment .................................................... 18
3.2.3 Obstructing Vehicle Detection Assessment ........................................................... 19
3.2.4 System Override Assessment ................................................................................. 19
3.3 Conclusions ..................................................................................................................... 20

iii
4 Intersection Safety Assist ....................................................................................................... 21
4.1 Test Scenarios and Assessment Criteria .......................................................................... 21
4.1.1 ISA Scenario 1: POV Straight Across SV Path ..................................................... 21
4.1.2 ISA Scenario 2: POV Left Turn Across SV Path................................................... 22
4.1.3 ISA Scenario 3: SV Left Turn Across POV Path................................................... 23
4.1.4 ISA Sub-Scenarios ................................................................................................. 23
4.1.5 Validity Criteria .................................................................................................... 24
4.2 Test Results ..................................................................................................................... 25
4.2.1 ISA Scenario 1: POV Straight Across SV Path ..................................................... 25
4.2.2 ISA Scenario 2: POV Left Turn Across SV Path................................................... 26
4.2.3 ISA Scenario 3: SV Left Turn Across POV Path................................................... 27
4.2.4 SV and POV Acceleration Assessment .................................................................. 28
4.3 Conclusions ..................................................................................................................... 28
5 Blind Spot Intervention ......................................................................................................... 29
5.1 Test Scenarios and Assessment Criteria .......................................................................... 29
5.1.1 BSI Scenario 1: SV Lane Change With Constant Headway ................................. 29
5.1.2 BSI Scenario 2: SV Lane Change With Closing Headway Scenario .................... 30
5.1.3 BSI Scenario 3: SV Lane Change With Constant Headway, False Positive Assessment ....................................................................................................................... 31
5.1.4 Validity Criteria .................................................................................................... 33
5.1.5 Performance Criteria ............................................................................................ 34
5.2 Test Results ..................................................................................................................... 34
5.3 Conclusions ..................................................................................................................... 35
6 Traffic Jam Assist .................................................................................................................. 36
6.1 Test Scenarios and Assessment Criteria .......................................................................... 36
6.1.1 Lead Vehicle Decelerates Accelerates Then Decelerates ..................................... 36
6.1.2 Suddenly Revealed Stopped Vehicle ..................................................................... 37
6.1.3 Lead Vehicle Lane Change With Braking ............................................................. 38
6.1.4 Validity Criteria .................................................................................................... 39
6.2 Test Results ..................................................................................................................... 39
6.2.1 Lead Vehicle Decelerates Accelerates Then Decelerates ..................................... 40
6.2.2 Suddenly Revealed Stopped Vehicle ..................................................................... 40
6.2.3 Lead Vehicle Lane Change With Braking ............................................................. 41
6.3 Conclusions ..................................................................................................................... 45

iv
7 Opposing Traffic Safety Assist .............................................................................................. 46
7.1 Test Scenarios and Assessment Criteria .......................................................................... 46
7.1.1 OTSA Scenario 1: Unintended Lateral Deviation, No SV Turn Signal, Manual Steering ............................................................................................................................ 47
7.1.2 OTSA Scenario 2: Intentional Lateral Deviation, Turn Signal, Manual Steering 50
7.1.3 OTSA Scenario 4: False Positive Assessment, Manual Steering .......................... 52
7.1.4 Validity Criteria .................................................................................................... 55
7.1.5 Performance Criteria ............................................................................................ 55
7.2 Test Results ..................................................................................................................... 56 7.3 Conclusions ..................................................................................................................... 56
8 Overall Concluding Remarks................................................................................................ 57
9 References ............................................................................................................................... 59
10 Appendix ................................................................................................................................... 1 10.1 SV Parking Notifications ................................................................................................... 1
10.2 Time Tolerance .................................................................................................................. 1
10.3 Final Parking Position ....................................................................................................... 1
10.4 Encroaching Pedestrian Detection Assessment ................................................................. 2
10.5 Obstructing Vehicle Detection Assessment ...................................................................... 2
10.6 System Override Assessment ............................................................................................ 2
v
List of Figures
Figure 2-1. 2019 Audi A6 ................................................................................................................5 Figure 2-2. 2017 Mercedes-Benz E300 ...........................................................................................6 Figure 2-3. GST system, shown with GVT revison F .....................................................................6 Figure 2-4. 4activeSystems static pedestrian ...................................................................................7 Figure 2-5. Perpendicular parking spaces on VDA .........................................................................8 Figure 2-6. Parallel parking spaces on VDA ...................................................................................8 Figure 2-7. Intersection on VDA .....................................................................................................9 Figure 2-8. Example robotic steering controller installation .........................................................10 Figure 2-9. Example robotic brake and accelerator controller installation used in SV and LV ....10 Figure 3-1. Mercedes E300 Parking Pilot button...........................................................................11 Figure 3-2. Mercedes E300 parking notification sequence ...........................................................12 Figure 3-3. Perpendicular parking test layout ................................................................................13 Figure 3-4. Parallel parking test layout ..........................................................................................13 Figure 3-5. Perpendicular parking with encroaching pedestrian test layout ..................................14 Figure 3-6. Parallel parking with rear encroaching pedestrian test layout ....................................14 Figure 3-7. Parallel parking with front encroaching pedestrian test layout ...................................15 Figure 3-8. Perpendicular parking with obstructing vehicle test layout ........................................16 Figure 3-9. Parallel parking with obstructing vehicle test layout ..................................................16 Figure 4-1. ISA Scenario 1 crash-imminent (left) and near-miss (right) choreography ................22 Figure 4-2. ISA Scenario 2 crash-imminent (left) and near-miss (right) choreography ................22 Figure 4-3. ISA Scenario 3 crash-imminent (left) and near-miss (right) choreography ................23 Figure 5-1. BSI Scenario 1 overview .............................................................................................29 Figure 5-2. SV path for BSI Scenarios 1 and 2 lane deviations ....................................................30 Figure 5-3. BSI Scenario 1 validity period termination condition 3. .............................................30 Figure 5-4. BSI Scenario 2 overview .............................................................................................31 Figure 5-5. BSI Scenario 3 layout..................................................................................................31 Figure 5-6. SV path for BSI Scenario 3. ........................................................................................32 Figure 5-7. Baseline yaw rate composite and acceptability corridor .............................................32 Figure 5-8. BSI false positive example ..........................................................................................33 Figure 6-1. LVDAD path ...............................................................................................................36 Figure 6-2. LVDAD velocity and acceleration profiles.................................................................37 Figure 6-3. SRSV path ...................................................................................................................37 Figure 6-4. SRSV path profile .......................................................................................................38 Figure 6-5. LVLCB path ................................................................................................................38 Figure 6-6. LVLCB POV path profile ...........................................................................................39 Figure 6-7. GST brake tuning improvement, beginning of day one ..............................................43 Figure 6-8. GST brake tuning improvement, end of day one ........................................................44

vi
Figure 6-9. GST brake tuning improvement, beginning of day two ..............................................44 Figure 6-10. GST brake tuning improvement, end of day two ......................................................45 Figure 7-1. OTSA Scenario 1 test layout .......................................................................................48 Figure 7-2. Robotic steering parameters for unintended lane deviation trials ...............................49 Figure 7-3. OTSA Scenario 1 end validity period conditions .......................................................50 Figure 7-4. OTSA Scenario 2 robotic steering parameters ............................................................50 Figure 7-5. OTSA Scenario 2 test layout .......................................................................................51 Figure 7-6. OTSA Scenario 4 test layout .......................................................................................53 Figure 7-7. OTSA Scenario 4 robotic steering parameters ............................................................54 Figure 7-8. OTSA Scenario 4 end validity period conditions .......................................................54

vii
List of Tables
Table 3-1. Perpendicular Parking Performance Results ................................................................18 Table 3-2. Parallel Parking Performance Results ..........................................................................18 Table 3-3. Encroaching Pedestrian Detection Summary ...............................................................19 Table 3-4. Obstructing Vehicle Detection Results ........................................................................19 Table 3-5. System Override Results ..............................................................................................20 Table 4-1. ISA Vehicle Speed Combinations ................................................................................24 Table 4-2. POV Straight Across SV Path Near-Miss Results .......................................................26 Table 4-3. POV Straight Across SV Path Crash-Imminent Results ..............................................26 Table 4-4. POV Left Turn Across SV Path Near-Miss Results.....................................................26 Table 4-5. POV Left Turn Across SV Path Crash-Imminent Results ...........................................27 Table 4-6. SV Left Turn Across POV Path Near-Miss Results.....................................................27 Table 4-7. SV Left Turn Across POV Path Crash-Imminent Results ...........................................27 Table 4-8. SV and POV Acceleration ............................................................................................28 Table 5-1. BSI Results ...................................................................................................................34 Table 6-1. LVDAD SV Performance Summary ............................................................................40 Table 6-2. LVDAD POV Deceleration Validity Check ................................................................40 Table 6-3. SRSV Test Conduct and SV Performance Summary ...................................................41 Table 6-4. LVLCB SV Performance Summary .............................................................................41 Table 6-5. LVLCB POV Deceleration Validity Check .................................................................42 Table 7-1. OTSA Scenario 1 Parameters .......................................................................................49 Table 7-2. OTSA Scenario 2 Parameters .......................................................................................52 Table 7-3. OTSA Scenario 4 Test Parameters ...............................................................................52 Table 7-4. OTSA results ................................................................................................................56 Table 8-1. Overall ADAS System Performance Results ...............................................................58

1
Executive Summary
The National Highway Traffic Safety Administration has developed a series of draft test procedures to research the test track performance of light vehicles equipped with the advanced driver assistance system (ADAS) technologies: blind spot intervention (BSI); active park assist (APA), intersection safety assist (ISA), opposing traffic safety assist (OTSA); and traffic jam assist (TJA) (NHTSA, 2019a; 2019b; 2019c; 2019d; 2019e). These draft research procedures were released on November 18, 2019, in Docket No. NHTSA-2019-0102. In the case of APA, BSI, and TJA, the draft procedures are updates to those first available within Docket No. NHTSA-2018-0027. The ISA and OTSA were not previously available (i.e., available for the first time within Docket No. NHTSA-2019-0102).
The objective of the work described in this report was to demonstrate the performability of the latest draft research test procedures. This work follows the previously performed exploratory research used to develop, test, and scrutinize early versions of each draft procedure, and was used to evaluate technical recommendations provided within the test reports documenting the earlier work (Davis & Forkenbrock, in press; Fogle et al., in press; Fogle et al., in press; Manahan & Forkenbrock, in press). For APA testing described in this report, a 2017 Mercedes-Benz E300 was used as the subject vehicle (SV). A 2019 Audi A6 was used as the SV during the evaluation of the other draft research test procedures.
The APA draft research test procedure, dated August 2019,1 is designed to evaluate how an APA system performs an automated parking maneuver into both perpendicular and parallel parking spaces in different scenarios (NHTSA, 2019b). The tests described in this draft procedure were used to assess parking performance, encroaching pedestrian detection, obstructing vehicle detection, and how the system responds to a manual override of the steering wheel, brake pedal, and accelerator pedal during the automated parking maneuver. During each trial, the SV is driven in the center of an approach lane, at 6 mph (9.7 km/h) until the desired parking space is identified. In all cases, the desired parking space is defined by pavement markings and two parked vehicles on either side of it. After bringing the SV to a stop, the driver initiates the automated parking function in accordance with the in-vehicle instructions presented by the system within 5 seconds. For the tests where the SV attempts to park, completion of the maneuver occurs when the APA system first notifies the driver that the parking maneuver is complete. For the manual override tests, the driver applies an input within 500 ms after the initial (automated) clockwise steering is begins. The Mercedes E300 satisfied all parking performance criteria except that once parked, it was more than 12 in. (0.3 m) from the inboard parking space lines. During encroaching pedestrian detection tests, the SV aborted the test during both parallel scenarios to avoid impacting the simulated pedestrian (a stationary mannequin). In the perpendicular scenario, the SV contacted the pedestrian on the first attempt to back into the desired parking space, pulled forward away from the pedestrian, and then continued its parking attempt for 122.6 seconds before aborting the maneuver. During the obstructing vehicle detection tests, the SV avoided the obstructing vehicle by aborting the parking maneuver. The SV did not meet the performance criteria defined in the APA draft research test procedure for any of the system override assessment tests. During the conduct of these trials, the SV either failed to abort the maneuver at the correct time, or it failed to stop the SV after aborting the maneuver. Overall,
1 The draft research test procedure document dates relate closer to when the respective document was written than the date it was first made publicly available.

2
the APA draft research test procedure was performed as specified, and no changes to improve performability were required.
The September 2019 ISA draft research test procedure (NHTSA, 2019c) is designed to evaluate how a ISA system responds to a principal other vehicle (POV) that approaches the SV within a four-way intersection using crash-imminent or near-miss timing. Three test scenarios are specified: POV straight across SV path test, POV left turn across SV path, and SV left turn across POV path. During the tests performed with crash-imminent timing, the SV will impact the POV if the ISA system does not intervene. With near-miss timing, the SV narrowly misses the POV so as to assess whether the system responds to situations where it is not required to do so. Although the ISA draft test procedure specifies an SV test speed of up to 25 mph (40.2 km/h), the Audi A6 ISA system is only designed to operated at speeds up to 6.2 mph (10 km/h). For this reason, all ISA tests described in this report were performed just below this threshold at 6 mph (9.7 km/h). Even with this speed adjustment, the SV ISA system only intervened during one test condition performed with crash-imminent timing (the POV straight across SV path scenario where the SV accelerated into the intersection from rest). No ISA warnings or interventions occurred during any trial performed with near-miss choreography. Overall, except for the need to reduce the SV test speed to accommodate the SV, and the POV speed to preserving most of the intended SV-to-POV choreography, the ISA draft research test procedure was performed as specified, including all test validity criteria, and no changes to improve performability were required. That said, addition of a tolerance to specify permissible SV and POV accelerations during scenarios where the vehicle must be moved from rest is recommended, as no tolerance is provided in the September 2019 ISA draft research test procedure. Use of the ±0.05g POV acceleration values specified in the October 2019 TJA draft research test procedure is one option, as the range was used successfully during the lead vehicle decelerates, accelerates, then decelerates trials described in this report.
The July 2019 BSI draft research test procedure (NHTSA, 2019a) is designed to evaluate how a BSI system responds to driving situations where the POV is operated within or near the rear SV blind zone. Three test scenarios are specified, two performed with crash-imminent timing expected to ellicit a BSI response, and a false positive assessment where no BSI intervention is necessary. The first scenario, SV lane change with constant headway, is used to evaluate how a BSI system responds to a POV residing within the SV blind spot, in an adjacent lane, during an SV lane change. The second scenario, SV lane change with closing headway, is used to observe the BSI system response to a POV that approaches the SV blind spot, in an adjacent lane, during an SV lane change. The third scenario, constant headway false positive assessment, is used to assess if/how the BSI system will respond to a non-threatening vehicle during a full lane change in which there is no potential for a collision. No BSI activations were apparent during the tests described in this report regardless of test scenario, and both crash-imminent trials resulted in the SV impacting the side of the POV. That said, a post-test review of the SV operator’s manual revealed that the BSI system was likely not active (i.e., properly enabled) during these tests due to lane departure system being turned off.2 Overall, the BSI draft research test procedure was performed as specified, including all test validity criteria, and aside from taking steps to better 2 To avoid having the operation one safety system from confounding that of another during the agency’s research, NHTSA typically performs its ADAS test trials with only the technology of interest enabled. In the case of the Audi A6, it is believed that this likely prevented the BSI from being activated, and emphasizes the importance of understanding how an ADAS is expected to operate before tests are performed. In addition to a careful review of the vehicle’s operator’s manual, this may also require direct consultation with the vehicle manufacturer.

3
ensure the vehicle’s ADAS settings were appropriately configured, no changes to improve performability were required.
The October 2019 TJA draft test procedure (NHTSA, 2019e) is designed to evaluate how an TJA system responds to three low speed car-following and crash-imminent driving scenarios. All TJA tests are performed with the SV being driven in automation level 2, where its lateral and longitudinal control are simulaneously maintained by the vehicle for the duration of each test trial. The first scenario, lead vehicle decelerates, accelerates, then decelerates (LVDAD), is used to evaluate the TJA system’s ability to detect and respond to a POV being driven ahead of the SV with changing speeds. The second scenario, suddenly revealed stopped vehicle (SRSV), is used to assess the TJA system’s ability to detect and respond to a stationary POV that is suddenly revealed after a secondary other vehicle (SOV) being driven ahead of the SV steers around it. The third scenario, lead vehicle lane change with braking (LVLCB), is used to evaluate the TJA system’s ability to detect and respond to a moving POV that brakes during and/or after performing a lane change into a space between the SV and SOV. For the tests described in this report, the Audi A6 avoided the POV during each LVDAD and SRSV scenario test trial, and all validity requirements specified in the TJA draft research test procedure were satisfied. Of the six LVLCB trials performed, one resulted in an SV-to-POV impact (during the 25 mph [40.2 km/h] test performed with a post-lane change POV deceleration of 0.5 g). Overall, the October 2019 TJA draft research test procedure was performed as specified, and no changes to improve performability were required.
The September 2019 OTSA draft research test procedure (NHTSA, 2019d) is designed to evaluate how an OTSA system responds to driving situations where the SV heading is directed towards a POV travelling in the opposite direction. Three crash-imminent assessments where the POV is operated in an adjacent lane are specified: unintended lane deviation (Scenario 1), intended lane deviation (Scenario 2), and automated lane deviation (Scenario 3). Additionally, two false positive assessments where the POV is operated two lanes away from the SV are defined (Scenarios 4 and 5). The OTSA draft research test procedure states that Scenarios 1, 2, and 4 lane deviations are to be performed manually (i.e., robotically controlled), whereas those used during Scenario 3 and 5 are to be performed by the vehicle’s automatic lane change function. Since the Audi A6 was not equipped with technology to perform automated lane changes, an evaluation of Scenarios 3 and 5 was not possible. The Audi A6 was also not equipped with an OTSA system, therefore no OTSA activations were expected or observed during the tests described in this report. That said, the scenarios that were tested were able to be performed as described in the OTSA draft test procedure, including all test validity criteria, and no changes to improve performability were required.

4
1 Introduction The objective of the work described in this report was to demonstrate the performability of five draft test procedures developed by NHTSA to research advanced driver assistance system (ADAS) technologies. Specifically, this assessment was intended to demonstrate the tests described in each draft procedure could be performed as written, without ambiguity or discrepancy. The technologies discussed include:
• Active Parking Assist – a system designed to identify parking spaces capable of accommodating a driver’s vehicle and, with minimal-to-no input from the driver, that automatically provides the driver with control input assistance to maneuver the vehicle into the space without colliding into other objects or pedestrians.
• Intersection Safety Assist – a system whose interventions are designed to help the driver avoid an intersection-based collision with another vehicle that is approaching, or has entered, the forward path of their vehicle. ISA interventions are expected to be automatically initiated brake activations, however steering-based (or some combination of braking and steering) may also be possible.
• Blind Spot Intervention – a system whose interventions are designed to help the driver avoid a collision with another vehicle that is approaching, or being operated within, the blind spot of their vehicle in an adjacent lane. BSI interventions are automatically initiated and adjust the vehicle’s heading via brake- and/or steering-based activations.
• Traffic Jam Assist – a system designed to automatically control the lateral position of the SV within its travel lane while simultaneously and automatically establishing and maintaining a constant longitudinal headway behind the vehicle immediately ahead of it at speeds up to 25 mph (40.2 km/h).
• Opposing Traffic Safety Assist – a system designed to bring a driver’s vehicle back into the original travel lane after a path deviation causes it to move towards an oncoming vehicle driven in an adjacent lane. OTSA interventions are automatically initiated and adjust the vehicle’s heading via brake- and/or steering-based activations.
NHTSA developed the draft test procedures for research purposes; to provide a documented process by which system operation and effectiveness can be objectively assessed. These draft research procedures were released on November 18, 2019, in Docket No. NHTSA-2019-0102. In the case of APA, BSI, and TJA, the draft procedures are updates to those first available within Docket No. NHTSA-2018-0027. The ISA and OTSA were not previously available (i.e., available for the first time within Docket No. NHTSA-2019-0102).
The objective of the work described in this report was to assess the performability of the latest draft research test procedures. General test protocol and test scenario descriptions, draft assessment criteria, and test results for each technology assessment are included. This work follows the previously performed exploratory research used to develop, test, and scrutinize early versions of each draft procedure, and was used to evaluate technical recommendations provided within the test reports documenting the earlier work (Davis & Forkenbrock, in press; Fogle et al., in press; Fogle et al., in press; Manahan & Forkenbrock, in press).

5
2 Test Protocol The section outlines the subject vehicles, principal other vehicle, secondary other vehicles, and surrogate pedestrian used in this assessment.
2.1 Subject Vehicles Since the objective of the work described in this report was to demonstrate the performability of the draft research test procedures (i.e., whether the tests can be accurately and efficiently performed per the specifications described therein), only one SV was used per test procedure evaluated. A 2019 Audi A6, subsequently referred to as the Audi A6, was used as the SV for all test procedure assessments except APA since the vehicle was not so-equipped. The Audi A6 was also not equipped with OTSA, however unlike APA, the SV need not be equipped with OTSA to demonstrate performability of the draft research test procedure.3 For the APA assessment, a 2017 Mercedes-Benz E300, subsequently referred to as the Mercedes E300 for brevity, was used as the SV. Information regarding the technologies evaluated on each vehicle are discussed in their respective sections (3.0 to 7.0). Additional information can be found in the respective owner’s manuals (Audi, 2019; Daimler AG, 2017).
2.1.1 2019 Audi A6 The Audi A6 (Figure 2-1) was the main SV used for this assessment. The vehicle was equipped with the driver assistance package that included adaptive cruise assist, lane departure warning, Audi Pre-Sense, and Intersection Assistant.
Figure 2-1. 2019 Audi A6
3 OTSA is an active crash avoidance technology that briefly intervenes if it determines a head-on crash is imminent. APA is used to automatically park the SV. The OTSA draft research test procedure can still be performed with a vehicle not equipped with OTSA, but there will be no automatically initiated crash avoidance intervention. If a vehicle is not equipped with APA, the APA test draft research test procedure cannot be performed.

6
2.1.2 2017 Mercedes-Benz E300 The Mercedes E300 (Figure 2-2) was only used as the SV for the APA assessment. The Mercedes E300 is an all-wheel drive, 4-door passenger car equipped with APA and other active safety technologies.
Figure 2-2. 2017 Mercedes-Benz E300
2.2 Principal Other Vehicle The POV used for each test trial was an AB Dynamics (ABD) Guided Soft Target (GST) system. The GST system used for the evaluations described in this report (Figure 2-3) was comprised of a Low-Profile Robotic Vehicle (LPRV) and a “revision F” Global Vehicle Target (GVT). The LPRV is a robotic platform and can be safely driven over by the SV during crash-imminent scenarios. The GVT is secured to the top of the LPRV with Velcro and is designed to look as close to a real vehicle as possible to the sensors used by ADAS systems including radar (24 and 76-77 GHz), cameras, and lidar. The GVT consists of foam panels and skins designed to separate upon impact. Extensive collaborative research was performed from 2015 to 2018 to significantly improve how realistic the GST system appears to ADAS systems, and its specifications are documented (Euro NCAP Secretariat, 2018). The GST system provides accurate closed-loop control of the POV relative to the SV, and is strikeable from any approach aspect.
Figure 2-3. GST system, shown with GVT revison F

7
2.3 Parked, Lead, and Secondary Other Vehicles Some test conditions required vehicles in addition to the SV and POV. The role of these vehicles is discussed within the respective section of this report, where applicable.
• For the APA tests, the following parked vehicles (PV)4 were positioned in the parking spaces adjacent to the desired SV parking space.
o 2017 BMW 540i: 194.6” X 73.5” (494.3 cm X 186.7 cm)
o 2017 Tesla Model S 90D: 196.0” X 77.3” (497.8 cm X 196.3 cm)
o 2018 Cadillac CT6: 204.1” X 74.0” (518.4 cm X 188.0 cm)
• For OTSA tests, a 2019 Ford Fusion or a 2017 Volvo S90 was used as the lead vehicle (LV).
• For TJA tests, a 2019 Ford Fusion was used as the secondary other vehicle (SOV).
2.4 Surrogate Pedestrian A 4activeSystems static pedestrian was used as the surrogate pedestrian test mannequin, subsequently referred to as the PED for brevity, for all tests requiring a simulated pedestrian. This PED is a 50th percentile adult-male-sized static (non-articulating) posable mannequin designed to appear realistic to the sensors used by ADAS systems including radar (24 and 76-77 GHz), cameras, and lidar. Appropriate reflective characteristics are achieved by using specific treatments to the PED skin surfaces, clothing, and test apparatus.
Figure 2-4. 4activeSystems static pedestrian
The PED is secured to a shallow platform using magnets, which is accurately pulled along a pre-programmed path using closed loop control relative to the SV. If hit by the SV, the PED is typically pushed off and away from the platform, which is then pushed against the ground and stops as the test vehicle is driven over it. The PED can be repeatedly struck from any approach 4 NHTSA’s August 2019 draft APA test procedure specifies that PVs shall be between 175 to 197 in (455 to 500 cm) long and 70 to 76 in (178 to 193 cm) wide (NHTSA, 2019b). While some of the PVs used did not fall within this range, it is not believed to have confounded test results. This is because the PVs on either side of the SV’s desired parking space were positioned so that their nearest side was 1 ft (0.3 m) away from the near edge of the parking space lines. Therefore, the size of the SV’s desired parking space was kept constant regardless of PV dimensions.

8
angle without harm to those performing the tests or the vehicles being evaluated. Reassembly and securing the PED back to top of the platform takes one person approximately 1 minute to complete. The PED and platform are shown in Figure 2-4.
2.5 Test Facility All tests were performed at the Transportation Research Center, Inc., in East Liberty, Ohio. Three facilities at TRC were used to perform the lower level automation test procedure assessment.
• Vehicle Dynamics Area (VDA) parking spaces
• VDA intersection
• Skid pad
2.5.1 VDA Parking Spaces The VDA parking spaces were used for APA evaluations. The VDA parking spaces facility consists of two separate areas; one area with five perpendicular parking spaces and one area with five parallel parking spaces, shown in Figure 2-5 and 2-6, respectively. The perpendicular and parallel parking spaces meet the dimensional requirements specified in NHTSA’s June 2019 APA draft research test procedure (NHTSA, 2019b).
Figure 2-5. Perpendicular parking spaces on VDA
Figure 2-6. Parallel parking spaces on VDA
2.5.2 VDA Intersection A depiction of the intersection used for the ISA tests described in this report is presented in Figure 2-7. This intersection has a four-way configuration and is designed to support two roads, each with two lanes of travel (one in each direction), intersecting perpendicularly. The lines used to delineate each lane and to define the intersection meet Federal Highway Administration

9
(FHWA) specifications as defined in the Manual on Uniform Traffic Control Devices (FHWA, 2012). The intersection was defined by solid white edge lines, solid white stop bars, and yellow center lines. For the 98 ft (30 m) leading up to the intersection stop bar, the yellow centerline was a double yellow line. The yellow centerline was a single dashed line for the remainder of each lane. The width of the lane lines was 10 to 15 cm (4 to 6 in).
Figure 2-7. Intersection on VDA
2.5.3 Skid Pad The skid pad is a long, straight-road facility. The main portion of the skid pad is 3,281 ft (1 km) long and 6 lanes wide. The lanes are approximately 14 ft (4.3 m) wide, and are separated by either a solid or dashed white line.
2.6 Test Equipment The main test equipment used in the SV consisted of an ABD steering robot, an ABD brake and throttle controller, and an Oxford Technical Solutions RT and Range system.
2.6.1 Steering Robot Where applicable, an ABD SR15 Orbit steering robot was installed in the SV to accurately and repeatedly achieve and/or maintain the lateral path. The SR15 Orbit, shown in Figure 2-8, is a lightweight, low torque module that mounts to the steering wheel without having to remove the airbag. It can be programmed to operate in open or closed loop, and can return manual steering back to the driver should they need to resume control of the vehicle. The steering robot was not used in the SV for APA or TJA testing.

10
Figure 2-8. Example robotic steering controller installation
2.6.2 Brake and Accelerator Robot For tests where adaptive cruise control (ACC) was not used and closed loop longitudinal control was needed an ABD CBAR600 brake and accelerator robot was used (see Figure 2-9). The robot was attached to the lower front edge of the driver’s seat, and was used to modulate the brake and accelerator pedals. The brake and accelerator robot was not used in the SV for APA, BSI, TJA, or OTSA testing.
Figure 2-9. Example robotic brake and accelerator controller installation used in SV and LV
2.6.3 Inertial and GPS data All vehicles used in testing were instrumented with Oxford Technologies RT 3002 units that provide highly accuracy inertial and GPS data (which was differentially corrected). Paired with an Oxford Technologies Range S system, relative ranges and velocities between the SV, POV, and SOV (where applicable) were also collected.

11
3 Active Park Assist The Mercedes E300 was used as the SV for the APA tests described in this report. Specifically, the vehicle was evaluated using NHTSA’s August 2019 APA draft research test procedure (NHTSA. 2019b).
The Mercedes E300 APA system, called Parking Pilot, controls accelerator, brake, steering, and gear selection during the parking maneuver (Daimler AG, 2017). To use Parking Pilot, the driver presses the Parking Pilot button shown in Figure 3-1.
Parking Pilot
Figure 3-1. Mercedes E300 Parking Pilot button
Once activated, the system scans for parking spaces large enough to accommodate the vehicle. When a suitable space is found, the APA system instructs the driver to stop the vehicle and displays instructions on the vehicle’s infotainment system to guide them through the parking process. Once the APA system has completed the parking maneuver, it brings the vehicle to a stop and notifies the driver that the maneuver is complete. Pictures of these notifications are shown in Figure 3-2.

12
Step 1 (detection)
Step 2
Step 3
Step 4
Step 5 (completion)
Figure 3-2. Mercedes E300 parking notification sequence

13
3.1 Test Scenarios and Assessment Criteria Brief descriptions of the scenarios, validity criteria, and evaluation criteria used for the tests described in this report are provided in sections 3.1.1 to 3.1.4; additional details can be found in the APA draft research test procedure. All tests were performed with an approach speed of 6 mph (9.7 km/h). One valid trial per test condition was performed.
3.1.1 Active Park Assist Performance Assessment The APA performance assessment tests are designed to evaluate how well an APA system performs an automated parking maneuver in both perpendicular and parallel parking spaces. The test layout geometry for the perpendicular and parallel scenarios are given in Figures 3-3 and 3-4, respectively.
Figure 3-3. Perpendicular parking test layout
Figure 3-4. Parallel parking test layout

14
3.1.2 Encroaching Pedestrian Detection Assessment The encroaching pedestrian tests are designed to evaluate how an APA system responds to a pedestrian that encroaches into the SV’s desired parking space while the perpendicular or parallel parking maneuver is performed. The PED described in Section 2.4 is used as the surrogate pedestrian mannequin for these tests. The test layout geometry for the perpendicular tests performed with the PED is shown in Figure 3-5. Parallel tests are performed with the PED encroaching into both the front and back of the parking space. The test layout geometry for the rear and front encroaching parallel tests are given in Figures 3-6 and 3-7, respectively.
Figure 3-5. Perpendicular parking with encroaching pedestrian test layout
Figure 3-6. Parallel parking with rear encroaching pedestrian test layout
15
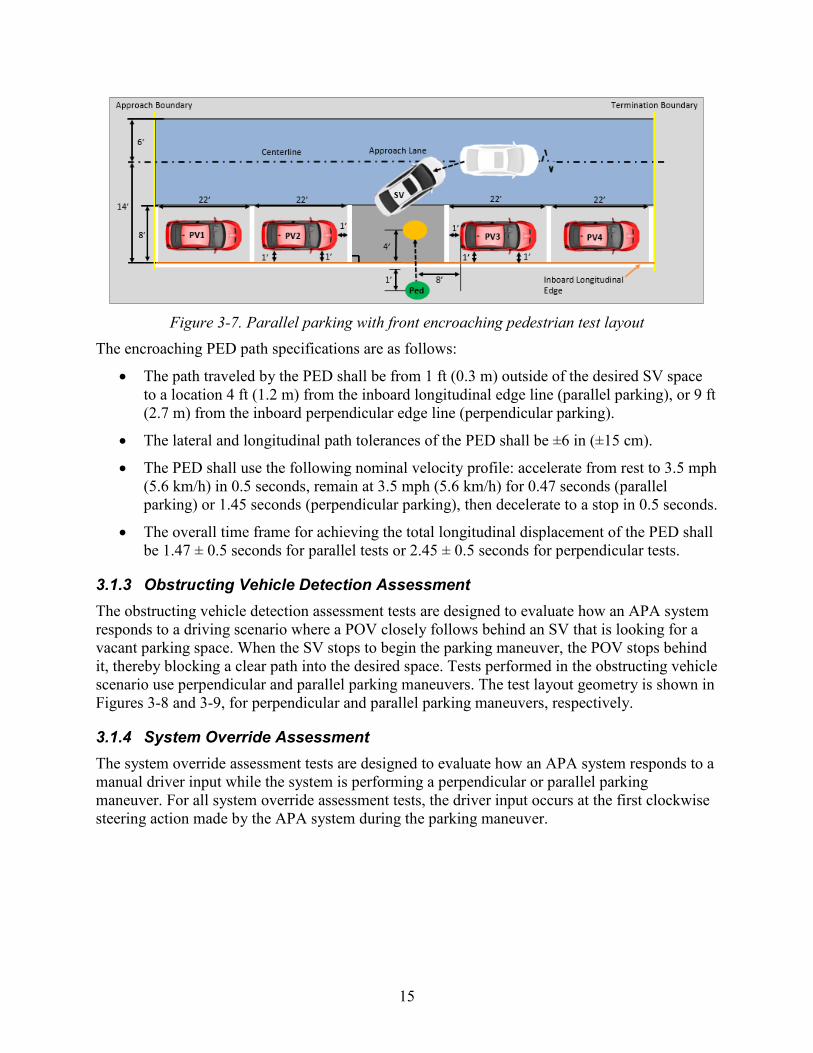
Figure 3-7. Parallel parking with front encroaching pedestrian test layout
The encroaching PED path specifications are as follows:
• The path traveled by the PED shall be from 1 ft (0.3 m) outside of the desired SV space to a location 4 ft (1.2 m) from the inboard longitudinal edge line (parallel parking), or 9 ft (2.7 m) from the inboard perpendicular edge line (perpendicular parking).
• The lateral and longitudinal path tolerances of the PED shall be ±6 in (±15 cm).
• The PED shall use the following nominal velocity profile: accelerate from rest to 3.5 mph (5.6 km/h) in 0.5 seconds, remain at 3.5 mph (5.6 km/h) for 0.47 seconds (parallel parking) or 1.45 seconds (perpendicular parking), then decelerate to a stop in 0.5 seconds.
• The overall time frame for achieving the total longitudinal displacement of the PED shall be 1.47 ± 0.5 seconds for parallel tests or 2.45 ± 0.5 seconds for perpendicular tests.
3.1.3 Obstructing Vehicle Detection Assessment The obstructing vehicle detection assessment tests are designed to evaluate how an APA system responds to a driving scenario where a POV closely follows behind an SV that is looking for a vacant parking space. When the SV stops to begin the parking maneuver, the POV stops behind it, thereby blocking a clear path into the desired space. Tests performed in the obstructing vehicle scenario use perpendicular and parallel parking maneuvers. The test layout geometry is shown in Figures 3-8 and 3-9, for perpendicular and parallel parking maneuvers, respectively.
3.1.4 System Override Assessment The system override assessment tests are designed to evaluate how an APA system responds to a manual driver input while the system is performing a perpendicular or parallel parking maneuver. For all system override assessment tests, the driver input occurs at the first clockwise steering action made by the APA system during the parking maneuver.

16
Figure 3-8. Perpendicular parking with obstructing vehicle test layout
Figure 3-9. Parallel parking with obstructing vehicle test layout Three different types of override maneuvers are performed:
1. Steering override
2. Accelerator pedal override
3. Brake pedal override or manual timeouts
For the steering and accelerator pedal override assessments, the SV driver applies either a steering wheel torque or accelerator pedal input to see if the APA system will stop automatically in response to the driver input. If the APA system automatically controls braking during the parking maneuver, brake pedal override assessment is performed. This involves the SV driver applying the brake pedal to see if the APA system will stop automatically in response to the driver input. If the APA system does not automatically control braking during the parking maneuver, manual timeout assessments are performed. This involves the SV driver braking the vehicle to a stop and waiting to see if the APA system will time out after being stopped for >5 seconds.

17
3.1.5 Validity Criteria The validity criteria described in the APA draft research test procedure were assessed for each trial performed in this study. These criteria included test tolerances for the initial SV approach by the parking space, SV driver response times, and other scenario-specific validity criteria for the individual trials.
SV lane position and speed test tolerances were confirmed within an interval ranging from one second prior to the front most part of the SV crossing the approach boundary until either (1) the onset of the SV driver’s braking in response to receiving the parking space detection notification, or (2) 1 second after the rearmost part of the SV crossed the termination boundary, which is shown in Figures 3-2 to 3-8 above.
During the approach:
• The SV remained in the center of the approach lane ±1 ft (±0.3 m); and
• The SV speed was 6 ±1.0 mph (9.7 ±1.6 km/h).
An acceptable SV driver response time was confirmed for the following instances within a given trial, where applicable.
• The accelerator pedal was released, and SV driver stopped the vehicle (1) within 5 seconds of receiving the parking detection notification, or (2) before the rearmost part of the SV crossed the termination boundary.
• The SV driver initiated the automated parking function within 5 seconds of receiving the in-vehicle instructions.
• The SV driver released manual control of any automated portions of the parking maneuver (gear selector, steering, brake pedal, and accelerator pedal inputs) within 5 seconds of being prompted to do so.
• The SV driver made gear selection changes within 3 seconds of a request.
• The SV driver made accelerator pedal and/or brake pedal applications within 2 seconds of a request.
For encroaching pedestrian detection assessments:
• The PED achieved the desired longitudinal displacement in 1.47 ±0.5 s for parallel tests and 2.45 ±0.5 s for perpendicular tests; and
• The PED began moving within 1s after the SV first began to move backwards.
For obstructing vehicle detection assessments:
• Until the SV came to a stop after detecting a desired space, the POV followed the SV at a headway of 6 ft ±6 in (1.8 m ±15 cm) and a lateral offset of 3 ft ±6 in (0.9 m ±15 cm); and
• The POV was stationary as the APA system performed the rest of the parking maneuver.
For system override assessments:
• Steering, accelerator pedal, and brake pedal overrides were applied within 500 ms after the initial CW steering reversal was initiated.

18
3.2 Results Sections 3.2.1, 3.2.2, 3.2.3, and 3.2.4 provide results for the SV parking performance, encroaching pedestrian, obstructing vehicle, and system override evaluations, respectively. Within the summary tables provided in each section, the following descriptive conventions are used.
• Test results that did not satisfy the performance criteria stated in the APA draft researchtest procedure are highlighted in red text.
• In sections 3.2.2 through 3.2.4, trials that satisfied all applicable performance criteria arelabelled “met criteria” (MC). Trials that did not are labelled “did not meet criteria”(DNMC), and the criteria that were not met are noted.
3.2.1 Active Park Assist Performance Assessment Parking performance results for the perpendicular and parallel parking trials are provided in Tables 3-1 and 3-2, respectively. The perpendicular trial met all performance criteria specified in the APA draft research test procedure except that the rear bumper was more than 12 in. (0.3 m) away from the parking space line. The parallel trial met all performance criteria except that the right-side tires of the SV were more than 12 in. (0.3 m) away from the parking space line.
Table 3-1. Perpendicular Parking Performance Results
Duration (s) (must be ≤ 45)
Front Left Tire to PV2
(must be ≥ 12 in.)
Rear Left Tire to PV2
(must be ≥ 12 in.)
Front Right Tire to PV3
(must be ≥ 12 in.)
Rear Right Tire to PV3
(must be ≥ 12 in.)
Rear Bumper to Line
(must be ≤ 12 in.)
41.1 32.4 in (82.4 cm)
34.5 in (87.6 cm)
31.5 in (80.1 cm)
33.4 in (84.8 cm)
19.1 in (48.6 cm)
Table 3-2. Parallel Parking Performance Results
Duration (s) (must be ≤ 45)
Front Right Tire to Line
(must be ≤ 12 in.)
Rear Right Tire to Line
(must be ≤ 12 in.)
Front Bumper to PV3
(must be ≤ 12 in.)
Rear Bumper to PV2
(must be ≤ 12 in.)
26.5 13.9 in (35.2 cm)
16.3 in (41.3 cm)
53.0 in (134.5 cm)
50.0 in (126.9 cm)
3.2.2 Encroaching Pedestrian Detection Assessment Results of the encroaching pedestrian detection tests are shown in Table 3-3. For both parallel scenarios, the SV aborted the maneuver when it was unable to park due to the presence of the PED. This prevented the SV from impacting the PED, thereby satisfying the performance criteria provided in the APA draft research test procedure. In the perpendicular scenario, the SV contacted the PED (with an impact speed of 0.2 mph, or 0.4 km/h) on the first attempt to back into the spot, and then attempted to park for 122.6 seconds before aborting the maneuver.

19
Table 3-3. Encroaching Pedestrian Detection Summary
Test Condition Minimum Distance Between SV & PED Speed at Impact MC/DNMC
Perpendicular parking; rear PED encroachment
0.0 in1 (0.0 cm)
0.2 mph (0.4 km/h) DNMC
Parallel parking; rear PED encroachment
9.0 in (22.9 cm) N/A MC
Parallel parking; front PED encroachment
9.4 in (23.4 cm) N/A MC
1 SV hit PED and attempted to park for 122.6 seconds before aborting the maneuver, exceeded maximum duration of 45 seconds specified in the test procedure.
3.2.3 Obstructing Vehicle Detection Assessment Results of the obstructing vehicle detection tests are shown in Table 3-4. In all trials the SV aborted the maneuver to avoid an impact with the obstructing vehicle, therefore satisfying the performance criteria stated in the APA draft research test procedure.
Table 3-4. Obstructing Vehicle Detection Results
Test Condition Distance Between SV & POV at Abort MC / DNMC
Perpendicular Parking 6.7 in (17.0 cm) MC
Parallel Parking 3.2 in (8.0 cm) MC
3.2.4 System Override Assessment Results from the system override assessments are shown in Table 3-5. While the SV alerted the driver when a maneuver had been aborted, it did not present the exact language and steps specified by the draft APA test procedure (provided in the Appendix).
The SV APA system did not explicitly satisfy all performance criteria for any of the system override assessments.
• For accelerator overrides, the SV ignored the accelerator input from the driver andcontinued the parking maneuver rather than aborting it.
• For brake overrides, the APA system did not abort the parking maneuver upon brakeapplication by the driver. Rather, the APA system waited until the maneuver had timedout after the vehicle came to a stop from the driver brake application. Despite the SVessentially performing a manual timeout, it was evaluated with the brake overrideassessment since it automatically controls SV braking.
• For steering overrides, the APA system did cancel the maneuver. However, it let thevehicle continue moving in reverse rather than bringing the vehicle to a stop and shiftingthe transmission into park or applying the parking brake.

20
Table 3-5. System Override Results
Override Assessment Perpendicular (MC/DNMC)
Parallel (MC/DNMC)
Accelerator DNMC1 DNMC1
Brake DNMC2 DNMC2
Steering DNMC3 DNMC3
1 APA system ignored accelerator input. 2 APA system did not abort the parking maneuver, it let the driver hold the brake until it timed out.
3 APA system cancelled maneuver but let the vehicle keep moving in reverse rather than stopping the vehicle.
3.3 Conclusions The work described in this chapter demonstrates that the tests described in the August 2019 version of NHTSA’s draft APA test procedure were performable and satisfying the validity criteria associated with each of the other scenario/test condition is possible.
The Mercedes C300 satisfied 5 of 6 perpendicular parking evaluation criteria, and 3 of 5 parallel parking evaluation criteria for the parking performance assessments. The Mercedes C300 avoided SV-to-PED impacts during 2 of 3 encroaching pedestrian tests and avoided SV-to-POV impacts during both obstructing vehicle detection tests. Not all performance criteria were satisfied for each of the three override assessments (i.e., those associated with the accelerator, brake, and steering overrides).

21
4 Intersection Safety Assist The Audi A6 was used as the SV for the ISA tests described in this report. Specifically, the vehicle was evaluated using NHTSA’s September 2019 ISA draft research test procedure (NHTSA, 2019c).
The Audi A6 ISA system, called “Intersection Assistant,” is active at speeds up to 18 mph (29 km/h), and is designed to warn the driver of approaching cross traffic with an audible and visual alert. If the driver does not respond to the alert, the vehicle can automatically issue a brake activation if the vehicle speed is at or below 6.2 mph (10 km/h) in certain circumstances.
4.1 Test Scenarios and Assessment Criteria NHTSA’s The ISA draft research test procedure specifies three test scenarios to objectively assess ISA performance; one straight-crossing path scenario, and two left turn across path scenarios (NHTSA, 2019c). Each scenario was performed with either “crash-imminent” or “near-miss” SV-to-POV choreography. “Crash-imminent” timing was designed to elicit ISA interventions from the SV; if no ISA intervention occurred, an SV-to-POV collision would occur. “Near-miss” timing resulted in the SV narrowly missing the POV to assess whether the system would intervene in situations where it is not required to do so. All tests were performed at the intersection described in section 2.5.2, which was comprised of the dimensions specified in the ISA draft test procedure.
4.1.1 ISA Scenario 1: POV Straight Across SV Path The objective of ISA Scenario 1, shown in Figure 4-1, is to evaluate the ISA system’s ability to detect and respond to a POV driven straight across the SV’s forward path. Although the ISA draft research test procedures includes test conditions where the POV approaches from the right and left sides of the SV, the tests Scenario 1 trials described in this report included right-side approaches only.
For the ISA Scenario 1 tests,
• "Crash-imminent” choreography resulted in the front center of the SV impacting the POVat its longitudinal center point if no SV ISA intervention occurs (see Figure 4-1, left).
• “Near-miss” choreography resulted in the front center of the SV to be located 6.6 ft (2m) behind the rearmost part of the POV when the front center of the SV crosses a verticalplane defined by the side of the POV parallel to the POV longitudinal centerline (seeFigure 4-1, right).

22
SV SV
Figure 4-1. ISA Scenario 1 crash-imminent (left) and near-miss (right) choreography
4.1.2 ISA Scenario 2: POV Left Turn Across SV Path The objective of ISA Scenario 2, shown in Figure 4-2, is to evaluate the ISA system’s ability to detect and respond to a POV that turns left across the SV’s forward path. In this scenario,
Figure 4-2. ISA Scenario 2 crash-imminent (left) and near-miss (right) choreography
• “Crash-imminent” choreography resulted in the front center of the SV impacting the rightfront corner of the POV (see Figure 4-2, left).
• “Near-miss” choreography resulted in the front-most part of the SV reaching a verticalplane defined by the right side of the POV, parallel to the POV longitudinal centerlineonce the POV’s turn has been completed, and the front center of the SV being 6.6 ft (2 m)behind the rearmost part of the POV (see Figure 4-2, right).

23
4.1.3 ISA Scenario 3: SV Left Turn Across POV Path The objective of ISA Scenario 3, shown in Figure 4-3, is to evaluate the ISA system’s ability to detect and respond to a POV while the SV is being steered left across the POV’s forward path. For these tests,
• For ISA Scenario 3 “crash-imminent” choreography resulted in the front center-point ofthe SV impacting the front left corner of the POV (see Figure 4-3, left).
• “Near-miss” choreography resulted in the front-most part of the POV reaching a verticalplane defined by the right side of the SV, parallel to the SV longitudinal centerline oncethe SV’s turn has been completed, and the front center of the POV being 6.6 ft (2 m)behind the rearmost part of the SV (see Figure 4-3, right).
Figure 4-3. ISA Scenario 3 crash-imminent (left) and near-miss (right) choreography
4.1.4 ISA Sub-Scenarios The ISA draft research test procedure specifies three vehicle speed combinations, or “sub-scenarios,” for Scenarios 1 and 2. For ISA Scenario 3, five sub-scenarios are specified. Unless one vehicle is initially at rest, and depending on the sub-scenario, the APA draft research test procedure specifies an initial test speed of up to 25 mph (40.2 km/h) be used by both vehicles.
The Audi A6 ISA system was only capable of automatically applying active brake interventions at speeds up to 6.2 mph (10 km/h). Therefore, to facilitate observation of system operation, and while maintaining the as much of the choreography defined in the ISA draft research test procedure as possible, the maximum speed used for the SV and POV tests described in this report was just below this threshold at 6 mph (9.7 km/h), not the 25 mph (40.2 km/h) specified in the draft test procedure. Also, each ISA scenario only used the three sub-scenarios (Table 4-1).
For ISA sub-scenario A, both vehicles traveled at a constant speed from test onset to completion (or ISA brake intervention). In ISA sub-scenario B, the SV approached the intersection at a constant speed, and the POV accelerated from rest from its respective intersection stop bar while turning left in front of the SV. During ISA sub-scenario C, the POV approached the intersection at a constant speed, and the SV accelerated from rest from its respective intersection stop bar while turning left in front of the SV.

24
Table 4-1. ISA Vehicle Speed Combinations
ISA Sub-Scenario Vehicle Speeds
SV POV
A 6 mph (9.7 km/h)
6 mph (9.7 km/h)
B 6 mph (9.7 km/h)
0 6 mph (0 9.7 km/h)
C 0 6 mph (0 9.7 km/h)
6 mph (9.7 km/h)
4.1.5 Validity Criteria The validity criteria described in the ISA draft research test procedure were assessed for each trial performed in this study, and were comprised of tolerances for vehicle speed, lane and path positions, and SV yaw rate when the vehicle was being driven in a straight line. Checks to insure the driver did not provide unintended inputs were also performed.
All test tolerances are to be met during the validity period. For tests where the SV is initially stopped, the validity period begins 3 seconds before the SV accelerates from rest. For tests where the SV is not initially stopped, the validity period begins 3 seconds before the SV reaches the intersection stop bar located in the SV travel lane. Regardless of whether a test trial is performed with crash-imminent or near-miss SV-to-POV timing, the validity period ends if the SV impacts the POV or 3 seconds after the SV has avoided the SV-to-POV impact.
For each ISA trial described in this report, all validity criteria were satisfied within the applicable validity period. In summary,
• Accelerator pedal position and brake pedal force data confirmed the driver did not pressthe either pedal.
• For tests where the SV and/or POV approached the intersection, the speeds were 6 ± 1mph (9.7 ± 1.6 km/h).
• The SV and POV lane positions and paths were ± 0.8 ft (± 0.25 m) of the desiredspecifications.
• For tests where the SV approached the intersection, the SV yaw rate was 0 ± 1 deg/s.
• For tests where the SV or POV was accelerated from rest, an average value of 0.127 ±0.05g (1.25 ± 0.49 m/s²) was achieved.5
5 The ISA draft test procedure specified that an acceleration of 0.127 g (1.25 m/s2) be used for scenarios where a vehicle accelerates from its respective intersection stop bar, however no tolerance was provided. As it directly effects the ability to achieve the desired SV-to-POV choreography during trials where it is relevant, achieving and maintaining the desired acceleration away from the stop bar is important as discussed in an earlier NHTSA ISA test procedure validation report (Davis & Forkenbrock, in press). For the tests described in the current report, the acceleration tolerance specified in NHTSA’s TJA draft research test procedure, ± 0.05g (0.49 m/s²), was used to assess SV or POV acceleration validity, where applicable (NHTSA, 2019e).

25
To ensure the position-based choreography defined in the ISA draft research test procedure was properly realized during each trial, SV-to-POV proximity assessments are specified at two points in the test timeline.
• A synchronization check that compares the actual position of the vehicles to thattheoretically expected when one of them reached its respective intersection stop bar,6 andthen
• At the time of impact or a near-miss assessment point.
Since all trials where the SV enters the validity period at speed were performed at 6 mph (9.7 km/h), much lower than that specified in the ISA draft research test procedure, the synchronization checks were not performed during analysis of the tests described in this report (the equations, which include constants based on higher speeds than those used for the ISA tests described in this report were therefore not directly applicable). The later proximity assessment was, however, and all trials where no ISA brake intervention occurred were found to be within a ± 0.8 ft (± 0.25 m) test tolerance, which is a range identical to the SV and POV lateral path deviation tolerance assessed during each trial.7
4.2 Test Results Sections 4.2.1, 4.2.2, and 4.2.3 provide results for the ISA Scenario 1, 2, and 3 evaluations performed with the Audi A6, respectively. Sections 4.2.4 presents an assessment of how able the SV and POV could satisfy the TJA-based acceleration tolerance, where applicable.
4.2.1 ISA Scenario 1: POV Straight Across SV Path Results from ISA Scenario 1 near-miss and crash-imminent tests are provided in Tables 4-2 and 4-3, respectively. All validity requirements specified in the ISA draft research test procedurewere satisfied. No ISA interventions where observed during the ISA Scenario 1 tests performedwith near-miss timing. One ISA Scenario 1 test performed with crash-imminent timing producedan ISA intervention (during conduct of ISA sub-scenario C), and that trial concluded with the SVbeing automatically braked to a stop before reaching the POV.
For the near-miss tests, the desired distance of 6.6 ± 0.8 ft (2 ± 0.25 m) was satisfied during each trial, where near-miss distances between 5.8 and 7.2 ft (1.76 and 2.19 m) were observed. For the crash-imminent tests, the desired offset from the intended POV impact point was 0 ± 0.8 ft (0 ± 0.25 m). Similarly, ISA Scenario 1 tests performed with crash imminent timing and no ISA intervention satisfied the specified tolerance of 0 ± 0.8 ft (0 ± 0.25 m), where the offset from desired impact point was 0.6 ft (0.18 m) for both trials.
6 Details pertaining to each synchronization checks differ depending on the test sub-scenario, but conceptually they each endeavor to confirm the SV-to-POV choreography has been realized before an ISA intervention could be expected to occur. 7 The accuracy of SV-to-POV relative positioning can only be assessed from the onset of the validity period to the onset of the SV ISA brake intervention, should it occur. Since these interventions reduce SV speed, they effectively extend the time-to-collision. This affects the pre-crash timeline, and therefore the orientation of SV relative to the POV at the time of impact (if an impact occurs) or at the near miss assessment point. Therefore, the trials described in this report were not deemed non-valid if an ISA brake intervention occurred and the final SV-to-POV orientation was not within ± 0.8 ft (± 0.25 m) of the desired value achievable only when an ISA does not intervene.

26
Table 4-2. POV Straight Across SV Path Near-Miss Results
ISA Scenario
ISA Sub-
Scenario
ISA Warning
ISA Intervention
Speed Reduction Impact
Near-Miss Distance
6.6 ± 0.8 ft
Difference From Desired
6.6 ft
1 A N N N N 7.2 ft (2.19 m)
0.6 (0.18 m)
1 B N N N N 6.4 ft (1.95 m)
-0.2(0.05 m)
1 C N N N N 5.9 ft (1.79m)
-0.7(0.21 m)
Table 4-3. POV Straight Across SV Path Crash-Imminent Results
ISA Scenario
ISA Sub-
Scenario
ISA Warning
ISA Intervention
Speed Reduction Impact
Offset From Desired Impact Point 0 ± 0.8 ft
1 A N N N Y 0.6 ft (0.18 m)
1 B N N N Y 0.6 ft (0.18 m)
1 C Y Y 6.0 mph (9.66 km/h) N N/A
4.2.2 ISA Scenario 2: POV Left Turn Across SV Path Results from the ISA Scenario 2 near-miss and crash-imminent tests are provided in Tables 4-4 and 4-5, respectively. All validity requirements specified in the ISA draft research test procedure were satisfied, and no ISA warnings or brake interventions were observed. For the trials performed with near-miss timing, offsets from the desired near-miss distance ranged from 6.6 to 7.1 ft (2.01 to 2.04 m). For the crash-imminent tests, offsets from desired impact point varied from 0.37 to 0.58 ft (0.11 and 0.18 m).
Table 4-4. POV Left Turn Across SV Path Near-Miss Results
ISA Scenario
ISA Sub-
Scenario
ISA Warning
ISA Intervention
Speed Reduction Impact
Near-Miss Distance
6.6 ± 0.8 ft
Difference From Desired
6.6 ft
2 A N N N N 6.7 ft (2.04 m)
0.2 (0.05 m)
2 B N N N N 7.1 ft (2.16 m)
0.5 (0.16 m)
2 C N N N N 6.6 ft (2.01 m)
0.0 (0.01 m)

27
Table 4-5. POV Left Turn Across SV Path Crash-Imminent Results
ISA Scenario
ISA Sub-
Scenario
ISA Warning
ISA Intervention
Speed Reduction Impact
Offset From Desired Impact Point 0 ± 0.8 ft
2 A N N N Y 0.4 ft (0.13 m)
2 B N N N Y 0.4 (0.11 m)
2 C N N N Y 0.6 ft (0.18 m)
4.2.3 ISA Scenario 3: SV Left Turn Across POV Path Results from the ISA Scenario 3 near-miss and crash-imminent tests are provided in Tables 4-6 and 4-7, respectively. All validity requirements specified in the ISA draft research test procedure were satisfied, and no ISA warnings or brake interventions were observed. For the trials performed with near-miss timing, offsets from the desired near-miss distance ranged from 6.6 to 6.8 ft (2.01 to 2.07 m). For the crash-imminent tests, offsets from desired impact point varied from 0.06 to 0.5 ft (0.02 and 0.15 m).
Table 4-6. SV Left Turn Across POV Path Near-Miss Results
ISA Scenario
ISA Sub-
Scenario
ISA Warning
ISA Intervention
Speed Reduction Impact
Near-Miss Distance
6.6 ± 0.8 ft
Difference From Desired
6.6 ft
3 A N N N N 6.8 ft (2.07 m)
0.3 (0.08 m)
3 B N N N N 6.6 (2.01 m)
0.1 (0.02 m)
3 C N N N N 6.6 ft (2.01 m)
0.1 (0.02 m)
Table 4-7. SV Left Turn Across POV Path Crash-Imminent Results
ISA Scenario
ISA Sub-
Scenario
ISA Warning
ISA Intervention
Speed Reduction Impact
Offset From Desired Impact Point 0 ± 0.8 ft
3 A N N N Y 0.5 ft (0.15 m)
3 B N N N Y 0.3 ft (0.10 m)
3 C N N N Y 0.1 ft (0.02 m)

28
4.2.4 SV and POV Acceleration Assessment The average accelerations from valid trials during which an ISA intervention did not occur are shown in Figure 4-9, and were determined using the method described in the TJA draft research test procedure. For the ISA sub-scenario B tests where the POV (the GST) was accelerated from the stop bar, the average accelerations ranged from 0.119 to 0.130g (1.17 to 1.28 m/s²). For the ISA sub-scenario C tests where an external controller attached to the SV accelerator pedal was used to accelerate the vehicle from the stop bar, the average accelerations ranged from 0.110 to 0.118g (1.08 to 1.15 m/s²). All average accelerations shown in Table 4-8 were within the 0.127 ± 0.05g range used to assess acceleration validity for the tests described in this report.
Table 4-8. SV and POV Acceleration
ISA Scenario Choreography
ISA Sub-Scenario B
ISA Sub-Scenario C
Avg POV Accel Avg SV Accel
1 Near-Miss 0.127 g
(1.25 m/s²) n/a1
Crash-Imminent 0.125 g (1.23 m/s²)
0.115 g (1.13 m/s²)
2 Near-Miss 0.128 g
(1.26 m/s²) 0.110 g
(1.08 m/s²)
Crash-Imminent 0.130 g (1.28 m/s²)
0.117 g (1.15 m/s²)
3 Near-Miss 0.127 g
(1.25 m/s²) 0.112 g
(1.09 m/s²)
Crash-Imminent 0.119 g (1.17 m/s²)
0.118 g (1.15 m/s²)
1An ISA intervention prevented the SV acceleration target from being satisfied.
4.3 Conclusions With the exception of not being able to use nominal test speeds above 6 mph (9.7 km/h), all validity requirements specified in the ISA draft research test procedure were satisfied. No ISA warnings or interventions were observed during any trials performed with near-miss timing. An ISA warning and brake intervention (and subsequent crash avoidance) was observed in 1 of 9 trials performed with crash imminent timing, during a test where the SV is accelerated from rest towards a POV that is crossing straight across its path from the right. For tests requiring the SV or POV to be accelerated from rest, the trials performed in this study demonstrated that average values of 0.127 ± 0.05g are attainable.

29
5 Blind Spot Intervention The Audi A6 was used as the SV for the BSI tests described in this report. Specifically, the vehicle was evaluated using NHTSA’s July 2019 BSI draft research test procedure (NHTSA, 2019a).
The Audi A6 BSI system is a combination of the vehicle’s Side Assist and lane departure warning systems, which also include lane departure warning and exit warning functionality. When activated, the system is designed to automatically steer the vehicle back into the vehicle’s original travel lane in an attempt to help the driver avoid an SV-to-POV impact.8 The Audi BSI system is operational between speeds of 40 to 155 mph (65 to 250 km/h).
5.1 Test Scenarios and Assessment Criteria The BSI draft research test procedure specifies three test scenarios to objectively assess BSI performance. This section describes the test scenarios, validity criteria, and performance criteria used in the BSI evaluation. All tests were performed as described in the draft test procedure unless otherwise stated. Two of the scenarios are performed with “crash-imminent “choreography, and are designed to elicit a BSI response from the vehicle. One scenario is a “false positive” test designed not to elicit a response from the vehicle. All tests were performed with SV speed modulated via the vehicle’s cruise control, while a robotic steering controller was used to maintain the SV’s initial path and to establish the desired SV lane deviations or lane changes. One valid trial per test condition was performed.
5.1.1 BSI Scenario 1: SV Lane Change With Constant Headway BSI Scenario 1 is designed to evaluate the BSI system’s ability to detect and respond to a POV residing in the SV’s blind spot using the choreography shown in Figure 5-1. Initially, the SV and POV are driven in a straight line in their respective lanes at 45 mph (72.4 km/h) and, after a steady state period, the turn signal is activated. One second later, a lane change is initiated by the SV towards the lane line separating the SV and POV.
Figure 5-1. BSI Scenario 1 overview
8 Additional information about the Audi A6 BSI system, and how the vehicle settings must be configured to enable it, is provided in Section 5.2 of this report.

30
The SV followed the path shown in Figure 5-2 using robotic control of the SV steering wheel. To avoid having the effect of a BSI intervention being confounded by robot operation of the steering wheel, robotic control is released within 250 ms of the SV exiting the 2,625 ft (800 m) radius curve during the lane change.
Figure 5-2. SV path for BSI Scenarios 1 and 2 lane deviations A BSI Scenario 1 test trial concludes when:
• When the SV impacted the POV; or
• Five seconds after the SV established a heading away from the POV and was completelywithin its original travel lane; or
• One second after the SV traveled ≥ 1 ft (0.3 m) beyond the inboard edge of the lane lineseparating the SV travel lane from one adjacent and to the right of it (see Figure 5-3).
Figure 5-3. BSI Scenario 1 validity period termination condition 3.
5.1.2 BSI Scenario 2: SV Lane Change With Closing Headway Scenario BSI Scenario 2 is designed to evaluate the BSI system’s ability to detect and respond to a POV approaching the SV blind spot from the rear (see Figure 5-4). For these tests, the POV is driven at a constant speed 5 mph (8 km/h) greater than that of the SV in an adjacent lane with the SV speed at 45 mph (72.4 km/h). Initially, the SV and POV are driven in a straight line in their

31
respective lanes at the desired speeds. After a steady state period and turn signal application, a lane change is initiated by the SV towards the lane line separating the SV and POV. BSI Scenario 2 uses test choreography such that the SV will impact the POV when the front most edge of the POV is 3.3 ft (1 m) in front of the rearmost edge of the SV if no BSI intervention occurs.
Figure 5-4. BSI Scenario 2 overview BSI Scenario 2 uses the robotically controlled SV path previously shown in Figure 5-2. The three end of trial options are also identical to those previously specified for BSI Scenario 1.
5.1.3 BSI Scenario 3: SV Lane Change With Constant Headway, False Positive Assessment
BSI Scenario 3 is designed to assess whether the BSI system detects and responds to a non-threatening POV during a single lane change using the choreography shown in Figure 5-5. For these tests, the POV is driven two lanes to the left of the SV’s initial travel lane with a constant longitudinal offset from the rear of the SV. After a period of steady state driving followed by activation of the SV turn signal, an SV lane change is performed into the open and adjacent lane that initially separates the SV from the POV using the path described in Figure 5-6.
Figure 5-5. BSI Scenario 3 layout
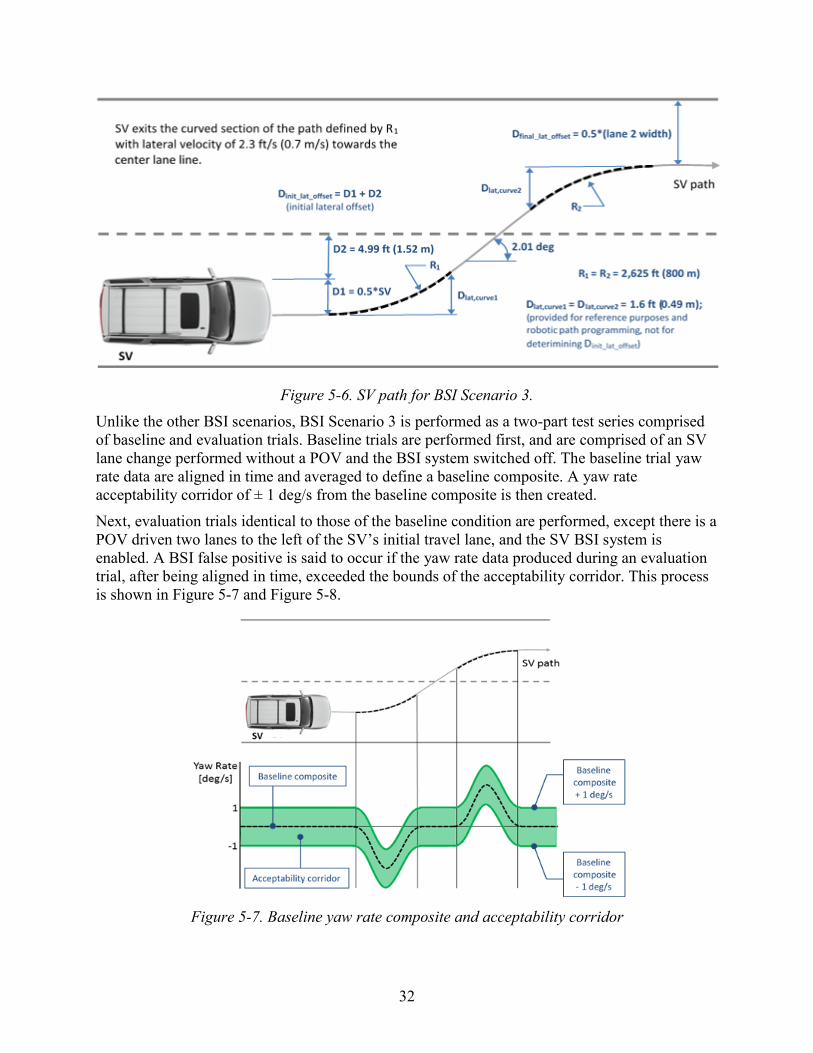
32
Figure 5-6. SV path for BSI Scenario 3. Unlike the other BSI scenarios, BSI Scenario 3 is performed as a two-part test series comprised of baseline and evaluation trials. Baseline trials are performed first, and are comprised of an SV lane change performed without a POV and the BSI system switched off. The baseline trial yaw rate data are aligned in time and averaged to define a baseline composite. A yaw rate acceptability corridor of ± 1 deg/s from the baseline composite is then created.
Next, evaluation trials identical to those of the baseline condition are performed, except there is a POV driven two lanes to the left of the SV’s initial travel lane, and the SV BSI system is enabled. A BSI false positive is said to occur if the yaw rate data produced during an evaluation trial, after being aligned in time, exceeded the bounds of the acceptability corridor. This process is shown in Figure 5-7 and Figure 5-8.
Figure 5-7. Baseline yaw rate composite and acceptability corridor

33
Figure 5-8. BSI false positive example
A BSI Scenario 3 test trial conclusions when one of two times occur:
• Five seconds after the SV has completed the single lane change into the left lane adjacentto the SV’s original travel lane without a BSI intervention; or
• One second after a BSI intervention causes the SV to travel ≥ 1 ft (0.3 m) beyond theinboard edge of the lane line separating the post lane change SV travel lane and oneadjacent and to the right of it (see Figure 5-9).
Figure 5-9. BSI Scenario 3 false positive validity period termination condition 2
5.1.4 Validity Criteria The validity criteria described in the BSI draft research test procedure were assessed for each trial performed in this study, and were comprised of tolerances for vehicle speed, lane position, turn signal activation timing (where applicable), and lane change initiation.
• The SV and POV speeds were desired speed ± 1 mph (72.4 km/h ± 1.6 km/h).
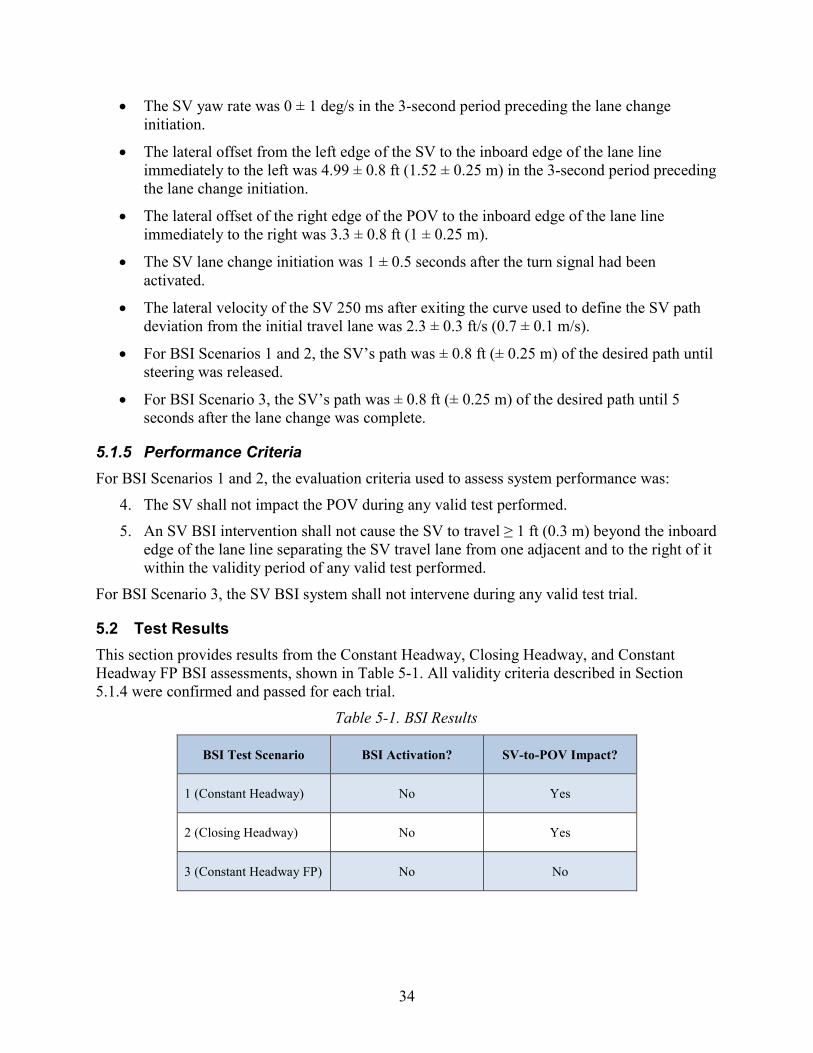
34
• The SV yaw rate was 0 ± 1 deg/s in the 3-second period preceding the lane changeinitiation.
• The lateral offset from the left edge of the SV to the inboard edge of the lane lineimmediately to the left was 4.99 ± 0.8 ft (1.52 ± 0.25 m) in the 3-second period precedingthe lane change initiation.
• The lateral offset of the right edge of the POV to the inboard edge of the lane lineimmediately to the right was 3.3 ± 0.8 ft (1 ± 0.25 m).
• The SV lane change initiation was 1 ± 0.5 seconds after the turn signal had beenactivated.
• The lateral velocity of the SV 250 ms after exiting the curve used to define the SV pathdeviation from the initial travel lane was 2.3 ± 0.3 ft/s (0.7 ± 0.1 m/s).
• For BSI Scenarios 1 and 2, the SV’s path was ± 0.8 ft (± 0.25 m) of the desired path untilsteering was released.
• For BSI Scenario 3, the SV’s path was ± 0.8 ft (± 0.25 m) of the desired path until 5seconds after the lane change was complete.
5.1.5 Performance Criteria For BSI Scenarios 1 and 2, the evaluation criteria used to assess system performance was:
4. The SV shall not impact the POV during any valid test performed.
5. An SV BSI intervention shall not cause the SV to travel ≥ 1 ft (0.3 m) beyond the inboardedge of the lane line separating the SV travel lane from one adjacent and to the right of itwithin the validity period of any valid test performed.
For BSI Scenario 3, the SV BSI system shall not intervene during any valid test trial.
5.2 Test Results This section provides results from the Constant Headway, Closing Headway, and Constant Headway FP BSI assessments, shown in Table 5-1. All validity criteria described in Section 5.1.4 were confirmed and passed for each trial.
Table 5-1. BSI Results
BSI Test Scenario BSI Activation? SV-to-POV Impact?
1 (Constant Headway) No Yes
2 (Closing Headway) No Yes
3 (Constant Headway FP) No No

35
No BSI activations were apparent during the conduct of the two crash-imminent scenario tests, and both trials resulted in an SV side impact with the POV. The false positive assessment did not identify a BSI activation using the method described above, as shown in Figure 5-10.
250 300 350 400 450 500 550
Relative X Position (m)
-3
-2
-1
0
1
2
3
Yaw
Rat
e (d
egre
e/se
c)
Corridor
Trial
Figure 5-10. Scenario 3 false positive assessment (no BSI intervention observed) Note: The BSI tests described in this report were performed with the vehicle’s lane departure warning (LDW) and lane keeping support systems deactivated to prevent their operation from potentially confounding that of the BSI system alone. Upon further investigation after testing, it was discovered that the Audi A6 BSI system can only be activated if the LDW system is also enabled (i.e., turned on). For this reason, although the test results can be used to quantify the performability of NHTSA’s BSI draft research test procedure, they may not accurately represent how the vehicle would have responded to the test scenarios had the BSI system been enabled and active.
5.3 Conclusions The work described in this report demonstrated that the BSI draft research test procedure was well-defined and performable, and that all validity requirements specified within the draft test procedure can be satisfied.
The Audi A6 did not issue BSI interventions during any trial, regardless of whether the tests were performed as crash imminent or false positive assessments. It is unknown whether these results accurately represent how the vehicle would have responded to the test scenarios had the BSI system been enabled in a manner consistent with the manufacturer’s design intent.

36
6 Traffic Jam Assist The Audi A6 was used as the SV for the TJA tests described in this report. Specifically, the vehicle was evaluated using NHTSA’s October 2019 TJA draft research test procedure (NHTSA, 2019e).
The Audi A6 uses a combination of adaptive cruise assist and lane guidance to facilitate TJA operation. Adaptive cruise assist can be set for speeds between 20 and 95 mph (32 to 153 km/h), but can remain active at lower speeds in stop and go traffic. Lane guidance can be activated as long as the necessary lane markings are present, the lane is not too wide or too narrow, and the driver’s hands are on the steering wheel. Lane guidance can be set to five different following distances.
6.1 Test Scenarios and Assessment Criteria Brief descriptions of the scenarios, validity criteria, and evaluation criteria for the tests described in this report are provided in sections 6.1.1 through 6.1.4; additional details can be found in the TJA draft research test procedure. For each test condition:
• The SV adaptive cruise control (ACC) was enabled, active, and set to the farthestfollowing distance setting.
• The SV lane centering control (LCC) system was enabled and active.• The SV initial speed was generally 15 or 25 mph (24.1 or 40.2 km/h).• The SV driver did not provide manual inputs to the SV accelerator or brake pedals.• The SV driver did not put their hands on the steering wheel (except for tapping the
steering wheel to avoid having the system timing out).• The validity period began 3 seconds before the onset of the test event, and ended when
the SV contacted the POV or 1 second after the SV stopped in response to the test event.• One valid trial per test condition was performed.
6.1.1 Lead Vehicle Decelerates Accelerates Then Decelerates The objective of the LVDAD scenario is to evaluate the TJA system’s ability to detect and respond to a POV that moderately brakes to a stop, pauses, accelerates back to its initial speed, then brakes aggressively to a stop ahead of the SV, as shown in Figure 6-1. In this scenario, the SV and POV remain in the same lane for the duration of each test trial.
Figure 6-1. LVDAD path

37
In Figure 6-2, the desired POV acceleration profile for the LVDAD scenario is shown. The POV first brakes to a stop with an average deceleration of 0.3 g, allows for the SV to stop for 3 or more seconds, accelerates back to the desired test speed at 0.127 g, allows for the SV to reach the desired test speed for 3 or more seconds, and then comes to a stop again with an average deceleration of 0.5 g.
Figure 6-2. LVDAD velocity and acceleration profiles
6.1.2 Suddenly Revealed Stopped Vehicle The objective of the SRSV scenario is to evaluate the TJA system’s ability to detect and respond to a stationary POV that is suddenly revealed after an SOV steers around it. In this scenario, shown in Figure 6-3, the SV and POV remain in the same lane for the duration of each test trial. The SOV begins in the same lane as the SV and POV, but performs a single lane change into an adjacent lane before colliding with the POV.
Figure 6-3. SRSV path To maximize the accuracy and repeatability of test conduct, a robotic steering controller was used to command the SOV lane change using the parameters shown in Figure 6-4. The lane change consists of two constant radius curves connected with a straight line to form the desired path. The SOV lane change is initiated when the headway to the POV is 40 ft (12.2m).

38
POV
Example: When operated at 25 mph (40.2 km/h), the SOV exits the curved section of the path defined by R1 with lateral velocity of 12.46 ft/s (3.80 m/s) towards the right lane line.
R
Dlat,curve
SOV
Dlat,curve1 = Dlat,curve2 = 4.95 ft (1.51 m); provided for reference purposes and robotic path programming
SOV path
20 deg
R1 = R2 = 82.02 ft (25
R1 Dinit_lat_offset = 0.5*(lane 1 width)
Dfinal_lat_offset = 0.5*(lane 2
Dlat,curve
Dreveal_onset_headway = 40 ft (12.2 m)
Figure 6-4. SRSV path profile
6.1.3 Lead Vehicle Lane Change With Braking The objective of the LVLCB scenario is to evaluate the TJA system’s ability to detect and respond to a moving POV that brakes during (in-turn deceleration) and/or after performing a lane change (final deceleration) into a space between the SV and SOV (see Figure 6-5). In this test, the SV and the SOV remain in the same lane for the duration of each test trial. The POV begins in a lane adjacent to the SV and SOV, and performs a single lane change into the SV and SOV travel lane. When used, the in-turn POV deceleration is 0.1 g. Post lane change POV deceleration is either 0.3 or 0.5g depending on the test conditions.
The LVLVB scenario is performed at 15 and 25 mph (24.1 and 40.2 km/h) for tests with no in-turn deceleration. For scenarios with both in-turn and final deceleration, tests are performed at 25 mph (40.2 km/h). It is not possible to perform the LVLCB scenario at 15 mph (24.1 km/h) with the 0.1 g in-turn deceleration used for the 25 mph (40.2 km/h), as the POV would decelerate to a stop before completing the lane change.
Figure 6-5. LVLCB path

39
The POV lane change used during LVLCB trials consists of two constant radius curves connected with a straight line to form the desired path (see Figure 6-6). The lane change is performed after the POV has matched the SV speed while also maintaining one of two SV-to-POV longitudinal headways for at least 3 seconds: 35 ft (10.7m) and 24.6 ft (7.5 m) during trials performed with and without in-turn deceleration, respectively.
Example: When operated at 25 mph (40.2 km/h), the POV exits the curved section of the path defined by R1 with lateral velocity of 6.1 ft/s (1.86 m/s) towards the right lane line.
R
Dlat,curve1
POV
Dlat,curve1 = Dlat,curve2 = 2.3 ft (0.7 m); provided for reference purposes and robotic path programming POV path
9.6 deg
R1 = R2 = 164 ft (50 m)
R1 Dinit_lat_offset = 0.5*(lane 1 width)
Dfinal_lat_offset = 0.5*(lane 2 width)
Dlat,curve2
Figure 6-6. LVLCB POV path profile
6.1.4 Validity Criteria The validity criteria described in the TJA draft research test procedure were assessed for each trial described in this report. These include specified speeds, accelerations, and POV path:
• The POV and SOV speeds shall be within ± 1 mph (± 1.6 km/h) of the given test speed.
• Decelerations and accelerations shall be maintained within ± 0.05 g of the desired value.
• Initial deceleration and acceleration magnitudes shall be reached within 0.5 ± 0.1 s.
• The SRSV reveal distance shall be 40 ft ± 1 ft (12.2 m ± 0.3 m).
• SOV and POV path tolerances are ± 0.8 ft (± 0.24 m).
• LVLCB initial POV-SOV longitudinal offset shall be within 3.3 ft (1 m) of the desiredoffset until the lane change occurs.
• LVLCB decelerations must be applied within 100 ms of lane change onset or completion.
6.2 Test Results Sections 6.2.1, 6.2.2, and 6.3.3 present summaries of the trials performed using the LVDAD, SRSV, and LVLCB scenarios, respectively. Tables for each scenario contain the minimum range to target and, where applicable, impact speed and relative impact speed. All tests, unless otherwise noted, met test validity criteria stated in the TJA draft research test procedure.

40
6.2.1 Lead Vehicle Decelerates Accelerates Then Decelerates A summary of the minimum SV-to-POV ranges observed during the LVDAD tests are shown in Table 6-1. No SV-to-POV impact was observed for either test speed.
Table 6-1. LVDAD SV Performance Summary
Test Speed
During First POV Deceleration Event (0.3g)
During Second POV Deceleration Event (0.5g)
Minimum Range to
POV
SV Impact Speed
Relative Impact Speed
Minimum Range to
POV
SV Impact Speed
Relative Impact Speed
15 mph (24.1 km/h)
26.3 ft (8.02 m) -- -- 26.3 ft
(8.02 m) -- --
25 mph (40.2 km/h)
25.3 ft (7.70 m) -- -- 25.2 ft
(7.67 m) -- --
Table 6-2 reports how long it took the POV to achieve the desired decelerations, the initial POV deceleration magnitudes, and the average POV deceleration magnitudes observed during the LVDAD trials. Here, the “time to achieve the desired decelerations” was defined as the time from the onset of POV braking (the instant a deceleration of 0.05 g occurs) to the instant the deceleration first enters the lower threshold of the desired deceleration target, initial POV deceleration magnitude was taken to be the deceleration at the first data count after the lower threshold was exceeded, and average POV deceleration magnitude was calculated from a time 0.5 s after brake onset to 250 ms before the POV stops or an SV-to-POV impact occurs.
Table 6-2. LVDAD POV Deceleration Validity Check
Test Speed
During First POV Deceleration Event (0.3g)
During Second POV Deceleration Event (0.5g)
Magnitude First
Realized (s)1
Initial Decel. Magnitude
(g)2
Average Deceleration
(g)2
Magnitude First
Realized (s)1
Initial Decel. Magnitude
(g)2
Average Deceleration
(g)2
15 mph (24.1 km/h) 0.06 -0.26 -0.29 0.05 -0.26 -0.29
25 mph (40.2 km/h) 0.24 -0.45 -0.52 0.35 -0.45 -0.54
1 Must occur within ±0.5 s. 2 Must be within ±0.05 g of the nominal target value (0.3 or 0.5g).
6.2.2 Suddenly Revealed Stopped Vehicle A summary of the SOV-to-POV reveal headways and minimum SV-to-POV ranges observed during the SRSV tests are shown in Table 6-3 (no impacts occurred). The SRSV reveal headway is defined as the distance between the forward-most point of the SOV and the rear-most point of the POV at the beginning of the SOV lane change, which was taken to be the instant when the SOV lateral acceleration reached 0.03 g. According to the TJA draft research test procedure, this instant should occur when the POV-to-SOV headway is between 39 and 41 ft (11.9 m to 12.5 m) during an otherwise valid test.

41
Note: Realizing the reveal headways within an acceptable range required iterative adjustment to software parameters used to robotically control the SOV steering inputs. Such adjustments typically involved pre-triggering the SOV lane change; commanding it to occur before the distance between the SOV and POV reached 40 ft (12.2 m). For the 15 and 25 mph (24.1 and 40.2 km/h) tests, reveal headways set to occur at 44.7 and 45.2 ft (13.6 and 13.8 m), respectively, produced actual values within the acceptable range of 39 to 41 ft (11.9 to 12.5 m).
Table 6-3. SRSV Test Conduct and SV Performance Summary
Test Speed SOV-to-POV Reveal Headway
SV-to-POV Minimum Range
SV-to-POV Impact Speed
15 mph (24.1 km/h)
39.8 ft
(12.13 m)13.2 ft
(4.03 m) --
25 mph (40.2 km/h)
39.9 ft (12.15 m)
15.9 ft (4.86 m) --
6.2.3 Lead Vehicle Lane Change With Braking A summary of the minimum SV range to the POV and the SV speeds at the time of impact (actual and relative, where applicable) observed during the LVLCB tests are shown in Table 6-4. A low-speed SV-to-POV impact was observed during one trial performed at 25 mph (40.2 km/h); during a test without POV deceleration during the lane change, but with 0.5 g deceleration after the lane change was complete.
Table 6-4. LVLCB SV Performance Summary
Post LC Deceleration 0.3 g 0.5 g
In-Turn Deceleration 0 g 0.1 g 0 g 0.1 g
15 mph (24.1 km/h)
Minimum Range to POV 13.5 ft1 (4.10 m)
9.1 ft2 (2.78 m)
SV Impact Speed -- --
SV-to-POV Relative Impact Speed -- --
25 mph (40.2 km/h)
Minimum Range to POV 12.6 ft (3.84 m)
10.2 ft2 (3.12 m)
0 ft (0 m)
1.7 ft2 (0.51 m)
SV Impact Speed -- -- 1.05 mph (1.70 km/h) --
SV-to-POV Relative Impact Speed -- -- 1.02 mph
(1.64 km/h) --
1 Test did not satisfy lane centering requirements for the SOV. Since satisfying this check is generally not problematic, the test trial was not repeated.
2 Test did not satisfy POV deceleration start time criteria.

42
Table 6-5 includes POV deceleration start times, the time taken to reach the initial deceleration magnitude desired, initial POV deceleration magnitudes, and average POV deceleration values used to assess test validity for the tests previously summarized in Table 6-4.
Extensive adjustments to the POV brake event trigger programming in the control software used to command the GST were made to consistently satisfy the POV deceleration start times specified for the LVLCB trials. During the tuning process, problems associated with being unable to achieve the desired GST brake onset timing fell into one (or both) of the following two categories:
• The in-turn (first) deceleration event was programmed to occur at the same time as thelane change, as nominally specified in the TJA draft research test procedure, however theactual POV braking onset occurring earlier than the onset of the lane change.
• Although the final (second) deceleration event was programmed to occur once the GSThad satisfied the lateral and longitudinal positions used to define completion of the POVlane change, the actual braking onset occurred later, and outside of the allowable timetolerance.
Table 6-5. LVLCB POV Deceleration Validity Check
Test Type No In-Turn Deceleration
With In-Turn Deceleration
Deceleration 0.3 g 0.5 g 0.1 g 0.3 g 0.1 g 0.5 g
15 mph (24.1 km/h)
Onset (s) 1 0.08 0.11
No tests with in-turn deceleration were performed from 15 mph.
Magnitude First Realized (s) 2 0.28 0.14
Initial Deceleration Magnitude (g) 3 -0.25 -0.45
Average Deceleration (g) 4 -0.32 -0.51
25 mph (40.2 km/h)
Onset (s) 1 0.03 0.07 0.11 0.05 0.03 0.12
Magnitude First Realized (s) 2 0.36 0.425 0.00 0.105 0.00 0.295
Initial Deceleration Magnitude (g) 3 -0.25 -0.45 -0.06 -0.25 -0.06 -0.45
Average Deceleration (g) 4 -0.32 -0.52 -0.10 -0.28 -0.10 -0.53
1 Braking to be initiated within ±0.250 s of POV lane change. 2 Must occur within ±0.5 s. 3 Taken at the first data count after the lower threshold of the nominal magnitude is exceeded 4 From 0.5 s after brake onset to 250 ms before POV stops or SV-to-POV impact occurs.

43
Multiple ways of addressing these problem areas were explored, including the use of different lateral acceleration-based triggers (which was found to be too noisy to use reliably), and different steering angle data thresholds (which provided better consistency than lateral acceleration due to a better signal-to-noise ratio, but could still not satisfy the 100 ms response time specified in a previous version of NHTSA’s TJA draft research test procedure). Ultimately the combination of steering angle data and reducing the brake response time tolerance to within 250 ms after the lane change is initiated and/or completed (depending on the test conditions) was used. This tolerance is specified in the October 2019 TJA draft test procedure.
All deceleration magnitudes specified for the LVLCB tests were satisfied; however, doing so required extensive tuning (of the LPRV braking commands) to achieve these values without LPRV wheel lock up. A chronology of the iteratively improved LPRV braking response is shown in Figures 6-7 through 6-10.
On the first day of LPRV brake tuning (Figure 6-7), front brake line pressure was not evenly applied, and was spiking to over 50 bar. Addition, the braking initially observed was significantly biased to the front. Through some trial and error, it was determined that the LPRV front wheels would lock when the front brake pressure reached over 30 bar.
Figure 6-7. GST brake tuning improvement, beginning of day one
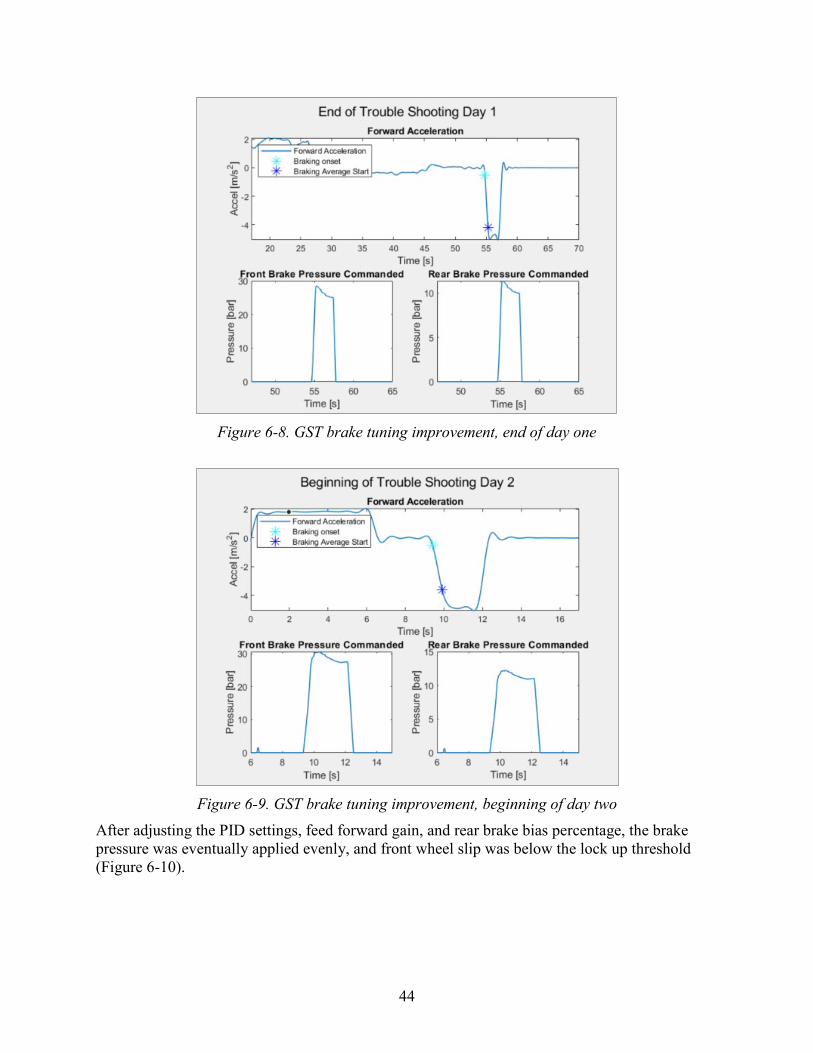
44
Figure 6-8. GST brake tuning improvement, end of day one
Figure 6-9. GST brake tuning improvement, beginning of day two After adjusting the PID settings, feed forward gain, and rear brake bias percentage, the brake pressure was eventually applied evenly, and front wheel slip was below the lock up threshold (Figure 6-10).

45
Figure 6-10. GST brake tuning improvement, end of day two
6.3 Conclusions The work described in this chapter demonstrates that the tests described in the October 2019 version of NHTSA’s draft TJA test procedure were performable and satisfying all validity criteria for each scenario/test condition is possible.
The Audi A6 avoided an SV-to-POV impact during each trial performed in the LVDAD and SRSV test scenarios. One of the six LVLCB trials resulted in a low-speed SV-to-POV impact; during the 25 mph (40.2 km/h) test performed without POV deceleration during the lane change, but with 0.5 g deceleration after the lane change was complete.

46
7 Opposing Traffic Safety Assist The Audi A6 was used as the SV for the OTSA tests described in this report. Specifically, the vehicle was evaluated using NHTSA’s September 2019 OTSA draft research test procedure (NHTSA, 2019d).
OTSA is an ADAS technology designed to automatically bring a driver’s vehicle back into the original travel lane after it has moved laterally towards an opposing vehicle driven in an adjacent lane. OTSA activations are intended to prevent head-on collisions, and are expected to occur regardless of whether the driver has activated the turn signal prior to the lane deviation. Note: The Audi A6 used for the work described in this report was not equipped with OTSA. However, since the OTSA draft research test procedure includes provisions to prevent the SV from being within 1.5 ft (0.46 m) laterally of the POV impact (i.e., an SV-to-POV impact should not ever occur during an OTSA trial, regardless of whether an OTSA intervention occurs or not, the vehicle was used to evaluate test performability only.
7.1 Test Scenarios and Assessment Criteria Five scenarios are defined in the OTSA research test procedure, three are crash-imminent scenarios and two are false positive assessments. Of the crash-imminent scenarios, one is designed to be an unintended lane deviation towards an oncoming vehicle characterized by a lower lateral velocity towards the lane line and no turn signal application. The other two are intended lane deviations, one performed with a higher lateral velocity and turn signal application, and one designed to be performed by the vehicle’s automatic lane change function. The false positive assessments were also designed for intended lane changes also being performed at a higher lateral velocity and turn signal application and with the vehicle’s automatic lane change function.
In addition to not being equipped with OTSA, the Audi A6 also did not have automatic lane change capabilities. Therefore, only the tests defined in OTSA Scenarios 1, 2, and 4 were used (i.e., those specifying manual lane deviations. not performed using the vehicle’s automatic lane change function). All OTSA tests described in this report were performed with the vehicle operating in automation level 1 with the ACC set to the farthest setting.
Several initial conditions were the same for each test scenario:
• The SV was initially positioned at a predetermined lateral offset from the left lane line,and LV was initially positioned in the center of the same travel lane. The POV waspositioned such that its leftmost edge was spaced 3.3 ft (1 m) from the inboard edge ofthe lane line directly to its left, and oriented opposite of the SV and LV (see Figures 7-1,7-4, and 7-6).
• Three SV_POV speed combinations were used for each scenario: 25_25 mph (40.2_40.2km/h), 45_25 mph (72.4_40.2 km/h), and 45_45 mph (72.4_72.4 km/h), where the firstand second numbers of each combination describe the nominal SV and POV speeds,respectively.
• Each vehicle (SV, POV, and LV) initially traveled straight within their respective lanes atthe desired speed.

47
• The LV was programmed with a closed-loop control speed of 44.5 mph (71.3 km/h),which was slightly lower than the nominal target speed of 45 mph (72.4 km/h). The SV’sadaptive cruise control (ACC) was set to 46 mph (74.0 km/h), and the farthest headwaysetting was selected. Setting the SV ACC speed higher than the tightly controlled speedof the LV ensured the ACC was actively modulating the SV-to-LV headway, somethingnot possible if the LV speed were to exceed that of the SV.
• Since the tests described in this report were only performed with the SV operating inautomation level 1, all SV lane deviations were commanded by the robotic steeringcontroller previously described in Section 2.6.1.
NHTSA’s OTSA draft research test procedure states that an OTSA system is expected to intervene in a manner that prevents any part of the SV from being within 1.5 ft (0.46 m) laterally of any part of the POV (not including the side mirrors). If this threshold was exceeded, the test was terminated and the SV automatically steered away from the POV, back into the original travel lane using an evasive maneuver preprogrammed into the robotic steering controller.
7.1.1 OTSA Scenario 1: Unintended Lateral Deviation, No SV Turn Signal, Manual Steering
OTSA Scenario 1, shown in Figure 7-1, was designed to evaluate an OTSA system’s ability to detect and respond to an opposing POV, present in a lane adjacent to that of the SV, after the SV unintentionally deviates from its travel lane with timing that creates a crash-imminent driving situation. In this scenario, the SV lane deviation was commanded manually,9 performed with a lateral velocity of 1.6 ft/s (0.5 m/s), and not preceded by activation of the turn signal.
Initially, the SV was driven straight behind the LV, at the lateral distance to the left lane line specified in Figure 7-2. This distance was calculated by adding half of the SV width to the lateral distances necessary for (1) the SV to complete the constant radius curve used to establish the desired heading angle, and (2) a short period of steady state driving after completion of the curve.
9 In the context of this report, a manual steering input is one not commanded by the SV itself. The robotically controlled steering inputs used to direct the SV into the path of the POV, and the subsequent POV avoidance maneuver (if needed) are both considered to be manual steering inputs.

48
Figure 7-1. OTSA Scenario 1 test layout More specifically, at the time-to-collision (TTC) specified in Table 7-1 for the various SV and POV speed combinations, robotically controlled inputs were used to steer the SV into a 3,937 ft (1200 m) radius curve until a speed-dependent heading angle (also listed in Table 7-1) was achieved. Once at this heading angle, the SV exited the constant radius curve with a lateral

49
velocity of 1.6 ft/s (0.5 m/s) towards the left lane line. The steering robot’s closed-loop control was released within 250 ms of exiting this curve to allow for an unimpeded SV response to be observed. Additional scenario-specific parameters to define the SV path deviation are given in Figure 7-2 and Table 7-1.
Figure 7-2. Robotic steering parameters for unintended lane deviation trials
Table 7-1. OTSA Scenario 1 Parameters
SV and LV Initial Speed POV Initial Speed SV Path Deviation
Onset TTC Range (sec) Nominal Heading
Angle, Θ (deg)1
25 ± 1 mph (40.2 ± 1.6 km/h
25 ± 1 mph (40.2 ± 1.6 km/h) 7.6 - 8.4 2.56
45 ±1 mph (72.4 ± 1.6 km/h)
25 ± 1 mph (40.2 ± 1.6 km/h) 6.1 - 6.5 1.43
45 ±1 mph (72.4 ± 1.6 km/h)
45 ±1 mph (72.4 ± 1.6 km/h) 6.1 - 6.5 1.43
1 Nominal heading angle is provided for reference purposes and robotic path planning. There is not a validity check performed on SV heading angle, only on lateral velocity.
For each Scenario 1 trial, the validity period ended when one of three conditions were met:
1. The lateral position of the SV was ≤ 1.5 ft (0.46 m) from the POV; or
2. Five seconds after the SV established a heading away from the POV and was completelywithin its original travel lane; or
3. One second after the SV traveled ≥ 1 ft (0.3 m) beyond the inboard edge of the lane lineseparating the SV travel lane from one adjacent and to the right of it (Figure 7-3).

50
Figure 7-3. OTSA Scenario 1 end validity period conditions
7.1.2 OTSA Scenario 2: Intentional Lateral Deviation, Turn Signal, Manual Steering
OTSA Scenario 2 was designed to evaluate the OTSA system’s ability to detect and respond to an opposing POV, present in a lane adjacent to that of the SV, after the SV intentionally deviates from its travel lane with timing that creates a crash-imminent driving situation. Consistent with the performance criteria used for OTSA Scenario 1, the SV OTSA system was expected to intervene in a manner that prevented any part of the SV from being within 1.5 ft (0.46 m) of any part of the POV (less the side mirrors).
To differentiate the intentional lane deviation used in OTSA scenario 2 from the unintended deviation maneuver used during OTSA Scenario 1, a higher lateral velocity of 2.3 ft/s (0.7 m/s) and turn signal were used. As shown in Figure 7-4, this was achieved by changing the initial SV offset within its travel lane, use of a smaller 2,625 ft (800 m) constant radius curve, and ultimately, a larger heading angle towards the left lane line. Also, since the time needed to complete the lateral deviation was less during OTSA Scenario 2 than for OTSA Scenario 1, the maneuver was initiated at a shorter TTC. An overview of OTSA Scenario 2 is shown in Figure 7-5.
Figure 7-4. OTSA Scenario 2 robotic steering parameters

51
SV
SV
Figure 7-5. OTSA Scenario 2 test layout The LV and POV staging for OTSA Scenario 2 was identical to that of OTSA Scenario 1. Table 7-2 contains other lane change parameters for OTSA Scenario 2. The end validity conditions forOTSA Scenario 2 were the same as those from OTSA Scenario 1.

52
Table 7-2. OTSA Scenario 2 Parameters
SV and LV Initial Speeds
POV Initial Speed
SV Turn Signal Application TTC (sec)
SV Path Deviation
Onset TTC Range (sec)
Nominal Heading Angle
(Θ, in deg)1
Lateral Offset (D2)
25 ± 1 mph (40.2 ± 1.6 km/h)
25 ± 1 mph (40.2 ± 1.6 km/h) 7.6 ± 0.5 6.3 - 6.9 3.61 6.23 ft
(1.9 m)
45 ± 1 mph (72.4 ± 1.6 km/h)
25 ± 1 mph (40.2 ± 1.6 km/h) 5.4 ± 0.5 4.3 - 4.6 2.01 4.99 ft
(1.52 m)
45 ± 1 mph (72.4 ± 1.6 km/h)
45 ± 1 mph (72.4 ± 1.6 km/h) 5.4 ± 0.5 4.3 - 4.6 2.01 4.99 ft
(1.52 m)
1 Nominal heading angle is provided for reference purposes and robotic path planning. There is not a validity check performed on SV heading angle, only on lateral velocity.
7.1.3 OTSA Scenario 4: False Positive Assessment, Manual Steering Unlike the crash-imminent scenarios defined in OTSA Scenarios 1 and 2, OTSA Scenario 4 is a false-positive assessment designed to evaluate whether an OTSA system detects and responds to a non-threatening POV. For these tests, the POV was driven two lanes to the left of the SV. Using the same longitudinal TTCs defined in OTSA Scenario 2, the SV driver activated the turn signal, and the robotic steering controller automatically initiated a single lane change into the left adjacent lane. However, rather than robotic steering control being released prior to the SV crossing the left lane line, a full single lane change was performed (i.e., the SV was steered from its initial travel lane to the center of the left adjacent lane). Robotic control of the SV steering was not released until the end of the validity period. A summary of these parameters is provided in Table 7-3. An overview of OTSA Scenario 4 is shown in Figure 7-6.
Table 7-3. OTSA Scenario 4 Test Parameters
SV and LV Initial Speeds
POV Initial Speed
SV Turn Signal Application TTC
(sec)
SV Path Deviation Onset
TTC Range (sec)
Nominal Heading Angle
(Θ, in deg)1
Lateral Offset (D2)
25 ± 1 mph (40.2 ± 1.6 km/h
25 ± 1 mph (40.2 ± 1.6 km/h) 7.6 ± 0.5 6.3 - 6.9 3.61 6.23 ft
(1.9 m)
45 ± 1 mph (72.4 ± 1.6 km/h)
25 ± 1 mph (40.2 ± 1.6 km/h) 5.4 ± 0.5 4.3 - 4.6 2.01 4.99 ft
(1.52 m)
45 ± 1 mph (72.4 ± 1.6 km/h)
45 ± 1 mph (72.4 ± 1.6 km/h) 5.4 ± 0.5 4.3 - 4.6 2.01 4.99 ft
(1.52 m)

53
Figure 7-6. OTSA Scenario 4 test layout The robotic steering choreography for OTSA Scenario 4, shown in Figure 7-7, was identical to that used for OTSA Scenario 2, except the manual lane deviation did not release steering control after a specified time during the lane change. Instead, the steering robot commanded SV steering through a full lane change that finished with the SV centered in its new travel lane, adjacent to the POV’s travel lane. Because of this constant control, an extra set of baseline trials were

54
conducted without a POV present for comparison and OTSA identification. This process was identical to that used in the BSI assessment with the OTSA scenarios.
Figure 7-7. OTSA Scenario 4 robotic steering parameters OTSA Scenario 4 tests were complete when one of the following conditions was met:
1. Five seconds after the SV had completed the single lane change into the left lane adjacentto the SV’s original travel lane; or
2. One second after an OTSA intervention caused the SV to travel ≥ 1 ft (0.3 m) beyond theinboard edge of the lane line separating the post lane change SV travel lane and oneadjacent and to the right of it (Figure 7-8).
POV
SV
1 ft (0.3 m) termination condition
3.3 ft (1 m)
Figure 7-8. OTSA Scenario 4 end validity period conditions
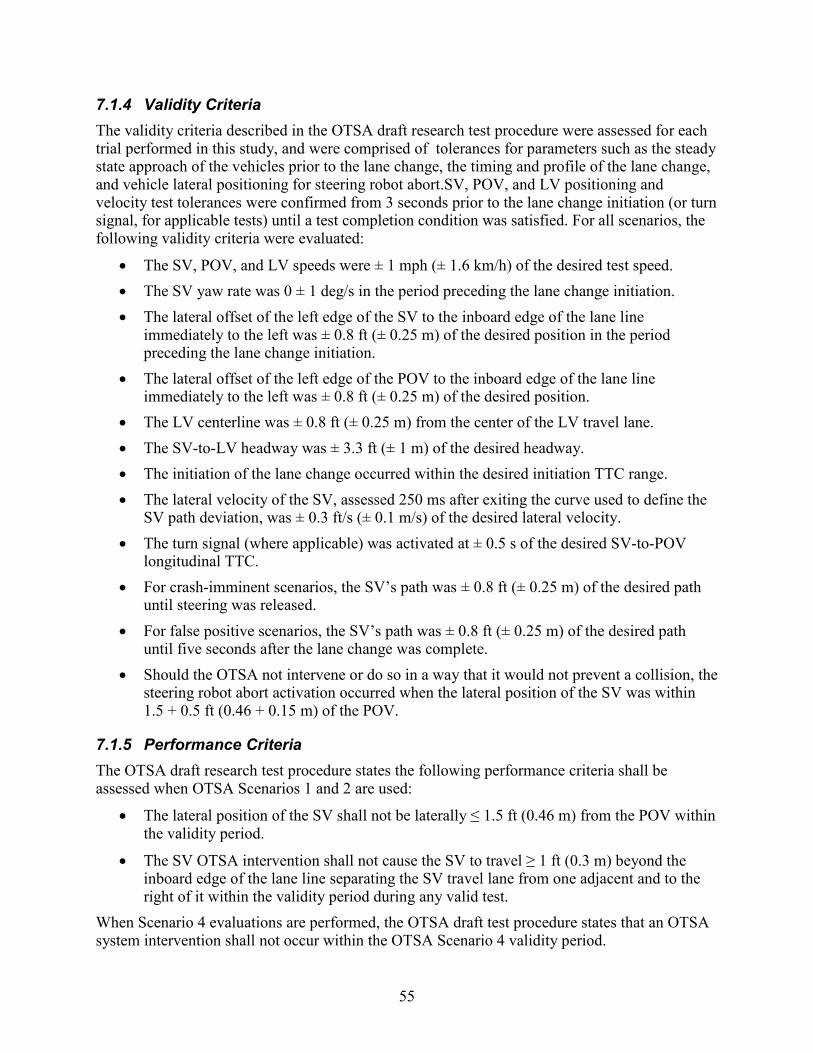
55
7.1.4 Validity Criteria The validity criteria described in the OTSA draft research test procedure were assessed for each trial performed in this study, and were comprised of tolerances for parameters such as the steady state approach of the vehicles prior to the lane change, the timing and profile of the lane change, and vehicle lateral positioning for steering robot abort.SV, POV, and LV positioning and velocity test tolerances were confirmed from 3 seconds prior to the lane change initiation (or turn signal, for applicable tests) until a test completion condition was satisfied. For all scenarios, the following validity criteria were evaluated:
• The SV, POV, and LV speeds were ± 1 mph (± 1.6 km/h) of the desired test speed.• The SV yaw rate was 0 ± 1 deg/s in the period preceding the lane change initiation.• The lateral offset of the left edge of the SV to the inboard edge of the lane line
immediately to the left was ± 0.8 ft (± 0.25 m) of the desired position in the periodpreceding the lane change initiation.
• The lateral offset of the left edge of the POV to the inboard edge of the lane lineimmediately to the left was ± 0.8 ft (± 0.25 m) of the desired position.
• The LV centerline was ± 0.8 ft (± 0.25 m) from the center of the LV travel lane.• The SV-to-LV headway was ± 3.3 ft (± 1 m) of the desired headway.• The initiation of the lane change occurred within the desired initiation TTC range.• The lateral velocity of the SV, assessed 250 ms after exiting the curve used to define the
SV path deviation, was ± 0.3 ft/s (± 0.1 m/s) of the desired lateral velocity.• The turn signal (where applicable) was activated at ± 0.5 s of the desired SV-to-POV
longitudinal TTC.• For crash-imminent scenarios, the SV’s path was ± 0.8 ft (± 0.25 m) of the desired path
until steering was released.• For false positive scenarios, the SV’s path was ± 0.8 ft (± 0.25 m) of the desired path
until five seconds after the lane change was complete.• Should the OTSA not intervene or do so in a way that it would not prevent a collision, the
steering robot abort activation occurred when the lateral position of the SV was within1.5 + 0.5 ft (0.46 + 0.15 m) of the POV.
7.1.5 Performance Criteria The OTSA draft research test procedure states the following performance criteria shall be assessed when OTSA Scenarios 1 and 2 are used:
• The lateral position of the SV shall not be laterally ≤ 1.5 ft (0.46 m) from the POV withinthe validity period.
• The SV OTSA intervention shall not cause the SV to travel ≥ 1 ft (0.3 m) beyond theinboard edge of the lane line separating the SV travel lane from one adjacent and to theright of it within the validity period during any valid test.
When Scenario 4 evaluations are performed, the OTSA draft test procedure states that an OTSA system intervention shall not occur within the OTSA Scenario 4 validity period.

56
7.2 Test Results All test validity criteria described in the OTSA draft research test procedure were satisfied for each trial.
Acknowledging once again that the Audi A6 used to perform the tests described in this report was not equipped with OTSA, no OTSA activations were anticipated or observed. Table 7-4 provides a summary of the OTSA tests performed. In summary,
• The lateral distance between the SV and POV was ≤ 1.5 ft (0.46 m) during each Scenario1 and 2 trial, and the SV was automatically steered away from the POV using an evasivemaneuver preprogrammed into the SV robotic steering controller.
• No OTSA activations were identified during the Scenario 4 false positive assessment.Table 7-4. OTSA results
Scenario SV/POV Speeds OTSA Activation? SR Abort?
OTSA Scenario 1
25/25 mph (40/40 km/h) No Yes
45/25 mph (72/40 km/h) No Yes
45/45 mph (72/72 km/h) No Yes
OTSA Scenario 2
25/25 mph (40/40 km/h) No Yes
45/25 mph (72/40 km/h) No Yes
45/45 mph (72/72 km/h) No Yes
OTSA Scenario 4
25/25 mph (40/40 km/h) No n/a
45/25 mph (72/40 km/h) No n/a
45/45 mph (72/72 km/h) No n/a
7.3 Conclusions The work described in this chapter demonstrates that tests defined in NHTSA’s September 2019 OTSA draft research test procedure are performable and that all validity requirements specified therein can be satisfied. Since the Audi A6 was not equipped with an OTSA system, no interventions or warnings were observed during the tests described in this report, regardless of whether crash-imminent or false positive scenarios were used.

57
8 Overall Concluding Remarks The work described in this report demonstrates that the test methods defined within NHTSA’s APA, BSI, ISA, OTSA, and TJA draft research test procedures are performable, and each test validity assessment can be satisfied. That said, addition of a tolerance to specify permissible SV and POV accelerations during ISA test scenarios where the vehicle must be moved from rest is recommended, as no tolerance is provided in the September 2019 ISA draft research test procedure. Use of the ±0.05g POV acceleration values specified in the October 2019 TJA draft research test procedure is one option, as the range was used successfully during the lead vehicle decelerates, accelerates, then decelerates TJA trials described in this report.
The performance criteria specified within each draft test procedure were developed for research purposes and to provide specific points for future research and technical discussion (e.g., Do the criteria appropriately align with the safety problems the technologies endeavor to address?). Acknowledging that the BSI and OTSA evaluations were performed without the respective systems in operation (either not enabled or because the SV was not so equipped), Table 8-1 provides a summary for the work described in this report. For the tests where the technologies were fully functional,
• The SV was best able to satisfy the performance criteria contained within the TJA draftresearch test procedure, where no SV-to-POV impacts occurred during 9 of the 10 trialsperformed.
• Although the SV APA system was functional during all test conditions, it was only ableto explicitly satisfy the performance criteria specified in the APA draft research testprocedure during 4 of the 13 trials. Better understanding why vehicle manufacturersconfigure their APA systems the way they do, especially with regards to parameters thatmay be philosophically differ from the specifications provided in the draft research testprocedure, is of interest to the agency.
• The ISA test results are believed to be indicative of the technology (generally speaking,and across all current implementations) being at an early stage of technical maturity. Thesystem’s limited functionality is reflected in its ability to only satisfy one of the 9performance criteria specified in the ISA draft research test procedure.

58
Table 8-1. Overall ADAS System Performance Results
ADAS Technology Satisfying Applicable Performance Criteria
Overall # Of Trials Primary Reasons For Being Unable To Do So
APA 4 of 13 Some parking performance criteria not satisfied; no system override assessment criteria were satisfied
ISA 1 of 9 1 System did not respond to most crash scenarios
BSI 1 of 3 2 System was not properly enabled, so it could not provide corrective interventions
TJA 9 of 10 3 Insufficient braking during one test trial
OTSA 3 of 9 4 The test vehicle was not equipped with an OTSA system
1 Test results shown are from trials performed with crash-imminent timing. An additional 9 trials were also performed with near-miss timing, where an ISA intervention was not needed to prevent an SV-to-POV impact. However, since no near-miss assessment criteria are explicitly stated or implied within the ISA draft research test procedure, results from these trials are not included in this table.
2 The BSI system was not properly enabled or active during these trials. For the Audi A6 used in this study, BSI can only be activated if the vehicle’s LDW system is also enabled (switched on). Since the LDW was switched off during conduct of the BSI tests, no BSI interventions were possible. The trial that did satisfy the applicable assessment criteria was a false positive test where the system was not expected to intervene.
3 No vehicle performance criteria are provided in the TJA draft research test procedure, therefore the 9/10 results shown refer to the overall number of trials during which no SV-to-POV impact occurred.
4 The subject vehicle was not equipped with an OTSA system. The three trials that did satisfy the applicable assessment criteria were false positive tests where the system was not expected to intervene.

59
9 References Audi. (2019). Owner’s Manual 2019 A6. Part number 4K0012721BA.
Daimler AG. (2017). E-Class Operator’s Manual. Part number 213 584 78 01.
Davis, I. J., & Forkenbrock, G. J. (in press). Intersection safety assist draft test procedure validation. National Highway Traffic Safety Administration.
Euro NCAP Secretariat. (2018, May). Global Vehicle Target Specification, version 1.0 (Document No. TB25) [Technical bulletin]. European New Car Assessment Programme. Available at https://cdn.euroncap.com/media/39159/tb-025-global-vehicle-target-specification-for-euro-ncap-v10.pdf.
Federal Highway Administration. (2012, May). Manual on Uniform Traffic Control Devices for Streets and Highways, 2009 edition, including Revision 1 dated May 2012 and Revision 2 dated May 2012. https://mutcd.fhwa.dot.gov/pdfs/2009r1r2/pdf_index.htm.
Fogle, E. E., Arquette, T. E., & Forkenbrock, G. J. (in press). Active park assist draft test procedure validation (Report No. DOT HS 812 923). National Highway Traffic Safety Administration.
Fogle, E. E., Arquette, T. E., & Forkenbrock, G. J. (in press). Traffic jam assist draft test procedure validation. National Highway Traffic Safety Administration.
Manahan, T. R., & Forkenbrock, G. J. (in press). Opposing traffic safety assist draft test procedure validation. National Highway Traffic Safety Administration.
NHTSA. (2019a, July). Blind spot intervention system confirmation test (working draft) (Report No. DOT HS 812 760; also found in Docket No. NHTSA-2019-0102-0001). Author.
NHTSA. (2019b, August). Active park assist system confirmation test (working draft) (Report No. DOT HS 812 714; also found in Docket No. NHTSA-2019-0102-0007). Author.
NHTSA. (2019c, September). Intersection safety assist system confirmation test (working draft) (Docket No. NHTSA-2019-0102-0006]. Author.
NHTSA. (2019d, September). Opposing traffic safety assist system confirmation test (working draft) (Docket No. NHTSA-2019-0102-0008). Author.
NHTSA. (2019e, October). Traffic jam assist system confirmation test (working draft). (Docket No. NHTSA-2019-0102-0002). Author.

A-1
10 Appendix The following is a list of vehicle performance criteria defined within the draft APA test procedure. It includes a list of APA system parking notification, time tolerance, final parking position, encroaching pedestrian detection assessment, obstructing vehicle detection assessment, and system override assessment requirements.
10.1 SV Parking Notifications • APA systems must present a parking space detection notification before the rearmost part
of the SV crosses the termination boundary.
• APA systems must present a notification to begin the parking function within 5 secondsof the vehicle coming to a complete stop.
• APA systems shall present in-vehicle instruction within 5 seconds after the SV driver hasinitiated the automated parking function.
• APA systems shall present instructions within 5 seconds after completion of the parkingmaneuver.
10.2 Time Tolerance • Systems with automated gear selection must complete the parking maneuver within 45
second from the instant the SV driver first releases the brake pedal.
• Systems with manual gear selection, brake pedal, and/or accelerator pedal inputs mustcomplete the parking maneuver within 60 seconds.
10.3 Final Parking Position • Perpendicular
o The rearmost part of the SV shall be within 12 inches of the inboard edge of therear of the desired parking space.
o The leftmost part of the SV shall be 12 or more inches away from the rightmostpart of the second parked vehicle (PV2).
o The rightmost part of the SV shall be 12 or more inches away from the leftmostpart of the third parked vehicle (PV3).
• Parallel
o The rightmost edge of the SV’s right-side tires shall be within 12 inches from theinboard edge of the desired parking space.
o The front most part of the SV must be 1 or more inches away from the rearmostpart of PV3.
o The rearmost part of the SV must be 12 or more inches away from the front mostpart of PV2.

A-2
10.4 Encroaching Pedestrian Detection Assessment • If the APA system uses all automated inputs (steering, brake, throttle, and gear selector):
o The park assist system shall not allow the SV to impact the PED at any time.
o If the system cannot park, it shall terminate the maneuver.
• If the APA system uses manual inputs for brake, throttle, and/or gear selector:
o The park assist system shall instruct the driver how to avoid the PED during theparking maneuver.
o Provided the SV driver responds to the requests within 2 seconds, the SV shall notimpact any PV.
o If the system cannot park the SV due to the PED the SV shall terminate themaneuver.
10.5 Obstructing Vehicle Detection Assessment • If the APA system uses all automated inputs (steering, brake, throttle, and gear selector):
o The park assist system shall not allow the SV to impact the POV at any time.
o If the system cannot park due to the POV’s presence, it shall terminate themaneuver.
• If the APA system uses manual inputs for brake, throttle, and/or gear selector:
o The park assist system shall instruct the driver how to avoid the PED during theparking maneuver.
o Provided the SV driver responds to the requests within 2 seconds, the SV shall notimpact any PV.
o If the system cannot park the SV due to the PED the APA system shall terminatethe maneuver.
10.6 System Override Assessment • The steering wheel torque require to override the system shall be ≤ 20 ft·lbf (27 N·m).
• The accelerator pedal position required to manually override the system shall be ≤ 5percent of the wide-open accelerator pedal position.
• For an automated braking system, the brake pedal position required to manually overridethe system shall be ≤ 5 percent of the wide-open accelerator pedal position.
• For a manual braking system, the SV driver must brake to a stop within 2 seconds of theinitial clockwise steering cut in. After the vehicle comes to a stop it shall remain at restfor five seconds.
• For all system overrides, the APA system shall present the SV driver with the alert“Parking assist override initiated. Apply brakes to complete.” After the driver applies thebrakes, the APA system shall present the following alert: “Parking assist overridecomplete. Manual driving restored.”

DOT HS 812 983 October 2021
14839-093021-v10