Draft Report | April 2016
53
Transcript of Draft Report | April 2016

-TELLUS
Sandy Ridge Facility
Draft Water Quality Management
Plan
April 2016

SANDY RIDGE PROJECT
DRINKING WATER QUALITY
MANAGEMENT PLAN
Draft Report | April 2016

<blank Page>

Sandy Ridge Project Drinking Water Quality Management Plan Table of Contents
ii Drinking Water Quality Management Plan Version 0.1
Table of Contents
Distribution ...................................................................................................................................... iv
Abbreviations .................................................................................................................................... v
1 General information ................................................................................................................... 6
1.1 Purpose and scope ................................................................................................................. 6
1.2 System layout ......................................................................................................................... 6
1.3 Duty of care holder ................................................................................................................ 6
1.4 Water users .......................................................................................................................... 10
2 Drinking water supply system information ................................................................................ 11
2.1 Water harvesting / abstraction sources and methods ........................................................ 11
2.2 Storage system ..................................................................................................................... 11
2.3 Treatment system ................................................................................................................ 11
2.4 Reticulation network ............................................................................................................ 12
2.5 Systems operation ............................................................................................................... 12
2.6 Operational monitoring and maintenance .......................................................................... 13
2.7 System operators competency ............................................................................................ 13
3 Catchment ................................................................................................................................ 14
3.1 Map of catchment area ........................................................................................................ 14
3.2 Risk assessment of catchment area ..................................................................................... 14
3.4 Catchment monitoring and maintenance ............................................................................ 16
4 Monitoring requirements.......................................................................................................... 17
5 Incidence response procedure .................................................................................................. 21
6 Reporting requirements ............................................................................................................ 25
7 References ............................................................................................................................... 26
Appendices ...................................................................................................................................... 27
A.1 Analytical water quality data ............................................................................................... 28
A.2 Systems Compliance and Routine Reporting Requirements for Minesites And
Exploration Camps .......................................................................................................................... 29
List of Figures
Figure 1 Regional Location ...................................................................................................................... 7
Figure 2 Potable Water Source Location ................................................................................................ 8
Figure 3 Potable Water Schematic .......................................................................................................... 9
Figure 4 Regional Catchment Area ....................................................................................................... 15

Sandy Ridge Project Drinking Water Quality Management Plan Table of Contents
1 Drinking Water Quality Management Plan Version 0.1
List of Tables
Table 2–1 Water storage system .......................................................................................................... 11
Table 2–2 Specifications of RO system ................................................................................................. 12
Table 2–3 Monitoring and maintenance summary .............................................................................. 13
Table 3–1 Catchment area risk assessment .......................................................................................... 14
Table 4–1 Water quality monitoring plan ............................................................................................. 17
Table 5–1 Potable water system risk assessment ................................................................................ 22
Sandy Ridge Project Drinking Water Quality Management Plan Distribution
iv Drinking Water Quality Management Plan Version 0.1
DISTRIBUTION
Report File Name Report Status Author Date Distribution
Drinking Water Quality Management Plan –V0.1
V0.1 (Draft) Aurora Environmental
21 April 2016 Tellus Holdings Ltd.
Disclaimer:
The information contained in this document produced by Tellus Holdings Ltd (Tellus) is solely for the
use of the Office of the Environment Protection Authority identified in the documentation and for the
purpose for which it has been prepared. Tellus undertakes no duty to, or accepts any responsibility to,
any third party who may rely upon this document.
All rights reserved. No section or element of this document may be removed from this document,
reproduced, electronically stored or transmitted in any form without the written permission of Tellus.
All care and diligence has been exercised in interpreting data and the development of environmental
assessment and recommendations presented in this report. In any event, Tellus accepts no liability for
any costs, liabilities or losses arising because of the use of, or reliance upon, the contents of this
report.
Sandy Ridge Project Drinking Water Quality Management Plan Abbreviations
v Drinking Water Quality Management Plan Version 0.1
ABBREVIATIONS
DoH Department of Health
kL Kilolitre
km Kilometre
mg/L Milligrams per litre
RO Reverse Osmosis
Sandy Ridge Project Drinking Water Quality Management Plan Chapter 1: General Information
6 Drinking Water Quality Management Plan Version 0.1
1 GENERAL INFORMATION
1.1 Purpose and scope The purpose of this Drinking Water Quality Management Plan (the Plan) is to specify the
requirements for potable water management for the Sandy Ridge Project (the Site) operated by
Tellus Holdings Pty Ltd (Tellus) and to ensure drinking water quality complies with relevant drinking
water standards.
As Tellus will utilise self–managed water abstraction and collection systems for the reticulation,
distribution and consumption of potable water for the Site, this Plan has been prepared to meet the
requirements detailed in Minesites and Exploration Camps Drinking Water Quality Monitoring
Requirements (Department of Health (DoH), 2009a) which specifies the following:
Establish a Drinking Water Quality Management Plan in accordance with Model Drinking Water
Quality Management Plan (DoH, 2009b).
Establish a monitoring program as per Small Community Sampling Grid.
Reporting in accordance with Systems Compliance and Routine Reporting Requirements for
Minesites and Exploration Camps (DoH, 2011).
1.2 System layout The Site is located approximately 75 kilometres (km) north–east of Koolyanobbing, in the Shire of
Coolgardie, within the Goldfields Region of Western Australia (Figure 1).
The potable water system layout is shown on Figure 2, with the system schematic shown on Figure
3.
1.3 Duty of care holder The duty of care holder for the Site is currently the Project Leader for the Sandy Ridge Project.
Mr Michael Ingram
Level 34, Exchange Tower
2 The Esplanade, Perth, WA 6000
E-mail: [email protected]

0 Figure:
Drawn: CAD Resources ~ www.cadresources.com.auTel: (08) 9246 3242 ~ Fax: (08) 9246 3202A A4Rev:
Client: 20km
Scale 1:1,000,000MGA94 (Zone 51) AE Ref: THO2014-003 Regional Location
6550
000m
N
150000mE 200000mE 250000mE 300000mE 350000mE
6600
000m
N66
5000
0mN
6550
000m
N66
0000
0mN
6650
000m
N
150000mE 200000mE 250000mE 300000mE 350000mE
WindarlingWindarling
Mt JacksonMt Jackson
KoolyanobbingKoolyanobbing
CarinaCarina
Carina Mine CampCarina Mine Camp
Southern CrossSouthern Cross
CoolgardieCoolgardie
KambaldaKambalda
Perth to Kalgoorlie RailwayPerth to Kalgoorlie Railway
GREAT EASTERN HIGHWAY
GREAT EASTERN HIGHWAY
WESTERNWESTERN
AUSTRALIAAUSTRALIA
KalgoorlieKalgoorliePerthPerth
SANDY RIDGESANDY RIDGE
KalgoorlieKalgoorlie
Sandy Ridge Project
SANDY RIDGE PROJECTSANDY RIDGE PROJECT
Legend:Iron Ore MineRailMajor RoadMinor Road
KambaldaKambaldaNature ReserveNature Reserve
KaramindieKaramindieForestForest
ex Credoex CredoPastoral StationPastoral Station
ex Goongarrieex GoongarriePastoral StationPastoral Station
Mount Manning -Mount Manning -Helena AndHelena And
Aurora RangesAurora RangesConservation ParkConservation Park
Mount ManningMount ManningRange Nature ReserveRange Nature Reserve
ex Mt Jacksonex Mt JacksonPastoral StationPastoral Station
ex Ennuinex EnnuinPastoral StationPastoral Station
Wallaroo RockWallaroo RockConservation ParkConservation Park
YellowdineYellowdineNature ReserveNature Reserve
BoorabbinBoorabbinNational ParkNational Park
Goldfields WoodlandsGoldfields WoodlandsConservation ParkConservation Park
Goldfields WoodlandsGoldfields WoodlandsNational ParkNational Park
Goldfields WoodlandsGoldfields WoodlandsConservation ParkConservation Park
Goldfields WoodlandsGoldfields WoodlandsManagement AreaManagement Area
ex Jaurdiex JaurdiPastoral StationPastoral Station
Date: Apr 2016
J4J4
DPaW Managed Lands:Conservation ParkFormer LeaseholdNational ParkNature ReserveProposed Conservation and Mining ReserveState Forest
CAD Ref: g2294_WMP_01_01.dgn
IWDF access road
IWDF access road
IWDF Mount Walton EastIWDF Mount Walton East
Author: D. Bourke
Drinking Water Quality Management Plan 1
LOCALITY

Figure:
Drawn: CAD Resources ~ www.cadresources.com.auTel: (08) 9246 3242 ~ Fax: (08) 9246 3202A A4Rev:
0
AE Ref: THO2014-003
6630
000m
N
210000mE
6630
000m
N
210000mE
L 77/135L 77/135
Site Access RoadSite Access Road
220000mE
6640
000m
N
6640
000m
N
Class IIClass IILandfillLandfill
LandfillLandfillAccessAccessRoadRoad
AccommodationAccommodationCampCamp
Camp Access RoadCamp Access Road
Sandy Ridge Project
UndergroundUndergroundStorage AreaStorage Area
Pits/CellsPits/Cells Infrastructure AreaInfrastructure Area
Client:
220000mE
Scale 1:100,000MGA94 (Zone 51)
1.5km
CAD Ref: g2294_WMP_02_01.dgn
M77/1244-IM77/1244-I
E77/2225-IE77/2225-I
E77/1418-IE77/1418-I
M77/1261-IM77/1261-I
M77/2077-IM77/2077-I
E77/2225-IE77/2225-I
L15/305
L15/305
E16/440E16/440
M 16/540M 16/540
ex Jaurdi Pastoral Stationex Jaurdi Pastoral Station
Proposed ConservationProposed Conservationand Mining Reserveand Mining Reserve
Water PipelineWater Pipeline
Legend:InfrastructureDevelopment EnvelopeProposed Mining TenementProposed Miscellaneous LicenceMining TenementExploration LicenceMiscellaneous LicenceCarina Mine Pit Boundaryex Jaurdi Pastoral StationProposed Conservation & Mining Reserve
Carina Pit - Potable Water Source for Sandy Ridge ProjectCarina Pit - Potable Water Source for Sandy Ridge Project
2Drinking Water Quality Management PlanAuthor: D. Bourke
Date: April 2016
Potable Water Source Location
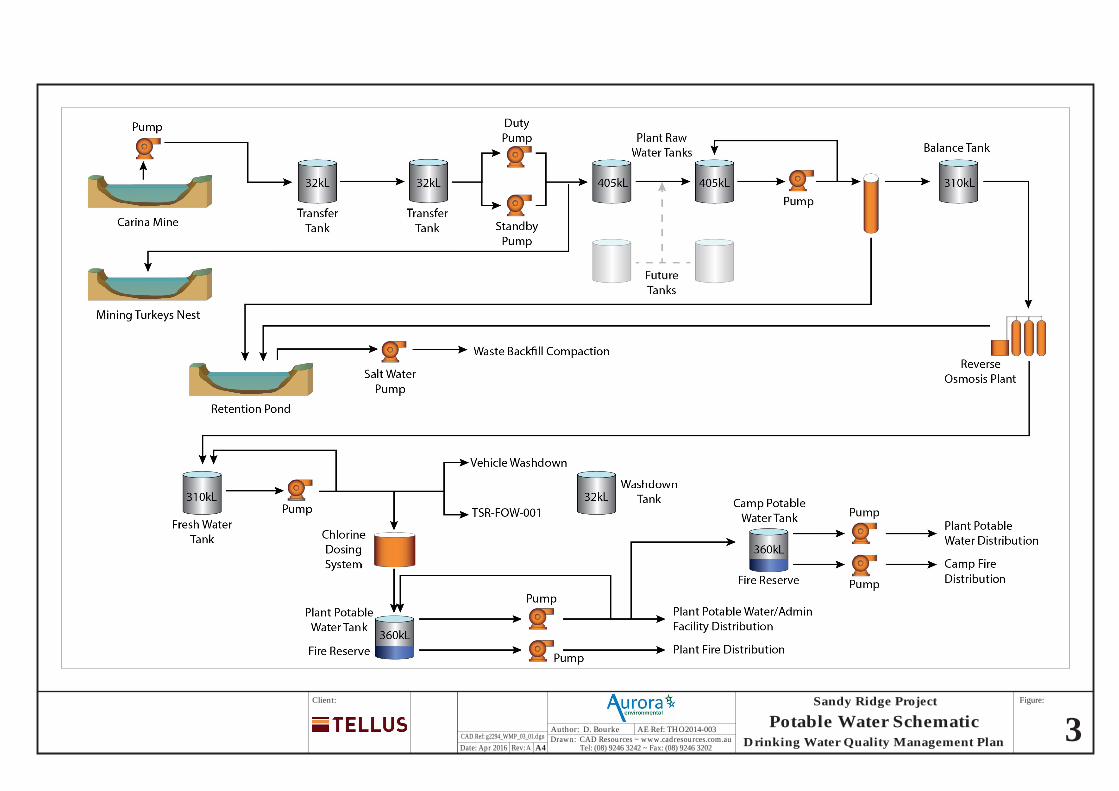
Figure:
Drawn: CAD Resources ~ www.cadresources.com.auTel: (08) 9246 3242 ~ Fax: (08) 9246 3202A A4Rev:
Client:
AE Ref: THO2014-003
Sandy Ridge Project
Date: Apr 2016
Author: D. Bourke
Drinking Water Quality Management PlanCAD Ref: g2294_WMP_03_01.dgn 3Potable Water Schematic

Sandy Ridge Project Drinking Water Quality Management Plan Chapter 1: General Information
10 Drinking Water Quality Management Plan Version 0.1
1.4 Water users The potable water system will have the capacity to service all potable water requirements at the
mine and accommodation camp, expected to be approximately 40 people. It is anticipated that
2,044 kL of potable water will be required per annum (based on 140 litres per person per day).

Sandy Ridge Project Drinking Water Quality Management Plan Chapter 2: Drinking Water Supply System Information
11 Drinking Water Quality Management Plan Version 0.1
2 DRINKING WATER SUPPLY SYSTEM INFORMATION
2.1 Water harvesting / abstraction sources and methods Water will be sourced from Mineral Resources’ Carina Iron Ore Mine Pit, located 15 km to the south-
west of the Site (Figure 2), which currently has excess water disposed of in evaporation ponds. By
the time the Sandy Ridge Project commences, the mine pit will have been closed. Mineral Resources’
mine closure plan includes partially backfilling the mine pit and then leaving it to flood as the
groundwater recovers following dewatering activities. The mine pit will be accessed via a dedicated
water pipeline. Analytical water quality data for the source water is included as Appendix A.1.
2.2 Storage system The water storage system for the Sandy Ridge Project is summarised in Table 2–1. All tanks will be
constructed of steel and will be sealed to prevent animal/insect intrusion. All tanks will be
structurally sound and compliant with relevant Australian Standards.
Table 2–1 Water storage system
Tank Details Tank Capacity (kL) Location Pre/Post Treatment
Turnover Time
Transfer Tank 1 32 Mine Pre-treatment X
Transfer Tank 2 32 Mine Pre-treatment X
Plant Raw Water Tank 1
405 Mine Pre-treatment X
Plant Raw Water Tank 2
405 Mine Pre-treatment X
Balance Tank 310 Mine Pre-treatment X
Fresh Water Tank 310 Mine Post-treatment x
Washdown Tank 32 Mine Post-treatment x
Plant Potable Water Tank (inc fire reserve)
360 Mine Post-treatment x
Camp Potable Water Tank (inc fire reserve)
360 Accommodation Camp
Post-treatment x
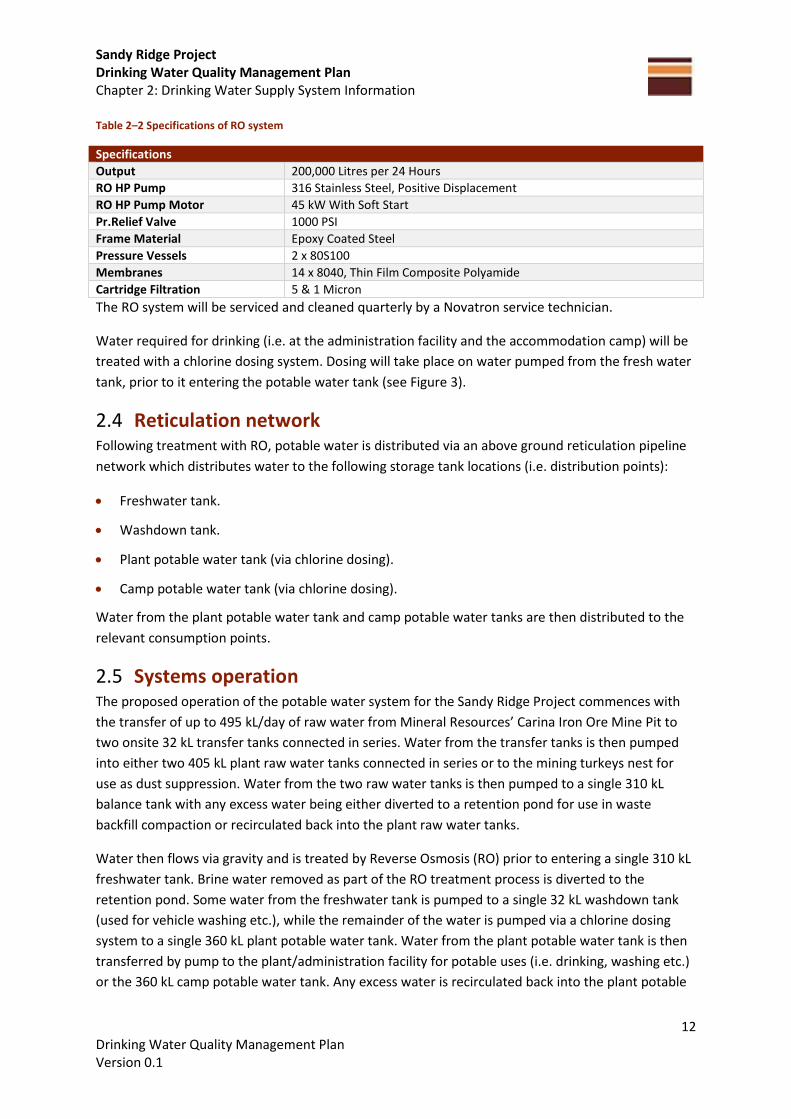
2.3 Treatment system Water for potable use will be treated by a Novatron SWE 200 kL/day RO system. Specifications of
this system are provided in Table 2–2.
Sandy Ridge Project Drinking Water Quality Management Plan Chapter 2: Drinking Water Supply System Information
12 Drinking Water Quality Management Plan Version 0.1
Table 2–2 Specifications of RO system
Specifications
Output 200,000 Litres per 24 Hours
RO HP Pump 316 Stainless Steel, Positive Displacement
RO HP Pump Motor 45 kW With Soft Start
Pr.Relief Valve 1000 PSI
Frame Material Epoxy Coated Steel
Pressure Vessels 2 x 80S100
Membranes 14 x 8040, Thin Film Composite Polyamide
Cartridge Filtration 5 & 1 Micron
The RO system will be serviced and cleaned quarterly by a Novatron service technician.
Water required for drinking (i.e. at the administration facility and the accommodation camp) will be
treated with a chlorine dosing system. Dosing will take place on water pumped from the fresh water
tank, prior to it entering the potable water tank (see Figure 3).
2.4 Reticulation network Following treatment with RO, potable water is distributed via an above ground reticulation pipeline
network which distributes water to the following storage tank locations (i.e. distribution points):
Freshwater tank.
Washdown tank.
Plant potable water tank (via chlorine dosing).
Camp potable water tank (via chlorine dosing).
Water from the plant potable water tank and camp potable water tanks are then distributed to the
relevant consumption points.
2.5 Systems operation The proposed operation of the potable water system for the Sandy Ridge Project commences with
the transfer of up to 495 kL/day of raw water from Mineral Resources’ Carina Iron Ore Mine Pit to
two onsite 32 kL transfer tanks connected in series. Water from the transfer tanks is then pumped
into either two 405 kL plant raw water tanks connected in series or to the mining turkeys nest for
use as dust suppression. Water from the two raw water tanks is then pumped to a single 310 kL
balance tank with any excess water being either diverted to a retention pond for use in waste
backfill compaction or recirculated back into the plant raw water tanks.
Water then flows via gravity and is treated by Reverse Osmosis (RO) prior to entering a single 310 kL
freshwater tank. Brine water removed as part of the RO treatment process is diverted to the
retention pond. Some water from the freshwater tank is pumped to a single 32 kL washdown tank
(used for vehicle washing etc.), while the remainder of the water is pumped via a chlorine dosing
system to a single 360 kL plant potable water tank. Water from the plant potable water tank is then
transferred by pump to the plant/administration facility for potable uses (i.e. drinking, washing etc.)
or the 360 kL camp potable water tank. Any excess water is recirculated back into the plant potable

Sandy Ridge Project Drinking Water Quality Management Plan Chapter 2: Drinking Water Supply System Information
13 Drinking Water Quality Management Plan Version 0.1
water tank. Some water from the plant potable water tank is also reserved for plant fire distribution.
Water from the camp potable water tank is distributed to the camp for potable water uses (i.e.
drinking, showering, washing etc.). A schematic of the potable water system is shown in Figure 3.
2.6 Operational monitoring and maintenance Operational monitoring and maintenance systems will be in place to ensure the provision of safe
potable water throughout the life of the mine, as outlined in Table 2–3.
Table 2–3 Monitoring and maintenance summary
Monitoring/Maintenance Frequency Responsibility
Visual inspection of source water pipeline, storage tanks and reticulation pipeline network
Weekly Maintenance Department
RO system Quarterly Maintenance Department
Chlorine dosing system Monthly Maintenance Department
Water Quality See Section 4 Environmental Department
2.7 System operators competency All personnel operating the potable water supply system will have the appropriate qualifications and
training to do so.

Sandy Ridge Project Drinking Water Quality Management Plan Chapter 3: Catchment
14 Drinking Water Quality Management Plan Version 0.1
3 CATCHMENT
3.1 Map of catchment area Potable water will be harvested from the Carina Iron Ore Mine Pit which is located in the upper
portion of the regional Swan Avon Yilgarn catchment area (Figure 4).The Carina Iron Ore Mine Pit
intersects a goethite–hematite orebody that constitutes the main aquifer. The ore is known to be
highly vuggy and locally cavernous with a correspondingly high permeability. The adjoining mafic
rocks appear to be relatively unfractured and excluding the contact zones between the Banded Iron
Formation and country rock which are often permeable groundwater conduits, only minor aquifers
exist outside of the major ore body aquifer. Water within this aquifer has a salinity of approximately
33,000 mg/L and a pH of approximately 7.5 – 8.0. As the annual recharge rate from rainfall is very
small in the area, groundwater resources are considered in terms of groundwater in storage.
3.2 Risk assessment of catchment area Given the location of the Carina Iron Ore Mine Pit (source water) in the upper portion of the Swan
Avon Yilgarn catchment as well as the low rainfall, high evaporation rates, lack of major surface
water flow paths and the significant depth to groundwater in the catchment area, risks of
contamination to the aquifer (water source) are considered to be very low. The main risks will likely
be associated with historic mining activities and facilities by Mineral Resources in the vicinity of the
mine pit.
A risk assessment of the catchment area is summarised in Table 3–1.
Table 3–1 Catchment area risk assessment
Risks Hazards Management Management Priority
Historic Effluent Ponds Nutrients, micro-organisms (i.e. Thermotolerant coliforms and E. Coli)
Managed under Mineral Resources Mine Closure Plan Regular visual inspection of remaining infrastructure as required
Low
Historic Evaporation Ponds
Metals Sulfides
Low
Historic Fuel Storage Hydrocarbons Low
Historic Chemical Storage
Nutrients Acids/Alkali
Low
Acid Mine Drainage Acidification of groundwater Increased metals
Review of water quality data
Low

0 Figure:
Drawn: CAD Resources ~ www.cadresources.com.auTel: (08) 9246 3242 ~ Fax: (08) 9246 3202A A4Rev:
Client: 50km
Scale 1:2,500,000MGA94 (Zone 51) AE Ref: THO2014-003
LeonoraLeonora
Sandy Ridge Project
SANDY RIDGE PROJECTSANDY RIDGE PROJECT
Date: Apr 2016CAD Ref: g2294_WMP_04_01.dgn
Author: D. Bourke
Drinking Water Quality Management Plan 4Regional Catchment Area
0mE 200000mE 400000mE
6600
000m
N68
0000
0mN
200000mE0mE 400000mE
6800
000m
N66
0000
0mN
Carina Iron Ore Mine Pit (Source Water)Carina Iron Ore Mine Pit (Source Water)
Swan Avon / YilgarnSwan Avon / YilgarnCatchmentCatchment
Raeside - PontonRaeside - PontonCatchmentCatchment
MenziesMenzies
KalgoorlieKalgoorlie
CoolgardieCoolgardie
Southern CrossSouthern Cross KambaldaKambalda
BencubbinBencubbin
KellerberrinKellerberrin
MerredinMerredin
Legend:Site LocationCarina Mine (Source Water)Raeside - Ponton CatchmentSwan Avon / Yilgarn CatchmentMajor RoadMinor Road

Sandy Ridge Project Drinking Water Quality Management Plan Chapter 3: Catchment
16 Drinking Water Quality Management Plan Version 0.1
3.4 Catchment monitoring and maintenance Due to the lack of catchment contamination pathways, formalised catchment monitoring is not
considered necessary for this potable water source. Opportunistic sightings of potentially
contaminating activities in the catchment area will be addressed and any contaminating activities
that occur with potential to impact on the potable supply source will be managed accordingly.

Sandy Ridge Project Drinking Water Quality Management Plan Chapter 4: Monitoring Requirements
17 Drinking Water Quality Management Plan Version 0.1
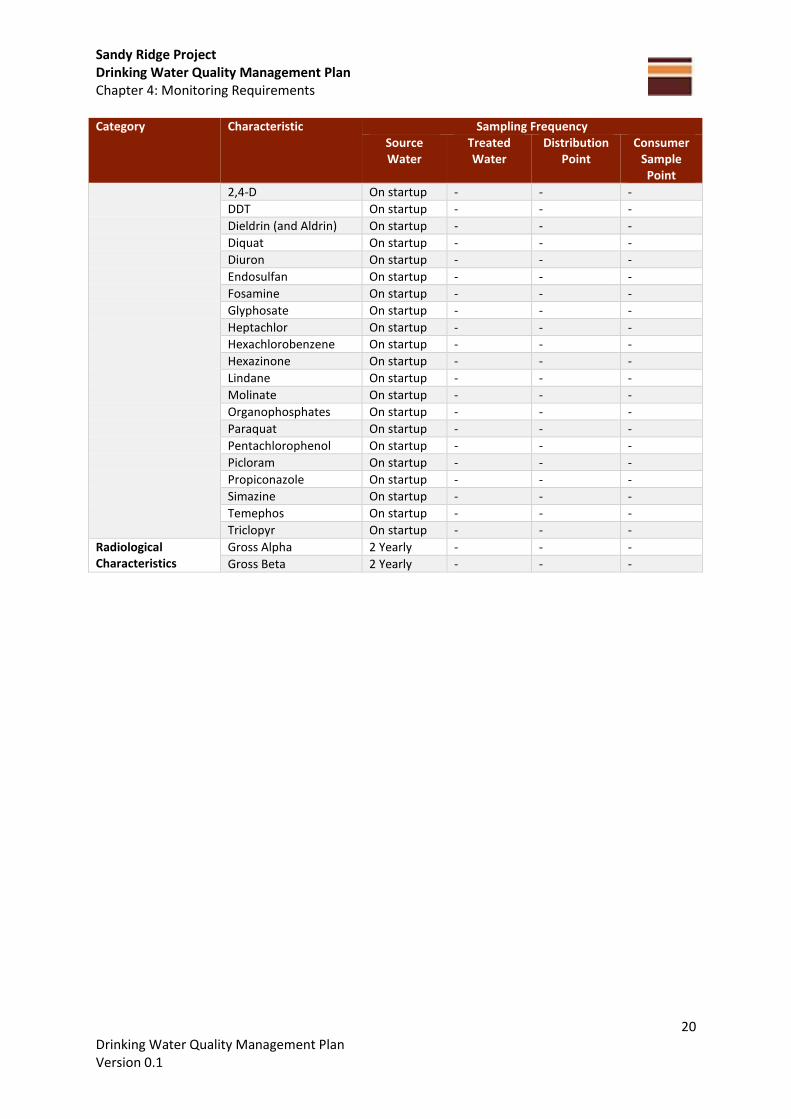
4 MONITORING REQUIREMENTS
The water quality monitoring plan is outlined in Table 4–1 and has been prepared in accordance with
the DoH’s Small Community Model Assessable Sampling Grid. Disinfection will be through RO
filtration and Chlorination.
Sample points are defined as follows:
Source Water – Carine Iron Ore Mine Pit.
Treated Water – A sample taken from the chlorination dosing system immediately after
treatment.
Distribution Point – Samples taken from the pump following the storage tanks at each storage
tank location (i.e. potable water tank and camp potable water tank).
Consumer Sample Point – A sample will be taken at all distribution areas (i.e. the kitchen,
accommodation camp and administration/production facilities).
Table 4–1 Water quality monitoring plan
Category Characteristic Sampling Frequency
Source Water
Treated Water
Distribution Point
Consumer Sample Point
Micro-organisms
Thermo-tolerant coliforms (or E. coli)
Monthly - Monthly
Amoeba (Naegleria fowleri)
- - Monthly
Physical Characteristics
Dissolved Oxygen - - 6 Monthly
Hardness - 6 Monthly
pH - 6 Monthly
Taste and odour - Annually
Temperature - 6 Monthly
Total Dissolved Solids - 6 Monthly
True Colour - 6 Monthly
Turbidity - 6 Monthly
1. Inorganic Chemicals Disinfection Agents and Inorganic By-products of Disinfection
Chlorine (free) - Monthly
Trihalomethanes - 6 monthly
Organic Chemicals Disinfection By-products A
Chloroacetic Acid - 6 monthly
Dichloroacetic Acid - 6 monthly
Trichloroacetic Acid - 6 monthly
2-chlorophenol - 6 monthly
2,4-dichlorophenol - 6 monthly
2,4,6-trichlorophenol - - - 6 monthly
Trichloroacetaldehyde - - - 6 monthly

Sandy Ridge Project Drinking Water Quality Management Plan Chapter 4: Monitoring Requirements
18 Drinking Water Quality Management Plan Version 0.1
Category Characteristic Sampling Frequency Source Water
Treated Water
Distribution Point
Consumer Sample Point
(chloral hydrate)
2. Other Inorganic Chemicals
Aluminium (acid-soluble)
- - Annually -
Ammonia (as NH4) - - Annually -
Antimony - - - Annually
Arsenic - Annually - -
Asbestos - - 2 Yearly -
Barium Annually - - -
Beryllium 2 Yearly - - -
Boron Annually - - -
Cadmium - - - Annually
Chloride - Annually - -
Chromium (as Cr(VI)) - - Annually -
Copper - - - Annually
Cyanide - - Annually -
Fluoride Annually - - -
Hydrogen Sulfide - Annually -
Iodide 2 Yearly - - -
Iron - Annually - -
Lead - - - Annually
Manganese - Annually - -
Mercury Annually - - -
Molybdenum Annually - - -
Nickel - - - Annually
Nitrate - - Annually -
Nitrite - - Annually -
Selenium Annually - - -
Silver 2 Yearly - - -
Sodium - Annually - -
Sulfate - Annually - -
Tin 2 Yearly - - -
Uranium 2 Yearly - - -
Zinc - - - Annually
Organic Compounds Treatment Organics (other than Disinfection By-products)
Acrylamide - Annually - -
Carbon tetrachloride - Annually - -
Organic Compounds Industrial Hydrocarbons 1 (other than Disinfection By-products)
Benzene 2 Yearly - - -
Chlorobenzene 2 Yearly - - -
Dichlorobenzenes 1,2-dichlorobenzene (1,2-DCB)
2 Yearly - - -
Dichlorobenzenes 1,3-dichlorobenzene (1,3-DCB)
2 Yearly - - -
Dichlorobenzenes 1,4-dichlorobenzene (1,4-
2 Yearly - - -

Sandy Ridge Project Drinking Water Quality Management Plan Chapter 4: Monitoring Requirements
19 Drinking Water Quality Management Plan Version 0.1
Category Characteristic Sampling Frequency Source Water
Treated Water
Distribution Point
Consumer Sample Point
DCB)
Dichloroethanes 1, 1-dichloroethane
2 Yearly - - -
Dichloroethanes 1, 2-dichloroethane
2 Yearly - - -
Dichloroethenes 1, 1-dichloroethene (1,1-DCE)
2 Yearly - - -
Dichloroethenes 1, 2-dichloroethene (1,2-DCE)
2 Yearly - - -
Dichloromethane (methylene chloride)
2 Yearly - - -
Epichlorohydrin 2 Yearly - - -
Ethylbenzene 2 Yearly - - -
Ethylenediamine tetraacetic acid (EDTA)
2 Yearly - - -
Hexachlorobutadiene 2 Yearly - - -
Nitrilotriacetic acid (NTA)
2 Yearly - - -
Styrene (vinylbenzene) 2 Yearly - - -
Trichlorobenzenes (total)
2 Yearly - - -
1,1,1-Trichloroethane 2 Yearly - - -
Vinyl chloride 2 Yearly - - -
Organic Compounds Industrial Hydrocarbons 2 (other than Disinfection By-products)
Organotins dialkyltins 2 Yearly - - -
Organotins tributyltin oxide
2 Yearly - - -
Plasticisers di(2-ethylhexyl) phthalate (DEHP)
- - - 2 Yearly
Plasticisers di(2-ethylhexyl) adipate (DEHA)
- - - 2 Yearly
Polycyclic aromatic hydrocarbons (PAHs) Benzo-(a)-pyrene
- - - 2 Yearly
Toluene - - 2 Yearly -
Xylene - - 2 Yearly -
Organic Compounds (other than Disinfection By-products)
Tetrachloroethene 2 Yearly - - -
Trichloroethylene (TCE) 2 Yearly - - -
Pesticides Aldrin (and Dieldrin) On startup - - -
Amitrole On startup - - -
Atrazine On startup - - -
Chlordane On startup - - -
Chlorfenvinphos On startup - - -
Clopyralid On startup - - -
Sandy Ridge Project Drinking Water Quality Management Plan Chapter 4: Monitoring Requirements
20 Drinking Water Quality Management Plan Version 0.1
Category Characteristic Sampling Frequency Source Water
Treated Water
Distribution Point
Consumer Sample Point
2,4-D On startup - - -
DDT On startup - - -
Dieldrin (and Aldrin) On startup - - -
Diquat On startup - - -
Diuron On startup - - -
Endosulfan On startup - - -
Fosamine On startup - - -
Glyphosate On startup - - -
Heptachlor On startup - - -
Hexachlorobenzene On startup - - -
Hexazinone On startup - - -
Lindane On startup - - -
Molinate On startup - - -
Organophosphates On startup - - -
Paraquat On startup - - -
Pentachlorophenol On startup - - -
Picloram On startup - - -
Propiconazole On startup - - -
Simazine On startup - - -
Temephos On startup - - -
Triclopyr On startup - - -
Radiological Characteristics
Gross Alpha 2 Yearly - - -
Gross Beta 2 Yearly - - -
Sandy Ridge Project Drinking Water Quality Management Plan Chapter 5: Incidence Response Procedure
21 Drinking Water Quality Management Plan Version 0.1
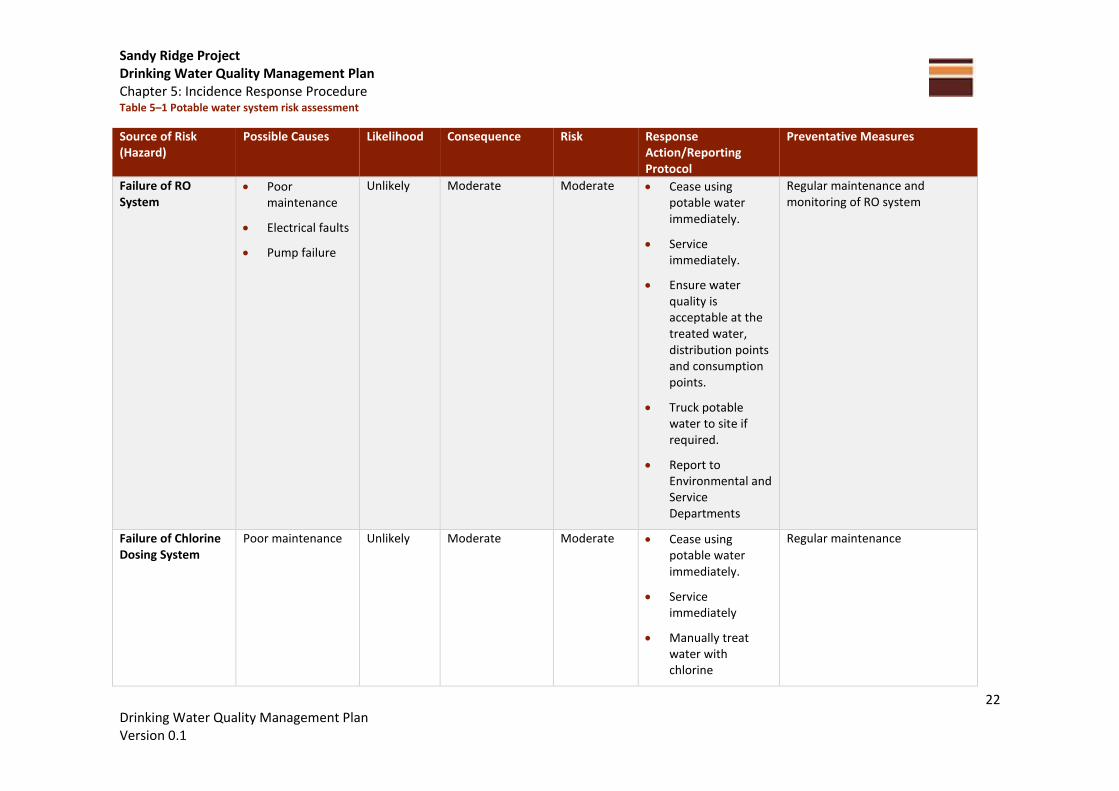
5 INCIDENCE RESPONSE PROCEDURE
A risk assessment for the potable water system is provided in Table 5–1.
Sandy Ridge Project Drinking Water Quality Management Plan Chapter 5: Incidence Response Procedure
22 Drinking Water Quality Management Plan Version 0.1
Table 5–1 Potable water system risk assessment
Source of Risk (Hazard)
Possible Causes Likelihood Consequence Risk Response Action/Reporting Protocol
Preventative Measures
Failure of RO System
Poor maintenance
Electrical faults
Pump failure
Unlikely Moderate Moderate Cease using potable water immediately.
Service immediately.
Ensure water quality is acceptable at the treated water, distribution points and consumption points.
Truck potable water to site if required.
Report to Environmental and Service Departments
Regular maintenance and monitoring of RO system
Failure of Chlorine Dosing System
Poor maintenance Unlikely Moderate Moderate Cease using potable water immediately.
Service immediately
Manually treat water with chlorine
Regular maintenance

Sandy Ridge Project Drinking Water Quality Management Plan Chapter 5: Incidence Response Procedure
23 Drinking Water Quality Management Plan Version 0.1
Source of Risk (Hazard)
Possible Causes Likelihood Consequence Risk Response Action/Reporting Protocol
Preventative Measures
Ensure water quality is acceptable at the treated water, distribution points and consumption points.
Truck potable water to site if required.
Report to Environmental and Service Departments.
Hydrocarbon spill when refuelling pumps
Over filling
Spillage
Fuel pump failure
Unlikely Minor Moderate Immediate clean-up of spill area
Ensure water quality is acceptable at distribution points and consumption points.
Report to Environmental Department
Refuelling procedure in place
Competently trained operators
Spill kits available when refuelling
Refuelling on-site is within a separate catchment area and will not impact source water
Leakage of tanks and/or pipes
Vehicle impacts with pipelines
Poor sealing of pipes and
Possible Moderate High Determine location of leak or break in the system.
Regular inspections of potable water infrastructure

Sandy Ridge Project Drinking Water Quality Management Plan Chapter 5: Incidence Response Procedure
24 Drinking Water Quality Management Plan Version 0.1
Source of Risk (Hazard)
Possible Causes Likelihood Consequence Risk Response Action/Reporting Protocol
Preventative Measures
fittings Repair immediately.
Determine available potable water remaining on-site.
Truck potable water to site if required.
Report to Service Department
Sandy Ridge Project Drinking Water Quality Management Plan Chapter 6: Reporting Requirements
25 Drinking Water Quality Management Plan Version 0.1
6 REPORTING REQUIREMENTS
All reporting (emergency and routine) will be conducted in accordance with Systems Compliance and
Routine Reporting Requirements for Minesites And Exploration Camps (DoH, 2011). Appendix A.2
provides a model reporting format to be used for submission to the DoH.

Sandy Ridge Project Drinking Water Quality Management Plan Chapter 7: References
26 Drinking Water Quality Management Plan Version 0.1
7 REFERENCES
Department of Health, 2009a, Minesites and Exploration Camps Drinking Water Quality Monitoring
Requirements.
Department of Health, 2009b, Model Drinking Water Quality Management Plan.
Department of Health, 2011, Systems Compliance and Routine Reporting Requirements for Minesites
and Exploration Camps.
DoH see Department of Health.

Sandy Ridge Project Drinking Water Quality Management Plan Appendices
27 Drinking Water Quality Management Plan Version 0.1
APPENDICES

Sandy Ridge Project Drinking Water Quality Management Plan Appendices
28 Drinking Water Quality Management Plan Version 0.1
A.1 Analytical water quality data
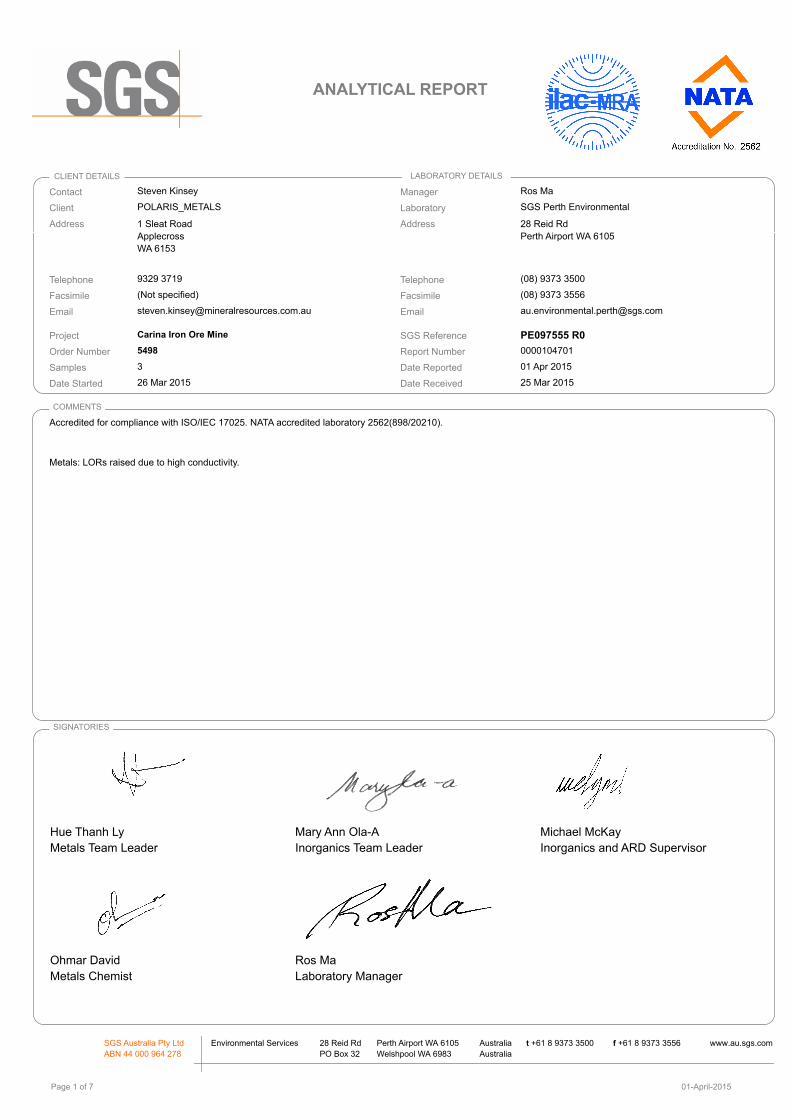
Date Reported
0000104701Report Number
Contact
SGS Perth Environmental
28 Reid Rd
Perth Airport WA 6105
Ros Ma
(08) 9373 3500
(08) 9373 3556
3
SGS Reference
Facsimile
Telephone
Address
Manager
Laboratory
5498
Carina Iron Ore Mine
(Not specified)
9329 3719
1 Sleat Road
Applecross
WA 6153
POLARIS_METALS
Steven Kinsey
Samples
Order Number
Project
Facsimile
Telephone
Address
Client
CLIENT DETAILS LABORATORY DETAILS
01 Apr 2015
ANALYTICAL REPORT
PE097555 R0
25 Mar 2015Date ReceivedDate Started 26 Mar 2015
Metals: LORs raised due to high conductivity.
Accredited for compliance with ISO/IEC 17025. NATA accredited laboratory 2562(898/20210).
COMMENTS
Hue Thanh Ly
Metals Team Leader
Mary Ann Ola-A
Inorganics Team Leader
Michael McKay
Inorganics and ARD Supervisor
Ohmar David
Metals Chemist
Ros Ma
Laboratory Manager
SIGNATORIES
SGS Australia Pty Ltd
ABN 44 000 964 278
Environmental Services 28 Reid Rd
PO Box 32
Perth Airport WA 6105
Welshpool WA 6983
Australia
Australia
t +61 8 9373 3500 f +61 8 9373 3556 www.au.sgs.com
Page 1 of 7 01-April-2015

PE097555 R0ANALYTICAL REPORT
PE097555.001
Water
24/3/15 15:15
WRD1
PE097555.002
Water
24/3/15 15:40
WRD2
PE097555.003
Water
24/3/15 16:10
WRD3
Parameter LORUnits
Sample Number
Sample Matrix
Sample Date
Sample Name
pH in water Method: AN101 Tested: 25/3/2015
pH** pH Units - 7.2 7.5 7.4
Conductivity and TDS by Calculation - Water Method: AN106 Tested: 25/3/2015
Conductivity @ 25 C µS/cm 2 45000 52000 53000
Total Dissolved Solids (TDS) in water Method: AN113 Tested: 30/3/2015
Total Dissolved Solids Dried at 175-185°C mg/L 10 31000 36000 37000
Alkalinity Method: ME-AU-ENVAN135 Tested: 25/3/2015
Total Alkalinity as CaCO3 mg/L 5 420 710 540
Carbonate Alkalinity as CO3 mg/L 1 <1 <1 <1
Bicarbonate Alkalinity as HCO3 mg/L 5 520 870 650
Acidity and Free CO2 Method: AN140 Tested: 25/3/2015
Acidity to pH 8.3 mg CaCO3/L 5 85 100 89
Nitrate Nitrogen and Nitrite Nitrogen (NOx) by FIA Method: AN258 Tested: 30/3/2015
Nitrate, NO₃ as NO₃ mg/L 0.2 0.5 <0.2 <0.2
Chloride by Discrete Analyser in Water Method: AN274 Tested: 27/3/2015
Chloride, Cl mg/L 1 16000 18000 19000
Sulphate in water Method: AN275 Tested: 27/3/2015
Sulphate, SO4 mg/L 1 3100 3600 3700
Metals in Water (Dissolved) by ICPOES Method: AN320/AN321 Tested: 27/3/2015
Aluminium, Al mg/L 0.02 <0.10↑ <0.10↑ <0.10↑
Arsenic, As mg/L 0.02 <0.10↑ <0.10↑ <0.10↑
Cadmium, Cd mg/L 0.001 <0.005↑ <0.005↑ <0.005↑
Chromium, Cr mg/L 0.005 <0.025↑ <0.025↑ <0.025↑
Copper, Cu mg/L 0.005 <0.025↑ 0.043 <0.025↑
Iron, Fe mg/L 0.02 <0.10↑ <0.10↑ <0.10↑
Lead, Pb mg/L 0.02 <0.10↑ <0.10↑ <0.10↑
Magnesium, Mg mg/L 0.1 1400 1600 1600
Manganese, Mn mg/L 0.005 0.11 0.43 0.33
Nickel, Ni mg/L 0.005 0.063 0.073 0.11
Potassium, K mg/L 0.1 150 180 160
Selenium, Se mg/L 0.05 <0.25↑ <0.25↑ <0.25↑
Silver, Ag mg/L 0.005 <0.025↑ <0.025↑ <0.025↑
Sodium, Na mg/L 0.5 8700 10000 11000
Zinc, Zn mg/L 0.01 0.07 <0.05↑ <0.05↑
01-April-2015Page 2 of 7

PE097555 R0ANALYTICAL REPORT
PE097555.001
Water
24/3/15 15:15
WRD1
PE097555.002
Water
24/3/15 15:40
WRD2
PE097555.003
Water
24/3/15 16:10
WRD3
Parameter LORUnits
Sample Number
Sample Matrix
Sample Date
Sample Name
Mercury (dissolved) in Water Method: AN311/AN312 Tested: 31/3/2015
Mercury mg/L 0.00005 <0.00005 <0.00005 <0.00005
01-April-2015Page 3 of 7
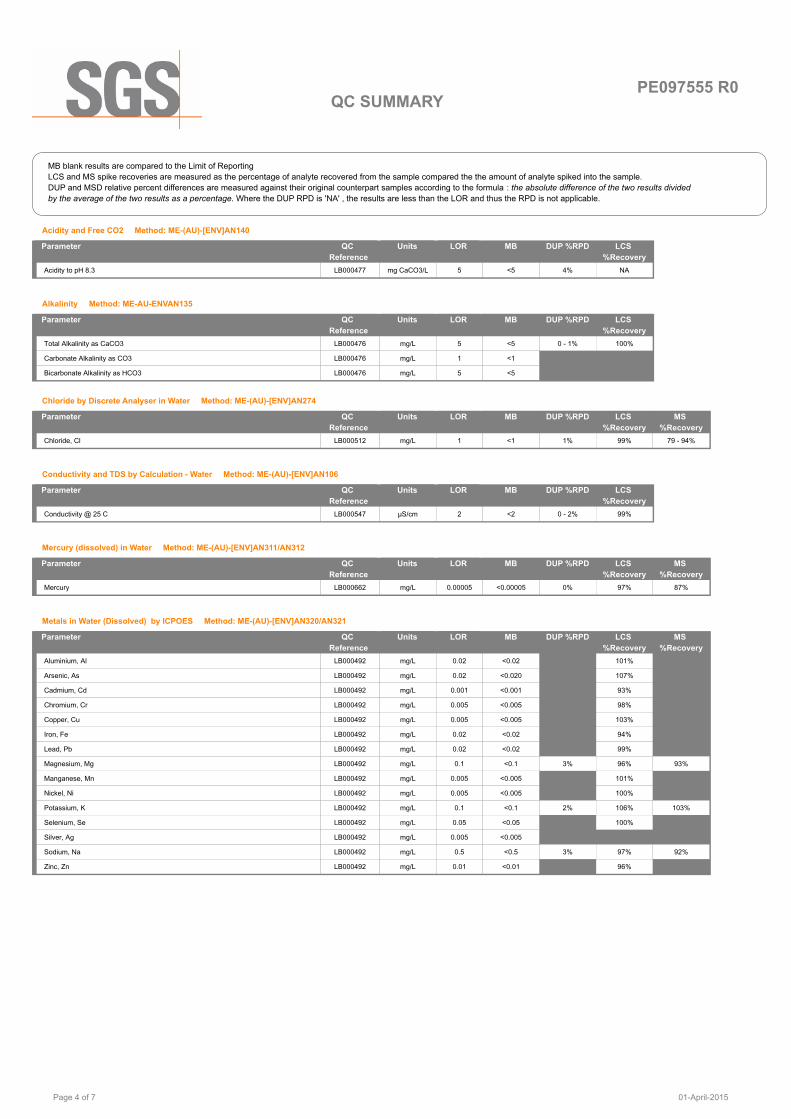
PE097555 R0QC SUMMARY
MB blank results are compared to the Limit of Reporting
LCS and MS spike recoveries are measured as the percentage of analyte recovered from the sample compared the the amount of analyte spiked into the sample.
DUP and MSD relative percent differences are measured against their original counterpart samples according to the formula : the absolute difference of the two results divided
by the average of the two results as a percentage. Where the DUP RPD is 'NA' , the results are less than the LOR and thus the RPD is not applicable.
Acidity and Free CO2 Method: ME-(AU)-[ENV]AN140
MB DUP %RPD LCS
%Recovery
Acidity to pH 8.3 LB000477 mg CaCO3/L 5 <5 4% NA
LORUnits Parameter QC
Reference
Alkalinity Method: ME-AU-ENVAN135
MB DUP %RPD LCS
%Recovery
Total Alkalinity as CaCO3 LB000476 mg/L 5 <5 0 - 1% 100%
Carbonate Alkalinity as CO3 LB000476 mg/L 1 <1
Bicarbonate Alkalinity as HCO3 LB000476 mg/L 5 <5
LORUnits Parameter QC
Reference
Chloride by Discrete Analyser in Water Method: ME-(AU)-[ENV]AN274
MB DUP %RPD LCS
%Recovery
MS
%Recovery
Chloride, Cl LB000512 mg/L 1 <1 1% 99% 79 - 94%
LORUnits Parameter QC
Reference
Conductivity and TDS by Calculation - Water Method: ME-(AU)-[ENV]AN106
MB DUP %RPD LCS
%Recovery
Conductivity @ 25 C LB000547 µS/cm 2 <2 0 - 2% 99%
LORUnits Parameter QC
Reference
Mercury (dissolved) in Water Method: ME-(AU)-[ENV]AN311/AN312
MB DUP %RPD LCS
%Recovery
MS
%Recovery
Mercury LB000662 mg/L 0.00005 <0.00005 0% 97% 87%
LORUnits Parameter QC
Reference
Metals in Water (Dissolved) by ICPOES Method: ME-(AU)-[ENV]AN320/AN321
MB DUP %RPD LCS
%Recovery
MS
%Recovery
Aluminium, Al LB000492 mg/L 0.02 <0.02 101%
Arsenic, As LB000492 mg/L 0.02 <0.020 107%
Cadmium, Cd LB000492 mg/L 0.001 <0.001 93%
Chromium, Cr LB000492 mg/L 0.005 <0.005 98%
Copper, Cu LB000492 mg/L 0.005 <0.005 103%
Iron, Fe LB000492 mg/L 0.02 <0.02 94%
Lead, Pb LB000492 mg/L 0.02 <0.02 99%
Magnesium, Mg LB000492 mg/L 0.1 <0.1 3% 96% 93%
Manganese, Mn LB000492 mg/L 0.005 <0.005 101%
Nickel, Ni LB000492 mg/L 0.005 <0.005 100%
Potassium, K LB000492 mg/L 0.1 <0.1 2% 106% 103%
Selenium, Se LB000492 mg/L 0.05 <0.05 100%
Silver, Ag LB000492 mg/L 0.005 <0.005
Sodium, Na LB000492 mg/L 0.5 <0.5 3% 97% 92%
Zinc, Zn LB000492 mg/L 0.01 <0.01 96%
LORUnits Parameter QC
Reference
01-April-2015Page 4 of 7

PE097555 R0QC SUMMARY
MB blank results are compared to the Limit of Reporting
LCS and MS spike recoveries are measured as the percentage of analyte recovered from the sample compared the the amount of analyte spiked into the sample.
DUP and MSD relative percent differences are measured against their original counterpart samples according to the formula : the absolute difference of the two results divided
by the average of the two results as a percentage. Where the DUP RPD is 'NA' , the results are less than the LOR and thus the RPD is not applicable.
pH in water Method: ME-(AU)-[ENV]AN101
MB DUP %RPD LCS
%Recovery
pH** LB000547 pH Units - 5.7 - 6.3 2% 100%
LORUnits Parameter QC
Reference
Sulphate in water Method: ME-(AU)-[ENV]AN275
MB DUP %RPD LCS
%Recovery
MS
%Recovery
Sulphate, SO4 LB000512 mg/L 1 <1 0 - 2% 101% 73 - 92%
LORUnits Parameter QC
Reference
Total Dissolved Solids (TDS) in water Method: ME-(AU)-[ENV]AN113
MB DUP %RPD LCS
%Recovery
MS
%Recovery
MSD %RPD
Total Dissolved Solids Dried at 175-185°C LB000631 mg/L 10 <10 2 - 3% 94 - 99% 100% 0%
LORUnits Parameter QC
Reference
01-April-2015Page 5 of 7

PE097555 R0
METHOD METHODOLOGY SUMMARY
METHOD SUMMARY
Nitrate and Nitrite by FIA: In an acidic medium, nitrate is reduced quantitatively to nitrite by cadmium metal. This
nitrite plus any original nitrite is determined as an intense red-pink azo dye at 540 nm following diazotisation with
sulphanilamide and subsequent coupling with N-(1-naphthyl) ethylenediamine dihydrochloride. Without the
cadmium reduction only the original nitrite is determined. Reference APHA 4500-NO3- F.
AN101 pH in Soil Sludge Sediment and Water: pH is measured electrometrically using a combination electrode (glass
plus reference electrode) and is calibrated against 3 buffers purchased commercially. For soils, an extract with
water is made at a ratio of 1:5 and the pH determined and reported on the extract. Reference APHA 4500-H+.
AN106 Conductivity and TDS by Calculation: Conductivity is measured by meter with temperature compensation and is
calibrated against a standard solution of potassium chloride. Conductivity is generally reported as µmhos/cm or
µS/cm @ 25°C. For soils, an extract with water is made at a ratio of 1:5 and the EC determined and reported on
the extract, or calculated back to the as-received sample. Total Dissolved Salts can be estimated from conductivity
using a conversion factor, which for natural waters, is in the range 0.55 to 0.75. SGS use 0.6. Reference APHA
2520 B.
AN113 Total Dissolved Solids: A well-mixed filtered sample of known volume is evaporated to dryness at 180°C and the
residue weighed. Approximate methods for correlating chemical analysis with dissolved solids are available.
Reference APHA 2540 C.
AN135 Alkalinity (and forms of) by Titration: The sample is titrated with standard acid to pH 8.3 (P titre) and pH 4.5 (T titre)
and permanent and/or total alkalinity calculated. The results are expressed as equivalents of calcium carbonate or
recalculated as bicarbonate, carbonate and hydroxide. Reference APHA 2320. Internal Reference AN135
AN135 Free and Total Carbon Dioxide may be calculated using alkalinity forms only when the samples TDS is <500mg/L.
If TDS is >500mg/L free or total carbon dioxide cannot be reported . APHA4500CO2 D.
AN140 Acidity by Tritration: The water sample is titrated with sodium hydroxide to designated pH end point. In a sample
containing only carbon dioxide, bicarbonates and carbonates, titration to pH 8.3 at 25°C corresponds to
stoichiometric neutralisation of carbonic acid to bicarbonate. Method reference APHA 2310 B.
AN274 Chloride by Aquakem DA: Chloride reacts with mercuric thiocyanate forming a mercuric chloride complex. In the
presence of ferric iron, highly coloured ferric thiocyanate is formed which is proportional to the chloride
concentration. Reference APHA 4500Cl-
AN275 Sulphate by Aquakem DA: Sulphate is precipitated in an acidic medium with barium chloride. The resulting turbidity
is measured photometrically at 405nm and compared with standard calibration solutions to determine the sulphate
concentration in the sample. Reference APHA 4500-SO42-. Internal reference AN275.
AN311/AN312 Mercury by Cold Vapour AAS in Waters: Mercury ions are reduced by stannous chloride reagent in acidic solution
to elemental mercury. This mercury vapour is purged by nitrogen into a cold cell in an atomic absorption
spectrometer or mercury analyser. Quantification is made by comparing absorbances to those of the calibration
standards. Reference APHA 3112/3500.
AN320/AN321 Metals by ICP-OES: Samples are preserved with 10% nitric acid for a wide range of metals and some non-metals.
This solution is measured by Inductively Coupled Plasma. Solutions are aspirated into an argon plasma at
8000-10000K and emit characteristic energy or light as a result of electron transitions through unique energy
levels. The emitted light is focused onto a diffraction grating where it is separated into components .
AN320/AN321 Photomultipliers or CCDs are used to measure the light intensity at specific wavelengths. This intensity is directly
proportional to concentration. Corrections are required to compensate for spectral overlap between elements.
Reference APHA 3120 B.
01-April-2015Page 6 of 7

PE097555 R0
This report must not be reproduced, except in full.
Samples analysed as received.
Solid samples expressed on a dry weight basis.
IS
LNR
*
**
^
Insufficient sample for analysis.
Sample listed, but not received.
This analysis is not covered by the scope of
accreditation.
Indicative data, theoretical holding time exceeded.
Performed by outside laboratory.
The QC criteria are subject to internal review according to the SGS QAQC plan and may be provided on request or alternatively can be found here:
http://www.sgs.com.au/~/media/Local/Australia/Documents/Technical%20Documents/MP-AU-ENV-QU-022%20QA%20QC%20Plan.pdf
FOOTNOTES
LOR
↑↓
QFH
QFL
-
NVL
Limit of Reporting
Raised or Lowered Limit of Reporting
QC result is above the upper tolerance
QC result is below the lower tolerance
The sample was not analysed for this analyte
Not Validated
Any other holder of this document is advised that information contained hereon reflects the Company 's findings at the time of its intervention only
and within the limits of Client's instructions, if any. The Company's sole responsibility is to its Client and this document does not exonerate parties to
a transaction from exercising all their rights and obligations under the transaction documents.
This document is issued, on the Client 's behalf, by the Company under its General Conditions of Service available on request and accessible at
http://www.sgs.com/en/Terms-and-Conditions/General-Conditions-of-Services-English.aspx . The Client's attention is drawn to the limitation of
liability, indemnification and jurisdiction issues defined therein.
Some totals may not appear to add up because the total is rounded after adding up the raw values.
01-April-2015Page 7 of 7
Sandy Ridge Project Drinking Water Quality Management Plan Appendices
29 Drinking Water Quality Management Plan Version 0.1
A.2 Systems Compliance and Routine Reporting
Requirements for Minesites And Exploration Camps
Delivering a Healthy WA 1
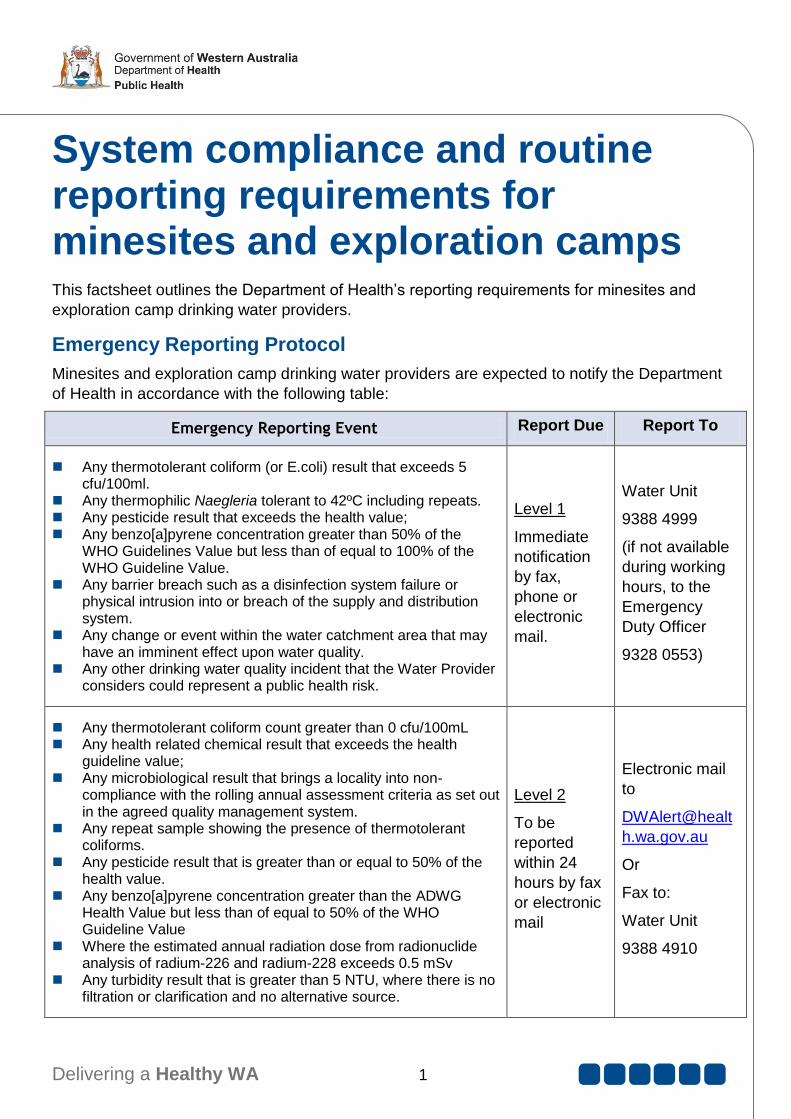
System compliance and routine reporting requirements for minesites and exploration camps This factsheet outlines the Department of Health’s reporting requirements for minesites and
exploration camp drinking water providers.
Emergency Reporting Protocol
Minesites and exploration camp drinking water providers are expected to notify the Department
of Health in accordance with the following table:
Emergency Reporting Event Report Due Report To
Any thermotolerant coliform (or E.coli) result that exceeds 5 cfu/100ml.
Any thermophilic Naegleria tolerant to 42ºC including repeats. Any pesticide result that exceeds the health value; Any benzo[a]pyrene concentration greater than 50% of the
WHO Guidelines Value but less than of equal to 100% of the WHO Guideline Value.
Any barrier breach such as a disinfection system failure or physical intrusion into or breach of the supply and distribution system.
Any change or event within the water catchment area that may have an imminent effect upon water quality.
Any other drinking water quality incident that the Water Provider considers could represent a public health risk.
Level 1
Immediate
notification
by fax,
phone or
electronic
mail.
Water Unit
9388 4999
(if not available
during working
hours, to the
Emergency
Duty Officer
9328 0553)
Any thermotolerant coliform count greater than 0 cfu/100mL Any health related chemical result that exceeds the health
guideline value; Any microbiological result that brings a locality into non-
compliance with the rolling annual assessment criteria as set out in the agreed quality management system.
Any repeat sample showing the presence of thermotolerant coliforms.
Any pesticide result that is greater than or equal to 50% of the health value.
Any benzo[a]pyrene concentration greater than the ADWG Health Value but less than of equal to 50% of the WHO Guideline Value
Where the estimated annual radiation dose from radionuclide analysis of radium-226 and radium-228 exceeds 0.5 mSv
Any turbidity result that is greater than 5 NTU, where there is no filtration or clarification and no alternative source.
Level 2
To be
reported
within 24
hours by fax
or electronic
Electronic mail
to
DWAlert@healt
h.wa.gov.au
Or
Fax to:
Water Unit
9388 4910

Delivering a Healthy WA 2
Routine Reporting Format
The 2004 Australian Drinking Water Guidelines provide the basis for the reporting protocol to
the Department of Health. Model reporting formats (Appendix 1) should be read in conjunction
with the summary of reporting requirements.
Summary of Reporting Requirements
Report
No. Report Title
Page
Number Quarterly Annually
Administration
1 Sample Cover Page i
2 Water Provider Information 1
3 System Information 1
4 Performance Summary 2
Microbial Performance - (Rolling 12 Months Ending)
5 Microbiological - Exception Notifications 3
6 Microbiological - Compliance By
Region/Scheme/Zone/Service Provider (Summary) 4
(1) (2)
7 Microbiological - Performance Community Specific 4
8 Microbiological - Charts By
Region/Scheme/Zone/Service Provider 5
(1) (2)
9 Microbiological Incident Specific Information 6
Chemical - Health Related Performance
10 Chemical - Health Related - Exception Notifications 7
11 Chemical - Health Related 7 (3)
Chemical - Aesthetic Performance
12 Chemical - Aesthetic - Charts 8
13 Chemical - Aesthetic - Incident Specific Information 8
Radiological Performance
14 Radiological - Exception Notifications 9
15 Radiological Performance 9
Sampling
16 Planned Sample Report (5)
(5)
17 Planned Sample Summary 10
18 Planned Sample Exceptions 10
19 General Notes/Other News 11 (4)
Delivering a Healthy WA 3
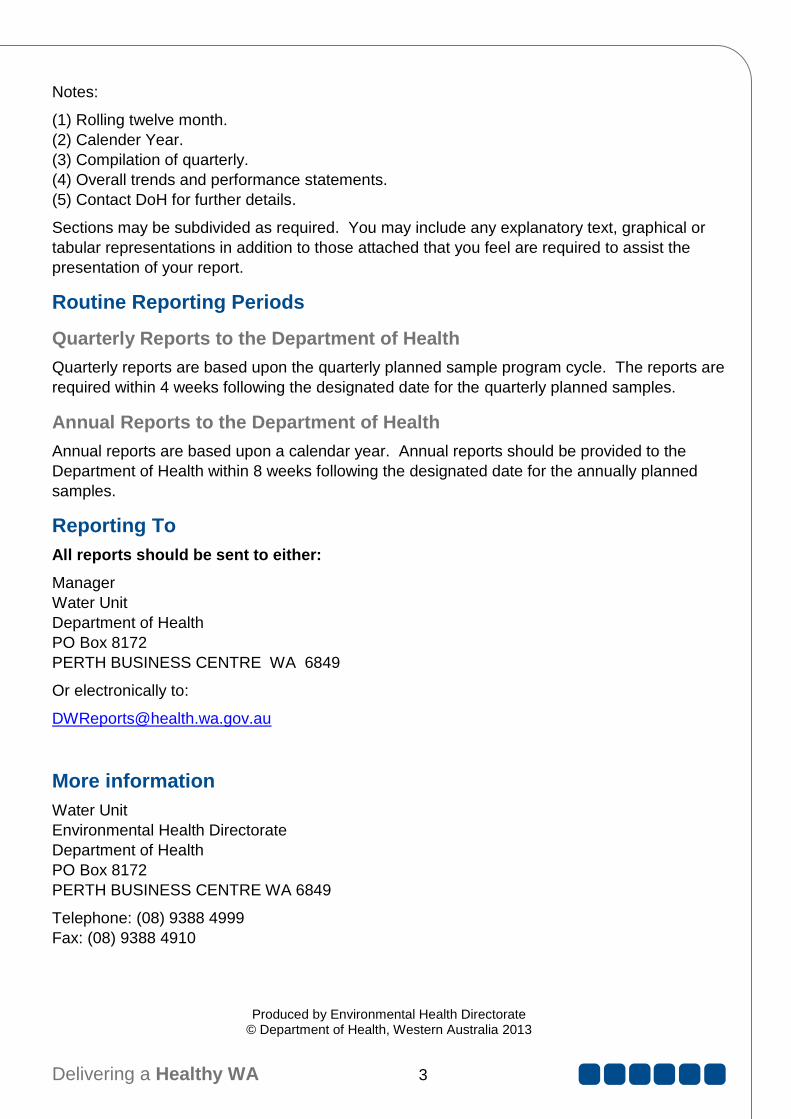
Notes:
(1) Rolling twelve month.
(2) Calender Year.
(3) Compilation of quarterly.
(4) Overall trends and performance statements.
(5) Contact DoH for further details.
Sections may be subdivided as required. You may include any explanatory text, graphical or
tabular representations in addition to those attached that you feel are required to assist the
presentation of your report.
Routine Reporting Periods
Quarterly Reports to the Department of Health
Quarterly reports are based upon the quarterly planned sample program cycle. The reports are
required within 4 weeks following the designated date for the quarterly planned samples.
Annual Reports to the Department of Health
Annual reports are based upon a calendar year. Annual reports should be provided to the
Department of Health within 8 weeks following the designated date for the annually planned
samples.
Reporting To
All reports should be sent to either:
Manager
Water Unit
Department of Health
PO Box 8172
PERTH BUSINESS CENTRE WA 6849
Or electronically to:
More information
Water Unit
Environmental Health Directorate
Department of Health
PO Box 8172
PERTH BUSINESS CENTRE WA 6849
Telephone: (08) 9388 4999
Fax: (08) 9388 4910
Produced by Environmental Health Directorate © Department of Health, Western Australia 2013
Model Reporting Format
For the
Department of Health
Logo
Report to the Department of Health
by the
Insert Name of Water Authority
for the period
Day Month Year to Day Month Year
___________________________________________________________________________
Contents
EMERGENCY REPORTING PROTOCOL 1
ROUTINE REPORTING FORMAT 2
SUMMARY OF REPORTING REQUIREMENTS 2
ROUTINE REPORTING PERIODS 3
REPORTING TO 3
MORE INFORMATION 3
1.0 WATER PROVIDER INFORMATION 5
2.0 PERFORMANCE SUMMARY 6
3.0 MICROBIAL PERFORMANCE - (ROLLING 12 MONTHS ENDING) 7
4.0 CHEMICAL - HEALTH RELATED PERFORMANCE 10
5.0 CHEMICAL - AESTHETIC PERFORMANCE 11
6.0 RADIOLOGICAL PERFORMANCE 12
7.0 PLANNED SAMPLE SUMMARY 13
8.0 GENERAL NOTES/OTHER NEWS 14

Model Reporting Format
For the
Department of Health
1.0 Water Provider Information
Water Provider Contact Details
Name of Company
Company Address
Company Phone Fax
Company Email
Chief Executive Officer
CEO Email
DoH Liaison Officer
DoH Liason Officer Email
1.1 System Information (Annual Report Only)
Locality
Zone
Name
Number of
Consumers
Average
amount
of Water
Supplied
(l/day)
Sources of
Water
(% Bore/
Surface
catchment)
Treatment
Systems
Length
of
Mains
Number
of
Sample
points
Notes:
(1) Table may be expanded or collapsed according to the number of zones or subdivided to
show regions, schemes or service providers
Catchment Details
Distribution System
Model Reporting Format
For the
Department of Health
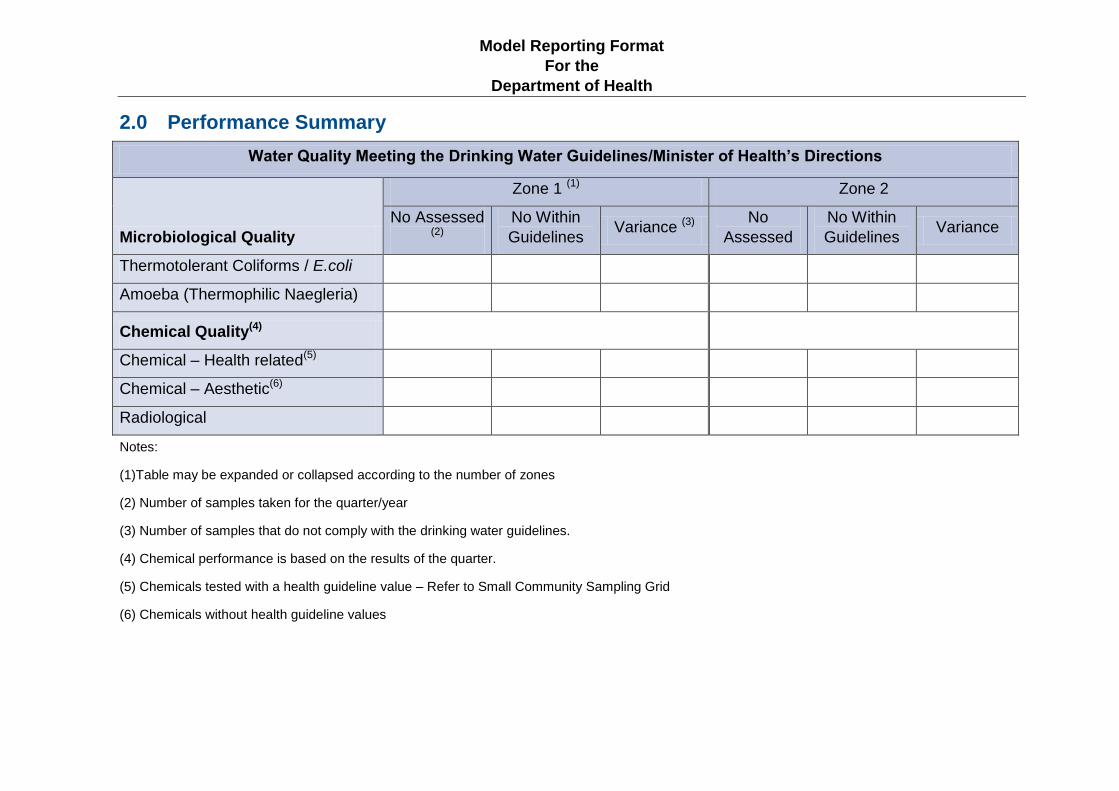
2.0 Performance Summary
Water Quality Meeting the Drinking Water Guidelines/Minister of Health’s Directions
Microbiological Quality
Zone 1 (1) Zone 2
No Assessed (2)
No Within
Guidelines Variance (3)
No
Assessed
No Within
Guidelines Variance
Thermotolerant Coliforms / E.coli
Amoeba (Thermophilic Naegleria)
Chemical Quality(4)
Chemical – Health related(5)
Chemical – Aesthetic(6)
Radiological
Notes:
(1)Table may be expanded or collapsed according to the number of zones
(2) Number of samples taken for the quarter/year
(3) Number of samples that do not comply with the drinking water guidelines.
(4) Chemical performance is based on the results of the quarter.
(5) Chemicals tested with a health guideline value – Refer to Small Community Sampling Grid
(6) Chemicals without health guideline values
Model Reporting Format
For the
Department of Health
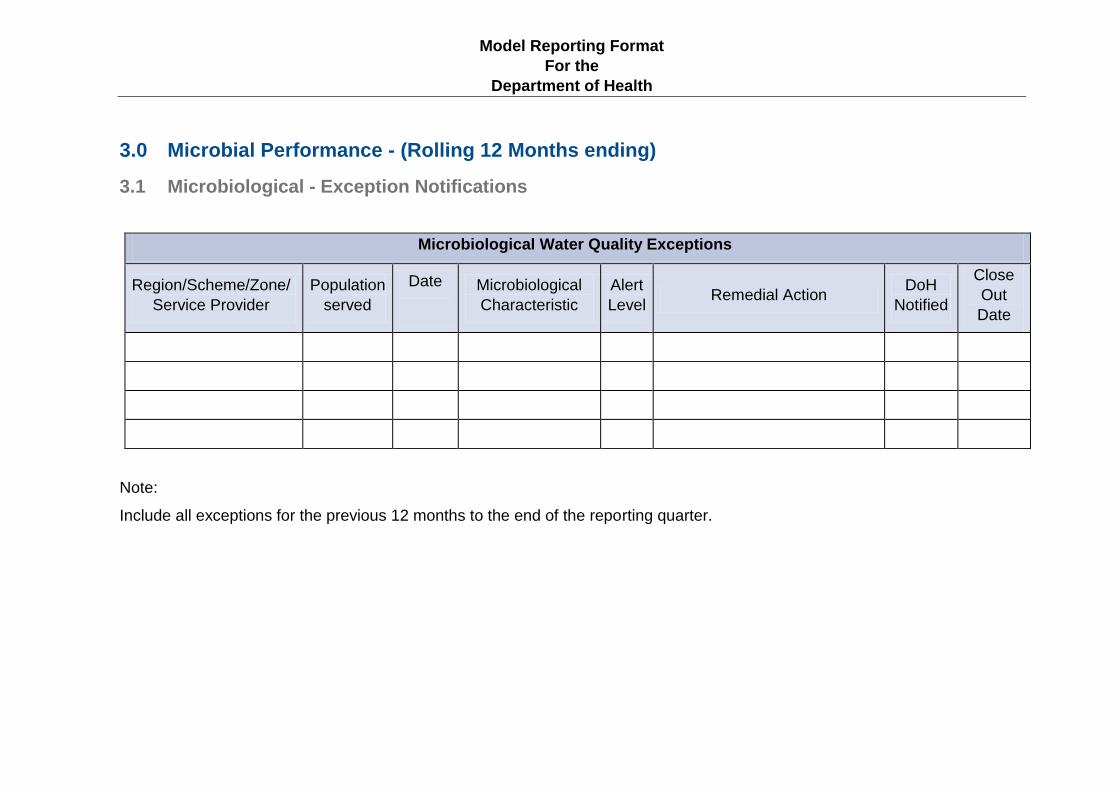
3.0 Microbial Performance - (Rolling 12 Months ending)
3.1 Microbiological - Exception Notifications
Microbiological Water Quality Exceptions
Region/Scheme/Zone/
Service Provider
Population
served
Date
Microbiological
Characteristic
Alert
Level Remedial Action
DoH
Notified
Close
Out
Date
Note:
Include all exceptions for the previous 12 months to the end of the reporting quarter.

Model Reporting Format
For the
Department of Health
3.2 Microbiological - Compliance by Zone (Summary).
Zone
No. of
Bacteria
samples
Thermotolerant
Coliforms
Thermotolerant Coliforms
12 Mths Roll. Avg. (%) No. of
Amoeba
Samples
Naegleria
to >=
42C
Naegleria
Fowleri
Thermophillic Naegleria
12 Mths Rolling Avg (%)
Non
Comply
%
Comply Month -2 Month -1 Month Month -2 Month -1 Month
Note:
Rolling 12 months average is calculated in the following manner:
Number of assessable samples complying for the past 12 months
Number of assessable samples taken in the past 12 months
Example: 12 Months Rolling Average for the month of February 2011
Number of assessable samples taken from 1 March 2010 to 28 February 2011 = 24
Number of assessable samples complying from 1 March 2010 to 28 February 2011 = 20
12 Months Rolling Average = 20 ÷ 24 x 100 = 83%
X 100

Model Reporting Format
For the
Department of Health
3.3 Microbiological - Charts by Zone
Notes for all charts
(1) All results displayed are to be on a rolling twelve (12) month basis to the end of each
respective month.
(2) Compliance target must be shown
3.5 Microbiological Incident Specific Information
3.5.1 Zone A
(Insert text)
3.5.2 Zone B
(Insert text)
Thermotolerant Coliforms
80828486889092949698
100
Month
-11
Month
-10
Month
-9
Month
-8
Month
-7
Month
-6
Month
-5
Month
-4
Month
-3
Month
-2
Month
-1
Month
% C
om
pli
an
ce
% Compliance
Naegleria 42C
80828486889092949698
100
Month
-11
Month
-10
Month
-9
Month
-8
Month
-7
Month
-6
Month
-5
Month
-4
Month
-3
Month
-2
Month
-1
Month
% C
om
pli
an
ce
% Compliance

Model Reporting Format
For the
Department of Health
4.0 Chemical - Health Related Performance
4.1 Chemical - Health Related - Exception Notifications
Health Related Chemical Water Quality Exceptions
Region/Scheme/Zone/
Service Provider
Population
served Date
Health Related
Chemical
Characteristic
MoU
Alert
Level
Remedial Action DoH
Notified
Close
Out Date
4.2 Chemical - Health Related
Text interpretation by Zone of results presented.
Model Reporting Format
For the
Department of Health
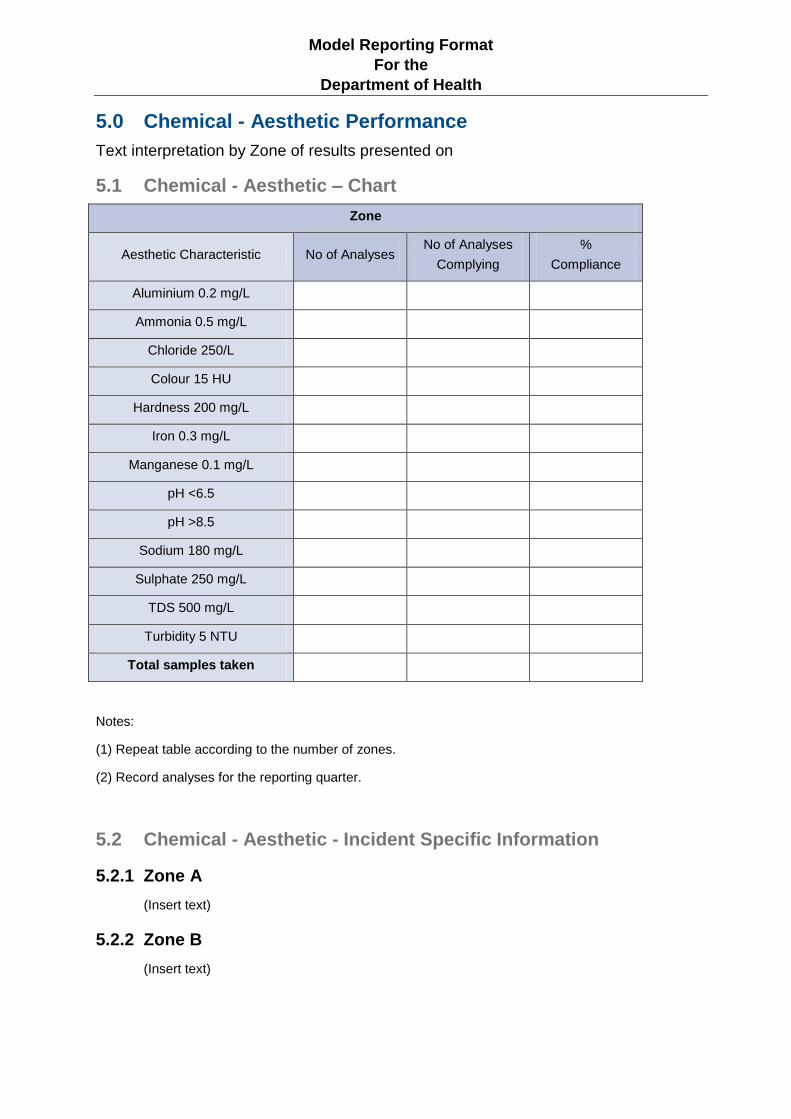
5.0 Chemical - Aesthetic Performance
Text interpretation by Zone of results presented on
5.1 Chemical - Aesthetic – Chart
Zone
Aesthetic Characteristic No of Analyses No of Analyses
Complying
%
Compliance
Aluminium 0.2 mg/L
Ammonia 0.5 mg/L
Chloride 250/L
Colour 15 HU
Hardness 200 mg/L
Iron 0.3 mg/L
Manganese 0.1 mg/L
pH <6.5
pH >8.5
Sodium 180 mg/L
Sulphate 250 mg/L
TDS 500 mg/L
Turbidity 5 NTU
Total samples taken
Notes:
(1) Repeat table according to the number of zones.
(2) Record analyses for the reporting quarter.
5.2 Chemical - Aesthetic - Incident Specific Information
5.2.1 Zone A
(Insert text)
5.2.2 Zone B
(Insert text)

Model Reporting Format
For the
Department of Health
6.0 Radiological Performance
6.1 Radiological - Exception Notifications
Radiological Water Quality Exceptions
Zone Population
served Date
Radiological
Characteristic
Alert
Level Remedial Action
DoH
Notified
Close Out
Date
6.2 Radiological Performance
Scheme/Service Provider
Zone % samples within range

Model Reporting Format
For the
Department of Health
7.0 Planned Sample Summary
Zone Microbiological Chemical Radiological Fluoride (if fluoridating)
Planned Taken % Taken Planned Taken % Taken Planned Taken % Taken Planned Taken % Taken
7.1 Planned Sample Exceptions
Planned Sample Exceptions
Zone Sampling
Point Date Due
Characteristic
(Microbiological/Chemical/Radiological) Reason for missed sample

Model Reporting Format
For the
Department of Health
8.0 General Notes/Other News
This section can include reference to specific programs for maintenance, new
additions to the scheme supply or report format or discussion on ongoing problems.