Draft Environmental Impact Statement
82
DRAFT ENVIRONMENTAL IMPACTS STATEMENT Composting on Campus Report Prepared By: Bowling Green State University Environmental Studies 4020: Environmental Impact Statements Instructor: Marco Nardone Team Members: Lin-z Tello Ngan Nguyen Rachel Woods Magdeline Simonis Taylor White Ted Petryszyn Project Coordinator: Alyssa Piccolomini April 2013
-
Upload
lindsey-tello -
Category
Environment
-
view
92 -
download
1
Transcript of Draft Environmental Impact Statement

DRAFT ENVIRONMENTAL IMPACTS STATEMENT
Composting on Campus Report Prepared By: Bowling Green State University
Environmental Studies 4020: Environmental Impact Statements Instructor: Marco Nardone
Team Members:
Lin-z Tello
Ngan Nguyen
Rachel Woods
Magdeline Simonis
Taylor White
Ted Petryszyn
Project Coordinator:
Alyssa Piccolomini
April 2013

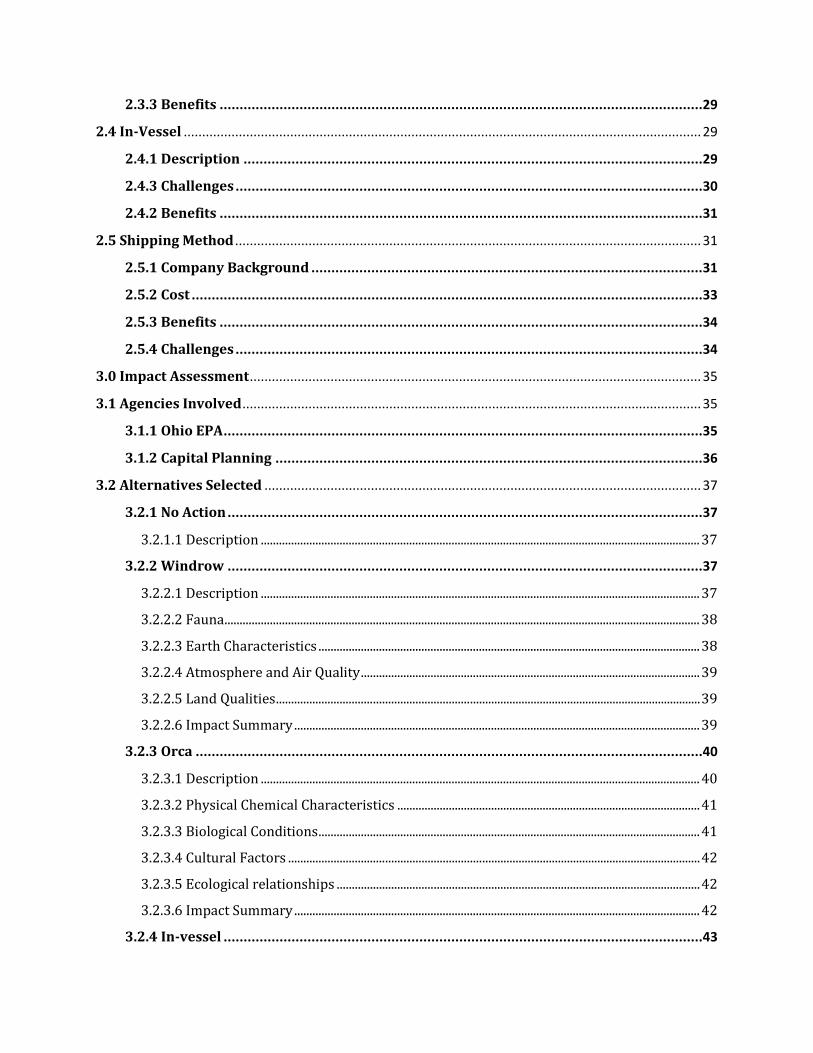
Table of Contents Executive Summary ...................................................................................................................................... 4
Project Description ....................................................................................................................................... 5
1.0 Environmental Setting ....................................................................................................................... 6
1.1 the Oaks Dining Hall ........................................................................................................................... 7
1.1.1 Current Green Projects and Waste Dynamics at the Oaks ....................................................9
1.1.2 Project Clean Plate ............................................................................................................9
1.1.3 Recycling ............................................................................................................................9
1.1.4 Pre Consumer Recycling ................................................................................................... 10
1.1.5 Post-Consumer Waste ...................................................................................................... 10
1.2 Proposed Composting Site .............................................................................................................. 10
1.2.1 Geology .......................................................................................................................... 12
1.2.2 Hydrology ...................................................................................................................... 13
1.2.3 Climate/Precipitation .................................................................................................. 17
1.2.4 Flora .............................................................................................................................. 17
1.2.5 Fauna ............................................................................................................................. 17
1.2.6 History ........................................................................................................................... 18
1.2.7 Site Location and Proximity to other Buildings on Campus ...................................... 19
1.2.8 Building on landfill sites .............................................................................................. 20
2.0 Project Alternatives ......................................................................................................................... 22
2.1 No Action ............................................................................................................................................ 22
2.1.1 Description ................................................................................................................... 22
2.1.2 Challenges ..................................................................................................................... 22
2.1.3 Benefits ......................................................................................................................... 23
2.2 Windrow ............................................................................................................................................. 23
2.2.1 Description ................................................................................................................... 23
2.2.2 Windrow Dimensions ................................................................................................... 23
2.2.3 Challenges ..................................................................................................................... 25
2.2.4 Benefits ......................................................................................................................... 26
2.3 Orca ..................................................................................................................................................... 27
2.3.1 Description ................................................................................................................... 27
2.3.2 Challenges ..................................................................................................................... 28
2.3.3 Benefits ......................................................................................................................... 29
2.4 In-Vessel ............................................................................................................................................. 29
2.4.1 Description ................................................................................................................... 29
2.4.3 Challenges ..................................................................................................................... 30
2.4.2 Benefits ......................................................................................................................... 31
2.5 Shipping Method ............................................................................................................................... 31
2.5.1 Company Background .................................................................................................. 31
2.5.2 Cost ................................................................................................................................ 33
2.5.3 Benefits ......................................................................................................................... 34
2.5.4 Challenges ..................................................................................................................... 34
3.0 Impact Assessment ........................................................................................................................... 35
3.1 Agencies Involved ............................................................................................................................. 35
3.1.1 Ohio EPA ........................................................................................................................ 35
3.1.2 Capital Planning ........................................................................................................... 36
3.2 Alternatives Selected ....................................................................................................................... 37
3.2.1 No Action ....................................................................................................................... 37
3.2.1.1 Description ................................................................................................................................................. 37
3.2.2 Windrow ....................................................................................................................... 37
3.2.2.1 Description ................................................................................................................................................. 37
3.2.2.2 Fauna ............................................................................................................................................................. 38
3.2.2.3 Earth Characteristics .............................................................................................................................. 38
3.2.2.4 Atmosphere and Air Quality ................................................................................................................ 39
3.2.2.5 Land Qualities ............................................................................................................................................ 39
3.2.2.6 Impact Summary ...................................................................................................................................... 39
3.2.3 Orca ............................................................................................................................... 40
3.2.3.1 Description ................................................................................................................................................. 40
3.2.3.2 Physical Chemical Characteristics .................................................................................................... 41
3.2.3.3 Biological Conditions .............................................................................................................................. 41
3.2.3.4 Cultural Factors ........................................................................................................................................ 42
3.2.3.5 Ecological relationships ........................................................................................................................ 42
3.2.3.6 Impact Summary ...................................................................................................................................... 42
3.2.4 In-vessel ........................................................................................................................ 43

3.2.4.1 Description ................................................................................................................................................. 43
3.2.4.2 Land, plants, and animals ..................................................................................................................... 43
3.2.4.3 Cultural factors ......................................................................................................................................... 44
3.2.4.4 Water and air quality.............................................................................................................................. 44
3.2.4.5 Impact Summary ...................................................................................................................................... 44
3.2.5 Shipping ........................................................................................................................ 45
3.2.5.1 Description ................................................................................................................................................. 45
3.2.5.2 Atmosphere and Air Quality ................................................................................................................ 46
3.2.5.3 Employment ............................................................................................................................................... 46
3.2.5.4 Impact Summary ...................................................................................................................................... 46
3.2.6 Overall Impact Summary ............................................................................................. 47
4.0 Evaluation of Alternatives .............................................................................................................. 48
4.1 Windrow ............................................................................................................................................. 48
4.2 Orca ..................................................................................................................................................... 49
4.3 In-Vessel ............................................................................................................................................. 49
4.4 Shipping .............................................................................................................................................. 50
4.5 No Action ............................................................................................................................................ 50
4.6 Recommendations ............................................................................................................................ 50
4.7 Summary ............................................................................................................................................ 51
Appendix ..................................................................................................................................................... 52
A. Class II Composting Facility Requirements .......................................................................... 52
B. Composting Facility Registration Form Class II / Class III ..................................................... 60
C. Application Form ............................................................................................................... 64
D. Windrow Leopold Matrix ................................................................................................... 73
E. In-vessel Leopold Matrix.................................................................................................... 74
F. Orca Leopold Matrix .......................................................................................................... 75
G. Shipping Leopold Matrix .................................................................................................... 76
H. Adkins-Burke Checklist ...................................................................................................... 77
Works Cited ................................................................................................................................................ 79

Executive Summary
The Environmental Studies 4020 Course (Environmental Impact Statements) was asked
to research a potential project for the campus of Bowling Green State University. The focus of
this project was to create a composting proposition that could potentially help the University
move towards meeting its goal of becoming carbon-neutral (as stated by the President’s Climate
Commitment (PCC) that President Mazey signed in 2012).
With this guidance, our group decided upon four different alternatives for implementing
composting on campus: Windrow, Orca, In-vessel, shipping, and the no-action alternative. The
environmental impacts of the alternatives were found using an adapted Leopold Matrix.
To compare the alternatives, an adapted Adkins-Burke Checklist was created and
evaluated the alternatives based on the success in meeting the objective of the project, cost,
environmental impacts, safety, and community factors. Based on this comparison, alternative
four, the shipping alternative, would be the best short-term solution; and alternative three, In-
vessel, would be the best long-term solution to the problem. Alternative four has almost no legal
influences and it costs almost nothing for the University to adopt. Alternative three is most
costly, but it has a tremendous amount of positive effects on the community.
Therefore, we recommend the implementation of alternative four or alternative three
depending on the amount of funding that the University would be able to obtain to complete the
project.
4

Project Description
Since President Mazey signed the PCC in 2012, the Environmental Studies Department,
and various organizations at Bowling Green State University’s campus, have been looking for
ways to help the University move towards being carbon-neutral in the future. Because of this,
our group, along with Dr. Nick Hennessey of the Sustainability Department, and various
managers of Dining Services have introduced the possibility of implementing a composting
facility on campus. The cost of this project can be extremely high, but it can also offer the
University an array of benefits ranging from “green” awards to educational value. Because the
cost of composting machinery can be so expensive, our group, along with Dr. Hennessey, looked
into the possible alternative of having a company pick-up the Oak’s organic waste and shipping
it to their composting facility in Westerville, Ohio. If this were to be the alternative selected, the
University would lose out on a wider variety of educational demonstrations, materials produced
from the organic waste, and positive recognition. This document contains the various findings of
the different project alternatives along with specific information about the alternatives in regards
to cost, logistics, maintenance, and benefits compared to the challenges.
5

1.0 Environmental Setting
The environmental setting for this project varies according to site location. Potential sites
that have been analyzed for composting facilities include:
• An on-site location within The Oaks Dining Hall
• An off-site location that would be located next to the Campus Operations
building, on an area of land that is currently vacant (see Figure 1 below).
As The Oaks Dining Hall is a pre-existing building, we did not analyze the hydrology,
geology, flora/fauna, climate/precipitation, or history of the site. Instead, the building itself will
be described by analyzing its history, current green projects, and waste dynamics (focusing on
pre-consumer and post-consumer waste).
All dining and catering that is handled on campus is owned and operated by Chatwell’s,
Inc. Chartwell’s service is targeted towards schools K-12th grade, higher education (colleges),
and corporations. Their goal is to inform the consumer about healthier choices of foods and
provide these foods in a way that is inexpensive but also healthy for the consumer. In colleges
and elementary schools, there are programs set in place to help educate the kids and instructors
on a better diet. The major program is called, Eat.Learn.Live. This is geared towards providing
student with healthier foods, reaching out to them to ensure that they understand why eating
healthy is essential, and analyzing case studies to understand university trends in food
consumption. Along with providing food, Chartwell’s also provides service to the community
by incorporating their own staff into dining facilities to help monitor the way food is prepared
and served.
For the off-site location, several environmental aspects were analyzed in order to
establish an environmental baseline standard. The geology, hydrology, flora, fauna,
climate/precipitation, history, and site location/proximity to other buildings on campus were
analyzed in detail in order to identify the current conditions of the location. Furthermore, as the
site in question was once utilized as a landfill, research was conducted in order to identify any
concerns that might arise when constructing buildings/facilities on relict landfill sites.
6
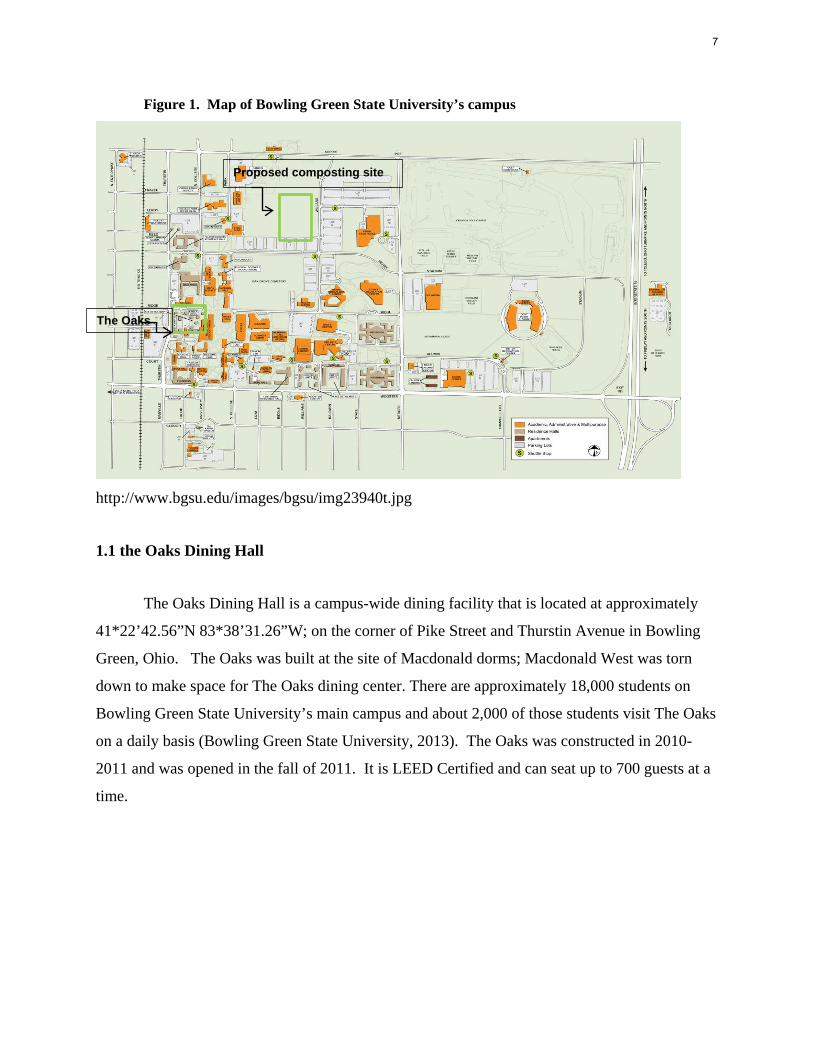
Figure 1. Map of Bowling Green State University’s campus
http://www.bgsu.edu/images/bgsu/img23940t.jpg
1.1 the Oaks Dining Hall
The Oaks Dining Hall is a campus-wide dining facility that is located at approximately
41*22’42.56”N 83*38’31.26”W; on the corner of Pike Street and Thurstin Avenue in Bowling
Green, Ohio. The Oaks was built at the site of Macdonald dorms; Macdonald West was torn
down to make space for The Oaks dining center. There are approximately 18,000 students on
Bowling Green State University’s main campus and about 2,000 of those students visit The Oaks
on a daily basis (Bowling Green State University, 2013). The Oaks was constructed in 2010-
2011 and was opened in the fall of 2011. It is LEED Certified and can seat up to 700 guests at a
time.
Proposed composting site
The Oaks
7

Figure 2. Digital image of BGSU’s campus from 1943.
http://www.bgsu.edu/colleges/library/cac/uarchives/uatour/page50290.html
Picture from 1943, green box highlights where Oaks is now
8

The Oaks has many sustainable features that help reduce the cost of energy consumption
and also helps to save the university money. One of these features is the Live-Roof. The green
roof has interlocking plant trays of Sedum that acts as a hardy ground cover and stays green
throughout the years. It has many benefits such as: little water use for maintenance (water used
is from rainwater retention system), repurposed deck from Douglas fir, reused barn siding, picnic
tables that are made from 100% recycled plastic bottles, lawn chairs that are made from 100%
recyclable resin, variety of vegetables and fruit plants, a solar powered water fountain, already
existing composting bin for organic materials, and it also reduced the indoor temperature 6-8
degrees in the summer and acts as an insulating layer in the winter months (Bowling Green State
University, 2013). Several other sustainable features are described in the following section.
1.1. Current Green Projects and Waste Dynamics at the Oaks
1.1.1 Project Clean Plate
Project Clean Plate is an event that takes place in both The Oaks and Carillon Dining
Halls two times a year. The first time is in late October/early November. The second time is in
late March/ early April. Project Clean plate is a Chartwells program that provides awareness to
international hunger and helps students focus globally and act locally to combat hunger, reduce
waste, save energy and initiate real change. It is designed to reduce overall food waste in all-you-
can-eat campus dining operations.
1.1.2 Recycling
The Oaks only participates in cardboard recycling because it has limited use of other
recyclable materials. The dining center consumes mostly fresh food that does not come from
plastic jugs and cans, so it does not have a need for other recycling programs.
9

1.1.3 Pre Consumer Recycling
Pre-consumer recycling is the process where the waste of manufacturing is recycled
before the final products get to the consumer. This type of recycling can be carried out in many
different industries. Many restaurants and diners, including universities’ dining hall have
successfully contributed to pre-consumer recycling. Dining halls are equipped with containers
for recyclable metals and plastics associated with food preparation, cooking, and/or baking, and
general trash disposal. Dishwashing areas usually contain compost-specific containers. Although
compost is typically used for post-consumer waste they also serve as receptacles for pre-
consumer foods that cannot be prepared due to expiration, or for food scraps generated in the
preparation process. Pre-consumer food scraps are contributed to an in-vessel composter.
1.1.4 Post-Consumer Waste
Post-consumer waste is the waste generated by the consumer. For example post-
consumer waste is the waste that gets thrown away after the consumer has received their items.
All of the food items that have not been consumed that gets thrown out are considered post-
consumer waste. This can include: fruit skins, meat bones and leftover food. Post-consumer
waste can also include non-food waste too. Such items like; coffee cups, utensils, napkins,
takeout containers, paper bags and food wrapping are all considered post-consumer waste. Also
recyclable items like newspaper, junk mail and aluminum cans are all classified as post-
consumer waste (PlentyMag.com, 2009).
1.2 Proposed Composting Site
The proposed off-site composting location consists of an L-shaped plot of land, located
South of Poe Road and between Park Avenue and Williard Road, shown in Figure 3 below. The
site is currently owned by Bowling Green State University, and the parcel number is B07-511-
190201002000. The site is comprised of 20.17 acres (Wood County Auditor Office, 2013).
10

Figure 3. Aerial view of proposed composting site
Green box indicates where the proposed composting site would be. The “L” shape indicates the end of the boundary line.
11
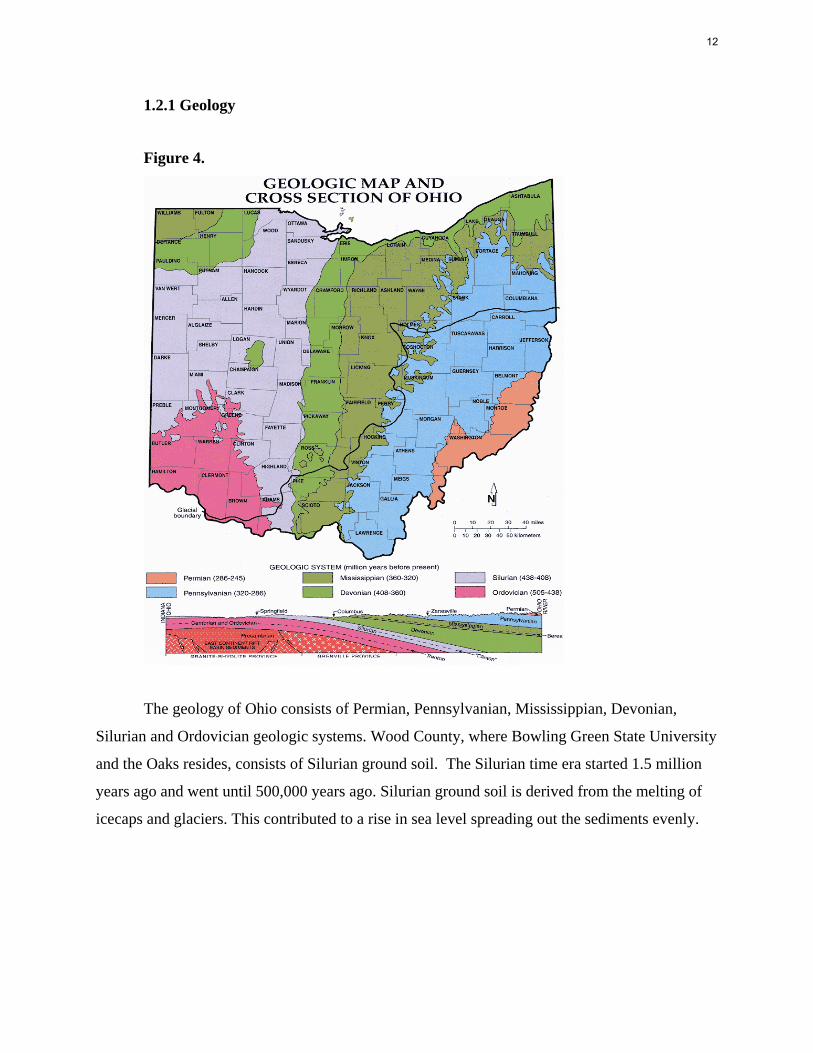
1.2.1 Geology
Figure 4.
The geology of Ohio consists of Permian, Pennsylvanian, Mississippian, Devonian,
Silurian and Ordovician geologic systems. Wood County, where Bowling Green State University
and the Oaks resides, consists of Silurian ground soil. The Silurian time era started 1.5 million
years ago and went until 500,000 years ago. Silurian ground soil is derived from the melting of
icecaps and glaciers. This contributed to a rise in sea level spreading out the sediments evenly.
12
1.2.2 Hydrology
The city of Bowling Green was a part of the Great Black Swamp, which was formed by
glacier. The swamp was built due to clay and silt material in the lake bed, causing water
difficulty to move through. The problem in Northwest Ohio generally is how to get rid of the
water, as the settlers spent years on turning the swamp into usable land. Around the city is a
system of ditches that is used to let the water flow away whenever it rains, but it is still a little
difficult because of the clay that is left in the soil. There are also some wetland areas left. The
limestone bedrock is effective in supplying water for many different uses. An analysis site
reveals a well capacity of 25 gpm, with the depth to the limestone bedrock is 22 feet. See table
for chemical constituents.
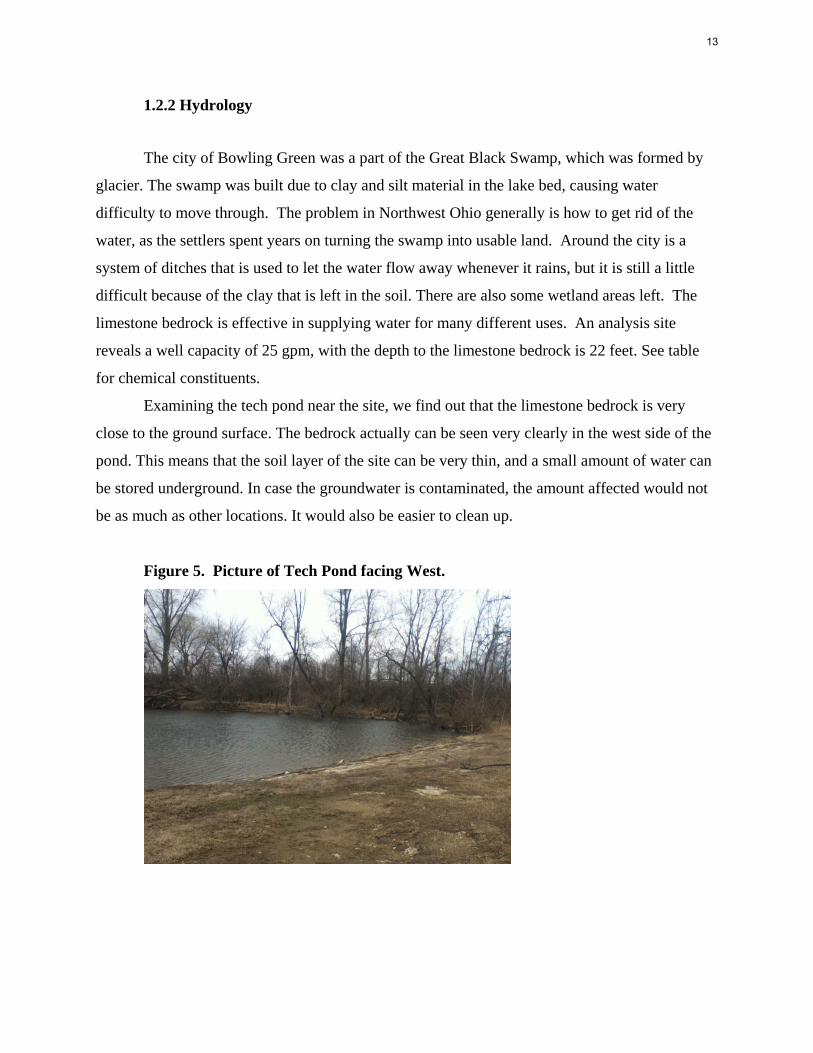
Examining the tech pond near the site, we find out that the limestone bedrock is very
close to the ground surface. The bedrock actually can be seen very clearly in the west side of the
pond. This means that the soil layer of the site can be very thin, and a small amount of water can
be stored underground. In case the groundwater is contaminated, the amount affected would not
be as much as other locations. It would also be easier to clean up.
Figure 5. Picture of Tech Pond facing West.
13

Figure 6. Picture of Limestone at the Tech Pond.
Figure 7. Historic map of the Great Black Swamp
http://blogs.bgsu.edu/blackswampjournal/2011/04/14/history-of-the-great-black-swamp/
14

Figure 8. Groundwater resource of Wood County
http://ohioline.osu.edu/aex-fact/0490_87.html
15
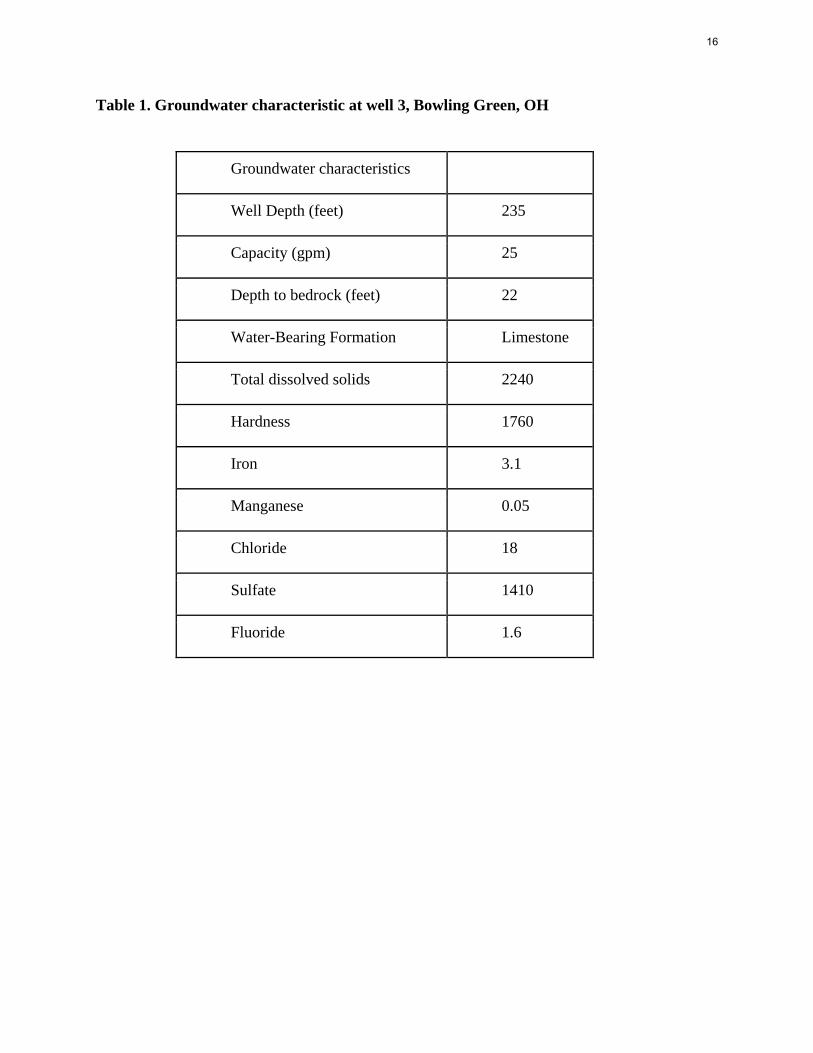
Table 1. Groundwater characteristic at well 3, Bowling Green, OH
Groundwater characteristics
Well Depth (feet) 235
Capacity (gpm) 25
Depth to bedrock (feet) 22
Water-Bearing Formation Limestone
Total dissolved solids 2240
Hardness 1760
Iron 3.1
Manganese 0.05
Chloride 18
Sulfate 1410
Fluoride 1.6
16

1.2.3 Climate/Precipitation
Bowling Green follows a steady trend for seasonal temperature averages. For example
according to weather data from The Weather Channel the average Winter temperature is 34 F°,
the average Spring temperature is 65 F°, the average Summer temperature is 84 F° and the
average Fall temperature is 63 F° (Weather, 2012). For precipitation Bowling Green on average
receives below 3 inches of rain in the Fall and Winter months. However, through the spring and
summer, Bowling Green receives between 3 - 4 inches of precipitation (Weather, 2012). Also on
average Bowling Green has around 101 precipitation days and 182 sunny days with a UV index
of 3.5. For humidity Bowling Green has an annual average of 76.10% and an annual average
wind speed of 13.18 mph (Best Places, 2010).
1.2.4 Flora
Of the dozens of various plant species that exist in Northwest Ohio, there are none
growing on the specific coordinates of where the proposed composting facility will be. There is
little vegetation growing on the site in question. What exists now is limited to crabgrass
(Digitaria sanguinalis), invasive thistle (Dipsacus fullonum), and various shrubs. The land is
maintained to be a grassy area as many organizations use that area as a practice field or for group
meetings. Any composting structure that is located on this site will not be large enough to affect
local flora and will most likely be structured in the middle of the old landfill site where only
crabgrass will be disturbed (Ohio, 2013).
1.2.5 Fauna
There are several animal species that will be affected by the creation of the composting
facilities on campus. It is known that many squirrels, rabbits, white-tailed deer, red tailed hawks,
skunks, other small mammals, and variety of small birds heavily populate the campus and
surrounding area of Bowling Green. The pond located next to the Technology Building has a
variety of reptiles and amphibians, as well as a few mammals and insects, but they would not be
close enough to the construction of the compost are to greatly be affected.
17

The area that is being proposed to build on is mostly populated by sparse vegetation and
therefore will not inhabit a large variety of critters. There are currently no threatened or
endangered species that are living in the area or that have ever been sited on Bowling Green
State University’s campus (ODNR, 2013).
1.2.6 History
A few of our chosen alternatives for this proposed project require a site that can be used
to house composting facilities. Land parcels that Bowling Green State University already owns
were considered for this project, in order to reduce expenses. In order to identify possible
locations that are not already in use and are not slated for future use, our team contacted the
University’s Capital Planning office and acquired a map, with possible composting sites
outlined. After considering a number of potential sites, our team concluded that the best option
consisted of a plot of land situated on-campus, next to the recycling plant, which is currently
vacant. The site in question is about 20 acres, and can be seen in the image below.
In order to gain further knowledge regarding the lot’s history, our team visited the Wood
County Auditor’s office in order to acquire the parcel number, and then tracked the ownership of
the particular lot by searching through files in the Wood County Recorder’s Office. The lot in
question was purchased by Bowling Green State University in 1974, from the City of Bowling
Green. The City had owned the land since 1930, when it purchased the land from a local
resident, Fred C. Moore. Prior to this time, Moore’s family had owned the land for at least 20
years, and had used the land for agricultural purposes. Moore filed a petition asking the city to
vacate the land, after it was acquired, so no houses or streets were created on the parcel, although
our records state that a landfill was created on the site at some point during the time that the City
of Bowling Green claimed ownership of the plot (Wood County Auditor Office, 2013).
According to the Bowling Green City Public Works Department, the city built a waste
water treatment plant on the site, which was in operation from 1944 to 1979. In 1974, the land
ownership was transferred to the University, and in 1979 the existing water treatment plant was
vacated, and a new one was built off-campus by the city. A hill and pond currently exist on this
site. The pond may be seen in Figure 7, labeled Tech Pond, and the adjacent area north of the
parking lot is where the hill is located. These features are remnants from a spoil field that was
18

created when the water treatment plant was demolished, and the uncapped site is classified as a
landfill. The landfill on the site contains dirt and pipes that were left over from the water
treatment plant (Bowling Green Public Works Department, 2013).
The University does not have any plans concerning the site at this time. While the
history of the site (having been a landfill) may pose some issues for our team, we felt that the
close proximity to other buildings on campus (including the recycling facility), as well as the
general size of the lot proved that it was the best option.
1.2.7 Site Location and Proximity to other Buildings on Campus
Figure 9.
The coordinates for the center of the available area are 41°22'59.45"N, 83°38'9.62"W.
This point was used for reference to nearby buildings and high traffic areas for students and staff.
The distances to these points were calculated using Google Earth, and are listed below.
● 142 meters to the closest on campus sidewalk on the western edge of parking lot
12.
● 167 meters to the Tech Pond (closest surface water source).
19

● 255 meters from both the Technology Building, (closest class building).
● 255 meters the nearest corner of the Marching Band Practice Field next to the
Perry Field House.
● 279 meters from the Wood County Airport Building.
● 486 meters from Falcon Heights (closest student dormitory).
1.2.8 Building on landfill sites
When building on a landfill there are many factors that need to be considered and
examined when determining if the former landfill is suitable for construction. Historically,
municipal landfills were no more than a “free for all” dumping site that would take in anything
from solid waste, junked cars and machinery all the way to toxic chemicals. These traditional
landfills lacked any sanitation regulations which would protect the surrounding environment
from pollution and physical hazards that were a direct result of the landfill. As landfills
progressed throughout time, more stringent rules were enacted so that potentially hazardous
issues could be avoided.
The first issue that deserves acknowledgement when building on a former landfill would
be settlement of the soil underneath the new structure. Settlement is a result of the weight of the
structure above the former landfill adding pressure to the landfill underneath. As a result the
landfill soil becomes compressed and any void space inside of the landfill, (example: a junk car’s
void space) would become compact and the structure would sink (McLaughlin, 1995).
Many landfills do not compress their waste and thus leave a void space filled with air that can be
compressed if there is a strong enough force adding pressure. Settlement can be as slight as a
crack in the foundation or as extreme as total building structure collapse. There are many ways to
mitigate settlement when building so that the structure is safe. The most common type for former
landfills would be to insert piles, similar to stakes in a tent (The Risk and Rewards.., 2005). The
steel piles act as props to keep the structure from settling at an accelerated rate and help to
position the new structure over the landfill to alleviate pressure. Between the steel piles a cement
base slab is positioned to help support the building. Possible settlement is unknown, much like a
home settling and thus a factor that should be considered when building any type of structure on
20

top of a former landfill and should be monitored for the first few years of construction and post
construction.
The second issue that warrants issue is referred to as “landfill gas” this is the result of
years of dumping unknown and known chemicals and mixing with the decomposition of solid
and liquid waste. Landfill gas consists of methane gas and carbon dioxide which is a byproduct
of the decomposition of solid waste (Last, 2006). These gasses in the open atmosphere warrant
no immediate health risk, yet in a confined structure can be an issue. A structure above a former
landfill site endures the chance of landfill gas infiltrating into the building and in higher levels in
a confined area can be toxic and methane near any form of ignition can explode which could
result in fatalities. This hazard would require the structure above the former landfill to have
excellent ventilation systems to keep the structure’s air quality pure, if in an enclosed area. In
addition, the carbon dioxide and methane levels should be monitored often, along with any other
toxic chemical that would enter the area’s atmosphere as a result. Yet in most cases, the older the
landfill site the lower the levels of landfill gas that are emitted but the precaution is still there.
Another hazard from landfill gas is the possibility of the foundation cracking because of the
pressure trying to escape the landfill site underneath, which can cause structural damage. This is
a minimal risk that should only be looked into if cracking is experienced.
Overall, building on former landfill sites is of no real concern. Land settlement is a
normal factor in all construction projects and should be anticipated when building on a former
landfill. The longer time between new structure construction and the close of the former dump
helps to lessen the amount of settling. Landfill gas also warrants little risk as long as preventative
measures are taken to decrease accumulation of the gasses in enclosed structures (McLaughlin,
1995).
21

2.0 Alternatives This section is an overview of the five alternatives proposed for the pre-consumer and
post-consumer organic waste produced by the Oaks Dinning hall, located on Bowling Green
State University campus. These alternatives are compiled of No Action (2.1), Windrow (2.2),
Orca (2.3), In-Vessel (2.4) and Shipping (2.5). Following the description of each alternative there
is a detailed description of the challenges and benefits of each selected alternative.
2.1 No Action
2.1.1 Description
Currently all compostable waste from the Oaks dining center is disposed as garbage,
which is collected by the company, Waste Management, Inc. The average daily waste at the
Oaks is 906.66 pounds per day, which costs the university about $14.96 per day (the price per
ton is $33.00). The university must also pay to haul the garbage to the landfill, which is $150 per
haul, and there are approximately 3 hauls per month, but the number of hauls changes with the
amount of garbage produced. Currently, this program is costing the University approximately
$860 dollars a month, and is not generating any revenue (Hennessy 2013).
2.1.2 Challenges
The university is paying money to haul away the compostable garbage to the landfill,
with little benefit. Sending compostable material to the landfill causes the organic material to
decompose in the absence of oxygen, which emits methane, in some ways more detrimental
greenhouse gas than carbon dioxide. Organic material that is composted and which decomposes
in an aerobic environment does not release methane (CUESA 2013). Furthermore, a methane
collection and burning facility to generate electricity from the landfill in Bowling Green, Ohio
does not currently exist, thus causing any methane currently produced in the landfill to serve as
only a detriment to society, with no gain (WCSWMD 2013).
22

2.1.3 Benefits
The amount of waste that is produced is being immediately removed from the facility.
The university/facility is only responsible for the waste for a short period of time until the
container needs to be emptied, and then it becomes the responsibility of the landfill. The waste
container is small enough to be kept on site, and no other site construction needs to be taken into
consideration.
2.2 Windrow
2.2.1 Description
Windrow composting consists of placing the mixture of raw materials in long narrow
piles, called windrow, that are turned on a regular basis. Windrow composting requires a very
tight schedule of rotating the compost, due to the fact that Windrow’s piles aerate primarily by
natural or passive air movement. Windrow requires a lot of oxygen to ensure aerobic
decomposition (Large Scale Composting, n.d). Temperature is another factor that influences
Windrow composting. The temperature should reach 131 degrees Fahrenheit in order for
pathological reductions to occur. If the temperature is allowed to go above that range, the
microorganisms begin to die, slowing the composting process. However, if the temperature is
lower than this range, aerobic decomposition slows (College Guide, n.d).
2.2.2 Windrow Dimensions
Windrow composting at Bowling Green would consist of three rows. Each row would be
60 feet in length and 10 feet in width, and the height would be about 4 feet. Shown below (in
Figure 10) are the exact measurements of the proposed Windrow compost row for Bowling
Green State University's campus. The equipment needed for this first alternative consists of a
bulldozer or multiple compost Windrow turners. An access road off of Park Avenue in Bowling
Green can serve as a transportation road for a compost turner or a bulldozer (College Guide, n.d).
The dimension of the Windrow compost and the 10 feet space in between each row for easier
turner/bulldozer accessibility is demonstrated below in Figure 11. Finally, Figure 12 shows an
23

aerial view of the compost pile, if this alternative was chosen and created, and Figure 13 shows
where the facility site will be located in relation to the rest of campus (Jerome Library is pictured
in the center).
Figure 10. Alternative 2. Dimensions of Windrow Compost in Bowling Green
Figure 11. Dimensions of 3 Windrow rows on Bowling Green’s property
24

Figure 12. Future Windrow location on Bowling Green’s Campus
2.2.3 Challenges
Windrow composting is pressed with many issues concerning the environment,
economics and social obligations of everyday life. To begin with, Windrow requires workers
and/or volunteers to turn the compost every 3 days (College Guide, n.d). If a compost turner
machine is used, it will cost on average from $30,000 to $130,000 to purchase the machine
(Composting Equipment, 2013). One effect of the turning of the piles is the exhaust emission by
the compost turners. Every time that they are used harmful exhaust will be released into the
atmosphere unless the compost turners can run on a cleaner burning fuel. Also, Windrow
requires a lot of land for composting, and it attracts a variety of scavengers and produces odors.
As a consequence of these issues, Windrow requires large buffer zones in order to prevent odors
25

or vermin from negatively impacting local residents. Finally, permits are required depending on
the size of the facility.
Figure 13. Landfill site facing East.
Windrow compost requires a "turn-over" maintenance, which can be done manually or
with a bulldozer. Since this is a former landfill site, there is always a chance of land subsidence,
which is the act of the land sinking in elevation due to added pressure on top of the site. Since it
is almost impossible to determine if the site has already compacted over the years, it must be
noted that there is always a risk of subsidence or land compaction due to the constant pressure of
bulldozers and trucks that will be required to transfer the compost to and from the location
(Pierce 2010). The subsidence will be unnoticeable over short periods of time and thus,
negligible, yet must still be factored in as an added risk when constructing at this location.
26

2.2.4 Benefits
Windrow can handle a large volume of material, has a low capital cost and uses less
equipment and maintenance than many other composting methods. It also can reduce the
amount of waste to be disposed. Construction of a Windrow Compost pile on the selected landfill
parcel will require little to no maintenance and/or alterations to the landfill site, which will result
in virtually no construction associated challenges. The Windrow compost will be organized into
three rows and placed on top of the former landfill. The former landfill site is 20.17 acres (stated
in section 1.2), which is roughly 878,605.2 square feet of flat area to construct upon. The
proposed three Windrow rows and buffer zones will require a surface area of 80 feet by 70 feet,
which will only utilize 0.64% of the entire landfill location (see Figure 13). The remaining space
will allow for future windrow piles, if necessary, due to an increase in compostable materials
from the campus, in the case that campus dining may choose to create compost from other
facilities in addition to The Oaks at some point. An added benefit from construction on this
proposed landfill site is that the hill is already flattened on top where the piles would be located.
This ensures that there will be no future problems associated with flooding, as this area is already
elevated. It should also be noted that there is no reason to have a cement separation between the
landfill site grass and the Windrow piles themselves.
2.3 Orca
2.3.1 Description
Orca (Organic Refuse Conversion Alternative) is an alternative to conventional
composting facilities. Orca is a bioreactor system that reduces organic waste to water within 24
hours. Environmentally friendly microorganisms break down the organic materials in an aerobic
environment ("Orca," 2010). Orca is capable of composting 2400 pounds of waste each day.
Burgis Envirolutions has machines available in 400, 800, 1200, 1600, 2000, and 2400-pound
capability increments ("Orca food waste," n.d.). Considering the current waste production of the
Oaks dining center (906.66 pounds per day), the 1200-pound capable machine would be the best
choice (see Figure 14 below for further information regarding the 1200 pound capacity machine).
27

Figure 14. Specifications for the Orca system, based on a unit that can decompose up to
1200 pounds of waste daily ("Orca food waste," n.d.).
The ORCA Green waste disposal system works using “bio-chips” which house the
microorganisms used to break down the organic waste. The “bio-chips” are similar in
appearance to charcoal, but degrade much slower than food-waste, so they house the
microorganisms between uses. The machine operates on a fully automated schedule, and remains
on at all times. The machine mists water regularly onto the material, and then agitates the
mixture for a brief period. After the mixture has been agitated, the machine allows it to sit and
the microorganisms decompose the material. The waste inside is fully reduced within 24 hours.
The machine can decompose vegetables, fish by-products (including the meat and bones), meat
(poultry, beef, etc.), rice, noodles, bread, and fruit. The machine is silent and odor-free because
the food is not allowed to sit and develop an odor. The resulting compost water may be used for
irrigation, compost tea, or non-potable plumbing ("Orca food waste," n.d.).
28

2.3.2 Challenges
The Orca system is fairly expensive, as the cost ranges from $23,000 - $60,000 dollars,
depending on the size of the unit ("Orca," 2010).
Typical water usage for a 1200-pound capacity Orca system is around 150 gallons per
day, which may increase the net water usage for the Dining Center. However, much of this
water usage is counteracted by the water that Orca produces, which is then recirculated back into
the system. Also, the system emits a trace amount of carbon dioxide along with the water that is
produced. Finally, Orca also uses a power of 0.7 kW which, if it runs continuously, would use
600 kWh/month, amounting to about $60/month in electrical costs ("Orca food waste," n.d.).
2.3.3 Benefits
The Orca composter uses low temperature aerobic composting, eliminating odors while
running silently. Also, a general benefit of composting is a reduction in methane (a by-product
of conventionally disposing waste) and lower fuel emissions from transporting waste. Since
water (and a trace amount of carbon dioxide) is the main by-product, Orca also reduces insect
and rodent problems as compared to conventional waste disposal alternatives. Furthermore, the
water produced can be used as a fertilizer, reducing landscaping costs, and possibly generating
revenue for the University ("Orca," 2010).
2.4 In-Vessel
2.4.1 Description
In-vessel composting is a process in which all materials are kept in a container to produce
compost in certain conditions of moisture, oxygen concentration, airflow, and temperature (up to
70 degrees). There are two types of In-vessel composting: aerobic, which includes the presence
of oxygen; and anaerobic, in which oxygen is absent (Aslam, 2007). Depending on the size of
the vessel, the system can treat anywhere between 365 tons and 20,000 tons of organic waste per
year. A medium size vessel (approximately 5x30 feet) can process 1000 to 3000 lbs. of food
29

each day (Aslam 2007). After about 2 weeks of active composting in the vessel, and a month of
curing, the result is a mixture of organic matter, water, and microorganisms (“Technology Fact
Sheet,” 2012). Figure 15 (below) shows a rough outline of the components that would involve
an In-vessel machine.
Figure 15. Example of In-vessel components
http://www.epd.gov.hk/epd/english/environmentinhk/waste/prob_solutions/WFdev_OWTFtech.html
2.4.3 Challenges
To operate and maintain In-vessel composting, some expenses and skills are required. An
In-vessel system can cost $25,000 to $50,000, plus $30 to $50 for operation and maintenance for
each ton of material treated (“Technology Fact Sheet,” 2012). A significant amount of
ventilation is required, while it is also necessary to turn the compost (Evans, 2011.). At the end,
sometimes windrows are still needed to cure the products after In-vessel. The size of the vessel
can limit its capacity. Also, the system can be closed when odor problems occur if poorly
managed.
30

The In-vessel system is an enclosed container that will be located on the previously
proposed landfill site. Weight will be an issue when determining if land settlement will occur.
As stated previously (Windrow section 2.2.3), a compost site on this location would result in an
undetermined amount of settlement, which on a long-term scale, can be an issue. In-vessel
would require a platform made of cement or a similar material to act as a foundation for the
structure. This foundation would also need to be fixed into the ground by piles to help structure
the foundation (Kerkes, 1995). Also, even though it is not required, a possible lab/house may be
constructed next to the In-vessel for laboratory related issues concerning the composted materials.
In addition to constructing a “laboratory”, a road leading up to the In-vessel would be needed
that could support any machine used to transport compost. This would only increase settlement
of the location slightly and is not a large factor in the construction of the facility. Overall, In-
vessel construction on the former landfill site would not require any special constructional needs
that would cause serious problems.
2.4.2 Benefits
In-vessel composting does not require a large amount of land area. Since it takes place in
an enclosed container, it is also less affected by the weather and has less impact on the
surrounding environment. Using In-vessel composting will reduce the amount of organic waste
that would normally be transported to the landfill. Compared to other types of composting
methods, In-vessel releases a very low amount greenhouse gases: carbon dioxide, nitrogen oxide,
nitrous oxide and especially methane. The product of In-vessel composting can be used as a
kind of fertilizer, which can prevent soil erosion, increase soil’s ability to hold water and
nutrients, and add organic matters to reduce the use of chemical fertilizer (Aslam, 2007). The
compost that will be created from this system could be used in the landscaping on campus. This
will allow the University to save money on mulch and fertilizer each year.
31

2.5 Shipping Method
2.5.1 Company Background
The company that will be collecting and processing all organic waste is Viridiun, LLC.
In collaboration with Ohio Mulch, Viridiun operates a completely chemical-free, turnkey process
all of which takes place in Ohio; they convert waste into tangible and marketable products –
enriched soil and nutrient-rich mulch. The company is based out of Westerville, OH; this is
where all waste will be transported to on a weekly basis. Viridiun collaborates with many
different states along with Ohio, but Ohio compost is handled in a specific way. In Ohio,
Viridiun does not make their own products out of the compost, instead, they ship it to Ohio
Mulch where they make the product: Green Envy (Abrams, 2013).
Green Envy is 100% organic compost that can be used to help enrich indoor and outdoor
plants (2). It is sold at all Ohio Mulch retailers. Ohio mulch doesn’t just sell organic mulch,
they also provide a variety of other substances such as: gardening tools, grass seed and straw,
mulches, seed products, and stone and pavers.
Figure 16. Map of Ohio, highlighting where the composting facility is located in relation to
Bowling Green, OH.
http://www.nationsonline.org/oneworld/map/USA/ohio_map.htm
32

2.5.2 Cost
Roughly 2 tons a month will be diverted by composting 4-64 gallon containers on a
weekly basis, these containers will be provided by Viridiun. Cost of compost program: $140.00
per month if serviced 1x per week. Approximately 2 tons x $33.00 (Landfill tonnage fees):
$66.00 (Landfill Tonnage Fees). Hauls will be reduced and spread out as well. Every 2 months,
hauls to the landfill would be reduced by one. This would result in a savings of roughly
$75.00/Month. $141.00 plus fuel and environment fees would be the cost to landfill. This
essentially makes the compost program cost neutral and as the program grows and more weight
is diverted, Bowling Green will see a savings on the landfill fees.
The following terms and conditions apply:
• Viridiun will provide time/date stamp of each service along with weights for each
pick up. These reports will be generated weekly.
• If liners are to be utilized, All compostable bags must be purchased through Ohio
Mulch at their current pricing (Currently .99 per bag).
• Viridiun to participate in the training of employees to help ensure proper
execution of service
• Service start date to be jointly developed between Bowling Green and Viridiun
• Contamination: In the event that contamination is found in the waste material
during a service or during tipping, the service fee for that event will be applied.
In addition, Bowling Green agrees to pay all expenses incurred to dispose of
contamination to include but not limited to transportation, tipping fees, and
landfill fees.
• Containers: Bins will be provided per the pricing structure above.
• In the event that the volume per location exceeds the projected volume capacity
and additional bins are requested, then additional fees apply.
• Payment terms: Net 30 days
• In the case of bin damage or excessive wear, beyond normal use, then bin
replacement and or repair costs will be charged.
33

• Organic material is defined as food waste, vegetable, fruit and bakery material
and all compostable material (Hennessy, 2013).
2.5.3 Benefits
Using Viridiun as a source to ship out compostable material will not require any more
funding than is already available. The University would be essentially breaking even when
paying Viridiun to haul off materials and also sending other wastes to the landfill. Compared to
the Windrow, ORCA, and In-vessel alternatives, shipping off the materials would be the most
cost-effective.
While the University would not be seeing any of the product turned over to us, it is still
generating revenue for the company of Ohio Mulch and is decreasing the amount of waste
hauled off to a landfill each month, therefore producing less methane.
2.5.4 Challenges
Viridiun only has one composting facility in Ohio, and that is located in Westerville, OH,
approximately 120 miles away (see Figure 7). The movement of material would not exactly be
the most environmentally friendly way to dispose of the University's organic waste, but Viridiun
does convert the material into a reusable, organic fertilizer when done. After the compost
reaches maturity, Viridiun turns over the facility to Ohio Mulch. Ohio Mulch then uses worms
to decompose the organic materials and finally uses the castings to make a 100% organic
fertilizers called Green Envy (Abrams, 2013).
34
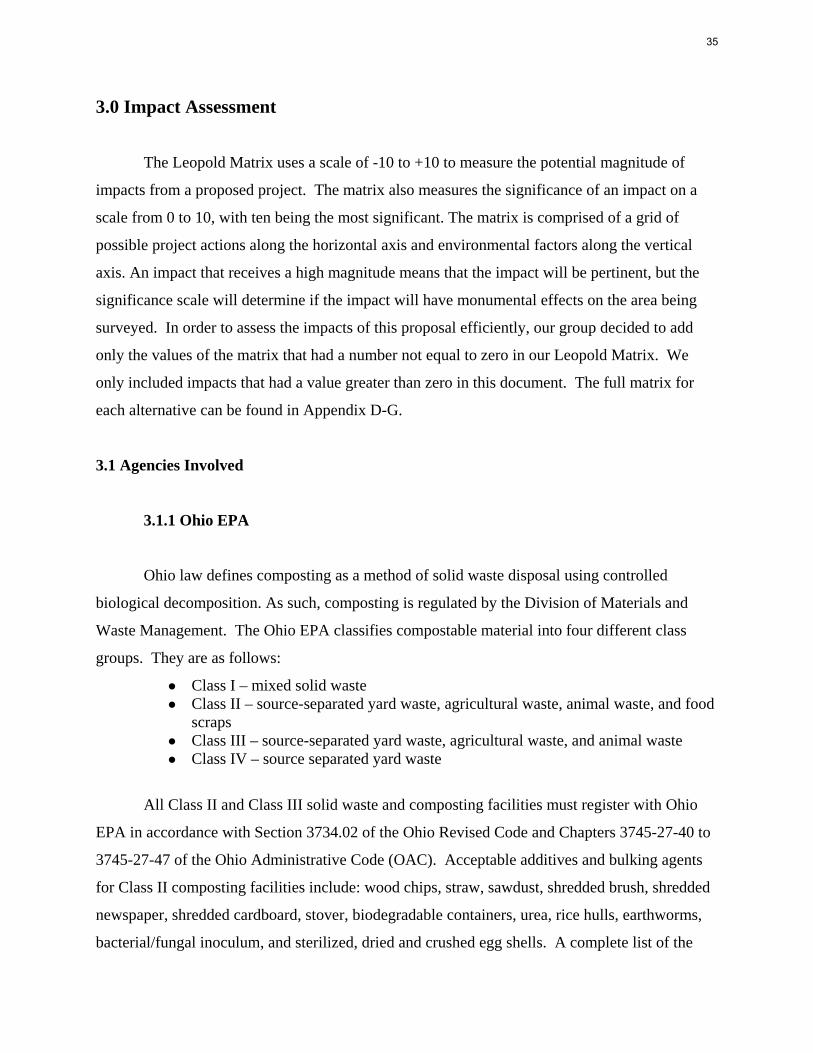
3.0 Impact Assessment
The Leopold Matrix uses a scale of -10 to +10 to measure the potential magnitude of
impacts from a proposed project. The matrix also measures the significance of an impact on a
scale from 0 to 10, with ten being the most significant. The matrix is comprised of a grid of
possible project actions along the horizontal axis and environmental factors along the vertical
axis. An impact that receives a high magnitude means that the impact will be pertinent, but the
significance scale will determine if the impact will have monumental effects on the area being
surveyed. In order to assess the impacts of this proposal efficiently, our group decided to add
only the values of the matrix that had a number not equal to zero in our Leopold Matrix. We
only included impacts that had a value greater than zero in this document. The full matrix for
each alternative can be found in Appendix D-G.
3.1 Agencies Involved
3.1.1 Ohio EPA
Ohio law defines composting as a method of solid waste disposal using controlled
biological decomposition. As such, composting is regulated by the Division of Materials and
Waste Management. The Ohio EPA classifies compostable material into four different class
groups. They are as follows:
● Class I – mixed solid waste ● Class II – source-separated yard waste, agricultural waste, animal waste, and food
scraps ● Class III – source-separated yard waste, agricultural waste, and animal waste ● Class IV – source separated yard waste
All Class II and Class III solid waste and composting facilities must register with Ohio
EPA in accordance with Section 3734.02 of the Ohio Revised Code and Chapters 3745-27-40 to
3745-27-47 of the Ohio Administrative Code (OAC). Acceptable additives and bulking agents
for Class II composting facilities include: wood chips, straw, sawdust, shredded brush, shredded
newspaper, shredded cardboard, stover, biodegradable containers, urea, rice hulls, earthworms,
bacterial/fungal inoculum, and sterilized, dried and crushed egg shells. A complete list of the
35

types of materials that can be added are listed on pages 1 and 2 of Appendix A (Types A-E).
Class II composting facilities must also use a combination of the following methods: Windrow,
In-vessel, or aerated static pile. Other facilities may be used, but they must be first approved by
the director of the Ohio EPA. For a complete list of rules and regulations the Ohio EPA has
created a Guidance Document. The complete list can be found in Appendix A.
The Ohio EPA also requires a license to operate a composting facility and therefore
charges an annual fee in which the price depends on the amount of tonnage. The university will
have to submit a Registration Form which can be found attached to this document in Appendix B
and the Application Form is attached as Appendix C. Since the campus will not generate more
than 12 tons on a daily level, the university will be charged only 300 dollars per year.
3.1.2 Capital Planning
The Office of Capital Planning serves the Bowling Green State University community by
planning and managing funding for new construction and renovation projects on campus. The
goal of the office of Capital Planning is to provide oversight and administration of Local and
State funding provided for construction and renovation projects that benefit the University as a
whole. The Capital Planning office also manages space, classroom upgrades, property, and small
improvement projects. Additional responsibilities include long-range planning and building
project program development. Capital Planning will be responsible for hiring the contracting
company to build the composting stations and the will oversee the project from start to finish.
In order to receive funding for the project, a write up of costs would have to be submitted
to the council on the Capital Planning Board. The office of Design and Construction has a list of
forms that can be accessed for any construction proposal and they can be found on Bowling
Green State University’s website.
3.1.3 City of Bowling Green Public Works
Since the university is located in the city of Bowling Green, it would be wise to contact
them about any construction on the proposed composting site for the Windrow and In-vessel
alternatives. According to the city of Bowling Green Public Works, the site proposed used to be
36

an area of a water treatment facility. After that as demolished, the city put in a temporary landfill
on the site. There are some specific rules and regulations associated with building on landfills,
and the department of Public Works will be responsible for determining if the proposed
alternatives can be built on the proposed site in compliance with the Ohio EPA rules and
regulations.
3.2 Alternatives Selected
3.2.1 No Action
3.2.1.1 Description
Currently all compostable waste from the Oaks dining center is disposed as garbage,
which is collected by the company, Waste Management, Inc. The average amount of daily waste
costs the university about $14.96 per day to dispose of the waste in the landfill on top of a
hauling fee which is $150 per haul. There are approximately 3 hauls per month, but the number
of hauls changes with the amount of garbage produced. Currently, this program is costing the
University approximately $860 dollars a month, and is not generating any revenue (Hennessy
2013). The disposal of compostable food waste in the landfill setting negatively affects air
quality because it produces methane. It also negatively affects food chains and increases pest
fauna populations because it attracts insects, mammals, and birds.
This No Action alternative functions as a baseline that the following alternatives will be
compared to, in order to identify both the positive and negative impacts associate the following
alternatives.
3.2.2 Windrow
3.2.2.1 Description
Windrow composting consists of placing the mixture of raw materials in long narrow
piles, called windrow, that are turned on a regular basis. Windrow composting requires a very
tight schedule of rotating the compost, due to the fact that windrows aerate primarily by natural
or passive air movement. Windrow requires a lot of oxygen to ensure aerobic decomposition
37

(Large Scale Composting, n.d). Temperature is another factor that influences windrow
composting. The temperature should reach 131 degrees Fahrenheit in order for pathological
reductions to occur. If the temperature is allowed to go above that range, the microorganisms
begin to die, slowing the composting process. However, if the temperature is lower than this
range, aerobic decomposition slows (College Guide, n.d).
3.2.2.2 Fauna
The four alternatives all have very high, negative impacts for the fauna at the site. In
general, all the alternatives will take away parts of surface land. In the Leopold matrix we
ranked fauna in the high negatives (-8,-9) with a significance ranging from (4-10). The windrow
material will take up an area of about 5,600 ft. So some important habitats for local species as
well as other animals, including micro-fauna would be negatively affected. Adding the windrow
compost will also attract different fauna such as raccoons, possums and coyotes. The waste
emplacement and emplacement of tailings, spoils and overburdens for fauna were also ranked
very negatively containing fauna. If the windrow piles cannot contain all the excess waste, it
would negatively affect the surrounding fauna. For example, animals would not have as much
space to run, and there would be less open land for birds to land on.
3.2.2.3 Earth Characteristics
The earth characteristics contain three sections. Construction materials, soils and
landforms are all a concern. Impacting soil in any environment can cause a significant impact.
Soil is important for the health of the flora and fauna in any wilderness area. A change in the soil
of our location could have impact on habitats, ground cover, roads and trails, emplacement of
tailings, spoils and overburden. Due to this soil has been assigned a high significance compared
to other environmental factors. The use of the windrow compost will also have a slight negative
effect due to roads and trails. In order for the windrow turner and bulldozer to reach the windrow
compost there will need to be a road created for them to drive up. This would affect the earth
characteristic because it would create a non-pervious road.
38

3.2.2.4 Atmosphere and Air Quality
Since the Windrow piles are to be placed on a landfill site, the release of methane into the
atmosphere from the landfill will be inevitable. Also if Windrow is the chosen alternative the use
of Windrow turners will release exhaust emissions into the atmosphere. Unless the compost
turner machines run off a clean burning fuel or an alternative energy source, diesel combustion
emissions will be released. Also the use of large dump trucks to pick up and or move the
compost will release pollutants into the atmosphere from their exhaust. The release of such
pollutants negatively will affect the surrounding habitat and environment.
3.2.2.5 Land Qualities
With the addition of window compost piles, there will be some effects on the surrounding
land qualities. Currently the proposed site is completely bare and resembles a flat field. The
addition of three Windrow compost piles, Windrow turner machines and the surrounding fences
will add an industrial image to the land site. In order for the Windrow alternative to be put into
effect some wilderness qualities on the land site will have to be negatively affected. For example
the public would much rather want to see an open field than a fenced in area with three piles of
compost.
3.2.2.6 Impact Summary
In order to assess the impact of the Windrow alternative, a Leopold matrix was created
(found in appendix). Found below are the four categories in which we separated the impacts
from a value of high significance to low significance.
The high negative impacts that deal with Windrow are:
• Habitat displacement • Pest attraction • Predator attraction • Poor air quality due to turning machine exhaust • Attraction of insects • Operational Accidents
39

The medium negative impacts that are a result from Windrow are:
• Odors and emissions from waste • Open field loss • Negative image • Weeds
The low negative impacts that are a result from Windrow are:
• Non-previous access roads • Possibility of leaching to surface or groundwater • Local flora removed • Additional infrastructure built
The positive impacts that are result from Windrow are:
• Use less landfill space • Positive image for Bowling Green State University • Ability to take on more compost at once • Recycle nutrients back to the earth • Increase soil productivity
3.2.3 Orca
3.2.3.1 Description
Orca (Organic Refuse Conversion Alternative) is an alternative to conventional
composting facilities. Orca is a bioreactor system that reduces organic waste to water within 24
hours. The organic materials are broken down by environmentally friendly microorganisms in
an aerobic environment ("Orca," 2010). With the current waste production from The Oaks
Dining Center of over nine hundred pounds per day, the Orca would be a qualified candidate for
this type of large scale waste production.
The ORCA Green waste disposal system works using “bio-chips” which house the micro-
organisms used to break down the organic waste. The “bio-chips” are similar in appearance to
charcoal, but degrade much slower than food-waste, so they house the microorganisms between
uses. The machine operates on a fully-automated schedule, and remains on at all times. The
machine mists water regularly onto the material, and then agitates the mixture for a brief period.
After the mixture has been agitated, the machine allows it to sit and the microorganisms
40

decompose the material. The waste inside is fully reduced within 24 hours. The machine can
decompose vegetables, fish by-products (including the meat and bones), meat (poultry, beef,
etc.), rice, noodles, bread, and fruit. The machine is silent and odor-free because the food is not
allowed to sit and develop an odor. The resulting compost water may be used for irrigation,
compost tea, or non-potable plumbing ("Orca food waste," n.d.).
After completing and analyzing a Leopold matrix for this alternative, our team identified
the following impacts.
3.2.3.2 Physical Chemical Characteristics
The Orca system impacts the physical and chemical characteristics on a very small scale,
this is because the Orca system is not located on the selected landfill site it is actually located
inside the Oaks Dining hall adjacent to the other waste disposal facilities in the dining hall. The
orca system will require pipelines connected to the current drainage system or to a separate
drainage system, which could require some underground construction. This will require some
construction but very minimal, which results in low magnitudes and significance values for
construction materials and soil. The Orca system emits a very small amount of carbon dioxide
gas which would require the Orca to be in a well-ventilated area. The gas emissions will also add
to the greenhouse gas emissions, this is why it is ranked very high.
3.2.3.3 Biological Conditions
When concerned with the impacts that the Orca system could have on biological factors,
our team found that insects were of most concern. Due to the location of the Orca, there is
minimal chance of this impacting the flora and fauna in any noticeable way. Since Orca is an
enclosed system inside of a building there is little chance of this attracting any wildlife.
Unfortunately when the Orca system is processing the waste, it can only contain a finite amount
of waste until the process is finished. It is likely that any pre-consumer and post-consumer waste
that is awaiting processing will require a storage bin that could possibly attract insects in the
building. This obviously would have a negative impact and would require some mitigation to
prevent this issue.
41

3.2.3.4 Cultural Factors
Our team found that installing Orca would have a mild negative impact on cultural
patterns and lifestyle, since workers within the Oaks dining facility would have to undergo new
training procedures in order to learn how to sort out compostable items to place into the new
Orca compactor. Also, health and safety would be negatively impacted to a degree, in the case
of an operational failure or if the machine was placed over capacity, as workers may come in
contact with effluent or waste if the machine broke down or exceeded its capacity. Furthermore,
we found that structures and utility networks would encounter somewhat of a negative impact if
the Orca processor were to break or if the machine went over capacity, as waste may leak into
the surrounding habitat.
3.2.3.5 Ecological relationships
In the case of operational failure, our team found that eutrophication could possibly
occur, resulting in a negative impact. However, this impact would have little significance due to
the relatively small size and capacity of the Orca processor. Finally, operational failure or over-
filling the machine could increase the number of disease and insect vectors in the vicinity (as the
waste would serve as a potential habitat for disease/insect vectors), resulting in a mild negative
impact.
3.2.3.6 Impact Summary
Our team found that the Orca alternative would have the potential to cause a few
significant impacts. We found that severe consequences of installing Orca could occur in the
case of:
• Operational failure • Emplacement of tailings, spoils, and overburden
These were found to be the most significant impacts because Orca has a finite storage
capacity, and if the machine was not able to process waste or if too much waste was placed into
the processor, several negative outcomes could occur.
A few minor negative impacts associated with the Orca alternative include:
42

• Creation of pipelines for drainage, which may disrupt the local environment • A small amount of carbon dioxide emissions • Potential to increase number of insects/pests near the Orca processor • Crew members at The Oaks would need to learn new procedures associated with the
installation and use of the machine
Despite Orca’s expensive price, compared to the “No Action” approach, there a many
benefits that in comparison make the price appear minuscule. The water produced by Orca could
be used:
• For landscaping practices • To create a Grey-water system for plumbing in building at the University • To create a revenue for the campus buy selling the water for multipurpose
Overall, with the vast amount of benefits that would ideally pay for the initial cost of
Orca system and to run the system. Orca would save the University thousands of dollars every
year, which the University would normally use for potable water, on plumbing and landscaping.
The benefits from using Orca would outweigh the minor negative effect from running the
system.
3.2.4 In-vessel
3.2.4.1 Description
In-vessel composting is a process in which all materials are kept in a container to produce
compost in certain conditions of moisture, oxygen concentration, airflow, and temperature (up to
70 degrees). There are two types of In-vessel composting: aerobic, which includes the presence
of oxygen; and anaerobic, in which oxygen is absent (Aslam, 2007). Depending on the size of
the vessel, the system can treat anywhere between 365 tons and 20,000 tons of organic waste per
year. The result is a mixture of organic matter, water, and microorganisms (“Technology Fact
Sheet,” 2012).
3.2.4.2. Land, plants, and animals
The presence of the vessel on the site may disturb the land; the construction materials and
the topsoil will be altered. Though only in a small scale, the construction will also take away
some habitat of plants, birds, land animals and insects. On the other hand, it may increase their
populations at the same times since they are attracted to the composting materials.
43

3.2.4.3. Cultural factors
The utility network will need to be applied in the area due to the huge amount of energy
required to run the system. Transportation network and other structures may also need to be
expanded. There may be some noise from the construction when the system is being installed,
but not significant since there is no residential community around the site.
3.2.4.4. Water and air quality
If roads and trails are to be built for transportation, dust will be released, causing air and
water quality problems. Compared to other types of composting methods, In-vessel releases a
very low amount greenhouse gases: carbon dioxide, nitrogen oxide, nitrous oxide and especially
methane. However, the most important impact the system can have is the leaking of odor,
methane and carbon dioxide from inside the vessel, in case of operation failure. This can
significantly increase the amount of insects and microorganisms that are attracted to the
composting materials. Eventually this may lead to health and safety issue for people.
3.2.4.5. Impact Summary
The positive impacts of the project will be the increase of employment that needed to
work on the project, such as on transportation an especially on installation and maintenance.
Also, the land will actually be useful instead of its current conditions which is just a piece of
unused land. A composting system on campus can be a great opportunity to educate students and
give them a closer look at composting technology and green initiatives. Overall, the negative
impacts of In-vessel composting system on the environment are not too significant and can be
reduced once the project is well managed. The main actions that can have impacts on the
environment are:
• Modification of the land surface when the system is set up • Roads and rails for transportation • Energy required to run the system • Waste treatment • Operation failure
The high negative impacts are:
• Construction material, soil and landform
44

• Birds, land animals, insects, and microorganisms • Health and safety issues • Compaction and settling processes
The medium negative impacts are:
• Air quality • Precipitation process • Utility network
The low negative impacts are:
• Wilderness and open-space quality • Trees and grass • Water quality • Transportation network • Cultural patterns
Positive impacts are:
• Employment • Education • Land use
3.2.5. Shipping
3.2.5.1 Description
The company that will be collecting and processing all organic waste is Viridiun, LLC.
In collaboration with Ohio Mulch, Viridiun operates a completely chemical-free, turnkey process
all of which takes place in Ohio; they convert waste into tangible and marketable products –
enriched soil and nutrient-rich mulch. The company is based out of Westerville, OH; this is
where all waste will be transported to on a weekly basis. Viridiun collaborates with many
different states along with Ohio, but Ohio compost is handled in a specific way. In Ohio,
Viridiun does not make their own products out of the compost; instead, they ship it to Ohio
Mulch where they make the product: Green Envy (Abrams, 2013).
Green Envy is 100% organic compost that can be used to help enrich indoor and outdoor
plants (2). It is sold at all Ohio Mulch retailers. Ohio mulch doesn’t just sell organic mulch;
45

they also provide a variety of other substances such as: gardening tools, grass seed and straw,
mulches, seed products, and stone and pavers.
Roughly 2 tons a month will be diverted by composting 4-64 Gallon containers on a
weekly basis. These containers will be provided by Viridiun. Cost of compost program:
$140.00 per month if serviced 1x per week. Approximately 2 tons x $33.00 (Landfill tonnage
fees): $66.00 (Landfill Tonnage Fees). Hauls will be reduced and spread out as well. Every 2
months, Hauls would be reduced by 1. This will result in a savings of roughly $75.00/Mth.
$141.00 plus fuel and environment fees would be the cost to landfill. Essentially, the cost of the
compost program would be cost neutral and as the program grows and more weight is diverted,
Bowling Green will see a savings on the landfill fees.
3.2.5.2 Atmosphere and Air Quality
If the shipping alternative is chosen this means that there will be an negative effect on the
surrounding air quality. In order for the waste to be transported to a facility, it must be shipped in
large trucks. These large trucks produce lots of exhaust which releases CO2 into the atmosphere
thus negatively affecting air quality. This alternative compared to the other proposed ones will
inevitably produce more CO2 emissions because the transport trucks will constantly be shipping
the waste to Viridium in Westerville, Ohio.
3.2.5.3 Employment
The shipping alternative will have a positive effect on employment. As mentioned
previously, The Oaks does produce a lot of food waste. This alternative will support an Ohio
business and therefore, have a positive impact on employment.
3.2.5.4 Impact Summary
In order to assess the impact of the Windrow alternative, a Leopold matrix was created
(found in appendix). Found below are the four categories in which we separated the impacts
from high significance to low significance.
The negative impacts that deal with Shipping are:
46

• Methane and CO2 emissions from trucks traveling • Possibility machinery failure (trucks break down)
The positive impacts that are result from Shipping are:
• No effect to locals- No smell, no inconvenience • Costs less than Windrow and In Vessel
3.2.6 Overall Impact Summary
In general, the selected alternatives each have different impact potentials on the
surrounding area. Each alternative affects the environment in different ways. The windrow and
in-vessel alternatives both have similar impacts on the environment due to the fact that the
methods require either an open or closed pit area to store food waste which is then rotated and
turned into compost. The construction of the facility to store these alternatives has a negative
impact on the area. Also, since windrow occurs in the open, different animals may be attracted
to the area, which has a significantly negative impact on the area of the composting site. For
both windrow and in-vessel, equipment will be required to turn the compost. This equipment
will have a negative impact on the environment not only from turning up the surrounding soil,
but also in fuel emissions. Orca, on the other hand, mainly has negative impacts due to the
potential for mechanical failure or overfilling the compost processor. The shipping method’s
most significant negative impact is on the air and atmosphere due to the increased burning of
fossil fuels that is required to transfer the food waste to the composting site. Some positive
impacts are associated with these alternatives, since both the shipping alternative and in-vessel
have positive impacts due to an increase in employment. Another positive impact for all of the
composting alternatives, other than no action, is that they are able to be used for educational
purposes, and can be a point of pride for Bowling Green State University and its Green
Initiatives Programs.
47

4.0 Evaluation of Alternatives
An Adkins-Burke Rating Checklist was used to compare and evaluate the different
alternatives. This method scores impacts on a scale of -3 to +3, with +3 being the best rating and
-3 being the worst. A rating of zero is neutral. There are no exact guidelines for rating the
alternatives, but a relative explanation of the criteria is defined in the comments section of the
model. A completed copy of the Adkins-Burke model for the alternatives being evaluated can be
found in Appendix H.
Table 2. Results of the Adkins-Burke checklist for alternatives.
4.1 Windrow
Using the Adkins-Burke rating checklist we figured out that for cost the windrow
alternative would have the most negative scores out of all of the alternatives. For example, the
initial cost of purchasing material and the cost of maintenance both scored a -3 where as other
alternatives scored -1 and -2. This is because windrow has the highest price range (we do not
know the official cost of a machine for BGSU, but windrow can potentially have the highest
range). For environmental impacts like methane emission and aesthetics, windrow scored a +3.
However other factors like the overburden of compost, displacement of flora and fauna and the
construction of roads all scored -2 or -1. In the safety section, windrow scored a -2 for risk of
injury due to poor maintenance and material used because windrow uses machines to turn the
compost. Also windrow scored a -1 for students not involved with the project entering
unsupervised. Lastly, under the community factors section, windrow scored a +3 for
environmental education, material produced like organic fertilizer and compost tea and property
48

value. This is because the University will be able to use any compost tea and fertilizer than is a
bi-product of the windrow machine.
4.2 Orca
Using this system we found that Orca resulted in a positive 5 overall rating, ranking it as
the third best option for composting on campus. Orca received a negative -2 for cost range and
raw materials because the cost of Orca is quite expensive yet not as much as other alternatives
and exposed raw material could be a hazard if there are not proper storage containers available.
Orca received a -1 for maintenance hazards safety and for construction cost, this is because the
Orca installation would be costly and there is a possibility of minor hazards from installing the
system. Materials produced received a positive rating of 1 because the Orca system will produce
water and compost tea, which could be used for agriculture or will be recycled into the sewage
system. Aesthetics and environmental education received a rating of positive 2 because since it
will be out of public site it will not pollute our campus aesthetics; also it is an opportunity to
educate students on recycling programs on campus. Students will be affected by the methods
used to collect the organic food waste, which is why Orca did not receive a positive 3 like
Alternatives 1 and 3. Finally, Orca received a positive 3 in property value and methane emission
because the campus will be more environmentally friendly which will make the campus more
desirable and also decrease the methane emissions from sending our waste to a landfill.
4.3 In-Vessel
Based on the Adkins-Burke Rating Checklist, In-vessel composting system does meet the
project’s objective. Compared to the Windrow alternative, it is significantly better because it
will not be directly placed on the ground, it is a closed system (beneficial during extreme
temperatures), and it can automatically be turned. In term of cost, it seems to be the second best
choice, with total score of -4. Compared to other composting methods, In-vessel is not the most
expensive system, though the construction is costly but the materials and maintenance are
relatively less. Some negative impacts of In-vessel include damages due to overflow, impacts on
plants and animals’ habitat, impacts of construction on Lot 12, and increased amount of
49

transportation to access the construction. Significant positive impacts of In-vessel on the
environment are the positive image for the university, and the reduction of that materials go to
the landfill, which means less methane is released to the atmosphere. Overall, the In-vessel
environmental impacts score is 0. In-vessel system does require maintenance since there may be
problems with odor leaking due to improper management. There also needs to be some kind of
security during the construction and afterward when the system is working. In term of safety, In-
vessel system score is -2, and is only better than windrow. The products of In-vessel can be used
as organic fertilizer. This is also be used by the University for environmental education, and
makes BGSU a more sustainable campus.
4.4 Shipping
The Shipping Method would be the number one short-term choice, because it receives a
rating of 8 on the Adkins-Burke checklist. Compared to other composting methods, it is more
budget friendly to ship compostable waste with the company Viridiun until an on-campus
alternative could be constructed. It has very few differences from shipping the waste to the
landfill, and would be an easy transition method, with the benefits of a “green” project. The
project would stay in Ohio, which keeps employment within the state, which is another benefit;
however, it produces more carbon dioxide emissions to ship the waste farther.
4.5 No Action
We gave the No Action Alternative scores of all zeros because there is currently no
composting on campus. All sections reviewed in our Adkins-Burke were based on impacts that
could potentially happen if composting became available on campus. If composting did not
become an option, all actions for removing waste from The Oaks would remain as is.
4.6 Recommendations
After reviewing all of these alternatives, it is decided that Shipping would be the best
short-term method while In-vessel would be the best long-term method. Shipping is definitely
the most cost-effective alternative because it costs almost just as much as the University spends
50

now in sending waste to the landfill site (No Action) and the University would not need to
comply with any EPA standards. In-vessel is the second most cost-effective and is
environmentally preferred to the other alternatives because it is not directly placed on the ground
(leaching is minimized), it is a closed system (unlike Windrow), and the compost does not need
to be manually turned. Orca would be economically preferred because all organic waste would
immediately be put into the machine and this would reduce the amount of odors generated and it
would also be installed in the building. Windrow would only be beneficial if the University did
agree to put in a small composting facility and then add onto it at a later date once more dining
halls were incorporated to the program. Adding onto Windrow is the simplest alternative in
these terms.
4.7 Summary
Based on the summary of our Adkins-Burke chart located above in Figure 1, we
concluded that the Shipping Alternative would be the best choice for the University right now.
With the shipping method of composting, BGSU will not be responsible for contacting the EPA
for regulations, paying fees, the cost of building a composting facility, or hiring staff to maintain
the compost site. Shipping is by far the most cost and labor efficient alternative. Contrary to the
ratings, we also believe that the In-vessel would be the more sought after Alternative in regards
to long term goals for the University. In-vessel received a combined score of 6 in our Adkins-
Burke checklist. This alternative is much more expensive to purchase and maintain in the long-
run in comparison to the Shipping Alternative, however, we believe that the In-vessel Alternative
will benefit the school to much greater lengths in the long run and although BGSU might not be
able to afford this alternative right now, we hope it will be something that can be considered in
the near future.
51

Appendix A Class II Composting Facility Requirements 52

53

54

55

56

57

58

59

Appendix B Composting Facility Registration Form Class II / Class III60

61

62

63

64

Appendix C Application Form 65

66
67

68

69

70

71

72

73

Environmental Items
Magnitude / Significance --> M S M S M S M S M S M S M S M S M S M S M S M S M S M S M Sa. Construction material -2 8 -5 6 -6 3 0 0 -6 3 -2 3 0 0 0 0 -6 1 2 1 0 0 0 0 0 0 -2 2 -27 27b. Soils 8 9 0 0 0 0 0 0 8 9 0 0 0 0 0 0 0 0 0 0 10 3 0 0 0 0 0 0 26 21
c. Land form -1 1 0 0 0 0 0 0 -1 1 0 0 0 0 0 0 0 0 -1 1 -2 2 0 0 0 0 0 0 -5 50 0 0 0 0 0 0 0 0 0 0
a. Underground 0 0 0 0 0 0 0 0 -3 2 0 0 0 0 0 0 0 0 0 0 0 0 0 0 0 0 0 0 -3 2
b. Quality 0 0 0 0 0 0 0 0 -2 1 0 0 0 0 0 0 0 0 0 0 0 0 0 0 0 0 0 0 -2 1
a. Quality (gases, particulates) -5 7 0 0 0 0 0 0 -6 6 0 0 0 0 0 0 0 0 0 0 -3 5 0 0 0 0 -3 5 -17 23
d. Methane and CO2 emissions 3 9 0 0 0 0 -6 6 0 0 0 0 0 0 0 0 0 0 -3 5 0 0 0 0 -3 5 -9 250 0 0 0 0 0 0 0 0 0 0 0 0 0 0 0
c. Deposition (sedimentation,precipitation) 0 0 0 0 0 0 -3 2 0 0 0 0 0 0 0 0 3 3 -3 5 0 0 0 0 -3 5 -6 15
f. Compaction and settling -7 9 -8 9 0 0 -8 9 0 0 0 0 0 0 0 0 0 0 -4 4 0 0 0 0 -4 4 -31 35
B. Biological Conditions 0 0 0 0 0 0 0 0 0 0a. Trees/shrubs/grass -1 1 -1 1 0 0 -1 1 0 0 0 0 0 0 0 0 4 2 -1 1 0 0 0 0 0 0 0 6
e. Endangered Species 0 0 0 0 0 0 0 0 0 0 0 0 0 0 0 0 0 0 0 0 0 0 0 0 0 0 0 00 0 0 0 0 0 0 0 0 0
a. Birds -2 4 0 0 0 0 -7 3 -1 1 0 0 0 0 0 0 0 0 3 2 -2 2 0 0 0 0 -2 2 -11 14b. Land animals including reptiles -7 4 -7 4 0 0 -7 3 -1 1 0 0 0 0 0 0 0 0 1 1 -2 2 0 0 0 0 -2 2 -25 17d. Insects -9 10 -1 2 0 0 0 0 -1 1 0 0 0 0 0 0 0 0 2 1 -2 2 0 0 0 0 -2 2 -13 18e. Microfauna 4 0 0 0 0 0 0 0 0 0 0 0 0 0 0 0 0 0 1 1 -8 5 0 0 0 0 -8 5 -11 11f. Endangered Species 0 0 0 0 0 0 0 0 0 0 0 0 0 0 0 0 0 0 0 0 0 0 0 0 0 0 0 0
C. Cultural Factors
1. L
and
Use
a. Wilderness and open spaces 4 3 4 3 0 0 0 0 -1 1 0 0 0 0 0 0 0 0 5 3 -1 1 0 0 0 0 -1 1 10 120 0 0 0 0 0 0 0 0 0 0 0 0 0 0 0
b. Wilderness qualities 0 0 -2 2 0 0 0 0 0 0 0 0 0 0 0 0 0 0 0 0 -2 2 0 0 0 0 -2 2 -6 6c. Open-space qualities 3 4 -3 4 0 0 0 0 0 0 0 0 0 0 0 0 0 0 -1 1 -1 1 0 0 0 0 -1 1 -3 11d. Landscape design 0 0 4 5 0 0 0 0 -1 1 0 0 0 0 0 0 0 0 6 5 -4 1 0 0 0 0 -4 1 1 13
f. Rare and Unique species or ecosystems 0 0 0 0 0 0 0 0 0 0 0 0 0 0 0 0 0 0 0 0 0 0 0 0 0 0 0 0 0 0
a. Cultural patterns (life-style) 0 0 0 0 0 0 -2 3 0 0 0 0 0 0 0 0 0 0 0 0 0 0 0 0 0 0 0 0 -2 3b. Health and safety 0 0 0 0 0 0 0 0 -2 3 0 0 0 0 0 0 0 0 0 0 -1 1 0 0 0 0 -10 5 -13 9
c. Employment 5 3 0 0 0 0 0 0 4 3 0 0 0 0 0 0 0 0 0 0 0 0 0 0 0 0 0 0 9 60 0 0 0 0 0 0 0 0 0 0 0
a. Structures -2 2 -2 2 0 0 0 0 0 0 0 0 0 0 0 0 -4 2 0 0 -3 3 0 0 0 0 -3 3 -14 12b. Transportation network (movement, access) 0 0 -1 2 0 0 0 0 3 3 0 0 0 0 0 0 -2 2 0 0 -1 1 0 0 0 0 -1 1 -2 9c. Utility networks -3 2 -2 3 0 0 0 0 0 0 0 0 0 0 0 0 0 0 0 0 0 0 0 0 0 0 0 0 -5 5
d. Waste disposal 0 0 0 0 0 0 0 0 0 0 0 0 0 0 0 0 0 0 0 0 -3 6 0 0 0 0 -3 6 -6 12
D. Ecological relationships
b. Eutrophication 0 0 0 0 0 0 0 0 0 0 0 0 0 0 0 0 0 0 0 0 0 0 0 0 0 0 0 0 0 0c. Disease and insect vectors -1 2 0 0 0 0 0 0 0 0 0 0 0 0 0 0 0 0 0 0 -7 3 0 0 0 0 -7 3 -15 8d. Food chains 0 0 0 0 0 0 0 0 0 0 0 0 0 0 0 0 0 0 0 0 1 2 0 0 0 0 1 2 2 4
Actions Totals -13 78 -24 43 -6 3 -16 9 -28 54 -2 3 0 0 0 0 -12 5 -42 57 0 0 -60 57
Leopold Matrix for Windrow
Actions
E. Land alteration J. Accidents
C. Resource extraction
D. Processing I. Chemical Treatment
A. Modification
of regime
B. Land transformation
and construction
En
vir
on
me
nta
l It
em
To
tals
e. J
unk
disp
osal
c. O
pera
tiona
l fa
ilure
H. Waste emplacement and treatment
l. S
urfa
cing
or
pavi
ng
m. N
oise
and
vi
brat
ion
e. E
nerg
y ge
nera
tion
h. T
rans
mis
sion
lin
es, p
ipel
ines
, an
d co
rrid
ors
b. S
urfa
ce
exca
vatio
n
c. S
ubsu
rface
ex
cava
tion
and
reto
rting
1. E
arth
2.
Wat
er3.
Atm
osph
ere
c. E
mpl
acem
ent
of ta
iling
s, s
poils
, an
d ov
erbu
rden
d. L
ands
capi
ng
d. W
eed
cont
rol
e. R
oads
and
tra
ils A. Physical and Chemical
Characteristics
c. M
odifi
catio
n of
ha
bita
t
d. A
ltera
tion
of
grou
nd c
over
4. P
roce
sses
1.Fl
ora
2.
Aest
hetic
s an
d H
uman
In
tere
sts
4.
Cul
tura
l St
atus
5.
Man
ufac
ture
d fa
cilit
ies
and
activ
ities
2. F
auna
Appendix D Windrow Leopold Matrix 74

Environmental Items
Magnitude / Significance --> M S M S M S M S M S M S M S M S M S M S M S M S M S M S M Sa. Construction material -2 8 -5 6 -6 3 0 0 -6 3 -4 3 0 0 0 0 -8 2 2 1 0 0 0 0 0 0 -2 2 -31 28b. Soils 8 9 0 0 0 0 0 0 8 9 0 0 0 0 0 0 0 0 0 0 10 3 0 0 0 0 0 0 26 21
c. Land form -1 1 0 0 0 0 0 0 -1 1 0 0 0 0 0 0 0 0 -1 1 -2 2 0 0 0 0 0 0 -5 50 0 0 0 0 0 0 0 0 0 0
a. Underground 0 0 0 0 0 0 0 0 -3 2 0 0 0 0 0 0 0 0 0 0 0 0 0 0 0 0 0 0 -3 2
b. Quality 0 0 0 0 0 0 0 0 -2 1 0 0 0 0 0 0 0 0 0 0 0 0 0 0 0 0 0 0 -2 1
a. Quality (gases, particulates) -5 7 0 0 0 0 0 0 -6 6 0 0 0 0 0 0 0 0 0 0 -3 5 0 0 0 0 -3 5 -17 23
d. Methane and CO2 emissions 3 9 0 0 0 0 0 0 -6 6 0 0 0 0 0 0 0 0 0 0 -3 5 0 0 0 0 -3 5 -9 250 0 0 0 0 0 0 0 0 0 0 0 0 0
c. Deposition (sedimentation,precipitation) 0 0 0 0 0 0 0 0 -3 2 0 0 0 0 0 0 0 0 3 3 -3 5 0 0 0 0 -3 5 -6 15
f. Compaction and settling -7 9 -8 9 0 0 0 0 -8 9 0 0 0 0 0 0 0 0 0 0 -4 4 0 0 0 0 -4 4 -31 35
B. Biological Conditions
a. Trees/shrubs/grass -1 1 -1 1 0 0 0 0 -1 1 0 0 0 0 0 0 0 0 4 2 -1 1 0 0 0 0 0 0 0 6
e. Endangered Species 0 0 0 0 0 0 0 0 0 0 0 0 0 0 0 0 0 0 0 0 0 0 0 0 0 0 0 0 0 0
a. Birds -2 4 0 0 0 0 -7 3 -1 1 0 0 0 0 0 0 0 0 3 2 0 0 0 0 0 0 -1 1 -8 11b. Land animals including reptiles -7 4 -7 4 0 0 -7 3 -1 1 0 0 0 0 0 0 0 0 1 1 0 0 0 0 0 0 -1 1 -22 14d. Insects -9 10 -1 2 0 0 0 0 -1 1 0 0 0 0 0 0 0 0 2 1 0 0 0 0 0 0 -2 2 -11 16e. Microfauna 4 0 0 0 0 0 0 0 0 0 0 0 0 0 0 0 0 0 1 1 0 0 0 0 0 0 -8 5 -3 6f. Endangered Species 0 0 0 0 0 0 0 0 0 0 0 0 0 0 0 0 0 0 0 0 0 0 0 0 0 0 0 0 0 0
C. Cultural Factors
1. L
and
Use
a. Wilderness and open spaces 4 3 4 3 0 0 0 0 -1 1 0 0 0 0 0 0 0 0 5 3 -1 1 0 0 0 0 -1 1 10 120 0 0 0 0 0 0 0 0 0
b. Wilderness qualities 0 0 -2 2 0 0 0 0 0 0 0 0 0 0 0 0 0 0 0 0 -2 2 0 0 0 0 -2 2 -6 6c. Open-space qualities 3 4 -3 4 0 0 0 0 0 0 0 0 0 0 0 0 0 0 -1 1 -1 1 0 0 0 0 -1 1 -3 11d. Landscape design 0 0 4 5 0 0 0 0 -1 1 0 0 0 0 0 0 0 0 6 5 -4 1 0 0 0 0 -4 1 1 13
f. Rare and Unique species or ecosystems 0 0 0 0 0 0 0 0 0 0 0 0 0 0 0 0 0 0 0 0 0 0 0 0 0 0 0 0 0 0
a. Cultural patterns (life-style) 0 0 0 0 0 0 -2 3 0 0 0 0 0 0 0 0 0 0 0 0 0 0 0 0 0 0 0 0 -2 3b. Health and safety 0 0 0 0 0 0 0 0 -2 3 0 0 0 0 0 0 0 0 0 0 -1 1 0 0 0 0 -10 7 -13 11
c. Employment 5 3 0 0 0 0 0 0 4 3 0 0 0 0 0 0 0 0 0 0 0 0 0 0 0 0 6 7 15 130 0
a. Structures -2 2 -2 2 0 0 0 0 0 0 0 0 0 0 0 0 -5 2 0 0 -3 3 0 0 0 0 -3 3 -15 12b. Transportation network (movement, access) 0 0 -1 2 0 0 0 0 3 3 0 0 0 0 0 0 -3 2 0 0 -1 1 0 0 0 0 -1 1 -3 9c. Utility networks -3 2 -2 3 0 0 0 0 0 0 0 0 0 0 0 0 -6 6 0 0 0 0 0 0 0 0 0 0 -11 11
d. Waste disposal 0 0 0 0 0 0 0 0 0 0 0 0 0 0 0 0 0 0 0 0 -3 6 0 0 0 0 -3 6 -6 12
D. Ecological relationships
b. Eutrophication 0 0 0 0 0 0 0 0 0 0 0 0 0 0 0 0 0 0 0 0 0 0 0 0 0 0 0 0 0 0c. Disease and insect vectors -1 2 0 0 0 0 0 0 0 0 0 0 0 0 0 0 0 0 0 0 -4 3 0 0 0 0 -4 3 -9 8d. Food chains 0 0 0 0 0 0 0 0 0 0 0 0 0 0 0 0 0 0 0 0 1 2 0 0 0 0 1 2 2 4
Actions Totals -13 78 -24 43 -6 3 -16 9 -28 54 -4 3 0 0 0 0 -22 12 -25 46 0 0 -49 64
Leopold Matrix for In-vessel
Actions
E. Land alteration J. Accidents
C. Resource extraction
D. Processing I. Chemical Treatment
A. Modification
of regime
B. Land transformation
and construction
En
vir
on
me
nta
l It
em
To
tals
e. J
unk
disp
osal
c. O
pera
tiona
l fa
ilure
H. Waste emplacement and treatment
l. S
urfa
cing
or
pavi
ng
m. N
oise
and
vi
brat
ion
e. E
nerg
y ge
nera
tion
h. T
rans
mis
sion
lin
es, p
ipel
ines
, an
d co
rrid
ors
b. S
urfa
ce
exca
vatio
n
c. S
ubsu
rface
ex
cava
tion
and
reto
rting
1. E
arth
2.
Wat
er3.
Atm
osph
ere
c. E
mpl
acem
ent
of ta
iling
s, s
poils
, an
d ov
erbu
rden
d. L
ands
capi
ng
d. W
eed
cont
rol
e. R
oads
and
tra
ils A. Physical and Chemical
Characteristics
c. M
odifi
catio
n of
ha
bita
t
d. A
ltera
tion
of
grou
nd c
over
4. P
roce
sses
1.Fl
ora
2.
Aest
hetic
s an
d H
uman
In
tere
sts
4.
Cul
tura
l St
atus
5.
Man
ufac
ture
d fa
cilit
ies
and
activ
ities
2. F
auna
Appendix E In-vessel Leopold Matrix 75

Environmental Items
Magnitude / Significance --> M S M S M S M S M S M S M S M S M S M S M S M S M S M S M Sa. Construction material 0 0 0 0 0 0 0 0 0 -3 4 0 0 0 0 0 0 0 0 0 0 0 0 0 0 -1 1 -4 5b. Soils 0 0 0 0 0 0 0 0 0 0 -2 1 0 0 0 0 0 0 0 0 0 0 0 0 0 0 0 0 -2 1
c. Land form 0 0 0 0 0 0 0 0 0 0 0 0 0 0 0 0 0 0 0 0 0 0 0 0 0 0 0 0 0 00 0
a. Underground 0 0 0 0 0 0 0 0 0 0 0 0 0 0 0 0 0 0 0 0 0 0 0 0 0 0 0 0 0 0
b. Quality 0 0 0 0 0 0 0 0 0 0 0 0 0 0 0 0 0 0 0 0 0 0 0 0 0 0 0 0 0 0
a. Quality (gases, particulates) 0 0 0 0 0 0 0 0 0 0 0 0 0 0 0 0 0 0 0 0 -3 4 0 0 0 0 -1 2 -4 6
d. Methane and CO2 emissions 0 0 0 0 0 0 0 0 0 0 -3 1 0 0 0 0 -5 4 0 0 -2 3 0 0 0 0 -2 3 -12 110 0
c. Deposition (sedimentation,precipitation) 0 0 0 0 0 0 0 0 0 0 0 0 0 0 0 0 0 0 0 0 0 0 0 0 0 0 0 0 0 0
f. Compaction and settling 0 0 0 0 0 0 0 0 0 0 -1 1 0 0 0 0 0 0 0 0 0 0 0 0 0 0 0 0 -1 1
B. Biological Conditions
a. Trees/shrubs/grass 0 0 0 0 0 0 0 0 0 0 0 0 0 0 0 0 0 0 0 0 0 0 0 0 0 0 0 0 0 0
e. Endangered Species 0 0 0 0 0 0 0 0 0 0 0 0 0 0 0 0 0 0 0 0 0 0 0 0 0 0 0 0 0 0
a. Birds 0 0 0 0 0 0 0 0 0 0 0 0 0 0 0 0 0 0 0 0 0 0 0 0 0 0 0 0 0 0b. Land animals including reptiles 0 0 0 0 0 0 0 0 0 0 0 0 0 0 0 0 0 0 0 0 0 0 0 0 0 0 0 0 0 0d. Insects 0 0 0 0 0 0 0 0 0 0 0 0 0 0 0 0 0 0 0 0 -4 5 0 0 0 0 0 0 -4 5e. Microfauna 0 0 0 0 0 0 0 0 0 0 0 0 0 0 0 0 0 0 0 0 0 0 0 0 0 0 0 0 0 0f. Endangered Species 0 0 0 0 0 0 0 0 0 0 0 0 0 0 0 0 0 0 0 0 0 0 0 0 0 0 0 0 0 0
C. Cultural Factors 0 0 0 0 0 0 0 0 0 0
1. L
and
Use
a. Wilderness and open spaces 0 0 0 0 0 0 0 0 0 0 0 0 0 0 0 0 0 0 0 0 0 0 0 0 0 0 0 0 0 00 0 0 0 0 0 0 0 0 0 0 0 0 0
b. Wilderness qualities 0 0 0 0 0 0 0 0 0 0 0 0 0 0 0 0 0 0 0 0 0 0 0 0 0 0 0 0 0 0c. Open-space qualities 0 0 0 0 0 0 0 0 0 0 0 0 0 0 0 0 0 0 0 0 0 0 0 0 0 0 0 0 0 0d. Landscape design 0 0 0 0 0 0 0 0 0 0 0 0 0 0 0 0 0 0 0 0 0 0 0 0 0 0 0 0 0 0
f. Rare and Unique species or ecosystems 0 0 0 0 0 0 0 0 0 0 0 0 0 0 0 0 0 0 0 0 0 0 0 0 0 0 0 0 0 00 0 0 0 0 0 0 0 0 0
a. Cultural patterns (life-style) -9 4 0 0 0 0 0 0 0 0 0 0 0 0 0 0 0 0 0 0 -4 4 0 0 0 0 0 0 -13 8b. Health and safety -2 2 0 0 0 0 0 0 0 0 0 0 0 0 0 0 0 0 0 0 -5 7 0 0 0 0 -7 5 -14 14
c. Employment 0 0 0 0 0 0 0 0 0 0 2 1 0 0 0 0 0 0 0 0 6 7 0 0 0 0 0 0 8 80 0 0 0 0 0 0 0 0 0
a. Structures 0 0 0 0 0 0 0 0 0 0 0 0 0 0 0 0 0 0 0 0 -3 1 0 0 0 0 -3 5 -6 6b. Transportation network (movement, access) 0 0 0 0 0 0 0 0 0 0 0 0 0 0 0 0 0 0 0 0 0 0 0 0 0 0 0 0 0 0c. Utility networks 0 0 0 0 0 0 0 0 0 0 0 0 0 0 0 0 0 0 0 0 0 0 0 0 0 0 -2 2 -2 2
d. Waste disposal 0 0 0 0 0 0 0 0 0 0 0 0 0 0 0 0 -4 3 0 0 -8 5 0 0 0 0 -3 2 -15 10
D. Ecological relationships0 0 0 0 0 0 0 0 0 0
b. Eutrophication 0 0 0 0 0 0 0 0 0 0 0 0 0 0 0 0 0 0 0 0 0 0 0 0 0 0 -4 2 -4 2c. Disease and insect vectors 0 0 0 0 0 0 0 0 0 0 0 0 0 0 0 0 0 0 0 0 -5 5 0 0 0 0 -6 4 -11 9d. Food chains 0 0 0 0 0 0 0 0 0 0 0 0 0 0 0 0 0 0 0 0 0 0 0 0 0 0 0 0 0 0
Actions Totals -11 6 0 0 0 0 0 0 0 0 -7 8 0 0 0 0 -9 7 -28 41 0 0 -29 26
4. P
roce
sses
1.Fl
ora
2.
Aest
hetic
s an
d H
uman
In
tere
sts
4.
Cul
tura
l St
atus
5.
Man
ufac
ture
d fa
cilit
ies
and
activ
ities
2. F
auna
2. W
ater
3. A
tmos
pher
e
c. E
mpl
acem
ent
of ta
iling
s, s
poils
, an
d ov
erbu
rden
d. L
ands
capi
ng
d. W
eed
cont
rol
e. R
oads
and
tra
ils A. Physical and Chemical
Characteristics
c. M
odifi
catio
n of
ha
bita
t
d. A
ltera
tion
of
grou
nd c
over
m. N
oise
and
vi
brat
ion
e. E
nerg
y ge
nera
tion
h. T
rans
mis
sion
lin
es, p
ipel
ines
, an
d co
rrid
ors
b. S
urfa
ce
exca
vatio
n
c. S
ubsu
rface
ex
cava
tion
and
reto
rting
1. E
arth
A. Modification
of regime
B. Land transformation
and construction
En
vir
on
me
nta
l It
em
To
tals
e. J
unk
disp
osal
c. O
pera
tiona
l fa
ilure
H. Waste emplacement and treatment
l. S
urfa
cing
or
pavi
ng
Leopold Matrix for ORCA
Actions
E. Land alteration J. Accidents
C. Resource extraction
D. Processing I. Chemical Treatment
Appendix F Orca Leopold Matrix 76

Environmental Items
Magnitude / Significance --> M S M S M S M S M S M S M S M S M S M S M S M S M S M S M Sa. Construction material 0 0 0 0 0 0 0 0 0 0 0 0 0 0 0 0 0 0 0 0 0 0 0 0 0 0 0 0 0 0b. Soils 0 0 0 0 0 0 0 0 0 0 0 0 0 0 0 0 0 0 0 0 0 0 0 0 0 0 0 0 0 0
c. Land form 0 0 0 0 0 0 -1 2 0 0 0 0 0 0 0 0 0 0 0 0 0 0 0 0 0 0 0 0 -1 20 0
a. Underground 0 0 0 0 0 0 0 0 0 0 0 0 0 0 0 0 0 0 0 0 0 0 0 0 0 0 0 0 0 0
b. Quality 0 0 0 0 0 0 0 0 0 0 0 0 0 0 0 0 0 0 0 0 0 0 0 0 0 0 0 0 0 0
a. Quality (gases, particulates) -2 3 0 0 0 0 0 0 0 0 0 0 0 0 0 0 0 0 0 0 0 0 0 0 0 0 0 0 -2 3
d. Methane and CO2 emissions -3 6 0 0 0 0 0 0 0 0 0 0 0 0 0 0 0 0 0 0 0 0 0 0 0 0 0 0 -3 60 0
c. Deposition (sedimentation,precipitation) 0 0 0 0 0 0 0 0 0 0 0 0 0 0 0 0 0 0 0 0 0 0 0 0 0 0 0 0 0 0
f. Compaction and settling 0 0 0 0 0 0 0 0 0 0 0 0 0 0 0 0 0 0 0 0 0 0 0 0 0 0 0 0 0 0
B. Biological Conditions
a. Trees/shrubs/grass 0 0 0 0 0 0 0 0 0 0 0 0 0 0 0 0 0 0 0 0 0 0 0 0 0 0 0 0 0 0
e. Endangered Species -1 2 0 0 0 0 0 0 0 0 0 0 0 0 0 0 0 0 0 0 0 0 0 0 0 0 0 0 -1 2
a. Birds -1 2 0 0 0 0 0 0 0 0 0 0 0 0 0 0 0 0 0 0 0 0 0 0 0 0 0 0 -1 2b. Land animals including reptiles -1 2 -1 2 -1 2 -4 6 -2 3 0 0 0 0 0 0 0 0 0 0 0 0 0 0 0 0 0 0 -9 15d. Insects 0 0 0 0 0 0 0 0 0 0 0 0 0 0 0 0 0 0 0 0 0 0 0 0 0 0 0 0 0 0e. Microfauna 0 0 0 0 0 0 0 0 0 0 0 0 0 0 0 0 0 0 0 0 0 0 0 0 0 0 0 0 0 0f. Endangered Species -1 2 0 0 -2 3 0 0 0 0 0 0 0 0 0 0 0 0 0 0 0 0 0 0 0 0 0 0 -3 5
C. Cultural Factors
1. L
and
Use
a. Wilderness and open spaces -2 3 -3 4 -3 2 -2 2 -1 2 0 0 0 0 0 0 0 0 0 0 0 0 0 0 0 0 0 0 -11 130 0
b. Wilderness qualities -2 3 -3 4 -3 2 -2 2 -1 2 0 0 0 0 0 0 0 0 0 0 0 0 0 0 0 0 0 0 -11 13c. Open-space qualities -2 3 -3 4 -3 2 -2 2 -1 2 0 0 0 0 0 0 0 0 0 0 0 0 0 0 0 0 0 0 -11 13d. Landscape design -2 3 -3 4 -3 2 -2 2 -1 2 0 0 0 0 0 0 0 0 0 0 0 0 0 0 0 0 0 0 -11 13
f. Rare and Unique species or ecosystems -1 2 -1 2 -2 3 -1 2 -1 2 0 0 0 0 0 0 0 0 0 0 0 0 0 0 0 0 0 0 -6 11
a. Cultural patterns (life-style) 0 0 0 0 0 0 0 0 0 0 0 0 0 0 0 0 0 0 0 0 0 0 0 0 0 0 0 0 0 0b. Health and safety 0 0 0 0 0 0 0 0 0 0 0 0 0 0 0 0 0 0 0 0 0 0 0 0 0 0 -2 3 -2 3
c. Employment 3 4 0 0 0 0 0 0 1 2 0 0 0 0 0 0 0 0 0 0 0 0 0 0 0 0 -2 3 2 90 0
a. Structures 1 2 2 2 2 2 0 0 0 0 0 0 0 0 0 0 0 0 0 0 0 0 0 0 0 0 0 0 5 6b. Transportation network (movement, access) 2 3 2 3 3 5 0 0 3 3 0 0 0 0 0 0 0 0 0 0 0 0 0 0 0 0 0 0 10 14c. Utility networks 1 2 1 2 3 4 0 0 0 0 0 0 0 0 0 0 0 0 0 0 0 0 0 0 0 0 0 0 5 8
d. Waste disposal 0 0 0 0 0 0 0 0 0 0 0 0 0 0 0 0 0 0 0 0 0 0 0 0 0 0 0 0 0 0
D. Ecological relationships
b. Eutrophication 0 0 0 0 0 0 0 0 0 0 0 0 0 0 0 0 0 0 0 0 0 0 0 0 0 0 0 0 0 0c. Disease and insect vectors 0 0 0 0 0 0 0 0 0 0 0 0 0 0 0 0 0 0 0 0 0 0 0 0 0 0 0 0 0 0d. Food chains -2 3 -2 3 -2 3 -1 3 0 0 0 0 0 0 0 0 0 0 0 0 0 0 0 0 0 0 0 0 -7 12
Actions Totals -13 45 -11 30 -11 30 -15 21 -3 18 0 0 0 0 0 0 0 0 0 0 0 0 -4 6
Leopold Matrix for Shipping
Actions
E. Land alteration J. Accidents
C. Resource extraction
D. Processing I. Chemical Treatment
A. Modification
of regime
B. Land transformation
and construction
En
vir
on
me
nta
l It
em
To
tals
e. J
unk
disp
osal
c. O
pera
tiona
l fa
ilure
H. Waste emplacement and treatment
l. S
urfa
cing
or
pavi
ng
m. N
oise
and
vi
brat
ion
e. E
nerg
y ge
nera
tion
h. T
rans
mis
sion
lin
es, p
ipel
ines
, an
d co
rrid
ors
b. S
urfa
ce
exca
vatio
n
c. S
ubsu
rface
ex
cava
tion
and
reto
rting
1. E
arth
2.
Wat
er3.
Atm
osph
ere
c. E
mpl
acem
ent
of ta
iling
s, s
poils
, an
d ov
erbu
rden
d. L
ands
capi
ng
d. W
eed
cont
rol
e. R
oads
and
tra
ils A. Physical and Chemical
Characteristics
c. M
odifi
catio
n of
ha
bita
t
d. A
ltera
tion
of
grou
nd c
over
4. P
roce
sses
1.Fl
ora
2.
Aest
hetic
s an
d H
uman
In
tere
sts
4.
Cul
tura
l St
atus
5.
Man
ufac
ture
d fa
cilit
ies
and
activ
ities
2. F
auna
Appendix G Shipping Leopold Matrix 77

1
Table X.X: Adkins-Burke Checklist Factor Description Alternative Comment
1 2 3 4 5 A. Success in meeting objective of project
Creating a composting option for the campus of Bowling Green State University
+3 +3 +3 +3 0 Taking the No-Action alternative will not complete the goal of the project.
B. Cost 1. Materials Initial purchasing amount of all
materials -3 -2 -1 0 0 Alternative 1 has the highest price range, Alternative 2 has the second highest and
3 has the smallest range. Alternative 4 would cost just as much as the method that is now in existence.
2. Maintenance Cost of the alternative over time -3 -1 -1 0 0 Untreated compost could result in more pests and foul odors. The fourth Alternative would not exist if maintenance was not upheld. Alternative 3 would be automatically turned.
3. Construction Labor costs, tools, etc. -2 -1 -2 0 0 Construction costs will be similar in Alternative 1 and 3. Alternative 4 will have no construction cost
C. Environmental Impacts
1. Raw Materials Overburden of compost -2 -2 -2 0 0 If the properly sized vessel is not suitable for the amount of waste produced, the vessels will overflow and cause severe damages.
2. Methane emission Reduction of the amount of materials going to the landfill.
+3 +3 +3 +3 0 Alternatives 1, 2, 3, and 4 will decrease the amount of waste processed at the landfill, and therefore decrease methane production.
3. Flora and Fauna Some plants and animals could be displaced
-1 0 -1 0 0 Construction of Alternative 1 and 3 will decrease the amount of open area on campus, although, no endangered species live in the area.
4. Aesthetics Creates a positive image for Bowling Green State University
+3 +2 +3 +2 0 Alternatives 1 and 3 will be visible, as they are outside. Alternative 2 and 4 will not be directly visible.
5. Increase in motor vehicle traffic
Construction of roads to easily access compost material
-1 0 -1 -1 0 Access roads will have to be built for Alternatives 1 and 3. Alternative 4 will result in more vehicles entering the loading dock behind The Oaks.
6. Construction Aspects occurring during assembly of compost vessels
-2 -1 -2 0 0 Construction during the process could block Lot 12 on campus or cause The Oaks dining hall to become noisy.
D. Safety 1. Maintenance Hazards
Risk of injury due to poor maintenance and materials used
-2 -1 -1 -1 0 Alternative 1 requires manual turning of the compost pile. Alternative 4 could be a hazard due to driving and operative duties at Viridiun.
Appendix H Adkins-Burke Checklist 78

2
2. Unauthorized personnel
Students not involved with the project entering unsupervised
-1 0 -1 0 0 If fences and security are not put into place properly, students could enter the premises.
E. Community Factors
1. Environmental Education
Use by school and public +3 +2 +3 0 0 Alternatives 1, 2, and 3 have this opportunity. The school and public will not be directly affected by the fourth alternative.
2. Materials Produced Materials such as organic fertilizer and compost tea.
+3 +1 +3 0 0 BGSU will benefit from organic fertilizer produced by Alternatives 1 and 3 (organic fertilizer that does not have to be bought) and Alternative 2 (compost tea). Alternative 4 will also produce fertilizer and tea, but it will not be property of the university.
3. Property Value The effect of the property on fulfilling the President’s Climate Commitment.
+3 +3 +3 +2 0 Alternatives 1, 2, 3 and 4 will make BGSU a more environmentally-friendly campus.
Rating Scale: -3 to +3; -3 being the worst rating, 0 being neutral, +3 being the best rating Alternative 1: Windrow; Alternative 2: Orca; Alternative 3: In-vessel; Alternative 4: Shipping; Alternative 5: No Action
79

Works Cited
Aslam, Danielle.(Dec 19, 2007). The Science Behind In-Vessel Composting. Retrieved From :http://www.calrecycle.ca.gov/lea/conference/07conf/presentations/day1/compost101/aslam.ppt Bowling Green Public Works Department. Phone interview. 27 Feb. 2013.
Bowling Green State University. (n.d.). What We Do - Capital Planning and Design. Retrieved April 2013, from Bowling Green State University: http://www.bgsu.edu/offices/architect/ Bowling Green State University. (2013). The Oaks Dining Center. Retrieved February 2013, from Campus Sustainability: http://www.bgsu.edu/offices/sustainability/page96889.html
College Guide to Campus Wide Composting (n.d.). In Project Compost. Retrieved From http://projectcompost.ucdavis.edu/sites/default/files/COLLEGE_.pdf Composting Equipment (2013). In Earth Saver. Retrieved From http://earthsaverequipment.com/Composting-Equipment CUESA. (2013).Composting: Recycling Our Food. Retrieved from: http://cuesa.org/page/composting-recycling-our-food
Evans, Steve D. (Aug 28, 2011) Advantages and Disadvantages of In Vessel Composting Versus Other Organic Waste Treatment Methods. Retrieved from http://ezinearticles.com/?Advantages-and-Disadvantages-of-In-Vessel-Composting-Versus-Other-Organic-Waste-Treatment-Methods&id=6525003
Hennessy, N. (2013). Waste Management, Inc., information on the Oaks. Interview with Randy Abrams, Viridiun. 2013 Kerkes, David J. (January 1995) Factors to Consider When Planning Landfill Construction. Retrieved from http://www.geotechconsultant.com/articles.htm Large Scale Composting (n.d.). In FAO Corporate Document Repository. Retrieved From http://www.fao.org/docrep/007/y5104e/y5104e07.htm
Last, S. (2006). Building on Landfill Sites. Retrieved February 2013, from http://EzineArticles.com/?expert=Steve_Last
McLaughlin. W. (1995). Construction Over Old Landfills. Fifth Annual Northeast
Mother Nature Network: http://www.mnn.com/earth-matters/stories/post-consumer-waste
80

Natural Gas Seminar. Retireved 2013 from http://www.scsengineers.com/Papers/Construction%20over%20Old%20Landfills.pdf
Ohio Department of Natural Resources, ODNR Division of Wildlife. Retrieved February 21, 2013, Web site: http://www.dnr.state.oh.us/tabid/4414/Default.asp
Ohio EPA. (n.d.). Composting. Retrieved April 2013, from Ohio Environmental Protection Agency: http://www.epa.ohio.gov/dmwm/Home/Composting.aspx
Ohio Nature. (2006-2013). Ohio Wildflowers List. Retrieved February 2013, from http://www.ohio-nature.com/ohio-wildflowers-list.html
Orca. (2010, August 4). Retrieved from http://www.infobarrel.com/Orca Orca food waste digester . (n.d.). Retrieved from http://burgisenviro.com/textbelow.php?category=orca Pierce, Jeffrey L. (March 2010) In Commercial Development of Closed Landfills: Case studies and Technical/Regulatory Issues. Retrieved From: http://www.scs-secure.com/Papers/6-02%20Commercial%20Development%20of%20Closed%20LF.pdf.
PlentyMag.com. (2009, April 23). Post-consumer waste. Retrieved February 26, 2013, from
Technology Fact Sheet: In Vessel Composting. Retrieved from techaction.org/Factsheets/ref15x07.pdf . 21. June, 2012. The Risks and Rewards of Reclaiming Old Landfills (2005). Boston Business Journal. Retrieved February 2013 from http://www.bizjournals.com/boston/stories/2005/04/04/focus4.html?page=all
The Weather Channel. (2013, February 25). Average Weather for Bowling Green, OH. Bowling Green , Ohio, USA: Weather Channel.
Windrow Composting (2003, October). In Job Service Pollution Prevention Opportunity Hankbook. Retrived From http://www.p2sustainabilitylibrary.mil/P2_Opportunity_Handbook/7_II_A_2.html
Wood County Auditor Office. (2013) Property data information for Parcel B07-511-190201002000.Retrieved Feb. 21, 2013 from Wood County Auditor Office.
Wood County Solid Waste Management District (WCSWMD). (2013). Landfill. Retrieved from: http://www.wcswmd.org/landfill.html
81