Draft Environmental Impact Statement for the Land ...
494
Rocky Mountain Region August 2021 Draft Environmental Impact Statement for the Land Management Plan Revision Grand Mesa, Uncompahgre, and Gunnison National Forests Volume 1: Chapters 1, 2, 3, and 4 Delta, Garfield, Gunnison, Hinsdale, Mesa, Mineral, Montrose, Ouray, Saguache, San Juan, and San Miguel Counties, Colorado Uncompahgre Peak rises to 14,309 feet, the tallest of the Grand Mesa, Uncompahgre, and Gunnison National Forests’ fourteen-thousand-foot peaks.
Transcript of Draft Environmental Impact Statement for the Land ...

Rocky Mountain Region August 2021
Draft Environmental Impact Statement for the Land Management Plan Revision Grand Mesa, Uncompahgre, and Gunnison National Forests Volume 1: Chapters 1, 2, 3, and 4 Delta, Garfield, Gunnison, Hinsdale, Mesa, Mineral, Montrose, Ouray, Saguache, San Juan, and San Miguel Counties, Colorado
Uncompahgre Peak rises to 14,309 feet, the tallest of the Grand Mesa, Uncompahgre,
and Gunnison National Forests’ fourteen-thousand-foot peaks.


GMUG National Forests Land Management Plan Draft Environmental Impact Statement: Volume 1
i
Draft Environmental Impact Statement for the Land Management Plan Revision
Grand Mesa, Uncompahgre, and Gunnison National Forests
Volume I: Chapters 1, 2, 3, and 4 Delta, Garfield, Gunnison, Hinsdale, Mesa, Mineral, Montrose,
Ouray, Saguache, San Juan, and San Miguel Counties, Colorado
Lead agency: USDA Forest Service Cooperating agencies Bureau of Land Management
U.S. Agricultural Research Service U.S. Fish and Wildlife Service Colorado Department of Agriculture Colorado Department of Natural Resources Colorado Parks and Wildlife Colorado Water Conservation Board Delta County Gunnison County Hinsdale County Mesa County Montrose County Ouray County Saguache County San Miguel County City of Grand Junction, Colorado Town of Crested Butte, Colorado
Responsible official: Chad Stewart, Forest Supervisor 2250 South Main Street Delta, Colorado 81416
For more information, contact: Samantha Staley, Forest Planner 2250 South Main Street Delta, Colorado 81416 (970) 852-9812 and (970) 874-6649
Abstract: This environmental impact statement documents the analysis of four alternatives (A through D) developed by the Forest Service to revise the 1991 land and resource management plan, as amended, for the Grand Mesa, Uncompahgre, and Gunnison National Forests.

USDA Forest Service
ii
In accordance with Federal civil rights law and U.S. Department of Agriculture (USDA) civil rights regulations and policies, the USDA, its Agencies, offices, and employees, and institutions participating in or administering USDA programs are prohibited from discriminating based on race, color, national origin, religion, sex, gender identity (including gender expression), sexual orientation, disability, age, marital status, family/parental status, income derived from a public assistance program, political beliefs, or reprisal or retaliation for prior civil rights activity, in any program or activity conducted or funded by USDA (not all bases apply to all programs). Remedies and complaint filing deadlines vary by program or incident. Persons with disabilities who require alternative means of communication for program information (e.g., Braille, large print, audiotape, American Sign Language, etc.) should contact the responsible agency or USDA’s TARGET Center at (202) 720-2600 (voice and TTY) or contact USDA through the Federal Relay Service at (800) 877-8339. Additionally, program information may be made available in languages other than English. To file a program discrimination complaint, complete the USDA Program Discrimination Complaint Form, AD-3027, available online at http://www.ascr.usda.gov/complaint_filing_cust.html and at any USDA office or write a letter addressed to USDA and provide in the letter all of the information requested in the form. To request a copy of the complaint form, call (866) 632-9992. Submit your completed form or letter to USDA by: (1) mail: U.S. Department of Agriculture, Office of the Assistant Secretary for Civil Rights, 1400 Independence Avenue, SW, Washington, D.C. 20250-9410; (2) fax: (202) 690-7442; or (3) email: [email protected] (link sends email). USDA is an equal opportunity provider, employer, and lender.

GMUG National Forests Land Management Plan Draft Environmental Impact Statement: Volume 1
iii
Summary The draft environmental impact statement is organized as follows: chapter 1 (purpose and need, proposed action, decision framework, and public involvement), chapter 2 (issues and alternatives), chapter 3 (affected environment and environmental consequences), chapter 4 (consultation and coordination), and literature cited. The U.S. Forest Service proposes to revise the forest plan for the Grand Mesa, Uncompahgre, and Gunnison National Forests (GMUG). The area affected by the proposal includes approximately 2.9 million acres of National Forest System land in southwestern Colorado. This action is needed because conditions, science, and policy have changed since the forest plan was approved, and a revised forest plan will provide integrated plan direction for social, economic, and ecological sustainability and multiple uses. On the basis of public comments and feedback, the plan revision team for the GMUG National Forests identified several key issues for resolution in alternatives, including but not limited to the extent of recommended wilderness, the extent of backcountry big game habitat versus areas open to new recreational trails, and the role of active vegetation management to achieve desired conditions. The alternatives include:
• Alternative A (also referred to as the current plan in this document) is the no-action alternative, which reflects the 1983 forest plan, as amended to date, and accounts for current laws, regulations, and terms and conditions from biological opinions.
• Alternative B, which can be broadly described as the “blended” alternative, was released for public feedback as the working draft revised forest plan, and it was subsequently updated in response to public feedback and internal Forest Service review. It proposed a modest amount of additional wilderness, an active vegetation management program, and a balanced approach to competing uses and values on the national forests.
• Alternative C can be broadly described as the “active management emphasis” alternative, with fewer special area allocations, more active vegetation and fuels management, less restrictive recreation use management, more motorized settings, and more areas allocated as suitable for timber production.
• Alternative D can be broadly described as the “special area emphasis” alternative, with more special area allocations, a smaller vegetation and fuels management program, more active and restrictive recreation use management, more non-motorized settings, and fewer areas allocated as suitable for timber production.
Based upon the effects of the alternatives, and public comments on the draft environmental impact statement, the responsible official will select from amongst the action alternatives to blend and modify a final alternative for the draft record of decision.


GMUG National Forests Land Management Plan Draft Environmental Impact Statement: Volume 1
v
Contents Summary ............................................................................................................................................. iii Contents ............................................................................................................................................... v Chapter 1. Purpose and Need for Action .......................................................................................... 1
Introduction ........................................................................................................................................ 1 Planning Area .................................................................................................................................... 1 Purpose and Need for Action ............................................................................................................ 3
Provide Strategic, Adaptive Direction ............................................................................................ 5 Contribute to Social and Economic Sustainability ......................................................................... 5 Provide for Ecological Sustainability .............................................................................................. 5 Maintain the Diversity of Plant and Animal Communities .............................................................. 6 Integrate Resource Management for Multiple Uses and Ecosystem Services .............................. 6
Proposed Action ................................................................................................................................ 6 Decision Framework .......................................................................................................................... 7 Public Involvement and Collaboration ............................................................................................... 8 Government Involvement and Related Planning Efforts ................................................................. 10
Federal ......................................................................................................................................... 10 Tribal ............................................................................................................................................ 10 State ............................................................................................................................................. 11 County and City............................................................................................................................ 11 Council on Environmental Quality Regulations ............................................................................ 11
Chapter 2. Alternatives ..................................................................................................................... 12 Introduction ...................................................................................................................................... 12 Alternative Development ................................................................................................................. 12 Issues .............................................................................................................................................. 13
Issue 1. Extent of Potential Additional Wilderness / Wilderness Areas to be Analyzed .............. 13 Issue 2. Amount of Active Vegetation Management .................................................................... 13 Issue 3. Balance between Increased Recreation and Existing Wildlife Habitat and Backcountry Hunting Opportunities .................................................................................................................. 13 Issue 4. Balance between More Restrictive and Less Restrictive Recreation Use Management ..................................................................................................................................................... 13 Issue 5. Balance between Motorized and Non-motorized Recreation......................................... 14 Issue 6. Balance between Increased Development and More Apparently Natural Settings ....... 14 Issue 7. Citizen Proposals for Special Management Areas with Preservation and/or Recreation Emphases .................................................................................................................................... 14 Issue 8. Modifications to Management Areas .............................................................................. 15 Issues that Did Not Contribute to the Development of Alternatives ............................................. 15
Alternatives ...................................................................................................................................... 16 Elements Common to All Alternatives.......................................................................................... 16 Elements Common to all Action Alternatives (B, C, and D) ......................................................... 17 Alternative A – No-Action Alternative (the Current Plan) ............................................................. 19 Alternative B – Blended Alternative ............................................................................................. 20 Alternative C – Active Management Emphasis ............................................................................ 21

USDA Forest Service
vi
Alternative D – Special Area Emphasis ....................................................................................... 22 Alternatives Considered but Not Studied in Detail ....................................................................... 24 Issues and Concerns that are Outside the Scope of the Decision to be Made ........................... 28
Comparison of Alternatives ............................................................................................................. 29 Comparison of Alternatives by Geographic Area ........................................................................ 40
Chapter 3. Affected Environment and Environmental Consequences ........................................ 52 Introduction ...................................................................................................................................... 52 Structure .......................................................................................................................................... 53 Best Available Scientific Information ............................................................................................... 54 Part I. Ecological Resources ........................................................................................................... 55
Overview ...................................................................................................................................... 55 Terrestrial Ecosystems ................................................................................................................ 55 Aquatic and Riparian Ecosystems ............................................................................................. 111 Wildlife and Plant Species ......................................................................................................... 128 Air Resources ............................................................................................................................ 230 Carbon Stocks ........................................................................................................................... 249 Climate ....................................................................................................................................... 252 Invasive Species ........................................................................................................................ 266 Soil Resources ........................................................................................................................... 273 Watersheds and Water Resources ............................................................................................ 278
Part II. Socioeconomic Resources ................................................................................................ 296 Socioeconomics ......................................................................................................................... 297 Multiple Uses and Ecosystem Services ..................................................................................... 315 Environmental Justice ................................................................................................................ 402 Designated Areas ...................................................................................................................... 408
Chapter 4. Consultation and Coordination ................................................................................... 417 List of Preparers ............................................................................................................................ 417
Core Interdisciplinary Team ....................................................................................................... 417 Extended Interdisciplinary Team ............................................................................................... 418 GMUG National Forests Leadership Team ............................................................................... 418 List of Federal, State, and Local Cooperators ........................................................................... 419 List of Tribal Governments Consulted ....................................................................................... 420 Agencies to Which the Draft Environmental Impact Statement was Distributed ....................... 420
Acronyms and Abbreviations ........................................................................................................ 421 Plan Component Acronyms ........................................................................................................... 421 Other Acronyms and Abbreviations ............................................................................................... 422
Glossary ........................................................................................................................................... 423 References Cited ............................................................................................................................. 458

GMUG National Forests Land Management Plan Draft Environmental Impact Statement: Volume 1
vii
List of Tables Table 1. Geographic areas of the GMUG National Forests ................................................................................... 3 Table 2. Size of management area, by alternative .............................................................................................. 30 Table 3. Forestwide issues, by alternative ........................................................................................................... 32 Table 4. Draft revised forest plan objectives, by alternative, in response to key planning issues ........................ 34 Table 5. Management areas by action alternative, Grand Mesa Geographic Area ............................................. 41 Table 6. Suitable timber by alternative, Grand Mesa Geographic Area ............................................................... 41 Table 7. Summer recreation opportunity spectrum settings by alternative, Grand Mesa Geographic Area ......... 42 Table 8. Winter recreation opportunity spectrum settings by alternative, Grand Mesa Geographic Area ............ 42 Table 9. Management areas by action alternative, Gunnison Basin Geographic Area ........................................ 43 Table 10. Suitable timber by alternative, Gunnison Basin Geographic Area ....................................................... 44 Table 11. Summer recreation opportunity spectrum settings by alternative, Gunnison Basin Geographic Area . 44 Table 12. Winter recreation opportunity spectrum settings by alternative, Gunnison Basin Geographic Area .... 45 Table 13. Management areas by action alternative, North Fork Valley Geographic Area ................................... 45 Table 14. Suitable timber by alternative, North Fork Valley Geographic Area ..................................................... 46 Table 15. Summer recreation opportunity spectrum settings by alternative, North Fork Valley Geographic Area ............................................................................................................................................................................ 46 Table 16. Winter recreation opportunity spectrum settings by alternative, North Fork Valley Geographic Area .. 47 Table 17. Management areas by action alternative, San Juans Geographic Area .............................................. 47 Table 18. Suitable timber by alternative, San Juans Geographic Area ................................................................ 48 Table 19. Summer recreation opportunity spectrum settings by alternative, San Juans Geographic Area ......... 48 Table 20. Winter recreation opportunity spectrum settings by alternative, San Juans Geographic Area ............. 49 Table 21. Management areas by action alternative, Uncompahgre Plateau Geographic Area ........................... 49 Table 22. Suitable timber by alternative, Uncompahgre Plateau Geographic Area ............................................. 50 Table 23. Summer recreation opportunity spectrum settings by alternative, Uncompahgre Plateau Geographic Area ..................................................................................................................................................................... 50 Table 24. Winter recreation opportunity spectrum settings by alternative, Uncompahgre Plateau Geographic Area ..................................................................................................................................................................... 51 Table 25. Crosswalk of draft revised forest plan content and corresponding section of chapter 3 of the draft environmental impact statement .......................................................................................................................... 53 Table 26. Terrestrial ecosystems of the plan area ............................................................................................... 56 Table 27. Acreage of terrestrial ecosystem distribution within the GMUG boundary and geographic areas ....... 57 Table 28. Key ecosystem characteristics for terrestrial ecosystems in the GMUG National Forests ................... 59 Table 29. Amount of existing and potential natural vegetation for terrestrial ecosystems in the GMUG National Forests ................................................................................................................................................................ 60 Table 30. Results of modeling with the Vegetation Dynamics Development Tool and existing conditions for terrestrial ecosystems in the GMUG National Forests ......................................................................................... 61 Table 31. Number of seedlings per acre on Forest Inventory and Analysis (FIA) plots, 2002 through 2015 ....... 62 Table 32. Contemporary ignitions and wildfire area burned by ecosystem in the GMUG National Forests ......... 64 Table 33. Amount of wildfire area burned by ecosystem and geographic area in the GMUG National Forests, 1968–2014........................................................................................................................................................... 64 Table 34. Pre-European settlement fire regimes and contemporary fire conditions for selected ecosystems in the GMUG National Forests ...................................................................................................................................... 66 Table 35. Major damage agents detected in aerial survey of the GMUG National Forests ................................. 68 Table 36. Major insects and diseases in the GMUG National Forests ................................................................. 69 Table 37. Current patch sizes for ecosystem groups, late-successional groups (4B and 4C), and within wilderness and roadless areas in the GMUG National Forests ........................................................................... 70 Table 38. Current snag density compared to current forest plan direction .......................................................... 72 Table 39. Current down woody material estimates based on Forest Inventory and Analysis (FIA) plot data ...... 73

USDA Forest Service
viii
Table 40. Ecological integrity of terrestrial ecosystems in the GMUG National Forests ...................................... 75 Table 41. Key ecosystem characteristics and indicators used in analysis .......................................................... 87 Table 42. Summary of plan components relevant to terrestrial vegetation for the revised forest plan ................ 94 Table 43. Area of forested ecosystems in the wildland-urban interface as currently mapped ........................... 103 Table 44. Issues that vary by action alternative and relevant terrestrial ecosystem indicators ......................... 105 Table 45. Draft revised forest plan objectives that vary by action alternative and relevant terrestrial ecosystem indicator ............................................................................................................................................................ 106 Table 46. Percentage of riparian and wetland ecosystems, by geographic area .............................................. 114 Table 47. Vegetative functional condition of riparian and wetland ecosystems in the GMUG National Forests 114 Table 48. Ecological integrity of aquatic ecosystems in the GMUG National Forests ....................................... 116 Table 49. Ecological integrity of wetland and riparian ecosystems in the GMUG National Forests .................. 116 Table 50. Threatened, endangered, proposed, and candidate species considered .......................................... 129 Table 51. Species of conservation concern in the GMUG National Forests ...................................................... 130 Table 52. Species associated with the spruce-fir ecosystem ............................................................................ 132 Table 53. Species associated with the aspen ecosystem ................................................................................. 133 Table 54. Species associated with the spruce-fir-aspen ecosystem ................................................................. 133 Table 55. Species associated with the lodgepole pine ecosystem .................................................................... 134 Table 56. Species associated with the pinyon-juniper ecosystem .................................................................... 134 Table 57. Species associated with the ponderosa pine ecosystem .................................................................. 135 Table 58. Species associated with the cool-moist mixed conifer ecosystem .................................................... 135 Table 59. Species associated with the warm-dry mixed conifer ecosystem ...................................................... 136 Table 60. Species associated with the bristlecone-limber pine ecosystem ....................................................... 136 Table 61. Species associated with the montane shrubland, oak-serviceberry-mountain mahogany ecosystem .......................................................................................................................................................................... 137 Table 62. Species associated with the sagebrush shrubland ecosystem .......................................................... 137 Table 63. Species associated with the montane-subalpine grasslands ecosystem .......................................... 138 Table 64. Species associated with the alpine uplands, alpine rocky slopes, screes, and cliffs ecosystem ....... 138 Table 65. Species associated with the desert alluvial saltshrub ecosystem ...................................................... 139 Table 66. Species associated with rivers and streams ...................................................................................... 140 Table 67. Species associate with lakes and reservoirs ..................................................................................... 140 Table 68. Species associated with the fens ecosystem .................................................................................... 140 Table 69. Species associated with the montane-alpine wet meadows and marshes ecosystem ...................... 141 Table 70. Species associated with the montane-subalpine riparian shrublands ecosystem ............................. 141 Table 71. Species associated with the cottonwood riparian woodlands ecosystem .......................................... 142 Table 72. Species associated with non-alpine rock outcrops and cliffs ............................................................. 143 Table 73. Species associated with snags and down woody material ................................................................ 143 Table 74. Species associated with unique substrates ....................................................................................... 144 Table 75. Key predator-prey relationships ........................................................................................................ 144 Table 76. Species affected by genetic drift, stochastic events, and anthropogenic disturbances ..................... 146 Table 77. Species with high or extreme vulnerability to climate change ........................................................... 147 Table 78. Species potentially impacted by insects and disease ........................................................................ 147 Table 79. Species potentially affected by intentional mortality .......................................................................... 148 Table 80. Species potentially affected by habitat fragmentation ....................................................................... 149 Table 81. Species potentially affected by invasive or non-native terrestrial species ......................................... 150 Table 82. Species potentially affected by livestock and wildlife grazing, browsing, and trampling .................... 150 Table 83. Species potentially affected by mining .............................................................................................. 151 Table 84. Species potentially affected by non-native fish .................................................................................. 152 Table 85. Species potentially affected by vegetation management and alteration ............................................ 152 Table 86. Species potentially affected by non-hunting recreation ..................................................................... 153

GMUG National Forests Land Management Plan Draft Environmental Impact Statement: Volume 1
ix
Table 87. Species potentially affected by hydrologic alteration ......................................................................... 154 Table 88. Lynx habitat environmental baseline under the current forest plan as of March 2021 ....................... 160 Table 89. Southern Rockies Lynx Amendment, by alternative .......................................................................... 164 Table 90. Lynx habitat use areas in the wildland-urban interface ...................................................................... 166 Table 91. Summary of use of exemptions and exceptions to Southern Rockies Lynx Amendment lynx habitat management standards: wildland-urban interface fuels treatment exemptions ................................................. 168 Table 92. Summary of use of exemptions and exceptions to Southern Rockies Lynx Amendment lynx habitat management standards: Veg S5 and S6 exceptions used in lynx habitat ......................................................... 168 Table 93. Mapped lynx habitat acres in suitable timber, by alternative, GMUG National Forests ..................... 172 Table 94. Lynx use areas and/or mapped lynx habitat in suitable timber, by alternative ................................... 173 Table 95. GMUG lynx habitat acres in existing wilderness, recommended wilderness, Colorado roadless areas, special interest areas, and research natural areas ............................................................................................ 174 Table 96. Effects of recommended wilderness on lynx habitat .......................................................................... 175 Table 97. Lynx habitat and use area distribution by land manager or ownership type for the cumulative effects area ................................................................................................................................................................... 176 Table 98. Distribution of designated critical habitat for Gunnison sage-grouse in the GMUG National Forests 179 Table 99. Overlap of designated critical habitat for Gunnison sage-grouse with alternative B management areas, summarized Forestwide .................................................................................................................................... 182 Table 100. Overlap of designated critical habitat for Gunnison sage-grouse with alternative B management areas, summarized by population ...................................................................................................................... 183 Table 101. Acreage of suitable timber base in Gunnison sage-grouse designated critical habitat .................... 186 Table 102. Designated critical habitat distribution in grazing allotments ............................................................ 188 Table 103. Designated road miles and density in critical habitat designated for Gunnison sage-grouse, GMUG National Forests ................................................................................................................................................ 189 Table 104. Designated trail miles and density in critical habitat designated for Gunnison sage-grouse, GMUG National Forests ................................................................................................................................................ 190 Table 105. Overlap of critical habitat designated for Gunnison sage-grouse and management areas for all action alternatives ........................................................................................................................................................ 192 Table 106. Bighorn sheep summer and winter range distribution in management areas for alternative A ........ 205 Table 107. Bighorn sheep summer range distribution in management areas for all action alternatives, revised to remove management areas for which the action alternatives designation in bighorn sheep habitat shows little difference ........................................................................................................................................................... 205 Table 108. Bighorn sheep winter range distribution in management areas for all action alternatives, revised to remove management areas for which the action alternatives designation in bighorn sheep habitat shows little difference ........................................................................................................................................................... 206 Table 109. Areas suitable for timber production for all alternatives ................................................................... 210 Table 110. Recreational impact activities to wildlife by management area designation ..................................... 214 Table 111. Recreation opportunity spectrum settings for all alternatives ........................................................... 217 Table 112. Relative impacts to wildlife by alternative ........................................................................................ 218 Table 113. Route density standards by management area, by alternative ........................................................ 220 Table 114. Baseline route density for wildlife management areas, by alternative ............................................. 222 Table 115. Effects of management areas on habitat connectivity for all alternatives......................................... 228 Table 116. Baseline, low, medium, and high oil and gas development air pollution effects ............................... 232 Table 117. Air quality conditions and trends at four national parks near the GMUG National Forests .............. 234 Table 118. Air quality measurement indicators .................................................................................................. 238 Table 119. Total amount of logging vehicle and equipment NAAQS and greenhouse gas emissions that would be produced by the SBEADMR proposed action compared to the annual Colorado statewide non-road vehicle and equipment emissions .................................................................................................................................. 243 Table 120. Effects to air quality and climate change, by alternative .................................................................. 246 Table 121. Cumulative air quality and greenhouse gas emissions and effects trends ....................................... 248 Table 122. Major forest carbon pools in the GMUG National Forests, 2008–2015 ............................................ 250 Table 123. Summary of potential future trends in climate-related variables for the GMUG National Forests .... 255

USDA Forest Service
x
Table 124. Resources and uses affected by climate change, potential indicators for monitoring, and direction and magnitude of potential changes ................................................................................................................. 257 Table 125. Invasibility rating by geographic area .............................................................................................. 267 Table 126. Erosion hazard ratings in the GMUG National Forests ................................................................... 274 Table 127. Watershed sub-basins of the GMUG National Forests.................................................................... 279 Table 128. Watershed condition class ratings for watersheds in each geographic area (number of watersheds by condition class) ............................................................................................................................................. 282 Table 129. Class 1 (good) watersheds with the potential to degrade to Class 2 (fair) ...................................... 282 Table 130. Number of springs and estimated springs per acre in the GMUG National Forests ........................ 284 Table 131. Hydrogeologic groups and units in the GMUG National Forests ..................................................... 284 Table 132. Segments designated as outstanding waters .................................................................................. 285 Table 133. Impaired streams and reasons for impairment in the GMUG National Forests ............................... 286 Table 134. Factors of economic sustainability in the GMUG analysis area ....................................................... 297 Table 135. Population characteristics in the GMUG analysis area, 1990–2016 ................................................ 299 Table 136. Effects of timber harvest on the local economy, by alternative ........................................................ 302 Table 137. Current status of cultural resources in the GMUG National Forests ................................................ 317 Table 138. Cultural site condition data for the GMUG National Forests ............................................................ 317 Table 139. Approximate livestock grazing acreage, by geographic area .......................................................... 330 Table 140. Range improvement types by district .............................................................................................. 331 Table 141. Rangeland vegetation condition for the GMUG National Forests .................................................... 331 Table 142. Rangeland vegetation condition by percentage of geographic areas .............................................. 331 Table 143. Range trend as a percentage of geographic areas ......................................................................... 332 Table 144. Grazing allotment overlaps with recommended wilderness, alternatives B and D .......................... 337 Table 145. Inventoried existing summer recreation opportunity spectrum settings in the GMUG National Forests .......................................................................................................................................................................... 342 Table 146. Summer recreation opportunity spectrum inventories, 1991 and 2018 ........................................... 344 Table 147. 1983 forest plan direction on recreation opportunity spectrum, by management prescription area . 346 Table 148. Recreation opportunity spectrum settings management direction in the no-action alternative ........ 346 Table 149. Summer recreation opportunity spectrum – Acreage of management direction, by alternative ....... 350 Table 150. Winter recreation opportunity spectrum – Acreage of management direction, by alternative .......... 350 Table 151. Acreage of wildlife management areas for each action alternative ................................................. 351 Table 152. Wilderness, wildlife, and special management areas – Acreage of management direction, by alternative ......................................................................................................................................................... 352 Table 153. Scenic integrity objective, visual quality objective, and perception crosswalk ................................. 360 Table 154. Summary of scenic integrity objective by forest plan alternative for the GMUG National Forests ... 361 Table 155. Effects for scenic resources, by alternative ..................................................................................... 370 Table 156. Harvest acres, by decade and treatment type ................................................................................. 378 Table 157. Lands suitable and not suitable for timber production by alternative ............................................... 384 Table 158. Projected timber sale program (annual average volume output) for each alternative ..................... 386 Table 159. Estimated acreage of timber management under each alternative (estimated annual acreage) ..... 387 Table 160. Draft revised forest plan snag retention thresholds ......................................................................... 390 Table 161. Recreation opportunity spectrum allocations within the suitable timber area, by alternative ........... 396 Table 162. Scenic integrity objective allocations within the suitable timber area, by alternative ....................... 397 Table 163. Lands suitable for timber production and total projected timber sale program, by alternative ......... 398 Table 164. Estimated percentage of minority population and people in poverty, 2015 ..................................... 404 Table 165. Size of recommended wilderness, by alternative ............................................................................ 412 Table 166. Research natural areas in the GMUG National Forests .................................................................. 413 Table 167. Existing and proposed special interest areas in the GMUG National Forests ................................. 414 Table 168. Core interdisciplinary team .............................................................................................................. 417

GMUG National Forests Land Management Plan Draft Environmental Impact Statement: Volume 1
xi
Table 169. Extended interdisciplinary team ....................................................................................................... 418 Table 170. GMUG National Forests leadership team ........................................................................................ 419
List of Figures Figure 1. Location of Grand Mesa, Uncompahgre, and Gunnison National Forests planning area ....................... 2 Figure 2. Geographic areas of the GMUG National Forests .................................................................................. 4 Figure 3. Management areas for alternative A, the no-action alternative ............................................................ 36 Figure 4. Management areas for alternative B, the blended alternative .............................................................. 37 Figure 5. Management areas for alternative C, with an active management emphasis ....................................... 38 Figure 6. Management areas for alternative D, with a special area emphasis .................................................... 39 Figure 7. Snags per acre in the GMUG National Forests from 2002 to 2015, based on Forest Inventory and Analysis plot data ................................................................................................................................................ 71 Figure 8. Results of ST-Sim predictive models for future seral stage distributions in the GMUG National Forests, part 1 ................................................................................................................................................................... 98 Figure 9. Results of ST-Sim predictive models for future seral stage distributions in the GMUG National Forests, part 2 ................................................................................................................................................................... 99 Figure 10. Results of ST-Sim predictive models for future seral stage distributions in the GMUG National Forests, part 3 ................................................................................................................................................... 100 Figure 11. Population-level utilization distribution for 118 lynx .......................................................................... 156 Figure 12. Mapped lynx habitat in the GMUG National Forests, as modeled from FSVeg Spatial, March 2021159 Figure 13. Lynx habitat in a timber sale project area ......................................................................................... 169 Figure 14. Area where VEG S7 applies in alternative B .................................................................................... 171 Figure 15. Intervention expense and relative success in sagebrush rangelands along a continuum from degraded state to intact core ............................................................................................................................. 187 Figure 16. Schematic diagram of trail density concept ...................................................................................... 224 Figure 17. Motorized and non-motorized routes, route displacement buffers, and wildlife security areas in the GMUG National Forests .................................................................................................................................... 226 Figure 18. Habitat connectivity framework ......................................................................................................... 228 Figure 19. Haziest and clearest days for the Weminuche Wilderness, 1990–2019 ........................................... 235 Figure 20. Haziest and clearest days for the White River National Forest, 2001–2019 ..................................... 236 Figure 21. Total forest carbon in the Rocky Mountain Region, 2005–2013 ....................................................... 249 Figure 22. Major forest disturbances in the GMUG National Forests, 1991–2011 ............................................. 250 Figure 23. Watershed condition classes in the GMUG National Forests ........................................................... 281

USDA Forest Service
xii
List of Maps
Maps are located online at: http://www.fs.usda.gov/goto/DraftForestPlan
1. Management Areas
a. Alternative A – Management Areas, Forestwide b. Alternative A – Management Areas, Gunnison Basin Geographic Area c. Alternative A – Management Areas, Grand Mesa Geographic Area d. Alternative A – Management Areas, Uncompahgre Plateau Geographic Area e. Alternative A – Management Areas, San Juans Geographic Area f. Alternative A – Management Areas, North Fork Valley Geographic Area g. Alternative B – Management Areas, Forestwide h. Alternative B – Management Areas, Gunnison Basin Geographic Area i. Alternative B – Management Areas, Grand Mesa Geographic Area j. Alternative B – Management Areas, Uncompahgre Plateau Geographic Area k. Alternative B – Management Areas, San Juans Geographic Area l. Alternative B – Management Areas, North Fork Valley Geographic Area m. Alternative C – Management Areas, Forestwide n. Alternative C – Management Areas, Gunnison Basin Geographic Area o. Alternative C – Management Areas, Grand Mesa Geographic Area p. Alternative C – Management Areas, Uncompahgre Plateau Geographic Area q. Alternative C – Management Areas, San Juans Geographic Area r. Alternative C – Management Areas, North Fork Valley Geographic Area s. Alternative D – Management Areas, Forestwide t. Alternative D – Management Areas, Gunnison Basin Geographic Area u. Alternative D – Management Areas, Grand Mesa Geographic Area v. Alternative D – Management Areas, Uncompahgre Plateau Geographic Area w. Alternative D – Management Areas, San Juans Geographic Area x. Alternative D – Management Areas, North Fork Valley Geographic Area y. All Alternatives – Designated Wilderness Management Areas, Forestwide
2. Recreation Opportunity Spectrum
a. Existing Condition - Summer Recreation Opportunity Spectrum, Forestwide b. Existing Condition - Summer Recreation Opportunity Spectrum, Gunnison Basin
Geographic Area c. Existing Condition - Summer Recreation Opportunity Spectrum, Grand Mesa
Geographic Area d. Existing Condition - Summer Recreation Opportunity Spectrum, Uncompahgre Plateau
Geographic Area e. Existing Condition - Summer Recreation Opportunity Spectrum, San Juans Geographic
Area f. Existing Condition - Summer Recreation Opportunity Spectrum, North Fork Valley
Geographic Area g. Alternative B - Summer Recreation Opportunity Spectrum, Forestwide h. Alternative B - Summer Recreation Opportunity Spectrum, Gunnison Basin Geographic
Area i. Alternative B - Summer Recreation Opportunity Spectrum, Grand Mesa Geographic
Area
GMUG National Forests Land Management Plan Draft Environmental Impact Statement: Volume 1
xiii
j. Alternative B - Summer Recreation Opportunity Spectrum, Uncompahgre Plateau Geographic Area
k. Alternative B - Summer Recreation Opportunity Spectrum, San Juans Geographic Area l. Alternative B - Summer Recreation Opportunity Spectrum, North Fork Valley
Geographic Area m. Alternative C - Summer Recreation Opportunity Spectrum, Forestwide n. Alternative C - Summer Recreation Opportunity Spectrum, Gunnison Basin Geographic
Area o. Alternative C - Summer Recreation Opportunity Spectrum, Grand Mesa Geographic
Area p. Alternative C - Summer Recreation Opportunity Spectrum, Uncompahgre Plateau
Geographic Area q. Alternative C - Summer Recreation Opportunity Spectrum, San Juans Geographic Area r. Alternative C - Summer Recreation Opportunity Spectrum, North Fork Valley
Geographic Area s. Alternative D - Summer Recreation Opportunity Spectrum, Forestwide t. Alternative D - Summer Recreation Opportunity Spectrum, Gunnison Basin Geographic
Area u. Alternative D - Summer Recreation Opportunity Spectrum, Grand Mesa Geographic
Area v. Alternative D - Summer Recreation Opportunity Spectrum, Uncompahgre Plateau
Geographic Area w. Alternative D - Summer Recreation Opportunity Spectrum, San Juans Geographic Area x. Alternative D - Summer Recreation Opportunity Spectrum, North Fork Valley
Geographic Area y. Existing Condition - Winter Recreation Opportunity Spectrum, Forestwide z. Existing Condition - Winter Recreation Opportunity Spectrum, Gunnison Basin
Geographic Area aa. Existing Condition - Winter Recreation Opportunity Spectrum, Grand Mesa Geographic
Area bb. Existing Condition - Winter Recreation Opportunity Spectrum, Uncompahgre Plateau
Geographic Area cc. Existing Condition - Winter Recreation Opportunity Spectrum, San Juans Geographic
Area dd. Existing Condition - Winter Recreation Opportunity Spectrum, North Fork Valley
Geographic Area ee. Alternative B - Winter Recreation Opportunity Spectrum, Forestwide ff. Alternative B - Winter Recreation Opportunity Spectrum, Gunnison Basin Geographic
Area gg. Alternative B - Winter Recreation Opportunity Spectrum, Grand Mesa Geographic Area hh. Alternative B - Winter Recreation Opportunity Spectrum, Uncompahgre Plateau
Geographic Area ii. Alternative B - Winter Recreation Opportunity Spectrum, San Juans Geographic Area jj. Alternative B - Winter Recreation Opportunity Spectrum, North Fork Valley Geographic
Area kk. Alternative C - Winter Recreation Opportunity Spectrum, Forestwide ll. Alternative C - Winter Recreation Opportunity Spectrum, Gunnison Basin Geographic
Area mm. Alternative C - Winter Recreation Opportunity Spectrum, Grand Mesa Geographic Area nn. Alternative C - Winter Recreation Opportunity Spectrum, Uncompahgre Plateau
Geographic Area

USDA Forest Service
xiv
oo. Alternative C - Winter Recreation Opportunity Spectrum, San Juans Geographic Area pp. Alternative C - Winter Recreation Opportunity Spectrum, North Fork Valley Geographic
Area qq. Alternative D - Winter Recreation Opportunity Spectrum, Forestwide rr. Alternative D - Winter Recreation Opportunity Spectrum, Gunnison Basin Geographic
Area ss. Alternative D - Winter Recreation Opportunity Spectrum, Grand Mesa Geographic Area tt. Alternative D - Winter Recreation Opportunity Spectrum, Uncompahgre Plateau
Geographic Area uu. Alternative D - Winter Recreation Opportunity Spectrum, San Juans Geographic Area vv. Alternative D - Winter Recreation Opportunity Spectrum, North Fork Valley Geographic
Area
3. Scenic Integrity Objectives
a. Existing Scenic Integrity, Forestwide b. Alternative B – Desired Scenic Integrity, Forestwide c. Alternative C – Desired Scenic Integrity, Forestwide d. Alternative D – Desired Scenic Integrity, Forestwide
4. Timber Suitability
a. Alternative A – Timber Suitability, Forestwide b. Alternative A – Timber Suitability, Gunnison Basin Geographic Area c. Alternative A – Timber Suitability, Grand Mesa Geographic Area d. Alternative A – Timber Suitability, Uncompahgre Plateau Geographic Area e. Alternative A – Timber Suitability, San Juans Geographic Area f. Alternative A – Timber Suitability, North Fork Valley Geographic Area g. Alternative B – Timber Suitability, Forestwide h. Alternative B – Timber Suitability, Gunnison Basin Geographic Area i. Alternative B – Timber Suitability, Grand Mesa Geographic Area j. Alternative B – Timber Suitability, Uncompahgre Plateau Geographic Area k. Alternative B – Timber Suitability, San Juans Geographic Area l. Alternative B – Timber Suitability, North Fork Valley Geographic Area m. Alternative C – Timber Suitability, Forestwide n. Alternative C – Timber Suitability, Gunnison Basin Geographic Area o. Alternative C – Timber Suitability, Grand Mesa Geographic Area p. Alternative C – Timber Suitability, Uncompahgre Plateau Geographic Area q. Alternative C – Timber Suitability, San Juans Geographic Area r. Alternative C – Timber Suitability, North Fork Valley Geographic Area s. Alternative D – Timber Suitability, Forestwide t. Alternative D – Timber Suitability, Gunnison Basin Geographic Area u. Alternative D – Timber Suitability, Grand Mesa Geographic Area v. Alternative D – Timber Suitability, Uncompahgre Plateau Geographic Area w. Alternative D – Timber Suitability, San Juans Geographic Area x. Alternative D – Timber Suitability, North Fork Valley Geographic Area

GMUG National Forests Land Management Plan Draft Environmental Impact Statement: Volume 1
1
Chapter 1. Purpose and Need for Action
Introduction The Grand Mesa, Uncompahgre, and Gunnison National Forests (GMUG) revised forest plan is being prepared in accordance with the National Forest Management Act of 1976, the 2012 National Forest System Land Management Planning Rule (hereafter, 2012 Planning Rule), as amended (36 Code of Federal Regulations (CFR) 219; USDA Forest Service 2012a), and other relevant laws and regulations. If approved, the revised forest plan will replace the 1983 GMUG Forest Plan, as amended (USDA Forest Service 1983), providing programmatic direction for managing the GMUG National Forests over the next 15 years. Previous efforts to revise the 1983 GMUG Forest Plan, including an 8-year effort involving extensive public participation and the development of comprehensive assessments, a need for change report, and a proposed plan (USDA Forest Service 2007), were put on hold when the 2008 National Forest System Land Management Planning Rule (USDA Forest Service 2008a) was overturned. Currently, the 2012 Planning Rule provides for the collaborative and science-based development, amendment, and revision of forest plans to guide the management of National Forest System lands so that they are ecologically sustainable while contributing to social and economic sustainability. The 2012 Planning Rule (36 CFR 219.5) requires a planning framework consisting of three phases: (1) assessment, (2) plan revision, and (3) monitoring. The GMUG assessment phase was completed in March 2018. The plan revision phase, including the preparation of an environmental impact statement, was initiated on April 3, 2018. In accordance with the National Environmental Policy Act, this draft environmental impact statement discloses the potential direct, indirect, and cumulative environmental impacts of implementing the draft revised forest plan and alternatives. The analysis is at the plan level and does not predict the effects of individual, site-specific projects or actions. Additional information and documents regarding this proposal are available in the planning record or on the GMUG forest plan revision website.
Planning Area The planning area is the Grand Mesa, Uncompahgre, and Gunnison National Forests, which includes approximately 2,966,200 acres of National Forest System land in Chaffee, Delta, Dolores, Garfield, Gunnison, Hinsdale, Mesa, Mineral, Montrose, Ouray, Pitkin, Saguache, San Juan, and San Miguel Counties of west-central Colorado (figure 1). Approximately 188,200 acres of inholdings of other ownerships occur within the GMUG administrative boundary; however, these lands are not included in the total acreage listed above and are not subject to Forest Service management. The GMUG is managed as one administrative unit of the National Forest System, with the Forest Supervisor Office in Delta, Colorado, and five ranger districts with offices in Grand Junction, Norwood, Montrose, Paonia, and Gunnison, Colorado.

USDA Forest Service
2
Figure 1. Location of Grand Mesa, Uncompahgre, and Gunnison National Forests planning area

GMUG National Forests Land Management Plan Draft Environmental Impact Statement: Volume 1
3
Elevations range from approximately 5,800 feet to over 14,300 feet, with landscapes encompassing broad valleys, rolling foothills, canyons, mesas, and myriad mountains. The complex climate and geology across the plan area result in a wide range of vegetation types. More than 20 major vegetation cover types occur, with numerous inclusions of smaller, rarer plant communities. The lower elevations contain semi-desert grasslands and savannahs. Pinyon-juniper is found at mid-elevations, while higher elevations support montane, subalpine, and alpine types of vegetation. The plan area is further subdivided into five geographic areas based on a combination of landforms, watershed boundaries, and political, social, and administrative boundaries. These geographic areas are the Grand Mesa, Gunnison Basin, North Fork Valley, San Juans, and Uncompahgre Plateau (table 1, figure 2). Geographic areas provide a means for describing conditions and trends of the plan area at a more local scale.
Table 1. Geographic areas of the GMUG National Forests [All acreages are approximate]
Geographic Area Ranger District
National Forest System Lands
(acres)
Other Lands1 (acres)
Percentage of GMUG (National Forest System
lands) Grand Mesa Grand Valley 316,200 4,600 11% Gunnison Basin Gunnison 1,283,500 74,100 43% North Fork Valley
Grand Valley, Paonia 481,500 21,300 16%
San Juans Norwood, Ouray 306,400 51,300 10% Uncompahgre Plateau
Grand Valley, Norwood, Ouray 578,500 36,800 20%
Total 2,966,200 188,400 100%
1 All other lands of various ownership that occur within the GMUG boundary.
Purpose and Need for Action The purpose for revising the 1983 GMUG Forest Plan is to address changed conditions that have occurred since the forest plan was approved, and to provide integrated plan direction for social, economic, and ecological sustainability and multiple uses. The GMUG plan revision team identified preliminary needs for change to the existing plan based on requirements of the 2012 Planning Rule, assessment findings, and public concerns, input, and issues. Scoping for the preliminary needs for change was initiated on April 3, 2018 (see the Public Involvement and Collaboration section for more information). The resulting key issues and needs to address are listed below, organized by theme. Themes represent a combination of requirements of the 2012 Planning Rule and overarching needs for change identified in the assessments.

USDA Forest Service
4
Figure 2. Geographic areas of the GMUG National Forests

GMUG National Forests Land Management Plan Draft Environmental Impact Statement: Volume 1
5
Provide Strategic, Adaptive Direction Key issues and needs to address include:
• Provide more adaptive direction that incorporates current and emerging conservation biology principles. The existing forest plan provides prescriptive, outdated management direction for wildlife, making it difficult to adapt to changes in the latest science and forest conditions.
• Focus on outcomes of vegetation management treatments, not methods to accomplish work, while assessing the short- and long-term impacts to the natural and social environment. Consider updating plan direction to allow more flexibility as new methods and best management practices emerge. The existing forest plan is overly prescriptive regarding harvest methods, utilization standards, and other silvicultural practices. Two specific examples of changes in the draft revised forest plan to allow more flexibility include the increased maximum size for openings in aspen and lodgepole, as well as a lower minimum stocking level for ponderosa and warm-dry mixed conifer.
Contribute to Social and Economic Sustainability Key issues and needs to address include:
• Provide people and communities with a range of social and economic benefits for present and future generations. These benefits include water, timber production, livestock grazing, recreation, energy and mineral resources, and additional multiple uses.
• Consider and integrate recreation within desired conditions and other plan direction. The recreational value and use of the GMUG has increased since the 1983 forest plan was signed.
• Identify triggers or thresholds of impacts to direct camping management tools (designating sites, closing sites, etc.). Increased dispersed camping in “hot spots” in the national forests has resulted in increased use conflicts with adjacent landowners, recreation, and resource impacts.
• Manage more systematically for scenery, including scenic byways and national scenic trails, consistent with current direction and methods. This is closely connected to the quality of recreational experience.
• Across all alternatives, update areas suitable for timber production to better reflect current and potential future methods and technology used to conduct harvest. And, using best available data and science to determine areas conducive to commercial harvest including, but not limited to, soils, productivity, and ability to regenerate. See also chapter 2, Key Issues for Alternatives.
• Identify projected timber and wood sale quantities and planning for new and appropriate uses to improve forest health and safety, given the high mortality of spruce-fir from the spruce beetle epidemic and other changes on the landscape. See also chapter 2, Key Issues for Alternatives.
Provide for Ecological Sustainability Key issues and needs to address include:

USDA Forest Service
6
• Maintain or restore ecological integrity; air, soil, and water; and riparian areas, taking into account stressors such as wildland fire, insects and disease, and changes in climate. Key issues and needs to address include: Provide direction for ecosystem-based management at a landscape scale, and
emphasize maintenance and restoration of ecosystem function and natural processes to improve resiliency.
Consider plan direction that takes into account a changing climate, including adaptive responses to impacts of climate change (such as more frequent and larger disturbance events). Focus on maintaining ecosystem resiliency to continue to provide multiple uses and ecosystem services.
Maintain the Diversity of Plant and Animal Communities Key issues and needs to address include:
• Provide ecological conditions to maintain biodiversity, including additional consideration for threatened and endangered species, species of conservation concern, and species of public interest like big game. Key issues and needs to address include: Provide plan direction to maintain or restore key ecosystem characteristics that
benefit multiple species. Consider species groupings, or guilds, that capture commonalities, and provide direction to protect or conserve the important common components and additional species-specific direction as needed. Provide direction for wildlife habitat connectivity.
Plan for increased trail development that concentrates uses in sustainable settings. Across all alternatives, wildlife management areas are a tool to redirect future trail development to more sustainable settings. See also Key Issues for Alternatives.
Integrate Resource Management for Multiple Uses and Ecosystem Services Key issues and needs to address include:
• Use the recreation opportunity spectrum in each part of the GMUG to identify a desired range of opportunities and to better integrate resource management throughout the year.
Proposed Action The GMUG National Forests propose to revise the 1983 GMUG Forest Plan, as amended (USDA Forest Service 1983), in accordance with the National Forest Management Act of 1976, the 2012 Planning Rule (36 CFR 219), as amended, and other relevant laws and regulations. If approved, the revised forest plan will replace existing direction of the 1983 GMUG Forest Plan, as amended, addressing the identified needs for change (see previous section). The draft revised forest plan provides broad direction and guidance for project and activity implementation in the plan area; it does not make project-level or site-specific decisions. The plan area includes approximately 2.9 million acres of National Forest System land in west-central Colorado (figure 1). A more detailed description of the proposed action is provided in chapter 2 of this document.

GMUG National Forests Land Management Plan Draft Environmental Impact Statement: Volume 1
7
Decision Framework In developing and approving a revised plan, the 2012 Planning Rule (36 CFR 219) requires the responsible official to:
• Ensure that the requirements for public participation are met (219.4). • Document how the best available scientific information was used to inform the planning
process (219.3). • Review relevant information from the assessment and monitoring to identify a
preliminary need to change the existing plan and to inform the development of plan components and other plan content (219.7(c)(2)(i)).
• Consider the goals and objectives of the Forest Service strategic plan when developing plan components (219.7(c)(2)(ii)).
• Identify the presence and consider the importance of various physical, biological, social, cultural, and historic resources in the plan area (219.7(c)(2)(iii)), with respect to the requirements for plan components (219.7 – 219.11).
• Consider conditions, trends, and stressors (36 CFR 219.6), with respect to the requirements for plan components (219.7–219.11).
• Identify an integrated set of plan components to provide for social, economic, and ecological sustainability, diversity of plant and animal communities, multiple uses and ecosystem services, and timber. Required plan components include desired conditions, objectives, standards, guidelines, and suitability of lands for multiple uses (including lands not suitable for timber production). Goals may be included as an optional plan component (219.7–219.11).
• Ensure that the planning process, plan components, and other plan content are within Forest Service authority, the inherent capability of the plan area, and the fiscal capability of the unit (219.1(g)).
• Identify management areas or geographic areas, or both (219.7(d)). • Identify, evaluate, and recommend, as appropriate, any lands that may be suitable for
inclusion in the National Wilderness Preservation System and rivers eligible for inclusion in the National Wild and Scenic Rivers System (219.7(c)(2)(v) and (vi)).
• Identify and recommend designated areas other than wilderness areas and wild and scenic rivers (219.7(c)(2)(vii)).
• Identify the suitability of areas for the appropriate integration of resource management and uses, with respect to the requirements for plan components, including identifying lands not suitable for timber production (219.7(c)(2)(viii) and 219.11).
• Identify the maximum quantity of timber that may be removed from the plan area (219.7(c)(2)(ix) and 219.11(d)(6)).
• Identify a plan monitoring program, including questions and indicators (219.7(c)(2)(x) and 219.12).
In accordance with the 2012 Planning Rule, the revised plan must also:
• Identify watersheds that are a priority for maintenance or restoration (219.7(f)(i)).

USDA Forest Service
8
• Describe the plan area’s distinctive roles and contributions within the broader landscape (219.7(f)(ii)).
• Include the monitoring program required by 219.12 (219.7(f)(iii)). • Provide information on the types of proposed and possible projects or actions that may
occur in the plan area during the life of the plan, including the planned timber sale program, timber harvesting levels, and the proportion of probable methods of forest vegetation management practices expected to be used (219.7(f)(iv)).
• Provide other optional content, such as potential management approaches or strategies and partnership opportunities or coordination activities (219.7(f)(2).
The responsible official for this environmental analysis and the revised forest plan is the forest supervisor. After reviewing the final environmental impact statement, including the alternatives and environmental consequences, the responsible official will issue a draft record of decision identifying a selected alternative, in accordance with Forest Service National Environmental Policy Act procedures (36 CFR 220). The draft record of decision will be subject to the pre-decisional administrative review process (objection process) (36 CFR 219, subpart B). The final record of decision and associated forest plan will provide integrated plan direction for managing the GMUG National Forests for at least the next 15 years. However, project-level environmental analysis will still need to be completed for site-specific proposals to implement the direction in the forest plan. Forest plans do not make budget decisions, and management priorities are determined, in part, by congressional appropriations.
Public Involvement and Collaboration The first forest plan for the GMUG National Forests was developed in 1983 and amended in 1991, 1993, 2005, 2007, and 2009. In the 2000s, the GMUG began revising the 1983 forest plan, directed first by the 2005 National Forest Management Act Planning Rule and subsequently by the 2008 Planning Rule. The Forest Service, via extensive public participation in Landscape Working Groups during 2001–2005, developed comprehensive assessments, a need for change report, and a proposed plan in 2007. This 8-year process was put on hold when the 2005 Planning Rule was overturned. Following the establishment of the 2012 Planning Rule, the GMUG re-initiated the forest plan revision process in 2017. In January 2016, in preparation for the forest plan revision effort, the Colorado Forest Restoration Institute developed a GMUG National Forests Rapid Stakeholder Assessment Report (CFRI 2016). The report assessed local stakeholders’ preferences and perspectives regarding key issues, desired outreach methods and venues, and past experience working with the GMUG. Using this input, the GMUG plan revision team prepared a public participation strategy (USDA Forest Service 2017a) for the plan revision and created a forest plan revision website and mailing list to provide background information, key documents, and ongoing updates to stakeholders. On June 5, 2017, the GMUG published a notice of intent in the Federal Register to initiate the assessment phase of plan revision. The notice of intent invited stakeholders to provide input on existing and changed conditions, and trends and perceptions of social, economic, and ecological systems. In the summer of 2017, the GMUG co-hosted eight public open

GMUG National Forests Land Management Plan Draft Environmental Impact Statement: Volume 1
9
houses with each of the primary counties in the planning area, as well as two live webinars. Approximately 350 people attended the open houses and webinars. Comments from the open houses and webinars, plus more than 100 written comments, were summarized and incorporated as appropriate in the draft assessment reports. The draft assessment reports (19 separate assessment reports by topic) were released in December 2017 for a 30-day comment period, and revised draft assessment reports were published in March 2018. The assessment and public input were used to help identify preliminary needs for changing the existing forest plan, as well as key issues to address. The GMUG initiated the wilderness evaluation and recommendation process in January 2018, in accordance with the requirements of Forest Service Handbook (FSH) 1909.12, chapter 70. Informed by public input and feedback on the draft inventory in January 2018, the GMUG released a revised inventory report on February 20, 2018. Likewise, informed by public comment on the draft evaluation report in August 2018, the GMUG released a revised evaluation report in March 2019. In chapters 2 and 4 of this document, some of these inventoried and evaluated areas are identified and analyzed as recommended wilderness, and the rationale for those areas that were not carried forward for further analysis in an alternative is disclosed (see appendix 6). In February 2019, The GMUG also published a draft wild and scenic river eligibility report for river and stream segments in accordance with the requirements of FSH 1909.12, chapter 80. The revised draft eligibility report is appended to this draft revised forest plan (see appendix 11 of the draft revised forest plan). On April 3, 2018, the GMUG published a notice of intent to revise the forest plan and prepare an environmental impact statement in the Federal Register. The notice of intent initiated a 30-day scoping and comment period (April 3 to May 3, 2018), allowing interested parties to provide comments on the preliminary needs for change, distinctive roles and contributions of the GMUG, and proposed management area framework. Scoping materials, guides, and background information were provided on the forest plan revision website, and two scoping webinars were held in April 2018. On May 4, 2018, a Federal Register notice extended the scoping and comment period by 30 days until June 2, 2018, providing additional time for review and feedback. In June 2019, the GMUG released a full working draft of the forest plan for informal public feedback, and co-hosted with each of the primary counties eight public meetings during the month of July. The GMUG received more than 9,000 written comments (including 500 original letters) during the formal scoping period. The GMUG also conducted subsequent informal feedback periods between scoping and publication of the draft environmental impact statement; a total of 7 informal feedback periods contributed approximately another 1,000 public comments. The interdisciplinary team used the scoping comments and informal feedback from the public, local government, and other agencies to help develop the proposed action and the alternatives analyzed in this draft environmental impact statement. Publication of this draft environmental impact statement, along with the proposed revised forest plan, provides another opportunity for public review and comment.

USDA Forest Service
10
Government Involvement and Related Planning Efforts The 2012 Planning Rule (36 CFR 219.4(b)(1-2)) requires the responsible official to coordinate land management planning with, and review the planning and land use policies of, federally recognized Indian Tribes, other Federal agencies, and State and local governments, where relevant to the plan area. In October 2017, the GMUG advised these entities of the assessment publication while requesting their participation as cooperating agencies once the National Environmental Policy Act process began. In March 2018, the GMUG formally invited pertinent Federal and State agencies, counties, and Tribes to participate in the planning effort as cooperating agencies. The following entities signed memorandums of understanding for cooperating agency status: the eight primary counties, Delta, Gunnison, Mesa, Montrose, Ouray, Saguache, Hinsdale, and San Miguel Counties, as well the town of Crested Butte and the city of Grand Junction. The State of Colorado’s Department of Natural Resource agencies—Colorado Parks and Wildlife and Colorado Water Conservation Board—served as cooperating agencies, as well as the Colorado Department of Agriculture, Bureau of Land Management, U.S. Fish and Wildlife Service, and U.S. Agricultural Research Service. The GMUG met with representatives of these cooperating agencies to coordinate planning efforts, and these discussions will continue throughout the forest plan revision process. The GMUG also reviewed other agency planning documents and efforts within or near the plan area for consistency, including the following:
Federal Land management plans for National Forest System lands within or near the GMUG considered in the draft revised forest plan include the Rio Grande, San Juan, White River, and Pike-San Isabel National Forest plans. Other Federal plans considered include resource management plans for the Gunnison, Uncompahgre, and Grand Junction Field Offices of the Bureau of Land Management, as well as the Dominguez-Escalante National Conservation Area; and the Black Canyon of the Gunnison National Park and Curecanti National Recreation Area units managed by the National Park Service. Furthermore, the GMUG coordinated with the U.S. Fish and Wildlife Service to incorporate into the revised forest plan, where appropriate, conservation and recovery actions for threatened and endangered species in the national forests, and will consult on the effects of the proposed action in accordance with section 7 of the Endangered Species Act.
Tribal The forest supervisor contacted Tribal representatives from the Ute Mountain Ute, the Ute Indian Tribe, and the Southern Ute multiple times during the planning process, prior to and during development of the draft revised forest plan. The Southern Ute Tribe initially responded to set up a meeting for information sharing, but several scheduling attempts on the part of the GMUG and the Tribe did not yield a meeting. The GMUG will continue to contact the Tribes in order to have a robust and meaningful dialogue about the draft revised forest plan.

GMUG National Forests Land Management Plan Draft Environmental Impact Statement: Volume 1
11
State Throughout the assessment phase and the development of the draft revised forest plan, the GMUG communicated with Colorado Parks and Wildlife on a variety of wildlife issues, but coordinated most closely on the development of the wildlife management areas. In addition, the following State plans were considered in the draft revised forest plan: 2020 Forest Action Plan; 2015 State Wildlife Action Plan; 2016–2026 Statewide Trails Strategic Plan; 2019 Statewide Comprehensive Outdoor Recreation Plan; and 2020 Colorado Parks and Wildlife Recommendations for Land Use Development. See appendix 1 for the consistency review.
County and City Starting with initiation of the planning process, the GMUG communicated with local government officials from the counties. In partnership with the primary counties in the planning area, GMUG staff held open house meetings to gather input on conditions, trends, and needs for change (summer 2018) and on the working draft of the forest plan (summer 2019). Throughout the process, Forest Service representatives attended county meetings to provide updates and answer questions, including several multi-county meetings to present information about the forest plan process. With assistance from the cooperating agency counties, the GMUG considered and evaluated county plans for consistency during the planning process for the following counties: Delta, Gunnison, Hinsdale, Mesa, Montrose, Ouray, San Miguel, and Saguache. See appendix 1 for the consistency review.
Council on Environmental Quality Regulations This environmental analysis is conducted according to the 1978 Council on Environmental Quality regulations for implementing the procedural provisions of the National Environmental Policy Act (40 CFR 1500-1508, as amended). The Council on Environmental Quality issued revised regulations for implementing the procedural provisions of the National Environmental Policy Act, effective September 14, 2020. The revised regulations provide the responsible official the option of conducting an environmental analysis under the 1978 regulations if the process was initiated prior to September 14, 2020 (40 CFR 1506.13, 85 FR 137, p. 43373, July 16, 2020).

USDA Forest Service
12
Chapter 2. Alternatives
Introduction This chapter describes and compares the alternatives considered by the responsible official for the draft revised forest plan. It includes a discussion of how the alternatives were developed, issues raised, descriptions and comparisons of the alternatives, and alternatives that were not considered in detail.
Alternative Development As discussed in chapter 1, this forest plan revision effort is based on the requirements of the 2012 Planning Rule, findings of the forest assessment, changes in conditions since the 1983 forest plan, and public comments. A list of significant issues was identified from the public comments, and some of these issues drove the development of alternatives. All reasonable alternatives to the proposed action must meet the purpose and need for change and address one or more of the significant issues. Not all possible alternatives were carried into detailed study because the list of options would have been prohibitively large. Instead, the responsible official identified those alternatives that met the criteria and created a reasonable range of direction, allocations, management requirements, outputs, and effects from which to choose. Revised plan alternatives represent a range of possible management options. Information presented here and in chapter 3 provide the basis from which to evaluate the comparative merits of the alternatives. Each alternative emphasizes specific land allocations and resource uses and deemphasizes other allocations and uses in response to the significant issues. Alternative A (often referred to as the current plan in this document) is the no-action alternative, which reflects the 1983 forest plan, as amended to date, and accounts for current laws, regulations, and terms and conditions from biological opinions. Alternative B was released for public feedback as the working draft revised forest plan, and it was subsequently updated in response to public feedback and internal Forest Service review. Development of alternatives C and D was driven by issues identified during the scoping period and during feedback on the working draft revised forest plan. Alternative C can be broadly described as the “active management emphasis” alternative, with fewer special area allocations, more active vegetation and fuels management, less restrictive recreation use management, more motorized settings, and more areas allocated as suitable for timber production. Alternative D can be broadly described as the “special area emphasis” alternative, with more special area allocations, a smaller vegetation and fuels management program, more active and restrictive recreation use management, more non-motorized settings, and fewer areas allocated as suitable for timber production.

GMUG National Forests Land Management Plan Draft Environmental Impact Statement: Volume 1
13
Issues From 2017 through 2019, the GMUG plan revision team provided seven public comment and/or feedback periods and received more than 10,000 public comments. The following items emerged as the key issues that drove the development of alternatives:
Issue 1. Extent of Potential Additional Wilderness / Wilderness Areas to be Analyzed Public input indicated a range of desired additional wilderness. Perspectives vary from believing that existing designated areas are adequate or more than enough; other perspectives are that nearly all areas evaluated should be recommended for designation.
Issue 2. Amount of Active Vegetation Management This issue is primarily addressed by the extent of suitable timber acreage, the amount of planned timber production, and the amount of planned fuels treatments. The range of alternatives is intended to address widely varying public perspectives on the role of active vegetation management to achieve desired social, economic, and ecological conditions, including those related to forest health, wildlife habitat, fuels in the wildland-urban interface, and scenery. Some public comments advocated for no salvage harvest, so this is captured within alternative D as well.
Issue 3. Balance between Increased Recreation and Existing Wildlife Habitat and Backcountry Hunting Opportunities Some public and cooperating agency input reflected a desire to maintain relatively unfragmented big game habitat and associated hunting opportunities. Other commenters wanted more developed recreation across the landscape; they indicated that wildlife habitat should be managed alongside such increasing recreation. This issue is primarily addressed via the amount of land in wildlife management areas in each alternative. Plan direction for these areas is to maintain existing, relatively unfragmented big game habitat, and other wildlife habitat, in the context of increasing pressure from recreation trail development. Conversely, areas not identified as Wildlife Management Areas would be the starting point for future new trails.
Issue 4. Balance between More Restrictive and Less Restrictive Recreation Use Management This issue is primarily addressed by different recreation management objectives, whether within designated and recommended wilderness, recreation emphasis areas, or Forestwide. For example, for the recreation objective MA-OBJ-REC-02, the objective is to eliminate existing unauthorized motorized use in semi-primitive recreation opportunity spectrum areas. Within alternatives B and C, the target would be to complete five actions per decade to meet this objective. Within alternative D, that number would increase four-fold to 20, representing a much more expansive and active management approach to maintaining semi-primitive settings. For other objectives, the issue is addressed by accelerating how quickly the objective is achieved.

USDA Forest Service
14
Issue 5. Balance between Motorized and Non-motorized Recreation This issue is primarily addressed via the recreation opportunity spectrum to provide a range of desired future settings for both motorized and non-motorized recreation. Public comments reflect a range of opinions, with some advocating for more or continued motorized access, and others advocating for more non-motorized areas. While the forest plan does not address travel management, the type of planning that would designated areas or routes open or closed and for the types of travel, the forest plan recreation opportunity spectrum maps will set the stage for future project-level travel planning. See also Issues and Concerns that are Outside the Scope of the Decision to be Made.
Issue 6. Balance between Increased Development and More Apparently Natural Settings The variation in mapped scenic integrity objectives in the GMUG contributes to addressing this issue, ranging from more areas with higher scenery requirements to more areas of maintained / relatively lower scenery requirements. This issue is also addressed across the action alternatives by the variety of tools mentioned above (recommended wilderness, suitable timber, recreation opportunity spectrum, etc.). This issue is even carried into the recreation opportunity spectrum for recommended wilderness areas, as commenters requested that recommended wilderness be primitive recreation opportunity spectrum, despite the influence of adjacent highways and other motorized routes.
Issue 7. Citizen Proposals for Special Management Areas with Preservation and/or Recreation Emphases The GMUG has received four separate—but largely consistent—citizen proposals, including the Gunnison Public Lands Initiative proposal for areas of Gunnison County; the San Juan Wilderness Proposal for areas of San Miguel and Ouray Counties; and the Community Conservation Proposal and Outdoor Alliance proposals, both of which extend across much of the GMUG. The Gunnison Public Lands Initiative was submitted by Gunnison County, a cooperating agency for the forest plan revision. Likewise, the San Juan Wilderness Proposal was submitted by San Miguel County, which is also a cooperating agency for the forest plan revision. While the specifics of the proposals vary, each proposal supports both more wilderness and a variety of additional management areas. Each proposed area would generally restrict some types of active management and/or recreation. Some proposed areas would emphasize recreation. These proposals are primarily addressed via the category of Special Management Area / MA 3.3 that is unique to alternative D, but in other alternatives they have also been addressed via other types of overlapping management area categories and management direction, including recreation settings (recreation opportunity spectrum), scenic integrity objectives, wildlife management areas, research natural areas, special interest areas, the conservation watershed network, and eligible wild and scenic rivers.

GMUG National Forests Land Management Plan Draft Environmental Impact Statement: Volume 1
15
Issue 8. Modifications to Management Areas
Mountain Resorts – Snodgrass (1,460 acres) Dating back to 2011, the forest supervisor of the GMUG determined that in the forest plan revision that was pending at that time, that Snodgrass would be removed from the Ski Area Management Area and returned to the General Forest Management Area. Due to landslide-prone soils and avalanche hazards, multiple geotechnical studies completed during the 1990s and 2000s had determined the area to be unsuitable for development that is associated with a ski area. Over the past three decades, development of the area has also been controversial in local communities. In alternatives B and D, Snodgrass is changed to General Forest (MA 5); in alternative C it is retained as the Mountain Resort Management Area (MA 4.2).
Battlements Research Natural Area (10,240 acres) In the 2007 proposed plan, the Battlements Research Natural Area was proposed to provide recognition of and protection for this relatively intact pinyon-juniper ecosystem. For the current planning effort, the plan revision team reviewed the available literature and existing uses and determined the area still may warrant research natural area status. As well, multiple federally listed plant species and regional forester’s plant species of conservation concern also occur in the area. Given the lack of uses on the landscape, the no-action alternative may also naturally protect the ecosystem, so alternatives B and C reflect no change in management direction for the area. The potential research natural area is considered within alternative D, which would be consistent with the adjacent White River National Forest’s management of the area.
Special Interest Areas Within alternatives B and D, the approximately 14,500-acre Gunnison Research Special Interest Area is proposed to call special attention to the extensive, experimental ecological research conducted by the Rocky Mountain Biological Laboratory near the historic mountain town of Gothic. Within alternative D, the plan revision team also brought forward one of the few special interest areas proposed in the 2007 plan, the approximately 500-acre Taylor-Willard Special Interest Area, to call special attention to botanical values in the area. The proposed Taylor-Willard Special Interest Area is located approximately 12 miles south of Aspen, on the border between the White River and Gunnison National Forests. The area located on the White River National Forest is currently being managed as a special interest area with an emphasis on sensitive and endangered plant species. Most of the area is above timberline with elevations ranging from 11,200 to 12,300 feet. The area is significant for the number of identified rare high-alpine plants that occur there.
Issues that Did Not Contribute to the Development of Alternatives Additional issues were raised both internally and by the public. In many cases, draft plan direction was developed in response to internal and external comments and is included in each of the action alternatives: B, C, and D.

USDA Forest Service
16
These issues include but are not limited to:
• air quality • soils • water supply and quality • riparian areas and fisheries • spread and control of invasive plants (weeds and aquatic invasive species) • role of fire management, including fire suppression, identification of high value
resources, and wildland-urban interface considerations • natural range of variation of vegetation conditions • specific vegetation components (such as old growth, snags, and large trees) • carbon storage • at-risk plant and animal species (federally listed threatened, endangered, proposed, and
candidate species, and species of conservation concern) • wildlife species diversity and viability of species; route density standard in wildlife
management areas • areas of Tribal interest • cultural and historical resources • livestock grazing • infrastructure (such as roads, trails, facilities, and dams) • recreation special uses, outfitter guides, most permitted recreation facilities and uses
(such as organizational camps, events, group use), existing developed and dispersed recreation
• congressionally and administratively designated areas – existing wilderness; Tabeguache; Roubideau; Fossil Ridge Special Recreation Area; Colorado roadless areas (52 percent of the GMUG)
• access and land status.
Alternatives The alternatives span a range of forest management practices and uses of available resources. The general theme and intent of each alternative is summarized below, in relationship to the issues that drove alternatives. A limited number of plan components vary by alternative.
Elements Common to All Alternatives All alternatives adhere to the principles of multiple use and the sustained yield of goods and services required by the Code of Federal Regulations (36 CFR 219.1 (b)). All alternatives are designed to:
• meet law, regulation, and policy, • contribute to ecological, social, and economic sustainability, • provide sustainable levels of products and services,
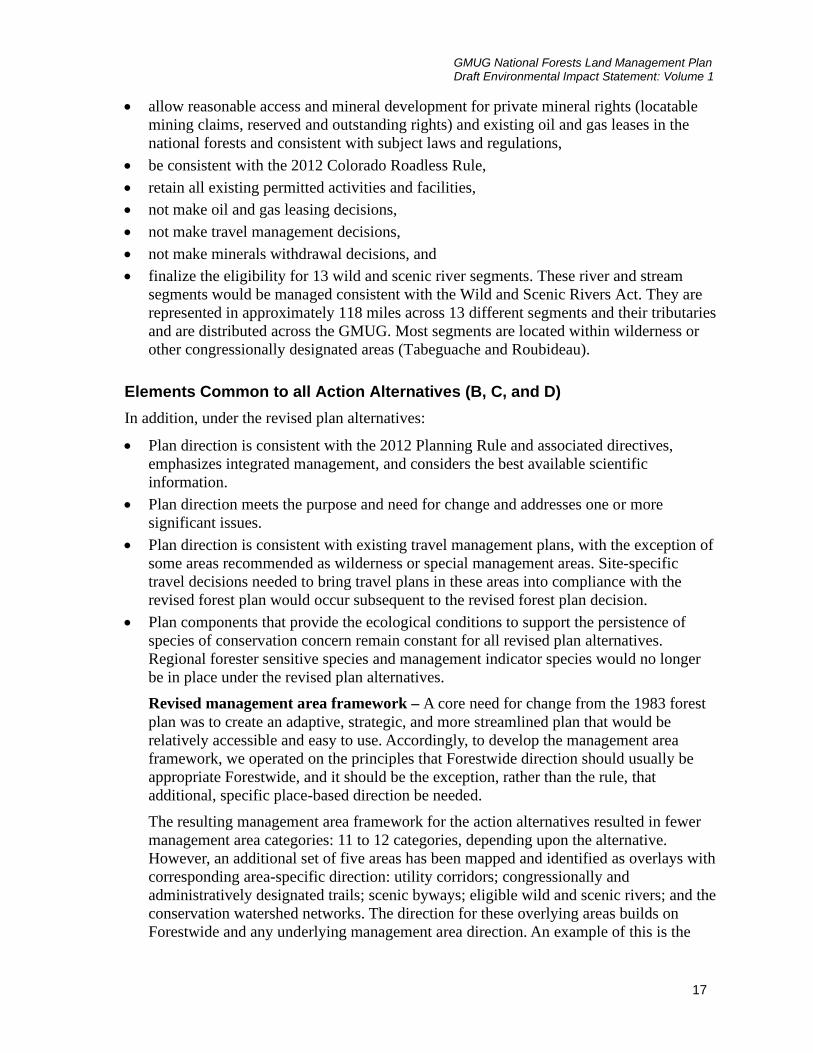
GMUG National Forests Land Management Plan Draft Environmental Impact Statement: Volume 1
17
• allow reasonable access and mineral development for private mineral rights (locatable mining claims, reserved and outstanding rights) and existing oil and gas leases in the national forests and consistent with subject laws and regulations,
• be consistent with the 2012 Colorado Roadless Rule, • retain all existing permitted activities and facilities, • not make oil and gas leasing decisions, • not make travel management decisions, • not make minerals withdrawal decisions, and • finalize the eligibility for 13 wild and scenic river segments. These river and stream
segments would be managed consistent with the Wild and Scenic Rivers Act. They are represented in approximately 118 miles across 13 different segments and their tributaries and are distributed across the GMUG. Most segments are located within wilderness or other congressionally designated areas (Tabeguache and Roubideau).
Elements Common to all Action Alternatives (B, C, and D) In addition, under the revised plan alternatives:
• Plan direction is consistent with the 2012 Planning Rule and associated directives, emphasizes integrated management, and considers the best available scientific information.
• Plan direction meets the purpose and need for change and addresses one or more significant issues.
• Plan direction is consistent with existing travel management plans, with the exception of some areas recommended as wilderness or special management areas. Site-specific travel decisions needed to bring travel plans in these areas into compliance with the revised forest plan would occur subsequent to the revised forest plan decision.
• Plan components that provide the ecological conditions to support the persistence of species of conservation concern remain constant for all revised plan alternatives. Regional forester sensitive species and management indicator species would no longer be in place under the revised plan alternatives. Revised management area framework – A core need for change from the 1983 forest plan was to create an adaptive, strategic, and more streamlined plan that would be relatively accessible and easy to use. Accordingly, to develop the management area framework, we operated on the principles that Forestwide direction should usually be appropriate Forestwide, and it should be the exception, rather than the rule, that additional, specific place-based direction be needed. The resulting management area framework for the action alternatives resulted in fewer management area categories: 11 to 12 categories, depending upon the alternative. However, an additional set of five areas has been mapped and identified as overlays with corresponding area-specific direction: utility corridors; congressionally and administratively designated trails; scenic byways; eligible wild and scenic rivers; and the conservation watershed networks. The direction for these overlying areas builds on Forestwide and any underlying management area direction. An example of this is the

USDA Forest Service
18
congressionally and administratively designated trails overlay, which includes the Continental Divide National Scenic Trail. While direction for the Continental Divide National Scenic Trail would apply along the entirety of the trail in the GMUG, how the corridor is managed would be determined by the underlying management area direction, which adjusts as this trail traverses through several management areas, including Designated Wilderness (MA 1.1), Colorado Roadless Areas (MA 3.1), Mountain Resorts (MA 4.1), and General Forest (MA 5).
• Major spatial components that do not vary by action alternative: Although the spatial extent of these areas does not vary by action alternative, the management framework for each area does vary by action alternative due to interactions with suitable timber (area is included or excluded), varying scenic integrity objectives, and varying recreation opportunity settings (recreation opportunity spectrum).
o Congressionally and Administratively Designated Trails – the Continental Divide National Scenic Trail and Old Spanish National Historic Trail, and the administratively designated trails Crags Crest and Bear Creek National Recreation Trails. Each trail is mapped to include the foreground viewshed (about one-half mile from either side of the trail tread). In the draft revised forest plan, designated trails encompass a mapped area of approximately 77,600 acres (2.5 percent of the GMUG) that overlie multiple other management areas. The forest plan also includes integrated direction for the Continental Divide National Scenic Trail and Old Spanish National Historic Trail to provide for the nature and purposes for which they were established.
o Recreation Emphasis Corridors represent a “snapshot” of areas of the national forests that are located along travelways and which currently experience extremely frequent, season-long dispersed camping and other recreational use; this category is not intended to include all popular recreational areas in the national forests. These corridors encompass approximately 1 percent of the GMUG. (Note that a small fraction (7 percent) of these corridors is replaced by special management areas in alternative D, but management would be similar. For this reason, this management area is identified as one that does not vary by alternative, as the difference is slight and is not driven by a key issue).
o Conservation Watershed Networks are mapped as an overlying area to highlight the conservation status of the boreal toad and the green-lineage Colorado River cutthroat trout. Additional management measures and restoration actions would be applied in these areas.
o Utility corridors encompass a mapped area of about 47,800 acres (1.5 percent of the GMUG) that overlie multiple other management areas. Utility corridors encompass both designated West-wide energy corridors and other local, non-West-wide energy corridors.
• Expanded and updated suitable timber. In general, approximately twice as much acreage is identified as “may be suitable” in step 1 of the suitability process. This

GMUG National Forests Land Management Plan Draft Environmental Impact Statement: Volume 1
19
occurred for two reasons: 1) unlike the 1982 Planning Rule, the 2012 Planning Rule does not require exclusions based on economic feasibility; and 2) the plan revision team took a more inclusive approach to account for relatively outdated, error-prone timber and other spatial data. From the “may be suitable” starting point, for each action alternative, select management areas were then excluded in accordance with the theme of the alternative for step 2 of the suitability process.
Alternative A – No-Action Alternative (the Current Plan) Alternative A, the no-action alternative, is also referred to as the current plan throughout this document. The current plan was written in 1983, with a subsequent major timber amendment completed in 1991. With respect to management areas, it assigns the 2.9 million acres of National Forest System lands into one of 20 management areas. Subsequently designated Colorado roadless areas also overlap several of the management areas in the 1983 plan. Under this alternative, the current management plan would continue to guide management of the national forest. Changes as a result of laws and regulations that have been adopted since the 1983 plan, such as the designation of Colorado roadless areas, are necessarily included as part of the no-action alternative and are part of the environmental baseline. With respect to the identified issues, the alternative is described as follows: Issue 1: There would be no recommended wilderness areas. Areas that are recommended in
alternatives B and D would, in the no-action alternative, continue to be managed consistent with the Colorado Roadless Rule. Existing designated wilderness amounts to 553,000 acres.
Issue 2: The suitable timber area is from the 1991 GMUG plan, as amended, minus the subsequent Colorado roadless areas and additional subsequently designated wilderness (Colorado Wilderness Act of 1993), which amounts to 550,000 acres. This is approximately 18 percent of the GMUG. A projected 35,900 CCF would be produced for the first 5 years. For years 6 through 20, a projected 32,100 CCF would be produced. Fuels treatments would total 90,500 acres per decade.
Issue 3: There are no additional provisions for wildlife habitat or for wildlife management areas. Management Area 4B, Wildlife Habitat Management for One or More Management Indicator Species, would continue to have some emphasis on the management indicator species. As well, Management Areas 5A and 5B would be emphasized for big game winter range. Areas of less human disturbance would generally be provided by designated wilderness areas and more remote areas within designated Colorado roadless areas.
Issue 4: There are no objectives for recreation in the current plan that are comparable to those proposed in the draft revised forest plan. However, a number of standards require closure of dispersed camping sites once impacts reach a certain threshold; by contrast, the draft revised forest plan proposes a broader suite of tools be applied than just closure.
Issue 5: Motorized and non-motorized recreation settings would continue to be managed as they are today, consistent with the pertinent motorized or winter travel management plan. Where there is no established travel management plan, such as a winter travel

USDA Forest Service
20
management plan in portions of the Gunnison Basin, outside of wilderness the settings would be driven largely by snow conditions and recreationists’ access and ability.
Issue 6: Scenery would continue to be managed with the Visual Resource Management system, with different areas assigned different levels of scenery resource protection. Forestwide, the majority (60 percent) would be managed at the modification or lower level, which equates to a moderate or lower scenic integrity objective.
Issue 7: There are no special management areas. The areas identified in alternative D would, under the current plan, continue to be managed largely as General Forest and designated Colorado Roadless Management Areas.
Issue 8: With respect to modifications to management areas, there would be no additional research natural areas or special interest areas. In Crested Butte, Snodgrass would remain within the Ski Area Management Area. The Continental Divide National Scenic Trail, Old Spanish National Historic Trail, and other national recreation trails in the GMUG would continue to be managed in accordance with their enabling legislation and agency policy.
Alternative B – Blended Alternative Alternative B is the blended alternative. It is based on the working draft revised forest plan that was published for public feedback in June 2019, with modifications in response to feedback and internal Forest Service review. It is the result of public engagement efforts since 2017 and represents a balance between general active management and more restrictive management; both of these approaches maintain and enhance key values. For example, while 36 percent of the GMUG is identified as General Forest (MA 5) in alternative B, 25 percent of the GMUG is identified as a Wildlife Management Area (MA 3.2) to maintain existing backcountry character and big game habitat in the context of increasing recreation trail development. Wildlife management areas have served as a cornerstone of our work with Colorado Parks and Wildlife to maintain wildlife connectivity. With respect to the identified issues, the alternative is described as follows: Issue 1: An additional 34,000 acres would be managed as recommended wilderness adjacent
to the existing designated Sneffels, Lizard Head, West Elk, and Raggeds Wilderness areas. This represents approximately 1 percent of the GMUG. The total areas managed as wilderness would amount to 587,000 acres, or 20 percent of the GMUG.
Issue 2: A total of approximately 948,200 acres (32 percent of the GMUG) would be suitable for timber production, and a projected 55,000 CCF of timber would be produced annually. All lands that were not withdrawn from timber suitability due to legal or technical factors (for example, designated wilderness) would be suitable for timber production except for research natural areas, special interest areas, recommended wilderness areas, eligible wild and scenic rivers that are classified as wild, mountain resorts, and recreation emphasis areas. When consistent with other plan components, harvest for purposes other than timber production could occur on other lands designated as not suitable for production. About 93 percent of the suitable timber acreage is on slopes of 40 percent or less, but about 6 percent (60,000 acres) is on slopes of 40 to 60 percent, and 1 percent (11,500 acres) is on slopes greater than 60 percent. Fuels

GMUG National Forests Land Management Plan Draft Environmental Impact Statement: Volume 1
21
treatments would total 110,000 acres in the first decade and 150,000 acres in the second decade.
Issue 3: 740,000 acres would be managed as wildlife management areas to limit trail density in these areas.
Issue 4: Recreation objectives would be achieved at a moderate pace to try to achieve a balanced, measured approach. Details for the associated objectives are contained in table 4. An adaptive management approach is also proposed for managing both dispersed day and overnight use. This approach is detailed in the Forestwide draft plan components for recreation.
Issue 5: For summer recreation settings, the balance between motorized and non-motorized and the level of development would remain largely the same as it exists today. Slight corrections were made that result in 1 percent differences between the summer recreation settings, though semi-primitive non-motorized areas would increase by 2 percent. For winter recreation settings, there would be an increase in semi-primitive non-motorized settings from 18 to 26 percent, and a corresponding decline in semi-primitive motorized settings from 51 to 43 percent. These adjustments are largely in the southern and eastern portions of the Gunnison Basin.
Issue 6: A majority (58 percent) of the GMUG would be managed at a high or very high scenic integrity objective in alternative B. Twenty-seven percent would be managed for moderate scenic integrity, and only 14 percent would be managed for low scenic integrity.
Issue 7: There would be no special management areas. In this alternative, areas identified as special management areas in alternative D would instead be managed largely as General Forest and designated Colorado Roadless Management Areas.
Issue 8: With respect to management area modifications, an additional 15,000 acres of the GMUG would be managed as the Gunnison Research Special Interest Area to emphasize ecological research conducted by the Rocky Mountain Biological Laboratory. The Snodgrass unit of Crested Butte Mountain Resort would become General Forest Management Area. The Continental Divide National Scenic Trail, Old Spanish National Historic Trail, and other national recreation trails in the GMUG would be managed with a cohesive set of plan direction within mapped management corridors.
Alternative C – Active Management Emphasis Alternative C is the active management emphasis alternative. Alternative C represents the greatest amount of area within the General Forest Management Area category (46 percent of the GMUG), which would provide the most management flexibility for ongoing and future multiple uses in the GMUG. A relatively small amount of the GMUG would be in discretionary management area categories: there is no additional recommended wilderness and only three wildlife management areas (1 percent of the GMUG). While recreation emphasis corridors are retained in alternative C, they are identified as suitable for timber production. More area is identified as a desired motorized setting for both summer and winter. This alternative is projected to generate the same amount of planned timber as alternative B, but this would be distributed across a larger area suitable for timber production.

USDA Forest Service
22
With respect to the identified issues, the alternative is described as follows: Issue 1: There would be no recommended wilderness, the same as the no-action alternative.
The amount of existing 550,000 acres (19 percent of the GMUG) of existing designated wilderness would not change.
Issue 2: A total of approximately 974,900 acres (33 percent of the GMUG) would be suitable for timber production, and a projected 55,000 CCF of timber would be produced annually. The suitable area is the same as that for alternative B, but it includes recreation emphasis areas. About 93 percent of the suitable timber acreage is on slopes of 40 percent or less, but about 6 percent (60,000 acres) is on slopes of 40 to 60 percent, and 1 percent (11,500 acres) is on slopes greater than 60 percent. When consistent with other plan components, harvest for purposes other than timber production could occur on other lands not suitable for production. Fuels treatments would total 130,000 acres per decade.
Issue 3: 36,000 acres would be managed as wildlife management areas to limit trail density in these areas.
Issue 4: Recreation objectives would be achieved the same way as in alternative B. Details for the associated objectives are contained in table 4. An adaptive management approach is also proposed for managing both dispersed day and overnight use.
Issue 5: For summer recreation settings, more area would be managed as semi-primitive motorized and roaded natural in this alternative than the other alternatives. Thirty-two percent of the GMUG would be managed as semi-primitive motorized (compared to 26 percent in the no-action alternative), and 20 percent would be managed as roaded natural (compared to 14 percent in the no-action alternative). Relatively less area would be managed as semi-primitive non-motorized with 37 percent of the GMUG in this category (compared to 48 percent in the no-action alternative). For winter recreation settings, likewise more area would be managed as semi-primitive motorized – 56 percent of the GMUG, compared to 51 percent in the no-action alternative.
Issue 6: Compared to alternative B, 20 percent more area in alternative C would be managed for moderate scenic integrity objectives as opposed to high scenic integrity objectives. More than half (51 percent) would be managed for moderate scenic integrity objectives, while 11 percent would be high, and 18 percent would be low. This is the most comparable to the no-action alternative, as it most resembles the current plan management.
Issue 7: There would be no special management areas. These areas would be managed largely as General Forest and designated Colorado Roadless Management Areas.
Issue 8: With respect to management area additions and modifications, there would be no additional special interest areas or research natural areas. The Snodgrass unit of Crested Butte Mountain Resort would continue to be managed as a Mountain Resort/Ski Management Area. The Continental Divide National Scenic Trail, Old Spanish National Historic Trail, and other national recreation trails in the GMUG would be managed with a cohesive set of plan directions within mapped management corridors.
Alternative D – Special Area Emphasis Alternative D is the special area emphasis alternative, which proposes the most recommended wilderness (9 percent). These new recommended wilderness areas and special

GMUG National Forests Land Management Plan Draft Environmental Impact Statement: Volume 1
23
management areas (category MA 3.3) reflect portions of the five proposals submitted by citizen coalitions. Special management areas are excluded from timber production and are generally identified for more semi-primitive, often non-motorized recreation. Special management areas also contain a variety of recreation and travel-related direction. These include 1) over-snow vehicle suitability; 2) motorized suitability; and 3) mechanized suitability. The suitability also identifies whether the areas are suitable for additional trail development. In contrast to alternative B, there are fewer acres in wildlife management areas (20 percent of the GMUG) because in the Gunnison Basin, some of these wildlife management areas are replaced by wilderness areas to be analyzed or a special management area in alternative D. The draft environmental impact statement analyzes the trade-offs between the areas that are more recreation development-oriented in alternative D (due to their special management area prescriptions) than alternative B’s wildlife management areas. With respect to the identified issues, the alternative is described as follows: Issue 1: There would be 261,000 acres of recommended wilderness (9 percent of the
GMUG). Combined with existing designated wilderness, this would amount to a total of 814,000 acres, or 27 percent of the GMUG.
Issue 2: A total of approximately 757,800 acres (26 percent of the GMUG) would be suitable for timber production, and a projected 30,000 CCF of timber would be produced annually. The suitable area is similar to that in alternative B, but it additionally excludes scenic byways, designated trails, special management areas, all classifications of eligible wild and scenic river segments, and areas with a slope greater than 40 percent. No commercial harvest outside of the areas suitable for timber production would be conducted. Furthermore, salvage harvest would not be conducted. Fuels treatments would total 50,000 acres per decade.
Issue 3: 621,000 acres (21 percent of the GMUG) would be managed as wildlife management areas to limit trail density in these areas.
Issue 4: Recreation objectives would be accelerated and increased. Details for the associated objectives are contained in table 4. An adaptive management approach is also proposed for managing both dispersed day and overnight use.
Issue 5: For summer recreation settings, corresponding with the increased acreage in recommended wilderness, areas managed with a primitive recreation setting in this alternative increase from 12 to 27 percent of the GMUG. Area managed as semi-primitive non-motorized decreases from 48 to 32 percent, as that area would instead be managed as a primitive (recommended wilderness) setting. The area managed with a semi-primitive motorized setting would decrease from 26 to 23 percent of the GMUG. For winter recreation settings, more area would likewise be managed with a primitive recreation setting (27 percent, compared to 16 percent in the no-action alternative). The area managed as semi-primitive non-motorized would more than double to 39 percent, as compared to 18 percent in the no-action alternative. The area managed as semi-primitive non-motorized would accordingly more than halve down to 20 percent (as compared to 51 percent in the no-action alternative).
USDA Forest Service
24
Issue 6: As much as 70 percent of the GMUG would be managed as high or very high scenic integrity in alternative D, which is more than double the area proposed in alternative C. Twenty-four percent would be managed as moderate, and 6 percent as low.
Issue 7: 246,000 acres would be managed as special management areas, distributed widely across the Gunnison Basin and the San Juans.
Issue 8: With respect to management area additions and modifications, an additional 2,000 acres of the GMUG would be managed as the Gunnison Research Special Interest Area to emphasize ecological research conducted by the Rocky Mountain Biological Laboratory, as well as the Taylor-Willard Special Interest Area to increase management consistency with the adjacent White River National Forest. 11,000 acres would be managed as the Battlements Research Natural Area on the north end of the Grand Mesa. As in alternative B, the Snodgrass unit of the Crested Butte Mountain Resort would become General Forest Management Area. The Continental Divide National Scenic Trail, Old Spanish National Historic Trail, and other national recreation trails in the GMUG would be managed with a cohesive set of plan directions within mapped management corridors. However, the trail corridors would not be included within areas suitable for timber production.
Alternatives Considered but Not Studied in Detail The Council on Environmental Quality requires Federal agencies to briefly discuss the reasons for eliminating any alternatives that were not developed in detail (40 CFR 1502.14 (a). Public comments received during scoping provided suggestions for alternative methods for achieving the purpose and need for action. Some of these alternatives were outside the scope of the purpose and need for action, duplicative of the alternatives considered in detail, or determined to be components that would cause unnecessary harm. The alternatives provided by the public (in bold) and the subsequent agency rationale as to why they were not given further detailed study are described below.
Additional Management Area Categories Public feedback requested that all designated critical habitat should be designated as distinct management areas in the revised plan with specific prescriptions such as regulatory standards and plan components aimed at providing special protection for these areas and restoring degraded habitat. Rather than carve out distinct management areas for federally listed species, whose critical habitat is determined by the U.S. Fish and Wildlife Service and may change over time, plan components for threatened and endangered species are included as Forestwide direction, applied where the critical habitat and/or species occurs. Public feedback also requested the Continental Divide National Scenic Trail be identified as a management area. Because it intersects so many management areas, for ease of mapping, the Continental Divide National Scenic Trail is identified as a corridor. There is no functional difference between the implementation of the two different mapping terms.
Additional Suitability Analyses Public feedback requested that the GMUG conduct additional Forestwide suitability analyses for grazing; for over-snow travel; for land exchange and/or acquisition; and for

GMUG National Forests Land Management Plan Draft Environmental Impact Statement: Volume 1
25
mineral development, including oil and gas leasing. The 2012 Planning Rule only requires determination of timber suitability. For a more efficient planning approach, the GMUG opted to complete the minimum requirement. One exception to the above is represented in alternative D by the portion of the GMUG in special management areas. To best capture the citizen proposals for these areas, additional suitability direction is included: 1) over-snow vehicle suitability; 2) motorized (terra trails) suitability; and 3) mechanized suitability. The suitability also identifies whether the areas are suitable for additional (new) trail development. For mineral development, see section Issues and Concerns that are Outside the Scope of the Decision to be Made.
Climate Change Through feedback, the public requested an alternative that would maximize carbon sequestration. The long-term net effects of active vegetation management on forest carbon is currently debated in the best available science: some indicate net sink, net loss, or neutral. Avoiding forest conversion to non-forest and ensuring restocking after disturbance are the two known ways to maintain forest carbon. Given the scientific uncertainty, this alternative is not carried forward for detailed analysis. Rather, the draft plan focuses on ecosystem resilience, using both active management and area prescriptions, in the context of a changing climate.
Bighorn Sheep and Livestock Grazing Public feedback requested an alternative that would provide full separation of domestic and bighorn sheep within a specified timeframe. The agency’s national policy, however, is to provide for effective separation, and this is reflected in the draft revised forest plan and alternatives.
Recommended Wilderness and Other Special Area Categories, and Recreation Opportunity Spectrum Settings Through feedback, the public requested that areas in the GMUG wilderness evaluation with ratings of "moderate" or "high" retain the most primitive summer and winter recreation opportunity spectrum possible and/or no more developed setting than semi-primitive non-motorized. Feedback also requested that special management areas in the proposed congressional legislation “CORE Act” have primitive recreation opportunity spectrum, or be no more developed than semi-primitive non-motorized recreation opportunity spectrum, at minimum. Other citizen proposals identified semi-primitive non-motorized recreation opportunity spectrum for other special management areas in both summer and winter. Generally, areas are not assigned a primitive setting unless they are 3 miles from a motorized route, so the use of primitive settings is largely limited to designated wilderness. Similarly, semi-primitive non-motorized settings are not assigned unless the area is truly non-motorized. Nonetheless, there is a fairly broad range of recreation opportunity spectrum settings identified for both summer and winter, across the alternatives, corresponding to recommended wilderness areas, special management areas that were endorsed by the

USDA Forest Service
26
respective counties, wildlife management areas, and other area-specific considerations. See the section Comparison of Alternatives for more detailed comparisons of recreation opportunity spectrum settings (issue 5) by alternative.
Recreation Emphasis Areas and Travel Planning Public feedback requested that prior to identification of recreation emphasis areas, landscape-scale connectivity analysis be conducted as part of an actual travel management planning process. Recreation emphasis areas capture the existing most highly recreated areas, for both dispersed day use and dispersed overnight use. The intent is to manage existing uses more sustainably. Additional trails originating from such areas would be analyzed at the project level. Programmatically, the effect of these areas in the landscape context is analyzed in this draft environmental impact statement.
Recreation Trails and Wildlife Habitat Public feedback requested that the forest plan emphasize and/or limit new trails to roaded natural and/or rural recreation opportunity spectrum settings as well as Recreation Emphasis Corridors (MA 4.2) and Mountain Resorts (MA 4.1) Management Areas. This is similar to issues 3 and 6, albeit more specific. Although the plan revision team did not directly accommodate this specific request in the draft revised forest plan alternatives, the concept of discouraging trail development in some locations on the landscape is inherent to the wildlife management areas. The wildlife management areas in alternatives B and D cap trail development at a certain density, whereas other areas on the landscape would have no similar cap. Public feedback also requested that wildlife management areas be managed as a primitive recreation opportunity spectrum setting and/or for minimal trail development. As noted above, primitive recreation opportunity spectrum settings are reserved exclusively for areas 3 miles or more from a motorized route; few of these locations exist outside of designated wilderness. However, the plan revision team did incorporate the concept of “minimal trail development” with the standards for no net gain in new trail miles above a specified density threshold. Public feedback requested that route density standards be applied that would better distinguish between the different types of use and their impacts than the proposed one-size-fits-all approach. While the plan revision team considered this, it became infinitely complex to implement, and the best available science did not support making such concrete distinctions of the impact of a motorized trail versus a mechanized trail versus a foot and horse trail. For the durability of the forest plan, the streamlined approach of one standard of 1 mile per square mile is preferred. Cooperating agency feedback requested that the forest plan reduce existing trail densities within key wildlife management areas when the current trail density exceeds 1 mile per square mile. Although the forest plan is not making travel management decisions, the plan does identify broad objectives that each wildlife management area have an action plan; that actions be completed to improve connectivity (MA-OBJ-WLDF-03).

GMUG National Forests Land Management Plan Draft Environmental Impact Statement: Volume 1
27
Semi-primitive Settings and Surface Development / Timber Harvest Public feedback requested that primitive and semi-primitive non-motorized settings be found unsuitable for timber harvest, surface disturbance associated with oil and gas operations, and other discretionary mineral development. This concept for timber harvest was not carried forward, as it would not meet the need for continued fuels reduction even within more remote, non-motorized areas of the national forests, and timber harvest can be a byproduct of fuels treatments. With respect to oil and gas operations and other mineral development, minerals decisions are beyond the scope of the decisions made for the forest plan effort. See also Issues and Concerns that are Outside the Scope of the Decision to be Made.
Special Area Designations – Citizen Proposals A variety of citizen proposals proposed additional recommended wilderness and other special management area categories, including the Community Conservation proposal and the Outdoor Alliance proposal. Proposals for special areas varied in nature but generally proposed the areas be withdrawn from mineral entry and/or closed to leasing; be withdrawn from timber production; be kept roadless, and generally limit recreation use to non-motorized and/or nonmechanized travel. In the case of Outdoor Alliance, additional areas were identified with varying levels of specific recommendations, but they generally emphasized recreation. As noted in the section below regarding scope, mineral decisions are not being made within this forest plan, and closure of areas currently open to motorized use is also not being considered. Local community support was also a factor in determining which of the citizen proposals would be carried forward for detailed analysis. However, there is considerable overlap between the decisions that are being made in the forest plan and some of the spirit and intent within the citizen proposals. For example, a high proportion of citizen-proposed special areas overlap summer primitive and semi-primitive non-motorized settings (74 percent), and as much as 41 percent of proposed special areas overlap winter semi-primitive non-motorized settings. As well, there is considerable overlap (46 percent) between wildlife management areas (in which future recreation trail density would be capped), conservation watershed networks (12 percent; where there would be an emphasis on conserving watershed function for resident aquatic species), and proposed research natural areas (where the emphasis is on conserving the reference ecological community). A detailed comparison of the citizen proposals and the proposed alternatives is contained in the project record.
Timber and Other Resource Values Public feedback requested that wildlife migratory corridors and sensitive habitats be excluded from areas suitable for timber production, as well as land requiring new road construction or major reconstruction for access. Feedback requested that insect, disease, and post-wildfire salvage be limited to areas suitable for timber production.
USDA Forest Service
28
With respect to migratory corridors and sensitive habitats, timber production is not necessarily incongruent with their habitat features. At a broad, planning scale, these finer-grained features are also not well-mapped across the national forests and are best addressed via project-specific application of forest plan standards and guidelines and other design features to mitigate impacts to a given species. With respect to insect, disease, and post-wildfire salvage being limited to areas suitable for timber production, this is partially addressed by alternative D, which removes salvage as a forest management tool entirely. In the other alternatives, salvage would be allowed outside of areas suitable for timber production, consistent with other resource plan components. Public feedback also requested that the forest plan prohibit timber harvest in high-probability/high-quality lynx habitat. Rather than prohibit, the forest plan proposes an amendment to the Southern Rockies Lynx Amendment that would more strictly cap production in these areas (standard Veg S7/Veg S8 or FW-STND-SPEC-35).
Issues and Concerns that are Outside the Scope of the Decision to be Made While the extent of future mineral development has remained a topic of high public interest throughout the planning effort, mineral suitability and mineral withdrawal decisions remain outside of the scope of forest plan revision, with the exception of the required determination for coal suitability at the forest plan stage per 43 CFR 3420.1-4. Each of the five citizen proposals for special areas included language regarding mineral withdrawal. Other public comments requested that any area identified for a desired semi-primitive recreation setting be withdrawn from mineral entry, that site-specific resources (e.g., fens, historic properties, recreation sites) be withdrawn from mineral entry, that specific locations be withdrawn, that important watersheds and wildlife habitat be withdrawn, and that all Colorado roadless areas be withdrawn. Public comments also requested consideration of an alternative that would preclude future coal leasing in the GMUG. The required determination for coal suitability at the forest plan stage is discussed in detail in appendix 10 of the forest plan. Given economic constraints and designated Colorado roadless area constraints (outside of the contested North Fork Mining Area per the Colorado Roadless Rule), the area available to coal leasing is extremely limited. Therefore, an alternative that would preclude future coal leasing in the GMUG is unnecessary. Oil and gas leasing availability, including surface use stipulations, remains outside of the scope of the forest plan revision. This will be completed in a separate and subsequent environmental analysis process. Public comments requested alternatives that would be best considered in the subsequent leasing available analysis, including alternatives for no energy/mineral development; minimal energy/mineral development; maximum energy/mineral development; exclusively renewable energy development. Public comments have requested specific leasing stipulations be applied, such as the requirement for methane flaring, capture, and/or mitigation in any future leasing. While a preliminary need for change in the GMUG’s 2017 Minerals Assessment identified a potential need for change to further clarify Colorado roadless area mineral leasing provisions, this remains beyond the scope of the forest plan revision. Related public comments suggested no surface occupancy stipulations for all Colorado roadless areas

GMUG National Forests Land Management Plan Draft Environmental Impact Statement: Volume 1
29
and/or limits on the distance allowed for leasing between current no surface occupancy areas, to better reflect current distance limits with respect to horizontal drilling. These comments would be best considered in the subsequent leasing availability analysis. Likewise, Forestwide travel management remains outside the scope of forest plan revision, despite high public interest in winter travel management, in particular. Public comments specifically requested an alternative that would provide continued and enhanced motorized access and motorized recreation in the GMUG. In general, area motorized travel decisions have been made in prior travel management decisions and are now reflected in the draft revised forest plan’s mapped recreation settings (recreation opportunity spectrum), such as the distinctions between semi-primitive motorized and semi-primitive non-motorized settings. Both future mineral decisions and travel decisions would be guided by more broad forest plan direction, including but not limited to Forestwide riparian direction, management areas, mapped recreation opportunity settings (recreation opportunity spectrum), and mapped scenic integrity objectives.
Comparison of Alternatives Alternatives are compared by management area allocations in table 2. Alternatives are compared Forestwide by issue in table 3. Forest plan objectives are compared by alternative, in response to key planning issues, in table 4.

USDA Forest Service
30
Table 2. Size of management area, by alternative [Values rounded to nearest 1,000; NA, not applicable because these 1983 management area categories do not have a corresponding category in the current draft revised forest plan]
No-Action Alternative Draft Alternative B Draft Alternative C Draft Alternative D
Management Area and Description Acres Percentage in Roadless Acres
Percentage in Roadless Acres
Percentage in Roadless Acres
Percentage in Roadless
8/1.1 – Designated Wilderness 34,300 34,300 34,300 34,300
8a/1.1a - Designated Wilderness 107,200 107,200 107,200 107,200 8b/1.1b – Designated Wilderness 224,300 224,300 224,300 224,300 8c/1.1c – Designated Wilderness 187,700 187,700 187,700 187,700 1.2 – Area Analyzed as Wilderness 0 34,000 86% 0 261,000 90% 1.3 – Tabeguache and Roubideau Areas 28,000 28,000 28,000 28,000
2.1 – Special Interest Area 2,000 17,000 74% 2,000 4,000 46% 2.2 – Research Natural Area 1,000 93% 1,000 93% 1,000 93% 12,000 99% 2.3 – Fossil Ridge Special Recreation Area 43,000 43,000 43,000 43,000
3.1 – Colorado Roadless Area that doesn’t overlap another Management Area category
(overlaps 11 other
MA categories)
427,000 891,000 215,000
3.2 – Wildlife Management Area 0 740,000 58% 36,000 25% 621,000 50% 3.3 – Special Management Area 0 0 0 246,000 52% 4.1 – Mountain Resort 11,000 9,000 11,000 9,000
4.2 – Recreation Emphasis Corridor 0 38,000 38,000 35,000
5 – General Forest 0 1,077,000 1,364,000 940,000
2A – Semi-primitive Motorized Recreation Opportunities1 399,000 44% NA NA NA NA NA NA
2B – Roaded Natural and Rural Recreation Opportunities1 73,000 21% NA NA NA NA NA NA
3A – Semi-primitive Non-motorized Recreation Opportunities1 79,000 77% NA NA NA NA NA NA

GMUG National Forests Land Management Plan Draft Environmental Impact Statement: Volume 1
31
No-Action Alternative Draft Alternative B Draft Alternative C Draft Alternative D
Management Area and Description Acres Percentage in Roadless Acres
Percentage in Roadless Acres
Percentage in Roadless Acres
Percentage in Roadless
4B – Wildlife Habitat Management for One or More Management Indicator Species1
220,000 53% NA NA NA NA NA NA
4D – Aspen Management1 67,000 30% NA NA NA NA NA NA 5A – Big Game Winter Range in Non-Forested Areas1 252,000 27% NA NA NA NA NA NA
5B – Big Game Winter Range in Forested Areas1 26,000 8% NA NA NA NA NA NA
6A – Livestock Grazing - Improve Forage Composition1 1,000 100% NA NA NA NA NA NA
6B – Livestock Grazing - Maintain Forage Composition1 734,000 43% NA NA NA NA NA NA
7A – Timber Management on Slopes Under 40%1 501,000 25% NA NA NA NA NA NA
10E – Municipal Watersheds1 7,000 NA NA NA NA NA NA TOTAL2 2,997,000 2,967,000
1 These 1983 management area categories do not have a corresponding category in the current draft revised forest plan.
2 Total acreage varies slightly between the no-action and the action alternatives due to improved data layers between the last major plan amendment in 1993 and the present. Acres in wilderness are represented here as the same across all alternatives, despite underlying data discrepancies between 1991 data and current data.
3 The 1983 management area categories for wilderness are 8, 8A, 8B, 8C. 8 is for wilderness areas designated subsequent to the 1983 forest plan. 8A, 8B, and 8C reflect different primitive settings. The corresponding numbering used for the draft plan is 1.1, 1.1a., 1.1b, 1.1c.
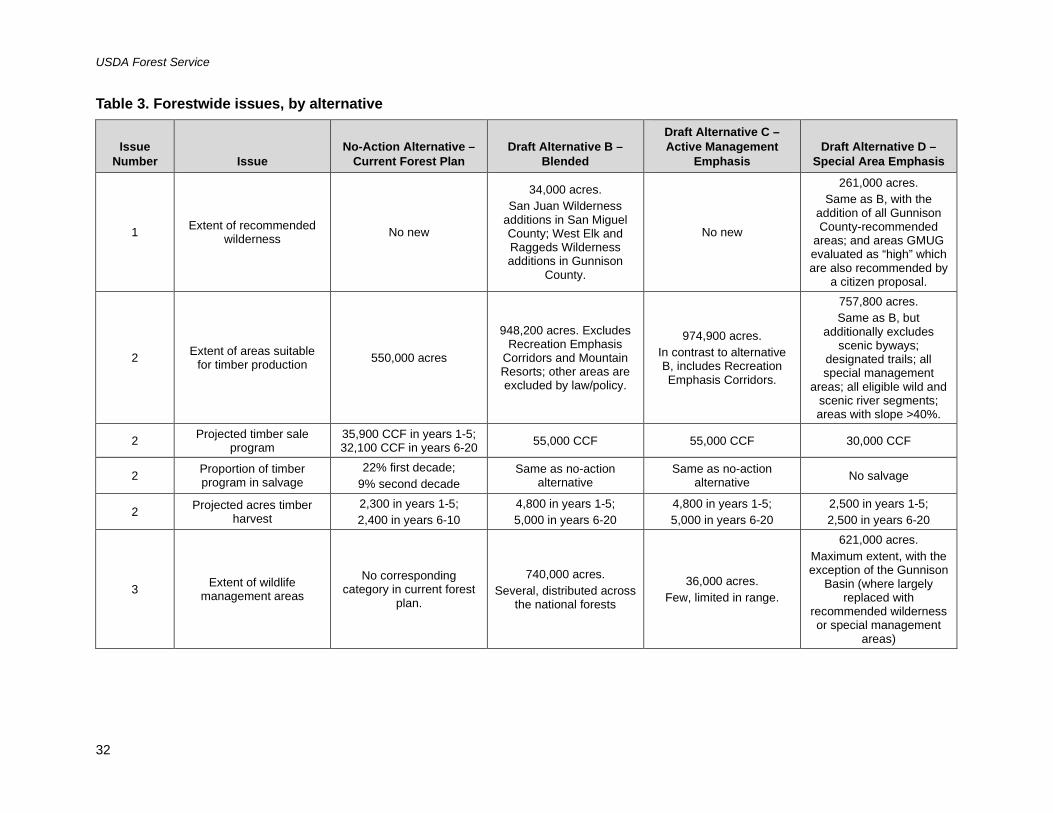
USDA Forest Service
32
Table 3. Forestwide issues, by alternative
Issue Number Issue
No-Action Alternative – Current Forest Plan
Draft Alternative B – Blended
Draft Alternative C – Active Management
Emphasis Draft Alternative D –
Special Area Emphasis
1 Extent of recommended wilderness No new
34,000 acres. San Juan Wilderness
additions in San Miguel County; West Elk and Raggeds Wilderness additions in Gunnison
County.
No new
261,000 acres. Same as B, with the
addition of all Gunnison County-recommended
areas; and areas GMUG evaluated as “high” which are also recommended by
a citizen proposal.
2 Extent of areas suitable for timber production 550,000 acres
948,200 acres. Excludes Recreation Emphasis
Corridors and Mountain Resorts; other areas are excluded by law/policy.
974,900 acres. In contrast to alternative B, includes Recreation Emphasis Corridors.
757,800 acres. Same as B, but
additionally excludes scenic byways;
designated trails; all special management
areas; all eligible wild and scenic river segments; areas with slope >40%.
2 Projected timber sale program
35,900 CCF in years 1-5; 32,100 CCF in years 6-20 55,000 CCF 55,000 CCF 30,000 CCF
2 Proportion of timber program in salvage
22% first decade; 9% second decade
Same as no-action alternative
Same as no-action alternative No salvage
2 Projected acres timber harvest
2,300 in years 1-5; 2,400 in years 6-10
4,800 in years 1-5; 5,000 in years 6-20
4,800 in years 1-5; 5,000 in years 6-20
2,500 in years 1-5; 2,500 in years 6-20
3 Extent of wildlife management areas
No corresponding category in current forest
plan.
740,000 acres. Several, distributed across
the national forests
36,000 acres. Few, limited in range.
621,000 acres. Maximum extent, with the exception of the Gunnison
Basin (where largely replaced with
recommended wilderness or special management
areas)

GMUG National Forests Land Management Plan Draft Environmental Impact Statement: Volume 1
33
Issue Number Issue
No-Action Alternative – Current Forest Plan
Draft Alternative B – Blended
Draft Alternative C – Active Management
Emphasis Draft Alternative D –
Special Area Emphasis
5
Summer recreation opportunity spectrum
settings, as percentage of the GMUG
Primitive – 12% Semi-primitive non-
motorized – 48% Semi-primitive motorized –
26% Roaded natural – 14%
Rural <1%
Primitive – 11% Semi-primitive non-
motorized – 47% Semi-primitive motorized –
28% Roaded natural – 14%
Rural <1%
Primitive – 11% Semi-primitive non-
motorized – 37% Semi-primitive motorized –
32% Roaded natural – 20%
Rural <1%
Primitive – 27% Semi-primitive non-
motorized – 32% Semi-primitive motorized –
23% Roaded natural – 18%
Rural <1%
5
Winter recreation opportunity spectrum
settings, as percentage of the GMUG
Pristine – 4% Primitive – 16%
Semi-primitive non-motorized – 18%
Semi-primitive motorized – 51%
Roaded natural – 11% Rural <1%
Pristine – 4% Primitive – 16%
Semi-primitive non-motorized – 26%
Semi-primitive motorized – 43%
Roaded natural – 11% Rural <1%
Pristine – 4% Primitive – 14%
Semi-primitive non-motorized – 12%
Semi-primitive motorized – 56%
Roaded natural – 14% Rural <1%
Pristine – 4% Primitive – 27%
Semi-primitive non-motorized – 39%
Semi-primitive motorized – 20%
Roaded natural – 10% Rural <1%
6 Scenic integrity objectives,
as percentage of the GMUG
Preservation (very high) – 15%
Retention (high) – 6% Partial retention
(moderate) – 19% Modification (low) – 56% Maximum modification
(very low) – 4%
Very high - 21% High – 37%
Moderate – 27% Low – 14%
Very high - 20% High – 11%
Moderate – 51% Low – 18%
Very high - 29% High – 41%
Moderate – 24% Low – 6%
7
Citizen proposals for special management
areas with preservation and/or recreation
emphases.
N/A None None
246,000 acres. Gunnison County and San
Miguel County-recommended areas.
8 Special interest areas 2,000 acres.
17,000 acres. New – Gunnison
Research Special Interest Area
Same as no-action alternative. No new
special interest areas.
4,000 acres. New – Gunnison
Research Special Interest Area; Taylor Willard
Special Interest Area.
8 Research natural areas 1,000 acres. Existing -
Gothic, Dry Forks Escalante.
Same as no-action alternative. No new
research natural areas.
Same as no-action alternative. No new
research natural areas.
12,000 acres New – Battlements.

USDA Forest Service
34
Issue Number Issue
No-Action Alternative – Current Forest Plan
Draft Alternative B – Blended
Draft Alternative C – Active Management
Emphasis Draft Alternative D –
Special Area Emphasis
8 Mountain Resorts
11,000 acres. Crested Butte Mountain
Resort includes Snodgrass.
9,000 acres. Crested Butte Mountain Resort excludes an area
called Snodgrass.
Same as no-action alternative. No change. Same as B.
Table 4. Draft revised forest plan objectives, by alternative, in response to key planning issues
Issue Objective and Topic Measure No-Action Alternative Alternative B Alternative C Alternative D
2 FW-OBJ-FFM-02 Fuels Acres fuels treated per decade 90,500 acres
110,000 acres first decade;
150,000 acres second decade
130,000 acres 50,000 acres
2 FW-OBJ-SPEC-03
Species Acres terrestrial habitat restored/enhanced per decade 20,000 acres 20,000 acres 80,000 acres 20,000 acres
2 FW-OBJ-RMGD-06 Acres of riparian and meadow habitat and miles of perennial stream restored/enhanced per decade
2,500 acres; 15 miles Same as Alt B Same as Alt B
2 FW-OBJ-IVSP-02 Treat invasive species 10% of inventoried acres Same as Alt B Same as Alt B
4 FW-OBJ-SPEC-30
At-risk plants Actions implemented to minimize off-road travel N/A Within 3 years Same as B Within 1 year
4 FW-OBJ-SPEC-38 Sage-grouse Reduce routes within 2 miles of leks Same as B Within 10 years Same as B Within 5 years
1
MA-OBJ-WLDN-04 Wilderness
and Roubideau, Tabeguache
Remove unauthorized improvements/structures Same as B Within 10 years Same as B Within 5 years
1 MA-OBJ-WLDN-05
Wilderness Complete recreation opportunity spectrum mapping Same as B Within 5 years Same as B Within 3 years
1 MA-OBJ-WLDN-06 Wilderness
Develop area-specific wilderness management plans Same as B Within 10 years Same as B Within 5 years

GMUG National Forests Land Management Plan Draft Environmental Impact Statement: Volume 1
35
Issue Objective and Topic Measure No-Action Alternative Alternative B Alternative C Alternative D
1 MA-OBJ-RECWLD-03
Recommended wilderness
Close unauthorized routes N/A Within 5 years N/A Within 7 years
4
MA-OBJ-WLDN-07 Wilderness and recommended
wilderness
Number of boundary areas adjacent to motorized settings signed per decade Same as B 5 0 20
4 MA-OBJ-REC-01 Recreation
Number of recreation sites with accessibility improved per decade Same as B 5 0 10
4 MA-OBJ-REC-02 Recreation
Number existing unauthorized motorized travel incursions eliminated per decade in semi-primitive non-motorized recreation opportunity spectrum
N/A 2 0 10
4 FW-OBJ-REC-04
Acres of alpine ecosystems restored through implementing recreation management plans and/or road/trail decommissioning.
N/A 100 Same as Alt B Same as Alt B
7 MA-OBJ-SMA-01
Special management areas
Initiate travel management to implement special management area suitability designations
N/A N/A N/A Within 3 years
4 MA-OBJ-EMREC-02 Recreation emphasis
areas
Actions taken within 5 years to improve degraded dispersed overnight use areas Same as B At least 5 At least 2 At least 10
4 MA-OBJ-EMREC-03 Recreation emphasis
areas
Actions taken within 5 years to improve degraded dispersed day use areas Same as B At least 5 At least 2 At least 10

USDA Forest Service
36
Management area categories for each alternative, including where they overlap with Colorado roadless areas (as symbolized with the striped pattern) are shown in figure 3, figure 4, figure 5, and figure 6. To simplify labels in the no-action alternative, categories that directly coincide with draft revised forest plan categories are labeled the same as in the draft revised forest plan and alternatives (i.e., MA 1.3, Tabeguache and Roubideau Areas).
Figure 3. Management areas for alternative A, the no-action alternative

GMUG National Forests Land Management Plan Draft Environmental Impact Statement: Volume 1
37
Figure 4. Management areas for alternative B, the blended alternative

USDA Forest Service
38
Figure 5. Management areas for alternative C, with an active management emphasis

GMUG National Forests Land Management Plan Draft Environmental Impact Statement: Volume 1
39
Figure 6. Management areas for alternative D, with a special area emphasis

USDA Forest Service
40
Comparison of Alternatives by Geographic Area The following tables compare the major allocations by alternative for each of the five geographic areas in the GMUG. The no-action alternative is not included in the management area tables because the current plan categories do not compare to any of the draft revised forest plan categories.

GMUG National Forests Land Management Plan Draft Environmental Impact Statement: Volume 1
41
Grand Mesa
Table 5. Management areas by action alternative, Grand Mesa Geographic Area [Units reported in acres and as a percentage of the total of the geographic area]
Management Area Alternative B
(acres) Alternative B
(percent) Alternative C
(acres) Alternative C
(percent) Alternative D
(acres) Alternative D
(percent) 1.2/3.1 – Area Analyzed as Wilderness/Colorado Roadless Area 0 0% 0 0% 2,900 1%
2.2/3.1 - Research Natural Area/Colorado Roadless Area 0 0% 0 0% 10,700 3%
3.1 - Colorado Roadless Area (that doesn’t overlap another Management Area) 19,400 6% 156,900 50% 8,700 3%
3.2 - Wildlife Management Area 15,400 5% 0 0% 15,400 5% 3.2/3.1 - Wildlife Management Area/Colorado Roadless Area 137,500 43% 0 0% 134,600 43%
4.1 - Mountain Resort 1,600 1% 1,600 1% 1,600 1% 4.2 - High-Use Recreation Area 2,900 1% 2,900 1% 2,900 1% 5 - General Forest 139,700 44% 155,100 49% 139,700 44%
Total 316,500 316,500 316,500
Table 6. Suitable timber by alternative, Grand Mesa Geographic Area [Units reported in acres and as a percentage of the total geographic area]
Alternative A (acres)
Alternative A (percent)
Alternative B (acres)
Alternative B (percent)
Alternative C (acres)
Alternative C (percent)
Alternative D (acres)
Alternative D (percent)
47,000 15% 98,000.00 31% 100,000.00 32% 86,000.00 27%

USDA Forest Service
42
Table 7. Summer recreation opportunity spectrum settings by alternative, Grand Mesa Geographic Area [Units reported in acres and as a percentage of the total geographic area. ROS, recreation opportunity spectrum]
ROS Setting Alternative A
(acres) Alternative A
(percent) Alternative B
(acres) Alternative B
(percent) Alternative C
(acres) Alternative C
(percent) Alternative D
(acres) Alternative D
(percent) Primitive 0 0% 0 0% 0 0% 2,900 1% Semi-Primitive Non-Motorized 146,500 46% 141,900 45% 79,100 25% 138,100 44%
Semi-Primitive Motorized 108,100 34% 112,600 36% 162,800 51% 108,000 34%
Roaded Natural 59,500 19% 59,500 19% 72,300 23% 65,300 21% Rural 2,100 1% 2,100 1% 2,100 1% 2,100 1%
Table 8. Winter recreation opportunity spectrum settings by alternative, Grand Mesa Geographic Area [Units reported in acres and as a percentage of the total geographic area. ROS, recreation opportunity spectrum]
ROS Setting Alternative A
(acres) Alternative A
(percent) Alternative B
(acres) Alternative B
(percent) Alternative C
(acres) Alternative C
(percent) Alternative D
(acres) Alternative D
(percent) Primitive 18,900 6% 18,900 6% 0 0% 21,800 7% Semi-Primitive Non-Motorized 91,900 29% 100,500 32% 107,500 34% 152,800 48%
Semi-Primitive Motorized 134,500 43% 125,900 40% 114,100 36% 72,700 23%
Roaded Natural 69,300 22% 69,300 22% 93,000 29% 67,300 21% Rural 1,600 1% 1,600 1% 1,600 1% 1,600 1%

GMUG National Forests Land Management Plan Draft Environmental Impact Statement: Volume 1
43
Gunnison Basin
Table 9. Management areas by action alternative, Gunnison Basin Geographic Area [Units reported in acres and as a percentage of the total of the geographic area]
Management Area Alternative B
(acres) Alternative B
(percent) Alternative C
(acres) Alternative C
(percent) Alternative D
(acres) Alternative D
(percent) 1.1 - Designated Wilderness 33,600 3% 33,600 3% 33,600 3% 1.1a – Designated Wilderness 41,800 3% 41,800 3% 41,800 3% 1.1b – Designated Wilderness 143,600 11% 143,600 11% 143,600 11% 1.1c – Designated Wilderness 113,600 9% 113,600 9% 113,600 9% 1.2 – Area to be Analyzed as Wilderness 500 <1% 0 0% 11,400 1% 1.2/3.1 – Area to be Analyzed as Wilderness/Colorado Roadless Area 9,800 1% 0 0% 120,700 9%
2.1 - Special Interest Area 3,700 <1% 1,000 <1% 1,500 <1% 2.1/3.1 – Special Interest Area / Colorado Roadless Area 12,300 1% 0 0% 1,700 <1%
2.2 – Research Natural Area 0 0% 0 0% 0 0% 2.2/3.1 – Research Natural Area / Colorado Roadless Area 1,000 <1% 1,000 0% 1,000 <1%
2.3 – Fossil Ridge Special Recreation Area 36,200 3% 43,400 3% 36,200 3% 2.3/3.2 – Fossil Ridge Special Recreation Area/Wildlife Management Area 7,200 1% 0 0% 7,200 1%
3.1 – Colorado Roadless Area 189,200 15% 347,500 27% 92,600 7% 3.2 – Wildlife Management Area 111,300 9% 23,500 2% 64,600 5% 3.2/3.1 - Wildlife Management Area / Colorado Roadless Area 141,600 11% 5,400 <1% 47,300 4%
3.3 – Special Management Area 0 0% 0 0% 100,100 8% 3.3/3.1 – Special Management Area/ Colorado Roadless Area 0 0% 0 0% 90,600 7%
4.1 – Mountain Resort 4,300 <1% 5,800 <1% 4,300 <1% 4.2 – High-Use Recreation Area 19,600 2% 19,700 2% 17,000 1%
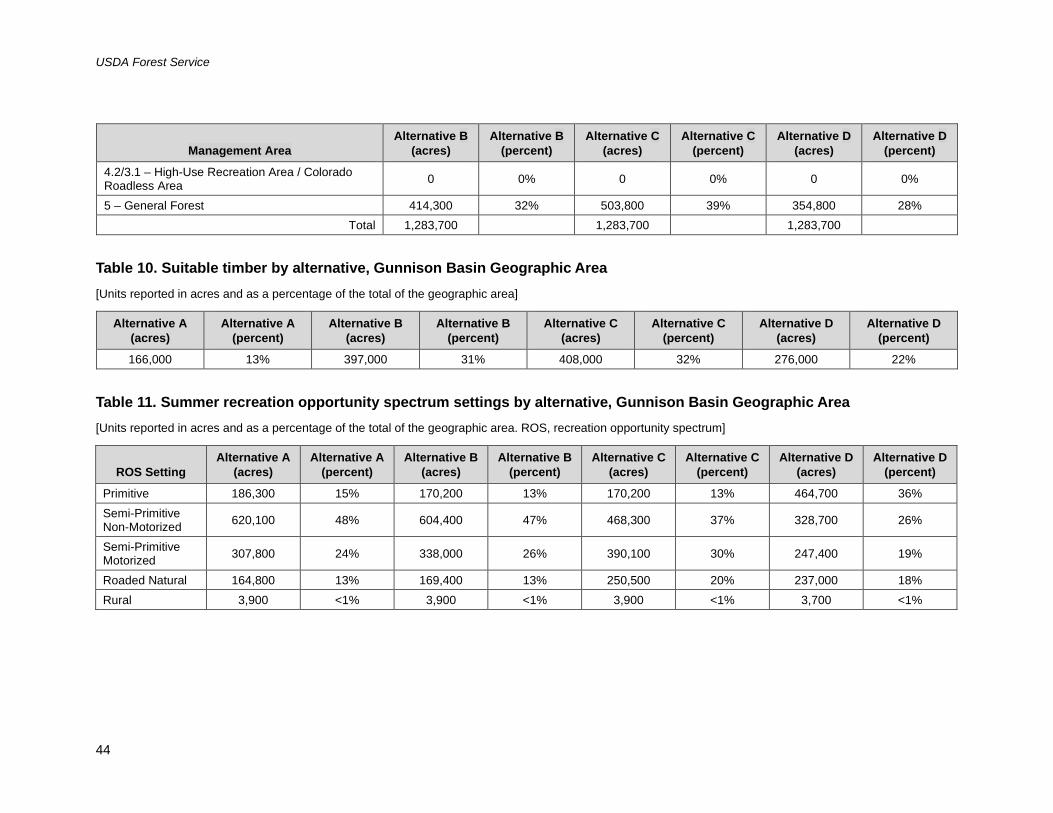
USDA Forest Service
44
Management Area Alternative B
(acres) Alternative B
(percent) Alternative C
(acres) Alternative C
(percent) Alternative D
(acres) Alternative D
(percent) 4.2/3.1 – High-Use Recreation Area / Colorado Roadless Area 0 0% 0 0% 0 0%
5 – General Forest 414,300 32% 503,800 39% 354,800 28% Total 1,283,700 1,283,700 1,283,700
Table 10. Suitable timber by alternative, Gunnison Basin Geographic Area [Units reported in acres and as a percentage of the total of the geographic area]
Alternative A (acres)
Alternative A (percent)
Alternative B (acres)
Alternative B (percent)
Alternative C (acres)
Alternative C (percent)
Alternative D (acres)
Alternative D (percent)
166,000 13% 397,000 31% 408,000 32% 276,000 22%
Table 11. Summer recreation opportunity spectrum settings by alternative, Gunnison Basin Geographic Area [Units reported in acres and as a percentage of the total of the geographic area. ROS, recreation opportunity spectrum]
ROS Setting Alternative A
(acres) Alternative A
(percent) Alternative B
(acres) Alternative B
(percent) Alternative C
(acres) Alternative C
(percent) Alternative D
(acres) Alternative D
(percent) Primitive 186,300 15% 170,200 13% 170,200 13% 464,700 36% Semi-Primitive Non-Motorized 620,100 48% 604,400 47% 468,300 37% 328,700 26%
Semi-Primitive Motorized 307,800 24% 338,000 26% 390,100 30% 247,400 19%
Roaded Natural 164,800 13% 169,400 13% 250,500 20% 237,000 18% Rural 3,900 <1% 3,900 <1% 3,900 <1% 3,700 <1%

GMUG National Forests Land Management Plan Draft Environmental Impact Statement: Volume 1
45
Table 12. Winter recreation opportunity spectrum settings by alternative, Gunnison Basin Geographic Area [Units reported in acres and as a percentage of the total of the geographic area. ROS, recreation opportunity spectrum]
ROS Setting Alternative A
(acres) Alternative A
(percent) Alternative B
(acres) Alternative B
(percent) Alternative C
(acres) Alternative C
(percent) Alternative D
(acres) Alternative D
(percent) Pristine (Wilderness) 42,000 3% 42,000 3% 42,000 3% 42,000 3%
Primitive 249,900 19% 249,900 19% 249,600 19% 423,500 33% Semi-Primitive Non-Motorized 221,100 17% 365,100 28% 60,700 5% 661,000 52%
Semi-Primitive Motorized 677,300 53% 534,700 42% 819,100 64% 70,900 6%
Roaded Natural 87,800 7% 86,900 7% 107,100 8% 81,100 6% Rural 4,300 <1% 4,300 <1% 4,300 <1% 4,300 <1%
North Fork Valley
Table 13. Management areas by action alternative, North Fork Valley Geographic Area [Units reported in acres and as a percentage of the total of the geographic area]
Management Area Alternative B
(acres) Alternative B
(percent) Alternative C
(acres) Alternative C
(percent) Alternative D
(acres) Alternative D
(percent) 1.1 - Designated Wilderness 300 <1% 300 <1% 300 <1% 1.1a – Designated Wilderness 54,200 11% 54,200 11% 54,200 11% 1.1b – Designated Wilderness 55,200 11% 55,200 11% 55,200 11% 1.1c – Designated Wilderness 15,100 3% 15,100 3% 15,100 3% 1.2 - Area to be Analyzed as Wilderness 0 0% 0 0% 100 <1% 1.2/3.1 - Area to be Analyzed as Wilderness/ Colorado Roadless Area 1,300 <1% 0 0% 42,600 9%
3.1 - Colorado Roadless Area (that doesn’t overlap another Management Area) 168,500 35% 205,000 43% 103,600 22%
3.2 - Wildlife Management Area 2,000 <1% 0 0% 22,700 5%

USDA Forest Service
46
Management Area Alternative B
(acres) Alternative B
(percent) Alternative C
(acres) Alternative C
(percent) Alternative D
(acres) Alternative D
(percent) 3.2/3.1 - Wildlife Management Area/ Colorado Roadless Area 35,200 7% 0 0% 28,600 6%
3.3 - Special Management Area 0 0% 0 0% 6,400 1% 3.3/3.1 - Special Management Area/ Colorado Roadless Area 0 0% 0 0% 23,600 5%
4.2 - High-Use Recreation Area 2,000 <1% 2,000 <1% 1,700 <1% 5 - General Forest 147,700 31% 149,700 31% 127,400 26%
Total 481,400 481,400 481,400
Table 14. Suitable timber by alternative, North Fork Valley Geographic Area [Units reported in acres and as a percentage of the total of the geographic area]
Alternative A (acres)
Alternative A (percent)
Alternative B (acres)
Alternative B (percent)
Alternative C (acres)
Alternative C (percent)
Alternative D (acres)
Alternative D (percent)
46,000 10% 98,000 20% 99,000 21% 85,000 18%
Table 15. Summer recreation opportunity spectrum settings by alternative, North Fork Valley Geographic Area [Units reported in acres and as a percentage of the total of the geographic area. ROS, recreation opportunity spectrum]
ROS Setting Alternative A
(acres) Alternative A
(percent) Alternative B
(acres) Alternative B
(percent) Alternative C
(acres) Alternative C
(percent) Alternative D
(acres) Alternative D
(percent) Primitive 105,500 22% 99,300 21% 100,300 21% 173,900 36% Semi-Primitive Non-Motorized 256,900 53% 253,000 52% 237,900 49% 176,900 37%
Semi-Primitive Motorized 54,800 11% 67,900 14% 53,600 11% 54,200 11%
Roaded Natural 63,600 13% 63,600 13% 89,500 19% 76,000 16% Rural 300 <1% 300 <1% 300 <1% 300 <1%

GMUG National Forests Land Management Plan Draft Environmental Impact Statement: Volume 1
47
Table 16. Winter recreation opportunity spectrum settings by alternative, North Fork Valley Geographic Area [Units reported in acres and as a percentage of the total of the geographic area. ROS, recreation opportunity spectrum]
ROS Setting Alternative A
(acres) Alternative A
(percent) Alternative B
(acres) Alternative B
(percent) Alternative C
(acres) Alternative C
(percent) Alternative D
(acres) Alternative D
(percent) Pristine (Wilderness) 54,300 11% 54,300 11% 54,300 11% 54,300 11% Primitive 72,000 15% 72,000 15% 66,600 14% 127,300 26% Semi-Primitive Non-Motorized 24,100 5% 36,100 7% 19,000 4% 39,400 8%
Semi-Primitive Motorized 272,000 56% 260,100 54% 272,900 57% 202,600 42%
Roaded Natural 59,100 12% 59,100 12% 68,700 14% 57,900 12% Rural 0 0% 0 0% 0 0% 0 0%
San Juans
Table 17. Management areas by action alternative, San Juans Geographic Area [Units reported in acres and as a percentage of the total of the geographic area]
Management Area Alternative B
(acres) Alternative B
(percent) Alternative C
(acres) Alternative C
(percent) Alternative D
(acres) Alternative D
(percent) 1.1 - Designated Wilderness 400 <1% 400 <1% 400 <1% 1.1a – Designated Wilderness 11,200 4% 11,200 4% 11,200 4% 1.1b – Designated Wilderness 25,500 8% 25,500 8% 25,500 8% 1.1c – Designated Wilderness 59,000 19% 59,000 19% 59,000 19% 1.2 - Area to be Analyzed as Wilderness 4,400 1% 0 0% 13,500 4% 1.2/3.1 - Area to be Analyzed as Wilderness/ Colorado Roadless Area 18,100 6% 0 0% 20,400 7%
2.1 - Special Interest Area 500 <1% 500 <1% 500 <1% 3.1 - Colorado Roadless Area (that doesn’t overlap another Management Area) 18,600 6% 59,400 19% 7,600 2%

USDA Forest Service
48
Management Area Alternative B
(acres) Alternative B
(percent) Alternative C
(acres) Alternative C
(percent) Alternative D
(acres) Alternative D
(percent) 3.2 - Wildlife Management Area 37,500 12% 0 0% 30,500 10% 3.2/3.1 - Wildlife Management Area/ Colorado Roadless Area 22,600 7% 0 0% 23,400 8%
3.3 - Special Management Area 0 0% 0 0% 11,000 4% 3.3/3.1 - Special Management Area/ Colorado Roadless Area 0 0% 0 0% 8,000 3%
4.1 - Mountain Resort 3,600 1% 3,600 1% 3,600 1% 4.2 - High-Use Recreation Area 7,700 3% 7,700 3% 7,600 2% 5 - General Forest 97,600 32% 139,400 45% 84,400 28%
Total 306,600 306,600 306,500
Table 18. Suitable timber by alternative, San Juans Geographic Area [Units reported in acres and as a percentage of the total of the geographic area]
Alternative A (acres)
Alternative A (percent)
Alternative B (acres)
Alternative B (percent)
Alternative C (acres)
Alternative C (percent)
Alternative D (acres)
Alternative D (percent)
35,000 11% 91,000 30% 99,000 32% 54,000 18%
Table 19. Summer recreation opportunity spectrum settings by alternative, San Juans Geographic Area [Units reported in acres and as a percentage of the total of the geographic area. ROS, recreation opportunity spectrum]
ROS Setting Alternative A
(acres) Alternative A
(percent) Alternative B
(acres) Alternative B
(percent) Alternative C
(acres) Alternative C
(percent) Alternative D
(acres) Alternative D
(percent) Primitive 68,400 22% 59,900 20% 64,700 21% 129,900 43% Semi-Primitive Non-Motorized 178,700 58% 177,300 58% 162,800 53% 112,100 37%
Semi-Primitive Motorized 31,200 10% 40,600 13% 36,100 12% 25,300 8%
Roaded Natural 24,800 8% 25,500 8% 40,000 13% 34,500 11%
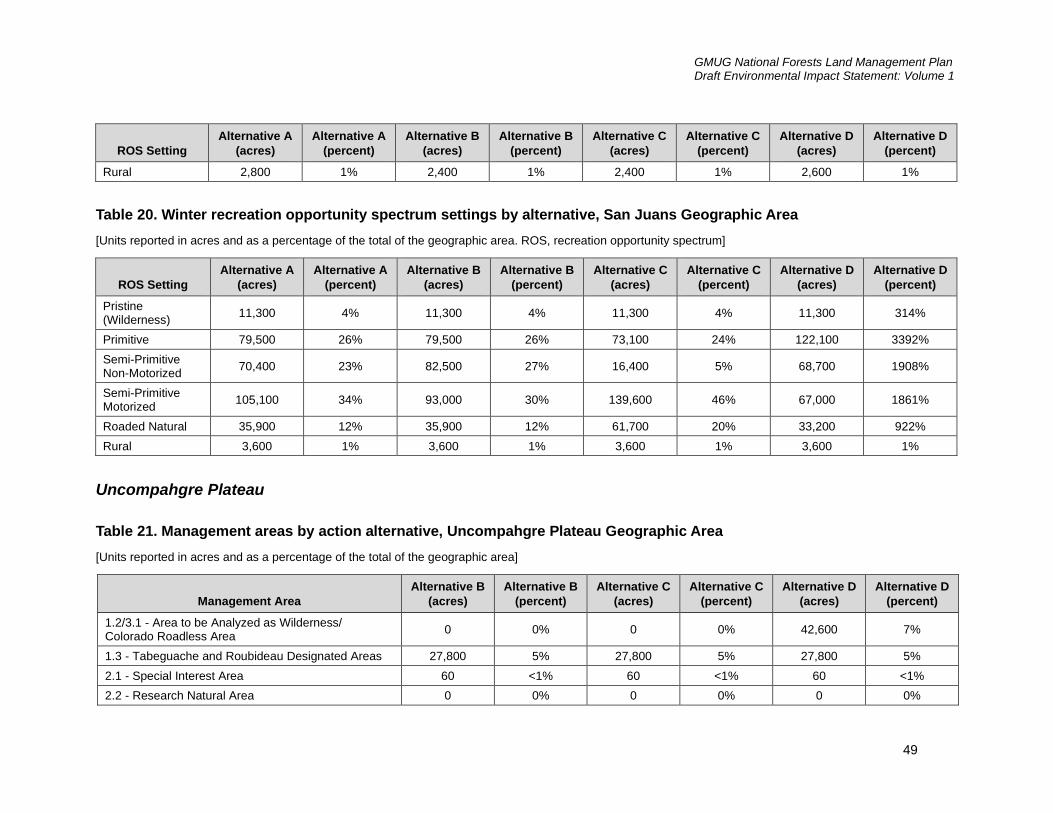
GMUG National Forests Land Management Plan Draft Environmental Impact Statement: Volume 1
49
ROS Setting Alternative A
(acres) Alternative A
(percent) Alternative B
(acres) Alternative B
(percent) Alternative C
(acres) Alternative C
(percent) Alternative D
(acres) Alternative D
(percent) Rural 2,800 1% 2,400 1% 2,400 1% 2,600 1%
Table 20. Winter recreation opportunity spectrum settings by alternative, San Juans Geographic Area [Units reported in acres and as a percentage of the total of the geographic area. ROS, recreation opportunity spectrum]
ROS Setting Alternative A
(acres) Alternative A
(percent) Alternative B
(acres) Alternative B
(percent) Alternative C
(acres) Alternative C
(percent) Alternative D
(acres) Alternative D
(percent) Pristine (Wilderness) 11,300 4% 11,300 4% 11,300 4% 11,300 314%
Primitive 79,500 26% 79,500 26% 73,100 24% 122,100 3392% Semi-Primitive Non-Motorized 70,400 23% 82,500 27% 16,400 5% 68,700 1908%
Semi-Primitive Motorized 105,100 34% 93,000 30% 139,600 46% 67,000 1861%
Roaded Natural 35,900 12% 35,900 12% 61,700 20% 33,200 922% Rural 3,600 1% 3,600 1% 3,600 1% 3,600 1%
Uncompahgre Plateau
Table 21. Management areas by action alternative, Uncompahgre Plateau Geographic Area [Units reported in acres and as a percentage of the total of the geographic area]
Management Area Alternative B
(acres) Alternative B
(percent) Alternative C
(acres) Alternative C
(percent) Alternative D
(acres) Alternative D
(percent) 1.2/3.1 - Area to be Analyzed as Wilderness/ Colorado Roadless Area 0 0% 0 0% 42,600 7%
1.3 - Tabeguache and Roubideau Designated Areas 27,800 5% 27,800 5% 27,800 5% 2.1 - Special Interest Area 60 <1% 60 <1% 60 <1% 2.2 - Research Natural Area 0 0% 0 0% 0 0%

USDA Forest Service
50
Management Area Alternative B
(acres) Alternative B
(percent) Alternative C
(acres) Alternative C
(percent) Alternative D
(acres) Alternative D
(percent) 3.1 - Colorado Roadless Area (that doesn’t overlap another Management Area) 31,100 5% 121,800 21% 2,300 0%
3.2 - Wildlife Management Area 142,600 25% 3,800 1% 179,900 31% 3.2/3.1 - Wildlife Management Area/Colorado Roadless Area 94,300 16% 3,600 1% 75,900 13%
3.3 - Special Management Area 0 0% 0 0% 2,000 0% 3.3/3.1 - Special Management Area/ Colorado Roadless Area 0 0% 0 0% 4,600 1%
4.2 - High-Use Recreation Area 5,300 1% 5,300 1% 5,300 1% 5 - General Forest 277,300 48% 416,000 72% 238,000 41%
Total 578,460 578,500 578,460
Table 22. Suitable timber by alternative, Uncompahgre Plateau Geographic Area [Units reported in acres and as a percentage of the total of the geographic area]
Alternative A (acres)
Alternative A (percent)
Alternative B (acres)
Alternative B (percent)
Alternative C (acres)
Alternative C (percent)
Alternative D (acres)
Alternative D (percent)
172,000 30% 265,000 46% 269,000 47% 257,000 44%
Table 23. Summer recreation opportunity spectrum settings by alternative, Uncompahgre Plateau Geographic Area [Units reported in acres and as a percentage of the total of the geographic area. ROS, recreation opportunity spectrum]
ROS setting Alternative A
(acres) Alternative A
(percent) Alternative B
(acres) Alternative B
(percent) Alternative C
(acres) Alternative C
(percent) Alternative D
(acres) Alternative D
(percent) Primitive 0 0% 0 0% 0 0% 39,800 7% Semi-Primitive Non-Motorized 207,800 36% 202,500 35% 138,100 24% 177,700 31%
Semi-Primitive Motorized 269,700 47% 274,600 48% 307,800 53% 244,900 42%
Roaded Natural 100,400 17% 100,800 17% 132,400 23% 115,500 20%

GMUG National Forests Land Management Plan Draft Environmental Impact Statement: Volume 1
51
ROS setting Alternative A
(acres) Alternative A
(percent) Alternative B
(acres) Alternative B
(percent) Alternative C
(acres) Alternative C
(percent) Alternative D
(acres) Alternative D
(percent) Rural 0 0% 0 0% 0 0% 0 0%
Table 24. Winter recreation opportunity spectrum settings by alternative, Uncompahgre Plateau Geographic Area [Units reported in acres and as a percentage of the total of the geographic area. ROS, recreation opportunity spectrum]
ROS Setting Alternative A
(acres) Alternative A
(percent) Alternative B
(acres) Alternative B
(percent) Alternative C
(acres) Alternative C
(percent) Alternative D
(acres) Alternative D
(percent) Primitive 61,900 11% 61,900 11% 27,800 5% 98,700 17% Semi-Primitive Non-Motorized 138,900 24% 200,700 35% 147,600 26% 243,300 42%
Semi-Primitive Motorized 310,400 54% 254,100 44% 306,000 53% 174,500 30%
Roaded Natural 67,100 12% 61,500 11% 96,700 17% 61,500 11% Rural 0 0% 0 0% 0 0% 0 0%

USDA Forest Service
52
Chapter 3. Affected Environment and Environmental Consequences
Introduction This chapter presents the existing affected environment of the GMUG plan revision area and the potential environmental consequences of continuing to implement the existing forest plan (the no-action alternative) or of implementing the draft revised forest plan alternatives described in chapter 2. This chapter is written at a programmatic scale; it extends across the entire plan area, and the time scale is the next approximately 20–30 years. The Affected Environment section for each resource is based in large part upon the 2018 assessments completed for this planning process, but it includes some relevant updates and new information. The Environmental Consequences sections in this chapter identify reasonable predictions of consequences of the alternative sets of forest plan direction in the GMUG National Forests. However, we do not intend to describe every environmental process or condition. The land management plan provides a programmatic framework that guides site-specific actions but does not authorize, fund, or carry out any project or activity. Because the land management plan does not authorize or mandate any site-specific activities or ground-disturbing actions, there can be no direct effects. There are also no irreversible and irretrievable commitments nor short-term losses of productivity included in the analysis. However, there may be longer-term environmental consequences of managing the GMUG under this programmatic framework, which are disclosed in this chapter. For estimating the environmental consequences at the programmatic forest plan level, the assumption has been made that the kinds of resource management activities allowed under the draft plan direction are reasonably foreseeable future actions to achieve the desired conditions and objectives. However, the specific location, design, and extent of such activities are generally not known at this time. Those decisions are made on a site-specific (project-by-project) basis. More importantly, future site-specific actions will undergo a site-specific review as they are proposed to fulfill the agency’s responsibilities under the National Environmental Policy Act and other laws. This environmental impact statement will provide information that may be incorporated by reference in future site-specific National Environmental Policy Act documents, but this environmental impact statement is not a decision document for future site-specific actions. Therefore, the discussions here refer to the potential for consequences to occur and are in many cases only estimates. The consequences analyses are useful when comparing and evaluating alternatives on a Forestwide basis, but are not intended to be applied directly to specific locations in the GMUG. In addition to assessing environmental consequences of the alternatives upon the forest resources, goods, and services, an analysis is made of cumulative consequences that may occur from actions outside of Federal lands. Cumulative consequences are deemed to occur and are addressed below when those actions outside of GMUG boundaries interact with plan management in the GMUG.

GMUG National Forests Land Management Plan Draft Environmental Impact Statement: Volume 1
53
Within each resource section, the indicators, qualitative or quantitative approaches, and the spatial and temporal boundaries of the area used for the resource analysis are disclosed. Numbers such as acres, miles, and volumes are approximate due to the use of coarse-scale geospatial data; they are variously rounded to indicate approximate certainty. Cumulative effects result from the incremental impact of the action when added to the impacts of other past, present, and reasonably foreseeable future actions regardless of what agency (Federal or non-Federal) or person undertakes such other actions (40 CFR 1508.7). This programmatic cumulative effects analysis addresses cumulative consequences that may occur from actions outside of Federal lands. Cumulative consequences are addressed when those actions outside of the GMUG boundaries interact with plan management in the GMUG. The analysis of cumulative effects provides a larger context in which to evaluate the effects of the forest plan. The cumulative effects on each resource at the forest-plan scale is discussed in terms of general programmatic tendencies toward either improved, sustained, or deteriorating resource conditions.
Structure The draft revised forest plan content is crosswalked to its corresponding section in this chapter in table 25.
Table 25. Crosswalk of draft revised forest plan content and corresponding section of chapter 3 of the draft environmental impact statement
Forest Plan Section Corresponding Section of Chapter 3 of the Draft
Environmental Impact Statement
Part II: Ecological Sustainability Part I: Ecological Resources
Air Quality (AQ) Air Resources Key Ecosystem Characteristics (ECO) Terrestrial Ecosystems Riparian Management Zones and Groundwater-Dependent Ecosystems (RMGD)
Aquatic, Riparian, and Wetland Ecosystems
Aquatic Ecosystems (AQTC) Aquatic, Riparian, and Wetland Ecosystems Invasive Species (IVSP) Invasive Species Fire and Fuels Management (FFM) Terrestrial Ecosystems Native Species Diversity (SPEC) Wildlife and Plant Species Paleontology (PLEO) (no effect; no comparable section) Soil Resources (SOIL) Soil Resources Watersheds and Water Resources (WTR) Watersheds and Water Resources (no single parallel section; incorporated throughout)
Climate
Part III: Multiple Uses and Ecosystem Services of the Forests Part II: Socioeconomic Resources
(no single parallel section; incorporated throughout)
Socioeconomic Setting and Impacts
Cultural and Historic Resources (CHR) Cultural and Historic Resources

USDA Forest Service
54
Forest Plan Section Corresponding Section of Chapter 3 of the Draft
Environmental Impact Statement Designated Trails (DTRL) See Part III: Wilderness, Wild and Scenic Rivers, and
other Designated Areas – National Scenic and Historic Trails and Administratively Designated Trails
Energy and Mineral Resources (ENMI) Energy and Mineral Resources and Geologic Hazards Infrastructure (INFR) (no effect; not included) Lands and Special Uses (LSU) (no effect; not included) Rangelands, Forage, and Grazing (RNG Rangeland Resources Recreation (REC) Recreation Resources Scenery (SCNY) Scenery Resources Scenic Byways (SBWY) Scenery Resources Timber and Other Forest Products (TMBR) Timber Resources Trails (TRLS) Recreation Resources Transportation System (TSTN) Infrastructure Eligible Wild and Scenic Rivers (WSR) See Part III: Wilderness, Wild and Scenic Rivers, and
other Designated Areas - Eligible Wild and Scenic Rivers
Chapter 3. Management Area Direction Part III: Wilderness and Special Areas
and Designations
Wilderness and Areas where Natural Processes Dominate (MA 1)
Wilderness, Wild and Scenic Rivers, and other Designated Areas
Designated Wilderness - MA 1.1, 1.1a, 1.1b, 1.1c (WLDN)
Designated Wilderness
Recommended Wilderness - MA 1.2 (RECWLD) Recommended Wilderness Tabeguache and Roubideau Areas - MA 1.3 (no effect; not included) Special Areas and Designations (MA 2) Wilderness, Wild and Scenic Rivers, and other
Designated Areas Special Interest Areas - MA 2.1 (SIA) Special Interest Areas Research Natural Areas - MA 2.2 (RNA) Research Natural Areas Fossil Ridge Special Recreation Area (MA 2.3) (no comparable section) Natural Areas with Focused Management (MA 3) N/A; header Colorado Roadless Areas - MA 3.1 (CRA) (no effect; not included) Wildlife Management Area - MA 3.2 (WLDF) See Part II: Wildlife and Plant Species Recreation Management Areas (MA 4) See Part II: Recreation Resources Mountain Resorts - MA 4.1 (MTR) See Part II: Recreation Resources Recreation Emphasis Management Areas - MA 4.2 (EMREC)
See Part II: Recreation Resources
General Forest (MA 5) N/A, as the draft environmental impact statement discusses effects to general forest throughout each section
Best Available Scientific Information The 2012 Planning Rule requires the responsible official to use the best available scientific information to inform the development of the proposed plan, including plan components, the monitoring program, and plan decisions. The interdisciplinary team, composed of Forest

GMUG National Forests Land Management Plan Draft Environmental Impact Statement: Volume 1
55
Service resource experts, used a number of resources including peer-reviewed and technical literature, databases and data management systems, modeling tools and approaches, information obtained via participation and attendance at scientific conferences, local information, workshops and collaborations, and information received via public input and feedback. The responsible official and resource specialists who make up the interdisciplinary team considered what is most accurate, reliable, and relevant in their use of the best available information. The best available information for this proposal includes publications listed in the Literature Cited sections of the assessment reports and in the References section of this draft environmental impact statement. Please refer to the assessment reports (USDA Forest Service 2018) for a detailed discussion of data sources, evaluation methods, scales of analysis, data gaps and uncertainties, and related information for each resource area or topic.
Part I. Ecological Resources
Overview A primary goal of the revised forest plan is to provide for ecological integrity and sustainability of the GMUG such that it contributes to the sustainability of social and economic systems, both in the present and into the future. Ecological integrity and sustainability in the GMUG, and the ability of the GMUG to contribute to social, cultural, and economic conditions, are intricately connected and interdependent. This section examines the conditions, trends, and integrity of terrestrial ecosystems; aquatic, riparian, and wetland ecosystems; wildlife and plant species; water resources; soil resources; air resources; and carbon in the plan area, and the environmental consequences of the draft revised forest plan and alternatives upon these resources. Conditions and trends related to climate and the predicted effects of climate change to the GMUG National Forests are also evaluated.
Terrestrial Ecosystems
Affected Environment A detailed description of the affected environment of terrestrial ecosystems is included in the Terrestrial Ecosystems Assessment (USDA Forest Service 2018) and is hereby incorporated by reference. This information is summarized below for the environmental analysis. Other components of the terrestrial ecosystem such as wildlife and plant species and soils are discussed later in this chapter. The Rangeland Resources and Timber Resources sections further describe conditions and trends of rangelands and forested ecosystems in relation to their socioeconomic uses and benefits.
Ecosystem Drivers, Stressors, and Management Influences Drivers and stressors of terrestrial ecosystems in the GMUG include succession, wildfire, insects and disease, invasive species, climate, and climate change. Management influences include vegetation and timber management; livestock grazing; roads and trails; recreation

USDA Forest Service
56
use and development; and mineral, oil, and gas development. These influence factors are described in detail in the terrestrial ecosystems assessment (USDA Forest Service 2018) and are considered in this environmental analysis.
Terrestrial Ecosystems of the Plan Area The assessment identified 15 terrestrial ecosystems in the plan area (table 26). A detailed description of each ecosystem, including species composition and other characteristics, is provided in the terrestrial ecosystem assessment (USDA Forest Service 2018). Terrestrial ecosystem distribution across geographic areas is shown in table 27. Management of the GMUG has especially high potential to influence lodgepole pine, spruce-fir-aspen, alpine uplands, ponderosa pine, warm-dry mixed conifer, and cool-moist mixed conifer types because of the abundance of these ecosystems on the landscape and proportional representation at the plan scale.
Table 26. Terrestrial ecosystems of the plan area Ecosystem
Forests and woodlands
Spruce-fir forest Aspen forest Spruce-fir-aspen forest Lodgepole pine forest Pinyon-juniper woodland Ponderosa pine forest Cool-moist mixed conifer forest Warm-dry mixed conifer forest Bristlecone-limber pine forest
Shrublands Montane shrubland, oak-serviceberry-mountain mahogany Sagebrush shrubland Desert alluvial saltshrub
Grasslands, alpine, other Montane-subalpine grasslands Alpine uplands Rocky slopes, screes, cliffs

GMUG National Forests Land Management Plan Draft Environmental Impact Statement: Volume 1
57
Table 27. Acreage of terrestrial ecosystem distribution within the GMUG boundary and geographic areas [Acreages are approximate and do not sum precisely due to rounding. Estimates include all lands within the GMUG administrative boundary including approximately 2,966,200 acres of National Forest System land and 188,400 acres of other lands (inholdings). Other lands are included here for ecological context only; these lands are not subject to Forest Service management]
Ecosystem Total Acres
Percentage of All Lands within
GMUG Boundary
Grand Mesa
Geographic Area
(acres)
North Fork Valley
Geographic Area
(acres)
Gunnison Basin
Geographic Area
(acres)
San Juans Geographic
Area (acres)
Uncompahgre Plateau Geographic
Area (acres)
Spruce-fir 534,320 17.0 67,604 (21%)
81,869 (16%)
273,284 (20%)
104,038 (29%)
7,525 (1%)
Aspen 460,345 14.6 65,475 (20%)
130,021 (26%)
118,160 (9%)
39,922 (11%)
106,767 (17%)
Spruce-fir-aspen 426,011 13.5 53,640 (17%)
112,420 (22%)
125,698 (9%)
58,759 (16%)
75,496 (12%)
Lodgepole pine 283,713 9.0 0 0 283,332 (21%)
203 (<1%)
178 (<1%)
Pinyon-juniper 107,309 3.4 19,315 (6%)
2,680 (<1%)
351 (<1%)
689 (<1%)
84,273 (14%)
Ponderosa pine 105,003 3.3 0 236 (<1%)
8,974 (<1%)
458 (<1%)
95,336 (15%)
Cool-moist mixed conifer 39,839 1.3 1,682 (<1%)
1,584 (<1%)
33,782 (2%)
1,284 (<1%)
1,507 (<1%)
Warm-dry mixed conifer 19,027 0.6 1,355 (<1%)
610 (<1%)
9,844 (<1%)
1,210 (<1%)
6,008 (1%)
Bristlecone-limber pine 8,172 0.3 0 0 8,172 (<1%) 0 0
Montane shrubland, oak-serviceberry-mountain mahogany
325,209 10.3 60,830 (19%)
83,462 (17%)
11,749 (<1%)
7,297 (2%)
161,871 (26%)
Sagebrush shrubland 95,988 3.0 2,772 (<1%)
5,996 (1%)
63,779 (5%)
350 (<1%)
23,091 (4%)

USDA Forest Service
58
Ecosystem Total Acres
Percentage of All Lands within
GMUG Boundary
Grand Mesa
Geographic Area
(acres)
North Fork Valley
Geographic Area
(acres)
Gunnison Basin
Geographic Area
(acres)
San Juans Geographic
Area (acres)
Uncompahgre Plateau Geographic
Area (acres)
Montane-subalpine grassland 300,430 9.5 32,757
(10%) 43,028 (9%)
154,919 (11%) 28,449 (8%) 41,277
(7%)
Alpine uplands 121,614 3.9 0 2,592 (<1%)
93,576 (7%)
25,446 (7%) 0
Other (rocky slopes, screes, cliffs bare, saltshrub; aquatic, wetland, and riparian1)
324,924 10.3 12,832 (4%)
54,304 (4%)
55,308 (11%) 75,117 (21%) 6,153
(1%)
1 Discussed in the Aquatic, Riparian, and Wetland Ecosystems section. Terrestrial Ecosystem Integrity.

GMUG National Forests Land Management Plan Draft Environmental Impact Statement: Volume 1
59
Key Ecosystem Characteristics
The terrestrial ecosystems assessment (USDA Forest Service 2018) identified six key ecosystem characteristics to assess for terrestrial ecosystem integrity in the GMUG National Forests (table 28). Results are summarized for each characteristic. Please refer to the assessment for a detailed discussion of each characteristic, analysis methods, data sources, gaps, and assumptions.
Table 28. Key ecosystem characteristics for terrestrial ecosystems in the GMUG National Forests
Key ecosystem characteristic Category Data sources used in assessment
Diversity of cover types Composition • FSVegSpatial (USDA Forest Service 2017d) • Potential natural vegetation spatial data for the GMUG
Diversity of structural stages Structure • FSVegSpatial (USDA Forest Service 2017d) • Vegetation Dynamics Development Tool (Beukema et
al. 2003)
Regeneration and recruitment Function
• Forest Inventory and Analysis data (USDA Forest Service 2017e)
• Current forest plan stocking requirements (USDA Forest Service 1983)
• Bioclimate modeling (Rehfeldt et al. 2015)
Landscape disturbances Function
• GMUG fire history and fire origin data spatial data • USDA Forest Service insect and disease aerial
detection surveys and reports • Literature review
Wildlife habitat patch size and connectivity Connectivity FSVegSpatial with FRAGSTATS analysis (McGarigal et al.
2012)
Snags and down woody material Structure
• Common stand exams for the GMUG • Forest Inventory and Analysis data (USDA Forest
Service 2017e) • South central highlands historical range of variability
report (Romme et al. 2009) • Current forest plan requirements (USDA Forest
Service 1983)
Diversity of Cover Types
Current ecosystem coverages were calculated across the plan area and compared to reference conditions based on a potential natural vegetation model classification (table 29). Environmental factors such as soils, slope, aspect, climate, and elevation determine the plant communities that potentially can grow on a given area. The potential natural vegetation type for a given location is the vegetation that would become established there if all successional sequences were completed (i.e., disturbance was absent) under present climatic and edaphic conditions. While it should not be used as an ecosystem to ecosystem comparison, the potential natural vegetation data provide a useful reference for overall landscape heterogeneity in ecosystem cover. The potential natural vegetation reference condition shows a mean percent cover by

USDA Forest Service
60
ecosystem of 6 percent, with a standard deviation of 6 percent (table 29). Our current ecosystem distribution has a mean percent cover of 7 percent, with a standard deviation of 5.5 percent, showing no significant departure from reference conditions in terms of ecosystem diversity across the GMUG. Relative to potential natural vegetation reference conditions, current landscape heterogeneity in ecosystem cover is similar. Future trends in diversity of cover types are difficult to predict. Climate change may cause the loss of some ecosystems due to differential impacts of drought stress across species (see the Climate section). Projected increases in large disturbances such as fire and insects (Vose et al. 2012) could lead to greater homogeneity of cover types across the plan area (see the Landscape Disturbances section for more information).
Table 29. Amount of existing and potential natural vegetation for terrestrial ecosystems in the GMUG National Forests
Ecosystem Area
(total acres)
Area (percentage of GMUG)
Potential Natural
Vegetation (total acres)
Potential Natural
Vegetation (percentage of GMUG)
Spruce-fir 534,320 17 544,095 17 Aspen 460,345 15 275,194 9 Spruce-fir-aspen 426,011 14 683,126 22 Lodgepole pine 283,713 9 78,248 2 Pinyon-juniper 107,309 3 119,809 4 Ponderosa pine 105,003 3 91,031 3 Cool-moist mixed conifer 39,839 1 91,031 3 Warm-dry mixed conifer 19,027 1 184,968 6 Bristlecone-limber pine 8,172 <1 17,403 1 Montane shrubland, oak-serviceberry-mountain mahogany
325,209 10 268,174 9
Sagebrush shrubland 95,988 3 140,171 4 Montane-subalpine grassland 300,430 10 68,713 2 Alpine uplands 121,614 4 72,571 2 Other (aquatic, wetland, riparian, bare, saltshrub, rocky slopes, screes, and cliffs)
324,924 10 Unknown (not modeled)
Unknown (not modeled)
Distribution of Structural Stages
A comparison of existing structural stage conditions to modeled conditions from the Vegetation Dynamics Development Tool (Beukema et al. 2003) varied by ecosystem, though a few consistent patterns emerged (table 30). In all ecosystems, the GMUG has an under-representation of early seral stages on the landscape, paired with an over-representation of mid-seral stages in nearly all ecosystems (while seral stages refer to age, rather than structure, approximate seral stage can be inferred from structural stage and vice-versa). Future trends include the continued aging of stands and associated transitions into later seral stages, and possibly more frequent, extensive, and severe disturbances resulting from the

GMUG National Forests Land Management Plan Draft Environmental Impact Statement: Volume 1
61
effects of climate change (Vose et al. 2012). In combination, this could cause structural stages in ecosystems across the GMUG to move toward natural range of variation conditions, though in most ecosystems, large and severe disturbances will be required to be within natural range of variation for early seral stage proportions. Because of the ongoing spruce-beetle outbreak, spruce-fir and spruce-fir-aspen ecosystems may continue to move closer to natural range of variation for representation of early seral stages, but will likely have lower than natural range of variation percentages in late seral stages.
Table 30. Results of modeling with the Vegetation Dynamics Development Tool and existing conditions for terrestrial ecosystems in the GMUG National Forests [NRV, natural range of variation or modeled reference conditions]
Ecosystem Seral Stage
Vegetation Dynamics
Development Tool
(percent)
Existing condition (percent) Departure
Spruce-fir1 Early 27-32% <1% - Early-mid 20-24% 21% Within NRV Late-mid/Late 43-53% 79% +
Aspen Early 8-14% 1% - Early-mid 23-26% 48% + Late-mid/Late 40-67% 51% Within NRV
Spruce-fir-aspen Early 13-19% <1% - Early-mid 22-29% 24% Within NRV Late-mid/Late 48-65% 76% +
Lodgepole pine Early 22-39% 1% - Early-mid 36-40% 64% + Late-mid/Late 23-38% 35% Within NRV
Pinyon-juniper Early 1-3% 0% - Early-mid 5-11% 42% + Late-mid/Late 86-93% 58% Within NRV
Pinyon-juniper with shrub component
Early 28-51% 0% - Early-mid 39-43% 71% + Late-mid/Late 9-29% 29% Within NRV
Ponderosa pine
Early 14-16% 0% - Early-mid 11-14% 21% + Late-mid/Late 9-22% 41% + Fire-maintained open
48-65% 36% -
Cool-moist mixed conifer Early 13-24% 0% - Early-mid 20-23% 33% + Late-mid/Late 48-70% 67% Within NRV
Warm-dry mixed conifer Early 14-20% 0% - Early-mid 19-20% 23% +

USDA Forest Service
62
Ecosystem Seral Stage
Vegetation Dynamics
Development Tool
(percent)
Existing condition (percent) Departure
Late-mid/Late 51-76% 77% +
Bristlecone-limber pine Early 14-20% 0% - Early-mid 19-20% 47% + Late-mid/Late 51-76% 53% Within NRV
Montane shrubland, oak-serviceberry-mountain mahogany
Early 30-70% 7% - Mid 28-34% 49% + Late 0-36% 44% +
Sagebrush shrubland Montane-subalpine grassland Not modeled Alpine uplands Rocky slopes, screes, cliffs
1 Based on the best available data that preceded the spruce beetle-outbreak. Current actual conditions on the landscape are substantially different than these data.
Regeneration and Recruitment
Based on a comparison of Forest Inventory and Analysis plot data to current forest plan (USDA Forest Service 1983) stocking requirements, current regeneration appears to be functioning normally in the GMUG, exceeding stocking requirements in all ecosystems but ponderosa pine (table 31). When current plan stocking requirements are applied as a reference condition, there is no indication that forested ecosystems in the GMUG are departed from the reference model in terms of regeneration and recruitment, though we lack data for some of these systems. It is possible that localized departures from the natural range of variation in terms of regeneration or recruitment exist, but it is unlikely that the GMUG is currently outside of natural range of variation at a landscape scale. However, bioclimate modeling of the future spatial distribution of suitable habitat for tree species suggests that the GMUG may trend away from natural range of variation for regeneration and recruitment due to the effects of climate change (see the Climate section for more information).
Table 31. Number of seedlings per acre on Forest Inventory and Analysis (FIA) plots, 2002 through 2015 [n/a, not applicable; Source: USDA Forest Service (2017e)]
Ecosystem Number of Plots
Number of Seedlings per acre (species)
Current Forest Plan Stocking Requirement –
Minimum (trees per acre)
Current Forest Plan Stocking Requirement –
Desired (trees per acre)
Spruce-fir 176 593 (subalpine fir), 343 (Engelmann spruce) 150 – 200 360 – 530
Aspen 138 1,265 (aspen) 1,200 1,800

GMUG National Forests Land Management Plan Draft Environmental Impact Statement: Volume 1
63
Ecosystem Number of Plots
Number of Seedlings per acre (species)
Current Forest Plan Stocking Requirement –
Minimum (trees per acre)
Current Forest Plan Stocking Requirement –
Desired (trees per acre)
Lodgepole pine 56 498 (lodgepole pine) 150 – 245 360 – 430 Pinyon-juniper 28 120 (pinyon pine), 3 (juniper) n/a n/a Cool-moist mixed conifer 23 509 (aspen), 114 (Douglas-fir),
36 (blue spruce) n/a n/a
Ponderosa pine 8 0 (ponderosa pine) 190 – 205 240 – 310 Bristlecone-limber pine 2 38 (bristlecone pine), 0 (limber
pine) n/a n/a
Warm-dry mixed conifer 0 No data available n/a n/a
Spruce-fir-aspen 0 No data available n/a n/a
Landscape Disturbances
Predominant landscape disturbances in the GMUG National Forests include wildfire and insect and disease infestations. These natural processes are evaluated as key ecosystem characteristics in the following paragraphs.
Fire
Contemporary conditions for annual area burned and ignitions by ecosystems and geographic areas in the GMUG are summarized in table 32 and table 33. Fire history (area burned) spans 1968 through 2014, and includes all fires greater than 5 acres. Ignitions data from 1970 through 2013 includes both natural and human-caused ignitions. During this period, the GMUG had an average of 49 ignitions per year. The majority of these (65 percent) were lightning-caused, while the remainder were human-caused. Historic and contemporary fire regimes were calculated for ecosystems in the GMUG (table 34). In this context, “historic” refers to a period of several hundred years prior to widespread European settlement of North America in the mid-1800s. During this period the GMUG and surrounding areas were primarily occupied by the Utes, with possible use and occupation by several other Indian tribes and communities. While the influence that American Indian tribes may have had on historic fire regimes is debated, it is generally agreed that potential anthropogenic effects during the pre-settlement time period were minimal in comparison to the known post-settlement human impacts on fire. Results of comparisons between historic and contemporary fire regimes indicate that many ecosystems are outside the natural range of variation for fire regimes, sometimes drastically so. However, in ecosystems like spruce-fir, where historic fire return intervals range from 200 to 500 years, a 34-year timeframe is too short to accurately represent ecosystem dynamics. In general, the lack of stand-replacing fires within the higher-severity, longer-interval fire regimes (e.g., spruce-fir, spruce-fir-aspen, high-elevation lodgepole) following Euro-American settlement could be due to fire suppression and other human-caused effects in the 20th century, or it could be due to the lack of extreme weather conditions needed to initiate stand-replacing fires.

USDA Forest Service
64
However, modeled departure from natural range of variation in the lower-severity, frequent fire ecosystems (i.e., ponderosa pine, pinyon-juniper shrublands, warm-dry mixed-conifer) is much more likely to reflect an actual departure, and in many cases is clearly attributable to human-caused influences. Human-caused influences include both direct fire suppression and indirect effects from land uses that impact fuel structures, including a reduction of fine fuels from livestock grazing.
Table 32. Contemporary ignitions and wildfire area burned by ecosystem in the GMUG National Forests
Ecosystem
Mean Annual Ignitions per Square Mile
(1970 – 2013)
Total Acres Burned
(1968 – 2014)
Mean Annual Acres
Burned (1968 – 2014)
Mean Annual Percentage
Burned (1968 – 2014)
Spruce-fir 0.007 1,412 38 0.01 Aspen 0.007 1,890 51 0.01 Spruce-fir-aspen 0.009 579 16 0.00 Lodgepole pine 0.009 1,131 31 0.01 Pinyon-juniper 0.022 4,565 123 0.13 Pinyon-juniper with shrubs1 0.031 374 10.12 0.07 Ponderosa pine 0.039 9,975 270 0.26 Cool-moist mixed conifer 0.012 144 4 0.01 Warm-dry mixed conifer 0.017 418 11 0.06 Bristlecone-limber pine 0.012 0 0 0 Montane shrubland, oak-serviceberry-mountain mahogany 0.013 14,241 385 0.12
Sagebrush shrubland 0.009 1,346 36 0.04 Montane-subalpine grassland 0.009 8,733 236 0.08 Alpine uplands 0.002 1 <1 <0.01 Other (rocky slopes, screes, cliffs, riparian, wetlands, bare) 0.007 2,934 79.30 0.02
1 Including pinyon-juniper with greater than 30 percent shrub cover.
Table 33. Amount of wildfire area burned by ecosystem and geographic area in the GMUG National Forests, 1968–2014
[GA, geographic area]
Ecosystem
Grand Mesa GA
(acres)
North Fork Valley GA
(acres)
Gunnison Basin GA
(acres)
San Juans
GA (acres)
Uncompahgre Plateau GA
(acres) Spruce-fir 29 234 160 880 109 Aspen 60 2 719 881 227 Spruce-fir-aspen 25 25 310 183 36 Lodgepole pine 0 0 1,131 0 0 Pinyon-juniper 908 15 0 0 3,642

GMUG National Forests Land Management Plan Draft Environmental Impact Statement: Volume 1
65
Ecosystem
Grand Mesa GA
(acres)
North Fork Valley GA
(acres)
Gunnison Basin GA
(acres)
San Juans
GA (acres)
Uncompahgre Plateau GA
(acres) Pinyon-juniper with shrubs 57 0 0 0 317 Ponderosa pine 0 0 466 0 9,510 Cool-moist mixed conifer 0 0 133 0 12 Warm-dry mixed conifer 1 0 350 0 68 Bristlecone-limber pine 0 0 0 0 0 Montane shrubland, oak-serviceberry-mountain mahogany 515 83 10 24 13,609
Sagebrush shrubland 0 5 312 0 1,030 Montane-subalpine grassland 595 476 1,678 23 5,961 Alpine uplands 0 0 0 1 0 Other (rocky slopes, screes, cliffs, riparian, wetlands, bare) 149 28 222 62 2,472
Mean annual acres burned 63 23 148 56 1,000 Mean annual percentage burned 0.019% 0.005% 0.011% 0.016% 0.163% Mean number of annual ignitions 5.12 3.97 13.15 4.59 21.94 Mean number of annual ignitions per square mile 0.010 0.005 0.006 0.008 0.023

USDA Forest Service
66
Table 34. Pre-European settlement fire regimes and contemporary fire conditions for selected ecosystems in the GMUG National Forests [Table does not include ecosystems for which fire is not a typical disturbance, or ecosystems in which fire regimes are not well understood]
Ecosystem
Pre-European Settlement Conditions Contemporary Conditions
(Wildfire 1968 – 2014; Prescribed Fire 1980 – 2015)
Fire Severity
Fire Return Interval (years)
Average Annual Acres
Burned (based on fire return interval)
Average Annual Acres
Burned (wildfire)
Average Annual Acres
Burned (prescribed
fire)
Average Annual Acres
Burned (wildfire and prescribed
fire)
Percentage of Historic Average
Annual Acres Burned (based on fire return
interval)
Additional Fire Needed to Be Within
Natural Range of Variation Levels
(multiple of current)1
Spruce-fir High 200 – 500 1,070 – 2,670 38 324 362 13.6 – 33.8 3.0 – 7.4 Aspen2 Varies Varies Varies 51 333 384 NA NA Spruce-fir-aspen High 150 – 300 1,420 – 2,840 16 146 162 5.7 – 11.4 8.8 – 17.5
Lodgepole pine below 9,500-foot elevation
Mixed 50 – 200 150 – 580 4 162 166 28.6 – 111.1 0.9 – 3.5
Lodgepole pine above 9,500-foot elevation
High 200 – 400 640 – 1,270 27 214 241 18.9 – 37.0 2.7 – 5.3
Pinyon-juniper High 200 –
1,000 90 – 460 123 22 145 31.3 - 166.7 0.6 – 3.2
Pinyon-juniper with shrubs
Low-mixed 35 – 200 70 – 420 10 18 28 6.7 – 40.0 2.5 – 15.0
Ponderosa pine Low 10 – 100 1,050 – 10,500 270 274 544 5.2 – 52.6 1.9 – 19.3
Cool-moist mixed conifer
High-mixed 50 – 200 200 – 800 4 66 70 8.8 – 34.5 2.9 – 11.4
Warm-dry mixed conifer
Low-mixed 20 – 50 380 – 950 11 40 51 5.4 – 13.3 7.5 – 18.6

GMUG National Forests Land Management Plan Draft Environmental Impact Statement: Volume 1
67
Ecosystem
Pre-European Settlement Conditions Contemporary Conditions
(Wildfire 1968 – 2014; Prescribed Fire 1980 – 2015)
Fire Severity
Fire Return Interval (years)
Average Annual Acres
Burned (based on fire return interval)
Average Annual Acres
Burned (wildfire)
Average Annual Acres
Burned (prescribed
fire)
Average Annual Acres
Burned (wildfire and prescribed
fire)
Percentage of Historic Average
Annual Acres Burned (based on fire return
interval)
Additional Fire Needed to Be Within
Natural Range of Variation Levels
(multiple of current)1
Bristlecone-limber pine above 10,000-foot elevation
Low-mixed 9 – 55 50 – 320 0 15 15 4.7 – 30.3 3.3 – 21.3
Montane shrubland, oak-serviceberry-mountain mahogany
High 1 – 100 3,250 – 325,200 385 270 655 0.2 – 20.0 5.0 – 496.5
Sagebrush shrubland High 40 – 240 400 – 2,400 36 375 411 17.2 – 100.0 1.0 – 5.8
Percentage of area of selected ecosystems in GMUG burning/year – wildfire only
Percentage of area of selected ecosystems in GMUG burning/year – wildfire and prescribed fire
Total of selected ecosystems 0.041 0.134
1 “Additional fire needed” is the ratio of pre-settlement average annual acres burned calculated from fire return intervals to contemporary annual acres burned, and represents departure from natural range of variation as a multiplicative factor. For example, aspen forests in the GMUG need at least 8.6, and up to 16 times more, fire than they have had in the last 50 years to be within their natural range of variation.
2 Fire’s role in aspen dominant ecosystems in southwestern Colorado varies widely. See: Tepley and Veblen 2015, Coop et al. 2014, Shinneman et al. 2013, Kulakowski et al. 2004, Smith and Smith 2005, and Romme et al. 2001.

USDA Forest Service
68
Insects and Disease Several insects and diseases significantly influence the structure and composition of the forests in the GMUG (table 35 and table 36). Currently, insects having the greatest impact are spruce beetle (Dendroctonus rufipennis) and Douglas-fir beetle (Dendroctonus pseudotsugae). Other major insects and diseases include western balsam bark beetle (Dryocoetes confuses), western spruce budworm (Christoneura freemani), annosus root disease (caused by Heterobasidion occidentale), Armillaria root disease (Armillaria spp.), lodgepole pine needle casts (Lophodermella concolor and Lophodermella montivaga), dwarf mistletoe (Arceuthobium spp.), and Marssonina leaf blight (Marssonina spp.).
Table 35. Major damage agents detected in aerial survey of the GMUG National Forests [Cumulative acres affected for aspen diseases are from 2000 through 2010. Source: USDA Forest Service (2017b)]
Agent
2015 Acres
Affected 2016 Acres
Affected 1996–2016 Cumulative
Acres Affected
Spruce beetle 100,100 91,000 328,000 Douglas-fir beetle 2,183 3,520 61,400 Mountain pine beetle 600 0 17,120 Western spruce budworm 11,400 16,010 Subalpine fir mortality 11,700 6,700 unknown Fir engraver 5,600 2,861 Lophodermella needle cast 222 2,300 Aspen diseases, including sudden aspen decline, aspen discoloration, aspen defoliation, and aspen dieback and mortality.
35,400 3,890 229,000

GMUG National Forests Land Management Plan Draft Environmental Impact Statement: Volume 1
69
Table 36. Major insects and diseases in the GMUG National Forests
Species Ecosystem Insects Diseases
Engelmann spruce
Spruce-fir; spruce-fir-aspen
Spruce beetle (Dendroctonus rufipennis), western spruce budworm (Choristoneura freemani)
Armillaria spp.
Subalpine fir Spruce-fir; spruce-fir-aspen
Fir engraver beetle (Scolytus ventralis), western balsam bark beetle (Dryocoetes confusus), western spruce budworm
Armillaria spp.
Aspen Aspen; spruce-fir-aspen Aspen borer (Saperda calcarata), bronze aspen borer (Agrilus liragus), western tent caterpillar (Malacosoma californicum), large aspen tortrix (Choristoneura conflictana)
Black target canker (Ceratocystis fimbriata), Cryptosphaeria canker (Cryptosphaeria populina), Cytospora canker (Cytospora chrysosperma), sooty bark canker (Encoelia pruinosa), Marssonina leaf blight (Marssonina spp.), Shepherd’s crook (Venturia macularis), aspen leaf rust (Melampsora medusae), aspen trunk rot (Phellinus tremulae) and white mottled rot (Ganoderma applanatum)
Lodgepole pine Lodgepole pine Mountain pine beetle (Dendroctonus ponderosae), pine engraver beetle (Ips pini)
Lodgepole pine dwarf mistletoe (Arceuthobium americanum), comandra blister rust (Cronartium comandrae), lodgepole pine needle cast (Lophodermella concolor, Lophodermella montivaga)
Pinyon pine Pinyon-juniper Pinyon Ips beetle (Ips confusus) Black stain root disease (Leptographium wagneri var. wageneri), Armillaria spp., pinyon pine dwarf mistletoe (Arceuthobium divaricatum)
Rocky Mountain juniper/Utah juniper
Pinyon-juniper – Juniper true mistletoe (Phoradendron juniperinum), Gymnosporangium stem rust of juniper (Gymnosporangium spp.)
Ponderosa pine Ponderosa pine, warm-dry mixed conifer
Mountain pine beetle, western pine beetle (Dendroctonus brevicomis), pine engraver beetle
Armillaria spp., Annosus (Heterobasidion occidentale), ponderosa pine dwarf mistletoe (Arceuthobium vaginatum ssp. cryptopodium), comandra blister rust, ponderosa pine needlecast (Davisomycella ponderosae)
Douglas-fir Cool-moist mixed conifer; warm-dry mixed conifer
Douglas-fir beetle (Dendroctonus pseudotsugae), fir engraver beetle, western spruce budworm
Armillaria spp., Annosus, Douglas-fir dwarf mistletoe (Arceuthobium douglasii)
Blue spruce Cool-moist mixed conifer Spruce beetle – Bristlecone pine Bristlecone-limber pine Mountain pine beetle White pine blister rust (Cronartium ribicola) Limber pine Bristlecone-limber pine Mountain pine beetle White pine blister rust Gambel oak Montane shrubland, oak-
serviceberry-mountain mahogany
Oak leaf roller (Tortrix spp.), oak looper (Lambdina fiscellaria somniaria)
–
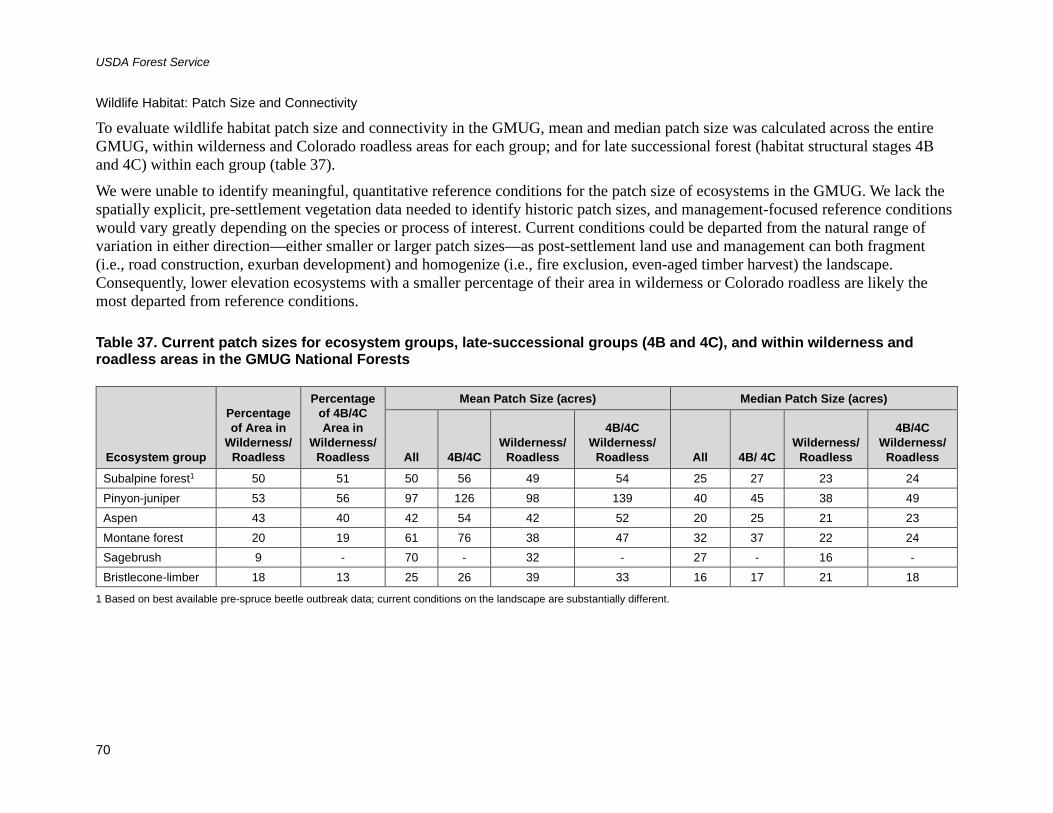
USDA Forest Service
70
Wildlife Habitat: Patch Size and Connectivity
To evaluate wildlife habitat patch size and connectivity in the GMUG, mean and median patch size was calculated across the entire GMUG, within wilderness and Colorado roadless areas for each group; and for late successional forest (habitat structural stages 4B and 4C) within each group (table 37). We were unable to identify meaningful, quantitative reference conditions for the patch size of ecosystems in the GMUG. We lack the spatially explicit, pre-settlement vegetation data needed to identify historic patch sizes, and management-focused reference conditions would vary greatly depending on the species or process of interest. Current conditions could be departed from the natural range of variation in either direction—either smaller or larger patch sizes—as post-settlement land use and management can both fragment (i.e., road construction, exurban development) and homogenize (i.e., fire exclusion, even-aged timber harvest) the landscape. Consequently, lower elevation ecosystems with a smaller percentage of their area in wilderness or Colorado roadless are likely the most departed from reference conditions.
Table 37. Current patch sizes for ecosystem groups, late-successional groups (4B and 4C), and within wilderness and roadless areas in the GMUG National Forests
Ecosystem group
Percentage of Area in
Wilderness/ Roadless
Percentage of 4B/4C Area in
Wilderness/ Roadless
Mean Patch Size (acres) Median Patch Size (acres)
All 4B/4C Wilderness/
Roadless
4B/4C Wilderness/
Roadless All 4B/ 4C Wilderness/
Roadless
4B/4C Wilderness/
Roadless Subalpine forest1 50 51 50 56 49 54 25 27 23 24 Pinyon-juniper 53 56 97 126 98 139 40 45 38 49 Aspen 43 40 42 54 42 52 20 25 21 23 Montane forest 20 19 61 76 38 47 32 37 22 24 Sagebrush 9 - 70 - 32 - 27 - 16 - Bristlecone-limber 18 13 25 26 39 33 16 17 21 18
1 Based on best available pre-spruce beetle outbreak data; current conditions on the landscape are substantially different.

GMUG National Forests Land Management Plan Draft Environmental Impact Statement: Volume 1
71
Snags and Down Woody Material
Snag levels in the GMUG were assessed using Forest Inventory and Analysis plot data (USDA Forest Service 2017e). These data show a trend of increasing snag levels since the spruce beetle outbreak started in the mid-2000s, with recent years showing approximately 25 snags per acre greater than 8 inches in diameter and around 15 snags per acre greater than 10 inches diameter (figure 7).
Figure 7. Snags per acre in the GMUG National Forests from 2002 to 2015, based on Forest Inventory and Analysis plot data
As a result of the recent spruce beetle outbreak and other disturbance agents, the GMUG has a high density of snags, more than the minimum required by the current forest plan (USDA Forest Service 1983) (table 38). In contrast, the available data suggest that downed wood levels are lower than what is required by the current forest plan (table 39). Specifically, the data suggest that forested areas within the GMUG are generally below the 10 to 20 tons per acre retention amount, but well above the 50 linear feet per acre retention amount required by the forest plan.

USDA Forest Service
72
Table 38. Current snag density compared to current forest plan direction [Based on table III-9b in the current forest plan; FIA, Forest Inventory and Analysis data (USDA Forest Service 2017d); dbh, diameter at breast height; N/A, not available]
Forest Type
Mean Snags
per Acre1 (FIA)
Current Forest Plan Minimum Snags per
Acre
Current Forest Plan Minimum Diameter (inches)
South Central Highlands Report (Romme et al. 2009)
Spruce-fir 17.3 0.9 – 2.25 10 Sample old growth stand had 14.2 snags per acre with an average dbh of about 17 inches.
Lodgepole pine 9.3 0.9 – 1.8 8 N/A
Aspen 18.1 1.2 – 3 8
Cavity-nesting species preferred snags that averaged 50 feet tall and 16 inches dbh (range 5 to 25 inches).
Douglas-fir (cool-moist or warm-dry mixed conifer)
6.7 0.9 – 2.25 10 N/A
Ponderosa pine
0 (9
exams) 0.9 – 2.25 10
Minimum density of one 14-inch snag to two 10-inch snags based on current old growth. “In truth, we simply do not know densities or quantities of dead wood in the pre-1870 ponderosa pine forests of the South Central Highlands section.” For wildlife, minimum recommended densities are 1.73 to 5.2 snags per acre (10 to 20 inches), but these may be higher than what existed prior to fire exclusion and higher than necessary to maintain functional communities.
Pinyon-juniper 9.4 – 8 N/A
1 Mean snags/acre is based on snags that are larger than the minimum diameter for that species.

GMUG National Forests Land Management Plan Draft Environmental Impact Statement: Volume 1
73
Table 39. Current down woody material estimates based on Forest Inventory and Analysis (FIA) plot data [Source: USDA Forest Service (2017d)]
Forest Inventory and
Analysis Forest Type
GMUG Ecosystem
Tons per
Acre
Linear Feet per
Acre (10+
inches)
Linear Feet per
Acre (12+
inches)
Current Forest Plan
Recommended (linear feet per
acre)
Current Forest Plan
Recommended (tons per acre)
Aspen Aspen forest 4.87 382.9 187.0 50 (10+ inches) 10–201 Engelmann spruce
Spruce-fir forest 7.64 753.3 521.5 50 (12+ inches) 10–20
Engelmann spruce/subalpine fir
Spruce-fir forest 10.54 1,077.2 683.1 50 (12+ inches) 10–20
Deciduous oak woodland
Montane shrubland, oak-serviceberry-mountain mahogany
1.07 28.9 12.4 – –
Lodgepole pine Lodgepole pine forest 5.29 364.8 163.0 50 (10+ inches) 10–20
Pinyon/juniper woodland
Pinyon-juniper woodland
4.62 347.0 302.1 – –
Douglas-fir Warm-dry mixed conifer forest and cool-moist mixed conifer forest
3.56 310.9 206.9 50 (12+ inches) 10–20
Ponderosa pine Ponderosa pine forest
3.69 227.6 170.5 50 (12+ inches) 10–20
All types 5.58 484.5 293.4 – –
1 “For species dependent on this material for their habitat”; current plan does not specify which ecosystems this standard applies to.
Summary of Ecological Integrity by Ecosystem
This section provides an integrated summary of terrestrial ecosystem integrity based on the preceding evaluation of key ecosystem characteristics. Due to data limitations and other factors, interpretation and conclusions are not possible for all ecosystems, characteristics, or scales, as described below. Where a departure from ecological integrity is indicated and sufficient data are available, we infer whether conditions are due to contemporary management or other factors outside of Forest Service control. An overview of ecological integrity by terrestrial ecosystem, at the plan scale, is provided in table 40. Based on the best available scientific information, ecological departure or potential departure is evident across multiple ecosystems in the GMUG. Potential causes of departure include:

USDA Forest Service
74
• Distribution of structural stages: An underrepresentation of early seral stages in all modeled ecosystems is likely due in part to a lack of fire from suppression activities since the early 1900s. An overrepresentation of mid-seral stages in nearly all modeled ecosystems is predominantly due to large, high-severity fires that burned across the GMUG in the late 1800s. Discrepancies between current and natural range of variation conditions are also partly attributable to limitations in both current conditions data and models used to reconstruct reference conditions.
• Fire regime: In general, the lack of stand-replacing fires within the higher-severity, longer-interval fire regimes (i.e., spruce-fir, spruce-fir-aspen, high-elevation lodgepole) in the plan area after Euro-American settlement could be interpreted as a result of fire suppression and other human-caused effects in the 20th century, or it could be due to a lack of extreme weather conditions needed to initiate stand-replacing fires. Departure in the lower-severity, frequent fire ecosystems (i.e., ponderosa pine, pinyon-juniper shrublands, warm-dry mixed-conifer) are much more likely to reflect an actual departure, and are in many cases clearly attributable to human-caused influences including fire suppression and indirect effects from land uses that impact fuel structures, such as reduction of fine fuels from livestock grazing.
• Insects and disease and wildlife habitat: The potential ecological departure of insects and disease (in particular, the severity and extent of disturbance) and wildlife habitat patch size and connectivity is unknown due to a lack of pre-settlement, reference condition data for these characteristics. Available data suggest that some insects and disease may currently be operating outside of their historic range of variability.
• Snags and down woody material: The large number of snags in the GMUG is a result of the recent spruce beetle outbreak and other disturbance agents. Available data for down woody material suggest that levels are generally lower than the 10 to 20 tons per acre retention amount, but well above the 50 linear feet per acre retention amount specified in the current forest plan.

GMUG National Forests Land Management Plan Draft Environmental Impact Statement: Volume 1
75
Table 40. Ecological integrity of terrestrial ecosystems in the GMUG National Forests [NRV, natural range of variation]
Ecosystem Diversity of Cover Types
Distribution of Structural
Stages Regeneration and
Recruitment Fire Regime Insects and
Disease
Wildlife Habitat: Patch Size and Connectivity
Snags and Down Woody
Material Spruce-fir Within NRV Departed/ At
Risk Within NRV Potentially Departed1 Unknown Unknown Unknown3
Aspen Within NRV Departed/ At Risk
Within NRV Potentially Departed1 Unknown Unknown Unknown3
Spruce-fir-aspen Within NRV Departed/ At Risk
Within NRV Potentially Departed1 Unknown Unknown Unknown3
Lodgepole pine Within NRV Departed/ At Risk
Within NRV Potentially Departed1 Unknown Unknown Unknown3
Pinyon-juniper Within NRV Departed/ At Risk
Within NRV With Shrubs: Departed/At Risk; Without Shrubs:
Potentially Departed
Unknown Unknown Unknown3
Ponderosa pine Within NRV Departed/ At Risk
Within NRV Departed/ At Risk Unknown Unknown Unknown3
Cool-moist mixed conifer
Within NRV Departed/ At Risk
Within NRV Potentially Departed1 Unknown Unknown Unknown3
Warm-dry mixed conifer
Within NRV Departed/ At Risk
Within NRV Departed/ At Risk Unknown Unknown Unknown3
Bristlecone-limber pine
Within NRV Departed/ At Risk
Within NRV Lower Elevations (below 10,000 feet): Departed/ At Risk2
Unknown Unknown Unknown3
Montane shrubland, oak-serviceberry-mountain mahogany
Within NRV Departed/ At Risk
Unknown Departed/ At Risk Unknown Unknown N/A
Sagebrush shrubland
Within NRV Unknown- not modeled
Unknown Potentially Departed1 Unknown Unknown N/A
Montane-subalpine grassland
Within NRV Unknown- not modeled
Unknown Unknown Unknown Unknown N/A
Alpine uplands Within NRV Unknown- not modeled
Unknown Unknown Unknown Unknown N/A

USDA Forest Service
76
Ecosystem Diversity of Cover Types
Distribution of Structural
Stages Regeneration and
Recruitment Fire Regime Insects and
Disease
Wildlife Habitat: Patch Size and Connectivity
Snags and Down Woody
Material Rocky slopes, screes, cliffs, desert alluvial saltshrub
Unknown- not modeled
Unknown- not modeled
Unknown Unknown Unknown Unknown N/A
1 A 34-year sampling timeframe is too short to accurately represent ecosystem dynamics and natural range of variation for these cover types due to their historically longer fire return intervals (200 to 500 years). The lack of stand-replacing fires in these systems could be due either to fire suppression and other human-caused effects in the 20th century, or due to a lack of extreme weather conditions needed to initiate stand-replacing fires. Therefore, we do not have sufficient data for these systems to assess their ecological departure for fire regime.
2 Fire is not a significant disturbance factor in higher elevation (above 10,000 feet) bristlecone-limber pine and therefore was not modeled in the assessment.
3 The best available data indicate snag levels are increasingly higher and downed wood levels are lower than required by the current forest plan. However, because reference conditions are unknown for snags and downed wood levels, the ecological integrity of these characteristics is uncertain.

GMUG National Forests Land Management Plan Draft Environmental Impact Statement: Volume 1
77
Please refer to the Key Ecosystem Characteristics section for more details. The following sections provide further discussion on the ecological integrity of individual terrestrial ecosystems in the GMUG, including their ecological risks and potential future trends associated with climate change. Please refer to the Climate section and table 123 and table 124 for an overview of climate conditions, trends, and potential impacts to terrestrial ecosystems.
Spruce-Fir
Major disturbances in the spruce-fir ecosystem include fire and bark beetle outbreaks. The GMUG is currently experiencing an extensive and severe spruce beetle outbreak, with 328,000 cumulative acres affected by spruce beetle from 1996 through 2016 (note: some of this acreage is within the spruce-fir-aspen ecosystem). Timber harvest treatments are ongoing in spruce-fir forest as part of the Spruce Beetle Epidemic and Aspen Decline Management Response Project (USDA Forest Service 2016). Vegetation modeling indicates that, prior to the spruce beetle outbreak, early seral stages were underrepresented and late seral stages overrepresented for spruce-fir. These conditions are likely due to the lack of fire disturbance during the past century. Change detection efforts to quantify contemporary conditions have not yet been completed, but we expect that late seral stages are now underrepresented in areas heavily affected by spruce beetles in the plan area. Spruce-fir forests are rated as moderately vulnerable to climate change by an expert panel, though the panel has low confidence in that rating (Neely et al. 2011). Secondary impacts of climate change through the influence of warming temperatures and increased droughts on the frequency, extent, and severity of landscape disturbances such as wildfires and insect outbreaks may have significant impacts on spruce-fir forests. Realized impacts of climate change on spruce-fir forest may be mediated by the ability of these species and ecosystems to migrate to higher elevations in response to warming temperatures. Bioclimate models predict that suitable conditions for Engelmann spruce and subalpine fir will be threatened or lost in 47 percent of the area of their current extent by 2060 (USDA Forest Service 2018, terrestrial ecosystems assessment).
Aspen
Early seral aspen is under-represented in the GMUG, with a corresponding over-representation of mid-seral aspen. Aspen forests in the plan area are recently impacted by a variety of diseases, including approximately 229,000 acres affected from 2000 to 2010. Aspen forests are rated as moderately vulnerable to the impacts of climate change, with low confidence (Neely et al. 2011). In particular, aspen forests may experience increased pest (insect and fungal) attacks, drought, and the inability to colonize new areas fast enough to offset lost habitat elsewhere. Livestock grazing may also begin to have a greater impact. The terrestrial ecosystems assessment (USDA Forest Service 2018) indicates that suitable conditions in as much as 93 percent of the aspen forests in the GMUG may eventually be threatened or lost by 2060 due to changes in climate conditions, although this may be offset by expansion of aspen into new areas that become climatically suitable.

USDA Forest Service
78
Overall, this suggests that aspen forests in the GMUG face uncertainty, but may not experience decline. The adjacent Rio Grande National Forest has experienced a substantial increase in aspen forests due to large spruce tree die-off, balancing against the effects of fire exclusion, which often favors conifers over aspen. Aspen is an early colonizer of areas where forests have died due to fire or insect outbreaks, both of which are somewhat difficult to predict at the plan scale (USDA Forest Service 2018, terrestrial ecosystems assessment).
Spruce-Fir-Aspen
Management of the GMUG has especially high potential to influence the ecological integrity of the spruce-fir-aspen ecosystem based on its abundance on the landscape and proportional representation at the plan scale. Like spruce-fir forests, this ecosystem is currently being impacted by a large-scale spruce beetle outbreak. Current conditions in spruce-fir-aspen in the GMUG are fairly homogeneous in terms of age, size class, and stand density, as a result of large-scale fires that burned through these systems in the 1850s and again from 1878 to 1879, followed by a century of minimal fire. These conditions indicate a departure from ecological integrity for this cover type. Spruce-fir and aspen forests are both rated as moderately vulnerable to climate change with low confidence (Neely et al. 2011). Like spruce-fir forests, actual impacts of climate change may be mediated by the ability of these component species to move upward in elevation or to cooler and wetter aspects. Bioclimate models predict that suitable conditions for Engelmann spruce and subalpine fir and aspen will be threatened or lost in 56 percent of the area of their current extent by 2060 (USDA Forest Service 2018, terrestrial ecosystems assessment).
Lodgepole Pine
Management of the GMUG has especially high potential to influence the ecological integrity of lodgepole pine based on its abundance on the landscape and proportional representation at the plan scale. Similar to other forest types in the GMUG, early-mid successional stages are somewhat over-represented in this cover type. Low-elevation lodgepole pine forests are within reference conditions in terms of the amount of fire, but higher-elevation (9,500 feet or greater) lodgepole pine forests have from 20 to 40 percent as much fire in contemporary times as expected for this cover type, indicating a potential departure from ecological integrity. Major insects and pathogens that affect this ecosystem include mountain pine beetle and dwarf mistletoe. While mountain pine beetle has received a lot of attention in the Rocky Mountain Region, the GMUG has not experienced large outbreaks of mountain pine beetle like other parts of Colorado, though a small outbreak was detected in the Gunnison Basin Geographic Area in 2019. The GMUG initiated a rapid management response in 2020 to prevent this outbreak from spreading. Approximately 17,000 acres have been affected by mountain pine beetle in the last 20 years. Dwarf mistletoe is a naturally occurring parasite that impacts forest health, but is also habitat and part of an important ecosystem process. Many wildlife species use mistletoe brooms for nesting, resting, and hiding cover. Mistletoe is estimated to impact up to three-fourths of the lodgepole pine stands north of Highway 50 in the Gunnison Basin, to varying degrees (Haines 2017). Lodgepole stands with mistletoe

GMUG National Forests Land Management Plan Draft Environmental Impact Statement: Volume 1
79
infestations are more susceptible to stand-replacing wildfire. Dwarf mistletoes are regulated by stand-replacing fire, so lack of recent fire has likely led to increased spread and intensification of the parasite, facilitating conditions that may be outside of their natural range of variation (USDA Forest Service 2018, terrestrial ecosystems assessment). Lodgepole pine forests are predicted to be moderately vulnerable to climate change (with medium confidence) (Neely et al. 2011). Bioclimate models suggest that this ecosystem may be unable to persist in its current range, with suitable conditions for lodgepole pine forests predicted to be threatened or lost by 2060 throughout 99 percent of its current extent. The ability of lodgepole pine to expand to new areas in the GMUG as those become climatically suitable may be crucial for its long-term persistence on the landscape (USDA Forest Service 2018, terrestrial ecosystems assessment).
Pinyon-Juniper
Pinyon-juniper woodlands in the GMUG have an under-representation of early seral stages and over-representation of mid-seral stages, indicating a departure from ecological integrity. This lower-elevation system is highly accessible to humans, and therefore has seen significant influences related to livestock grazing, tree removal, fire suppression, and development. Heavy, year-round livestock grazing started occurring in the late 1800s throughout pinyon-juniper systems and persisted until the mid-1950s. This contributed to the current tree-dominated conditions by removing competing understory species and allowing the woody overstory species to prosper (Manier et al. 2003). Livestock grazing also led to tree removal (chaining) for better livestock forage, and reseeding with non-native crested wheatgrass, which caused significant fragmentation to pinyon and juniper systems (Knight et al. 2000) and unknown ecological consequences. Second only to ponderosa pine, pinyon-juniper ecosystems have a substantial portion (42 percent) rated as being in “fair” rangeland condition (see Rangeland Conditions and Trends section). Climate change may cause pinyon-juniper woodlands to shift toward juniper dominance (CNHP 2015) (also see table 124). Pinyon pine trees in particular are expected to be sensitive to secondary impacts of climate change on frequency and severity of landscape disturbances as we have seen past evidence of drought-driven disturbances affecting this species in the GMUG. For example, the drought in 2002 enabled the ips beetle to attack large tracts of pinyon pine in the western part of the GMUG in 2003 (USDA Forest Service 2004). Bioclimate models for pinyon-juniper persistence are relatively positive, with suitable conditions for all component species predicted to be threatened or lost in just 4 percent of their current extent. However, some individual component species are predicted to be threatened or lost in greater proportions, suggesting that we may see shifts in dominance to pinyon pine, Rocky Mountain juniper, and Utah juniper in different parts of this ecosystem (USDA Forest Service 2018, terrestrial ecosystems assessment).
Ponderosa Pine
Management of the GMUG has especially high potential to influence the ecological integrity of the ponderosa pine ecosystem based on its abundance on the landscape and proportional representation at the plan scale. This forest type has an underrepresentation of early seral

USDA Forest Service
80
and late fire-maintained open stages, and a corresponding overrepresentation of mid-seral stages, indicating a departure from ecological integrity. Three main human-caused influences are responsible for dramatic alterations in the structure and function of ponderosa pine forest ecosystems since Euro-American settlement: livestock grazing, logging, and fire exclusion (Covington et al. 1997; Romme et al. 2009). These factors have led to ponderosa pine forests that have a relatively uniform and dense stand structure, with most trees small to medium-size and from 70 to 100 years old. This structure is associated with a high vulnerability to outbreaks of insects and disease, risk of high-severity wildfire, and concerns about regeneration (Romme et al. 2009). In addition to fire, insects and disease play a role in the dynamics of this ecosystem. Notably, a mountain pine beetle (Dendroctonus ponderosae) outbreak occurred on the Uncompahgre Plateau in the 1980s. Dwarf mistletoe (Arceuthobium vaginatum ssp. cryptopodum) and root disease also operate in this ecosystem. In the GMUG, the ponderosa pine ecosystem is one of the most heavily influenced and actively managed by humans. Relative to other terrestrial ecosystems in the national forests, ponderosa pine is heavily roaded, with 12.1 percent of the ecosystem area impacted by roads (third highest in the plan area after sagebrush shrublands and montane-subalpine grasslands). Roads are an ecosystem stressor that can have a major impact on landscape patterns and processes. Further, approximately half of the 25,000 acres of invasive species inventoried in the GMUG are found in either ponderosa pine or montane-subalpine grassland ecosystems (see the Invasive Plants section). Ponderosa pine forests also have the highest extent of past vegetation management of any ecosystem in the GMUG. This is due in part to recent Uncompahgre Plateau Collaborative Forest Landscape Restoration Program projects (USDA Forest Service 2010a), which are beneficial for this ecosystem over the long term. Ponderosa pine also has the greatest percentage (49 percent) of rangeland that is in “fair” condition (see the Rangeland Conditions and Trends section). Ponderosa pine is predicted to show moderate increases (with low confidence) due to climate change (Neely et al. 2011). Bioclimate models suggest that these potential increases will depend on the ability of ponderosa pine to expand to new areas as they become climatically suitable, as suitable conditions for ponderosa pine forest are predicted to be threatened or lost throughout 97 percent of their current extent of by 2060 (USDA Forest Service 2018, terrestrial ecosystems assessment).
Cool-Moist Mixed Conifer
Management of the GMUG has especially high potential to influence the ecological integrity of the cool-moist mixed conifer ecosystem based on its abundance on the landscape and proportional representation at the plan scale. The primary disturbance in cool-moist mixed conifer forests is infrequent, stand-replacing fires, with occasional small and less severe fires. Root disease and insect outbreaks, such as Douglas-fir beetle (Dendroctonus pseudotsugae) outbreaks, also play a role in stand dynamics. Because of their mixed composition, these stands are unlikely to experience insect outbreaks, but they may be affected by outbreaks that initiate in nearby homogeneous stands, or by endemic levels of insects.

GMUG National Forests Land Management Plan Draft Environmental Impact Statement: Volume 1
81
Like many forested ecosystems in the GMUG National Forests, this system has an underrepresentation of early seral and overrepresentation of mid-seral stages, indicating a departure from ecological integrity. These conditions are likely due, at least in part, to fire suppression throughout the 20th century. Douglas-fir forests are predicted to be highly vulnerable (with low confidence) to climate change (Neely et al. 2011). Bioclimate modeling of future conditions suggests that this ecosystem may shift away from Douglas-fir dominance, with suitable conditions for this species predicted to be threatened or lost in 86 percent of the current extent of cool-moist mixed conifer forests by 2060. The degree of climate change impacts on this ecosystem may be either amplified by secondary impacts of warming temperatures on disturbance events, or mitigated by the ability of component species to expand to new areas in the GMUG as those become climatically suitable (USDA Forest Service 2018, terrestrial ecosystems assessment).
Warm-Dry Mixed Conifer
Management of the GMUG has especially high potential to influence the ecological integrity of the warm-dry mixed conifer ecosystem based on its abundance on the landscape and proportional representation at the plan scale. This ecosystem has an under-representation of early seral stages and uncharacteristically low amounts of fire in the past 50 years, with the amount of contemporary average annual acres burned about 5 to 13 percent of reference conditions. These conditions indicate a departure from ecological integrity for this cover type. General patterns of change post-settlement are well documented in stand structure within the warm-dry mixed conifer forest type in the Western United States (White and Vankat 1993; Mast and Wolf 2004). Specifically, there has been a shift in species composition and abundance to shade-tolerant species such as white fir and Douglas-fir at the expense of the shade-intolerant but more fire-resistant ponderosa pine. Douglas-fir forests are predicted to be highly vulnerable (with low confidence) to climate change, while ponderosa pine forests are expected to show moderate increases (also with low confidence) (Neely et al. 2011). Similar to cool-moist mixed conifer, bioclimate modeling of future conditions suggests that this ecosystem may shift away from Douglas-fir dominance, with suitable conditions predicted to be threatened or lost in 85 percent of its current extent by 2060. The degree of climate change impacts on this ecosystem may be either amplified by secondary impacts of warming temperatures on disturbance events or mitigated by the ability of component species to expand to new areas in the GMUG as they become climatically suitable (USDA Forest Service 2018, terrestrial ecosystems assessment).
Bristlecone-Limber Pine
Bristlecone-limber pine forest is a small component of the GMUG National Forests, occupying approximately 8,200 acres (0.3 percent), with its entire range in the Gunnison Basin Geographic Area. Fire frequency in this ecosystem is highly variable, and insect and disease information for this cover type is minimal. Bristlecone and limber pine are both subject to mountain pine beetle-caused mortality, though the small extent of this ecosystem
USDA Forest Service
82
in the GMUG makes an outbreak in the plan area unlikely. White pine blister rust is another potential threat to these species, though it is not yet known to occur in the GMUG. Bristlecone pine forests are predicted to be highly vulnerable (with low confidence) to climate change (Neely et al. 2011) (also see table 124) Due to its limited distribution and tendency to recruit very slowly, bristlecone pine forest may be unable to colonize new areas in the future even if the areas are climatically suitable. Warmer conditions and more frequent drought may also increase the susceptibility of trees to white pine blister rust. Bioclimate models indicate that suitable conditions will be threatened or lost by 2060 throughout 88 percent of the current extent of bristlecone pine and 25 percent of the current extent of limber pine (USDA Forest Service 2018, terrestrial ecosystems assessment). As most of the bristlecone-limber forests in the GMUG are dominated by bristlecone pine, and its current extent is small, this supports the Neely et al. (2011) assessment of high vulnerability of these ecosystems to climate change.
Montane Shrubland, Oak-Serviceberry-Mountain Mahogany
Fire is a major driver in this ecosystem and creates a mosaic of dense shrub clusters and openings dominated by herbaceous species. Mid and late seral stages are strongly over-represented relative to modeled reference conditions in montane shrublands, suggesting that this ecosystem is ecologically departed. The most likely cause of departure is fire suppression during the 20th century, supported by a comparison of contemporary fire in the GMUG with pre-settlement fire return intervals. The Gunnison Basin Climate Change Vulnerability Analysis (Neely et al. 2011) suggests that this vegetation type may be stable under climate change scenarios, or even experience a moderate increase in its range. Bioclimate models for Gambel oak under projected climate conditions support this prediction, with suitable conditions for Gambel oak-dominant shrublands projected to be lost or threatened habitat by 2060 throughout only 7 percent of its current extent (USDA Forest Service 2018, terrestrial ecosystems assessment).
Sagebrush Shrubland
Like most non-forested ecosystems in the GMUG, the ecological integrity of sagebrush shrubland is uncertain due to limited information on reference conditions for key ecosystem characteristics. Historically, fire in sagebrush systems reduces decadent sagebrush stands, promotes understory growth and nutrient cycling, and creates a mosaic of sagebrush structures and community types across a broad landscape. However, pre-settlement stand-replacing fire frequency in sagebrush vegetation types is highly debated and is likely dependent on fuels structure (i.e., open sagebrush versus sagebrush-woodland ecotones) and the species of sagebrush (Baker 2006; Wright et al. 1979; and Welch and Criddle 2003). In the plan area, the sagebrush ecosystem has been affected over the last 100 years or more by livestock grazing, which is an important ecosystem service critical to ranching livelihoods. Additionally, past management actions were implemented to reduce shrub cover and increase grass and forb production. This includes brush mowing, prescribed burning, and chemical treatments. These past actions have influenced current conditions and trends in the sagebrush landscape.

GMUG National Forests Land Management Plan Draft Environmental Impact Statement: Volume 1
83
Non-native invasive plants are another risk factor in this ecosystem. Species such as cheatgrass, yellow toadflax, and Canada thistle have the potential to spread and increase, degrading habitat quality for sagebrush-dependent species and causing reduced ecosystem resiliency and resistance. Infrastructure such as roads and powerline corridors are vectors for weed transmission. Wildlife, especially big game animals, and livestock may also facilitate weed transmission. Weed treatment activities are ongoing in the plan area and will continue to be needed to address this risk factor. See the Invasive Plants section for more information on these species and their influence in the plan area. Roads and livestock have contributed to soil erosion, compaction, and loss; and reduced hydrologic function in riparian and wet meadow sites in the sagebrush ecosystem. In collaboration with partners and grazing permittees, the GMUG has successfully implemented erosion control restoration actions over the past decade. Due to restoration efforts and collaboration with partners across land ownership boundaries, soil condition and hydrologic function are improving. The Gunnison Basin Climate Change Vulnerability Assessment (Neely et al. 2011) evaluated the relative vulnerability of two distinct sagebrush ecosystem types, montane sagebrush and low-elevation sagebrush. Montane sagebrush received a vulnerability score of “moderate increase,” and low-elevation sagebrush received a score of “presumed stable.” However, several sagebrush-dependent species were found to be highly or extremely vulnerable to the potential effects of climate change. The predicted effects of a changing climate to the sagebrush landscape include increased severity of drought, proliferation of invasive species (especially cheatgrass), dieback of Wyoming sagebrush, montane sagebrush shifting upward in elevation, reduced productivity at drier sites, aspen mortality, and altered succession. In general, the Wyoming sagebrush occupies more xeric (drier) sites and is likely to experience more change than the mesic (moister) mountain big sagebrush sites (Rondeau et al. 2016).
Montane-Subalpine Grassland
Like most non-forested ecosystems in the GMUG, the ecological integrity of montane-subalpine grassland is uncertain due to limited information on reference conditions for key ecosystem characteristics. A variety of drivers including topography, geology, soil, climate, and disturbances (fire, mass movement, snow) are responsible for the occurrence and interspersion of meadows. Prior to Euro-American settlement, natural drivers of these grasslands were native ungulate herbivory and wildfire. Domestic livestock use and fire suppression in the past century have altered the character of these natural drivers; however, we do not have sufficient information on pre-settlement reference conditions to assess their potential departure. Roads and trails are a major influence in this ecosystem in the plan area, directly affecting almost 13 percent of the total area of montane and subalpine grasslands. We do not have site-specific data, but known deleterious effects of roads in general include creating barriers to species mobility, acting as corridors for non-native and edge-adapted species, and increasing human access to interior habitats (Baker and Knight 2000). Roads also impact natural sediment and hydrologic regimes. Roads intercept rainfall on the road surface and subsurface water moving down the hillslope, concentrate flows on the road surface or adjacent ditches, and divert water from natural flow paths. Such conditions can alter meadow hydrology, sometimes resulting in drying out of meadows or soil loss.

USDA Forest Service
84
Invasive species are another known stressor in this ecosystem. Approximately half of the 25,000 acres of invasive species inventoried in the GMUG occur in either montane-subalpine grasslands or ponderosa pine ecosystems. Invasive species can have serious ecological impacts, including reduction of biodiversity, elimination of habitat and forage for wildlife and livestock, and alteration of fire regimes. See the Invasive Plants section for more information regarding invasive species. Montane-subalpine grasslands play an important role in carbon sequestration (especially subalpine meadows) and provide flowering plants for pollinator species such as the western bumblebee, forage production for wildlife and livestock, and habitat for a variety of small mammals. The role of mesic meadows in carbon sequestration cannot be understated, and management actions that result in increased carbon sequestration in the long term provide opportunities for climate change mitigation. See the Carbon Stocks section for more information.
Alpine Uplands; Alpine Rocky Slopes, Screes, Cliffs
Management of the GMUG has especially high potential to influence the integrity of the alpine uplands ecosystem based on its abundance on the landscape and proportional representation at the plan scale. Due to limitations of geospatial data, we are unable to estimate with confidence the extent of alpine talus, scree, rocky slopes, and cliffs in the plan area. Further, like most other non-forested ecosystems in the GMUG, the ecological integrity of this cover type is uncertain due to limited information on reference conditions. The majority of alpine areas within the GMUG are currently designated as either wilderness or Colorado roadless areas and have, therefore, experienced less human disturbance than other ecosystems. However, alpine environments are highly susceptible to soil disturbance (compaction, erosion, loss) and are slow to revegetate due to a limited growing season, strong winds, drought, and high evaporation rates. Because of their susceptibility and ever-increasing visitor levels in the GMUG, recreation is one of the biggest stressors to alpine ecosystems. In particular, alpine areas that have remnant roads from historic mining development now see high levels of off-highway vehicle use (some of it illegal off-trail use) with substantial impacts to soil and vegetation. Additionally, because of their susceptibility to soil disturbance and slow rates of revegetation, impacts from historic disturbance (including mining activities and heavy sheep grazing from the late 1800s to mid-1900s) may still be evident in alpine ecosystems. Climate change is another major stressor in alpine ecosystems. Both xeric and mesic alpine uplands are considered to be highly vulnerable to climate change-related impacts (Neely et al. 2011) (also see table 124). (Alpine areas are likely to be highly susceptible to rising temperatures and a shorter duration of snow cover, with a resulting longer growing season that may allow shrubs and trees to encroach. Range shifts in response to warmer temperatures may be impossible for alpine species, as they have no higher-elevation areas to which they can migrate (USDA Forest Service 2018, terrestrial ecosystems assessment).
Desert Alluvial Saltshrub
The desert alluvial saltshrub ecosystem comprises approximately 331 acres (about 0.01 percent) of the GMUG, making it very rare in the GMUG, though it is quite prevalent

GMUG National Forests Land Management Plan Draft Environmental Impact Statement: Volume 1
85
in lower elevations within the context area. Like most non-forested ecosystems in the GMUG, the ecological integrity of this cover type is uncertain due to limited information on reference conditions. Livestock grazing has had the most impact on this ecosystem since Euro-American settlement, altering the dominant vegetation toward non-palatable species. Because of the typically sparse vegetation cover, fires in this ecosystem were historically rare (West and Young 2000). Recently, fire has become more prevalent in this ecosystem across the Western United States due to the establishment of non-native annual grasses, primarily cheatgrass. Areas that have experienced livestock grazing, increases in non-native annuals, and increases in fire frequency are generally outside their historic range of variability. See the Invasive Plants section for more information.
Sustainability of Terrestrial Ecosystems
Evaluation of key ecosystem characteristics for terrestrial ecosystems indicates the following:
• Due to their relative abundance within the plan area, combined with relative rarity within the context area, GMUG management has high potential for influence in lodgepole pine, spruce-fir-aspen, alpine uplands, ponderosa pine, warm-dry mixed conifer, and cool-moist mixed conifer ecosystems.
• The GMUG maintains a diversity of ecosystem types within their natural range of variation, though the distribution of structural stages within these ecosystems is most likely outside of natural range of variation. The current distribution of structural stages includes an under-representation of early seral stages, paired with an over-representation of mid-seral stages in most ecosystems.
• This atypical distribution of structural stages can be attributed to widespread fires in the late 1800s, followed by more than a century of fire exclusion. However, the lack of stand-replacing fires within forest types with higher-severity, longer-interval fire regimes following Euro-American settlement could be due to the lack of extreme weather conditions needed to initiate stand replacing fires in addition to or instead of fire suppression. Lack of recent fire in frequent-fire ecosystems is more clearly attributable to human influence.
• Bioclimate models for 14 tree species within the plan area suggest that climatic conditions will not be suitable in the future for many species within a large portion of their current range.
• Landscape disturbances, including fire and insects and disease, may already be operating outside of their historic range of variability, and may continue to do so.
• It is unclear whether habitat patch sizes are within natural range of variation, and this would be difficult to ascertain even with further research.
• Stand exam and Forest Inventory and Analysis plot data suggest an increasing trend in snag levels, with about fifteen 10-inch or larger snags per acre, and twenty-five 8-inch or larger snags per acre in recent years, well above the required minimums in the current forest plan (USDA Forest Service 1983). Data for down woody material suggest that levels are generally lower than the 10 to 20 tons per acre retention amount in the current

USDA Forest Service
86
forest plan, but well above the 50 linear feet per acre retention amount required in the current plan.
• In general, we have less information about key characteristics and ecosystem integrity for non-forested ecosystems, including shrublands, grasslands, and alpine uplands.
Environmental Consequences
Analysis Framework
Key Issues
Key issues highlighted by the public for terrestrial ecosystems in the GMUG include two ecological stressors that are of growing concern in the plan area: climate change and recreation. A comprehensive analysis of climate change and its potential impacts in the GMUG is beyond the scope of this document, but some possible implications for forest plan revision are addressed below in the Assumptions and Information Gaps section, and in more detail in appendix G of the Terrestrial Ecosystem Assessment. Climate change is also integrated into ST-Sim models used in this analysis through assumptions made about the impact of a continued warming and drying trend on the amount of fire anticipated in the GMUG. It is anticipated that recreation use in the GMUG will continue to grow at a rapid rate. While this section does not explicitly analyze impacts of that rapid growth, two plan components (FW-STND-REC-06 and 07) require management response to unacceptable biophysical (ecological) impacts of recreation. Effects of these plan components and others designed to mitigate undesirable ecological impacts of recreation use are analyzed as part of the diversity of cover types indicator. The ability of the proposed action to sufficiently mitigate impacts of growing recreation in the GMUG will largely depend on 1) the rate of increase of recreation and 2) budget and personnel available to manage recreation. Public comments also noted concerns about the effect of increasing the area of the suitable timber base under the proposed action as well as questions about the impact of exempting wildland-urban interface from guidelines on retention of snags and down woody material. Effects of the wildland-urban-interface exemption are analyzed as part of the snags and down woody material indicator. Effects of the increase in area of the suitable timber base are not considered to be significant and are not analyzed here. Lack of a suitable timber designation has not been a major constraint on past management activities in the GMUG as many timber treatments meet multiple objectives and thus are permissible outside of the suitable timber base. However, effects of an increase in projected timber sale volumes are considered significant and are analyzed as part of the distribution of structural stages indicator.
Indicators
As required by the 2012 Planning Rule, the revised plan uses the concept of ecological integrity as a guiding framework to plan for social, ecological, and economic sustainability. The rule defines ecological integrity as the quality or condition of an ecosystem when its

GMUG National Forests Land Management Plan Draft Environmental Impact Statement: Volume 1
87
dominant ecological characteristics (for example, composition, structure, function, and connectivity) that act to maintain that quality or condition occur within the natural range of variation and can withstand and recover from most perturbations imposed by natural environmental dynamics or human influence (36 CFR 219.19). Natural range of variation (also commonly referred to as historical range of variation) is the variation of ecological characteristics and processes over scales of time and space that are appropriate for a given management application (Landres et al. 1999; Keane et al. 2009). In the Western United States, natural range of variation is typically derived from pre-European settlement conditions. While this definition of ecological integrity is explicitly tied to natural range of variation, the planning rule also makes allowances for the fact that in some cases, systems may no longer be capable of sustaining key ecosystem characteristics identified as common in the past based upon likely future environmental conditions (e.g., a warming climate). As such, desired conditions for terrestrial ecosystems in the revised plan were developed on the basis of natural range of variation, but in some cases vary from natural range of variation to account for anticipated future conditions. Overall ecological integrity forms the basis for the comparison of alternatives for terrestrial ecosystems. How well alternatives maintain ecological integrity is measured by how well they achieve the desired conditions for key ecosystem characteristics based on indicators selected for analysis. Departed current condition from the desired condition, or a trend toward higher departure, suggests that ecological integrity is at risk. Specific key ecosystem characteristics representing ecological function, composition, structure, and connectivity have been identified and serve as indicators for describing the affected environment and evaluating differences among the alternatives. These indicators are also chosen because they are measurable (quantitatively or qualitatively), there are data or means to distinguish and describe them, and they vary by alternative. Differences among the alternatives may be expressed as both qualitative and quantitative, and the estimated changes in key ecosystem characteristics over time serve as the basis for evaluation of ecological integrity. Some key ecosystem characteristics are applicable in some cases but not others; some are easily quantifiable in some cases but not others. The indicators discussed in this section of the environmental impact statement for terrestrial ecosystems are listed in table 41. (Wildlife habitat patch size and connectivity is noted here but will be analyzed in the Wildlife section). These are indicators of integrity, not an exhaustive list of all factors that may impact integrity or that may vary among alternatives.
Table 41. Key ecosystem characteristics and indicators used in analysis
Key ecosystem characteristic Category Indicator(s) Diversity of cover types Composition Percent area by different cover types
Distribution of structural stages Structure Projected structural stages from ST-SIM modeling
Regeneration and recruitment Function Stocking standards Landscape disturbances Function Acres of prescribed fire Wildlife habitat patch size and connectivity Connectivity Wildlife management areas

USDA Forest Service
88
Key ecosystem characteristic Category Indicator(s) Snags and down woody material Structure Snag and coarse woody debris guidelines
Diversity of cover types is a key ecosystem characteristic that contributes to ecological integrity. A heterogeneous landscape with a diversity of species is an important adaptation strategy for both resistance and resilience to the impacts of climate change that can help maintain long-term integrity of ecosystems across the plan area (Lindenmayer and Noss 2006; Thompson et al. 2009; Vose et al. 2012). Distribution of structural stages can be used to infer wildlife habitat, potential disturbance risk, and time since past disturbances. Although age of vegetation is not directly linked to structural stage, relative successional stages are implied by structure. Like diversity of cover types, distribution of structural stages is a key ecosystem characteristic that promotes resistance, resilience, and adaptation to the impacts of climate change and can help maintain ecosystem integrity (Vose et al. 2012, Thompson et al. 2009). Regeneration and recruitment of seedlings and saplings is a key ecosystem characteristic that is fundamental to the persistence of existing ecosystems on the landscape. Given that disturbance and plant mortality is a natural and recurring process in all terrestrial ecosystems in the GMUG, regeneration and recruitment within ecosystems is a requirement of their ability to perpetuate on the landscape. A landscape disturbance is defined as any relatively discrete event in space or time that disrupts ecosystem, community, or population structure, and changes resources, substrate, or the physical environment (White and Pickett 1985). Major disturbances including fire, insects, and disease have historically acted as ecosystem drivers in the GMUG, but all have the potential to become stressors in the event of a change in their characteristic disturbance regimes. A disturbance regime describes a typical pattern of disturbances over space and time, and is characterized by extent, frequency, and severity. One indicator of ecosystem integrity is whether disturbance processes are occurring with the same frequency, severity, and extent as they did historically; i.e., is the disturbance regime within the natural range of variation? Habitat connectivity is the degree to which the landscape facilitates animal movement and other ecological flows, and is determined by patch size and shape and spatial arrangement of patches. Patch size and habitat connectivity are key ecosystem characteristics of crucial importance to wildlife. The ability of individual organisms to move and interact throughout a landscape can aid a species and its survival in general, but is especially crucial in a changing climate. Movement can also help maintain genetic diversity within a species. This key characteristic is analyzed in the Wildlife section of this document. Snags and down woody material are essential for ecological integrity. They serve a variety of purposes, such as providing valuable wildlife habitat and supporting nutrient cycling. Snags and down woody material increase stand structural complexity, creating microclimates and microhabitats that support distinct and diverse wildlife assemblages (e.g., beetles and other arthropods: Heyborne et al. 2003, Buddle et al. 2006, Jeffries et al. 2006, Johansson et al. 2007; amphibians: Welsh 1990; birds: Sallabanks et al. 2006; and mammals: Sullivan et al. 2000, 2001, Fisher and Wilkinson 2005, Sullivan et al. 2007). Snags are crucial habitat for cavity nesting species such as woodpeckers, small forest owls, bats, and

GMUG National Forests Land Management Plan Draft Environmental Impact Statement: Volume 1
89
small mammals. Down woody material is important for water quality and reducing soil erosion.
Assumptions and Information Gaps
Ecological Integrity and Natural Range of Variation
Ecological integrity forms a crucial part of the plan’s “coarse-filter” approach for a conservation strategy—for example, a habitat-based approach, versus species-specific management (Hunter et al. 1988). A key assumption of the revised forest plan and the draft environmental impact statement is that intact ecological conditions mean habitats, and the species dependent on them, persist. Moreover, it is assumed that by maintaining these conditions, critical ecological and evolutionary processes such as nutrient and sediment transport, biotic interactions, dispersal, gene flow and disturbance regimes, will also be maintained and will provide the necessary environmental conditions for climate adaptation (Beier and Brost 2010). Wurtzebach and Schultz (2016) outline some key characteristics and assumptions associated with the ecological integrity framework. They note that ecological integrity:
• Emphasizes the importance of ecological processes such as natural disturbance regimes that provide the structures and functions on which the full complement of species in an ecosystem or landscape depend.
• Assumes that ecological systems that retain their native species and natural processes are more resistant and resilient to natural and anthropogenic stresses over time (including climate change).
• Emphasizes the intrinsic value of native biodiversity of ecosystems, beyond its functional role in supporting the renewal and reorganization of ecosystem function and structure over time.
Ecological integrity has emerged as a key component of ecological restoration and adaptation to climate change (Suding et al. 2015) and is a useful framework to guide management of terrestrial ecosystems (Carter et al. 2019). However, in planning for ecological integrity, it is important to recognize well-known sources of uncertainty that are specific to natural resource decision making (Chambers et al. 2019). These include: 1) partial knowledge—uncertainty in ecosystem and species responses to disturbances, climate change, and management actions and the related the need to estimate and model natural systems because of our inability to directly observe nature, 2) structural uncertainty—uncertainty and error in the models that predict system responses to disturbance, climate change, or specific management actions, and 3) partial controllability—the difficulty of actually applying management actions with high precision and timing leading to misinterpretation of the effectiveness of future management actions. Being cognizant of this uncertainty and operating under an adaptive management framework will be critically important to effectively managing for ecological integrity in the future. Consistent with the framework of managing for ecological integrity, a key assumption underlying plan development and this effects analysis is that the natural range of variation provides insight and a frame of reference for evaluation of ecological integrity and resilience
USDA Forest Service
90
(Wiens et al. 2012). It is assumed that the natural range of variation reflects the ecosystem conditions that have sustained the current complement of wildlife and plant species in the GMUG, and provides context for understanding the natural diversity of the vegetation and what processes sustain vegetation productivity and diversity (Keane et al. 2009). However, the natural range of variation has been criticized as being less relevant in an age of climate change (Millar 2014). While the revised plan is grounded in this natural range of variation framework, where feasible it does go beyond natural range of variation to consider ecosystem integrity in the context of likely future conditions. Habitat connectivity is a key ecosystem characteristic included in this effects analysis that lacks data on natural range of variation. For this indicator, we use contemporary research on habitat patch sizes and impacts of roads and trails on wildlife to evaluate ecological integrity. This is analyzed in detail in the Wildlife section.
Climate Change
Decades of research shows the Earth’s climate warmed rapidly during the 20th century and this trend is expected to intensify in the future (USDA Forest Service 2016, Furniss et al. 2010). These changes result in impacts to ecosystem processes including the timing, amount and type of precipitation, invasive species encroachment, shifts in fire regimes and intensity, insect infestations, carbon storage, and species health and resilience (USDA Forest Service 2016, Peterson et al. 2011). As such, climate change is a major ecological stressor in the GMUG. The Affected Environment – Climate section discusses climate and climate change in greater detail. The uncertainty that accompanies a changing climate creates challenges for natural resource management. Approaches to address forest and ecosystem management in the face of an uncertain and variable future should be flexible, emphasize ecological processes, and have the capacity to change and adapt to new information as it becomes available (Millar et al. 2007). Approaches commonly published in the literature include promoting resilience to change, creating resistance to change, and enabling forests to respond to change (Holling 1973, Millar et al. 2007, Janowiak et al. 2014). This analysis assumes that plan components grounded in this resilience/response/resistance framework will help maintain or restore the ecological integrity of terrestrial ecosystems in the plan area. Development of the programmatic management direction in the revised plan integrated all three of these approaches, though promoting resilience through reducing known ecological stressors is the primary approach. The resistance approach is integrated, for example with protection of highly valued habitats, species, or other resources. Approaches that could be considered response options are promotion of landscape connectivity through wildlife management areas and desired conditions that include a wider range of structural stages in forested systems than natural range of variation models indicate. Another key plan component that is critical in the context of future climate change is the establishment of a monitoring plan to inform an adaptive management approach. This enables the intentional use of monitoring to evaluate effectiveness of our plan direction and resulting management actions.

GMUG National Forests Land Management Plan Draft Environmental Impact Statement: Volume 1
91
Vegetation Models Used in Analysis
ST-SIM software is a stochastic state-and-transition simulation model that forecasts landscape dynamics. This software was used to make projections regarding the future seral stage distribution of various vegetation types in the GMUG, factoring in natural disturbances as well as planned vegetation management, such as timber harvests, wildlife treatments, and fuels treatments. State-and-transition models were used in earlier GMUG planning efforts in the mid-2000s to model the expected range in seral conditions that would have existed under historic disturbance regimes for forest, woodland, and shrub ecosystems in the GMUG. These older model results were used in the GMUG terrestrial ecosystem assessment (USDA Forest Service 2018) to assess the level of departure of the current conditions from historic reference conditions. To assess the effects of future planned management, these models were re-created in ST-SIM to forecast the future seral stage distribution of each vegetation type under each alternative. The main ST-SIM model parameters and assumptions were:
• Non-spatial models were run based on the acreage of each vegetation type across the entire forest and assuming a cell size of 10 acres. Twenty iterations were done for each simulation.
• Current seral stage distributions were based on the mapping of current conditions, as reported in the GMUG terrestrial ecosystem assessment. These assessments did not differentiate between late-mid and late seral stages, while the vegetation models did. A 2/3 – 1/3 breakdown was assumed with 2/3rd of the late-mid and late seral stage area allocated to the late seral stage and 1/3rd of the late-mid and late seral stage area allocated to the mid seral stage.
• For spruce-fir and spruce-fir-aspen, the current seral stage distribution was modified from what was reported in the GMUG terrestrial ecosystem assessment to incorporate the latest spruce beetle aerial detection data (1996-2018), with areas impacted by spruce-beetle added to the early seral stage.
• Dominant timber harvest practices were included in the models. Salvage harvest was not modelled as these areas would already have their seral stage changed to the early seral stage based on projected mortality in the model. All timber harvest activities were assumed to occur in the suitable timber base.
• Planned fuels and wildlife treatments were included in the model and were combined due to their similarities. Fuels/wildlife treatments were applied Forestwide with the exception of roadless and wilderness areas.
• Natural disturbances such as fire, insects, and pathogens were included in the models. Insects and pathogens are modeled based on natural range of variation rates and severity. For fire parameters, this analysis assumes that the last 10 to 20 years are most relevant to the near future (i.e., the next 10 to 20 years) but also recognizes that wildfire will likely increase in the coming decades due to climate change (Westerling et al. 2006).
• Fire return intervals used in the model were derived from Monitoring Trends in Burn Severity (MTBS) data over an area of about 65 million acres including the GMUG National Forests and extending into portions of Utah, Arizona, Colorado, and New Mexico.

USDA Forest Service
92
• Results of this Monitoring Trends in Burn Severity data analysis indicated a substantial increase in acres burned beginning in 2002. Since then, big fire years have become increasingly common in the analysis area and these big years drive the decadal averages. For modeling purposes, it was assumed that the 2009-2018 mean annual acres burned represents a reasonable estimate for the near future (i.e., Timestep 1 of the ST-Sim simulation). However, based on climate change literature and assumptions presented in the GMUG assessment, it was further assumed that in the longer term the annual average of acres burned will likely approach the recent “big years” (2002, 2012, and 2018) as these types of fire years and associated climate conditions become more prevalent.
• ST-Sim modeling assumed that the total acres burned would increase in a linear fashion over the coming decades between these two points. To account for unburned acres within the Monitoring Trends in Burn Severity fire perimeters, the Monitoring Trends in Burn Severity estimates were reduced by 30 percent (Meddens et al. 2018). As such, in the final models, the total area burned increased from approximately 6,000 acres in Timestep 1 of the simulation to approximately 20,000 acres in Timestep 50. The distribution of fire across ecosystems within the model was determined by the underlying probabilities associated with the fire regimes of each ecosystem.
Landscape dynamics models such as ST-Sim provide useful information for understanding vegetation change over time, management effects, and the relative differences between alternatives. For this analysis, the models are best used to provide information of comparative value and are not intended to be predictive or to produce precise values for vegetation conditions. Out of necessity, the models simplify complex and dynamic relationships between ecosystem processes and disturbances (such as climate, fire, and succession) and vegetation over time and space. The best available information, including corroboration with independent data sources, professional experience, and knowledge is used to build these models; however, there is a high degree of variability and an element of uncertainty associated with the results because of the ecological complexity and the inability to predict accurately the timing and/or location of future events.
Management Direction The current GMUG forest plan provides little direction that is explicitly tied to ecosystem integrity, other than “maintain a healthy and vigorous ecosystem resistant to insects, diseases, and other natural and human causes.” Terrestrial ecosystem-related standards and guidelines are generally focused on maintaining habitat needs of wildlife indicator species, and threatened, endangered, and sensitive species. The current plan does not include any guidance related to climate change. In all alternatives, the revised plan provides direction and desired conditions to maintain or restore ecological integrity and overall landscape resilience, in addition to guidance regarding specific resources (e.g., timber, wildlife, and rare plants). It also incorporates direction for management in a changing climate while allowing for flexibility to respond to impacts of climate change. The current plan provides prescriptive direction for several forest structure attributes, including stocking standards, snag and coarse wood levels, and retention of old growth. The revised plan includes direction on all of these subjects and is generally less prescriptive with

GMUG National Forests Land Management Plan Draft Environmental Impact Statement: Volume 1
93
wider ranges and more variability in direction between ecosystems. Stocking standards are generally lower in the revised plan to better match the current understanding of regeneration dynamics and provide more discretion for site-specific direction from GMUG silviculturists. The revised plan simplifies management area categories relative to the current plan. This change is not expected to affect terrestrial ecosystem integrity or the ability to meet desired conditions for terrestrial ecosystems and is not analyzed further in this section.
Effects Common to All Alternatives Under all alternatives, vegetation would be managed to be healthy and diverse, providing sustainable wildlife habitat, forest products, and recreational opportunities. There would continue to be vegetation management, including removal of trees, in order to restore diversity, improve habitat, provide wood products, and protect values from disturbance (for example forest thinning around homes, and tree harvest to slow disease spread). These management actions may have short-term, localized, negative impacts on soil condition (degradation), understory vegetative cover (reduction), and wildlife habitat (temporary loss or displacement). Livestock grazing would continue under all alternatives. Grazing and browsing by permitted livestock and wildlife affect species composition and abundance, which in turn influence fuel loading and fire regimes. Removal of surface biomass limits fire spread and can alter species composition by favoring more fire-sensitive species. Grazing management, including timing and stocking levels, can impact vegetative ground cover and species composition. All alternatives would manage grazing by allotment based on range capacity in order to maintain ecological process and function (e.g., water infiltration, wildlife habitat, soil stability, and natural fire regimes). Across all alternatives, vegetation would be impacted by future climate fluctuations in ways that are not entirely predictable. The affected environment section discusses potential implications of climate change in further detail.
Effects of the No-Action Alternative Under the no-action alternative, management would continue under the current GMUG forest plan. Under this plan, stocking standards would remain generally higher than in the revised plan. This may have no effect on ecosystem integrity, but could also lead to higher fuel loads or increased tree mortality. Snag retention levels would be generally lower and less variable by ecosystem than in the draft revised plan. Down woody material retention levels would remain at 10 to 20 tons/acre across all ecosystems (less variable and a narrower range than in the revised forest plan). Under the current plan, snag and down wood retention levels could lead to conditions outside of natural range of variation ranges in managed stands. While project work would continue to focus on multiple objectives, including ecosystem integrity, the no-action alternative does not provide detailed overarching direction tied to key characteristics of ecosystem integrity. The current forest plan does not contain any mention of, or guidance related to, climate change. While it does contain plan components to manage recreation and mitigate undesirable ecological impacts of recreation in the GMUG, the

USDA Forest Service
94
current plan does not have any direction comparable to the standards in the draft revised plan (FW-STND-REC-(06-07)) which outline specific management responses to clearly defined “unacceptable biophysical impacts” caused by recreation. The lack of climate-focused direction in the current plan may limit management of structure and composition of ecosystems to a more static natural range of variation range. It also may lead to lost opportunities for climate-resilience focused projects, including identification of climate change refugia. The lower specificity of current recreation direction may make management responses to unacceptable impacts slower and/or less effective in mitigating those impacts.
Effects of the Draft Revised Plan The components in the draft revised plan that would guide management of terrestrial vegetation are summarized in table 42. These plan components are designed to complement each other and collectively maintain or restore ecological integrity in the GMUG.
Table 42. Summary of plan components relevant to terrestrial vegetation for the revised forest plan
Plan Component(s) Summary of expected effects FW-DC-ECO (01-03, 06, 07, 09) FW-DC-IVSP-01 FW-DC-SPEC (01-02, 08, 12, 17, 19, 32, 33, 36) FW-DC-SOIL-01 FW-DC-RNG (01-02) MA-DC-WILDLF-01
These desired conditions collectively describe the function, composition, structure, and pattern of terrestrial ecosystems. The desired conditions are compatible and interrelated, and collectively they provide a comprehensive and clear articulation of resilient terrestrial ecosystems, including habitat conditions for at-risk species and the relative abundance and condition of key ecosystem characteristics at appropriate scales. Collectively, the full suite of desired conditions articulate a detailed description of ecological integrity for the plan area and provide a clear vision to guide management activities.
FW-GDL-ECO-07 FW-STND-IVSP (03-04) FW-GDL-IVSP (06-07, 09) FW-GDL-SPEC (06, 11, 19, 31) FW-STND-SPEC (35, 42) FW-STND-SOIL (02-03) FW-GDL-SOIL (04-07) FW-STND-RNG (06-08) FW-GDL-RNG (10-11) FW-STND-REC (05-07, 10) FW-GDL-REC-11 FW-STND-TMBR (01-07) FW-GDL-TMBR (08-10) FW-STND-TSTN (03-05) MA-STND-WLDF-02
The suite of standards and guidelines place clear constraints on direction of management activities to ensure that projects will not prevent achievement of desired conditions and will protect key ecosystem characteristics and at-risk species. Together, these plan components provide for maintenance and/or re-establishment of desirable vegetation for both non-forested and forested plant communities, including at-risk plants.
FW-OBJ-ECO-04 This objective provides direction to identify potential climate refugia and implement monitoring for refugia, which will help guide spatially explicit future management for climate change adaptation.
FW-OBJ-FFM-02 FW-OBJ-SPEC-03
These objectives specify a minimum desired level of vegetation management to help ensure that active management moves conditions toward the desired conditions for forested and non-forested ecosystems, including at-risk plants.

GMUG National Forests Land Management Plan Draft Environmental Impact Statement: Volume 1
95
Plan Component(s) Summary of expected effects FW-OBJ-IVSP-02 FW-OBJ-SPEC (28-30, 38) FW-OBJ-RNG-03 FW-OBJ-REC-04 MA-OBJ-WLDF-03
These objectives contribute to desired conditions for terrestrial ecosystems and at-risk plants by improving resiliency and/or reducing and mitigating impacts of ecological stressors.
Diversity of Cover Types
The draft revised plan includes specific plan components related to maintaining or restoring a diversity of cover types in the GMUG. As discussed in the affected environment, the diversity of cover types in the GMUG is currently within desired conditions. In the draft revised plan, desired conditions, including FW-DC-ECO-01, -03, and -06, FW-DC-IVSP-01, and FW-DC-SPEC-01 collectively describe a diverse mosaic of cover types at multiple spatial scales. They also refer specifically to how this diversity of cover types can be maintained in the context of stressors, including climate change and invasive species. Invasive species are a significant threat to vegetation species diversity in the GMUG, and standards, guidelines, and objectives related to invasive species management all contribute to the maintenance of a diversity of cover types in the GMUG. Specifically, objectives describe the amount of invasive species management performed annually (FW-OBJ-IVSP-02), and standards and guidelines specify best practices for invasive species mitigation (FW-STND-IVSP (03-04), FW-GDL-IVSP (06-07, 09)). Healthy and productive soils are essential for establishment and maintenance of vegetative cover and diversity. In the draft revised plan, standards and guidelines contribute to maintenance of this key ecosystem characteristic by specifying a maximum limit of detrimental soil disturbance (FW-STND-SOIL-02), describing best practices for decommissioning of trails and roads (FW-STND-SOIL-03), and constraining management activities (FW-GDL-SOIL-(04-07), FW-STND-TMBR-04, FW-GDL-TMBR-08) to ensure that soil quality and quantity are maintained. Unmanaged or improperly managed livestock grazing has the potential to negatively impact terrestrial ecosystem integrity and diversity of cover types. However, properly managed grazing, with respect to utilization levels, season of use, and numbers and type of animal, minimizes impacts to ecosystem function, can be sustainable over the long term (Pieper 1994; Holechek et al. 2010; Davies et al. 2011), and can be beneficial to some native plant species and communities adapted to grazing. Through adaptive management of the timing, intensity and duration of grazing, effects on vegetation productivity and species composition can be managed (Holechek et al. 2010). The draft revised plan includes an objective (FW-OBJ-RNG-03) for annual evaluations to facilitate the adaptive management described by Holechek et al. 2010, as well as standards and guidelines to protect rare and at-risk plants and sensitive vegetation types (FW-STND-RNG-06, FW-GDL-RNG-11), and standards and guidelines to ensure that grazing is managed to promote sustainable and vigorous native plant communities (FW-STND-RNG-(07-08), FW-GDL-RNG-10). Collectively, these components contribute to the maintenance of a diversity of vegetative cover types in the GMUG.

USDA Forest Service
96
Human recreation can negatively impact the diversity of cover types by causing vegetation loss through user trails, illegal off-route vehicle use, and expansion of dispersed camping, among other potential impacts. In the draft revised plan, several plan components address these issues. FW-OBJ-REC-04 provides direction to increase resiliency of alpine ecosystems to recreation stressors in the next decade, and FW-STND-REC-10 limits campfires to existing fire grates or fire pans in the alpine ecosystems. FW-STND-REC-05 prohibits motorized and mechanized travel outside of designated routes on snow-free land. Recreation standards (FW-STND-REC-(06-07)) provide direction for management responses in situations where unacceptable biophysical impacts (including loss of vegetation) are occurring due to recreation use in the GMUG. By limiting loss of vegetation due to recreation, these plan components contribute to the maintenance of a diversity of cover types in the GMUG. Fire is a natural part of most terrestrial ecosystems in the GMUG. Characteristic fire is an ecosystem driver, but uncharacteristic fires (those that differ in frequency or severity from an ecosystem’s historic fire regime) can be a stressor, and may convert an ecosystem to a different cover type permanently (Savage and Mast 2005; Roccaforte et al. 2012). Permanent cover type conversions due to uncharacteristic fire could negatively impact the diversity of cover types in the GMUG. In the draft revised plan, FW-OBJ-FFM-02 provides broad direction for actions to reduce risk of uncharacteristic fire, and specifically notes treatments to move ponderosa pine stands toward a fire maintained open structure as one method to achieve this objective. FW-OBJ-SPEC-03 is focused on wildlife habitat improvement and includes a broad range of potential management actions. Some actions under this objective will have a negligible effect on maintaining or increasing the diversity of cover types in the GMUG, but other actions (eliminating redundant routes, realigning routes into less impactful settings) will help contribute to the maintenance of a diversity of cover types. Some of the plan components described above have equivalent direction in the no-action alternative or within existing law, regulation, and policy. Relative to the no-action alternative, the draft revised plan has more direction specific to sensitive ecosystems, to mitigation of the stressor of human recreation, and to reduction of the risk of uncharacteristic fire. As such, the draft revised plan will continue to maintain or increase the diversity of cover types in the GMUG.
Distribution of Structural Stages
In the draft revised plan, FW-DC-ECO-01 describes a desired mosaic of vegetation structures across the landscape at a variety of scales, and FW-DC-ECO-02 includes quantitative desired ranges for seral stage distribution for all forested ecosystems in the GMUG. While seral stages and structural stages are different, and age of vegetation is not directly linked to structural stage, relative seral stages are implied by structure. The draft revised plan also includes FW-DC-ECO-08, which describes desired distribution and occurrence of old-growth forest across the GMUG. Of all the indicators analyzed in this section, the distribution of structural and/or seral stages is the most directly influenced by management. In terms of the draft revised plan, these management effects are driven by two objectives (FW-OBJ-FFM-02 and FW-OBJ-SPEC-

GMUG National Forests Land Management Plan Draft Environmental Impact Statement: Volume 1
97
03) which provide decadal goals for fuels and terrestrial wildlife habitat treatments, as well as the projected annual timber sale program (see chapter 2). ST-SIM modeling was used to forecast the future seral stage distribution of each vegetation type under each alternative. Results for alternative B are described below, with a comparison of effects of alternatives C and D in the following section. ST-SIM models were run at a Forestwide scale. As such, this analysis assumes that the Forestwide predicted conditions discussed below are a reasonable proxy for effects at the geographic area scale, and that future disturbance occurrence and management activities will be roughly evenly distributed by geographic area. Model results of all alternatives by ecosystem are shown in figure 8, figure 9, and figure 10. Ponderosa pine forests do not have a quantitative desired condition for seral stage distribution, but broadly speaking the “fire-maintained open” stage most closely corresponds to desired conditions for ponderosa pine (multi-aged stands made up of small even-aged patches (0.1 to 1 acre in size)). A zero-management scenario is included to offer context regarding the influence of management relative to natural disturbances for each ecosystem and seral stage. Models results extend out to 50 years, but as the life of this plan is expected to be 20 years, discussion of effects will focus on the initial 20-year period shown in results. For the most part, model results indicate that alternative B keeps seral stage conditions within or moves them toward desired ranges over the projected life of the draft revised plan (20 years). Mid-seral cool-moist mixed conifer moves higher than the desired range under alternative B, and mid-seral pinyon-juniper with shrubs moves lower than the desired range under alternative B. The no-action alternative shows a similar trend to alternative B for both of these ecosystems and seral stages. However, alternative B does not preclude these ecosystems from meeting desired conditions over the long term. Relative to the no-action alternative, the draft revised plan has a more qualitative and less quantitative desired condition for old-growth forest. However, while the current forest plan has a minimum percentage for old-growth by forested unit, the GMUG does not have a Forestwide assessment of old-growth occurrence, so in practice this minimum percentage has not served as a meaningful sideboard. It is not expected that the draft revised plan will have a measurable effect on the amount of old-growth forest in the GMUG.

USDA Forest Service
98
Figure 8. Results of ST-Sim predictive models for future seral stage distributions in the GMUG National Forests, part 1

GMUG National Forests Land Management Plan Draft Environmental Impact Statement: Volume 1
99
Figure 9. Results of ST-Sim predictive models for future seral stage distributions in the GMUG National Forests, part 2

USDA Forest Service
100
Figure 10. Results of ST-Sim predictive models for future seral stage distributions in the GMUG National Forests, part 3

GMUG National Forests Land Management Plan Draft Environmental Impact Statement: Volume 1
101
Regeneration and Recruitment
In the draft revised plan, FW-STND-TIMBR-02 requires that harvested areas are adequately restocked 5 years after harvest and specifies minimum restocking levels for suitable timber lands by cover type. Minimum stocking levels are specified as seedlings/acre and a percentage of the harvest area meeting that standard. This allows for flexibility to leave portions of the harvest area unstocked if they are unsuitable (i.e., harsh microsites) or undesirable (roadsides, wildland-urban interface) for reforestation. Compared to the no-action alternative, restocking levels in the draft revised plan only specify a minimum stocking level (vs. minimum and desired), and apply a 70 percent of area stocked standard (the no-action alternative had a 75 percent minimum and 100 percent desired for most cover types). The draft revised plan also specifies stocking levels for warm-dry and cool-moist mixed conifer types, in addition to the cover types covered in both the no-action and draft revised plan alternative (lodgepole pine, spruce-fir, aspen, and ponderosa pine). Minimum stocking levels are the same for spruce-fir and lodgepole pine, and lower for aspen and ponderosa pine in the draft revised plan as compared to the no-action alternative for 5 years post-harvest. These changes reflect improved understanding of regeneration dynamics of these ecosystems since the current plan was written, and they ensure sufficient regeneration and recruitment while not requiring higher rates of stocking than are ecologically necessary.
Landscape Disturbances
Insects and diseases are important disturbance agents and contributors to ecosystem function. The amount of insect and disease disturbance in forests is closely tied to the abundance of the host species, vegetative succession of forests into susceptible conditions (for example, larger trees, and higher densities), warmer climates, and droughts. The draft revised plan differs from the no-action alternative in its description of insects and disease as an important natural disturbance regime in FW-DC-ECO-02. While this acknowledges the important role of insects as a native disturbance agent, we expect no difference among alternatives in terms of the predicted scale and frequency of major forest insect outbreaks. While stand structure and composition contribute to insect and disease distribution and success, other factors such as water stress and annual temperatures are interrelated drivers that are often outside of Forest Service management control. Of all disturbance agents, wildfires are expected to be the most significant factor influencing ecological structure, function, and processes over the coming decades. Although it is not possible to predict exactly where and when fires will occur, there is an emerging scientific consensus that the total number of acres burned by wildfire will increase in coming decades (Westerling et al. 2006). While future fire rates will likely be different than both historic and contemporary fire return intervals, this analysis and ST-SIM model parameterization assumes that the next decade of wildfire frequency will be most similar to the last decade, and over the longer term, the annual average of acres burned will likely approach the recent “big-fire years” in Colorado (2002, 2012, 2018) as the climate conditions associated with these types of fire years become more prevalent.

USDA Forest Service
102
These anticipated increases in wildfire are expected to occur under both the no-action and the draft revised plan. However, the draft revised plan differs from the no-action in that it explicitly acknowledges the role of wildfire as an essential ecosystem process (FW-DC-ECO-02) and it sets an objective for treatment of 120,000 acres per decade to move ecosystems toward their desired conditions for fire regimes in the GMUG (FW-OBJ-FFM-02). While the no-action alternative has prescriptive direction for control and confinement of wildfires based on management areas and fireline intensity, the draft revised plan provides fire managers with more flexibility in deciding how to manage individual fires and allows fire to play a more natural role across the landscape than the no-action alternative. Because of this, it is expected that the draft revised plan will move terrestrial ecosystems (particularly those with more frequent fire regimes) toward desired conditions for fire more rapidly than the no-action alternative.
Snags and Down Woody Material
Snags and downed wood conditions are largely dependent on the pattern of natural and human disturbance processes. Currently, due to the large spruce beetle outbreak in the GMUG, there is an abundance of snags and downed woody material in spruce-fir and spruce-fir-aspen ecosystems. In general, snags and down woody material are very dynamic, highly variable, and unevenly distributed across time and space. Ecological processes associated with snags and downed wood dynamics vary across forested ecosystems. On the majority of the GMUG, natural ecological processes and disturbances are the primary factors affecting snag and downed wood conditions. Lower amounts of snags and downed wood will tend to occur in developed sites, areas where concern for fire hazard is elevated, and areas closer to communities and accessible to firewood cutting. In the draft revised plan, FW-DC-ECO-06 describes the desired condition for snags and coarse wood, and FW-GDL-ECO-07 provides a quantitative guideline for snags and woody material left by management activities that is applicable outside of the wildland-urban interface. FW-GDL-SOIL-06 provides further support for that guideline from a soils perspective. Relative to the no-action alternative, the draft revised plan has higher minimums for snag retention, and wider ranges and more ecosystem-specific direction for down woody material retention. The draft revised plan also specifies that retention guidelines do not apply in the wildland-urban interface, while the no-action alternative has no such specification. While the revised plan does not explicitly map wildland-urban interface, based on wildland-urban interface maps currently used by the GMUG, approximately 34 percent (666,000 acres) of the area of forested ecosystems included in FW-GDL-ECO-07 are currently mapped as wildland-urban interface. Areas of forested ecosystems in wildland-urban interface currently mapped in the GMUG are listed in table 43.

GMUG National Forests Land Management Plan Draft Environmental Impact Statement: Volume 1
103
Table 43. Area of forested ecosystems in the wildland-urban interface as currently mapped
Forest Ecosystem
Area in Wildland-Urban Interface
(acres)
Area in Wildland-Urban Interface
(percent) Aspen 195,456 42% Bristlecone-limber pine 1,324 16% Cool-moist mixed conifer 12,420 31% Lodgepole pine 104,886 37% Pinyon-juniper 35,415 33% Ponderosa pine 43,667 42% Spruce-fir 105,584 20% Spruce-fir-aspen 161,606 38% Warm-dry mixed conifer 6,119 32%
Total 666,477 34%
As discussed in the Affected Environment section, current conditions for snags are well above retention quantities in FW-GDL-ECO-07 for all ecosystems with available data (ponderosa pine forests are below guideline retention levels, but data were limited by a small sample size for that ecosystem). Current conditions for downed woody material are within the range of retention quantities for all ecosystems with available data, with the exception of aspen forests, which is slightly low (4.87 tons per acre vs. a retention guideline of 5–15 tons per acre). Through GDL-ECO-07, the draft revised plan will ensure that snags and down wood amounts are maintained at levels sufficient to support soil productivity and wildlife habitat across the GMUG while allowing management flexibility to meet fuels reduction objectives in wildland-urban interface areas. While large portions of many forested ecosystems are currently mapped within the wildland-urban interface (table 44) and thus not subject to snag and down wood retention guidelines, the actual effect of this exception will be limited to the portion of wildland-urban interface areas in forested ecosystems (this excludes montane shrublands) that are impacted by fuels treatments over the life of the plan, a total of approximately 200,000 acres (about 10 percent of their total area in the GMUG) over the next two decades.
Comparison of Effects of the Alternatives All the revised plan alternatives contain the same desired conditions for terrestrial ecosystem composition, structure, and function. Desired conditions are designed to maintain and enhance ecological integrity, diversity, function, and resiliency while contributing to social and economic sustainability as required by the 2012 Planning Rule. These alternatives also have the same Forestwide standards and guidelines designed to maintain ecosystems within or move them toward desired conditions. Objectives, extent of suitable timber, and allocation of land to management areas are the primary factors distinguishing management direction for terrestrial ecosystems among the revised plan alternatives. Alternatives are compared by issues, and forest plan objectives in

USDA Forest Service
104
table 2 and table 3 of chapter 2. Items from those tables that vary between action alternatives and are relevant to terrestrial ecosystem analysis indicators are noted in table 44 and table 45.

GMUG National Forests Land Management Plan Draft Environmental Impact Statement: Volume 1
105
Table 44. Issues that vary by action alternative and relevant terrestrial ecosystem indicators [CCF, one hundred cubic feet]
Issue No-Action Alternative:
Current Forest Plan Draft Alternative B:
Blended
Draft Alternative C: Active Management
Emphasis
Draft Alternative D: Special Area
Emphasis Relevant Terrestrial Ecosystem Indicator
Extent of recommended wilderness
No new 34,000 acres. San Juan Wilderness additions in San Miguel County; West Elk and Raggeds Wilderness additions in Gunnison County.
No new 261,000 acres. Same as B, with the addition of all Gunnison County-recommended areas; and areas GMUG evaluated as “high” which are also recommended by a citizen proposal.
Landscape Disturbances, Diversity of Cover Types
Projected Timber Sale Program
35,900 CCF for the first 5 years. For years 6-20, 32,100 CCF.
55,000 CCF 55,000 CCF 30,000 CCF Distribution of Structural Stages; Regeneration and Recruitment
Proportion of timber program in salvage
22% first decade; 9% second decade
Same as no-action alternative
Same as no-action alternative
No salvage Snags and Down Woody Material
Projected acres timber harvest
2,300 in years 1-5; 2,400 in years 6-20
4,800 in years 1-5; 5,000 in years 6-20
4,800 in years 1-5; 5,000 in years 6-20
2,500 in years 1-5; 2,500 in years 6-20
Distribution of Structural Stages; Regeneration and Recruitment
Extent of wildlife management areas
No corresponding category in current forest plan.
740,000 acres. Several, distributed across the national forests
36,000 acres. Few, limited in range.
621,000 acres. Maximum extent, with the exception of the Gunnison Basin (where largely replaced with recommended wilderness or special management areas)
Diversity of Cover Types
Special Interest Areas 2,000 acres. 17,000 acres. New – Gunnison Research Special Interest Area
Same as no-action alternative. No new special interest areas.
4,000 acres. New – Gunnison Research Special Interest Area; Taylor Willard Special Interest Area.
Diversity of Cover Types

USDA Forest Service
106
Issue No-Action Alternative:
Current Forest Plan Draft Alternative B:
Blended
Draft Alternative C: Active Management
Emphasis
Draft Alternative D: Special Area
Emphasis Relevant Terrestrial Ecosystem Indicator
Research Natural Areas 1,000 acres Existing – Gothic, Dry Forks Escalante.
Same as no-action alternative. No new research natural areas.
Same as no-action alternative. No new research natural areas.
12,000 acres New – Battlements.
Diversity of Cover Types
Table 45. Draft revised forest plan objectives that vary by action alternative and relevant terrestrial ecosystem indicator
Objective and Topic Measure
No-Action Alternative Alternative B Alternative C Alternative D
Relevant Terrestrial Ecosystem Indicator
FW-OBJ-FFM-02 Fuels
Acres fuels treated per decade 90,500 acres 110,000 acres first decade; 150,000 acres second decade
130,000 acres 50,000 acres Diversity of Cover Types, Distribution of Structural Stages, Landscape Disturbances
FW-OBJ-SPEC-03 Species
Acres terrestrial habitat restored/enhanced per decade
20,000 acres 20,000 acres 80,000 acres 20,000 acres Diversity of Cover Types, Distribution of Structural Stages
FW-OBJ-SPEC-30 At-Risk Plants
Actions implemented to minimize off-road travel
N/A Within 3 years Same as B Within 1 year Diversity of Cover Types
MA-OBJ-RECWLD-03 Recommended Wilderness
Close unauthorized routes N/A Within 5 years N/A Within 7 years Diversity of Cover Types
MA-OBJ-REC-02 Recreation
Number existing unauthorized motorized travel incursions eliminated per decade in semi-primitive non-motorized recreation opportunity spectrum
N/A 2 0 10 Diversity of Cover Types
MA-OBJ-EMREC-02 Recreation Emphasis Areas
Actions taken within 5 years to improve degraded dispersed overnight use areas
Same as B At least 5 At least 2 At least 10 Diversity of Cover Types
MA-OBJ-EMREC-03 Recreation Emphasis Areas
Actions taken within 5 years to improve degraded dispersed day use areas
Same as B At least 5 At least 2 At least 10 Diversity of Cover Types

GMUG National Forests Land Management Plan Draft Environmental Impact Statement: Volume 1
107
Diversity of Cover Types
Some objectives (FW-OBJ-IVSP-02, FW-OBJ-RNG-03, FW-OBJ-REC-04) related to maintaining a diversity of cover types are the same across action alternatives; those that vary by alternative are in table 45. Species, recreation, and recommended wilderness objectives MA-OBJ-RECWLD-03, MA-OBJ-REC-02, MA-OBJ-EMREC-02, MA-OBJ-EMREC-03 all address ecological stressors related to recreational use and motorized travel in the GMUG. Alternative D includes the most emphasis on these objectives, and as such may help maintain ecosystem integrity adjacent to federally listed plant populations (Battlements Research Natural Area) and within recommended wilderness and recreation emphasis areas at a higher level than other alternatives. FW-OBJ-FFM-02 is a broad objective that provides direction for actions to reduce the risk of uncharacteristic fire, specifically noting treatments to move ponderosa pine stands toward a fire maintained open structure. As uncharacteristic fire is an ecological stressor and may convert an ecosystem to a different cover type permanently, the alternatives with higher rates of fuels treatments (B and C) may contribute to a greater diversity of cover types in the GMUG, particularly ponderosa pine forest. Alternative D includes a botanically focused research natural area (Battlements) and the Taylor-Willard Special Interest Area to be managed for botanical values (Taylor-Willard). Both of these areas include uncommon plant communities that would benefit from additional protection by these official designations. Increased protection of rare plants would contribute to maintaining a diversity of cover types. As invasive species are a potential threat to the diversity of cover types in the GMUG and are often spread via routes and trails (motorized and non-motorized), alternative D may minimize the spread of invasive species due to its emphasis on management areas (recommend wilderness, wildlife management areas, special management areas) with restrictions on creation of routes. However, these same restrictions may make management of any existing invasive species more difficult.
Distribution of Structural Stages
Based on ST-Sim model results (figure 8), the distribution of seral stages (and by inference, structural stages) and their trajectories over time will vary somewhat between action alternatives. These results reflect variation in the amount of planned management between action alternatives through differences in the fuels treatment objective (FW-OBJ-FFM-02), terrestrial habitat treatment objective (FW-OBJ-SPEC-03), and the projected timber sale program in each action alternative. Broadly speaking, over the expected lifetime of the revised forest plan, alternative D maintains higher proportions of mid- and late-seral stages, while alternative C maintains higher proportions of early-seral stages. Alternative B (the draft revised plan) is a middle ground between alternatives C and D for all seral stages. While projected acres in each seral stage vary by alternative, general trajectories are similar across alternatives, and all three action alternatives are generally consistent with each other in terms of moving toward or remaining with desired condition ranges. As alternative D maintains higher proportions of mid- and late-seral stages and has the highest allocation of land area to designations that would not be subject to active

USDA Forest Service
108
management, it may have a greater area of old-growth forest types compared to other alternatives. However, this assumes that differences in planned treatments across alternatives would not impact rates and extents of natural disturbance.
Regeneration and Recruitment
Regeneration and recruitment is not expected to vary by action alternative. Differences in projected timber sale program in alternative D (30,000 CCF annually) compared to alternatives B and C (55,000 CCF annually) may have some effect on regeneration and recruitment in that a smaller area of the GMUG will be subject to forest plan stocking standards. Over the 20-year life of the revised plan, projected timber volume in alternatives A and D equates to about 50,000 acres of timber harvest, while projected timber volume in alternatives B and C equates to about 100,000 acres of timber harvest. However, the degree of this potential effect is dependent on whether forests in the GMUG continue to regenerate naturally without management intervention, which is in turn dependent on currently uncertain impacts of climate change within the planning area.
Landscape Disturbances
Across all action alternatives, FW-DC-ECO-02 describes the desired condition for landscape disturbances in the GMUG, including fire, insects, and disease. We expect no major differences among action alternatives in terms of the predicted scale and frequency of major outbreaks of insects or disease. While stand structure and composition contribute to insect and disease distribution and success, other factors such as water stress and annual temperatures are interrelated drivers that are often outside of Forest Service management control. Fire may vary across action alternatives due to differences in the amount of fuels treatments per decade (FW-OBJ-FFM-02) and differences in the amount of recommended wilderness. Alternatives B and C are expected to have roughly the same effects on fire as the amount of fuels treatments are comparable over the life of the plan, and additional recommended wilderness in alternative B is currently designated as upper tier Colorado roadless and managed similarly to wilderness in terms of fire. Compared to alternatives B and C, alternative D has a much lower amount of planned fuels treatments (50,000 acres per decade) and an additional recommended wilderness of 261,000 acres. As wilderness is managed for natural processes, additional wilderness may allow for more naturally ignited fires in alternative D. However, the increased pace and scale of fuels treatments in alternatives B and C may allow for characteristic fires to burn in those ecosystems that fuels treatments will focus on (ponderosa pine, pinyon-juniper and pinyon-juniper with shrubs, warm-dry mixed conifer, and cool-moist mixed conifer). Additionally, a general reduction in fuels across the GMUG may give managers more discretion in allowing natural ignitions to burn if they have greater confidence in adequate protection of wildland-urban interface areas and other values at risk.
Snags and Down Woody Material
Across all action alternatives, FW-GDL-ECO-07 provides a quantitative guideline for snags and woody material left by management activities that is applicable outside of the wildland-

GMUG National Forests Land Management Plan Draft Environmental Impact Statement: Volume 1
109
urban interface. While this component is consistent across action alternatives, the alternatives may have variable effects on snags and down woody material through the type of timber harvest activities and the amount of fuels treatments implemented. Alternatives B and C have the same amount of planned salvage harvest and approximately the same objective for fuels treatments, while alternative D has no salvage planned and a significantly lower objective for fuels treatments. As such, snags and down woody material levels may be higher in wildland-urban interface areas and within forest stands with high natural mortality in the GMUG in alternative D. The degree of this difference will vary by ecosystem, based on the distribution of planned fuels treatments (see appendix 2 for details), with the greatest potential differences in aspen forest, spruce-fir, spruce-fir-aspen, and ponderosa pine. Despite these site-specific differences between alternatives B and C and alternative D, Forestwide conditions for all action alternatives are expected to be within desired conditions for snags and down woody material.
Cumulative Effects The effects that past activities have had on all of the components of forest vegetation (such as forest composition and structure, landscape pattern, etc.) were discussed in the Affected Environment section and are reflected in the current condition of terrestrial ecosystems. Therefore, unless otherwise noted, past activities are not carried forward into the following cumulative effects analysis. Present and foreseeable future activities that could affect forest vegetation are summarized below. The affected area for cumulative effects to terrestrial vegetation includes the lands administered by the GMUG, as well as the lands of other ownership, both within and immediately adjacent to the national forest boundaries.
Increasing Human Population
Additional stressors that may increase in the future are increasing population levels, both locally and nationally, with resulting increasing demands and pressures on public lands. As related to terrestrial ecosystem conditions, these changes may lead to increased demands for commercial and non-commercial forest products, elevated importance of public lands in providing for habitat needs of wildlife species, increased recreation use, and changing societal desires related to the mix of uses that public lands should provide.
Regulations and Public Concerns Regarding Smoke Emissions
The ability to implement the vegetation treatments that would occur as a result of the alternatives is highly dependent upon prescribed burning (both associated with timber harvesting and without it) as well as using natural, unplanned ignitions to meet resource objectives. Therefore, public concern about smoke and associated air quality regulations may have effects in limiting vegetation treatments using fire and meeting desired vegetation conditions.
Management of Adjacent Lands
Portions of the GMUG adjoin other national forests, each with its own land management plan. The GMUG is also intermixed with lands of other ownerships, including private lands and state lands. Some geographic areas contain substantial inholdings of such lands, while

USDA Forest Service
110
others are more unfragmented in terms of ownership. Harvesting or conversion of forests on adjacent lands would affect vegetation conditions at the landscape level. State law applies to all activities regardless of ownership; therefore, basic resource protections would be consistent. However, vegetation management practices on other lands, particularly private lands, would not necessarily be conducted to meet the same desired conditions as those outlined in the GMUG plan. The management plans for National Forest System lands adjacent to the GMUG include the Pike-San Isabel National Forest, Rio Grande National Forest, San Juan National Forest, and White River National Forest. All of the plans contain direction that addresses terrestrial vegetation and promotes ecological integrity. Management of vegetation is broadly consistent across all national forests due to law, regulation, and policy. The cumulative effect would be that the management of terrestrial ecosystems would be complementary. Other public lands adjacent to the GMUG are managed by Colorado Parks and Wildlife and the Bureau of Land Management (Uncompahgre Field Office, Gunnison Field Office, and Grand Junction Field Office). Plan components related to terrestrial ecosystems are complementary to the plan components for the GMUG (See appendix 1). Some counties associated with the GMUG have wildfire protection plans that map or define the wildland-urban interface. Vegetation management, including harvest, may be emphasized in these areas more so than others. Managing for open forests and fire-adapted species may be particularly emphasized in these areas. The effect of the county plans would be to influence where treatments occur to contribute to desired vegetation conditions. Overall, cumulative environmental effects of proposed management under all alternatives, in the context of the larger landscape, would contribute to the movement of vegetation toward desired conditions.
Conclusion Consistent with 36 CFR 219.8(a)(1), the combined effects of the draft revised forest plan direction (across all action alternatives) would maintain or restore the ecological integrity of terrestrial ecosystems in the plan area because:
• The current plan generally recognizes the importance of ecosystem diversity and heterogeneity, but the revised plan alternatives reflect substantially more ecological thinking and provide more detail regarding vegetation conditions that will provide for ecological integrity and resilience.
• Desired conditions provide a comprehensive and clear articulation of resilient terrestrial ecosystems including habitat conditions for at-risk species and the relative abundance and condition of key ecosystem characteristics. Collectively, the full suite of desired conditions articulate a detailed description of ecological integrity for the plan area and provide a clear vision to guide management activities. These conditions are based on the modeled natural range of variation and most likely to be resilient to future environmental conditions.
• Expected trends for key indicators of terrestrial vegetation Forestwide show maintenance of or progress toward desired conditions for fire, diversity of cover types, snags and

GMUG National Forests Land Management Plan Draft Environmental Impact Statement: Volume 1
111
down woody material, and distribution of structural and seral stages across all action alternatives with few exceptions.
• Alternative B represents a middle ground between alternative C (active management emphasis) and alternative D (designated area emphasis). Alternative C may move the GMUG toward desired conditions more rapidly for landscape disturbances and distribution of structural stages (particularly for lower elevation, frequent-fire ecosystems), while alternative D may maintain a higher diversity of cover types and higher levels of snags and down woody debris.
Aquatic and Riparian Ecosystems
Affected Environment A detailed description of the affected environment for aquatic, riparian, and wetland ecosystems is included in the aquatic, riparian, and wetland ecosystems assessment (USDA Forest Service 2018) and is hereby incorporated by reference. This information is summarized below for the purposes of the environmental analysis. Also refer to the Water Resources section for further discussion on waterbody and water resource conditions and trends.
Drivers, Stressors, and Management Influences Drivers and stressors of aquatic, riparian, and wetland ecosystems in the GMUG include climate, annual precipitation patterns, climate change, flow regimes, groundwater, invasive plants and aquatic nuisance species, and wildfire. Management influences include water use and developments (groundwater pumping, diversions, ditches, and reservoirs), roads and trails, recreation, livestock grazing, forest vegetation management, and mining. These factors are described in detail in the assessment (USDA Forest Service 2018, aquatic, riparian, and wetland ecosystems) and are considered in this environmental analysis.
Aquatic, Riparian, and Wetland Ecosystem Integrity The aquatic, riparian, and wetland ecosystems assessment (USDA Forest Service 2018) evaluated three key ecosystem characteristics for aquatic, riparian and wetland ecosystems: composition, structure, and connectivity. Conditions and trend findings are summarized below. Please refer to the assessment for more details regarding key characteristics, analysis methods, and data sources, gaps, and assumptions.
Watershed Condition Framework
Based on watershed condition framework results, 158 watersheds in the GMUG were rated as Condition Class 1 (good), and 76 as Condition Class 2 (fair). No watersheds were rated as impaired; one watershed was not rated. Overall, watersheds in the plan area rated very well in terms of the lack of impaired waters: 211 watersheds were good, 201 were good for water quality, and 205 were good for life form presence. Related to specific indicators of watershed health, invasive species were a concern, with 192 of the watersheds ranking as poor in that category, and 149 ranking as poor for native species. The watershed condition

USDA Forest Service
112
framework is discussed further in the Water Resources section and in the sections below, where applicable.
Key Ecosystem Characteristics—Aquatic Ecosystems
Aquatic ecosystems in the plan area include rivers and streams (perennial, intermittent, and ephemeral), springs, lakes, and reservoirs. The GMUG has an estimated 3,657 miles of perennial streams and rivers, 1,390 miles of major (named) intermittent streams, and 5,815 miles of minor (unnamed) intermittent streams. The headwaters of several major tributaries to the Colorado River occur in the GMUG including the Gunnison, San Miguel, and Little Dolores Rivers. Aquatic ecosystem integrity was assessed based on the following key ecosystem characteristics: 1) characteristics of physical habitat in streams (structure), 2) fragmentation of stream habitat caused by human uses, such as dams (connectivity), 3) distribution, abundance, and characteristics of aquatic invertebrate communities across the GMUG (composition), and 4) distribution of native and non-native aquatic animals including fishes, amphibians, and invasives (composition and structure). Please refer to the Water Resources section for more information on springs and lake and reservoir conditions.
Habitat Structural Characteristics
Based on abiotic and biotic baseline data collected in response reaches of 19 watersheds in the GMUG, stream habitat characteristics and quality are highly variable across the plan area.
Habitat Connectivity and Fragmentation
While broadscale conditions are generally good, streams and rivers in the GMUG and their component species are still impacted and at-risk due to ecosystem stressors including dams and diversions, roads, mining, invasive species, disease, and climate change. Small dams on non-National Forest System land and instream structures, such as “perched” culverts at road-stream crossings and irrigation diversions also exist, fragmenting the stream network and blocking fish passage. In streams where these structures are present, fish are often able to move downstream, but cannot return upstream. All watersheds in the GMUG are affected by human-caused aquatic fragmentation. Unpaved road surfaces are a long-term source of fine sediment input into waterbodies. Roads within riparian management zones1, which are typically the area within 100 feet of a waterbody, and road-stream crossings are generally higher contributors of fine sediment. In the GMUG, an average of one road crossing occurs per every 3 miles of stream, with a total
1 The assessment (USDA Forest Service 2018, aquatic, riparian, and wetland ecosystems) used the term water influence zone, which is synonymous with riparian management zone as defined in the 2012 Planning Rule (36 CFR 219.19). Consistent with current direction, the later term is applied here and in subsequent sections.

GMUG National Forests Land Management Plan Draft Environmental Impact Statement: Volume 1
113
of 689 miles of roads in riparian management zones. According to watershed ratings based on the watershed condition framework, the North Fork of the Gunnison River and Gunnison Basin Geographic Areas have approximately 75 percent of their watersheds rated as “poor” (Class 3) for the road and trail “proximity to water” attribute. In the Uncompahgre Plateau Geographic Area, almost half of the watersheds were rated as “fair” (Class 2) and about one-quarter were rated as “poor” for this attribute. See the Infrastructure section for more information regarding roads in the GMUG. Although surface water quality is generally excellent within the boundaries of the GMUG, the State of Colorado identified segments in 21 streams totaling approximately 141 miles that do not meet water quality standards (table 133). Elevated metals concentrations related to historic mining activities are most often the reasons for failure to meet water quality standards.
Aquatic Species Distribution and Abundance
Streams in the GMUG contain invertebrate communities typical of streams in the southern Rocky Mountains, including stoneflies, mayflies, and caddisflies. Sample analysis using a benthic index of biological integrity indicated that macroinvertebrate communities and the streams they inhabit in the GMUG are generally close to reference conditions and are not experiencing broadscale negative changes resulting from human use of the surrounding environment. Based on the number of native cutthroat trout populations and the widespread distribution of all three common trout species across GMUG watersheds, ample habitat for cold-water species exists in the plan area. Native fish include green-lineage Colorado River cutthroat trout, mottled sculpin, and bluehead sucker. Flannelmouth sucker, roundtail chub, bonytail chub, Colorado pikeminnow, humpback chub, and razorback sucker are other native fishes that occur downstream of the GMUG. Non-native cold-water fish include brook trout, brown trout, rainbow trout, and blue-lineage Colorado River cutthroat trout. Non-native fishes are economically and recreationally important, but may have detrimental impacts on native species through hybridization, competition, predation, and disease transmission. As noted above, under the watershed condition framework, invasive or non-native species were determined to be an issue, with 192 of GMUG watersheds ranking as poor in that category, and 149 ranking as poor for native species. Native amphibians in the GMUG include barred tiger salamander (Ambystoma mavortium), boreal chorus frog (Pseudacris maculata), northern leopard frog (Lithobates [Rana] pipiens), and western (boreal) toad (Anaxyrus boreas boreas). Please refer to the Wildlife and Plants section for a discussion of aquatic at-risk species and species of interest in the plan area.
Key Ecosystem Characteristics—Riparian and Wetland Ecosystems
The aquatic, riparian, and wetland ecosystems assessment identified the following riparian and wetland ecosystems in the GMUG: fens, montane-alpine wet meadows and marshes, montane-subalpine riparian shrublands, montane-subalpine riparian woodlands, and cottonwood riparian woodlands. Riparian shrubland systems comprise over half of all riparian and wetland ecosystems in the plan area (table 46).

USDA Forest Service
114
Table 46. Percentage of riparian and wetland ecosystems, by geographic area
Ecosystem Acres
Grand Mesa
(percent)
North Fork Valley
(percent)
Gunnison Basin
(percent)
San Juans
(percent)
Uncompahgre Plateau
(percent) Fen 4,082 25 6 55 14 0 Montane-alpine wet meadow and marsh 45,144 19 6 56 11 8
Montane-subalpine riparian shrubland 112,655 7 15 67 7 4
Montane-subalpine riparian woodland 32,369 8 19 52 5 17
Cottonwood riparian 3,520 12 23 14 11 40
Riparian and wetland ecosystem integrity were assessed based on hydrologic regime and floodplain connectivity (structure, function, and connectivity), vegetation condition and function (composition and function), and physical sensitivity (structure). Human-caused stressors were also assessed.
Hydrologic Regime and Floodplain Connectivity
Subwatershed indicator ratings for water quantity ratings by ecosystem are shown in table 47. More than half of the 6th level subwatersheds in the GMUG are considered to be functioning properly with respect to hydrologic regime. Consequently, the majority of each riparian/wetland ecosystem occurs in subwatersheds that have properly functioning hydrologic regimes. In terms of hydrologic regimes, riparian shrublands are located in subwatersheds that are the least departed from proper functioning condition, while fens and cottonwood riparian areas are located in subwatersheds that are the most departed. Atypical hydrologic regimes in these two systems are of particular concern.
Vegetation Condition and Function
Subwatershed indicator ratings for vegetation condition and function by riparian/wetland ecosystem are shown in table 47. Most riparian and wetland ecosystems in the GMUG are located in subwatersheds with properly functioning vegetation, with the exception of cottonwood riparian systems, a majority of which are in “fair/functioning at risk” subwatersheds. A number of fens, wet meadows and marshes, and riparian shrublands and woodlands are also located in subwatersheds departed from reference conditions with “functioning at risk” ratings for vegetation condition.
Table 47. Vegetative functional condition of riparian and wetland ecosystems in the GMUG National Forests [Reported as percentage of ecosystem area by subwatershed indicator rating]
Ecosystem Functioning Properly
(percent) Fair/ Functioning at Risk
(percent) Impaired (percent)
Fen 71 29 0 Montane-alpine wet meadow and marsh 58 39 3

GMUG National Forests Land Management Plan Draft Environmental Impact Statement: Volume 1
115
Ecosystem Functioning Properly
(percent) Fair/ Functioning at Risk
(percent) Impaired (percent)
Montane-subalpine riparian shrubland 59 41 1 Montane-subalpine riparian woodland 58 39 3 Cottonwood riparian 32 64 4
Human-Caused Stressors
Subwatershed indicator ratings were also assessed across ecosystems based on roads and trails, rangeland vegetation conditions, and terrestrial invasive species (USDA Forest Service 2018, aquatic, riparian, and wetland ecosystems). Of these, roads and trails have the greatest impact on riparian and wetland ecosystems. A majority of each riparian and wetland ecosystem is functioning at risk for roads and trails; however, most areas are functioning properly for rangeland vegetation condition and terrestrial invasive species. Rangeland vegetation conditions and invasive species measurements show the greatest impact in cottonwood riparian ecosystems, and similar impacts for all other ecosystems. Wet meadows and marshes are also impacted by high livestock use historically, with residual effects including headcutting, trailing, water channeling, and postholing (Belsky and Blumenthal 1997).
Physical Sensitivity
Though all ecosystems have substantial areas of high sensitivity (due to inherent physical characteristics that dictate sediment and runoff generation), the assessment indicated that fens and riparian shrublands in the GMUG have the greatest proportion of their area in highly sensitive subwatersheds (USDA Forest Service 2018, aquatic, riparian, and wetland ecosystems).
Summary of Ecological Integrity by Ecosystem
This section provides an integrated summary of aquatic ecosystem integrity based on the preceding evaluation of key ecosystem characteristics. Due to data limitations and other factors, interpretation and conclusions are not possible for all ecosystems, characteristics, or scales. Where a departure from ecological integrity is indicated and sufficient data are available, we discuss whether conditions are due to contemporary management or other drivers and stressors outside of Forest Service control. An overview of ecological integrity by ecosystem, at the plan scale, is provided in table 48 and table 49. Based on the best available scientific information, ecological departure is evident across multiple aquatic ecosystems in the GMUG. Human-caused stressors and climate change are known risk factors for all aquatic, riparian, and wetland ecosystems. Please refer to the Key Ecosystem Characteristics section for more discussion. The following sections provide further discussion on the ecological integrity of these ecosystems, including ecological risks and potential future trends associated with climate change.

USDA Forest Service
116
Table 48. Ecological integrity of aquatic ecosystems in the GMUG National Forests
Ecosystem Habitat Structural Characteristics Habitat Connectivity Aquatic Species Rivers and streams Unknown Departed Departed
Table 49. Ecological integrity of wetland and riparian ecosystems in the GMUG National Forests [NRV, natural range of variation]
Ecosystem Hydrologic Regime,
Floodplain Connectivity Vegetation Condition/
Function
Fens Moderately Departed Within NRV Montane-alpine wet meadows and marshes Moderately Departed Moderately Departed
Montane-subalpine riparian shrublands Within NRV Moderately Departed Montane-subalpine riparian woodlands Moderately Departed Moderately Departed Cottonwood riparian Moderately Departed Departed
Rivers and Streams
Based on the condition of subwatersheds in which they occur, rivers and streams in the GMUG are departed from reference conditions for habitat connectivity and aquatic species composition (table 48). The Gunnison Basin Climate Change Vulnerability Assessment (Neely et al. 2011) identified small high-elevation streams as low to moderately vulnerable to climate change (high confidence), and mid-size streams and rivers as moderate to highly vulnerable (medium confidence). The potential direct effects of climate change to streams and rivers include reduced precipitation, earlier and shorter periods of snowmelt runoff, attenuated baseflows in streams, and increased stream temperatures (Rieman and Isaak 2010). Potential indirect effects include increased erosion and sedimentation after uncharacteristic wildfires, changes in the hydrologic regime due to extensive and severe insect outbreaks, and impacts associated with more frequent extreme weather events, including droughts and floods (Vose et al. 2012).
Fens
Based on the condition of subwatersheds in which they occur, fens are moderately departed for hydrologic regime and floodplain connectivity. Compared to other aquatic and riparian ecosystems assessed, fens have the highest sensitivity to physical disturbance. As grouped in the broader category of high-elevation groundwater-dependent wetlands, fens are expected (with high confidence) to be low to moderately vulnerable to climate change (Neely et al. 2011). Although fens have existed for thousands of years in the GMUG, they now face an uncertain future because of climate change. Changes in groundwater levels can have a large impact on fens, but changes in precipitation level can take time to translate into changes in groundwater levels, with the rate of correlation varying from place to place (CNHP 2015).

GMUG National Forests Land Management Plan Draft Environmental Impact Statement: Volume 1
117
Montane-Alpine Wet Meadows and Marshes
Based on the condition of subwatersheds in which they occur, montane-alpine wet meadows and marshes are moderately departed for hydrologic regime and floodplain connectivity, and vegetation condition and function. The vulnerability of this ecosystem to climate change depends on elevation. High-elevation groundwater-dependent wetlands are rated as low to moderately vulnerable to climate change (high confidence), while montane groundwater-dependent wetlands are rated as highly vulnerable to climate change (high confidence) (Neely et al. 2011). Wet meadows may be groundwater-dependent, but can also be associated with snowmelt or overland flow. These wet meadow subtypes have not been assessed for climate change vulnerability.
Montane-Subalpine Riparian Shrublands
Based on the condition of subwatersheds in which they occur, montane-subalpine riparian shrublands are moderately departed from reference conditions for vegetation condition and function. The vulnerability of this ecosystem to climate change depends on elevation. High-elevation riparian is rated as low to moderately vulnerable to climate change, while mid-elevation riparian is rated as moderately vulnerable to climate change (both with medium confidence) (Neely et al. 2011).
Montane-Subalpine Riparian Woodlands
Based on the condition of subwatersheds in which they occur, montane-alpine riparian woodlands are moderately departed for hydrologic regime and floodplain connectivity, and vegetation condition and function. The vulnerability of this ecosystem to climate change depends on elevation. High-elevation riparian is rated as low to moderately vulnerable to climate change, while mid-elevation riparian is rated as moderately vulnerable to climate change (both with medium confidence) (Neely et al. 2011).
Cottonwood Riparian Woodlands
Based on the condition of subwatersheds in which they occur, cottonwood riparian woodlands are moderately departed from reference conditions for hydrologic regime and floodplain connectivity, and departed for vegetation condition and function. This ecosystem is rated as highly vulnerable to climate change (low confidence) (Neely et al. 2011).
Sustainability of Aquatic, Riparian, and Wetland Ecosystems Current available information suggests that aquatic, riparian, and wetland ecosystems and their key characteristics generally maintain high integrity. However, roads and trails are a significant stressor in all ecosystems, and lower-elevation ecosystems, in general, have lower ecosystem integrity in the GMUG. In addition to the impacts of changing climate, forecasted human population growth may impact riparian and wetland ecosystems in the plan area with increases in the demand for water, exurban development and road density, and visitor use and recreation impacts.

USDA Forest Service
118
The Forest Service Rocky Mountain Research Station has built predictive stream temperature models for the State of Colorado (USDA Forest Service 2017c). Model results suggest that many high-elevation streams in the GMUG are too cold for native fishes (cutthroat trout and bluehead sucker) currently, but could become more suitable for cutthroat trout in the future if stream temperatures rose as much as 3 °C. However, the model’s down-scaled predictions suggest that all but the highest-elevation streams in the GMUG National Forests would become too warm for native cutthroat trout. In their current states, the riparian and wetland ecosystems within the GMUG National Forests have the ability to meet the needs of the present generation without compromising the ability of future generations to meet their needs. However, water demand is anticipated to increase. Combined with the outlook for a possible shift to a warmer and drier climate, with less input and more drawdown, the sustainability of riparian and wetland ecosystems will be impacted.
Environmental Consequences
Analysis Framework This programmatic land management plan analysis focuses on broadscale estimated effects related to impacts to aquatic and riparian resources on National Forest System lands. The spatial analysis area for aquatic and riparian resources include all the lands within the boundary of the Grand Mesa, Uncompahgre, and Gunnison National Forests. This area represents where changes may occur because of Forest Service management actions. The temporal scope of this analysis assumes a time span of about 15 years, the life of the plan. This analysis is divided into two parts. 1) Aquatic ecosystems include streams, rivers, and lakes and associated aquatic organisms, and 2) riparian and wetland ecosystems include riparian and wetland ecosystems such as fens, montane-alpine wet meadows and marshes, montane-subalpine riparian shrublands, montane-subalpine riparian woodlands, and cottonwood riparian woodlands. Riparian shrubland systems comprise over half of all riparian and wetland ecosystems in the plan area. The key indicators for assessing both aquatic and riparian resources among alternatives are the level of protection of these areas based on a qualitative assessment of plan components, the acreage of recommended wilderness in each alternative, and the acres of projected timber harvest in each alternative. Management activities such as timber harvest, dispersed recreation, livestock grazing, and mining activities can also cause ground disturbance and detrimentally impact aquatic and riparian resources. However, the differences in scale, extent, and distribution of these impacts are slight between alternatives. It can be reasonably assumed that the greatest future impacts to aquatic and riparian ecosystems would come from those management activities that are known to have resulted in impacts to these areas during previous planning periods, namely National Forest System roads and trails. For the purposes of this analysis, existing and potential new temporary roads associated with suitable timber base acreage offer a surrogate for future impacts to these areas.

GMUG National Forests Land Management Plan Draft Environmental Impact Statement: Volume 1
119
Methods and Assumptions
This analysis takes a programmatic look at the outcomes that may result from implementing the proposed management direction for each alternative over the life of the plan. For estimating effects at the programmatic forest plan level, it is assumed that the types of resource management activities allowed under the action alternatives are reasonably foreseeable future actions to achieve the Forest Service mission. Since future activitiy locations are not known at the programmatic land management plan level, specific spatial and temporal effects to aquatic and riparian ecosystems cannot be exactly determined. Therefore, impacts of potential management actions are considered predominantly as indirect impacts to these ecosystems. This summary impacts analysis for aquatic and riparian ecosystems relies primarily on an assessment of which management activities have the greatest ability to impact these areas, and which alternatives propose the greatest number of acres that are available to those management activities. For aquatic and riparian resources, broadscale outcomes were qualitatively estimated for effects on hydrologic function and watershed processes and resulting impacts on riparian and wetland ecosystems for forest lands within the project area. Existing conditions and trends for ecosystem health were derived from watershed condition framework surveys (USDA Forest Service 2018, aquatic, riparian, and wetland ecosystems assessment) and are considered in this environmental analysis. The watershed condition framework is discussed further in the Water Resources section. Watershed conservation practices and plan components including forest plan standards prescribe extensive measures to protect aquatic and riparian function and minimize effects caused by active forest management (MacDonald and Stednick 2003, Thomas et al. 2006, Reeves et al. 2006, Reiter et al. 2009). If all applicable measures are implemented and if they are effective, then adverse effects from any of the alternatives should be minimized. It is unlikely that plan components will prevent all adverse effects from occurring for each and every action that may be implemented in the GMUG. Therefore, alternatives that propose higher levels of activity for various resources pose greater inherent risks to aquatic and riparian resources. Cumulative effects from adjacent management of other National Forest System units and state and private entities could measurably impact aquatic and riparian resources for this programmatic analysis. Further details of these cumulative effects would be determined during site-specific analysis.
Management Direction Management direction under the current plan calls for protection of aquatic systems and riparian areas, and maintaining the integrity of these ecosystems through prescriptive strategies. The 2012 Planning Rule broadened aquatic and riparian management direction, requiring plans to maintain or restore aquatic and riparian ecosystems, described more succinctly as ecosystem services.
Effects of the No-Action Alternative The no-action alternative provides extensive direction for protection of aquatic and riparian resources during management activities. It is highly prescriptive and provides specific

USDA Forest Service
120
details on how these areas would be managed. Outcomes for aquatic and riparian resources under current management would likely continue to be maintained or improved. In contrast the draft revised forest plan provides guidelines for maintaining and improving resource conditions and key ecosystem characteristics as well as providing ecosystem services like clean water.
Effects Common to Action Alternatives Overall, aquatic- and riparian-related plan components in the draft revised forest plan would maintain or improve aquatic and riparian ecosystems while allowing management flexibility with respect to mitigating disturbance. Draft revised forest plan direction for aquatic and riparian ecosystems does not vary by plan alternative. For aquatic and riparian ecosystems, the draft revised forest plan provides more strategic, adaptive direction than the prescriptive, tactical direction of the current plan. All action alternatives add standards and guidelines that are not present in the current plan and would move the management decisions to be more of an ecological land management approach. For instance, for aquatic systems, standard FW-STND-AQTC-04 would prevent incidental mortality of native species during water drafting, and FW-STND-AQTC-05 would protect aquatic organisms at stream crossings and at in-stream structures including impoundments, diversions, and weirs on perennial streams and intermittent streams. In the draft revised forest plan for riparian management zones, management activities must maintain or restore the connectivity, composition, function, and structure of riparian and wetland areas in the long term (FW-STND-RMGD-08) and that stream thermal cover be conserved and windthrow prevented within the riparian management zone (FW-STND-RMGD-09).
Aquatic Ecosystems - Direct and Indirect Effects Nearly all land management direction implemented and described in this analysis has the potential to indirectly and possibly adversely affect aquatic resources to some degree. Activities that alter the quantity, timing, or quality of water resources have the greatest potential for adverse effects, and the risk of adverse effects generally decreases as the distance away from streams or wetlands increases. Watershed conservation practices, best management practices, forest plan standards and guidelines, and management approaches prescribe extensive measures to protect soil, riparian, and therefore aquatic ecosystems. When applicable measures are implemented and effective, adverse effects to these resources from management activities will be minimized or eliminated. Indirect effects are those that occur at a later date or different place than the original effect. Indirect effects related to this planning effort from specific programs are summarized below.
Effects on Aquatic Ecosystems from Vegetation Management including Timber Harvest and Mechanical Fuel Reductions
As described in the Watershed Resources section below, it is assumed for this analysis that the highest potential impacts on aquatic ecosystems would be related to road construction or reconstruction associated with timber harvest or some types of mechanical fuels reduction. Indirect effects to aquatic ecosystems and fisheries would be from the subsequent

GMUG National Forests Land Management Plan Draft Environmental Impact Statement: Volume 1
121
sedimentation and nitrification contributing to degrading of fishery habitat (Silins et al. 2014). The impacts from mechanical fuels reductions and timber sales on the magnitude, timing, and duration of streamflow, and on water quality, are described in the Watershed Resources section. Other vegetation management, including utility corridors and potential ski area modifications and expansions, may result in impacts that are similar to those from timber harvest. Beyond the effects of sediment from vegetation management, fisheries and aquatic species can be impacted by a reduction of streamside vegetation. Some reduction in streamside vegetation can reduce shade and therefore increase average annual and average daily stream temperature. Decreased recruitment of large woody debris in streams also can result. Overhanging vegetation provides cover for fish and helps cool stream temperatures. Large woody debris recruitment is important because it dissipates erosive stream energy, regulates sediment movement downstream, provides nutrients, and creates pools important to aquatic species. By alternative, the greatest impacts to aquatic ecosystems from vegetation management under the action alternatives would be under alternatives C and B, followed by alternative D. Alternatives C and B propose a higher acreage of harvest and have the higher potential to impact aquatic ecosystems.
Effects on Aquatic Ecosystems from Fire Management
Draft plan components benefit aquatic systems by calling for maintaining the structure and function of riparian management zones by stating that firelines would be located and configured to minimize sediment delivery and limit the creation of new stream channels (guideline FW-GDL-RMGD-13). Prescribed burns would likely result in considerably less severe impacts as compared to wildfire. Under prescribed burns, the location and severity of the fire are controlled to a greater extent; therefore, more ground cover would remain, and the erosion potential would be reduced. Sediment trapping buffers would generally remain around stream channels in order to reduce the amount of sediment delivered to the stream. Rarely do entire watersheds burn as a result of prescribed burns or wildfires managed for multiple resource benefits. These treatments are beneficial because they can reduce the impacts of changes in water yield and peak flows due to conditions such as drought. Furthermore, the careful and judicious use of prescribed burns may help reduce the risk of uncontrolled wildfires that may otherwise burn through and severely damage watersheds and riparian areas, increase erosion and sedimentation, and degrade large segments of fishery habitat. The most acres are proposed for prescribed burning in alternative C, followed by B, then D, then A. C would have relatively more short-term impacts to aquatic ecosystems compared to B, D, and A, but the long-term benefits may also be greater.
Effects on Aquatic Ecosystems from Livestock Grazing
The general impacts related to livestock grazing on aquatic ecosystems are discussed in the Watershed Resources and Riparian sections. Specifically, the primary impact to fisheries and

USDA Forest Service
122
aquatic species would be mainly due to degraded habitat resulting from erosion and sedimentation and increased stream temperatures caused by long-term concentrated grazing in riparian areas where streambank trampling and trailing, stream widening, and streamside vegetation removal can occur, resulting in insufficient overhead cover for fish (Platts 1991). Another impact to fisheries and aquatic species would be due to the construction of new stock ponds, and livestock water and the resulting water depletion and potentially reduced streamflows. Application of plan direction in all alternatives should ensure proper grazing management and reduce the effects to fisheries and aquatic ecosystems. Overall, the long-term impacts related to livestock grazing on aquatic ecosystems would be minor. Impacts vary little by alternative because suitable and available livestock grazing acreages are unchanged. The corresponding impacts on fish habitat from sediment and increased stream temperatures would therefore also be similar for action alternatives.
Effects on Aquatic Ecosystems from Roads and Trails
The primary impacts to aquatic ecosystems related to roads and trails are on streamflow and sediment production and are described in the Watershed Resources and Soils sections. Specifically, with regard to aquatic ecosystems, heavy sediment loads can reduce pool depths, bury stream substrates and spawning gravels, adhere to aquatic insects and the gills of fish, increase habitat for tubifex worms (Tubifex tubifex) (an intermediate host for whirling disease), alter channel form and function, and result in other forms of habitat degradation. Improperly placed, shaped, and sized culverts can act as fish barriers on key streams or exacerbate erosion and, in turn, result in headcutting. For any given watershed, the overall risks of impacts to aquatic ecosystems due to roads tend to increase with new road construction or reconstruction. Conversely, risks of impacts to aquatic and riparian ecosystems tend to decrease with road closure. Road maintenance may result in short-term increases in soil erosion; however, routine road maintenance provides opportunities to stabilize road features and improve road drainage. The location of roads is also an important consideration when minimizing erosion and sedimentation of streams. Roads adjacent to stream channels can potentially increase sedimentation and restrict channel meander or increase stream slope, causing the stream to downcut and erode. The relative impacts of roads on aquatic resources are based on changes in use and management practices by alternative. With more acreage of harvest proposed in alternatives B and C, it is assumed that there would be more temporary roads with corresponding aquatic impacts relative to alternative D.
Effects on Aquatic Ecosystems from Developed and Dispersed Recreation
The effects from developed and dispersed recreation would be the same across all action alternatives for the following reasons. Colorado Parks and Wildlife laws and regulations prevent over-exploitation of fish populations through angling with catch and release fishing for core conservation populations throughout most of the GMUG. Habitat alteration from recreational camping and day-use sites might cause some site-specific impacts, but those should not be extensive enough to measurably limit fish populations. Localized impacts to

GMUG National Forests Land Management Plan Draft Environmental Impact Statement: Volume 1
123
vegetation and banks in riparian areas would occur at lakes with fish and at river access sites, and generally effects would be the same among all alternatives. There would be little to no effects on aquatic and riparian resources from fishing. Increases in recreational visitation increase the risks to aquatic communities. The greatest threat from recreation is introduction of aquatic invasive species. These species include any non-native plant or animal species and disease that threatens the diversity or abundance of native species, the ecological stability of infested waters, or commercial, agricultural, or recreational activities dependent on such waters. Some include zebra and quagga mussels, New Zealand mudsnails, whirling disease, and non-native fish. While non-native fish such as brook and rainbow trout are desirable in many locations, there are places where they are not. Most of the pathways of introduction and spread of aquatic nuisance species are related to human activities, both accidental and intentional. Aquatic invasive species (i.e., zebra and quagga mussels) can be accidentally transported and spread by way of recreational boats and wading boots. Education and outreach will continue to be important to prevent the increased spread of these species, and the Forest Service Rocky Mountain Region continues to support Colorado Parks and Wildlife and other cooperators to set up key check stations for aquatic invasive species throughout Colorado.
Effects on Aquatic Ecosystems from Designation of Wilderness; Roadless, Wildlife, and Special Management Areas; Wild and Scenic Rivers
The primary impacts on aquatic ecosystems related to newly designated areas in the GMUG are discussed for wilderness, wildlife and special interest areas, and wild, scenic, and recreational rivers, respectively. Alternative D has the most acres analyzed for wilderness and other special areas, followed by B, and no new special areas in C. Alternative D proposes additional designated areas that would maximize the connectivity of habitat and increase opportunities for primitive and semi-primitive visitor experiences, including wildlife management areas. Wild and scenic river status is the same for all alternatives. Policies would provide protection for river flow characteristics and water quality for designated streams and rivers and their tributaries. Recreation pressure may increase for newly identified special areas, including fishing, but this is not expected to be substantial, as most of these are relatively remote or little used by the public. Revised management direction in all action alternatives to address habitat connectivity and ecosystem integrity related to aquatic ecosystems applies regardless of the designations listed above.
Cumulative Effects
Actions taken to implement any of the alternatives, along with past, present, and foreseeable future activities undertaken in the planning area (or other nearby jurisdictions, including local, state, Native American Tribal, and other Federal actions, as well as private) could result in cumulative impacts. Cumulative impacts cover the implementation timeframe of the approved forest plan and include lands and aquatic systems within or downstream of the
USDA Forest Service
124
planning area. Other reasonably foreseeable projects in the analysis area that may cumulatively affect aquatic ecosystems include Bureau of Land Management Resource Area plan revision for adjacent lands, forest plan revision and management for the San Juan, White River, Pike and San Isabel, and Rio Grande National Forests, as well as ongoing management for Black Canyon of the Gunnison National Park, and other adjoining Federal and State lands. Generally, management of adjacent Federal lands is complementary to the GMUG in efforts to reduce cumulative and other impacts to aquatic ecosystems. For cumulative effects, depending on the location of ground-disturbing activities, for site-specific project analysis the cumulative impacts of sedimentation may range from no impact to adverse for certain stretches of stream habitat and individual fish, especially in headwater systems; however, effects would be analyzed at the site-specific, project-level analysis level. Importantly, ongoing restoration management of native fish species is occurring and will continue to occur off of National Forest System lands in other areas of southern Colorado. Successful restoration efforts on nearby populations within the GMUG, or similar efforts for other species, contribute to the management as a whole and further reduce the likelihood of future Federal listings, especially with support of these efforts by the GMUG.
Riparian Ecosystems – Direct and Indirect Effects This analysis will discuss both riparian areas and associated wetlands. Action alternatives B through D essentially represent varying partitions of acreage among a variety of potential uses, ranging from restrictive management prescriptions (e.g., wilderness) to general forest areas that are suitable for harvest, grazing, and dispersed/motorized recreation. To meet ecological objectives, harvest or fuels management may occur in riparian areas. Livestock grazing impacts to riparian and wetland ecosystems are expected to remain consistent with those observed in the previous planning period, and will not vary by alternative. Among the action alternatives, alternative D represents a minimization of acreages that would be available for expansion of the road and trail network, particularly for motorized vehicles and timber harvest. As a result, alternative D would likely have the fewest impacts on riparian and wetland ecosystems. Alternatively, alternative C represents a maximum number of acres available for the potential expansion of the motorized trail network, and the maximum number of timber harvest acres, and the associated necessary temporary access roads. Consequently, alternative C would likely have the greatest impacts to riparian and wetland ecosystems. Despite the same proposed timber harvest as in alternative C, the impacts of alternative B would likely be lower in magnitude to those of alternative C due to a relatively smaller area in a motorized recreation setting and a high proportion of wildlife management areas. The potential watershed impacts in order of magnitude would range from alternative D at the low end, to alternative B, followed by alternative C at the high end for watershed impacts.
Effects on Riparian Ecosystems from Vegetation Management including Timber Harvest and Mechanical Fuel Reductions
Vegetation management and timber harvest within riparian and wetland ecosystems is constrained sufficiently by forest plan components such that these activities do not negatively affect riparian or wetland ecological management objectives.

GMUG National Forests Land Management Plan Draft Environmental Impact Statement: Volume 1
125
Roads directly alter riparian vegetation when, by necessity, they cross the riparian corridors associated with streams. These alterations come by means of both riparian vegetation removal at the site of the stream crossing, and via alteration of surface and subsurface flow patterns, which can subsequently alter riparian vegetation communities. Roads are not permitted in wetland ecosystems, but do have the potential to alter surface and subsurface flow patterns in the vicinity of these areas. Other impacts from timber harvest include the alteration of the hydrologic cycle in the immediate vicinity of the harvest, which may modify the timing and magnitude of runoff, and change the amount of water available to riparian and wetland areas. The impacts on riparian and wetland ecosystems from timber harvest and vegetation management would vary to some degree based on the acres proposed for harvest between alternatives. Acres of harvest vary substantially by alternative, with all action alternatives representing a substantial increase over alternative A. Based on proposed harvest acreage and management direction, alternatives C and B would be expected to have the greatest impacts to riparian and wetland areas, followed by alternative D.
Effects on Riparian Ecosystems from Livestock Grazing
Improper grazing practices can impact riparian area and wetland ecosystems through several mechanisms. Grazing impacts such as trailing along and through riparian and wetland areas, long seasons of use, and poor timing of livestock grazing can result in long recovery times, soil compaction, pugging, hummocking, soil sloughing, and changes in desirable vegetation species composition. In addition, unmanaged livestock grazing can crush and uproot plants due to trampling. Overgrazing and excessive seasons of use can decrease plant vigor and root reserves, which could result in plant mortality and loss of ground cover. Resulting bare soil could in turn reduce infiltration and increase runoff, impacts that subsequently lead to problems with physical channel stability that can further damage riparian plants via stream channel downcutting and altered patterns of sediment production and deposition. For these reasons, unmanaged livestock grazing impacts could decrease the abundance and distribution of desirable native plants and change the composition, structure, and function of the affected riparian area and wetland ecosystems. In particular, native willows are often selectively and excessively browsed by cattle and frequently sustain impacts when unmanaged livestock grazing practices occur over time. The impacts described above are typically avoided through proper rangeland management, which entails the application of the standards, guidelines, and management approaches detailed in the draft revised forest plan, along with a variety of other tools. Periodic monitoring and assessment of conditions can drive changes in management practices to remedy undesirable conditions. For permitted livestock grazing, there is no meaningful difference among the alternatives. Plan components that are common to alternatives B, C, and D place an increased emphasis on the health and functionality of riparian vegetation and wetlands.
Effects on Riparian Ecosystems from Recreation
Riparian and wetland areas typically attract recreational activities such as motorized travel, camping, hiking, mountain biking, and horseback riding. If not properly managed, these

USDA Forest Service
126
activities have the potential to impact riparian areas and wetland ecosystems by physically removing vegetation, or crushing or displacing shrubs and herbs, which results in mortality to plants and the loss of canopy and ground cover. If recreational activities (particularly motorized) occur in riparian or wetland areas when soils are saturated, severe rutting typically occurs, which can lead to erosion and loss of native riparian and wetland ecosystem vegetation. Recreational activities also have the potential to introduce and spread terrestrial and aquatic invasive exotic plants that compete with native plants for space, water, and nutrients. The extent of these impacts depends largely on the vegetation type, plant growth form (graminoids are more resistant to damage compared to trees, shrubs, and forbs), slope, soil type, season, and weather conditions (Hill and Pickering 2009). Impacts to riparian area and wetland ecosystems from unmanaged recreational activities would be similar for all the alternatives. Alternatives that place an emphasis on non-motorized forms of recreation are most likely to avoid negative impacts to riparian and wetland ecosystems. As a consequence, due to fewer acres available to motorized recreation, alternative D would likely have the least recreational impacts to riparian and wetland resources, followed by alternative B, then C.
Effects on Riparian Ecosystems from Water Diversions and Water Development Projects
Water diversions and developments have a wide variety of impacts on riparian and wetland ecosystems. The reduction of available water has the potential to reduce the spatial extent and persistence of these areas, limit nutrient availability, and alter the species composition to favor those plants that are more resistant to water shortage. In other cases, sustained flow through late season releases from reservoirs has the ability to enhance the health of riparian and wetland ecosystems.
Effects on Riparian Ecosystems from Designation of Wilderness, Wild, Scenic, and Recreational Rivers, Research Natural Areas, and Special Interest Areas
The designation of special areas such as wilderness, wild, scenic, and recreational rivers, research natural areas, and special interest areas has the potential to limit the type of activities that frequently impact riparian and wetlands ecosystems. Particularly, the reduction of suitable timber base due to an increase in the acreage of recommended wilderness would result in reduced impacts to riparian and wetland ecosystems. This results from decreases in timber activity that could potentially alter the hydrology of these ecosystems, and decreased road construction activities that typically directly impact riparian areas. Impacts to riparian and wetland ecosystems from designations such as wild, scenic, and recreational river eligibility, research natural areas, and special interest areas will vary based on the reason or purpose of the designation, but in general would likely protect or enhance riparian and wetland areas. As a consequence, the nature and magnitude of impacts to riparian and wetland ecosystems under alternative C would be the highest, and would be greater than the expected impacts of alternative B. Alternative D would provide the lowest level of impacts to these systems, primarily due to the large number of acres of recommended wilderness.

GMUG National Forests Land Management Plan Draft Environmental Impact Statement: Volume 1
127
Effects on Riparian Ecosystems from Climate Variability
Over the past several decades the mountains of southwestern Colorado have seen reductions in peak snowpack and substantial shifts in the timing of snowmelt and snowmelt runoff toward earlier in the year (Clow 2010, Harpold et al. 2012). These trends are expected to continue or potentially accelerate in the future with rising temperatures and increasing variability of precipitation inputs (Lute et al. 2015, Scalzitti et al. 2016). Increased air temperatures, extreme high- and low-flow events, alterations to groundwater recharge patterns, and changes in various sediment and nutrient cycles all have the potential to impact riparian and wetland ecosystems. Reductions in baseflows, particularly in late summer when elevated temperatures increase evapotranspiration, have the ability to alter the species composition and spatial extent of riparian areas. Because climatic variables influence hydrologic processes, any change in precipitation, evapotranspiration, snow accumulation, or snowmelt will influence recharge to groundwater systems. Future climate change will affect recharge rates and, in turn, groundwater levels and the amount of groundwater available to support springs and wetlands (Ludwig and Moench 2009). Reduction of groundwater tables could alter both species composition and the spatial extent of these features across the landscape. Climate variability is the same across all alternatives; however, alternatives that limit disturbances to riparian and wetland ecosystems would provide the best opportunity for these areas to persist and maintain functionality into the future. As a consequence, alternative D is likely to realize fewer climate change-associated impacts to riparian and wetland ecosystems, followed by B and C.
Cumulative Effects
Cumulative effects were considered for the implementation period of the forest plan revision in the project area. Cumulative effects include the total impacts to riparian and wetland ecosystems from the destruction of vegetative cover and altered hydrology, and results from the incremental impact of the alternatives when added to other past, present, and reasonably foreseeable future actions occurring within the same natural drainage basin or watershed. The most pertinent past and current effects that need to be considered for this analysis are the impacts from the management of livestock grazing, timber harvest, and travel management. Reasonably foreseeable future actions included in this analysis are forest management projects that are in various stages of planning across the GMUG and impacts to private lands adjacent to the forest. When combined with the past, present, and reasonably foreseeable future actions, the indirect effects discussed above do not combine to create significantly larger cumulative impacts to riparian and wetland resources. As a consequence, total cumulative impacts mirror the indirect effects, with the impacts from alternative C having the highest potential for cumulative effects, while the impacts from alternative B would be lesser in magnitude. Alternative D would have the fewest cumulative impacts to riparian and wetland ecosystems.

USDA Forest Service
128
Conclusion Consistent with 36 CFR 219.8(a)(1),(3), the effects of plan direction would maintain or restore the ecological integrity of aquatic and riparian ecosystems in the plan area because plan components are designed to maintain the structure, function, composition, and connectivity of these areas. An objective establishes a clear target to restore riparian habitat and hydrologic function on streams (FW-OBJ-RMGD-06) in order to move toward the desired condition. Due to management area allocations and proposed timber harvest and fuels reduction acres, alternative D would have the lowest impact on aquatic and riparian ecosystems, followed by alternative B, then alternative C.
Wildlife and Plant Species This section describes the conditions and trends of select wildlife and plant species in the GMUG National Forests in the context of 1) ecosystem integrity and diversity; and 2) potential risk factors to species. Specifically, the ecological integrity of ecosystems and landscape features that provide habitat for groups of wildlife and plant species is considered. Condition and trend information draw upon other sections of this draft environmental impact statement including Terrestrial Ecosystems; Aquatic, Riparian, and Wetland Ecosystems; and Water Resources. This “coarse filter” approach is based on the assumption that ecosystem integrity and diversity provide the ecological conditions necessary to maintain the persistence or contribute to the recovery of native species within the plan area. However, because ecosystem integrity at a broad scale may not necessarily address all of a species’ requirements or influences (e.g., at-risk species), we also apply a “fine-filter” approach by assessing risk factors for various species. Both ecosystem integrity and risk factors under Forest Service control were considered in the design of alternatives and plan components for wildlife and plant diversity and sustainability. Due to the programmatic nature of this analysis, species accounts and site-specific information are generally not described here. Please refer to the at-risk species assessment including species overviews (USDA Forest Service 2018), which provides more detail on species’ status and trends, life histories, presence and distribution in the plan area, potential threats or risk factors, and related information.
Species Evaluated
At-Risk Species At-risk species include federally threatened, endangered, proposed, and candidate species, and species of conservation concern. Federally recognized species currently or formerly known to occur in the plan area, or that may be impacted by management of the GMUG, are listed in table 50. Appendix 1 of the At-Risk Species Assessment Report (USDA Forest Service 2018) provides detailed accounts of federally recognized species in the GMUG, including known threats and risk factors.

GMUG National Forests Land Management Plan Draft Environmental Impact Statement: Volume 1
129
Table 50. Threatened, endangered, proposed, and candidate species considered
Species Endangered Species Act Status Occurrence data Uncompahgre fritillary butterfly Boloria acrocnema
Endangered Known from several locations in the plan area
Gunnison sage-grouse Centrocercus minimus
Threatened; designated critical habitat in the GMUG
15 known leks in the plan area
Yellow-billed cuckoo (western) Coccyzus americanus
Threatened Not documented in the plan area
Southwestern willow flycatcher Empidonax traillii extimus
Endangered Not documented in the plan area
Mexican spotted owl Strix occidentalis lucida
Threatened Not documented in the plan area
North American wolverine Gulo gulo
Proposed Threatened Not documented in the plan area
Canada lynx Lynx canadensis
Threatened Multiple occurrence records in the plan area
Humpback chub Gila cypha
Endangered Present in the Colorado River system downstream of the plan area. Species is subject to the downstream impacts from management of the plan area, but is not found in the plan area.
Bonytail chub Gila elegans
Endangered Present in the Colorado River system downstream of the plan area. Species is subject to the downstream impacts from management of the plan area, but is not found in the plan area.
Colorado pikeminnow Ptychochelus lucius
Endangered Present in the Colorado River system downstream of the plan area. Species is subject to the downstream impacts from management of the plan area, but is not found in the plan area.
Razorback sucker Xyrauchen texanus
Endangered Present in the Colorado River system downstream of the plan area. Species is subject to the downstream impacts from management of the plan area, but is not found in the plan area.
DeBeque phacelia Phacelia submutica
Threatened; designated critical habitat in the GMUG
30 to 50 known sites in the plan area
Colorado hookless cactus Sclerocactus glaucus
Threatened Up to four known populations in the plan area

USDA Forest Service
130
Species Endangered Species Act Status Occurrence data Clay-loving wild buckwheat Eriogonum pelinophilum
Endangered Not documented in the plan area
Skiff milkvetch Astragalus microcymbus
Candidate Not documented in the plan area
Ute ladies'-tresses Spiranthes diluvialis
Threatened Not documented in the plan area
Species of conservation concern currently identified by the regional forester for consideration in this draft environmental impact statement and the draft revised forest plan are listed in table 51. Rationale for their inclusion as species of conservation concern is provided in appendix 9 of the draft revised forest plan. Species considered but not included on the species of conservation concern list and corresponding rationale are also located in the appendix. Detailed accounts of potential species of conservation concern are provided in the assessment species overviews (USDA Forest Service 2018, at-risk species). Appendix 3 of this draft environmental impact statement includes a crosswalk between species of conservation concern, applicable plan components, and an analysis of their sufficiency. Federally listed species are individually analyzed in this draft environmental impact statement, as they will eventually be individually addressed in a separate biological assessment in consultation with the U.S. Fish and Wildlife Service.
Table 51. Species of conservation concern in the GMUG National Forests
Common Name Scientific Name
Animals Boreal toad Anaxyrus boreas boreas Nokomis fritillary butterfly Speyeria nokomis ssp. nokomis Gunnison’s prairie dog Cynomys gunnisoni, “Population 1”1 Pronghorn Antilocapra americana Brown-capped rosy-finch Leucosticte australis Southwestern river otter Lontra canadensis ssp. sonora
Plants Stonecrop gilia Aliciella sedifolia Crandall's rockcress Arabis crandallii Gunnison milkvetch Astragalus anisus Sierra hare sedge Carex leporinella Canadian single-spike sedge Carex scirpoidea Osterhout’s thistle Cirsium osterhoutii Willow hawthorn Crataegus saligna San Juan draba Draba graminea Slender rock-break Cryptogramma stelleri

GMUG National Forests Land Management Plan Draft Environmental Impact Statement: Volume 1
131
Common Name Scientific Name Whitlow-grass Draba malpighiacea Colorado wild buckwheat Eriogonum coloradense Large-flower globe-mallow Iliamna grandiflora Colorado desert-parsley Lomatium concinnum Crandall’s beardtongue Penstemon crandallii ssp. procumbens Grand Mesa penstemon Penstemon mensarum Avery Peak twinpod Physaria alpina Piceance bladderpod Physaria parviflora
lime-loving willow Salix calcicola var. glandulosior Sphagnum Sphagnum angustifolium Girgensohn’s sphagnum Sphagnum girgensohnii Water awlwort Subularia aquatica Hanging garden sullivantia Sullivantia hapemanii var. purpusii Sun-loving meadowrue Thalictrum heliophilum Rothrock Townsend-daisy Townsendia rothrockii
1 “Population 1” refers to Gunnison’s prairie dog populations occurring in south-central Colorado and northeastern New Mexico, and corresponds roughly with the “montane” range (versus “prairie” range) of Gunnison’s prairie dog described in the U.S. Fish and Wildlife Service 12-month finding published in the Federal Register on February 5, 2008 (73 FR 6660).
Species of Interest – General Wildlife Species of interest include those with socioeconomic value and benefits to people (e.g., hunting and fishing), importance to ecosystem function in terms of key ecosystem conditions, and interconnectedness with species of conservation concern. In the GMUG, these species of interest include elk, mule deer, Rocky Mountain bighorn sheep, desert bighorn sheep, mountain goat, moose, pronghorn, black bear, dusky grouse, white-tailed ptarmigan, Merriam’s wild turkey, mountain lion, all small game species, waterfowl, pollinators including the western bumblebee, and common trout species. More information regarding species of interest is provided and referenced in the assessment (USDA Forest Service 2018, at-risk species). Species of interest and wildlife species in general are addressed in this draft environmental impact statement.
Affected Environment
Terrestrial Ecosystems and Associated Species In this section, the integrity of terrestrial ecosystems in the GMUG National Forests is examined in terms of associated and potentially affected wildlife and plant species, representing one component of the “coarse filter” approach described earlier. Ecological departure indicates risk to the integrity and sustainability of the affected ecosystem and, hence, associated wildlife and plant species. Please refer to the Terrestrial Ecosystems section, Summary of Ecological Integrity by Ecosystem for a more detailed discussion of conditions and trends of terrestrial ecosystems in the GMUG. While information about species associated with each ecosystem is included here as part of the affected environment,

USDA Forest Service
132
the environmental consequences of the plan direction on each ecosystem are detailed in the Terrestrial Ecosystems and Aquatic and Riparian Ecosystems sections.
Spruce-Fir
Spruce-fir is currently departed from reference conditions for distribution of structural stages, and potentially departed for fire regime. Its departure from snags and down woody material is unknown due to a lack of reference condition information for this characteristic. The departure from reference conditions for distribution of structural stages has implications for species that rely on mature stand habitat, as well as those found in deeply shaded and moist areas within spruce-fir forests. Species associated with the spruce-fir ecosystem in the GMUG are listed in table 52.
Table 52. Species associated with the spruce-fir ecosystem [T, threatened species; SCC, species of conservation concern; SI, species of interest]
Specific Community or Habitat Associated Species
General spruce-fir
Canada lynx (Lynx canadensis) (T) Dusky grouse (Dendragapus obscurus) (SI) Elk (Cervus elaphus) (SI)
Mule deer (Odocoileus hemionus) (SI)
Mature stands
American marten (Martes americana) (SI) Boreal owl (Aegolius funereus) (SCC) Elk (Cervus elaphus) (SI) Mule deer (Odocoileus hemionus) (SI)
Early successional habitats Black bear (Ursus americanus) (SI) Elk (Cervus elaphus) (SI) Mule deer (Odocoileus hemionus) (SI)
Openings Black bear (Ursus americanus) (SI)
Elk (Cervus elaphus) (SI) Mule deer (Odocoileus hemionus) (SI)
Openings; barren shale slopes Colorado wild buckwheat (Eriogonum coloradense) (SCC)
Shaded, moist to wet rocks, cliffs, and breaks Hanging garden sullivantia (Sullivantia hapemanii var. purpusii) (SCC)
Seeps Sierra hare sedge (Carex leporinella) (SCC) Black bear (Ursus americanus) (SI) Elk (Cervus elaphus) (SI)
Moist environments/wet meadows and edges of wetlands
Black bear (Ursus americanus) (SI) Moose (Alces alces americanus) (SI)
Wetlands within spruce-fir ecosystem Boreal toad (Anaxyrus boreas boreas) (SCC) Moose (Alces alces americanus) (SI)
Aspen
Aspen is currently departed from reference conditions for distribution of structural stages, and potentially departed for fire regime. Its departure from snags and down woody material is unknown due to a lack of reference condition information for this characteristic. Future loss or reduction of this cover type due to climate change may be offset by expansion of aspen into new areas as they become climatically suitable. Now or in the near future, aspen may also be departed from the natural range of variation for insects and disease. Insect pest

GMUG National Forests Land Management Plan Draft Environmental Impact Statement: Volume 1
133
attacks may benefit some aspen-dependent wildlife species, as insect pests comprise a substantial portion of the diet of many woodpeckers, bats, and other species. Species associated with the aspen ecosystem in the GMUG are listed in table 53.
Table 53. Species associated with the aspen ecosystem [SCC, species of conservation concern; SI, species of interest]
Specific Community or Habitat Associated Species
General aspen
Black bear (Ursus americanus) (SI) Dusky grouse (Dendragapus obscurus) (SI)
Elk (Cervus elaphus) (SI)
Moose (Alces alces americanus) (SI)
Mule deer (Odocoileus hemionus) (SI)
Early successional habitats Black bear (Ursus americanus) (SI) Elk (Cervus elaphus) (SI) Mule deer (Odocoileus hemionus) (SI)
Openings Grand Mesa penstemon (Penstemon mensarum) (SCC) Elk (Cervus elaphus) (SI) Mule deer (Odocoileus hemionus) (SI)
Sagebrush openings Elk (Cervus elaphus) (SI) mule deer (Odocoileus hemionus) (SI)
Moist roadsides/disturbed areas Large-flower globe-mallow (Iliamna grandiflora) (SCC) Mature aspen stands next to openings and water
Elk (Cervus elaphus) (SI) Mule deer (Odocoileus hemionus) (SI)
Wetlands within this ecosystem Boreal toad (Anaxyrus boreas boreas) (SCC) Moose (Alces alces americanus) (SI)
Spruce-Fir-Aspen
The spruce-fir-aspen cover type is currently departed from reference conditions for distribution of structural stages, and potentially departed for fire regime. Its departure from snags and down woody material is unknown due to a lack of reference condition information for this characteristic. Species associated with the spruce-fir-aspen ecosystem in the GMUG are listed in table 54.
Table 54. Species associated with the spruce-fir-aspen ecosystem [SCC, species of conservation concern; SI, species of interest]
Specific Community or Habitat Associated Species
General spruce-fir-aspen
American marten (Martes americana) (SI) Black bear (Ursus americanus) (SI)
Dusky grouse (Dendragapus obscurus) (SI) Elk (Cervus elaphus) (SI) Moose (Alces alces americanus) (SI) Mule deer (Odocoileus hemionus) (SI)
Openings Elk (Cervus elaphus) (SI) Mule deer (Odocoileus hemionus) (SI)
Early successional habitats Black bear (Ursus americanus) (SI) Elk (Cervus elaphus) (SI) Mule deer (Odocoileus hemionus) (SI)

USDA Forest Service
134
Specific Community or Habitat Associated Species
Moist to wet rocks, cliffs, and breaks Hanging Garden sullivantia (Sullivantia hapemanii var. purpusii) (SCC)
Moist roadsides/disturbed areas Large-flower globe-mallow (Iliamna grandiflora) (SCC)
Moist environments/wet meadows and edges of wetlands
Elk (Cervus elaphus) (SI) Moose (Alces alces americanus) (SI) Mule deer (Odocoileus hemionus) (SI)
Wetlands within this ecosystem Boreal toad (Anaxyrus boreas boreas) (SCC) Moose (Alces alces americanus) (SI)
Lodgepole Pine
Lodgepole pine is currently departed from reference conditions for distribution of structural stages, and potentially departed for fire regime. Its departure from snags and down woody material is unknown due to a lack of reference condition information for this characteristic. Now or in the near future, lodgepole pine may also be departed from reference conditions for insects and disease. Species associated with the lodgepole pine ecosystem in the GMUG are listed in table 55.
Table 55. Species associated with the lodgepole pine ecosystem [SI, species of interest]
Specific Community or Habitat Associated Species
General lodgepole pine and mature stands
American marten (Martes americana) (SI) Elk (Cervus elaphus) (SI) Moose (Alces alces americanus) (SI) Mule deer (Odocoileus hemionus) (SI)
Early successional habitats Elk (Cervus elaphus) (SI) Mule deer (Odocoileus hemionus) (SI)
Pinyon-Juniper
Pinyon-juniper is currently departed from reference conditions for distribution of structural stages. Pinyon-juniper with shrubs is departed and pinyon-juniper without shrubs is potentially departed from reference conditions for fire regime. Its departure from snags and down woody material is unknown due to a lack of reference condition information for this characteristic. Species associated with the pinyon-juniper ecosystem in the GMUG are listed in table 56.
Table 56. Species associated with the pinyon-juniper ecosystem [SCC, species of conservation concern; SI, species of interest]
Specific Community or Habitat Associated Species
General pinyon-juniper Merriam’s wild turkey (Meleagris gallapovo merriami) (SI) Mountain lion (Puma concolor) (SI) Mule deer (Odocoileus hemionus) (SI)
Openings Colorado desert-parsley (Lomatium concinnum) (SCC) Shale substrates Piceance bladderpod (Physaria parviflora) (SCC)

GMUG National Forests Land Management Plan Draft Environmental Impact Statement: Volume 1
135
Ponderosa Pine
Ponderosa pine is currently departed from reference conditions for distribution of structural stages and fire regime. Its departure from snags and down woody material is unknown due to a lack of reference condition information for this characteristic. Species associated with the ponderosa pine ecosystem in the GMUG are listed in table 57.
Table 57. Species associated with the ponderosa pine ecosystem [SCC, species of conservation concern; SI, species of interest]
Specific Community or Habitat Associated Species
General ponderosa pine
Abert’s squirrel (Sciurus aberti) (SI) Dusky grouse (Dendragapus obscurus) (SI) Elk (Cervus elaphus) (SI) Merriam’s wild turkey (Meleagris gallapovo merriami) (SI) Mule deer (Odocoileus hemionus) (SI)
Openings Rothrock Townsend-daisy (Townsendia rothrockii) (SCC) Elk (Cervus elaphus) (SI) Mule deer (Odocoileus hemionus) (SI)
Cool-Moist Mixed Conifer
Cool-moist mixed conifer is currently departed from reference conditions for distribution of structural stages and potentially departed for fire regime. Its departure from snags and down woody material is unknown due to a lack of reference condition information for this characteristic. Species associated with the cool-moist mixed conifer ecosystem in the GMUG are listed in table 58.
Table 58. Species associated with the cool-moist mixed conifer ecosystem [T, threatened species; SCC, species of conservation concern; SI, species of interest]
Specific Community or Habitat Associated Species
General cool-moist mixed conifer
Canada lynx (lynx canadensis) (T) American marten (Martes americana) (SI) Black bear (Ursus americanus) (SI) Dusky grouse (Dendragapus obscurus) (SI) Elk (Cervus elaphus) (SI) Moose (Alces alces americanus) (SI) Mule deer (Odocoileus hemionus) (SI)
Early successional habitats Black bear (Ursus americanus) (SI) Elk (Cervus elaphus) (SI) Mule deer (Odocoileus hemionus) (SI)
Openings Elk (Cervus elaphus) (SI) Mule deer (Odocoileus hemionus) (SI)
Rocks, cliffs, and breaks Hanging garden sullivantia (Sullivantia hapemanii var. purpusii) (SCC) Moist roadsides/disturbed areas Large-flower globe-mallow (Iliamna grandiflora) (SCC)

USDA Forest Service
136
Warm-Dry Mixed Conifer
Warm-dry mixed conifer is currently departed from reference conditions for distribution of structural stages and fire regime. Its departure from snags and down woody material is unknown due to a lack of reference condition information for this characteristic. Species associated with the warm-dry mixed conifer ecosystem in the GMUG are listed in table 59.
Table 59. Species associated with the warm-dry mixed conifer ecosystem [SCC, species of conservation concern; SI, species of interest]
Specific Community or Habitat Associated Species
General warm-dry mixed conifer
Black bear (Ursus americanus) (SI) Dusky grouse (Dendragapus obscurus) (SI) Elk (Cervus elaphus) (SI) Mule deer (Odocoileus hemionus) (SI) Merriam’s wild turkey (Meleagris gallapovo merriami) (SI)
Early successional habitats Black bear (Ursus americanus) (SI) Elk (Cervus elaphus) (SI) Mule deer (Odocoileus hemionus) (SI)
Openings Elk (Cervus elaphus) (SI) Mule deer (Odocoileus hemionus) (SI)
Open Douglas-fir forests Crandall's rockcress (Arabis/ Boechera crandallii) (SCC)
Bristlecone-Limber Pine
Bristlecone-limber pine is currently departed from reference conditions for distribution of structural stages. It is also departed from reference conditions for fire regime at lower elevations (lower than 10,000 feet). Its departure from snags and down woody material is unknown due to a lack of reference condition information for this characteristic. Species associated with the bristlecone-limber pine ecosystem in the GMUG are listed in table 60.
Table 60. Species associated with the bristlecone-limber pine ecosystem [SI, species of interest]
Specific Community or Habitat Associated Species General bristlecone-limber pine Dusky grouse (Dendragapus obscurus) (SI)
Montane Shrubland, Oak-Serviceberry-Mountain Mahogany
Montane shrubland, oak-serviceberry-mountain mahogany is currently departed from reference conditions for distribution of structural stages and fire regime. Species associated with the montane shrubland, oak-serviceberry-mountain mahogany ecosystem in the GMUG are listed in table 61.

GMUG National Forests Land Management Plan Draft Environmental Impact Statement: Volume 1
137
Table 61. Species associated with the montane shrubland, oak-serviceberry-mountain mahogany ecosystem [SCC, species of conservation concern; SI, species of interest]
Specific Community or Habitat Associated Species
General montane shrubland, oak-serviceberry-mountain mahogany
Grand Mesa penstemon (Penstemon mensarum) (SCC) Gunnison's prairie dog (Cynomys gunnisoni) (SCC) Black bear (Ursus americanus) (SI) Elk (Cervus elaphus) (SI) Merriam’s wild turkey (Meleagris gallapovo merriami) (SI) Mule deer (Odocoileus hemionus) (SI)
Green River formation substrate Piceance bladderpod (Physaria parviflora) (SCC) Sun-loving meadowrue (Thalictrum heliophilum) (SCC)
Sagebrush Shrubland
Sagebrush shrubland is potentially departed from reference conditions for fire regime. However, as with most non-forested ecosystems in the GMUG, the overall ecological integrity of this cover type is uncertain due to limited information on pre-settlement reference conditions. Other risk factors include non-native plants, livestock use, roads, past management practices, and climate change. Species associated with the sagebrush shrubland ecosystem in the GMUG are listed in table 62.
Table 62. Species associated with the sagebrush shrubland ecosystem [T, threatened species; CH, designated critical habitat in the plan area; SCC, species of conservation concern; SI, species of interest]
Specific Community or Habitat Associated Species
General sagebrush shrubland
Gunnison sage-grouse (Centrocercus minimus) (T/CH) Crandall's rockcress (Arabis/Boechera crandallii) (SCC) Rothrock Townsend-daisy (Townsendia rothrockii) (SCC) Elk (Cervus elaphus) (SI) Mule deer (Odocoileus hemionus) (SI) Pronghorn (Antilocapra americana) (SI)
Sagebrush winter range Elk (Cervus elaphus) (SI) Mule deer (Odocoileus hemionus) (SI) Pronghorn (Antilocapra americana) (SI)
Disturbed areas Grand Mesa penstemon (Penstemon mensarum) (SCC) Clay soils Gunnison milkvetch (Astragalus anisus) (SCC) Shale slopes Colorado wild buckwheat (Eriogonum coloradense) (SCC)
Montane-Subalpine Grasslands
As with most non-forested ecosystems in the GMUG, the overall ecological integrity of montane-subalpine grasslands is uncertain due to limited information on pre-settlement reference conditions. Risk factors include livestock use, altered fire regimes, roads and trails, invasive plants, and climate change. Species associated with the montane-subalpine grasslands ecosystem in the GMUG are listed in table 63.

USDA Forest Service
138
Table 63. Species associated with the montane-subalpine grasslands ecosystem [SCC, species of conservation concern; SI, species of interest]
Specific Community or Habitat Associated Species
General montane-subalpine grasslands
Rothrock Townsend-daisy (Townsendia rothrockii) (SCC) Black bear (Ursus americanus) (SI) Elk (Cervus elaphus) (SI) Mule deer (Odocoileus hemionus) (SI) Pronghorn (Antilocapra americana) (SI)
Montane
Crandall's rockcress (Arabis/Boechera crandallii) (SCC) Gunnison milkvetch (Astragalus anisus) (SCC) Elk (Cervus elaphus) (SI) Mule deer (Odocoileus hemionus) (SI) Pronghorn (Antilocapra americana) (SI)
Subalpine
Osterhout's thistle (Cirsium osterhoutii) (SCC) Western bumblebee (Bombus occidentalis) (SI) Elk (Cervus elaphus) (SI) Mule deer (Odocoileus hemionus) (SI)
Moist meadows
Colorado wild buckwheat (Eriogonum coloradense) (SCC) Black bear (Ursus americanus) (SI) Elk (Cervus elaphus) (SI) Mule deer (Odocoileus hemionus) (SI)
Disturbed areas Grand Mesa penstemon (Penstemon mensarum) (SCC)
Alpine Uplands; Alpine Rocky Slopes, Screes, Cliffs
As with most non-forested ecosystems in the GMUG, the overall ecological integrity of alpine uplands, rocky slopes, screes, and cliffs is uncertain due to limited information on their pre-settlement reference conditions. Risk factors include recreation, historic disturbance from mining and heavy domestic sheep grazing, and climate change. Species associated with the alpine uplands, alpine rocky slopes, screes, and cliffs ecosystem in the GMUG are listed in table 64.
Table 64. Species associated with the alpine uplands, alpine rocky slopes, screes, and cliffs ecosystem [E, endangered species; SCC, species of conservation concern; SI, species of interest]
Specific Community or Habitat Associated Species
General alpine uplands
Uncompahgre fritillary butterfly (Boloria acrocnema) (E) Avery Peak twinpod (Physaria alpina) (SCC) Colorado wild buckwheat (Eriogonum coloradense) (SCC) Lancepod draba (Draba lonchocarpa var. lonchocarpa) (SCC) Least moonwort (Botrychium simplex) (SCC) Narrow-leaf grapefern (Botrychium lineare) (SCC) Peculiar moonwort (Botrychium paradoxum) (SCC) Osterhout's thistle (Cirsium osterhoutii) (SCC) Rocky Mountain bighorn sheep (Ovis canadensis canadensis) (SI) Sierra hare sedge (Carex leporinella) (SCC) Rothrock Townsend-daisy (Townsendia rothrockii) (SCC) Whitlow-grass (Draba malpighiacea) (SCC) American marten (Martes americana) (SI) White-tailed ptarmigan (Lagopus leucurus) (SI)
Moist, late-snow areas San Juan draba (Draba graminea) (SCC)

GMUG National Forests Land Management Plan Draft Environmental Impact Statement: Volume 1
139
Specific Community or Habitat Associated Species
Alpine talus, scree, rocky slopes, and cliffs
Avery Peak twinpod (Physaria alpina) (SCC) Osterhout's thistle (Cirsium osterhoutii) (SCC) Rothrock Townsend-daisy (Townsendia rothrockii) San Juan draba (Draba graminea) (SCC) Whitlow-grass (Draba malpighiacea) (SCC)
Alpine talus, scree, rocky slopes, and cliffs (rhyolite substrate)
Stonecrop gilia (Aliciella sedifolia) (SCC)
Large patches of snow willow Uncompahgre fritillary butterfly (Boloria acrocnema) (E) White-tailed ptarmigan (Lagopus leucurus) (SI)
Desert Alluvial Saltshrub
As with most non-forested ecosystems in the GMUG, the overall ecological integrity of desert alluvial saltshrub is uncertain due to limited information on pre-settlement reference conditions. Risk factors include livestock grazing, invasive plants, and altered fire regime. Species associated with the desert alluvial saltshrub ecosystem in the GMUG are listed in table 65.
Table 65. Species associated with the desert alluvial saltshrub ecosystem [T, threatened species; CH, designated critical habitat in the plan area]
Specific Community or Habitat Associated Species
General desert alluvial saltshrub Colorado hookless cactus (Sclerocactus glaucus) (T) Debeque phacelia (Phacelia submutica) (T/CH)
Aquatic, Riparian, and Wetland Ecosystems and Associated Species In this section, the integrity of aquatic ecosystems in the GMUG is examined in terms of associated and potentially affected wildlife and plant species, representing one component of the “coarse filter” approach described earlier. Ecological departure indicates risk to the integrity and sustainability of the affected ecosystem and, hence, associated wildlife and plant species. Human-caused stressors and climate change are known risk factors for all aquatic, riparian, and wetland ecosystems in the GMUG. Please refer to the Aquatic, Riparian, and Wetland Ecosystems and Water Resources sections of the 2018 assessments for more detailed discussion of the conditions and trends of these habitat types. While information about species associated with each ecosystem is included here as part of the affected environment, the environmental consequences of the plan direction on each ecosystem are detailed in the Terrestrial Ecosystems and Aquatic and Riparian Ecosystems sections of the 2018 assessments.
Rivers and Streams
Rivers and streams in the GMUG are departed from reference conditions for habitat connectivity and aquatic species composition, based on the condition of the subwatersheds in which they occur. Species associated with rivers and streams in the GMUG are listed in table 66.

USDA Forest Service
140
Table 66. Species associated with rivers and streams [T, threatened species; SCC, species of conservation concern; SI, species of interest]
Vegetation Community or Habitat Type Associated Species
General rivers and streams
Boreal toad (Anaxyrus boreas boreas) (SCC) Rainbow trout (Oncorhynchus mykiss) (SI) Brook trout (Salvelinus fontinalis) (SI) Brown trout (Salmo trutta) (SI) Colorado River cutthroat trout (Oncorhynchus clarkii pleuriticus) (SI)
Lakes and Reservoirs
Lakes and reservoirs were not directly evaluated in the assessment, though they were incorporated in the watershed condition framework assessment (see Watershed Condition Framework and Water Resources sections of the 2018 assessments). Species associated with lakes and reservoirs in the GMUG are listed in table 67.
Table 67. Species associate with lakes and reservoirs [T, threatened species; SCC, species of conservation concern; SI, species of interest]
Vegetation Community or Habitat Type Associated Species
General lakes and reservoirs
Boreal toad (Anaxyrus boreas boreas) (SCC) Water awlwort (Subularia aquatica) (SCC) Brook trout (Salvelinus fontinalis) (SI) Brown trout (Salmo trutta) (SI) Colorado River cutthroat trout (Oncorhynchus clarkii pleuriticus) (SI) Rainbow trout (Oncorhynchus mykiss) (SI)
Fens
Fens are moderately departed for hydrologic regime and floodplain connectivity, based on the condition of the subwatersheds in which they occur. Species associated with the fens ecosystem in the GMUG are listed in table 68.
Table 68. Species associated with the fens ecosystem [SCC, species of conservation concern]
Vegetation Community or Habitat Type Associated Species
Fens (non-specific chemistry) Sierra hare sedge (Carex leporinella) (SCC) Canadian single-spike sedge (Carex scirpoidea) (SCC) Water awlwort (Subularia aquatica) (SCC)
Iron fens Girgensohn's sphagnum (Sphagnum girgensohnii) (SCC) Sphagnum (Sphagnum angustifolium) (SCC)
Montane-Alpine Wet Meadows and Marshes
Based on the condition of the subwatersheds in which they occur, montane-alpine wet meadows and marshes are moderately departed for hydrologic regime and floodplain

GMUG National Forests Land Management Plan Draft Environmental Impact Statement: Volume 1
141
connectivity, and vegetation condition and function. Species associated with the montane-alpine wet meadows and marshes ecosystem in the GMUG are listed in table 69.
Table 69. Species associated with the montane-alpine wet meadows and marshes ecosystem [T, threatened species; CH, designated critical habitat in the plan area; SCC, species of conservation concern; SI, species of interest]
Vegetation Community or Habitat Type Associated Species
General montane-alpine wet meadows and marshes
Gunnison sage-grouse (Centrocercus minimus) (T/CH) Moose (Alces alces americanus) (SI) Nokomis fritillary, aka Great Basin silverspot (Speyeria nokomis nokomis) (SCC) Osterhout's thistle (Cirsium osterhoutii) (SCC)
Montane Nokomis fritillary, aka Great Basin silverspot (Speyeria nokomis nokomis) (SCC)
Montane to subalpine Boreal toad (Anaxyrus boreas boreas) (SCC) Water awlwort (Subularia aquatica) (SCC) Moose (Alces alces americanus) (SI)
Subalpine to alpine
Boreal toad (Anaxyrus boreas boreas) (SCC) Canadian single-spike sedge (Carex scirpoidea) (SCC) White-tailed ptarmigan (Lagopus leucurus) (SI) Moose (Alces alces americanus) (SI)
Montane-Subalpine Riparian Shrublands
Based on the condition of the subwatersheds in which they occur, montane-subalpine riparian shrublands are moderately departed from reference conditions for vegetation condition and function. Species associated with the montane-subalpine riparian shrublands ecosystem in the GMUG are listed in table 70.
Table 70. Species associated with the montane-subalpine riparian shrublands ecosystem [T, threatened species; CH, designated critical habitat in the plan area; SCC, species of conservation concern; SI, species of interest]
Specific Community or Habitat Type Associated At-risk Species
Willow carrs
Canada lynx (Lynx canadensis) (T) Canadian single-spike sedge (Carex scirpoidea) (SCC) White-tailed ptarmigan (Lagopus leucurus) (SI) Elk (Cervus elaphus) (SI) Moose (Alces alces americanus) (SI)
Riparian areas and wet meadows in sagebrush shrubland
Gunnison sage-grouse (Centrocercus minimus) (T/CH) Black bear (Ursus americanus) (SI) Elk (Cervus elaphus) (SI) Mule deer (Odocoileus hemionus) (SI)
Montane-Subalpine Riparian Woodlands
Based on the condition of the subwatersheds in which they occur, montane-alpine riparian woodlands are moderately departed for hydrologic regime and floodplain connectivity, and

USDA Forest Service
142
vegetation condition and function. Currently, no identified at-risk species or species of interest are directly associated with this ecosystem.
Cottonwood Riparian Woodlands
Based on the condition of the subwatersheds in which they occur, cottonwood riparian woodlands are moderately departed from reference conditions for hydrologic regime and floodplain connectivity, and departed for vegetation condition and function. Species associated with the cottonwood riparian woodlands ecosystem in the GMUG are listed in table 71.
Table 71. Species associated with the cottonwood riparian woodlands ecosystem [SCC, species of conservation concern; SI, species of interest]
Vegetation Community or Habitat Type Associated Species
General cottonwood riparian woodlands Willow hawthorn (Crataegus saligna) (SCC) Merriam’s wild turkey (Meleagris gallapovo merriami) (SI)
Special Habitat Features and Associated Species In this section, the integrity of special habitat features is examined in terms of associated and potentially affected wildlife and plant species, representing one component of the “coarse filter” approach described earlier. Special habitat features refer to unique or very specific habitat elements that are not described as individual ecosystems in this document, but rather key components that occur across multiple ecosystems and provide for the persistence of certain species.
Caves and Mines
There are few large underground caves and mines in the GMUG. Bat species prefer caves large enough to maintain stable interior temperatures for hibernation and maternity colonies. These deep underground habitats are very susceptible to white-nose syndrome. White-nose syndrome has not been detected in Colorado yet, and the spread of the pathogen has markedly slowed. However, if it is introduced in the area, the impact to bat populations could be extensive. Currently, there are no known at-risk species directly associated with this ecosystem.
Non-Alpine Rock Outcrops and Cliffs
Rock outcrops and cliffs are described in the terrestrial ecosystems assessment (USDA Forest Service 2018) but were not specifically assessed due to limited information regarding their extent in the plan area. Threats to species dependent upon rocks and outcrops are difficult to quantify. Recreational rock climbing may be the biggest threat to these species, due to the harassment (intentional or incidental) of wildlife, and the removal of vegetation from cracks and crevices for handholds and the placement of fall-protection equipment. However, impacts from rock climbing are limited to a few areas in the plan area with

GMUG National Forests Land Management Plan Draft Environmental Impact Statement: Volume 1
143
developed climbing routes. Species associated with non-alpine rock outcrops and cliffs in the GMUG are listed in table 72.
Table 72. Species associated with non-alpine rock outcrops and cliffs [SCC, species of conservation concern; SI, species of interest]
Vegetation Community or Habitat type Associated Species
General non-alpine rock outcrops and cliffs
Crandall’s beardtongue (Penstemon crandallii ssp. procumbens) (SCC) Rocky Mountain bighorn sheep (Ovis canadensis canadensis) (SI) Desert bighorn sheep (Ovis canadensis nelsoni) (SI)
Montane to subalpine Osterhout's thistle (Cirsium osterhoutii) (SCC) Limestone substrate Hanging garden sullivantia (Sullivantia hapemanii var. purpusii) (SCC)
Snags and Down Woody Material
The terrestrial ecosystems assessment (USDA Forest Service 2018) indicated an increase in the number of snags in the planning area during the study period. Overall, snag density in the plan area is greater than the minimum amounts set in the current forest plan (refer to the Snags and Down Woody Material section of this document). Snags are a key ecosystem characteristic for a variety of species, especially primary and secondary (flammulated owl, boreal owl) cavity nesters. The American marten uses hollow snags as den sites. The osprey builds nesting platforms in snags and has been documented in the GMUG. Bald eagles use snags for roost sites and as perch sites to watch for prey. Snags contribute to future recruitment of down woody material, also known as coarse woody debris. In the form of logs in various sizes and states of decay, coarse woody debris functions as cover and habitat for insects and small mammals preyed on by at-risk species and species of interest. Coarse woody debris also provides denning habitat for species, including Canada lynx and American marten, and helps retain soil moisture. Species associated with snags and down woody material in the GMUG are listed in table 73. The effects of draft revised forest plan direction on snags and down woody material are addressed in the Terrestrial Ecosystems section, Snags and Down Woody Material section of this document.
Table 73. Species associated with snags and down woody material [T, threatened species; SI, species of interest]
Vegetation Community or Habitat Type Associated Species
Snags American marten (Martes americana) (SI) Black bear (Ursus americanus) (SI)
Down woody material Canada lynx (Lynx canadensis) (T) American marten (Martes americana) (SI)

USDA Forest Service
144
Unique Substrates
Some plants require specific substrates that may occur in isolated patches. Such species can experience genetic isolation, sometimes leading to rapid speciation. The primary threat to these species is soil disturbance such as large-scale events from road construction or tillage, or small-scale events such as illegal off-road vehicle travel or dispersed camping. Species associated with unique substrates in the GMUG are listed in table 74.
Table 74. Species associated with unique substrates [T, threatened species; CH, designated critical habitat in the plan area; SCC, species of conservation concern]
Vegetation Community or Habitat Type Associated Species
Limestone/dolomite/calcareous substrates
Avery Peak twinpod (Physaria alpina) (SCC) Hanging garden sullivantia (Sullivantia hapemanii var. purpusii) (SCC) Piceance bladderpod (Physaria parviflora) (SCC) Rothrock Townsend-daisy (Townsendia rothrockii) (SCC)
Shale derived substrates
DeBeque phacelia (Phacelia submutica) (T/CH) Colorado desert-parsley (Lomatium concinnum) (SCC) Colorado wild buckwheat (Eriogonum coloradense) (SCC) Piceance bladderpod (Physaria parviflora) (SCC) Hanging garden sullivantia (Sullivantia hapemanii var. purpusii) (SCC) Sun-loving meadowrue (Thalictrum heliophilum) (SCC)
Volcanic tuff Colorado wild buckwheat (Eriogonum coloradense) (SCC)
Predator-Prey Relationships
Predator-prey relationships influence ecosystem pattern and process, which in turn influence vegetation and habitat conditions, species population dynamics, nutrient cycling, and a host of other dynamic ecosystem processes. The landscape-scale disturbance event from spruce bark beetles is likely the most influential natural ecological process affecting prey species in the GMUG National Forests at this time. Other factors influencing prey species and their habitat include vegetation management activities (particularly timber harvest), prescribed fire, mechanical habitat treatments (e.g., removal of encroaching pinyon-juniper and other vegetation), soil loss from erosion in riparian areas and meadows, non-native species invasions, and roads. In general, actions and management that maintain and enhance prey species’ habitat would benefit the associated at-risk species. Likewise, actions that maintain and enhance key ecosystem characteristics and conditions for associated at-risk species will benefit their prey species. Some prey species are also at-risk species or species of interest. Key predator-prey relationships in the GMUG are listed in table 75.
Table 75. Key predator-prey relationships [T, threatened species; SCC, species of conservation concern; SI, species of interest]
Ecosystem Feature (Prey Group) Associated Species Insects Boreal toad (Anaxyrus boreas boreas) (SCC)

GMUG National Forests Land Management Plan Draft Environmental Impact Statement: Volume 1
145
Ecosystem Feature (Prey Group) Associated Species Small mammals (prairie dogs, shrews, voles, squirrels, marmots, hares, rabbits) Elk Mule deer Bighorn sheep Passerines Waterfowl Woodpeckers Galliformes
Canada lynx (Lynx canadensis) (T) American marten (Martes americana) (SI) Black bear (Ursus americanus) (SI) Mountain lion (Puma concolor) (SI)
Risk Factors for Wildlife and Plant Species This section describes risk factors shared by certain at-risk species and species of interest in the GMUG, representing the fine-filter approach for species, as described earlier. Some risk factors directly affect the species, while others affect the species’ habitat. Also, some risk factors exist independently of habitat conditions (e.g., whirling disease, livestock grazing, and timber harvest), whereas some risk factors may be amplified by poor habitat conditions (e.g., spread of invasive plants in disturbed areas). The ability of the Forest Service to address these drivers and stressors and, hence, the need for change, varies widely depending on the specific risk factor, habitat type, and species. The effects of plan direction on mitigating risk factors are primarily addressed in the species of conservation concern appendix (appendix 3), the biological evaluations (appendices 4 and 5), and for individual federally listed species in the Environmental Consequences section below. Some of the overarching risk factors, with effects to a broad array of general wildlife species, are addressed below in the General Wildlife section, including the effects of recreation direction in the draft revised forest plan, the effect of habitat connectivity plan direction, and the effects of vegetation management proposed in the draft revised forest plan.
Small and Isolated Populations
Small and isolated populations are susceptible to threats from genetic drift and stochastic events (e.g., fire, drought, landslides). This is primarily a concern with species affected by other threats such as habitat fragmentation or diseases. Species in the GMUG affected by genetic drift, stochastic events, and anthropogenic disturbances are listed in table 76.

USDA Forest Service
146
Table 76. Species affected by genetic drift, stochastic events, and anthropogenic disturbances [T, threatened species; CH, designated critical habitat in the plan area; SCC, species of conservation concern; SI, species of interest]
Risk Factor Potentially Impacted Species
Genetic drift, stochastic events, and anthropogenic disturbances
Green-lineage Colorado River cutthroat trout (Oncorhynchus clarkii pleuriticus) (T) Gunnison sage-grouse (Centrocercus minimus) (T/CH) Uncompahgre fritillary butterfly (Boloria acrocnema) (T) Colorado desert-parsley (Lomatium concinnum) (SCC) Girgensohn’s sphagnum (Sphagnum girgensohnii) (SCC) Sphagnum (Sphagnum angustifolium) (SCC) Gunnison’s prairie dog (Cynomis gunnisoni) (SCC) Nokomis fritillary, aka Great Basin silverspot (Speyeria nokomis nokomis) (SCC) Piceance bladderpod (Physaria parviflora) (SCC) Stonecrop gilia (Aliciella sedifolia) (SCC) Sun-loving meadowrue (Thalictrum heliophilum) (SCC) Water awlwort (Subularia aquatica) (SCC) Whitlow-grass (Draba malpighiacea) (SCC) Rocky Mountain bighorn sheep (Ovis Canadensis canadensis) (SI) Desert bighorn sheep (Ovis Canadensis nelsoni or Ovis Canadensis mexicana) (SI)
Climate Change
Information regarding potential climate change impacts to species in the GMUG is based primarily on the Gunnison Basin Climate Change Vulnerability Assessment (Neely et al. 2011). Information was also derived from the Climate Change Vulnerability Assessment for Colorado Bureau of Land Management (CNHP 2015), and the Climate Change Vulnerability Assessment for Rare Plants of the San Juan Region of Colorado (CNHP 2014). Where these assessments disagree, we deferred to the Gunnison Basin Climate Change Vulnerability Assessment followed by the San Juan Climate Change Vulnerability Assessment, as those are more specific to the geographic vicinity of the GMUG. Species in the GMUG with high or extreme vulnerability to climate change and species that are otherwise reliant on habitats that are highly vulnerable to climate change are listed in table 77.

GMUG National Forests Land Management Plan Draft Environmental Impact Statement: Volume 1
147
Table 77. Species with high or extreme vulnerability to climate change [T, threatened species; CH, designated critical habitat in the plan area; SCC, species of conservation concern; SI, species of interest]
Risk Factor Species Potentially Impacted
High or extreme vulnerability to climate change (high or very high confidence)
Gunnison sage-grouse (Centrocercus minimus) (T/CH) Green-lineage Colorado River cutthroat trout (Oncorhynchus clarkii pleuriticus) (T) Avery Peak twinpod (Physaria alpina) (SCC) Boreal toad (Anaxyrus boreas boreas) (SCC) Colorado desert-parsley (Lomatium concinnum) (SCC) Colorado wild buckwheat (Eriogonum coloradense) (SCC) Gunnison milkvetch (Astragalus anisus) (SCC) Hanging Garden sullivantia (Sullivantia hapemanii var. purpusii) (SCC) Nokomis fritillary, aka Great Basin silverspot (Speyeria nokomis nokomis) (SCC) Piceance bladderpod (Physaria parviflora) (SCC) Sun-loving meadowrue (Thalictrum heliophilum) (SCC) White-tailed ptarmigan (Lagopus leucurus) (SI) Colorado River cutthroat trout (Oncorhynchus clarkii pleuriticus) (SI)
High or extreme vulnerability to climate change (unspecified confidence)
San Juan draba (Draba graminea) (SCC) Whitlow-grass (Draba malpighiacea) (SCC)
High or extreme vulnerability to climate change (low or medium confidence)
Boreal toad (Anaxyrus boreas boreas) (SCC) Rothrock Townsend-daisy (Townsendia rothrockii) (SCC) Stonecrop gilia (Aliciella sedifolia) (SCC)
Habitat is highly vulnerable to climate change (high or very high confidence)
American marten (Martes americana) (SI) Sierra hare sedge (Carex leporinella) (SCC) Avery Peak twinpod (Physaria alpina) (SCC) Colorado wild buckwheat (Eriogonum coloradense) (SCC) Osterhout's thistle (Cirsium osterhoutii) (SCC) Rocky Mountain bighorn sheep (Ovis canadensis canadensis) (SI) Rothrock Townsend-daisy (Townsendia rothrockii) (SCC) White-tailed ptarmigan (Lagopus leucurus) (SI) Whitlow-grass (Draba malpighiacea) (SCC)
Habitat is highly vulnerable to climate change (low or medium confidence)
Willow hawthorn (Crataegus saligna) (SCC)
Insects and Disease
Insects and disease have the potential to affect ecosystem integrity and species diversity, viability, and persistence. Please refer to the Insects and Disease section of the 2018 assessments for further discussion of effects to terrestrial ecosystems. Species in the GMUG potentially impacted by insects and disease are listed in table 78.
Table 78. Species potentially impacted by insects and disease [SCC, species of conservation concern; SI, species of interest]
Risk Factor Species Potentially Impacted Chytrid fungus Boreal toad (Anaxyrus boreas boreas) (SCC) Sylvatic plague Gunnison's prairie dog (Cynomys gunnisoni) (SCC)

USDA Forest Service
148
Risk Factor Species Potentially Impacted
Pneumonia/respiratory disease Rocky Mountain bighorn sheep (Ovis canadensis canadensis) (SI) Desert bighorn sheep (Ovis Canadensis nelsoni or Ovis Canadensis mexicana) (SI)
Disease/pathogen spread by non-native honeybees Western bumblebee (Bombus occidentalis) (SI)
Intentional Mortality
Legal hunting is not a risk factor for species in the GMUG, although species of interest and Gunnison’s prairie dog (a species of conservation concern) may be legally hunted by permit. Hunting is regulated by Colorado Parks and Wildlife, with one goal being the maintenance of stable populations of game species. As such, legal hunting is unlikely to create risk for continued persistence of these species in the plan area. The effects to species and populations due to illegal hunting (poaching) are difficult to quantify. We know that, of at-risk species in the GMUG, eagles are poached for their feathers, prairie dogs are poached because they are viewed as pests, and other rare species may be poached out of a perception that their presence on the land may lead to unreasonable government regulation. Species in the GMUG potentially affected by intentional mortality are listed in table 79.
Table 79. Species potentially affected by intentional mortality [T, threatened species; CH, designated critical habitat in the plan area; SCC, species of conservation concern; SI, species of interest]
Risk Factors Species Potentially Impacted
General – illegal hunting
Gunnison sage-grouse (Centrocercus minimus) (T/CH) Gunnison's prairie dog (Cynomys gunnisoni) (SCC) American marten (Martes americana) (SI) River otter (Lontra canadensis) (SI) White-tailed ptarmigan (Lagopus leucurus) (SI) Black bear (Ursus americanus) (SI) Dusky grouse (Dendragapus obscurus) (SI) Elk (Cervus elaphus) (SI) Merriam’s wild turkey (Meleagris gallapovo merriami) (SI) Moose (Alces alces americanus) (SI) Mountain lion (Puma concolor) (SI) Mule deer (Odocoileus hemionus) (SI) Pronghorn (Antilocapra americana) (SI)
Habitat Fragmentation
Habitat fragmentation and connectivity is a complex and species-specific issue. Based on the assessment (USDA Forest Service 2018, watersheds, water, and soil resources), there is a total of 352 dams in the GMUG, and additional fish barriers constructed to protect native species from hybridization. These aquatic barriers have both positive and negative impacts on fishes, negatively impacting bluehead suckers, and both negatively and positively impacting green-lineage Colorado River cutthroat trout. In terms of native cutthroat trout, fish barriers prevent hybridization, but also create genetic bottlenecks and increase susceptibility to stochastic events such as drought or flooding. Please refer to Habitat

GMUG National Forests Land Management Plan Draft Environmental Impact Statement: Volume 1
149
Connectivity and Fragmentation in the Aquatic, Riparian and Wetland Ecosystems section of the 2018 assessments for more information. Roads and trails also contribute to habitat fragmentation and reduce patch size and connectivity. The impact of this is further influenced by the frequency, type, and timing of the use of these roads and trails. Please refer to Wildlife Habitat: Patch Size and Connectivity in the Terrestrial Ecosystems section of the 2018 assessments for more information. Species in the GMUG potentially affected by habitat fragmentation are listed table 80.
Table 80. Species potentially affected by habitat fragmentation [T, threatened species; CH, designated critical habitat in the plan area; SCC, species of conservation concern; SI, species of interest]
Risk Factors Species Potentially Impacted
General habitat fragmentation
Canada lynx (Lynx canadensis) (T) Green-lineage Colorado River cutthroat trout (Oncorhynchus clarkii pleuriticus) (T) Gunnison sage-grouse (Centrocercus minimus) (T/CH) Nokomis fritillary, aka Great Basin silverspot (Speyeria nokomis nokomis) (SCC) American marten (Martes americana) (SI) Rocky Mountain bighorn sheep (Ovis canadensis canadensis) (SI) Western bumblebee (Bombus occidentalis) (SI) Black bear (Ursus americanus) (SI) Elk (Cervus elaphus) (SI) Moose (Alces alces americanus) (SI) Mule deer (Odocoileus hemionus) (SI) Pronghorn (Antilocapra americana) (SI)
Road construction, maintenance, and use
Crandall’s rockcress (Arabis crandallii) (SCC) Girgensohn’s sphagnum (Sphagnum girgensohnii) (SCC) Sphagnum (Sphagnum angustifolium) (SCC)
Invasive or Non-Native Terrestrial Species
Currently, there are at least 25,500 acres of inventoried invasive plant infestations in the GMUG, though this is an underestimate of the total acres affected. Invasive plants and non-native species can have serious ecological impacts by altering species composition and reducing biodiversity and ecosystem resilience. Climate change is expected to increase the impacts of invasive plant species by causing invasives to increase and expand. Control of invasive species by biological, mechanical, or chemical methods can also negatively affect at-risk species. In particular, herbicide treatments for weed control may inadvertently affect native species and individuals. For more information, see the Invasive Plants section of the 2018 assessments. Species in the GMUG potentially affected by invasive or non-native terrestrial species are listed in table 81.

USDA Forest Service
150
Table 81. Species potentially affected by invasive or non-native terrestrial species [T, threatened species; CH, designated critical habitat in the plan area; SCC, species of conservation concern]
Risk Factors Species Potentially Impacted
Invasive plants
Gunnison sage-grouse (Centrocercus minimus) (T/CH) Brewer’s sparrow (Spizella breweri) (SCC) Sage sparrow (Amphispizia belli) (SCC) Variegated scouringrush (Hippochaete variegata) (SCC)
Miscellaneous Western bumblebee (Bombus occidentalis) (parasites; honeybees, which are non-native and spread disease to bumblebees and other native bees) (SCC)
Livestock and Wildlife Grazing, Browsing, and Trampling
Livestock and wildlife grazing can impact different species in different ways. The more relevant impacts for at-risk species that were assessed include increased erosion, changes in plant species composition, and disease transmission (between domestic and bighorn sheep). Fen, wetland, and riparian species are especially vulnerable to increased sedimentation or hydrologic alteration that can be associated with improper grazing or uncharacteristically high use by wild ungulates. Species that occur on highly erodible soils may also be impacted by high levels of ungulate use and associated atypical rates of erosion. Please refer to the Rangeland Resources section of the 2018 assessments for more information on range management and associated conditions and trends in the GMUG. Species in the GMUG potentially affected by livestock and wildlife grazing, browsing, and trampling are listed in table 82.
Table 82. Species potentially affected by livestock and wildlife grazing, browsing, and trampling [T, threatened species; CH, designated critical habitat in the plan area; SCC, species of conservation concern; SI, species of interest]
Risk Factors Species Potentially Impacted
General – livestock and wildlife grazing, browsing, and trampling
Green-lineage Colorado River cutthroat trout (Oncorhynchus clarkii pleuriticus) (T) Gunnison sage-grouse (Centrocercus minimus) (T/CH) Canada lynx (lynx canadensis) (T) Canadian single-spike sedge (Carex scirpoidea) (SCC) Gunnison milkvetch (Astragalus anisus) (SCC) Nokomis fritillary, aka Great Basin silverspot (Speyeria nokomis nokomis) (SCC) Willow hawthorn (Crataegus saligna) (SCC) Western bumblebee (Bombus occidentalis) (SI) White-tailed ptarmigan (Lagopus leucurus) (SI) Rocky Mountain bighorn sheep (Ovis canadensis canadensis) (SI) Desert bighorn sheep (Ovis canadensis nelsoni) (SI) Elk (Cervus elaphus) (SI) Moose (Alces alces americanus) (SI) Mule deer (Odocoileus hemionus) (SI) Pronghorn (Antilocapra americana) (SI)

GMUG National Forests Land Management Plan Draft Environmental Impact Statement: Volume 1
151
Hard Rock Mining
Potential impacts from mining include soil erosion, chemical contamination (leaching from mines and spoils or spillage of industrial chemicals), road impacts, and habitat loss. Potential effects to aquatic and riparian ecosystems include changes in hydrologic regimes due to physical channel modifications, interception and rerouting of groundwater, decreases in baseflow with accompanying increases in runoff, and consumptive water use. Surface and groundwater quality may decline due to contamination from acid runoff, dissolved metals, and sediment production, which in turn can impact aquatic community composition and structure. Wetland and riparian areas may be lost due to mine operations or groundwater interception, with impacts to structure and function from water contamination. Current mining practices are subject to environmental review under the National Environmental Protection Act, National Historic Preservation Act, Endangered Species Act, and multiple other laws and regulatory systems. As such, the risk of current mining practices is limited and subject to review. Consequently, the current ecological impacts of mining across the GMUG are largely associated with historic mineral development. A total of 63 subwatersheds include abandoned mine land sites, with variable impacts on surface water quality and aquatic habitat. The four subwatersheds with the highest density of abandoned mine land sites contain all state-listed impaired waters due to water quality impacts from historic mining activities found in the GMUG (segments in 21 streams totaling approximately 141 miles). Please refer to the Water Quantity and Quality and Nonrenewable Energy and Minerals sections of the 2018 assessments for more information. Species potentially affected by mining are listed in table 83.
Table 83. Species potentially affected by mining [T, threatened species; CH, designated critical habitat in the plan area; SI, species of interest]
Risk Factors Species Potentially Impacted
Legacy of historic hard rock mining
Green-lineage Colorado River cutthroat trout (Oncorhynchus clarkii pleuriticus) (T) Gunnison sage-grouse (Centrocercus minimus) (T/CH) White-tailed ptarmigan (Lagopus leucurus) (SI)
Non-Native Fish
Non-native fish can impact native fish through predation, competition, and hybridization. Fish can impact amphibians through predation, disturbance of egg masses, and introduction of chytrid fungus or other diseases. Of the 231 watersheds assessed for invasive species, 192 were rated as “poor,” although the data do not distinguish between non-native fish, plants, or other organisms. See the Watershed Condition Framework and Aquatic Species Distribution and Abundance sections of the 2018 assessments for more information. Species in the GMUG potentially affected by non-native fish are listed in table 84.

USDA Forest Service
152
Table 84. Species potentially affected by non-native fish [T, threatened species; SCC, species of conservation concern]
Risk Factors Species Potentially Impacted
Non-native fish Green-lineage Colorado River cutthroat trout (Oncorhynchus clarkii pleuriticus) (T) Boreal toad (Anaxyrus boreas boreas) (SCC)
Vegetation Management and Alteration
Timber harvest can impact species that require larger trees, such as cavity-nesting species. At-risk plant species can be impacted by herbicide application, especially herbicide applications that might be designed to favor grazing by reducing broad-leaved plants and favoring grass and sedge species. Please refer to the Timber Resources and Rangeland Resources sections for more information on timber and vegetation management. Stand-replacing fire could impact many species that require dense cover or large trees. Depending on the timing, fire could also disrupt nesting. Conversely, fire exclusion in ecosystems where frequent fire is part of the natural disturbance regime may be a risk factor for species that are fire-adapted. Please refer to the Landscape Disturbances section of the 2018 assessments for more information on the history and influence of fire in the plan area. Species in the GMUG potentially affected by vegetation management and alteration are listed in table 85.
Table 85. Species potentially affected by vegetation management and alteration [T, threatened species; CH, designated critical habitat in the plan area; SCC, species of conservation concern; SI, species of interest]
Risk Factors Species Potentially Impacted
Timber harvest
Canada lynx (Lynx canadensis) (T) Green-lineage Colorado River cutthroat trout (Oncorhynchus clarkii pleuriticus) (T) Boreal toad (Anaxyrus boreas boreas) (SCC) Black bear (Ursus americanus) (SI) Dusky grouse (Dendragapus obscurus) (SI) Elk (Cervus elaphus) (SI) Moose (Alces alces americanus) (SI) Mule deer (Odocoileus hemionus) (SI)
Herbicide use – general Gunnison sage-grouse (Centrocercus minimus) (T/CH) Herbicide use – loss or contamination of nectar producing species
Nokomis fritillary, aka Great Basin silverspot (Speyeria nokomis nokomis) (SCC) Western bumblebee (Bombus occidentalis) (SI)
Herbicide Use – direct mortality Grand Mesa penstemon (Penstemon mensarum) (SCC)
Fire exclusion
Large-flower globe-mallow (Iliamna grandiflora) (SCC) Elk (Cervus elaphus) (SI) Merriam’s wild turkey (Meleagris gallapovo merriami) (SI) Mule deer (Odocoileus hemionus) (SI)

GMUG National Forests Land Management Plan Draft Environmental Impact Statement: Volume 1
153
Risk Factors Species Potentially Impacted
Wildland fire
Canada lynx (Lynx canadensis) (T) Gunnison sage-grouse (Centrocercus minimus) (T/CH) American marten (Martes americana) (SI) Rocky Mountain bighorn sheep (Ovis canadensis canadensis) (SI) Western bumblebee (Bombus occidentalis) (SI) Elk (Cervus elaphus) (SI) Merriam’s wild turkey (Meleagris gallapovo merriami) (SI) Mule deer (Odocoileus hemionus) (SI)
Recreation (Non-Hunting)
As Colorado’s human population continues to grow, recreational activities in the GMUG will likely increase. Please refer to the Recreation Resources section of the 2018 assessments for more information on recreation-related conditions and trends. Species potentially affected by non-hunting recreation are listed in table 86.
Table 86. Species potentially affected by non-hunting recreation [T, threatened species; CH, designated critical habitat in the plan area; SCC, species of conservation concern; SI, species of interest]
Risk factors Species Potentially Impacted
Peak bagging, alpine foot travel
Uncompahgre fritillary butterfly (Boloria acrocnema) (T) Stonecrop gilia (Aliciella sedifolia) (SCC) Rocky Mountain bighorn sheep (Ovis canadensis canadensis) (SI) White-tailed ptarmigan (Lagopus leucurus) (SI) Elk (Cervus elaphus) (SI)
Rock climbing Rocky Mountain bighorn sheep (Ovis canadensis canadensis) (SI)
Illegal off-road/trail motorized vehicle use
DeBeque phacelia (Phacelia submutica) (T/CH) Gunnison sage-grouse (Centrocercus minimus) (T/CH) Sierra hare sedge (Carex leporinella) (SCC) Avery Peak twinpod (Physaria alpina) (SCC) Boreal toad (Anaxyrus boreas boreas) (SCC) Canadian single-spike sedge (Carex scirpoidea) (SCC) Rothrock Townsend-daisy (Townsendia rothrockii) (SCC) San Juan draba (Draba graminea) (SCC) Water awlwort (Subularia aquatica) (SCC) Willow hawthorn (Crataegus saligna) (SCC) Elk (Cervus elaphus) (SI) Moose (Alces alces americanus) (SI) Mule deer (Odocoileus hemionus) (SI) Pronghorn (Antilocapra Americana) (SI)
Ski area management/snow compaction Canada lynx (Lynx canadensis) (T) Water awlwort (Subularia aquatica) (SCC)
Helicopter-based recreation Canada lynx (Lynx canadensis) (T) White-tailed ptarmigan (Lagopus leucurus) (SI) Mountain goat (Oreamnos americanus) (SI) Rocky Mountain bighorn sheep (Ovis canadensis canadensis) (SI)
Miscellaneous Water awlwort (Subularia aquatica) (SCC)
Direct disturbance White-tailed ptarmigan (Lagopus leucurus) (SI) Boreal toad (Anaxyrus boreas boreas) (SCC)

USDA Forest Service
154
Hydrologic Alteration
A properly operating hydrologic regime is defined by the magnitude, frequency, and timing of runoff from a watershed and is essential to maintaining ecosystem integrity of aquatic, riparian, and wetland ecosystems. In riparian systems, the most important aspect of the hydrologic regime is flooding, including annual and inter-annual variability in flooding, as well as sediment erosion and deposition. Conversely, in fens, the presence of stable perennially high water tables, lack of flooding and sediment, and absence of physical disturbances are crucial. Marshes and wet meadows are driven by periodically deep water along with periodic drought. Human alteration of the natural flow regime (e.g., dam construction, water diversions, ditches, peat mining, groundwater pumping) disrupts the dynamic equilibrium between the movement of water and the movement of sediment that exists in free-flowing rivers (Dunne and Leopold 1978), which can change the composition, structure, and/or function of riparian and wetland ecosystems (Bain et al. 1988), and have detrimental impacts on at-risk species that depend on them. Species in the GMUG potentially affected by hydrologic alteration are listed in table 87.
Table 87. Species potentially affected by hydrologic alteration [E, endangered species; T, threatened species; CH, designated critical habitat in the plan area; SCC, species of conservation concern]
Risk Factors Species Potentially Impacted
Anthropogenic alteration of hydrologic regime (surface or groundwater)
Humpback chub (Gila cypha) (E) Bonytail chub (Gila elegans) (E) Colorado pikeminnow (Ptychochelus lucius) (E) Elk (Cervus elaphus) (SI) Moose (Alces alces americanus) (SI) Razorback sucker (Xyrauchen texanus) (E) Green-lineage Colorado River cutthroat trout (Oncorhynchus clarkii pleuriticus) (T) Gunnison sage-grouse (Centrocercus minimus) (T/CH) Boreal toad (Anaxyrus boreas boreas) (SCC) Canadian single-spike sedge (Carex scirpoidea) (SCC) Sierra hare sedge (Carex leporinella) (SCC) Willow hawthorn (Crataegus saligna) (SCC) Water alwort (Subularia aquatica) (SCC) Waterfowl (SI)
Environmental Consequences - Federally Listed Wildlife Species This section addresses effects of plan alternatives on wildlife species federally protected under the Endangered Species Act. We analyzed species currently listed as threatened or endangered. When this analysis was prepared, species proposed by the U.S. Fish and Wildlife Service to be listed under the Endangered Species Act were not known to occur in the GMUG National Forests. Candidate species are those species for which the U.S. Fish and Wildlife Service has sufficient information on vulnerability and threats to support a proposal to list, but for which no proposed rule has yet been published. When this analysis was prepared, one terrestrial species was a candidate for Federal listing and known to occur in the GMUG National Forests (monarch butterfly, addressed in the biological evaluation

GMUG National Forests Land Management Plan Draft Environmental Impact Statement: Volume 1
155
and to be addressed in the biological assessment). A current list of species that may be present in the GMUG National Forests was obtained from the U.S. Fish and Wildlife Service (U.S. Department of the Interior 2021). The 2012 Planning Rule requires national forest land management plans to provide the ecological conditions necessary to contribute to the recovery of federally listed threatened and endangered species, and conserve proposed and candidate species (36 CFR 219.9(b). Information and science-based recommendations for federally listed species under the Endangered Species Act are included in species recovery plans, biological opinions, and critical habitat designations. This information was considered in developing plan components for those species for which recovery plans exist (i.e., Gunnison sage-grouse and Uncompahgre fritillary butterfly).
Canada Lynx (Lynx canadensis)
Affected Environment
Lynx habitat is primarily found in spruce-fir and spruce-fir/aspen ecosystems in the GMUG National Forests. The GMUG is well within the range of Canada lynx in the Southern Rockies, but lynx habitat is naturally fragmented and patchily distributed due to a high percentage of non-lynx habitat, high elevation, and extreme topography driving ecological conditions resulting in marginal habitat. Several areas provide contiguous, high quality habitat and are documented by Colorado Parks and Wildlife as having high lynx use (Theobald and Shenk 2011). Based on Colorado Parks and Wildlife lynx tracking data, the GMUG plays an important role in facilitating lynx movements and connectivity between core population areas. Low, moderate, and high-intensity lynx use areas and overlap of use areas with the GMUG, based on radio-telemetry data from a subset of the lynx reintroduced to Colorado during the 1999 to 2006 time period (Theobald and Shenk 2011), are identified in figure 11. Low-intensity use is shown in blue, moderate in yellow-orange, high in red.

USDA Forest Service
156
Figure 11. Population-level utilization distribution for 118 lynx

GMUG National Forests Land Management Plan Draft Environmental Impact Statement: Volume 1
157
Disturbances and processes that affect snowshoe hare habitat and populations are the main drivers affecting lynx. Wildland fire, insects and disease, and climate changes are ecological stressors to lynx and lynx habitat. These stressors influence forest succession and impact spruce-fir and spruce-fir/aspen ecosystem resiliency, hypothetically influencing lynx habitat suitability, connectivity, and persistence in the planning area. Lynx are adapted to deep, soft snow conditions, giving them a competitive advantage over other forest carnivores. Other predators may compete with lynx for access to prey species, or prey directly on lynx (Interagency Lynx Biology Team 2013). The GMUG National Forests host native predators that prey on snowshoe hares opportunistically. Mountain lions and coyotes are common in the planning area and are known to prey on snowshoe hares and lynx. Winter recreation activities that cause snow compaction in lynx habitat potentially affect snowshoe hares and lynx by facilitating access to deep, snowy areas that competing predators would normally not have easy access to. Fire suppression and climate change lead to larger intense wildfires. Habitat fragmentation from vegetation management activities or natural disturbances that remove forest cover stress key ecosystem characteristics that matter for lynx. These stressors may reduce lynx habitat resiliency and persistence by reducing structural diversity. Timber harvest and prescribed fire affect lynx habitat in detrimental, neutral, or beneficial ways. The Southern Rockies Lynx Amendment (2008) drives how we implement vegetation management in the GMUG National Forests. Vegetation management may initially affect lynx habitat detrimentally but leads to meeting long-term lynx habitat objectives by increasing uneven age classes and structural diversity, creating multi-storied forest conditions. Lynx and snowshoe hares are snow-adapted species with strong ties to boreal forest conditions. Climate change models predict warmer, drier conditions for Colorado. Climate change is a potential stressor and possible driver for lynx and snowshoe hare persistence. Key indicators for lynx persistence may hinge on spruce-fir ecosystems persisting as refugia in the GMUG National Forests. The GMUG appears to play a role in the bigger landscape in terms of facilitating lynx movements between core populations. Increased traffic volume on roads bisecting lynx habitat, increased development on non-Federal lands in lynx habitat, and events and processes that convert habitat to unsuitable for long timespans or even cause permanent habitat loss, have the potential to reduce habitat connectivity in the GMUG National Forests. The GMUG models lynx habitat for the planning area based on habitat mapping guidance from the Southern Rockies Lynx Amendment Implementation Guide. From 2020 through early 2021, we updated the modeled lynx habitat to reflect current conditions as affected from the spruce bark beetle epidemic. To accomplish this, the GMUG collaborated with the Forest Service Remote Sensing Application Center to update the forest vegetation layer (FSVeg Spatial) to account for Engelmann spruce mortality from spruce bark beetle and aspen mortality from sudden aspen decline. Initiated in 2014, the project identified overstory tree mortality by comparing 2000 conditions to 2019 satellite imagery. Satellite imagery data were supplemented with on-the-ground plots characterizing overstory, understory, and stand characteristics. Through the modeling process, all vegetation stands within the modeled strata were updated Forestwide. The lynx habitat model developed in cooperation with the

USDA Forest Service
158
San Juan and Rio Grande National Forests in 2010 was applied to the updated vegetation data (FSVeg Spatial). Mapped lynx habitat in the GMUG National Forests, as modeled from FSVeg Spatial, is shown in figure 12 for March 2021.

GMUG National Forests Land Management Plan Draft Environmental Impact Statement: Volume 1
159
Figure 12. Mapped lynx habitat in the GMUG National Forests, as modeled from FSVeg Spatial, March 2021

USDA Forest Service
160
As a result, acres of modeled habitat in lynx analysis units changed slightly. In addition, acres of unsuitable habitat within multiple lynx analysis units increased due to Engelmann spruce mortality. Beetle-induced mortality caused habitat in the Stewart and Cathedral lynx analysis units to exceed 30 percent unsuitable, exceeding the Southern Rockies Lynx Amendment standard VEG S1 threshold. Per standard VEG S1, no further actions that would convert suitable habitat to unsuitable are allowed in those two lynx analysis units. The lynx habitat environmental baseline under the current forest plan as of March 2021 is listed in table 88.
Table 88. Lynx habitat environmental baseline under the current forest plan as of March 2021
Lynx Analysis Unit
Total Acres of Lynx Habitat
Incidental Loss of
Habitat from Recovery Harvest,
1995–2020 (25 percent incidental
loss)1
Incidental Loss of
Habitat from Resiliency Harvest,
1995–2020 (15 percent incidental
loss)2
Total Unsuitable
Lynx Habitat (recovery and
resiliency harvest and
temp roads + beetle
mortality)
Percent Unsuitable from Beetle
Kill and Vegetation
Management Alpine 33,667 788 334 2,999 9 Amphitheater 20,306 0 7 1,224 6 Anthracite 18,958 0 0 111 1 Bald Mountain 30,713 0 0 1,193 4 Beckwith Mountain 48,505 0 0 254 1
Black Mesa 27,202 0 0 3,291 12 Brush Creek 36,575 0 0 484 1 Castle Pass 28,287 0 0 828 3 Cathedral 20,829 75 15 8,543 41 Cebolla 41,594 364 0 6,729 16 Chalk Mountain 21,480 0 73 86 0 Chester 21,801 466 6 1,725 8 Chimney Rock 21,547 0 0 46 0 Cochetopa 18,298 47 5 3,445 19 Cottonwood Lakes 23,797 180 4 384 2
Crater Lake 32,142 0 225 520 2 Dallas Creek 16,022 0 0 730 5 Fossil Ridge 26,399 0 0 1,573 6 Gothic 27,907 1 0 1,567 6 Green Mountain 24,707 31 16 133 1
Grizzly Peak 15,270 0 0 144 1 Huntsman Mountain 30,527 0 0 290 1

GMUG National Forests Land Management Plan Draft Environmental Impact Statement: Volume 1
161
Lynx Analysis Unit
Total Acres of Lynx Habitat
Incidental Loss of
Habitat from Recovery Harvest,
1995–2020 (25 percent incidental
loss)1
Incidental Loss of
Habitat from Resiliency Harvest,
1995–2020 (15 percent incidental
loss)2
Total Unsuitable
Lynx Habitat (recovery and
resiliency harvest and
temp roads + beetle
mortality)
Percent Unsuitable from Beetle
Kill and Vegetation
Management Iron Mountain 16,379 58 3 1,078 7 Island Lake 17,402 104 63 634 4 Kannah Creek 11,417 88 144 472 4 Lake City 23,702 118 27 1,555 7 Little Cone 15,400 6 0 1,292 8 Lone Cone 22,720 53 39 624 3 Los Pinos Creek 21,341 422 5 4,549 21
Matterhorn 18,630 34 0 415 2 Mesa Lakes 17,333 21 0 379 2 Mount Gunnison 20,207 0 0 233 1
Needle-Razor 5,969 79 9 655 11 Peeler Lakes (Kebler 20,760 0 0 0 0
Pitkin 20,116 14 0 1,660 8 Ragged Mountain 8,594 0 0 61 1
Red Creek 37,623 0 136 3,967 11 Rocky Brook 37,349 0 0 1,019 3 Sawtooth Mountain 24,067 0 0 1,583 7
Soap Creek 34,400 0 0 2,855 8 South Mamm Peak 6,507 0 0 60 1
Spring Creek 25,056 244 87 571 2 Stewart Creek 30,643 379 0 12,550 41 The Flat Tops 31,299 2 0 430 1 Tincup 32,806 0 0 1,223 4 Traver Mesa NEW 26,619 187 336 1,030 4
Turret Ridge 28,251 3 2 746 3 Upper Taylor 25,817 0 0 876 3 Upper Tomichi 17,484 0 0 1,702 10 Whetstone Peak 12,455 0 0 115 1
Whitecross Mtn 6,329 0 0 181 3 Total 1,203,208 3,764 1,536 78,813 7
USDA Forest Service
162
1Recovery harvest is salvage harvest of dead and dying trees from bark beetle induced mortality. We assume that salvage harvest causes an incidental temporary loss of habitat from 25 percent of treatment units.
2Resiliency harvest is live (green) tree harvest treatments designed to promote uneven age-class diversity in lynx habitat. We assume that live tree harvest causes an incidental temporary loss of habitat from 15 percent of treatments.
Based on our updated lynx habitat statistics, 43 lynx analysis units are below 10 percent unsuitable, four lynx analysis units range from 10 to 15 percent unsuitable, three range from 16 to 30 percent unsuitable, and two are above 30 percent unsuitable.
Environmental Consequences
Analysis Framework
This analysis addresses a key issue identified for lynx, which is to provide plan direction that reflects the best available science and remains relevant through time. Since the Southern Rockies Lynx Amendment amended the forest plan in 2008, and since the Lynx Conservation Assessment and Strategy was updated in 2013, we have learned more about lynx use and habitat conservation in Colorado. A lynx biology team (Forest Service and Colorado Parks and Wildlife biologists/scientists) is currently applying lynx tracking data to update habitat mapping for the Southern Rockies. During this same period, we’ve experienced a widespread spruce bark beetle epidemic affecting lynx habitat conditions. Our analysis reflects our consideration of ongoing science of lynx conservation and management. Lynx analysis units provide a fundamental scale at which to evaluate and monitor the effects of management actions on lynx habitat. Lynx analysis units do not depict actual lynx home ranges, but their size and configuration approximate the area used by an individual lynx, with habitat components necessary for year-round use. Within lynx analysis units our analysis for alternatives B, C, and D focuses on the areas with documented lynx use, where habitats are more contiguous and favorable for snowshoe hares. Based on lynx habitat mapping currently being modeled for the Southern Rockies by the Interagency Lynx Biology Team, we identified lynx use areas in the GMUG based on best available science (Theobald and Shenk 2011) that are likely to align with the forthcoming habitat mapping. We use the lynx use areas as a proxy for high-quality habitat in this analysis of the action alternatives, reflecting our current best estimate on where we will focus lynx habitat management and conservation.
Management Direction
The Canada lynx was listed as threatened in 2000. In 2013, the third edition of the Canada Lynx Conservation Assessment and Strategy was released, to provide a consistent and effective approach to conserve Canada lynx on Federal lands (Interagency Lynx Biology Team 2013). The Canada Lynx Conservation Agreement (USDA Forest Service and USFWS 2005) identifies the Science Report (Ruggiero et al. 2000) and the Lynx Conservation Assessment and Strategy (Ruediger et al. 2000 – first edition) as including the best available science. The Science Report (Ruggiero et al. 2000) is a compilation and interpretation of scientific knowledge on lynx, its primary prey and habitat relationships. The Lynx Conservation Assessment and Strategy (Ruediger et al. 2000; Interagency Lynx Biology

GMUG National Forests Land Management Plan Draft Environmental Impact Statement: Volume 1
163
Team 2013) builds upon this scientific base and identifies the risks to the species that may occur because of Federal land management and recommends conservation measures to remove or minimize risks. Collectively, the Science Report, the Lynx Conservation Assessment and Strategy, other relevant science, and locally specific information provide the best available scientific information. In 2008, the Southern Rockies Lynx Management Direction Record of Decision on the Southern Rockies Lynx Amendment (USDA Forest Service 2008b) was published, which amended the forest plan. The Southern Rockies Lynx Amendment plan components were designed to conserve and promote lynx recovery. The Southern Rockies Lynx Amendment applies to all National Forest System lands designated occupied by lynx in the Forest Service Rocky Mountain Region. The GMUG National Forests is considered occupied, which has been confirmed by Colorado Parks and Wildlife lynx tracking data and occupancy surveys. The Southern Rockies Lynx Amendment contains standards to maintain lynx habitat connectivity within and between lynx analysis units by limiting permanent development and vegetation management and requiring identification of potential crossing areas for highway construction in linkage areas. Vegetation management standards limit actions that produce early stand-initiation stage forest (habitat that does not provide forage or cover for snowshoe hares or lynx). Standards restrict the amount of precommercial thinning and other vegetation treatments that could reduce existing snowshoe hare habitat. Exemptions to these standards allow for fuel treatment within the wildland-urban interface. The Southern Rockies Lynx Amendment contains guidelines and objectives addressing factors such as maintenance of habitat for alternate prey species and habitat distribution. Guidelines encourage livestock grazing practices compatible with conserving lynx habitat, and to manage human uses such as recreation, travel, and mineral and energy development to maintain lynx habitat conditions and connectivity, and to limit human-caused snow compaction in lynx habitat.
Effects Common to All Alternatives
All alternatives apply the Southern Rockies Lynx Amendment direction to the most currently available lynx habitat mapping (table 89). The alternatives vary slightly in how they adopt the Southern Rockies Lynx Amendment direction. All alternatives would carry forward all or most plan components from the current Southern Rockies Lynx Amendment direction (see appendix 4 of the plan). The no-action alternative would continue to apply the Southern Rockies Lynx Amendment as we do today. Alternative B (blended alternative) would remove standard VEG S2 and add a new standard (FW-STND-SPEC-35, referred to as VEG S7). Alternative C (active management emphasis) would remove standards VEG S2, S5, and S6 and add VEG S7. Alternative D (special area emphasis) adopts the Southern Rockies Lynx Amendment in its entirety, and adds standard VEG S7. The effects of these different standards are discussed below in sections Effects of the Proposed Action – Southern Rockies Lynx Amendment Direction and Comparison of the Effects of the Alternatives – Southern Rockies Lynx Amendment Direction.

USDA Forest Service
164
Table 89. Southern Rockies Lynx Amendment, by alternative
No-Action Alternative Alternative B:
Blended Alternative
Alternative C: Active Management
Emphasis Alternative D:
Special Area Emphasis
Southern Rockies Lynx Amendment applies to applies to the most currently available lynx habitat mapping.
Southern Rockies Lynx Amendment, as amended, applies to the most currently available lynx habitat mapping.
Same as B Same as B
N/A
*NEW* Veg S71 applies to salvage activities that would impact high-quality lynx habitat within high-use areas.
Same as B *NEW* Veg S82 applies to vegetation in dead overstory stands to management activities that would impact high-quality lynx habitat.
N/A
Southern Rockies Lynx Amendment, as amended, would remove Veg S2.
Southern Rockies Lynx Amendment, as amended, would remove Veg S2, S5, and S6.
All original Southern Rockies Lynx Amendment standards would be applied.
1 VEG S7: Salvage activities in stands that represent high quality lynx habitat may occur in up to 7 percent of the high-probability lynx use area (95 percent lynx use areas shown on the High Probability Lynx Use Area Map) that overlaps the suitable timber base 15 years from the date on the forest plan decision. Salvage activities in VEG S7 stands in combination with all vegetation management activities, including incidental damage resulting in either Stand Initiation Structural Stage conditions, a reduction of horizontal cover, or both, are tracked for 15 years from the decision date for this forest plan decision.
2 VEG S8: In stands that do not qualify for Veg S6 due to overstory mortality, harvest activities may occur in as much as, but not more than, 7% of mapped lynx habitat over a period of 15 years from the date of the forest plan decision. Harvest activities in VEG S7 stands in combination with all vegetation management activities, including incidental damage resulting in either Stand Initiation Structural Stage conditions, a reduction of horizontal cover, or both, are tracked for 15 years from the decision date for this forest plan decision.
The proposed new standard, FW-STND-SPEC-35 (VEG S7), is based on best available science from the adjacent Rio Grande National Forest and is designed to limit harvest in high quality lynx habitat within identified lynx highly selected use areas. Highly selected use areas mapped on the GMUG National Forest comprise about 10,600 acres on the Gunnison Ranger District south and southwest of the town of Lake City. The draft revised forest plan alternatives include desired conditions specific to lynx on habitat connectivity (FW-DC-SPEC-32) and forest diversity (FW-DC-SPEC-33), a requirement to follow the Southern Rockies Lynx Amendment direction (FW-STND-SPEC-34), and management approaches on lynx linkage areas and vegetation management. In addition to lynx-specific direction, the revised plan alternatives offer complementary Forestwide coarse filter components for ecosystems and native species diversity (same across all action alternatives). These Forestwide plan components commit the GMUG National Forests to maintain or restore ecosystem and habitat diversity by conserving key ecosystem characteristics that species depend on. For example, vegetation connectivity facilitates lynx movements across landscapes. Areas of spruce-fir climate refugia may be a driver that helps species like lynx to persist despite changing and uncertain environmental conditions. Course woody debris functions as lynx denning habitat and meets habitat needs for lynx prey species. Old growth is a key ecosystem characteristic meeting certain lynx life history needs (denning) and provides habitat for associated prey species. The Key Ecosystems Characteristics section of

GMUG National Forests Land Management Plan Draft Environmental Impact Statement: Volume 1
165
Forestwide plan describes desired conditions and objectives for climate refugia (ECO-03, ECO-04), connectivity (ECO-05, SPEC-01, SPEC-03), and snags and course woody debris (ECO-06). Guideline ECO-07 recommends snag course woody debris levels to maintain ecological integrity and meet wildlife needs (table 2 in the proposed plan). Desired condition ECO-08 promotes old forest to support old growth- dependent species. Guideline SPEC-11 promotes snag retention to meet lynx habitat needs. All action alternatives add ecosystem and species desired conditions, standards, and guidelines promoting lynx conservation that are not present in the current plan. All action alternatives take an ecological approach by designing plan components based on key ecosystem characteristics lynx depend on, in alignment with the 2012 Planning Rule. We believe this approach will contribute to focused lynx conservation.
Vegetation Management
Vegetation management activities may require temporary roads to access timber. Temporary roads would create a temporary habitat loss where they traverse lynx habitat. Lynx habitat restoration would begin when temporary roads, which include decommissioned road prisms used as temporary roads, are closed after management activities are completed. Restoration treatments to restore temporary roads to their previous condition would involve applying methods that break up soil compaction, gating, or other methods to prevent public use, restoring original slope contours, and erosion prevention methods. The proposed plan, across all action alternatives, adds direction for soil restoration to temporary roads, non-system routes, skid trails, landings, and burn pile scars that contribute to lynx habitat recovery (FW-STND-SOIL-03 and FW-STND-TSTN-05). Roads and trails across the GMUG are expected to remain the same or decrease across the GMUG over time due to travel management and plan components such as FW-GDL-SPEC-16. Southern Rockies Lynx Amendment direction for road or other route alignments provides guidance to avoid placing them in certain types of topographic features important for lynx habitat connectivity such as ridgelines and saddles.
Fire Management
Wildfire and prescribed fire have positive and negative effects on lynx and lynx habitat depending on fire severity, site recovery potential (including habitat recovery time-period), and erosion influence on vegetation recovery afterward. Fire severity is likely the most consequential indicator for lynx habitat recovery. As observed on the neighboring Rio Grande National Forest, the West Fork Complex fire that burned in 2012 was a stand-replacing event that burned with high severity over much of its extent, resulting in long-term (100+ years, perhaps much longer in some areas) lynx habitat loss. Based on a GPS-collar lynx tracking study on the Rio Grande National Forest (conducted by the Rocky Mountain Research Station and Colorado Parks and Wildlife), lynx completely avoid the high severity burn areas. This is in contrast to low severity burns that can be beneficial to lynx habitat by promoting conifer regeneration and structural diversity. The effects from wildfire and prescribed fire will be similar across all alternatives. Alternatives B, C, and D allow for more fire use for resource benefit than is possible under the current forest plan. Fire use managed consistently with the Southern Rockies Lynx
USDA Forest Service
166
Amendment direction provides opportunities to manage for long-term lynx habitat objectives where appropriate on the landscape. Connected actions associated with wildfire suppression and prescribed fire management include fireline construction, which could contribute to temporary habitat loss. Temporary habitat loss would likely be more extensive from wildfire suppression because heavy equipment (dozers) are often used to create firelines, and trees are often cut down along firelines. Temporary habitat loss would likely be far less from prescribed fire management, because lynx habitat objectives consistent with forest plan direction and the Southern Rockies Lynx Amendment would be built into project design. Prescribed burning is not commonly implemented in primary lynx habitat (spruce-fir). Fire effects to spruce-fir will most likely be associated with wildfires. Prescribed burning is more likely to overlap secondary lynx habitat where aspen and conifer-aspen mixed stands are prevalent. The Forest Service would apply many of the same project design features used for timber harvests to fuels treatments to limit disturbance, while working with wildlife biologists to integrate lynx habitat objectives consistent with Southern Rockies Lynx Amendment direction where applicable and where opportunities to achieve multiple resource outcomes exist outside the wildland-urban interface. Fuels treatments would likely have the most impact to lynx habitat in the wildland-urban interface. There are 438,067 acres of mapped lynx habitat and 184,224 acres of lynx use areas (Theobald and Shenk 2011) in what the GMUG National Forests currently identify as the wildland-urban interface. The GMUG applies a buffer around at-risk values, consisting of a one-mile buffer around urban interface areas and smaller buffers around communication sites, developed recreation sites, Remote Automated Weather Station sites, and utility corridors. Treatments in lynx habitat in the wildland-urban interface as defined by the Healthy Forests Restoration Act count toward the Southern Rockies Lynx Amendment wildland-urban interface exception in all alternatives. The Southern Rockies Lynx Amendment describes this wildland-urban interface exception as: Standards VEG S1, VEG S2, VEG S5, and VEG S6 apply to all vegetation management projects that regenerate forested stands, except for fuel treatment projects within the wildland-urban interface as defined by the Healthy Forests Restoration Act. This exception has a limitation: Fuel treatment projects within the wildland-urban interface that do not meet standards VEG S1, VEG S2, VEG S5, VEG S6, or VEG S7 shall occur on no more than 3 percent (cumulatively) of lynx habitat on each administrative unit (a national forest or administratively combined national forests). In addition, fuel treatment projects may not result in more than three adjacent lynx analysis units exceeding the standard. Southern Rockies Lynx Amendment guideline VEG G10 also applies to fuel treatment projects under the current forest plan and would apply under all action alternatives. Lynx habitat use areas in the wildland-urban interface are listed in table 90.
Table 90. Lynx habitat use areas in the wildland-urban interface
Wildland-Urban Interface Category
Lynx Habitat (acres)
Lynx Use Area (acres)
Communication Site 6,579 4,173 Developed Recreation Site 10,891 5,689

GMUG National Forests Land Management Plan Draft Environmental Impact Statement: Volume 1
167
Wildland-Urban Interface Category
Lynx Habitat (acres)
Lynx Use Area (acres)
Remote Automated Weather Station Site 1,969 2,009
Urban Interface 295,785 115,715 Utility Corridor 122,843 56,639
Grazing and Human Uses
The Southern Rockies Lynx Amendment direction specifies one objective (GRAZ 01) and four guidelines (GRAZ G1, G2, G3, and G4) that apply to grazing in lynx habitat in lynx analysis units in occupied habitat. Grazing in lynx habitat is managed to be compatible with improving or maintaining lynx habitat, managing grazing so that impacts do not prevent shrubs and trees from regenerating, managing grazing for long-term aspen forest health and sustainability, and maintaining mid- or late-seral stages in willow riparian areas and shrub-steppe habitats (within the elevation range of forested lynx habitat in lynx analysis units). This direction applies to all alternatives. Grazing effects should remain the same across all alternatives. The Southern Rockies Lynx Amendment direction specifies 6 objectives and 12 guidelines for human uses, such as special uses (other than grazing), recreation management, roads, highways, and mineral and energy development in lynx habitat in lynx analysis units in occupied habitat, subject to valid existing rights. This direction addresses snow compaction, recreation activities, development, roads, and lynx habitat and connectivity. This direction applies to all alternatives. The main difference between the action alternatives relates to the allocation differences for wildlife management areas, recommended wilderness, recreation emphasis corridors, and the proposed new Gunnison Research Special Interest Area (quantified in the Comparison of the Effects of the Alternatives section). Standard MA-STND-WLDF-02 limits route density (motorized and non-motorized combined) in wildlife management areas to no more than 1 mile per square mile, and where that density is currently exceeded, requires that there is no net gain. Overlap of wildlife management areas with lynx habitat prevents or reduces recreation impacts to lynx and habitat from new roads and trails. Objective MA-OBJ-WLDF-03 improves habitat connectivity with respect to existing route densities and to achieve desired constituent ecosystem conditions in alignment with MA-DC-WLDF-01. Alternative B would provide the greatest benefit (25 percent of the GMUG National Forests is in wildlife management areas), followed by alternatives D (21 percent of the GMUG in wildlife management areas) and C (1 percent of the GMUG in wildlife management areas).
Effects of the No-Action Alternative
The no-action alternative would continue to implement the full Southern Rockies Lynx Amendment direction in mapped lynx habitat in lynx analysis units. The new standard VEG S7 (FW-STND-SPEC-35) would not apply, nor would any Southern Rockies Lynx Amendment standards be removed as proposed under alternatives B and C. Under the current forest plan, projects in lynx habitat are designed to be consistent with all applicable Southern Rockies Lynx Amendment objectives, guidelines, and standards. The biological
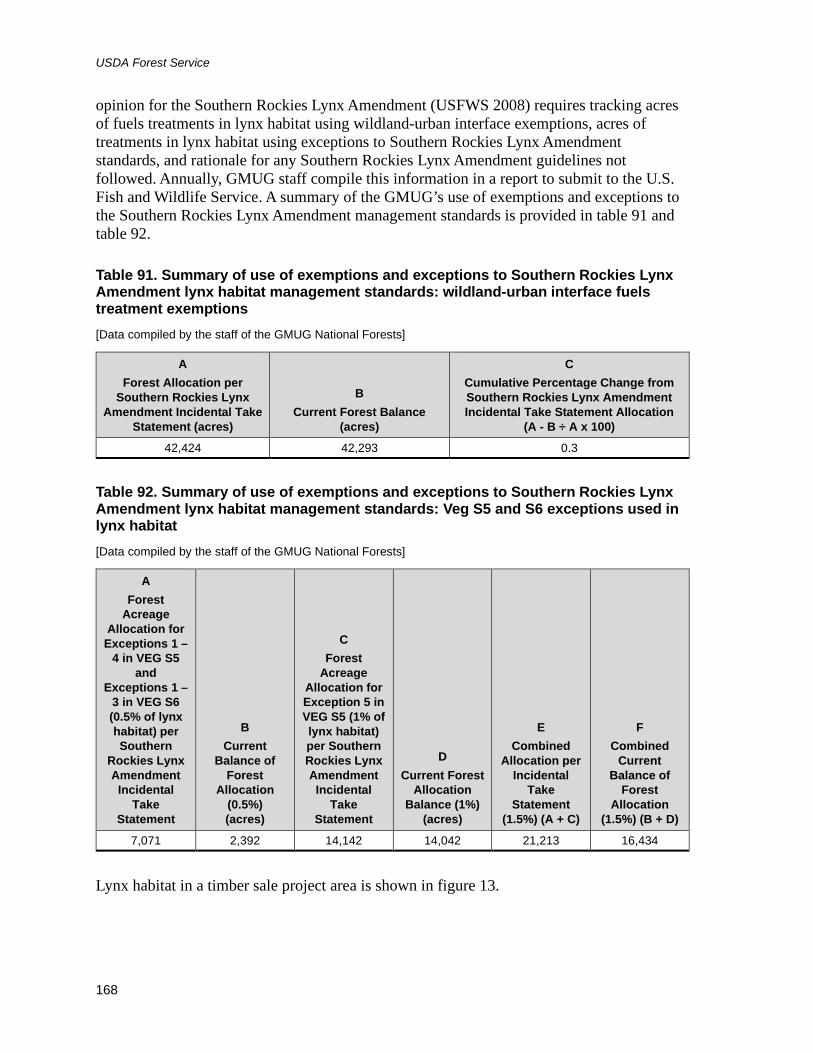
USDA Forest Service
168
opinion for the Southern Rockies Lynx Amendment (USFWS 2008) requires tracking acres of fuels treatments in lynx habitat using wildland-urban interface exemptions, acres of treatments in lynx habitat using exceptions to Southern Rockies Lynx Amendment standards, and rationale for any Southern Rockies Lynx Amendment guidelines not followed. Annually, GMUG staff compile this information in a report to submit to the U.S. Fish and Wildlife Service. A summary of the GMUG’s use of exemptions and exceptions to the Southern Rockies Lynx Amendment management standards is provided in table 91 and table 92.
Table 91. Summary of use of exemptions and exceptions to Southern Rockies Lynx Amendment lynx habitat management standards: wildland-urban interface fuels treatment exemptions [Data compiled by the staff of the GMUG National Forests]
A Forest Allocation per
Southern Rockies Lynx Amendment Incidental Take
Statement (acres)
B Current Forest Balance
(acres)
C Cumulative Percentage Change from Southern Rockies Lynx Amendment Incidental Take Statement Allocation
(A - B ÷ A x 100) 42,424 42,293 0.3
Table 92. Summary of use of exemptions and exceptions to Southern Rockies Lynx Amendment lynx habitat management standards: Veg S5 and S6 exceptions used in lynx habitat [Data compiled by the staff of the GMUG National Forests]
A Forest
Acreage Allocation for
Exceptions 1 – 4 in VEG S5
and Exceptions 1 –
3 in VEG S6 (0.5% of lynx habitat) per Southern
Rockies Lynx Amendment
Incidental Take
Statement
B Current
Balance of Forest
Allocation (0.5%) (acres)
C Forest
Acreage Allocation for Exception 5 in VEG S5 (1% of lynx habitat) per Southern Rockies Lynx Amendment Incidental
Take Statement
D Current Forest
Allocation Balance (1%)
(acres)
E Combined
Allocation per Incidental
Take Statement
(1.5%) (A + C)
F Combined
Current Balance of
Forest Allocation
(1.5%) (B + D) 7,071 2,392 14,142 14,042 21,213 16,434
Lynx habitat in a timber sale project area is shown in figure 13.

GMUG National Forests Land Management Plan Draft Environmental Impact Statement: Volume 1
169
Figure 13. Lynx habitat in a timber sale project area
Moderate to high lynx use areas modeled by Theobald and Shenk (2011) overlap approximately 325,281 acres of the mapped lynx habitat in the GMUG National Forests. Much of those acres are in designated wilderness, roadless areas, or other protected areas (discussed in Comparison of the Effects of the Alternatives section). Approximately 66,638 acres of modeled lynx habitat within the Theobald and Shenk (2011) lynx use areas occur in the alternative A suitable timber base. Since VEG S7 would not apply under alternative A, there would be no limit to how much salvage harvest could occur in high-quality lynx habitat within these approximately 66,700 acres other than as currently limited under the Southern Rockies Lynx Amendment direction.
Effects of the Action Alternatives
Southern Rockies Lynx Amendment Direction
Alternative B would apply the Southern Rockies Lynx Amendment direction to the most currently available lynx habitat mapping, and would remove one Southern Rockies Lynx Amendment standard, VEG S2. Alternative B adds two desired conditions for habitat connectivity and forest structural diversity (FW-DC-SPEC-32 and FW-DC-SPEC-33), a standard that requires applying the Southern Rockies Lynx Amendment direction as amended (FW-STND-SPEC-34), and a standard limiting salvage harvest in high-quality lynx habitat in lynx highly selected use areas referred to as VEG S7 (FW-STND-SPEC-35). Standard VEG S2 states: Timber management projects shall not regenerate more than 15 percent of lynx habitat on National Forest System lands within a lynx analysis unit in a 10-year period. This 15 percent includes the entire stand within an even-age regeneration area, and only the patch opening areas within group selections. Salvage harvest within stands killed by insect epidemics, wildfire, etc. does not contribute to the 15 percent, unless the harvest treatment would cause the lynx habitat to change to an unsuitable condition.

USDA Forest Service
170
Management under the current forest plan as amended in 2008 by the Southern Rockies Lynx Amendment never approaches the VEG S2 threshold for any lynx analysis unit. Removing this standard will not impact lynx habitat conservation because not enough acres are treated to regenerate lynx habitat in any given lynx analysis unit to ever reach 15 percent within a 10-year period. Removing VEG S2 will not reduce lynx conservation because VEG S1 will continue to meet landscape-level (lynx analysis unit) habitat conservation, it is more biologically meaningful since it accounts for lynx reproductive needs, and adding VEG S7 reduces vegetation disturbance in high-quality habitat identified in lynx use areas. The effect of removing Veg S2 is anticipated to be limited to reduced administrative burden. If the GMUG National Forests were to increase the pace and scale of vegetation management, one potential benefit of removing VEG S2 is that movement toward desired conditions for early seral spruce-fir (currently less than 1 percent of the plan area) to the natural range of variability (27–32 percent) could be achieved sooner. This could increase spruce-fir resiliency by reducing susceptibility to beetle epidemics or wildfire. Treatments temporarily converting lynx habitat to a stand initiation structural stage would impact lynx and their prey, but standard VEG S1 still applies, limiting how much lynx habitat is converted in each lynx analysis unit, and standard VEG S6 still applies, limiting reduction of winter snowshoe hare habitat in multi-story mature or late-successional conifer forests. Increasing early seral spruce-fir consistent with the Southern Rockies Lynx Amendment standards would benefit lynx habitat in the long term by increasing structural diversity and promoting future snowshoe hare habitat. The conservation community provided input on the working draft revised forest plan that expressed a desire to modify the VEG S1 threshold for percentage of unsuitable habitat in a lynx analysis unit from 30 percent to 10-15 percent to maximize female reproductive capacity. Maintaining the VEG S1 threshold at 30 percent is consistent with the best available science (Interagency Lynx Biology Team 2013). As discussed under Effects of the No-Action Alternative, based on management direction under the current plan, 83 percent of lynx analysis units in the GMUG are below 10 percent unsuitable and 90 percent are below 15 percent unsuitable. Based on this trend which has occurred over the 21-year period since lynx were listed in 2000, we anticipate that most lynx analysis units will remain below 15 percent unsuitable for the foreseeable future. However, if new information from the Interagency Lynx Biology Team or other peer-reviewed published science recommends lowering the 30 percent threshold, the GMUG will do so based on best available science. Alternative B (and C) adds VEG S7, which limits the salvage harvest amount that could occur in the lynx highly selected use area (as identified from the Rio Grande National Forest lynx study overlap with the GMUG, led by John Squires, Rocky Mountain Research Station). Under alternatives B and C, the proposed suitable timber base overlaps approximately 868 acres (8 percent) of the lynx highly selected use area. Site-scale characteristics would still be used to determine if Veg S7 would apply (i.e., confirm high-quality habitat in dead mature overstory stands). VEG S7 allows for salvage harvest to occur in up to 7 percent of high-quality habitat in dead mature overstory stands. Alternatives B and C would allow for salvage harvest to occur in up to 61 acres, under the assumption that all 867 acres meet the definition of high-quality habitat (≥45 percent dense horizontal cover) and consist of dead mature overstory. Locations where VEG S7 applies are shown in figure 14figure 15.

GMUG National Forests Land Management Plan Draft Environmental Impact Statement: Volume 1
171
Figure 14. Area where VEG S7 applies in alternative B
Forthcoming lynx habitat maps are anticipated prior to publication of the final environmental impact statement. As a proxy for those maps in the meantime, areas described by Theobald and Shenk (2011) were used as a proxy for a maximum applicable area. Under alternative B, the proposed suitable timber base overlaps approximately 142,761 acres (25 percent) of the Theobald and Shenk lynx use areas. Alternative B would allow for salvage harvest to occur in up to approximately 9,993 acres, if all 142,761 acres meet the definition of high-quality habitat (≥45 percent dense horizontal cover) and consist of dead mature overstory. This is likely an overestimate of how much salvage harvest could occur because not all of these acres have dead mature overstory and are high-quality habitat, making it likely that standard VEG S6 would instead still apply to some of these acres.
Comparison of Effects of the Alternatives
Southern Rockies Lynx Amendment Direction
The effect of removing VEG S2 in alternatives B and C is discussed above, in the section Effects of the Proposed Action – Southern Rockies Lynx Amendment Direction, as well as the effect of adding Veg S7 to alternatives B and C. Alternative C removes VEG S2, S5, and S6. The effects of removing VEG S2 would be the same as discussed in alternative B. Removing VEG S5 and S6 from alternative C is consistent with the active management emphasis that alternative C provides. Removing these standards would result in a reduced administrative burden. For lynx, the potential effects could be that under alternative C, vegetation management activities may affect more lynx habitat than alternatives A, B, and D due to

USDA Forest Service
172
removing the Veg S2, S5, and S6 standards. In alternative C, lynx habitat would still be managed at the lynx analysis unit scale to meet VEG S1. In contrast to the no-action alternative, VEG S7 adds a conservation benefit by limiting salvage harvest in high-quality lynx habitat where VEG S6 would no longer apply. The spruce bark beetle epidemic caused a changed condition to lynx habitat, converting habitat from multi-storied to single-storied due to the dead overstory. Per the Southern Rockies Lynx Amendment, VEG S6 only applies to multi-storied stands. Due to the changed condition, VEG S6 no longer applies to habitat it once applied to. However, dead overstory stands with high dense horizontal cover percentages resulting from live understory combined with dead overstory can still provide high-quality habitat. VEG S7 would protect that high-quality habitat where VEG S6 could no longer do so. VEG S8 in Alternative D likewise applies to lynx habitat that no longer meets the VEG S6 definition, but restricts all harvest rather than just salvage. Alternative D would have the greatest conservation benefit to lynx, followed by alternatives B, C, and A. The addition of VEG S7 to alternatives B and C, and Veg S8 to alternative D, adds additional lynx habitat conservation as compared to alternative A.
Vegetation Management
Between alternatives, lynx habitat management varies spatially based on acreage differences in timber suitability (table 93 and table 94). Three different sets of habitat data are used in this analysis (table 93 and table 94): currently used maps of lynx habitat (1,344,585 acres), more focused areas (581,069 acres) identified by Theobald and Schenk (2011); and yet more focused high-use areas (10,600 acres) identified by Squires et al. (2013).
Table 93. Mapped lynx habitat acres in suitable timber, by alternative, GMUG National Forests
Alternative
A (Southern Rockies Lynx Amendment
applies to the most currently available
lynx habitat mapping)
B (Southern Rockies Lynx
Amendment, as amended, applies to the most currently available
lynx habitat mapping; adds VEG S7; removes
VEG S2)
C (same as B; also removes VEG S2,
S5 and S6)
D (adds VEG S8;
keeps all original Southern
Rockies Lynx Amendment standards)
Total lynx habitat as mapped by the GMUG1
1,344,585 Same as A. Same as A Same as A
GMUG Lynx habitat in suitable timber
234,731 (17%) 457,985 (34%) 475,734 (35%) 342,009 (25%)

GMUG National Forests Land Management Plan Draft Environmental Impact Statement: Volume 1
173
Alternative
A (Southern Rockies Lynx Amendment
applies to the most currently available
lynx habitat mapping)
B (Southern Rockies Lynx
Amendment, as amended, applies to the most currently available
lynx habitat mapping; adds VEG S7; removes
VEG S2)
C (same as B; also removes VEG S2,
S5 and S6)
D (adds VEG S8;
keeps all original Southern
Rockies Lynx Amendment standards)
GMUG lynx habitat not in suitable timber
860,486 (64%) 886,600 (66%) 868,851 (65%) 1,002,576 (75%)
1 Lynx habitat mapping for the GMUG was updated in 2020 – 2021 using FS Veg Spatial, accounting for changed conditions due to tree mortality from spruce bark beetle.
Table 94. Lynx use areas and/or mapped lynx habitat in suitable timber, by alternative
Alternative A B C D Lynx use areas modeled by Theobald and Shenk (2011)1 581,069 Same as A Same as A Same as A
Forestwide, Theobald and Shenk (2011) lynx use areas in suitable timber Specific to Alternatives B and C: Lynx highly selected areas per Rio Grande National Forest lynx study overlap with the GMUG
66,638 (11% overlap with suitable timber)
142,761 (25%) (Maximum probable area VEG S7 could apply Forestwide) 867 (acres of lynx highly selected use areas where VEG S7 applies)
152,072 (26%) 867 (acres of lynx highly selected use areas where VEG S7 applies)
99,763 (17%)
Allowed salvage harvest acres under VEG S7 for Alternatives B and C, and allowed vegetation management under VEG S8 for Alternative D (7% of lynx use areas)
N/A
9,993 (1.7% of total lynx use areas Forestwide) 61 (in lynx highly selected use areas)
10,645 (1.8% of total lynx use areas Forestwide) 61 (in lynx highly selected use areas)
6,983 (1.2% of total lynx use areas Forestwide)
Theobald and Shenk lynx use areas not in suitable timber 514,431 (89%) 438,308 (75%) 428,997 (74%) 481,306 (83%)
1 Lynx use areas modeled by Theobald and Shenk (2011) in the GMUG National Forests were used as a proxy in this analysis to estimate where we anticipate applying VEG S7.
Certain timber harvest activities, such as salvage harvest, are not limited to only the suitable timber base, although we expect most timber harvest to occur in the suitable timber base allocation. Regardless, VEG S7 limits harvest activities in stands representing high-quality lynx habitat to as much as, but not more than, 7 percent over a period of 15 years. This applies to each action alternative. Alternatives B, C, and D contain more acres of lynx use areas in the suitable timber base compared to alternative A (table 94). However, when applying VEG S7, there are far fewer acres where harvest could occur in the action

USDA Forest Service
174
alternatives (ranging from 6,983 acres in alternative D to 10,645 acres in alternative C) compared to alternative A (66,638 acres). With respect to lynx, there are several trade-offs to managing an area as recommended or designated wilderness. Doing so provides the maximum amount of resource protection from human-induced disturbance or development that leads to long-term or permanent habitat loss. Wilderness designation strictly limits our ability to manage vegetation to meet desired conditions, which embrace perpetuating lynx habitat conditions by increasing forest age-classes, structural diversity, and resiliency. Wilderness designation strictly limits our ability to manage emerging disturbances such as bark beetle outbreaks. There could be an increased potential for high-severity fires in recommended wilderness compared to the no-action alternative, which could contribute to temporary lynx habitat loss if stand replacement fires occur. However, long-term benefits to lynx and lynx habitat due to development exclusion within recommended wilderness may outweigh impacts from potential periodic, high-intensity fires that may result from or within unmanaged stands. However, most recommended wilderness (86 to 92 percent) in the action alternatives overlaps existing Colorado roadless areas, which already place restrictions on vegetation management. A summary comparison of lynx habitat acres in protected areas is provided in table 95. A summary comparison of the effects of recommended wilderness on lynx habitat is provided in table 96.
Table 95. GMUG lynx habitat acres in existing wilderness, recommended wilderness, Colorado roadless areas, special interest areas, and research natural areas
Protected area with mapped lynx habitat Alternative
A Alternative
B Alternative
C Alternative
D Designated Wilderness 321,063 321,063 321,063 321,063 Recommended Wilderness N/A 16,3583 N/A 118,4044
Tabeguache and Roubideau Designated Areas 2,754 2,754 2,754 2,754
Fossil Ridge Special Recreation Area 16,865 16,865 16,865 16,865 Special Interest Area 1,124 7,6102 846 2,1345
Research Natural Area 6401 6401 6401 6401
Colorado Roadless Area 413,433 413,433 413,433 413,433 Special Management Area N/A N/A N/A 122,2366
Total 758,330 759,527 754,997 819,423 1604 acres of the research natural area overlap the Colorado roadless area. Colorado roadless area acreage includes the
research natural area inclusion. Total acreage does not double-count these acres. 2 In alternative B, 5,326 acres of the special interest area overlap the Colorado roadless area. Colorado roadless area acreage
includes the special interest area inclusion. Total acreage does not double-count these acres. 3 In alternative B, 13,266 acres of the recommended wilderness overlap the Colorado roadless area. Colorado roadless area
acreage includes the recommended wilderness inclusion. Total acreage does not double-count these acres. 4 In alternative D, 103,369 acres of the recommended wilderness overlap the Colorado roadless area. Colorado roadless area
acreage includes the recommended wilderness inclusion. Total acreage does not double-count these acres. 5 In alternative D, 936 acres of the special interest area overlap the Colorado roadless area. Colorado roadless area acreage
includes the special interest area inclusion. Total acreage does not double-count these acres. 6 In alternative D, 70,324 acres of the special management area overlap the Colorado roadless area. Colorado roadless area
acreage includes the special management area inclusion. Total acreage does not double-count these acres.

GMUG National Forests Land Management Plan Draft Environmental Impact Statement: Volume 1
175
Table 96. Effects of recommended wilderness on lynx habitat
Qualitative effects of: No-Action Alternative
Alternative B
Alternative C
Alternative D
Total recommended wilderness acres None 34,128 None 306,338 Proportion of recommended wilderness within Colorado roadless areas N/A 86% N/A 92%
GMUG mapped lynx habitat acres in recommended wilderness None 16,358 None 118,404
Proportion of lynx use areas (Theobald and Shenk 2011) in recommended wilderness None 19% None 15%
Proportion of lynx habitat in recommended wilderness within Colorado roadless areas N/A 81% N/A 87%
Potential impacts from reduced ability to manage vegetation toward desired conditions that benefit lynx habitat, and mitigate fire-associated impacts
None Some None Most
Potential long-term benefits to lynx habitat due to protection from habitat loss that could otherwise result from certain management activities or development
None Some None Most
Under alternatives B and D, there are 585,058 and 525,162 acres, respectively, of mapped lynx habitat outside of recommended wilderness, Colorado roadless areas, existing wilderness, designated areas, special interest areas, and research natural areas where we could apply applicable plan components as part of vegetation management activities to achieve lynx habitat objectives over the long-term. Applicable plan components include FW-DC-SPEC-32 (habitat connectivity), FW-DC-SPEC-33 (stand structure diversity), FW-STND-SPEC-35 (places limits on timber harvest and other vegetation management in high-quality lynx habitat), and table 1 of the forest plan expresses desired conditions for spruce-fir seral and structural stage distribution. Spruce-fir ecosystems often support timber production objectives, and timber production objectives would be implemented consistently with FW-DC-ECO-01 (manage toward a mosaic of vegetation conditions) and FW-DC-ECO-02 (ecosystem resiliency).
Cumulative Effects
The lynx analysis units within the GMUG National Forests plan area were considered as the cumulative effects area for this analysis. This includes accounting for reasonably foreseeable actions and effects on adjacent non-Federal lands and considering other adjacent land management plan influences on the GMUG National Forests. Past actions and foreseeable future actions primarily affect lynx habitat structural composition, suitability, and long-term habitat persistence. Activities with the greatest long-term potential impact to lynx are associated with vegetation management projects, the widespread spruce bark beetle epidemic, wildfire, and climate change influence on lynx habitat persistence. The Southern Rockies Lynx Amendment has standards limiting how much habitat we convert to an unsuitable condition from management actions. Since 2008, the Southern Rockies Lynx Amendment has been notably influential on how activities are implemented in lynx habitat. The Effects of the No-Action Alternative section discusses the

USDA Forest Service
176
status, which reflects the lynx habitat environmental baseline as influenced from past actions. The GMUG has not yet experienced a large-scale wildfire in lynx habitat. Wildfire is a reasonably foreseeable future natural disturbance, becoming more likely with projected climate change predictions. Since wildfire is reasonably foreseeable, Forest Service management actions in response to wildfire are also reasonably foreseeable, as described in the Fire Management section. The cumulative effects from past actions and foreseeable future actions are managed through careful planning, design, implementation, and monitoring consistent with the Southern Rockies Lynx Amendment direction under the no-action alternative and similarly under each action alternative. Influence from adjacent management on non-Forest Service lands would have immeasurable effects on site-specific habitat conditions at the individual lynx analysis unit and GMUG National Forests scale (table 97). This is primarily due to the majority of lynx habitat occurring on National Forest System lands (95 percent), rather than on other land ownerships (5 percent).
Table 97. Lynx habitat and use area distribution by land manager or ownership type for the cumulative effects area [Lynx habitat source: GMUG lynx habitat mapping. Use area source: Theobald and Shenk (2011)]
Land Manager or Owner Mapped Lynx Habitat Acres
(percent of total lynx habitat) Lynx Use Area Acres
(percent of total lynx use areas) GMUG National Forests 1,278,296 (95) 539,911 (93) Bureau of Land Management 53 (0.004) 145 (0.02) National Park Service 0 (0) 484 (0.08) Colorado Parks and Wildlife 179 (0.01) 162 (0.03) City 385 (0.03) 526 (0.09) County 111 (0.008) 124 (0.02) State Land Trust 631 (0.05) 479 (0.08) State Land Board 880 (0.07) 86 (0.01) Private 64,050 (4.8) 39,152 (6.7)
Total 1,344,585 (100) 581,069 (100)
The Southern Rockies Lynx Amendment direction has been the biggest driver influencing how the GMUG National Forests implement management actions in lynx habitat since 2008 and will continue to do so into the foreseeable future. Portions of the GMUG National Forests adjoin the White River, Pike-San Isabel, Rio Grande, and San Juan National Forests, each with its own forest plan that also incorporates the Southern Rockies Lynx Amendment direction. Bureau of Land Management lands adjacent or near the GMUG National Forests are managed with Bureau of Land Management resource management plans by the Uncompahgre, Gunnison, and Grand Junction Field Offices. The Uncompahgre resource and travel management plans were recently revised in 2020, the Dominguez-Escalante National Conservation Area plan in 2017, and the Grand Junction plan in 2015. The Bureau of Land

GMUG National Forests Land Management Plan Draft Environmental Impact Statement: Volume 1
177
Management similarly manages lynx habitat consistent with the Lynx Conservation Assessment and Strategy (Interagency Lynx Biology Team 2013). Bureau of Land Management lands around the town of Lake City contain their most contiguous lynx habitat adjacent and connected to lynx habitat in the GMUG National Forests, which is adjacent to lynx high use areas and a core population on the Rio Grande National Forest. Colorado Parks and Wildlife manages their state wildlife areas consistent with each state wildlife area management plan. Colorado Parks and Wildlife activities include noxious weed management, fence maintenance, travel management, and grazing management where allowed, in coordination with adjacent National Forest System lands. The 2015 State Wildlife Action Plan is Colorado Parks and Wildlife’s guiding document, detailing the greatest conservation needs. The State Wildlife Action Plan balances species-specific needs with policy requirements and in alignment with the agency’s proactive approach for considering all interests, protecting wildlife, and supporting economic opportunities. The 2020 Colorado Forest Action Plan identifies a road map for improving forest health, including conditions, challenges, goals, and strategies across six forest themes: forest conditions, living with wildfire, watershed protection, forest wildlife, urban and community forestry, and forest products. The plan prioritizes reducing risk from uncharacteristic wildfire, which is a concern for long-term lynx habitat persistence. The proposed forest plan direction is consistent with these Colorado statewide plan approaches. City- and county-owned lands comprise far less than 1 percent of lynx habitat in the planning area. The GMUG National Forests coordinate with local government on Forest Service management activities. Each county in the planning area has their own land use plan with goals, objectives, and strategies that guide land use decisions, including on the national forests. Community wildfire protection plans identify and prioritize areas for hazardous fuel reduction treatments, recommend treatment types and methods on Federal and non-Federal land to protect one or more at-risk communities and essential infrastructure, and recommend measures to reduce structural ignitability throughout the at-risk community. The Forest Service works in coordination with the counties where their community wildfire protection plans map or define the wildland-urban interface. As described in the Fire Management and Vegetation Management sections, GMUG National Forests hazardous fuels reduction treatments in lynx habitat in the wildland-urban interface are implemented consistently with the Southern Rockies Lynx Amendment direction, which would continue into the foreseeable future under the no-action alternative and the proposed forest plan alternatives. State Land Trust and State Land Board properties comprise far less than 1 percent of lynx habitat in the planning area. These lands are used to generate revenue and provide financial support for Colorado public schools (K-12) and other public institutions. The public does not have access to all properties, except to those enrolled in the Public Access Program. Those open to the public are used for a variety of wildlife-related uses, including hunting, fishing, and wildlife viewing. They have site-specific rules and timeframes for use, with most properties open for wildlife-related recreation from September 1 through the end of February. Most are not accessible by vehicles, all-terrain vehicles, or snowmobiles, and there are often restrictions on camping, parking, and off-road driving. Additionally, the State Land Board leases properties for other uses, such as livestock grazing, farming, or mining. Farming and mining are not common uses seen on state properties in the planning area. We

USDA Forest Service
178
anticipate that lynx habitat on these State properties in the planning area is protected from development or other habitat disturbances into the foreseeable future. Private lands make up 4.8 percent of lynx habitat in the planning area. Private lands in the planning area are typically inholdings surrounded by National Forest System lands, or otherwise border National Forest System lands. Some of these lands have residential homes, commonly seasonal houses, or cabins. Special use permits or road access easements are often associated with these private properties for access or water developments. Many of these private lands are undeveloped or sparsely developed. Basing on Colorado trends in human population, Colorado has one of the fastest growing populations in the country, with a current population of 5.5 million projected to grow to 8.5 million by 2050. We anticipate that recreational uses in the GMUG National Forests will continue to increase due to growing demand and increasing population. Accordingly, we also anticipate seeing increased use on private lands in the planning area, and increased permanent and seasonal residential development. Where this occurs in lynx habitat, this would likely cause a permanent loss of habitat. Areas with documented lynx use consist of remote and rugged terrain not conducive to development. We anticipate that despite expected increases in human use on public and private lands and increased development on private lands, the GMUG National Forests will continue to provide lynx habitat and habitat connectivity to support lynx persistence.
Conclusion
Consistent with 36 CFR 219.9(a)(2), the effects of plan direction would maintain or restore the diversity of ecosystems and habitat types in the plan area because proposed plan direction would maintain or restore key ecosystem characteristics lynx depend on, contribute to lynx habitat persistence, provide for connectivity, and focus lynx conservation based on the best available science. Alternative D provides the most conservation benefit, followed by alternative B and then C.
Gunnison Sage-Grouse (Centrocercus minimus)
Analysis Framework
Key issues for Gunnison sage-grouse relate to key issues described for terrestrial ecosystems that influence the sagebrush ecosystem. Gunnison sage-grouse and the sagebrush ecosystem they depend on are susceptible to a variety of ecological stressors and risk factors. The most substantial current and future threats are habitat loss and decline due to human development and associated infrastructure (USFWS 2014a). Other threats impacting Gunnison sage-grouse to a lesser extent include overgrazing, mineral development, pinyon-juniper encroachment, fences, invasive plants, wildfire, large-scale water development, predation (primarily associated with human disturbance and habitat decline), and recreation. Climate change influences are likely to exacerbate these threats. The Gunnison sage-grouse is considered highly vulnerable to climate change (Neely et al. 2011). Climate change models indicate a warming, drying trend. More frequent droughts increase sagebrush ecosystem vulnerability to non-native plant invasion (i.e., cheatgrass), large-scale habitat loss from uncharacteristic wildfire, pinyon-juniper encroachment, and increased erosion

GMUG National Forests Land Management Plan Draft Environmental Impact Statement: Volume 1
179
causing soil and plant loss. Erosion and associated soil and plant loss often occur in wet meadows and riparian areas used as brood-rearing habitat. In the sagebrush ecosystem, mesic habitats are most sensitive to climate change impacts. At the time of this analysis (April 2021), the GMUG National Forests is entering a third drought year within a four-year period, affecting habitat conditions and ecological integrity. This in turn contributes to a declining Gunnison sage-grouse population trend. To account for the potential effects from specific management area direction, the analysis includes a quantitative assessment of designated critical habitat acres in management areas. To provide an understanding of how proposed plan direction may affect Gunnison sage-grouse or its designated critical habitat and how plan direction helps address threats or contribute to species conservation, we did a qualitative analysis of plan components. Specific key ecosystem characteristics for Gunnison sage-grouse serve as indicators for this analysis. Gunnison sage-grouse depend on large, contiguous sagebrush areas across the landscape for long-term survival. Within the sagebrush ecosystem, seasonally specific vegetation structural characteristics support life history requirements. These are captured in the primary constituent elements described for designated critical habitat (USFWS 2014b), which we adopt as key ecosystem characteristics necessary for species conservation and recovery. The primary constituent elements are described in detail in 79 FR 69311 beginning on page 69333. We summarize them here: Landscape-Specific Primary Constituent Element Primary Constituent Element 1 – Extensive sagebrush landscapes capable of supporting a population of Gunnison sage-grouse. Seasonally Specific Primary Constituent Elements Primary Constituent Element 2 – Breeding habitat (lek, nesting, and early brood-rearing habitats typically used March 15 through July 15) composed of sagebrush plant communities with certain structural characteristics (cover and height) for sagebrush, non-sagebrush, total shrub, grass, and forb. Primary Constituent Element 3 – Summer-late fall habitat composed of sagebrush plant communities with certain structural characteristics (cover and height) for sagebrush, non-sagebrush, total shrub, grass, and forb. Primary Constituent Element 4 – Winter habitat composed of sagebrush plant communities that, in general, have sagebrush canopy cover between 30 to 40 percent and sagebrush height of 15.8 to 21.7 inches (40 to 55 centimeters). Primary Constituent Element 5 – Alternative, mesic habitats used primarily in the summer-late fall season, such as riparian communities, springs, seeps, and mesic meadows (GSRSC 2005, pp. 30, H–7; Schroeder et al. 1999, p. 4; Connelly et al. 2000, p. 980). The planning area has 175,800 acres of occupied and unoccupied (characterized as either potential or vacant) designated critical habitat (table 98).
Table 98. Distribution of designated critical habitat for Gunnison sage-grouse in the GMUG National Forests
GMUG Ranger District Gunnison Sage-Grouse Population Population Status Acres Grand Valley Pinon Mesa Occupied 691

USDA Forest Service
180
GMUG Ranger District Gunnison Sage-Grouse Population Population Status Acres Grand Valley Pinon Mesa Unoccupied (potential) 46,276 Gunnison Gunnison Basin Occupied 94,914 Gunnison Gunnison Basin Unoccupied (potential) 13,585 Norwood San Miguel Basin Occupied 1,890 Norwood San Miguel Basin Unoccupied (vacant) 15,468 Paonia Crawford Unoccupied (potential) 2,976
Total 175,800
This analysis focuses on how forest plan alternatives and plan components address issues and interact with indicators. A comprehensive life history description of Gunnison sage-grouse by Young et al. (2020) is available online. For additional information about the Gunnison sage-grouse in the GMUG National Forests, please refer to pages 94–105 of the Terrestrial Species Overview Assessment (USDA Forest Service 2018) prepared for the forest plan revision.
Management Direction
In 2014 the U.S. Fish and Wildlife Service published final rules listing the Gunnison sage-grouse as threatened (USFWS 2014a) and designating critical habitat (USFWS 2014b). On October 23, 2020, the U.S. Fish and Wildlife Service published the Final Recovery Plan for Gunnison Sage-Grouse (USFWS 2020a). The recovery plan is derived from the U.S. Fish and Wildlife Service species status assessment, which is an in-depth, scientific review of the species’ biology and threats, an evaluation of its biological status, and an assessment of the resources and conditions needed to maintain populations over time (USFWS 2019). In cooperation with partners, the U.S. Fish and Wildlife Service prepared the Recovery Implementation Strategy for Gunnison Sage-Grouse (USFWS 2020b), which serves as an operational plan for stepping down the higher-level recovery actions into specific tasks, or activities (USFWS 2020a). Several interagency plans and agreements continue to help guide management and are referenced in the U.S. Fish and Wildlife Service Gunnison sage-grouse species status assessment, recovery plan, and recovery implementation strategy. The Gunnison sage-grouse Rangewide Conservation Plan (GSRSC 2005) provides comprehensive information, guidance, and recommendations for each population area. In the plan, the Gunnison Sage-Grouse Rangewide Steering Committee identified conservation objectives and strategies specific to Forest Service management. A 2012 interagency effort led by the Bureau of Land Management that consisted of Federal land management agencies (action agencies – Bureau of Land Management Gunnison Field Office, National Park Service – Curecanti National Recreation Area and Black Canyon of the Gunnison National Park, and GMUG National Forests) and the Gunnison Basin Sage-Grouse Strategic Committee completed a Candidate Conservation Agreement (CCA) to promote conservation of the Gunnison Basin population of Gunnison sage-grouse. In 2013 the Bureau of Land Management Gunnison Field Office, with contributions by the other action agencies, completed a programmatic biological assessment addressing the effects of the CCA (BLM, NPS, and USDA Forest Service 2013). The biological assessment was submitted to the U.S. Fish and Wildlife Service on April 12, 2013, requesting a conference

GMUG National Forests Land Management Plan Draft Environmental Impact Statement: Volume 1
181
opinion. On July 30, 2013, the U.S. Fish and Wildlife Service issued a conference opinion to the action agencies. Following the 2014 final listing rule, the U.S. Fish and Wildlife Service converted the conference opinion to a biological opinion in accordance with section 7 of the Endangered Species Act. The CCA is valid for 20 years (2013–2033). The GMUG National Forests applies the CCA conservation measures to applicable management actions in Gunnison sage-grouse habitat on the Gunnison Ranger District. In 2015, a programmatic biological assessment was completed through an interagency collaboration between the GMUG National Forests, Bureau of Land Management Gunnison Field Office, and National Park Service Curecanti National Recreation Area. This programmatic biological assessment addressed riparian and wet meadow habitat restoration (erosion control) and non-native plant species treatment activities in sage-grouse habitat. This project addresses these threats throughout the Gunnison Basin by controlling noxious and invasive weeds and restoring proper hydrologic function. The GMUG National Forests has worked with partners to implement wet meadow habitat restoration annually in the Gunnison Basin since 2012. In 2018, a wet meadow habitat restoration project began on GMUG National Forests lands in unoccupied designated critical habitat on the Uncompahgre Plateau (Pinon Mesa population). The current GMUG forest plan provides little direction on Gunnison sage-grouse conservation, other than acknowledging late-successional sagebrush importance, and references Forest Service Manual (FSM) 2631. A supplement to FSM 2631 in 2011 updated guidelines for management or restoration of sage-grouse and sagebrush habitats to incorporate new information. FSM 2631.1 provides guidelines for sagebrush management or restoration projects (FSM 2600, chapter 2630, supplement number 2600-2011-2, effective September 30, 2011). The GMUG National Forests implements actions in sage-grouse habitat consistent with FSM 2631.1 guidelines. These guidelines are consistent with guidelines and recommendations in the rangewide conservation plan and CCA.
Effects Common to All Alternatives
Revised management direction for Gunnison sage-grouse is the same for all action alternatives, which would contribute to ecological sustainability. Under all action alternatives, we convert the CCA conservation measures into standards, guidelines, and objectives, with modifications based on best available science as cited in the proposed forest plan. This approach expands the CCA conservation measures from National Forest System lands in the Gunnison Basin Gunnison sage-grouse population to National Forest System lands in the Crawford, San Miguel, and Pinon Mesa Gunnison sage-grouse populations. The only commonality between the no-action and action alternatives is that the Forest Service would continue to implement actions consistent with FSM 2631.1 guidelines across all alternatives, as required to meet law, regulation, and policy. Under all alternatives, the Forest Service will follow the Gunnison sage-grouse recovery plan (USFWS 2020a) and implement applicable actions in the recovery implementation strategy (USFWS 2020b).

USDA Forest Service
182
Effects of the No-Action Alternative
The current forest plan does not provide specific direction for Gunnison sage-grouse or its habitat. The GMUG National Forests implements actions to meet Endangered Species Act requirements and consistent with interagency plans and agreements (i.e., rangewide conservation plan and CCA); however, the no-action alternative would not provide the regulatory mechanism and certainty necessary for a listed species. The current forest plan does not indicate the GMUG National Forests commitment to Gunnison sage-grouse recovery. The 2012 Planning Rule requires national forest land management plans to provide the ecological conditions necessary to contribute to the recovery of federally listed threatened and endangered species, and to conserve proposed and candidate species (36 CFR 219.9(b). The no-action alternative does not meet this requirement.
Effects of the Proposed Action
The proposed action adds specific Gunnison sage-grouse plan components consistent with FSM 2631.1 guidelines, and converts the CCA conservation measures into standards, guidelines, and objectives to be applied Forestwide in Gunnison sage-grouse habitat. The proposed Gunnison sage-grouse plan components are designed to reduce the effects of threats to the species, maintain or restore habitat, and contribute to recovery. Gunnison sage-grouse forest plan components apply Forestwide, but the management areas overlapping designated critical habitat cause varying effects due to their influence on where and how certain management actions are emphasized, and as influenced by specific management area direction. The overlap of designated critical habitat for Gunnison sage-grouse with alternative B management areas is listed in table 99 and table 100.
Table 99. Overlap of designated critical habitat for Gunnison sage-grouse with alternative B management areas, summarized Forestwide
Critical Habitat Status Management Area Acres
Total Designated Critical Habitat
in Planning Area (percent)
Unoccupied 1.1 - Designated Wilderness 63 0.04
Unoccupied 1.2/3.1 - Area to be Analyzed as Wilderness/Colorado Roadless Area 829 0.5
Unoccupied 3.1 - Colorado Roadless Area 4,980 3 Unoccupied 3.2 - Wildlife Management Area 3,665 2
Unoccupied 3.2/3.1 - Wildlife Management Area / Colorado Roadless Area 171 0.1
Unoccupied 4.2 - High-Use Recreation Area 746 0.4
Unoccupied 4.2/3.1 - High-Use Recreation Area / Colorado Roadless Area 0 0.0003
Unoccupied 5 - General Forest 59,913 34 Unoccupied Non-National Forest System Land 7,938 5 Occupied 1.2 - Area to be Analyzed as Wilderness 5 0.003
Occupied 1.2/3.1 - Area to be Analyzed as Wilderness / Colorado Roadless Area 12 0.007

GMUG National Forests Land Management Plan Draft Environmental Impact Statement: Volume 1
183
Critical Habitat Status Management Area Acres
Total Designated Critical Habitat
in Planning Area (percent)
Occupied 2.3 - Fossil Ridge Special Recreation Area 2,009 1
Occupied 2.3/3.2 - Fossil Ridge Special Recreation Area/Wildlife Management Area 1,604 0.9
Occupied 3.1 - Colorado Roadless Area 1,491 0.8 Occupied 3.2 - Wildlife Management Area 46,404 26
Occupied 3.2/3.1 - Wildlife Management Area / Colorado Roadless Area 6,979 4
Occupied 4.2 - High-Use Recreation Area 778 0.4 Occupied 5 - General Forest 26,622 15 Occupied Non-National Forest System Land 11,584 7
Total 175,794 100
Table 100. Overlap of designated critical habitat for Gunnison sage-grouse with alternative B management areas, summarized by population [Information summarized by Gunnison sage-grouse population area]
Gunnison Sage-
Grouse Population
Status
Gunnison Sage-Grouse
Population Management Area Acres
Total Designated Critical Habitat in
Planning Area (percent)
Occupied Gunnison Basin 1.2 - Area to be Analyzed as Wilderness 5 0.003
Occupied Gunnison Basin 1.2/3.1 - Area to be Analyzed as Wilderness/ Colorado Roadless Area 12 0.007
Occupied Gunnison Basin 2.3 - Fossil Ridge Special Recreation Area 2,009 1
Occupied Gunnison Basin 2.3/3.2 - Fossil Ridge Special Recreation Area/Wildlife Management Area
1,604 0.9
Occupied Gunnison Basin 3.1 - Colorado Roadless Area 1,491 0.8 Occupied Gunnison Basin 3.2 - Wildlife Management Area 46,253 26
Occupied Gunnison Basin 3.2/3.1 - Wildlife Management Area / Colorado Roadless Area 6,979 4
Occupied Gunnison Basin 4.2 - High-Use Recreation Area 726 0.4 Occupied Gunnison Basin 5 - General Forest 24,714 14 Occupied Gunnison Basin Non-National Forest System Land 11,115 6 Occupied Pinon Mesa 5 - General Forest 691 0.4 Occupied San Miguel Basin 3.2 - Wildlife Management Area 151 0.09 Occupied San Miguel Basin 4.2 - High-Use Recreation Area 52 0.03 Occupied San Miguel Basin 5 - General Forest 1,217 0.7 Occupied San Miguel Basin Non-National Forest System Land 470 0.3 Potential Crawford 3.1 - Colorado Roadless Area 17 0.01

USDA Forest Service
184
Gunnison Sage-
Grouse Population
Status
Gunnison Sage-Grouse
Population Management Area Acres
Total Designated Critical Habitat in
Planning Area (percent)
Potential Crawford 5 - General Forest 2,174 1 Potential Crawford Non-National Forest System Land 785 0.4 Potential Gunnison Basin 1.1 - Designated Wilderness 63 0.04
Potential Gunnison Basin 1.2/3.1 - Area to be Analyzed as Wilderness/ Colorado Roadless Area 829 0.5
Potential Gunnison Basin 3.1 - Colorado Roadless Area 540 0.3 Potential Gunnison Basin 3.2 - Wildlife Management Area 3,585 2
Potential Gunnison Basin 3.2/3.1 - Wildlife Management Area / Colorado Roadless Area 158 0.09
Potential Gunnison Basin 4.2 - High-Use Recreation Area 731 0.4
Potential Gunnison Basin 4.2/3.1 - High-Use Recreation Area / Colorado Roadless Area 0 0.0003
Potential Gunnison Basin 5 - General Forest 6,595 4 Potential Gunnison Basin Non-National Forest System Land 1,085 0.6 Potential Pinon Mesa 3.1 - Colorado Roadless Area 4,423 3
Potential Pinon Mesa 3.2/3.1 - Wildlife Management Area/ Colorado Roadless Area 13 0.007
Potential Pinon Mesa 4.2 - High-Use Recreation Area 16 0.009 Potential Pinon Mesa 5 - General Forest 38,232 22 Potential Pinon Mesa Non-National Forest System Land 3,593 2 Vacant San Miguel Basin 3.2 - Wildlife Management Area 80 0.05 Vacant San Miguel Basin 5 - General Forest 12,913 7 Vacant San Miguel Basin Non-National Forest System Land 2,475 1
Total 175,794 100
Forestwide, alternative B would manage 10 percent (18,145 acres) of designated critical habitat in areas to be analyzed as wilderness, Colorado roadless areas, designated wilderness, and the Fossil Ridge Special Recreation Area. These management areas preclude active vegetation management and most development (e.g., new routes), except those not expressly prohibited by the Wilderness Act of 1964, the Colorado Roadless Rule, or Fossil Ridge Recreation Management Area 16 U.S. Code 539i. Similarly, Colorado roadless areas provide a high level of conservation to maintain roadless area characteristics, prohibiting tree cutting and road construction (77 FR 39576). In wilderness and areas to be managed as wilderness, activities authorized by special use permit are allowed if they do not degrade wilderness character. We anticipate that activities that do not degrade wilderness character will not affect or will have only negligible effects to Gunnison sage-grouse or designated critical habitat. Standards MA-STND-WLDN-08, STND-WLDN-09, and STND-WLDN-10 would have ancillary benefits to Gunnison sage-grouse by requiring dogs to be leashed and/or under verbal control, limiting group sizes, and prohibiting drones. These activities, not otherwise managed, could disturb, stress, and displace sage-grouse, or in extreme cases cause sage-grouse mortality.

GMUG National Forests Land Management Plan Draft Environmental Impact Statement: Volume 1
185
Wildlife management areas overlap 33 percent (58,012 acres) of designated critical habitat. Proposed forest plan direction for wildlife management areas is conducive to Gunnison sage-grouse recovery. Under this alternative, the proposed Flat Top Mountain Wildlife Management Area overlaps the largest area of contiguous Gunnison sage-grouse habitat in the GMUG National Forests. The Flat Top Mountain Wildlife Management Area includes the only known area of National Forest System lands with Gunnison sage-grouse breeding sites. Standard MA-STND-WLDF-02 maintains habitat function and wildlife security by prohibiting a net gain in system routes, both motorized and non-motorized, where the system route density already exceeds 1 mile per square mile. Within the Flat Top Mountain Wildlife Management Area on the Gunnison Ranger District, no new routes would be allowed. This would maintain route density at less than 1 mile per square mile in the Flat Top Mountain area, which would maintain large blocks of diverse habitat undisturbed by routes consistent with MA-DC-WLDF-01. Roads and trails introduce human uses, cause fragmentation, and serve as vectors for non-native plant invasion. By preventing new route development and maintaining the current low route density, new impacts above current baseline levels are avoided. Additionally, FW-OBJ-SPEC-03 would contribute to restoring or enhancing designated critical habitat using a variety of actions, including eliminating redundant routes, converting mode of travel, or realigning routes into less impactful settings. High-use recreation areas (referred to as Recreation Emphasis Corridors – MA 4.2 in the proposed forest plan) overlap less than 1 percent (1,525 acres) of designated critical habitat. Where this overlap occurs, high-use recreation areas represent busy travelways that currently experience frequent, season-long dispersed recreational uses (e.g., 300-foot radius buffer of U.S. Highway 135 and County Road 742), National Forest System roads with concentrated recreation uses (e.g., Soap Creek corridor), or concentrated recreation activities near developed campgrounds or trail systems. These activities and associated effects exist currently. Continuing to concentrate recreation uses by emphasizing recreation in existing busy corridors may prevent recreation expansion into pristine or relatively undisturbed Gunnison sage-grouse critical habitat areas. Guideline MA-GDL-EMREC-04 may have ancillary benefits to Gunnison sage-grouse by curtailing natural resource impacts with recreation management controls. The General Forest Management Area overlaps 49 percent (86,534 acres) of designated critical habitat. This overlap occurs along the designated critical habitat periphery, mostly in unoccupied habitat (62,468 acres). Where the General Forest Management Area intersects designated critical habitat, forested habitats or sagebrush-forested interfaces are common. These areas include about 46,820 acres of the suitable timber base, discussed below in the Vegetation Management section. Forestwide plan direction applies to the General Forest Management Area, as well as all other management areas. Gunnison sage-grouse-specific Forestwide direction (2 desired conditions, 4 objectives, 1 standard, and 10 guidelines) puts restrictions or sideboards on management activities to promote Gunnison sage-grouse conservation and recovery. Gunnison sage-grouse plan components promote habitat conditions to support population expansion (SPEC-36 and -37), prioritize reducing route density within 2 miles of leks (SPEC-38), address fence impacts (SPEC-40), require habitat reclamation from surface-disturbing activities (SPEC 42), prevent disturbances within 1 mile of leks (SPEC-43), prevent permanent habitat loss by avoiding new infrastructure development in occupied habitat and minimize loss of habitat connectivity (SPEC-44 and -45), address non-native plant impacts through integrated weed prevention practices and

USDA Forest Service
186
standards for invasive species (SPEC-47, IVSP-03 and -04), and avoid disturbances during critical biological periods (SPEC-41, -48, -49, -50, -51, and -52).
Vegetation Management
Designated critical habitat occurs on the Gunnison, Grand Valley, Norwood, and Paonia Ranger Districts. Approximately 46,820 critical habitat acres intersect with the alternative B suitable timber base (table 101).
Table 101. Acreage of suitable timber base in Gunnison sage-grouse designated critical habitat
Gunnison Grand Valley Norwood Paonia Total 26,030 10,806 7,083 2,900 46,820
Where these intersect, the habitat is forested and does not likely provide the primary constituent elements described in the designated critical habitat rule (USFWS 2014b). There is potential for vegetation management in the suitable timber base to have ancillary effects to adjacent occupied habitat. Roads used to access suitable timber base areas may disturb Gunnison sage-grouse where those roads bisect occupied habitat. The rangewide conservation plan (GSGSC 2005) recommends avoiding surface-disturbing activities within 0.6 mile of lek sites. To be conservative, we applied a 1-mile buffer around leks and intersected the buffer with the suitable timber base. Under alternative B, 620 acres of the suitable timber base occurs within this buffer, but none within 0.6 mile of leks. Of the 46,820 acres of designated critical habitat in the suitable timber base, approximately 22,682 acres are considered occupied. Approximately 17,791 acres are potential habitat and 6,347 acres are vacant. Most occupied habitat within the suitable timber base is on the Gunnison Ranger District (21,802 acres). The Norwood Ranger District has 736 occupied habitat acres and the Grand Valley Ranger District has 144 acres. Impacts from timber management activities are most likely associated with driving through occupied habitat to get to suitable timber. Guideline FW-GDL-SPEC-48 would minimize disturbance during the breeding season in occupied habitat, placing seasonal timing restrictions on construction, maintenance, and access from March 1 to May 15. Where suitable timber and vegetation management outside the suitable timber base overlaps critical habitat, vegetation management activities could be used as a tool to improve Gunnison sage-grouse habitat by reducing forest cover. This could provide opportunities to increase habitat connectivity if we can integrate Gunnison sage-grouse habitat objectives into vegetation management projects. Prescribed fire treatments are used to meet vegetation-related resource objectives, including wildlife habitat improvement, stimulating shrub sprouting, creating habitat structural diversity, creating early-successional habitat openings, creating sagebrush-meadow edges, increasing herbaceous production, and simulating natural disturbance processes. Fire also maintains vegetation diversity, reduces conifer encroachment, regenerates aspen stands (we observe sage-grouse hens and chicks using sagebrush-aspen interfaces during summer), and

GMUG National Forests Land Management Plan Draft Environmental Impact Statement: Volume 1
187
contributes to vegetation diversity important to sage-grouse, elk, deer, pronghorn, and many non-game species. Invasive annual grasses may pose the greatest threat to sagebrush ecosystem function (figure 15). Increased recreation may contribute to this threat by introducing vectors that transmit and spread invasive plants. Invasive annual grasses (e.g., cheatgrass), a pivotal indicator of habitat degradation, must always be factored into planning and implementing vegetation management in or adjacent to sage-grouse habitat. Proposed forest plan direction for invasive species and associated management approaches would reduce weed risk through preventative actions, prioritize weed treatments, and integrate weed management into vegetation management projects (IVSP-01 – IVSP-09, and SPEC-47). FW-OBJ-IVSP-02 prioritizes cheatgrass treatments in sagebrush habitat, particularly Gunnison sage-grouse designated critical habitat. Tackling invasive annuals is a long-term commitment requiring a strategic and proactive approach. The current condition of designated critical habitat in the GMUG National Forests, primarily where the majority of habitat occurs in the Gunnison Basin, consists largely of intact areas (zero to low levels of infestation). However, over at least the last two decades, a transition has developed in some areas with mild or more moderate infestation levels. Transition areas would likely become annual-grass-dominated areas without proactive management. Proposed plan direction should contribute to maintaining intact and functional native sagebrush plant communities as dominant in designated critical habitat in the plan area.
Illustration from NRCS (2021). Proposed forest plan desired conditions, objectives, standards, and guidelines strive to
maintain Gunnison sage-grouse habitat using effective proactive and preventative care to avoid a degraded state.
Figure 15. Intervention expense and relative success in sagebrush rangelands along a continuum from degraded state to intact core
Effects from Grazing
Livestock grazing management and effects will be the same across all action alternatives, and therefore are addressed for the proposed action and alternatives C and D in this section. The Gunnison Basin, Crawford, San Miguel Basin, and Pinon Mesa critical habitat units overlap portions of the GMUG National Forests. Rangewide, the U.S. Fish and Wildlife
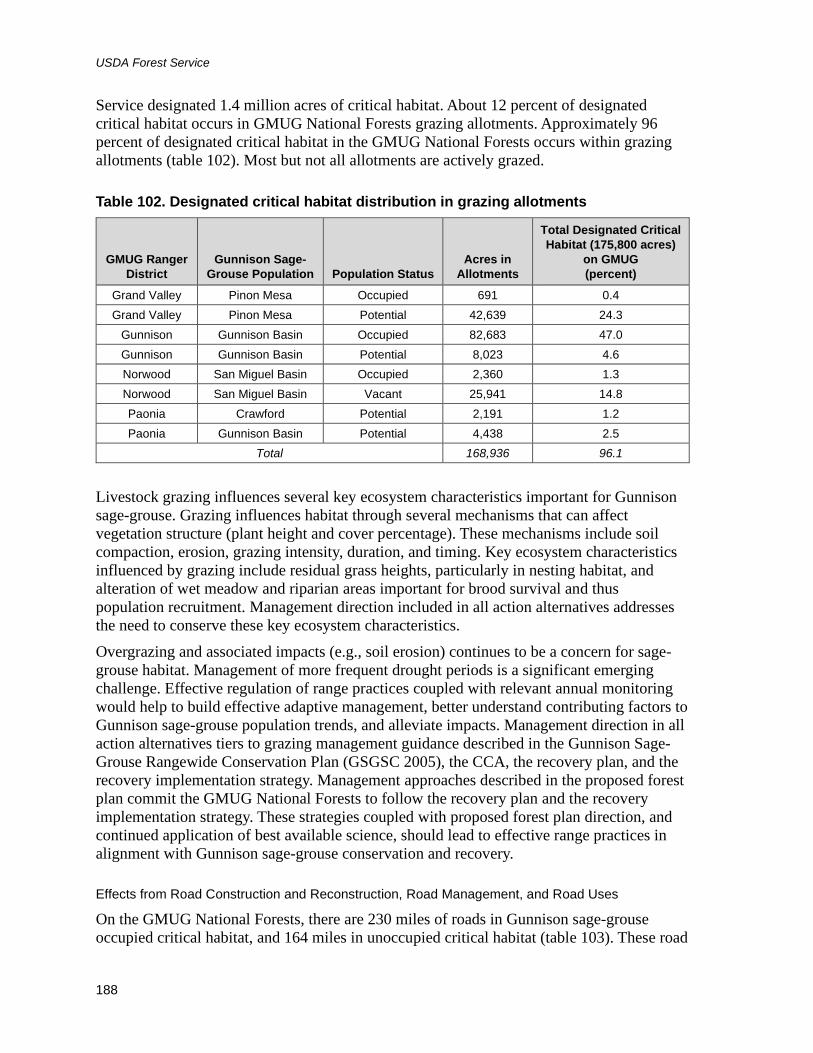
USDA Forest Service
188
Service designated 1.4 million acres of critical habitat. About 12 percent of designated critical habitat occurs in GMUG National Forests grazing allotments. Approximately 96 percent of designated critical habitat in the GMUG National Forests occurs within grazing allotments (table 102). Most but not all allotments are actively grazed.
Table 102. Designated critical habitat distribution in grazing allotments
GMUG Ranger District
Gunnison Sage-Grouse Population Population Status
Acres in Allotments
Total Designated Critical Habitat (175,800 acres)
on GMUG (percent)
Grand Valley Pinon Mesa Occupied 691 0.4 Grand Valley Pinon Mesa Potential 42,639 24.3
Gunnison Gunnison Basin Occupied 82,683 47.0 Gunnison Gunnison Basin Potential 8,023 4.6 Norwood San Miguel Basin Occupied 2,360 1.3 Norwood San Miguel Basin Vacant 25,941 14.8 Paonia Crawford Potential 2,191 1.2 Paonia Gunnison Basin Potential 4,438 2.5
Total 168,936 96.1
Livestock grazing influences several key ecosystem characteristics important for Gunnison sage-grouse. Grazing influences habitat through several mechanisms that can affect vegetation structure (plant height and cover percentage). These mechanisms include soil compaction, erosion, grazing intensity, duration, and timing. Key ecosystem characteristics influenced by grazing include residual grass heights, particularly in nesting habitat, and alteration of wet meadow and riparian areas important for brood survival and thus population recruitment. Management direction included in all action alternatives addresses the need to conserve these key ecosystem characteristics. Overgrazing and associated impacts (e.g., soil erosion) continues to be a concern for sage-grouse habitat. Management of more frequent drought periods is a significant emerging challenge. Effective regulation of range practices coupled with relevant annual monitoring would help to build effective adaptive management, better understand contributing factors to Gunnison sage-grouse population trends, and alleviate impacts. Management direction in all action alternatives tiers to grazing management guidance described in the Gunnison Sage-Grouse Rangewide Conservation Plan (GSGSC 2005), the CCA, the recovery plan, and the recovery implementation strategy. Management approaches described in the proposed forest plan commit the GMUG National Forests to follow the recovery plan and the recovery implementation strategy. These strategies coupled with proposed forest plan direction, and continued application of best available science, should lead to effective range practices in alignment with Gunnison sage-grouse conservation and recovery.
Effects from Road Construction and Reconstruction, Road Management, and Road Uses
On the GMUG National Forests, there are 230 miles of roads in Gunnison sage-grouse occupied critical habitat, and 164 miles in unoccupied critical habitat (table 103). These road

GMUG National Forests Land Management Plan Draft Environmental Impact Statement: Volume 1
189
miles include the motorized trails discussed in Effects from Trail Management and Recreation. We do not anticipate increased permanent road development in critical habitat, but if new road development were to occur, for example to provide private property owners access to their property, it would likely be a negligible amount. Proposed Forestwide direction would limit development in critical habitat and could potentially reduce route density within 2 miles of lek sites (FW-OBJ-SPEC-38, FW-STND-SPEC-42, FW-GDL-SPEC-43, FW-GDL-SPEC-44, FW-GDL-SPEC-45). Forestwide management direction provides guidance for seasonal closures to protect Gunnison sage-grouse during specified periods. This would allow roads or areas in sage-grouse habitat to be closed during mating (lek) season, breeding season (which includes nesting and early brood-rearing periods), and in severe winters. Outside of seasonal closure periods, use of existing, designated routes will not reduce sage-grouse habitat but indirectly could affect habitat quality and resiliency due to the risk roads pose as vectors for invasive plants. Use of existing roads may incidentally disturb birds. There is a risk of some adverse effects resulting from disturbance by motor vehicle users and other recreationists; however, this risk is not anticipated to increase substantially in the GMUG National Forests in critical habitat due to existing seasonal closures that would continue under the revised forest plan direction. This Forestwide management direction does not vary between action alternatives.
Table 103. Designated road miles and density in critical habitat designated for Gunnison sage-grouse, GMUG National Forests
Gunnison Sage-Grouse Population County
Gunnison Sage-Grouse Population Status
Road Length (miles)
Road Density (miles per square
mile)
Crawford1 Gunnison Unoccupied5 4 1.5 Montrose Unoccupied6 1.3 0.7
Crawford Total 5.3 1.1
Gunnison Basin2
Gunnison Occupied7 139.8 1.4
Unoccupied8 32.7 1.9 Montrose Unoccupied9 6.1 2.4
Saguache Occupied10 86.2 1.9
Unoccupied11 3.3 2.5 Gunnison Basin Total 268.1 1.6
Pinon Mesa3 Mesa Unoccupied12 78.1 1.1
San Miguel Basin4
Montrose Unoccupied13 28.3 1.7
San Miguel Occupied14 3.7 1.3
Unoccupied15 10.2 1.3 San Miguel Basin Total 42.2 1.6
Overall Total 394 1.4 1 Crawford population, GMUG total designated critical habitat: 2,967 acres (4.6 square miles). 2 Gunnison Basin population, GMUG total designated critical habitat: 108,500 acres (170 square miles). 3 Pinon Mesa population, GMUG total designated critical habitat: 46,967 acres (73 square miles). 4 San Miguel Basin population, GMUG total designated critical habitat: 17,358 acres (27 square miles). 5 Unoccupied habitat in the GMUG in Gunnison County, in the Crawford population: 1,746 acres (2.7 square miles).

USDA Forest Service
190
6 Unoccupied habitat in the GMUG in Montrose County, in the Crawford population: 1,230 acres (1.9 square miles). 7 Occupied habitat in the GMUG in Gunnison County, Gunnison Basin population: 65,308 acres (102 square miles). 8 Unoccupied habitat in the GMUG in Gunnison County, Gunnison Basin population: 11,123 acres (17.4 square miles). 9 Unoccupied habitat in the GMUG in Montrose County, Gunnison Basin population: 1,610 acres (2.5 square miles). 10 Occupied habitat in the GMUG in Saguache County, Gunnison Basin population: 29,606 acres (46.3 square miles). 11 Unoccupied habitat in the GMUG in Saguache County, Gunnison Basin population: 852 acres (1.3 square miles). 12 Unoccupied habitat in the GMUG in Mesa County, Pinon Mesa population: 46,276 acres (72.3 square miles). 13 Unoccupied habitat in the GMUG in Montrose County, San Miguel Basin population: 10,550 acres (16.5 square miles). 14 Occupied habitat in the GMUG in San Miguel County, San Miguel Basin population: 1,890 acres (3 square miles). 15 Unoccupied habitat in the GMUG in San Miguel County, San Miguel Basin population: 4,919 acres (7.7 square miles).
The proposed Flat Top Mountain Wildlife Management Area has the only documented sage-grouse breeding sites in the GMUG National Forests (12 lek sites). Under alternative B (and alternative D), proposed management direction for that area (approximately 23,848 acres) prohibits new road development, protecting the GMUG National Forests’ most important Gunnison sage-grouse breeding habitat. This direction would maintain habitat connectivity, prevent habitat loss associated with new roads, and prevent indirect effects such as invasive plant species invasion.
Effects from Trail Management and Recreation
As discussed above for roads, management direction will guide recreational closures in areas used by Gunnison sage-grouse. Forestwide across all action alternatives, FW-GDL-SPEC-52 avoids disturbance to sage-grouse during the winter and breeding periods from December 1 to May 15 by not authorizing recreation events, outfitting, and guiding permits within occupied habitat during this time. On the GMUG National Forests, there are 31 miles of trails in Gunnison sage-grouse occupied critical habitat, and 26.5 miles of trails in unoccupied critical habitat. This includes routes designated as motorized and non-motorized trails. Motorized trails are duplicated in the road analysis above. We do not anticipate increased trail development in critical habitat. We do anticipate increased use of routes in critical habitat as Colorado’s human population increases and based on observed increased recreation use on public lands. Designated trail miles and density in critical habitat designated for Gunnison sage-grouse is provided in table 104.
Table 104. Designated trail miles and density in critical habitat designated for Gunnison sage-grouse, GMUG National Forests
Gunnison Sage-Grouse Population County
Gunnison Sage-
Grouse Population
Status Designated Trail Uses Trail Length
(miles)
Trail Density (miles per
square mile)
Gunnison Basin1 Gunnison Occupied4
Four-Wheel Drive Vehicle >50" 7.8
0.2 All-Terrain Vehicle 1.4
Bicycle 4.0 Motorcycle 0.7
Pack and Saddle 7.8

GMUG National Forests Land Management Plan Draft Environmental Impact Statement: Volume 1
191
Gunnison Sage-Grouse Population County
Gunnison Sage-
Grouse Population
Status Designated Trail Uses Trail Length
(miles)
Trail Density (miles per
square mile)
Unoccupied5 All-Terrain Vehicle 0.7
0.1 Pack and Saddle 1.2
Saguache Occupied6
All-Terrain Vehicle 3.5 0.2 Motorcycle 0.4
Pack and Saddle 4.7 Gunnison Basin Total 32.1 0.2
Pinon Mesa2 Mesa
Occupied7 All-Terrain Vehicle 0.8 0.7
Unoccupied8
Four-Wheel Drive Vehicle >50" 2.4
0.3
All-Terrain Vehicle 7.2 Bicycle 7.1
Hiker/Pedestrian 2.1 Motorcycle 3.1
Pack and Saddle 2.8 Pinon Mesa Total 25.4 0.3
San Miguel Basin3 Montrose Unoccupied Pack and Saddle 0.09 0.003
1 Gunnison Basin population, GMUG total designated critical habitat: 108,500 acres (170 square miles). 2 Pinon Mesa population, GMUG total designated critical habitat: 46,967 acres (73 square miles). 3 San Miguel Basin population, GMUG total designated critical habitat: 17,358 acres (27 square miles). 4 Occupied habitat in the GMUG in Gunnison County: 65,308 acres (102 square miles). 5 Unoccupied habitat in the GMUG in Gunnison County: 12,869 acres (20 square miles). 6 Occupied habitat in the GMUG in Saguache County: 30,458 acres (46.6 square miles). 7 Occupied habitat in the GMUG in Mesa County: 691 acres (1.08 square miles). 8 Unoccupied habitat in the GMUG in Mesa County: 46,276 acres (72.3 square miles).
The proposed Flat Top Mountain Wildlife Management Area has the only documented sage-grouse breeding sites in the GMUG National Forests (12 lek sites). Under alternative B (and alternative D), proposed management direction for that area (approximately 23,848 acres) prohibits any new trail development, protecting the GMUG National Forests’ most important Gunnison sage-grouse breeding habitat. This direction would maintain habitat connectivity, prevent habitat loss associated with new trails, and prevent indirect effects such as invasive plant species invasion.
Comparison of Effects of the Alternatives
As discussed in the Effects of the Proposed Action section, proposed Forestwide plan components do not vary across the action alternatives. However, since some of the management area allocations do vary across alternatives, and because we propose specific management area direction, we disclose those potential effects and trade-offs. Critical

USDA Forest Service
192
habitat designated for Gunnison sage-grouse in management areas for all action alternatives is provided in table 105.
Table 105. Overlap of critical habitat designated for Gunnison sage-grouse and management areas for all action alternatives
Critical Habitat Status Management Area
Alternative B Acres
(percent1)
Alternative C Acres
(percent1)
Alternative D Acres
(percent1) Unoccupied 1.1 - Designated Wilderness 63 (0.04) 63 (0.04) 63 (0.04)
Unoccupied 1.2/3.1 - Area to be Analyzed as Wilderness / Colorado Roadless Area 829 (0.5) 0 (0) 4,024 (2.3)
Unoccupied 3.1 - Colorado Roadless Area 4,980 (3) 5,981 (3.4) 553 (0.3) Unoccupied 3.2 - Wildlife Management Area 3,665 (2) 0 (0) 9,784 (5.6)
Unoccupied 3.2/3.1 - Wildlife Management Area / Colorado Roadless Area 171 (0.1) 0 (0) 1,404 (0.8)
Unoccupied 4.2 - High-Use Recreation Area 746 (0.4) 746 (0.4) 746 (0.4)
Unoccupied 4.2/3.1 - High-Use Recreation Area / Colorado Roadless Area 0 (0) 0 (0) 0 (0)
Unoccupied 5 - General Forest 59,913 (34) 63,578 (36) 53,794 (30.6)
Unoccupied Non-National Forest System Land 7,938 (4.5) 7,938 (4.5) 7,938 (4.5) Occupied 1.2 - Area to be Analyzed as Wilderness 5 (0.003) 0 (0) 340 (0.2)
Occupied 1.2/3.1 - Area to be Analyzed as Wilderness / Colorado Roadless Area 12 (0.007) 0 (0) 218 (0.12)
Occupied 2.3 - Fossil Ridge Special Recreation Area 2,009 (1) 3,613 (2) 2,009 (1)
Occupied 2.3/3.2 - Fossil Ridge Special Recreation Area/Wildlife Management Area 1,604 (0.9) 0 (0) 1,604 (0.9)
Occupied 3.1 - Colorado Roadless Area 1,491 (0.8) 3,070 (1.7) 1,423 (0.8) Occupied 3.2 - Wildlife Management Area 46,404 (26) 16,731 (9.5) 17,414 (9.9)
Occupied 3.2/3.1 - Wildlife Management Area / Colorado Roadless Area 6,979 (4) 5,413 (3.1) 1,281 (0.7)
Occupied 3.3 – Special Management Area 0 (0) 0 (0) 30,065 (17)
Occupied 3.3/3.1 – Special Management Area / Colorado Roadless Area 0 (0) 0 (0) 5,561 (3)
Occupied 4.2 - High-Use Recreation Area 778 (0.4) 778 (0.4) 557 (0.3)
Occupied 5 - General Forest 26,622 (15) 56,299 (32) 25,432 (14.5)
Occupied Non-National Forest System Land 11,584 (6.6) 11,584 (6.6) 11,584 (6.6) Total 175,794 175,794 175,794
1 Percent of total designated critical habitat in the GMUG National Forests.
Alternatives B and D provide the most conservation benefit to Gunnison sage-grouse due to overlap of wildlife management areas and special use areas with critical habitat under those alternatives. Alternative C could potentially result in increased road construction, reconstruction, and use, but the same Forestwide direction supporting seasonal closures is the same across all action alternatives. Guideline FW-GDL-SPEC-48 places seasonal timing

GMUG National Forests Land Management Plan Draft Environmental Impact Statement: Volume 1
193
restrictions on construction, maintenance, and access, and closes roads to motorized and mechanized travel, from March 1 through May 15. For the Flat Top Wildlife Management Area, FW-GDL-SPEC-50 closes that area from December 1 to June 15 to all forms of public use. Guideline FW-GDL-SPEC-51 identifies criteria to determine if winter conditions warrant an area closure, which could occur anytime from December 1 to March 31. Collectively, these proposed plan components should contribute to avoiding or minimizing disturbances associated with roads. Effects from trail and recreation management are more likely to occur in alternative A. Alternatives B and C provide similar protections spatially because both have the same wildlife management area designation for the Flat Top Mountain area. Alternative D provides similar protections per the special management area designation but could potentially allow for new trail development. Alternatives B and D propose additional wilderness acreage in Gunnison sage-grouse habitat in some of the proposed West Elk Wilderness additions. This would protect designated critical habitat in those areas from development and ensure natural processes are driving ecosystem conditions. Special management areas in alternative D would have similar impacts on development across more critical habitat acres. This would be beneficial to the species especially in places like Flat Top Mountain on the Gunnison Ranger District. As such, alternatives B and D would likely have a positive impact on the species. Alternative B would designate a much greater amount of critical habitat in wildlife management areas compared to D, but the special management area designation under D would provide similar benefits over a similar amount of area. However, the difference between the special management areas in alternative D and the wildlife management areas in alternative B is that the special management area under alternative D in the Flat Top Mountain area would allow limited trail development. The wildlife management area for Flat Top Mountain in alternative B would not allow for any new trail development. This is the biggest trade-off between the two. Alternative C would make more habitat available for active management in General Forest Management Areas.
Cumulative Effects
The most substantial current and future threats are habitat loss and decline due to human development and associated infrastructure (USFWS 2014). Private land development is most concerning in the Gunnison Basin Gunnison sage-grouse population. Private land development adjacent to designated critical habitat on National Forest System lands in the Gunnison Basin is not likely to become a substantial threat to Gunnison sage-grouse on the adjacent Forest Service lands due to conservation easements protecting those properties from development. Additionally, most private properties in designated critical habitat bordering Forest Service lands were enrolled in the Candidate Conservation Agreement with Assurances (CCAA) program prior to Gunnison sage-grouse being listed as federally threatened. These properties continue to participate in the CCAA post-listing. Private properties enrolled in the CCAA were not designated as critical habitat because their enrollment in the CCAA was determined to provide adequate protections. The CCAA is an agreement between the U.S. Fish and Wildlife Service and any non-Federal property owner who voluntarily agrees to manage their property in a way that removes threats to at-risk species.
USDA Forest Service
194
Local influencing factors on or around the planning area include potential impacts to habitat caused by roads and trails, livestock grazing, transmission lines, fences, pinyon-juniper encroachment, invasive plants, wildfire, predation (primarily associated with human disturbance and habitat decline), and recreation. The fragmented nature of existing habitat amplifies the negative effects of these other threats (USFWS 2014a). Based on observed trends in increased human population growth in Colorado and increased recreation activities on public lands, increased cumulative physical disturbances associated with recreation in the plan area are reasonably foreseeable. In addition to the potential for increased physical disturbances, increased indirect effects are likely, including increased development on unprotected properties and an increased risk of invasive plant species due to human activity serving as a vector for weed transmission. However, future recreation management and development would be consistent with Endangered Species Act requirements and for those with a Federal nexus, would undergo section 7 consultation procedures. On the GMUG National Forests, the wildlife management areas proposed in alternatives B and D would prevent or restrict cumulative increases in recreation trails in 33 and 17 percent of designated critical habitat, respectively. Other recreation impacts may continue to increase, such as total volume, changes in recreation modes of travel over time, and changes in technology contributing to greater public awareness of recreation opportunities and experiences. Alternatives B and D also add protections from development and motorized or mechanized recreation to smaller percentages for areas to be analyzed as wilderness, with alternative D providing the most protections. Increased recreation pressure would be greatest in alternative C. The cumulative effects on Gunnison sage-grouse are expected to be minor and not significant due to restrictions and protections required by the Endangered Species Act.
Conclusion
Consistent with 36 CFR 219.9(a)(2), the effects of plan direction would maintain or restore the diversity of ecosystems and habitat types in the plan area because proposed plan direction would maintain or restore key ecosystem characteristics that Gunnison sage-grouse depend on, contribute to Gunnison sage-grouse habitat persistence, provide for connectivity, and focus conservation based on the best available science consistent with the Gunnison sage-grouse species status assessment (USFWS 2019), recovery plan (USFWS 2020a), and recovery implementation strategy (USFWS 2020b). Alternative D provides the most conservation benefit, followed by alternatives B and C.
Uncompahgre Fritillary Butterfly The Uncompahgre fritillary butterfly (Boloria acrocnema) was discovered on July 30, 1978, and described as a new species in 1980 (Gall and Sperling 1980). It was listed as endangered on June 24, 1991 (56 FR 28712). According to the recovery plan (USFWS 1994), this species has the smallest total range of any North American butterfly species. Currently, there are 11 known colonies, distributed in the San Juan mountains in the GMUG and Rio Grande National Forests and Bureau of Land Management lands (Gunnison Field Office). Potential habitat, but no known colonies, occur on the San Juan National Forest.
GMUG National Forests Land Management Plan Draft Environmental Impact Statement: Volume 1
195
There are four known Uncompahgre fritillary butterfly colonies in the GMUG National Forests. All are in designated wilderness areas (Uncompahgre and La Garita Wilderness areas). This species depends on snow willow habitat in the alpine ecosystem. Snow willow is the host plant for Uncompahgre fritillary butterfly larvae. This species uses snow willow habitat patches on north- and east-facing slopes, which provide a moist, cool microclimate (USFWS 1994). The north- and east-facing slopes above treeline typically have more persistent snow fields into early summer, providing moisture important for snow willow persistence. The main threat to this species appears to be climate change. If changing climatic conditions lead to less snow accumulation, less time that snow persists on the ground, and generally drier conditions, this species could be at risk of habitat loss, leading to reduced population persistence. Other factors could exacerbate climate change effects, such as trail impacts and associated recreation effects that impact snow willow habitat. Butterfly collection, while not thought to be a current threat, could have a direct impact on population persistence if it were to occur.
Effects of all Action Alternatives
All action alternatives include the same Forestwide direction for the Uncompahgre fritillary butterfly. The proposed forest plan has one standard prohibiting Uncompahgre fritillary butterfly collection except for scientific or conservation purposes. Collection for scientific or conservation purposes can only be authorized through a permitting process with the U.S. Fish and Wildlife Service. Generally, there will be very little, if any, adverse impact to the Uncompahgre fritillary butterfly from any action alternative. Increased visitor use and dispersed recreational pursuits likely are the primary concern. However, most of the Uncompahgre fritillary butterfly populations in the GMUG occur in remote areas that are not known to attract considerable human foot traffic at this time; therefore, visitor use and dispersed recreational pursuits should have minimal influences on Uncompahgre fritillary butterfly populations or habitat. Under all action alternatives, all known Uncompahgre fritillary butterfly populations in the GMUG National Forests are in existing wilderness areas. Currently, only the Uncompahgre Peak population receives high visitation from hikers and people seeking to summit Uncompahgre Peak. Interpretive signing at the trailhead and along the trail informs and educates the public about this endangered species and encourages the public to stay on designated trails. We have not observed compliance issues to date. Protective measures prescribed in revised management direction would help manage potential negative impacts. Standard FW-STND-SPEC-26 would prohibit Uncompahgre Fritillary butterfly collection. Guideline FW-GDL-SPEC-27 guides management actions to avoid occupied Uncompahgre fritillary butterfly snow willow habitat, and to manage livestock trailing through occupied habitat in accordance with an on-file biological assessment and concurrence with the U.S. Fish and Wildlife Service. Overall, the species will likely benefit from these protective measures. However, continued monitoring associated with the Uncompahgre Fritillary Butterfly Recovery Team Partnership is essential to documenting population and habitat trends and potential conservation concerns. Continued annual monitored per our Challenge Cost Share Agreement between Western Colorado University and the GMUG, Rio Grande, and San

USDA Forest Service
196
Juan National Forests would inform the Forest Service on effectiveness of the plan components, and allow for opportunities to adjust management based on best available science.
Vegetation Management
Uncompahgre fritillary butterfly habitat (snow willow) has no overlap with suitable timber harvesting areas; therefore, impacts to the Uncompahgre fritillary butterfly from the timber program would be negligible to nonexistent, with no adverse effect. Timber harvesting levels vary among alternatives, but it is likely that the impacts to the Uncompahgre fritillary butterfly from this program would not vary, due to the lack of spatial overlap between harvest-sized timber and Uncompahgre fritillary butterfly habitat.
Fire Management
There would be no measurable influence on the Uncompahgre fritillary butterfly due to fuels reduction associated with prescribed and use fires and fuels management. Fuels reduction activities are unlikely in the high subalpine spruce-fir forests that border the alpine tundra ecosystem. While wildland fire use may be an activity in the subalpine forests, the chances that such fires can extend into the more fire-resistant alpine areas that make up Uncompahgre fritillary butterfly habitat is highly unlikely. Fire control or suppression activities would be highly unlikely to occur in the alpine tundra ecosystem, let alone the north to northeast glacial cirque basins that support known populations of Uncompahgre fritillary butterfly and receive afternoon thunderstorm showers nearly every day during the summer season, particularly after monsoon season begins in early July. The unlikelihood of fire in Uncompahgre fritillary butterfly habitat reduces the probability that such control efforts could cause unintentional harm to the species or its habitat. Fire and fuels management will have no adverse effect on the Uncompahgre fritillary butterfly or its habitat. It is very unlikely that even the most intense wildfires could burn into the Uncompahgre fritillary butterfly habitat regardless of Forest Service management actions. As such, impact to the Uncompahgre fritillary butterfly from fire and fuels management would not vary from one alternative to the next.
Effects from Livestock Grazing
All action alternatives include revised plan direction for Uncompahgre fritillary butterfly habitat, specific to snow willow in alpine areas. The Forest does not permit livestock grazing in occupied Uncompahgre fritillary butterfly habitat. However, sheep trailing overlaps one known colony area. Sheep trailing typically occurs after the Uncompahgre fritillary butterfly flight season, and the sheep trail through the colony within a few days. As grazing leases cycle through permit renewal, revised management direction in all action alternatives would be taken into consideration, addressing any negative impacts associated with grazing. FW-GDL-SPEC-27 intends to avoid direct species and habitat impacts by avoiding placing management activities (livestock grazing and new or realigned recreation trails) in occupied Uncompahgre fritillary butterfly snow willow habitat, and directing livestock trailing

GMUG National Forests Land Management Plan Draft Environmental Impact Statement: Volume 1
197
through occupied habitat to continue to conform to the on-file biological assessment and concurrence with the U.S. Fish and Wildlife Service. Minimal impacts from the livestock grazing program to the Uncompahgre fritillary butterfly may, however, occur. This would not vary among alternatives because grazing does not typically occur, except rarely due to wandering livestock, in known Uncompahgre fritillary butterfly habitat on the planning unit. Revised plan direction can provide a second level of protection from grazing, or to protect any new patches of habitat that may be discovered. This would not vary among alternatives.
Effects from Roads and Road Use
There are no roads or motorized routes in or near Uncompahgre fritillary butterfly habitat. All known Uncompahgre fritillary butterfly populations are in wilderness or Colorado roadless areas in all alternatives. Road construction, reconstruction, road management, and off-highway vehicle use will have no impact on the Uncompahgre fritillary butterfly or its habitat. This would not vary by alternative.
Effects from Trail Management and Recreation
Although there are no trails or developed recreation sites in or near any known Uncompahgre fritillary butterfly habitats or populations, increasing recreational traffic, including off-trail use, is consistently noted as a potential threat to known Uncompahgre fritillary butterfly colonies, particularly colonies on an adjacent national forest (Alexander and Keck 2016). There is some potential for dispersed recreation to have adverse impacts to the Uncompahgre fritillary butterfly and its habitat. All action alternatives include direction to manage these potential impacts. This does not eliminate the potential for damage to the Uncompahgre fritillary butterfly or its habitat, however, as direction is contingent on monitoring to trigger implementation. The management direction will likely be enough to prevent any major or moderate adverse impacts to the species and habitat from dispersed recreation. Short-term impacts to habitat and individuals are possible from dispersed recreational foot traffic, depending upon accessibility to the colony area. Trampling by recreational foot traffic has been noted as a management issue in some colony areas; however, the overall effect of this activity is not known. Depending upon the colony area, the probability of impacts from recreational activities may occur on an annual or periodic basis. In all action alternatives, known Uncompahgre fritillary butterfly populations continue to be present in existing wilderness areas. None of the known populations occur in any of the management areas focused on recreation. As a result, management impacts from recreation to Uncompahgre fritillary butterfly will not vary among alternatives.
Effects from Proposed Wilderness Designations
Wilderness designation is generally protective of the Uncompahgre fritillary butterfly except perhaps for recreational activities, which might increase along with an increase in designated wilderness if there are increased numbers of visitors. Protection and management of the habitat for this species does not require any equipment or methods that are incompatible

USDA Forest Service
198
with wilderness designation. Wilderness designation does prevent many incompatible actions from occurring on Uncompahgre fritillary butterfly habitat. All known colonies in the planning area occur in designated wilderness and none are in areas proposed for wilderness; thus, the effect of proposed wilderness designations does not have a direct effect. The intensity of the impact to the species may be difficult to qualify, but if colonies were discovered in areas proposed for wilderness, the effect would be generally positive and long term, with no adverse effect. The alpine saddles and meadows that make up the habitat for the Uncompahgre fritillary butterfly are not in any of the special interest areas or special management areas.
Mineral Resource Activities
There are no active mineral extraction sites near any of the Uncompahgre fritillary butterfly populations or habitat in the GMUG. Populations that are in wilderness are protected from any new mineral claims entry. This plan revision has no impact and no change to minerals management in Colorado roadless areas. If any Uncompahgre fritillary butterfly colonies are discovered in Colorado roadless areas, the revised plan for all action alternatives would not cause different effects compared to the current plan. As a result, within the context of this plan revision, minerals extraction will have no impact to this species beyond those already analyzed by the environmental analysis that was done for the Colorado Roadless Rule.
Cumulative Effects
The Uncompahgre fritillary butterfly was once considered a little-known and poorly studied species. Since 2003, annual monitoring and associated studies advanced knowledge of the species on quantitative and qualitative abundance estimates, phylogenetic relationships within the same and associated genera, and genetic relationships among populations, colonies, and sub-colonies. This information, collected at all known colonies in the GMUG and Rio Grande National Forests, provides trend data for this endemic species and best available science informing the GMUG in understanding and assessing potential impacts to the species. Initially when first named as a new species, the only known direct impact involved collection, both legal and illegal, by researchers and hobbyists. The extent to which that collecting may have caused population declines is unknown. Collection of the species became regulated when the species was first listed under the Endangered Species Act. Current trends in reduced population persistence at sites qualitatively sampled, and recent general trends in abundance estimates at sites quantitatively sampled, suggest concerns for the continued persistence of this species (Alexander 2009). Until more information can be developed it is difficult to state the cumulative effects outside of current trends. Considerations and protection measures required by the Endangered Species Act are expected to continue to minimize potential known adverse effects, including cumulatively. Based on the analysis for the Uncompahgre fritillary butterfly, none of the alternatives would result in measurable cumulative effects. The proposed forest plan, by applying Forestwide direction for the species in all action alternatives (FW-DC-SPEC-17, FW-GDL-

GMUG National Forests Land Management Plan Draft Environmental Impact Statement: Volume 1
199
SPEC-19, FW-STND-SPEC-24, and FW-STND-SPEC-25), adds regulatory certainty not found in the no-action alternative.
Conclusion
Consistent with 36 CFR 219.9(a)(2), the effects of plan direction would maintain or restore the diversity of the alpine ecosystem and snow willow habitat in the plan area because proposed plan direction would maintain or restore key ecosystem characteristics the Uncompahgre fritillary butterfly depends on, contribute to its habitat persistence, and focus conservation based on the best available science in coordination with the Uncompahgre fritillary butterfly recovery team and consistent with the Uncompahgre fritillary butterfly recovery plan (USFWS 1994). Since all known colonies in the plan area are in designated wilderness, there is no measurable difference between any of the alternatives.
Environmental Consequences - General Wildlife The following general wildlife topics are addressed, selected based upon their significance and the relevance of the particular draft plan direction and alternatives: bighorn sheep, the effects of the proposed timber program on wildlife, the effects of recommended wilderness on wildlife, the effects of recreation on wildlife, and habitat connectivity in general.
Bighorn Sheep
Affected Environment
The GMUG is occupied by two subspecies of bighorn sheep: Rocky Mountain (Ovis canadensis canadensis) and desert (Ovis canadensis nelsoni). Rocky Mountain bighorn sheep are native to the GMUG and surrounding area and have occupied suitable mountainous habitat since pre-settlement times. Although it is difficult to estimate how many bighorn sheep were present in the GMUG historically, the available information suggests that they were quite common and widespread. By the late 1800s, however, the number of bighorn sheep decreased drastically in association with human settlement. There is one desert bighorn sheep herd, the S62 Dominguez (Uncompahgre) herd, with partial range overlap in the GMUG. The herd size is estimated at 165 individuals (2016 desert bighorn sheep post-hunt population estimates). Approximately 5 percent (6,500 acres) of this herd’s range occurs in the GMUG National Forests, in the Roubideau Creek drainage in the Roubideau Special Management Area on the southeast side of the Uncompahgre Plateau. As of March 2018, there are 14 Rocky Mountain bighorn sheep game management units with occupied range that occurs entirely or partially in the GMUG that supports approximately 1,285 individuals (2017 Rocky Mountain bighorn sheep post-hunt population estimates). The occupied range of five of these herds borders or minimally overlaps the GMUG and is included in this estimate. However, these five herds likely spend more time in portions of their range outside of the GMUG National Forests, yet are still influenced by the GMUG. These five herds are estimated to total 405 individuals.

USDA Forest Service
200
Disease epizootic events are likely the most influential factor affecting population trends. Bighorn sheep populations in the GMUG have undergone periodic fluctuations. Eight of the 14 Rocky Mountain bighorn sheep herds in/partially in the GMUG contain 100 individuals or more, which is considered by several authorities to be a minimal size for viability (Smith et al. 1991, New Mexico Game and Fish Department 2005). Habitat relationships and ecological needs for bighorn sheep in the GMUG National Forests are similar to those described elsewhere for Colorado. Most bighorn sheep populations occur in steep, mountainous terrain in the alpine, subalpine, and montane zones. Most herds display elevational migrations that vary by season, though some herds remain in the alpine zone throughout the year. There is ample unoccupied habitat for herd expansion in the GMUG, but most herds experience limited growth due to past disease events. The following risk factors were also identified in the species overview:
• Disease Epizootics: In Colorado, the susceptibility of bighorn sheep to pathogens introduced by domestic sheep is regarded as the primary factor limiting bighorn sheep populations (George et al. 2009). Based on disease occurrence information from Colorado Parks and Wildlife, disease has been documented in 13 game management units with occupied range in or partially in the GMUG. Of those, die-offs are documented in eight of them. Die-offs affected all age-classes and were typically followed with low lamb recruitment. Disease morbidity (persistence in a herd) is documented in 11 game management units with occupied range in the GMUG. Morbidity is documented in four herds without die-offs, and in seven herds with die-offs.
• Habitat Quality and Quantity: Based on professional opinion and field observations by Forest Service and Colorado Parks and Wildlife biologists, habitat conditions are not considered a primary limiting factor for bighorn sheep herds in the GMUG and appear adequate to support existing or expanding herd populations. For a few units, certain areas have moved away from desired conditions for bighorn sheep due to succession of vegetation related to wildfire suppression. In these cases, habitat conditions could be improved by implementing prescribed fire or mechanical treatments. Although perhaps important to some local herds, disruption of access to trace mineral supplies is not considered a limiting factor to Colorado bighorn sheep populations (Ramey and Carpenter 2007 in George et al. 2009). One emerging habitat phenomenon involves the extensive mortality of conifer trees in the subalpine spruce-fir zone. The Rocky Mountain subalpine spruce-fir forest vegetation type provides a common interface with the alpine tundra and montane grassland habitats that most bighorn sheep herds occupy. The effect of Engelmann spruce mortality on bighorn sheep is unknown.
• Herd Size and Loss of Genetic Diversity: In pre-settlement times, it is likely that most of Colorado’s bighorn sheep populations existed as large metapopulations that interacted over large areas and maintained high genetic diversity. Currently, large-scale movements and herd interactions have been greatly restricted because most extant populations occur as small, isolated herds separated by landscape habitat fragmentation factors such as roads, towns, urban home-sites, and other human developments on private lands in the broader landscape.
• Human Disturbance, Development, and Habitat Fragmentation: Human disturbances, development, and habitat fragmentation in the GMUG, while certainly influential, are

GMUG National Forests Land Management Plan Draft Environmental Impact Statement: Volume 1
201
not considered a primary limiting factor for bighorn sheep herds in the GMUG National Forests. In some units, recreation or other potential human disturbances warrant further site-specific evaluations for possible influences on local bighorn sheep herds (e.g., development and recreation in the S26 – Taylor River herd).
• Competition: Competition with domestic and wild ungulates can potentially influence bighorn sheep. From a forage perspective, bighorn sheep have the most dietary overlap with domestic sheep, cattle, and elk and less overlap with species such as mule deer. On Trickle Mountain (S10), the average year-round dietary overlap with pronghorn antelope was also fairly high at 45 percent. The Trickle Mountain study did not include domestic sheep, which had been removed at the time but are known to have the highest dietary overlap and utilize many of the same habitats as bighorn sheep. Regarding livestock, the study found that although bighorn sheep and cattle have a high dietary overlap, the impact of cattle was limited to only about 5 percent of the critical bighorn sheep range because cattle primarily remained close to water and used areas with less slope. However, other researchers have reported that cattle were serious dietary competitors with bighorn sheep where their habitats overlapped, and also compete through spatial displacement (several authors in Beecham et al. 2007). The impact on bighorn sheep due to an apparent social intolerance of cattle (except in extreme cases, such as the 2007/2008 winter conditions that resulted in the S-70 Fossil Ridge herd mixing with cattle on private land eating hay) has resulted in displacement from traditional range areas and disruption of the lamb-rearing season (Taylor 2001, Beecham et al. 2007). In the GMUG National Forests, however, there is typically little range overlap between cattle and bighorn sheep, and any potential forage competition from livestock most likely involves domestic sheep in the sheep allotments that overlap bighorn sheep herd ranges.
• Regarding native ungulates, potential competition with elk is likely in the GMUG National Forests. Elk can have greater negative effects on bighorn sheep than other wild ungulates because they are much larger, have a broader dietary overlap with bighorn sheep, and can gather in large herds on traditional bighorn sheep habitat summer range in the alpine zone (George et al. 2009). On Trickle Mountain, the year-round dietary overlap between elk and bighorn sheep averaged 68 percent and increased to as much as 76 percent during the spring (Bailey and Cooperrider 1982). Elk in alpine habitats overlapping with bighorn sheep range may be of particular concern for forage competition between the two species. The degree to which bighorn sheep herds in the GMUG National Forests are affected by elk forage competition is not known.
• Harvest: Current harvest rates in most herds in Colorado involve less than 3 percent of the estimated post-hunt herd size and primarily involve rams. These numbers are considered small enough that in most cases hunting is unlikely to have much effect on bighorn sheep populations. Hunting is not considered a primary limiting factor for any bighorn sheep herd in the GMUG National Forests. The following bighorn sheep game management units have recent public hunting seasons (as of 2016): S-10, S-11, S-13, S-17, S-20, S-21, S-22, S-24, S-33, S-54, S-69, and S-62 (Desert bighorn sheep unit). Units S-26 and S-70 have not had public hunting seasons in about a decade, due to small herd size. As of 2018, S-26 and S-70 are now managed as hunted populations by Colorado Parks and Wildlife.

USDA Forest Service
202
• Predation: Common predators of bighorn sheep in Colorado include mountain lion, coyote, black bear, and domestic dogs. Additional predators of lambs include bobcats, golden eagles, and red fox. For most Rocky Mountain bighorn sheep populations in Colorado, there is little evidence that lion predation is limiting bighorn sheep numbers. However, lion predation has been found to be a significant source of Rocky Mountain bighorn sheep mortality in individual field studies and in some cases numerous losses can be attributable to a single lion (Viera 2007 in George et al. 2009). Predation is not considered a primary limiting factor for bighorn sheep herds in the GMUG National Forests; however, other threats could compound the effects of predation. For example, if disease or other factors reduce herd size below the threshold for population viability, then predation on that herd would become a limiting factor. As a bighorn sheep group size decreases, other factors that are not normally a concern become limiting factors.
• Interagency and Cross-Boundary Management Coordination: The core herd home range and/or summer source habitat for several bighorn sheep herds in the GMUG National Forests are shared with adjacent Forest Service units and/or Bureau of Land Management units.
Environmental Consequences
Analysis Framework
This analysis framework is based upon the threats, risk factors, and habitat requirements identified in the species overview for Rocky Mountain bighorn sheep that was developed to support the At-Risk Species Assessment (USDA 2018). Included within the overview are the ecological conditions for recovery, conservation, and viability of bighorn sheep herds in the GMUG. This analysis carries them forward as key issues: Disease/Effective separation from domestic sheep and goats. Effective separation is defined by science-based estimates of bighorn sheep core herd range and movements across the landscape in relationship to domestic sheep areas and managing potential contact rates to an acceptable level to reduce the risk of disease transmission. Management to maintain separation would also address the risk factor for disease epizootics and would address competition with domestic animals. The indicator for this analysis is a qualitative discussion of the effects of plan components. Habitat connectivity. Indicators for this analysis are a narrative discussion of the effects of plan components and the acres of bighorn habitat per management area by alternative. Habitat quality and quantity:
• Within individual home ranges, habitat components that meet the foraging, resting, mating, lambing, thermal cover, and predator avoidance requirements.
• Ecological processes, such as wildfire, that help maintain adequate forage resources in the core herd home range, particularly in close proximity (about 500 meters) of escape terrain.
• Quality and quantity of forage, which can relate to many factors including climate, vegetation management, and competition with domestic livestock.
GMUG National Forests Land Management Plan Draft Environmental Impact Statement: Volume 1
203
Human disturbance: Adequate seclusion on important lambing and winter range areas is another factor identified in the overview. This includes management of human disturbances spatially and temporally near these key habitats. Issues removed from consideration: The following rick factors identified in the species overview are not further analyzed in the environmental impact statement:
• Competition with big game and other native wildlife species: This is not expected to vary across management alternatives and is not analyzed.
• Harvest (Hunting): This is outside the scope of Forest Service management authority and is not analyzed.
• Predation: Predation by native species is not expected to vary across management alternatives and is therefore not analyzed.
Disease Transmission and Effective Separation from Domestic Sheep and Goats
The current forest plan makes little to no recognition of the risk that disease transmission from domestic sheep poses to their wild cousins. However, the current plan does appear to allow a wide enough array of adaptive management flexibility for managers to have options to reduce risk somewhat. Trailing of domestic sheep through bighorn sheep habitat still occurs. All action alternatives contain two Forestwide plan components that address the risk of disease transmission from domestic sheep to bighorn sheep:
• FW-STND-SPEC-13, which addresses “effective separation” of bighorn and domestic sheep as a standard. The plan component does not define effective separation, but the emphasis of the planning rule on “best available science” means that the definition would be based on current science. As our scientific understanding of the species needs changes, so could the definition of “effective separation” as regards the risk of disease transmission from domestic animals to wild animals.
• FW-GDL-SPEC-14 addresses the risk of disease transmission from goat to bighorn sheep, requiring the Forest Service to minimize the potential for interaction and to manage pack goats consistently with the way sheep are managed.
The impact of these two components on the disease transmission issue faced by bighorn sheep would be strong. SPEC-13 for “effective separation” would become a mandatory component of renewed allotment management plans. The guideline SPEC-14 does provide greater flexibility regarding separation between pack goats and bighorn sheep, but still requires justification for any occasion when the Forest Service allows the users or permittees to not comply. Compared to the existing forest plan, these two components—over time, as incorporated into individual allotments as they are renewed—would likely greatly reduce the risk of disease transmission from domestic animals to bighorn sheep. Any remaining risk would occur from domestic animals escaped from handlers or permitted areas, or from bighorn sheep wandering well outside known herd ranges—stochastic events that can be hard to predict or manage. Overall, the adoption of the Forestwide components of the action alternatives would reduce the potential for disease transmission from domestic sheep to bighorn sheep. This would be a direct, long-term moderately beneficial impact to bighorn sheep in the GMUG.

USDA Forest Service
204
All action alternatives would better manage the potential for disease transmission in comparison to the current forest plan due to the incorporation of these components.
Habitat Connectivity
The current plan includes Forestwide direction to “Use vegetation treatment to restore historic migration patterns and dispersed foraging areas on summer and winter ranges” for bighorn sheep and other large game. This may allow managers flexibility to implement changes to forest operations in ways that could allow better movement of bighorn sheep populations. This plan direction includes no specifics as to how this should be managed. The draft revised plan includes a number of Forestwide components relating to the ability for native species populations to move across the landscape and to interact with other populations of the same species. This includes FW-DC-SPEC-01 allowing for native species movement and minimization of activities that could impact said movement. DC-SPEC-12 contains more specific guidance on the nature of such travel corridors and habitat locks, as well as the content of such habitat areas (security, quality). Another Forestwide desired condition for migration corridors, ECO-05, further specifies that genetic interchange is an intent of these corridors. Compared to the existing plan, the components across all action alternatives are much more specific in purpose and in the nature of the specified actions or conditions required or encouraged by such components. That said, habitat connectivity is as complex as the land itself across all ecosystem types and land ownership entities. The actions of the Forest Service can enable better movement of bighorn sheep across landscapes, but there is no guarantee that the animals will take advantage of these opportunities, or that the effectiveness of such actions will not be contradicted by the actions of adjacent land management/ownership entities. Across the action alternatives, the amount of land allocated to wildlife management areas would also impact habitat and genetic connectivity. Regarding bighorn sheep, the largest difference between action alternatives is the variability in the ratio of winter range between wildlife management areas, Colorado roadless areas, and general forest. Generally, areas with more land designated as wildlife management areas, Colorado roadless, or wilderness will be more protective of bighorn sheep movement, population dispersal, and genetic interchange because there is less human impact to the environment and the species due to fewer roads, less motorized use, or because a major goal of the area is to be managed in ways that benefit wildlife. Table 106, table 107, and table 108 show the differing proportions of management areas intersected with bighorn sheep habitat, omitting those categories for which the difference between alternatives impacts is less than 1 percent of bighorn sheep summer or winter range.

GMUG National Forests Land Management Plan Draft Environmental Impact Statement: Volume 1
205
Table 106. Bighorn sheep summer and winter range distribution in management areas for alternative A
Management Area
Summer Range Winter Range
Acres (percent1) Acres (percent2) 1.1 - Designated Wilderness 198,983 (51) 70,760 (47) 1.3 - Tabeguache and Roubideau Designated Areas 6,030 (2) 6,030 (4) 1B/8 - Downhill Skiing and Winter Sports / West-wide Energy Corridor 2 (0.0005) 0 (0)
2.3 - Fossil Ridge Special Recreation Area 30,783 (8) 6,535 (4) 2A - Semi-Primitive Motorized Recreation Opportunities 16,270 (4) 4,911 (3) 2B - Roaded Natural and Rural Recreation Opportunities 2,954 (0.7) 1,735 (1) 2B/8 - Roaded Natural and Rural Recreation Opportunities / West-wide Energy Corridor 0 (0) 0 (0)
3.1 - Upper Tier Colorado Roadless Area 17,045 (4) 3,736 (2) 3.2 - General Colorado Roadless Area 68,117 (17) 25,359 (17) 3A - Semi-Primitive Non-Motorized Recreation Opportunities 6,454 (2) 512 (0.3) 4.1/8 - Mountain Resort / West-wide Energy Corridor 1 (0.0002) 0 (0) 4B - Wildlife Habitat Management for One or More Management Indicator Species 3,125 (0.8) 1,082 (0.7)
4D - Aspen Management 685 (0.2) 586 (0.4) 5A - Big Game Winter Range in Non-Forested Areas 16,678 (4) 16,086 (11) 5B - Big Game Winter Range in Forested Areas 1 (0.0001) 1 (0.0004) 6B - Livestock Grazing - Maintain Forage Composition 2,382 (0.6) 1,368 (0.9) 7A - Timber Management on Slopes Under 40 Percent 9,192 (2) 2,430 (2) Non-National Forest System Land 15,234 (4) 10,100 (7)
1 Percent of total bighorn sheep summer range in the GMUG National Forests. Total summer range in the GMUG is 393,963 acres.
2 Percent of total bighorn sheep winter range in the GMUG National Forests. Total winter range in the GMUG is 151,240 acres.
Table 107. Bighorn sheep summer range distribution in management areas for all action alternatives, revised to remove management areas for which the action alternatives designation in bighorn sheep habitat shows little difference
Management Area
Alternative B Alternative C Alternative D
Acres (percent1)
Acres (percent1)
Acres (percent1)
1.2 - Area to be Analyzed as Wilderness 1,351 (0.3) 0 (0) 8,712 (2) 1.2/3.1 - Area to be Analyzed as Wilderness / Colorado Roadless Area 14,364 (4) 0 (0) 42,644 (11)
2.2/3.1 - Research Natural Area / Colorado Roadless Area 0 (0) 0 (0) 10,673 (3)
2.3 - Fossil Ridge Special Recreation Area 23,603 (6) 30,722 (8) 23,603 (6) 2.3/3.2 - Fossil Ridge Special Recreation Area / Wildlife Management Area 7,119 (2) 0 (0) 7,119 (2)
3.1 - Colorado Roadless Area 47,781 (12) 84,427 (21) 14,858 (4)

USDA Forest Service
206
Management Area
Alternative B Alternative C Alternative D
Acres (percent1)
Acres (percent1)
Acres (percent1)
3.2 - Wildlife Management Area 16,338 (4) 1,013 (0.3) 4,134 (1) 3.2/3.1 - Wildlife Management Area / Colorado Roadless Area 22,239 (6) 0 (0) 6,155 (2)
3.3 - Special Management Area 0 (0) 0 (0) 13,504 (3) 3.3/3.1 - Special Management Area / Colorado Roadless Area 0 (0) 0 (0) 10,100 (3)
5 - General Forest 38,809 (10) 55,783 (14) 30,856 (8)
1 Percent of total bighorn sheep summer range in the GMUG National Forests. Bighorn sheep summer range on GMUG is 393,963 acres.
Table 108. Bighorn sheep winter range distribution in management areas for all action alternatives, revised to remove management areas for which the action alternatives designation in bighorn sheep habitat shows little difference
Management Area
Alternative B (Blended)
Alternative C (Active
Management)
Alternative D (Special Area
Emphasis)
Acres (percent1)
Acres (percent1)
Acres (percent1)
1.2/3.1 - Area to be Analyzed as Wilderness / Colorado Roadless Area 3,400 (2) 0 (0) 8,533 (6)
2.2/3.1 - Research Natural Area / Colorado Roadless Area 0 (0) 0 (0) 10,608 (7)
3.1 - Colorado Roadless Area 24,512 (16) 28,933 (19) 9,197 (6) 3.2 - Wildlife Management Area 10,658 (7) 1,013 (0.7) 3,694 (2) 3.3 - Special Management Area 0 (0) 0 (0) 7,144 (5) 5 - General Forest 16,820 (11) 26,817 (18) 16,360 (11)
1 Percent of total bighorn sheep winter range in the GMUG National Forests. Bighorn sheep winter range on GMUG is 151,240 acres.
Based on overlap between the different management areas and known bighorn sheep habitat, alternative D is the most protective of bighorn sheep and their habitat. This is because of the total acres within wildlife management areas and the protection that confers upon bighorn, including lower trail density; special management areas, with differing levels of recreation restrictions; and the most area to be analyzed as wilderness; such areas would be subject to less human disturbance than general forest. Alternative C, because of its relative lack of wildlife management areas and lack of areas to be analyzed as wilderness, would have the least benefit to the management of bighorn sheep. This includes the larger areas managed as general forest overlapping with both summer and winter range. Alternative B has impacts to bighorn sheep falling between alternatives D and C because although more area would be managed as wildlife management area, there are no acres in the special management area category and fewer acres than D in recommend wilderness.

GMUG National Forests Land Management Plan Draft Environmental Impact Statement: Volume 1
207
Regarding landscape-level movement, both alternatives B and D provide opportunities for long-range movement because they both have ample wildlife management and wilderness analysis areas. Alternative D, because of its research natural area and wilderness analysis areas is more protective of bighorn sheep areas than alternative B and would likely allow the greatest population movement across the landscape, supportive of population meta-structure. Alternative C is least beneficial in that regard because it has the least wilderness analysis and wildlife management area acreage.
Habitat Quality and Quantity
Management Area 5A of alternative A includes management of winter range for deer, elk, bighorn sheep, and mountain goats to increase forage. The action alternatives all contain a suite of plan components related to vegetation condition and habitat management, from seed mixes used in restoration sites (STND-RNG-07), to range management (OBJ-RNG-05), recreation management and more. This would generally allow for better quality habitat to be maintained because managers would have the components needed to prevent damage and improve condition through seed mixes, restoration, and management of range and recreation. There is variability among the action alternatives regarding how much bighorn sheep range falls into each management area. In addition, the General Forest Management Area is intended to allow for management flexibility, which means that any firm description of impacts of that designation to bighorn sheep habitat quality would be speculative. Alternatives B and D include more recommended wilderness and wildlife management areas than alternative C.
Human Disturbance
Current forest plan direction includes: “Restrict activities within one mile of known bighorn sheep lambing grounds from May 1 through June 20 if they would cause unacceptable stress to lambing ewes.” The three action alternatives all contain a number of plan components limiting human impacts to wildlife and alpine areas, such as SPEC-GDL-19 (limits to motorized and recreational use) and STND-REC-11 (no fires outside established fire rings in alpine areas), and an objective for habitat restoration in alpine environments. Alternative D would also have the most acres within protective land designations such as wilderness, recommended wilderness, wildlife management areas, and the 3.3 special management area. Within areas managed under these designations, bighorn sheep would experience less human disturbance because of varying levels of restrictions upon recreation use.
Cumulative Effects
The cumulative effects area for this analysis includes the GMUG and all bighorn sheep game management units on the GMUG, including the entirety of those that have overlap with lands beyond the GMUG boundary.

USDA Forest Service
208
Fragmentation on non-Federal lands combined with small herd size and the presence and continued risk of transmitted diseases are primary factors limiting the restoration of large, interconnected herds in the national forests and between adjacent public land management units. The core herd home range and/or summer source habitat for several bighorn sheep herds in the GMUG National Forests are shared with adjacent Forest Service units and/or Bureau of Land Management units. In some cases, domestic sheep allotment permittees are also shared between the land management agencies. Coordination and consistency of management approaches regarding risk of contact with domestic sheep, monitoring, permit administration, and communication is critical to bighorn sheep management across the landscapes that support their long-term viability and population persistence. In some areas of the GMUG, multiple game management units have been combined by Colorado Parks and Wildlife into Data Analysis Units involving connected populations that extend beyond the GMUG boundary. This highlights the need for cross-boundary cooperation regarding bighorn sheep management. Examples include Data Analysis Unit RBS-12 (Collegiate North and Collegiate South, shared with the Pike and San Isabel National Forests), RBS-13 (Maroon Bells-Snowmass, shared with the White River National Forest), RBS-22 (San Luis Peak, shared with the Rio Grande National Forest; and Rock Creek, shared with Bureau of Land Management Gunnison Field Office), RBS-11 (Marshall Pass and Trickle Mountain, shared with the Pike and San Isabel, and Rio Grande National Forests), RBS-21 (Lake Fork/Pole Mountain and Cow Creek/Wetterhorn Peak, shared with the Bureau of Land Management Gunnison Field Office and Rio Grande National Forest, and RBS-25 (Dillon Mesa – West Elk, shared with the Bureau of Land Management Gunnison Field Office). Colorado has one of the fastest growing populations in the country. We anticipate that recreational uses in the GMUG National Forests will continue to increase due to growing demand and increasing population. We also anticipate increased use on private lands in the planning area, and increased permanent and seasonal residential development. Bighorn sheep habitat is often remote and in rugged terrain not conducive to development. However, many of those areas are subject to increasing levels of recreational use, which is anticipated to grow along with the state’s human population. We anticipate that despite expected increases in human use on public land, the GMUG will continue to provide bighorn sheep habitat and habitat connectivity to support bighorn sheep persistence due to the high percentage of protective land management allocations in bighorn habitat, such as 50 percent of summer range being within designated wilderness.
Conclusion
Effects of the No-Action Alternative
Overall, the current forest plan recognizes some of the unique values of bighorn sheep and works to manage that. This includes recognition of the value of alpine ecosystems for the species, protection of lambing grounds, and recognition of the need for longer-range population movement. The current plan appears to have no recognition of the risk that disease poses to the species, and somewhat lacks specific guidance for managing the species.

GMUG National Forests Land Management Plan Draft Environmental Impact Statement: Volume 1
209
Continuation of the current plan (alternative A) would probably result in a continuation of the status quo, in which bighorn sheep populations are stable in most years but suffer from occasional disease outbreaks and necessitate population supplementation.
Effects of the Action Alternatives
The action alternatives would have a more positive impact to bighorn sheep than the no-action alternative. This would result from improved and more precise plan components relating the habitat quality and management of human uses. The biological evaluation for the draft revised plan (appendix 4 in volume 2 of this draft environmental impact statement) lists 18 Forestwide plan components that could be protective of or beneficial to bighorn sheep or their habitat, in addition to multiple components relating to management of invasive species. Between the action alternatives, alternative D is the most beneficial to bighorn sheep because it is the most limiting of human impacts and includes the most acreage under the most protective management areas. Alternative C is the least protective, as it has the least acreage under areas that mandate actions supportive of bighorn sheep populations. However, this is balanced by the discretionary nature of the General Forest Management Areas within alternative C, in which the forest supervisor could manage in a number of ways with different impacts. Alternative B has impacts intermediate between alternatives D and C; it is more protective of bighorn sheep than alternative C, and less protective than alternative D. All three of the action alternatives provide the Forest Service and its cooperating agencies with the ability to maintain bighorn sheep populations in the GMUG in perpetuity because of the Forestwide plan components that address the risk of disease transmission as well as components that address habitat quantity and quality, population-level movement, and the impacts of human activity on the population.
Effects of Projected Timber Program on General Wildlife Vegetation management would primarily occur in the General Forest Management Area. Commercial timber harvesting would primarily occur in areas designated as suitable for timber production. Commercial harvest is a tool that can be used for restoration to achieve forest plan desired conditions or objectives. Active vegetation management meets multiple outcomes to support timber production for wood products, manage wildfire risk including more active management in the wildland-urban interface, meet fuels management objectives, and manage wildlife or fish habitat. These multiple outcomes are often integrated in projects. The proposed forest plan components for forested ecosystems will provide opportunities to use timber harvesting in the General Forest Management Area to work toward ecosystem desired conditions. The action alternatives propose an increase in suitable timber acres as compared to alternative A because the current forest plan excludes slopes steeper than 30 percent and all areas that were assumed not economically feasible. The proposed revised forest plan would allow for harvest on steeper slopes, provided that all plan components are adhered to. Feasibility would be determined at the project level. Areas

USDA Forest Service
210
suitable for timber production by management area for all alternatives are provided in table 109.
Table 109. Areas suitable for timber production for all alternatives
Alternative A
(acres) Alternative B
(acres) Alternative C
(acres) Alternative D
(acres) Timber Suitability 467,312 948,190 974,925 757,796
The timber program would have varying effects to wildlife. Typically, we anticipate negative impacts during implementation, followed by long-term benefits if wildlife habitat objectives are built into projects. Active management provides opportunities to manipulate habitat to promote desired habitat conditions over time. This varies depending on the forest types and species associated with them. Depending on the purpose and need of projects, the degree to which we build in wildlife habitat objectives varies from project to project. Some projects focus on addressing specific issues such as bark beetle outbreaks or hazardous fuels reduction with no specific wildlife habitat component other than design features built into the project to reduce negative impacts. Other projects have a wildlife habitat improvement emphasis as a major driver in the purpose and need. As reflected in table 109, alternative C would provide the most suitable timber acres, and could potentially provide the most acres to integrate wildlife habitat objectives if the purpose and need of projects provides the sideboards and flexibility to do so. Alternative C would also have the most potential to influence wildlife habitat negatively or positively by providing the greatest opportunity for active vegetation management. This is followed by alternatives B, D, and A. All alternatives provide opportunities to integrate wildlife and fish habitat needs and concerns into timber program activities and projects. The Forest Service works to integrate multiple outcomes as much as possible, including producing timber volume harvested using treatment methods that perpetuate desired habitat conditions for wildlife. For example, the Southern Rockies Lynx Amendment influences how timber sales are implemented in lynx habitat. The lynx analysis addresses this in detail. Forest management under the Southern Rockies Lynx Amendment has ancillary benefits to other species that use the same habitat, such as American marten, boreal owl, Rocky Mountain elk, dusky grouse, red squirrels, small mammals, cavity-nesting birds, a variety of forest-dependent birds, and snag-dependent species. Lynx habitat management under the Southern Rockies Lynx Amendment will continue into the foreseeable future, continuing to benefit a host of species that depend on the same key ecosystem characteristics as lynx. The biological evaluation of the proposed forest plan also addresses the effects of the timber program on the current regional forester’s list of sensitive species for the Forest Service Rocky Mountain Region.
Effects of Recommended Wilderness on General Wildlife The proposed forest plan recommends new wilderness designations in alternatives B and D. Existing wilderness designations stay the same under all alternatives, as do Colorado roadless areas. Areas recommended for wilderness would be managed to maintain wilderness characteristics. This would have varying effects on wildlife. This analysis

GMUG National Forests Land Management Plan Draft Environmental Impact Statement: Volume 1
211
describes the potential effects and trade-offs that recommended wilderness designations may have on general wildlife.
Direct and Indirect Effects of All Alternatives
Recommended wilderness would prevent most forms of active management, similar to designated wilderness. Natural ecosystem and disturbance processes would be the dominant influencing factors. With no active management presence, there would be less potential for disturbance and displacement of wildlife that is often associated with active management and multiple-use projects. Recommended wilderness would contribute to maintaining or increasing wildlife security areas, which would benefit habitat connectivity. Natural conditions and ecosystem processes would be the primary drivers influencing vegetation conditions. Wildlife habitat would remain in a pristine state, perhaps most benefitting species that are habitat specialists. Wildlife habitat in recommended wilderness would not be artificially maintained. Integrated wildlife and fuels management projects typically involve reducing heavy fuel loads, maintaining openings and habitat edges, increasing forage, or stimulating aspen regeneration. The GMUG would not have opportunities to artificially manage vegetation to achieve these multiple outcomes in recommended wilderness, but wildlife would benefit from lack of physical disturbance and the added security that recommended wilderness would provide. There are 34,128 acres of recommended wilderness in alternative B, in which 86 percent is Colorado roadless. There are 306,337 acres of recommended wilderness in alternative D, of which 92 percent is in Colorado roadless. Since the majority of recommended wilderness occurs in Colorado roadless and currently is managed similar to how it would be managed under a recommended wilderness designation, we do not anticipate the effects to be much different from the current condition. There is a notable beneficial restoration effect to wildlife that recommended wilderness would provide per objective MA-OBJ-RECWLD-03: Within five years of plan approval, physically close all unauthorized routes within recommended wilderness and take actions that promote restoration along such routes. This benefit is most prevalent in alternative D, which would apply this objective to a total area that would be nine times greater than alternative B. Alternatives A and C do not propose recommended wilderness. Overall, recommended wilderness influences general wildlife the most in alternative D, followed by alternative B. Alternative D adds the most area that would be managed in concert with designated wilderness, for a combined designated and recommended wilderness total of 859,649 acres (about 27 percent of the GMUG National Forests). In alternative B, designated and recommended wilderness totals 587,446 acres (about 19 percent of the GMUG). In conjunction with wildlife management areas, there would be a cumulative benefit to wildlife in terms of wildlife security areas, habitat, connectivity, and amount of area protected from disturbances associated with active management.
USDA Forest Service
212
Effects of Recreation on General Wildlife
Analysis Framework
Indicators
Indicators for this analysis include a qualitative discussion of the plan components and acres of recreation opportunity spectrum setting by alternative. Acres of wildlife management area are also an important indicator; see the Habitat Connectivity section of the General Wildlife section for a thorough discussion of the effects of this plan element by alternative.
Assumptions
Impacts from recreation to wildlife can include a number of factors, including direct mortality of wildlife, harassment of wildlife, habitat damage, altered wildlife behavior, and more. Direct mortality such as roadkill can occur in areas of motorized access. Mortality can also occur if animals need to be euthanized due to human-wildlife conflicts. Harassment, intentional or not can occur. Some animals can have a physiological reaction to the presence of humans that may not be outwardly visible. This can include increased heart rate, less food consumption due to alertness behavior, or loss of access to otherwise suitable habitat. This can lead to reproductive failure or poor nutrition. This harassment can occur from vehicles, visitors hiking on trails, dogs (especially off-leash dogs), camping activities, and more. Visitor use can damage habitat via trampling of sensitive sites or streamside habitat damage, potentially opening up fragile soils to erosion, damaging habitat for riparian wildlife species. Visitors can unintentionally introduce invasive plants, damaging wildlife habitat and nutrition. Visitors can start fires, intentionally or otherwise. This can occur via hot surfaces on vehicles, or target shooting, or from campfires and picnic cookouts. This can cause damage to wildlife habitat and direct mortality. Wildlife diseases can be unintentionally introduced by recreational use, such as anglers who spread chytrid fungus or aquatic nuisance organisms, or spelunkers who inadvertently introduce white-nose syndrome into caves and mines.
Current Plan Direction Relative to Recreation Impacts to Wildlife
Current plan direction for managing impacts to wildlife from recreation include closure of dispersed sites where unacceptable damage is occurring and the use of the recreation opportunity spectrum, including measurements of persons at one time capacity and Frissell condition classes as a means to determine which sites need to be rehabilitated.

GMUG National Forests Land Management Plan Draft Environmental Impact Statement: Volume 1
213
Proposed Plan Direction Relative to Recreation Impacts to Wildlife
The proposed alternatives address some of this potential damage through land management area designations. Some of the ways the various alternatives address such risks are highlighted in table 110.

USDA Forest Service
214
Table 110. Recreational impact activities to wildlife by management area designation
Management Area Motorized Use Mechanized
Use Dispersed Camping
Route Density Group Size
Dog Leash Requirement
Off-route Non-Motorized
Travel MA 1 Wilderness and Areas Where Natural Processes Dominate (Grouped by theme)
No No Adaptive management, prohibited near water bodies
No new routes in Wilderness
15 people 25 mixed humans plus stock animals
Yes No mention (Forestwide direction)
MA 2 Special Area Designations
Designated routes only
Designated Routes only
Prohibited in 2.2 No mention (Forestwide direction)
No mention (Forestwide direction)
No mention (Forestwide direction)
Prohibited in 2.2
MA-3 Management Areas with Focused Management
No net gain above 1 mile per mile in 3.2
No net gain above 1 mile per mile in 3.2 (all routes)
No mention (Forestwide direction)
In 3.2 cannot increase above 1 liner mile per square mile
No mention (Forestwide direction)
No mention (Forestwide direction)
No mention (Forestwide direction)
MA 4 Recreation Management Areas
In 4.1 limited to administrative, emergency, or special use-permitted 4.2: Designated routes and areas only
4.2: Designated routes only
4.1: No mention 4.2: Allowed, but with potential site-specific closures or management
No mention (Forestwide direction)
4.1: No mention 4:2: No limits, may be addressed through site-specific management discretion
No mention (Forestwide direction)
No mention (Forestwide direction)
MA 5 General Forest/Forestwide Direction
Forestwide direction
Forestwide direction
Forestwide direction
Forestwide direction
Forestwide direction
Forestwide direction
Forestwide direction

GMUG National Forests Land Management Plan Draft Environmental Impact Statement: Volume 1
215
In addition, all action alternatives share a suite of plan components including those focused on recreation. Most of the recreation-focused plan components focus on visitor access, experience, and facilities, but there are others that focus on reducing the impacts from recreation. This includes closure of unauthorized routes (REC-06) and management of dispersed overnight sites and day-use sites to reduce or eliminate unacceptable impacts (REC-07, REC-08). Forestwide recreation-focused plan components also include limiting motorized use to existing system routes (REC-12), human waste management (REC-13), prevention of human/wildlife habituation and adverse encounters (REC-14), and the use of the recreation opportunity spectrum in planning as one tool (of many) to help reduce adverse impacts from recreation (REC-16). Recreation opportunity spectrum: Please refer to table 149 and table 150 of this draft environmental impact statement for areas in the GMUG, and to tables 7 through 14 of the draft revised forest plan for descriptions of recreation opportunity spectrum settings. The level of the recreation opportunity spectrum settings assigned to one area or another is reflective of the current and expected visitor use of that area.
Impacts to Wildlife from Managing for Pristine Settings
Impacts to wildlife from the pristine designations would be expected to be minimal. Compared to other areas there would be no risk of roadkill, fewer people, and fewer off-leash dogs. This could be slightly offset by the inability to actively manage such areas with vehicles and a lack of facilities. Essentially, facilities exist in other designations partly for visitor convenience, but also to limit damage from visitors. If visitation exceeds expectations, damage could result from the lack of facilities. A lack of water-crossing facilities could result in streambank erosion if visitors congregate in one area that may be suitable for crossing. Other impacts could include streambank erosion, trampling of sensitive habitats, stream pollution from human waste, or harassment of wildlife. These impacts would likely be minimal because areas designated as pristine are far from existing facilities and are difficult to access—resulting in self-selection of which visitors recreate there. Such self-selection is likely to favor more experienced visitors familiar with the concepts of Leave No Trace and other behavior patterns that are less disruptive of natural conditions. Overall, impacts to wildlife from the designation of pristine would be largely non-existent because the area receives very little human use, and that would continue under this designation. There could be some impact from difficulty in treating invasive plant infestations or addressing other natural resource damage, but this is balanced by the decreased probability of invasive plants being introduced or other natural resource damage occurring.
Impacts to Wildlife from Managing for Primitive Settings
As with the pristine designation, impacts could result if visitor use is higher than anticipated such that minimal facilities cannot support actual use. As with pristine, areas with a primitive designation remain difficult to access, resulting in visitation numbers that are (in most places) unlikely to greatly exceed expectations The primitive designation does allow slightly greater use of facilities such as water crossings to manage such use.

USDA Forest Service
216
Impacts to wildlife from the primitive designation might be negligible because the area receives very little human use and that would be expected to continue. There might be some harassment of wildlife and some habitat damage from trampling, but low numbers of visitors would limit that damage. Overall, impacts to wildlife from the designation of primitive would be largely non-existent because the area receives very little human use. There could be some impact from difficulty treating invasive plant infestation or addressing other natural resource damage, but this is balanced by the decreased probability of invasive plants being introduced or other natural resource damage occurring.
Impacts to Wildlife from Managing for Semi-Primitive Non-Motorized Settings
Areas with this designation might receive more wildlife habitat damage and experience more wildlife harassment than pristine or primitive areas because visitor use is expected to be higher. Such impacts could include harassment of wildlife, trampling of wildlife habitat, and littering. Some wildlife in this area may experience enough visitor contact to alter their behavior, such as marmots who learn to beg for food. This could happen anywhere but increases in probability as visitor use increases. Relative to pristine and primitive, ease of access to semi-primitive areas may result in less self-selection of visitors and thus more damage per visitor.
Impacts to Wildlife from Managing for Semi-Primitive Motorized Settings
The introduction of motor vehicles to an area increases the potential for wildlife harassment and habitat damage substantially. Direct mortality of large animals would be expected to be low due to the condition of the roads in such an area. Vehicles using such roads would be moving slowly or making noise as they clank over rocks and potholes, giving wildlife enough notice to move. Risks of habitat damage increase with the risk of spilled fluids and higher-impact camping techniques afforded by such access. With road access the risk of fire increases. This would result from hot surfaces on the vehicles themselves as well as the higher-impact recreational activities afforded by being able to transport heavier loads. This includes camping with more equipment and larger groups, bigger fire rings, more fuel, and increased target shooting. Areas with a semi-primitive motorized designation would also likely have more visitors as compared to non-motorized recreation opportunity spectrum categories. This increases all aspects of impacts to wildlife, from harassment, to dogs, to the potential for introduction of non-native species. One offset to this damage is the ability within semi-primitive motorized to include some basic sanitation facilities. This can allow higher levels of visitor use with less contamination of water sources with human waste, less ground disturbance from catholes, and less littering with toilet paper when compared to areas with similar visitor use numbers but no sanitation facilities.

GMUG National Forests Land Management Plan Draft Environmental Impact Statement: Volume 1
217
Impacts to Wildlife from Managing for Roaded Natural Settings
Recreation in areas designated as roaded natural probably have the highest impact to wildlife of any in the plan area because of higher visitor use and because there is very little area classified as the more developed rural setting. Some direct mortality of wildlife will occur as roadkill, as the roads in this area are typically in better condition, allowing for higher speeds. Greater visitor use, campgrounds, picnic areas, and target shooting increase the probability of wildfire ignition with resultant impacts to wildlife. Wildlife near campgrounds and picnic areas can become habituated to human contact and the presence of human food, resulting in much greater human-wildlife conflict. This can also result in wildlife mortality if it becomes necessary to euthanize problem animals. Animals not euthanized may need to be relocated. Roaded areas have great potential for riparian impacts, some severe enough to result in fish kill. This can include spills and leaks from vehicles, as well as improper disposal of greywater from campsites.
Impacts to Wildlife from Managing for Rural Settings
Although human impacts to wildlife in areas designated as rural can be significant, these areas make up less than one percent of the plan area in all alternatives. These impacts are similar to what would be seen in roaded natural but with greater roadkill due to higher quality roads, and greater probability of environmental contamination from vehicle accidents. If such contamination were to occur, it could result in impacts to wildlife. Recreation opportunity spectrum settings for all alternatives are listed in table 111.
Table 111. Recreation opportunity spectrum settings for all alternatives [Reported as percentage of the GMUG National Forests]
Season
No-Action Alternative:
Current Forest Plan (percent)
Alternative B: Blended (percent)
Alternative C: Active Management
Emphasis (percent)
Alternative D: Special Area Emphasis
(percent) Summer Primitive – 12% Primitive – 11% Primitive – 11% Primitive – 27%
Summer Semi-primitive non-motorized – 48%
Semi-primitive non-motorized – 47%
Semi-primitive non-motorized – 37%
Semi-primitive non-motorized – 32%
Summer Semi-primitive motorized – 26%
Semi-primitive motorized – 28%
Semi-primitive motorized – 32%
Semi-primitive motorized – 23%
Summer Roaded natural – 14%
Roaded natural – 14%
Roaded natural – 20% Roaded natural – 18%
Summer Rural <1% Rural <1% Rural <1% Rural <1% Winter Pristine – 4% Pristine – 4% Pristine – 4% Pristine – 4% Winter Primitive – 16% Primitive – 16% Primitive – 14% Primitive – 27%
Winter Semi-primitive non-motorized – 18%
Semi-primitive non-motorized – 26%
Semi-primitive non-motorized – 12%
Semi-primitive non-motorized – 39%
Winter Semi-primitive motorized – 51%
Semi-primitive motorized – 43%
Semi-primitive motorized – 56%
Semi-primitive motorized – 20%
Winter Roaded natural – 11%
Roaded natural – 11%
Roaded natural – 14% Roaded natural – 10%
Winter Rural <1% Rural <1% Rural <1% Rural <1%

USDA Forest Service
218
Summary of Recreation Impacts to Wildlife by Alternative
Relative impacts to wildlife are summarized by alternative in table 112. Non-hunting mortality of wildlife from recreational activity would be similar across alternatives, as such mortality would be most likely in the more developed areas of the GMUG—rural and roaded natural, which only vary across alternatives by a total of 4 percent of the GMUG land area. Areas with greater vehicle access would have more human use, and that human use would be (on a per-capita basis) more impactful due to the ability to use vehicles to being in more of everything—more people, more dogs, more firewood, bigger tents, more food, more firearms and ammunition for target shooting, and many other impactful things. As shown in table 111, the current plan (alternative A) and alternative B have similar acreage in each recreation opportunity spectrum designation, with the exception of winter semi-primitive motorized and semi-primitive non-motorized settings. Alternative B would be more protective of wildlife than alternative A because it has reduced motorized use of backcountry areas in winter, equating to less harassment of wildlife. Alternative B also benefits from the Forestwide plan components common to all action alternatives, further reducing impacts to wildlife when compared to the no-action alternative. Alternative C, by contrast, would probably be the most detrimental to wildlife because it has the highest acreage open to recreational motorized use and the attendant impacts to wildlife. This includes the highest probability of harassment, human-wildlife conflict, and accidental wildfire ignition. Alternative C has more roaded area than alternative A, but alternative C also includes the plan components that are common to all action alternatives. The recreational structure of alternative D would be the most protective of wildlife because it would include less motorized use and less developed use than any other alternative. This would likely equate to less harassment of wildlife, less accidental wildfire ignition, and less human-wildlife conflict associated with animals becoming accustomed to human food.
Table 112. Relative impacts to wildlife by alternative
Alternative Relative Impact to Wildlife Alternative D (Special Area Emphasis) Least Adverse Alternative B (Blended) Slightly Adverse Alternative A (No Action) Moderately Adverse Alternative C (Active Management) Most Adverse
Habitat Connectivity
Direct, Indirect and Cumulative Effects of All Alternatives
Habitat connectivity is a key indicator for all species. Physical features affect habitat connectivity in terrestrial and aquatic ecosystems by causing barriers to effective movement. Features that may act as barriers include roads, culverts, trails, fences, and other

GMUG National Forests Land Management Plan Draft Environmental Impact Statement: Volume 1
219
developments (FW-STND-SPEC-06). Changes in vegetative or habitat structural conditions may influence the ability of a species to move across the landscape. The degree to which physical features interrupt connectivity varies depending on how permeable the feature might be or type of use associated with it (e.g., wildlife-friendly fences vs. non-wildlife-friendly fences; road or highway traffic), the size of the interruption (length, width, and height), and the type and frequency of use it receives. Landscape patterns associated with vegetative structural conditions, and changes in these conditions due to natural succession, natural disturbance processes, and management activities all potentially influence habitat connectivity. As cited by King (2021), Canada lynx may use lower-quality habitat as corridors between core habitat patches even in cases of fragmentation and disturbance (Vanbianchi et al. 2017). Maintaining habitat connectivity is particularly important for the long-term conservation of populations at the periphery of a species’ range (i.e., Canada lynx), where populations can be especially vulnerable if they experience large amounts of anthropogenic disturbance (Squires et al. 2013). Some species that tend to be habitat generalists may benefit from certain physical features, but the presence of those species indirectly impacts other species. For example, overhead transmission lines, fences, or low-use roads may not pose a physical barrier to Gunnison sage-grouse or movement of big game species, but those features may attract predators such as coyotes, foxes, or raptors that prey on sage-grouse and may increase mortality risk from fence collisions or entanglement (FW-GDL-SPEC-45 and SPEC-46). Impacts from impaired connectivity vary among species depending upon their needs. Roads and trails affect connectivity and influence animal movements due to physical disturbances from diverse recreation uses, frequency of use, and multiple modes of travel (all-terrain vehicle, dirt bike, jeep, utility terrain vehicle, full-sized vehicles, mountain bike, e-bike, horse, and foot). The current forest plan contains habitat effectiveness requirements (which vary by management area) that are applied to open motorized routes. Habitat effectiveness is determined by evaluating road density and amount of use (average daily traffic estimated by road type). The current forest plan defines road density as the average adjusted miles of open road and motorized trails per 640 acres in a fourth-order watershed. Adjusted miles are calculated by multiplying the miles of road type by their coefficients (see the GMUG National Forests Amended Land and Resource Management Plan 1991, p. III-76, section III). Coefficients range from 0.0 to 1.0. The higher the average daily traffic, the higher the coefficient. The sum of average adjusted miles is then compared to data in a table in the current forest plan (p. III-76, section III) to determine habitat effectiveness in relation to the habitat effectiveness standards required for certain management areas. The proposed forest plan applies new science developed since the current forest plan was amended in 1991, which factors in the effects from both motorized and non-motorized routes. The proposed plan would apply a route density standard for all routes, rather than a habitat effectiveness standard for motorized routes, in all wildlife management areas (MA-STND-WLDF-02). The current forest plan contains five management area designations that require working toward a minimum habitat effectiveness of 60 to 90 percent for elk (varies across management areas with the 4B and 5A Management Areas being the most restrictive). This equates to an adjusted motorized route density of 0.25 mile per square mile to achieve 90 percent effectiveness, 0.5 mile per square mile to achieve 80 percent effectiveness, and
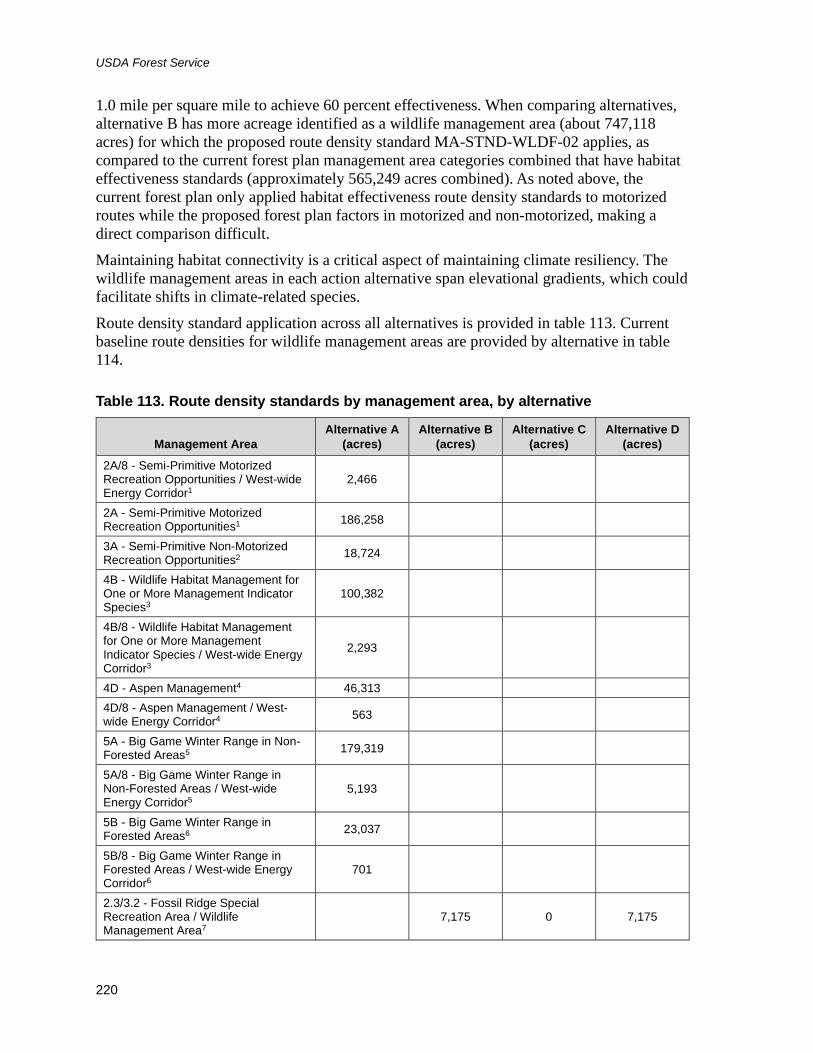
USDA Forest Service
220
1.0 mile per square mile to achieve 60 percent effectiveness. When comparing alternatives, alternative B has more acreage identified as a wildlife management area (about 747,118 acres) for which the proposed route density standard MA-STND-WLDF-02 applies, as compared to the current forest plan management area categories combined that have habitat effectiveness standards (approximately 565,249 acres combined). As noted above, the current forest plan only applied habitat effectiveness route density standards to motorized routes while the proposed forest plan factors in motorized and non-motorized, making a direct comparison difficult. Maintaining habitat connectivity is a critical aspect of maintaining climate resiliency. The wildlife management areas in each action alternative span elevational gradients, which could facilitate shifts in climate-related species. Route density standard application across all alternatives is provided in table 113. Current baseline route densities for wildlife management areas are provided by alternative in table 114.
Table 113. Route density standards by management area, by alternative
Management Area Alternative A
(acres) Alternative B
(acres) Alternative C
(acres) Alternative D
(acres) 2A/8 - Semi-Primitive Motorized Recreation Opportunities / West-wide Energy Corridor1
2,466
2A - Semi-Primitive Motorized Recreation Opportunities1 186,258
3A - Semi-Primitive Non-Motorized Recreation Opportunities2 18,724
4B - Wildlife Habitat Management for One or More Management Indicator Species3
100,382
4B/8 - Wildlife Habitat Management for One or More Management Indicator Species / West-wide Energy Corridor3
2,293
4D - Aspen Management4 46,313 4D/8 - Aspen Management / West-wide Energy Corridor4 563
5A - Big Game Winter Range in Non-Forested Areas5 179,319
5A/8 - Big Game Winter Range in Non-Forested Areas / West-wide Energy Corridor5
5,193
5B - Big Game Winter Range in Forested Areas6 23,037
5B/8 - Big Game Winter Range in Forested Areas / West-wide Energy Corridor6
701
2.3/3.2 - Fossil Ridge Special Recreation Area / Wildlife Management Area7
7,175 0 7,175

GMUG National Forests Land Management Plan Draft Environmental Impact Statement: Volume 1
221
Management Area Alternative A
(acres) Alternative B
(acres) Alternative C
(acres) Alternative D
(acres) 3.2 - Wildlife Management Area7 308,809 27,372 313,200 3.2/3.1 - Wildlife Management Area / Colorado Roadless Area7 431,134 9,020 309,885
3.3 - Special Management Area 0 0 119,482 Total 565,249 747,118 36,393 749,743
1 2A Management Area (MA) standard (p. III-104): Do not exceed an average open local road density of 2 miles per square mile in fourth-order watersheds. Do not exceed an average motorized trail density of 4 miles per square mile on fourth-order watersheds. Do not exceed an average motorized trail density of 2 miles per square mile in non-forested areas of fourth-order watersheds.
2 3A MA standard (p. III-112): Work toward a minimum level of 80 percent habitat effectiveness for elk. (0.5 mile per square mile average adjusted miles of open motorized routes).
3 4B MA standard (p. III-118): Work toward a minimum level of 90 percent habitat effectiveness for elk. (0.25 mile per square mile average adjusted miles of open motorized routes).
4 4D MA standard (p. III-123): Work toward a minimum level of 60 percent habitat effectiveness for elk. (1.0 mile per square mile average adjusted miles of open motorized routes).
5 5A MA standard (p. III-129): Work toward a minimum level of 90 percent habitat effectiveness for elk. 6 5B MA standard (p. III-137): Work toward a minimum level of 80 percent habitat effectiveness for elk. 7 Proposed wildlife management area standard MA-STND-WLDF-02: To maintain habitat function and provide security habitat
for wildlife species by minimizing impacts associated with roads and trails, there shall be no net gain in system routes, both motorized and non-motorized, where the system route density already exceeds 1 linear mile per square mile, within a wildlife management area boundary. Additions of new system routes within wildlife management areas shall not cause the route density in a proposed project’s zone of influence to exceed 1 linear mile per square mile. Within the Flattop Wildlife Management Area on the Gunnison Ranger District, there shall be no new routes. Exception: this does not apply to administrative routes (see appendix 12 of the proposed forest plan, Footnotes Regarding Best Available Scientific Information for further detail).

USDA Forest Service
222
Table 114. Baseline route density for wildlife management areas, by alternative [Route densities currently exceeding the MA-STND-WLDF-02 threshold of 1 mile per square mile would be restricted to no net gain in trail routes. Calculated with a vector method in GIS.]
Alternative B Alternative B Alternative C Alternative C Alternative D Alternative D
Wildlife Management Area Acres to
nearest 100
Route Density (miles per
square mile) Acres to
nearest 100
Route Density (miles per
square mile) Acres to
nearest 100
Route Density (miles per
square mile) Almont Triangle Corridor North 37,500 0.8 N/A N/A 15,400 1.4 Battlements 24,800 0.9 N/A N/A 24,800 0.9 Calamity to Unaweep 28,600 0.9 N/A N/A 40,300 1.6 Carbon Creek Corridor 10,600 0.5 N/A N/A 200 12.5 Chalk Mountain/Flattops 75,700 0.4 N/A N/A 57,100 0.6 Cottonwoods 35,300 0.9 N/A N/A 35,300 0.9 Currant Creek 10,800 0.2 N/A N/A 10,800 0.2 Dawson Gulch Montane/Sargents Corridor 29,100 0.7 N/A N/A 29,200 0.7
Dyer Creek Montane N/A N/A N/A N/A 20,200 1.2 Eddiesville Montane 12,400 1.1 N/A N/A 9,900 1.2 Flat Top 29,300 0.7 28,900 0.7 N/A N/A Forest Hill Montane 25,500 0.7 N/A N/A 6,900 1.2 Fossil Ridge WMA 7,200 2.1 N/A N/A 7,200 2.1 High Mesa 17,000 1.2 N/A N/A 17,000 1.2 High Mesa/Baldy 2,900 1.4 N/A N/A 500 2.9 Horsefly 25,700 1.0 N/A N/A 6,800 0.2 Kannah Creek Drainage 34,500 0.8 N/A N/A 34,500 0.8 Kelso Mesa/Middle Point 44,600 0.9 N/A N/A 26,600 0.9 Lands End-Lamborn Montane N/A N/A N/A N/A 4,100 2.2 Lands End Lower Montane 5,300 1.0 N/A N/A 9,600 0.8 Little Cimarron N/A N/A N/A N/A 14,600 0.8 Lizard Head Alpine 12,400 1.9 N/A N/A 11,800 2.3

GMUG National Forests Land Management Plan Draft Environmental Impact Statement: Volume 1
223
Alternative B Alternative B Alternative C Alternative C Alternative D Alternative D
Wildlife Management Area Acres to
nearest 100
Route Density (miles per
square mile) Acres to
nearest 100
Route Density (miles per
square mile) Acres to
nearest 100
Route Density (miles per
square mile) Lone Cone 12,200 0.7 N/A N/A 4,700 0.1 Long Canyon-Campbell 23,300 1.9 N/A N/A 34,700 1.6 Mesa Seco Alpine 14,500 0.6 N/A N/A 14,500 0.6 Naturita Canyon 7,400 0.7 7,400 0.7 2,800 1.5 Roubideau 33,300 1.3 N/A N/A 40,500 1.7 Sanford Creek Montane 13,000 0.9 N/A N/A 13,000 0.9 Sawtooth Montane 34,900 0.4 N/A N/A 12,800 1.2 Signal Peak/South Almont 19,500 1.2 N/A N/A N/A N/A Soap Creek Corridor 16,400 0.6 N/A N/A 12,500 0.7 South Uncompahgre Plateau 3,100 1.7 N/A N/A 3,100 1.7 Turret Ridge 4,100 0.0 N/A N/A 4,100 0.0 Upper Tabeguache/Cottonwood 59,200 0.9 N/A N/A 89,200 1.0 West Elk South Montane 13,600 0.0 N/A N/A N/A N/A Windy Point 11,800 0.2 N/A N/A 11,800 0.2 Yellow Mountain 11,700 N/A N/A 1,400 0.2

USDA Forest Service
224
An example of a concept to help inform decisions on new trail development and to achieve desired conditions per MA-DC-WLDF-01 and SPEC-01, to meet standard MA-STND-WLDF-02, and to accomplish objectives per SPEC-03 and MA-OBJ-WLDF-03 is shown in figure 16, which illustrates identical trail densities but varied distribution. Depending on wildlife connectivity needs, there may be areas where we manage trail distribution to be more concentrated (right side) to maintain larger wildlife security areas (discussed farther below) or to avoid migration corridors, and other areas where we manage for more dispersed trail distribution (left side) to maintain low route density.
Figure 16. Schematic diagram of trail density concept
Unique to alternative D, Special Management Area MA 3.3 has varied forest plan direction for each unique special management area in terms of the kinds of travel suitability determinations allowed (identified in table 17 of the draft revised forest plan). Travel suitability ranges from allowing or not allowing over-snow vehicle, motorized, or mechanized travel, and prohibiting new or limiting new over-snow vehicle, motorized, or mechanized travel. This direction varies across 22 unique special management areas. With few exceptions, most special management areas do not allow new route development or limit new route development. For those, we anticipate that the effects of a special management area designation would have similar effects to wildlife as compared to those same acreages that would otherwise be included in the wildlife management area under alternative B. For those few special management areas that allow new motorized and mechanized route construction without restrictions, impacts to wildlife could include reduced wildlife security areas, reduced connectivity causing changes in species distribution and movement patterns, habitat impacts (new routes could add vectors for invasive plants), and species avoidance depending on frequency and timing of route use. A difference between alternatives with implications for Gunnison sage-grouse is that the Flat Top Wildlife Management Area in alternative B prohibits any new route development, but the Flat Top Special Management Area in alternative D allows for limited new mechanized routes. The Flat Top area is Gunnison sage-grouse designated critical habitat and the largest

GMUG National Forests Land Management Plan Draft Environmental Impact Statement: Volume 1
225
area of occupied contiguous Gunnison sage-grouse habitat on the GMUG National Forests. New routes allowed in alternative D could add habitat and disturbance impacts that alternative B would prevent. Alternative C would apply the route density standard to the least acreage as compared to all other alternatives (approximately 1 percent of the plan area vs. 25 and 21 percent for alternatives B and D, respectively). Depending on the mode of travel and frequency of use, big game species may be disturbed or displaced from using habitat adjacent to roads and trails when human use occurs. Studies (primarily on elk) estimate avoidance distances from trails and roads depending on the type of use (Wisdom et al. 2018, Preisler et al. 2013, Ciuti et al. 2012, Rogala et al. 2011, Naylor et al. 2009, Wisdom et al. 2005). Forestwide Desired Condition FW-DC-SPEC-12 is based on these study findings. In 2018, the GMUG National Forests coordinated with Colorado Parks and Wildlife on a spatial analysis identifying road and trail displacement distances on mule deer and elk, informed from the peer-reviewed scientific publications referenced above. Displacement distances were applied to all open routes in the GMUG National Forests. We applied a 660-meter avoidance distance for non-motorized routes (foot, horse, and mountain bike) and a 1-kilometer (1,000-meter) avoidance distance for motorized routes. This analysis informed us in identifying potential wildlife security areas, defined as areas greater than 250 acres with no roads or trails and outside of the potential road and trail displacement buffers. Approximately 30 percent (902,112 acres) of the GMUG National Forests provide security areas. Security areas contribute to habitat connectivity in the GMUG National Forests (figure 17). Maintaining or increasing security areas would maintain or improve habitat connectivity, support animal movements, provide migration corridors, and provide hiding cover/refuge from disturbances associated with roads and trails.

USDA Forest Service
226
Figure 17. Motorized and non-motorized routes, route displacement buffers, and wildlife security areas in the GMUG National Forests
The 660-meter avoidance distance for non-motorized routes comes primarily from the Wisdom et al. (2018) publication, which is based on experiments conducted at the USDA Forest Service Starkey Experimental Forest and Range in northeast Oregon. We believe this publication currently represents the best available scientific information. We acknowledge the following limitations: it may actually underestimate the avoidance distance of non-motorized routes in many instances for the following reasons: 1) the elk population at Starkey is not hunted, 2) the "treatment" in the experimental design involved extremely low trail use (two trips per day), and this level of use is significantly lower compared to high-use areas in the GMUG, 3) the experiment occurred in an enclosure that may have limited travel/avoidance distances, and 4) the vegetation cover and topography in the enclosure provides relatively good hiding cover compared to some areas in the GMUG. Wisdom acknowledges these limitations in the paper. The 1-kilometer avoidance distance for motorized routes comes from the body of scientific literature on mule deer and elk avoidance of roads. It is also supported by the Hebblewhite (2008) synthesis (1,131-meter average avoidance distance for multiple big game species) and the Wisdom et al. (2018) paper (879-meter all-terrain vehicle avoidance by elk but acknowledging 0.5 to 1.5-kilometer avoidance for most motorized routes). Future management actions across all action alternatives would be evaluated for consistency with desired condition FW-DC-SPEC-12 by considering how activities affect security areas. Maintaining security areas and increasing their size and distribution when opportunities allow would contribute to meeting this desired condition and would be consistent with Forestwide guideline SPEC-16 (consider travel route re-alignment options to create larger

GMUG National Forests Land Management Plan Draft Environmental Impact Statement: Volume 1
227
contiguous habitat blocks and security areas), meet specific wildlife management area direction (MA-STND-WLDF-02), contribute to meeting the Forestwide desired conditions for ecosystem connectivity (ECO-05) and range (RNG-01), and be consistent with the Forestwide objective for native species diversity (SPEC-03). The proposed forest plan applies management approaches consistently across all action alternatives that would seek opportunities to work with State and Federal land management agencies and private landowners to improve connectivity between large contiguous blocks of habitat (>500 acres). Our modeled wildlife security areas could be used to inform and apply habitat connectivity management approaches. The wildlife security areas identified in the GMUG National Forests could inform management approaches by aiding in identifying contiguous blocks of undisturbed habitat and opportunities to improve connections between them. Wildlife security areas, combined with wildlife management area polygons and other protected areas such as designated wilderness and Colorado roadless areas, are integral to maintaining connectivity for a variety of species, not just within the boundaries of the GMUG National Forests but across multiple jurisdictions. The proposed forest plan includes a holistic, coordinated management approach with the Federal Highway Administration, Colorado Department of Transportation, Colorado Parks and Wildlife, other Federal land management agencies, local communities, and stakeholders to identify priority linkage areas (Beier et al. 2008; Hoctor et al. 2007; Meiklejohn et al. 2010) and improve habitat connectivity, reduce wildlife-vehicle collisions, provide for aquatic organism passage, and increase highway permeability (Native Species Diversity, General Species Diversity section). To facilitate wildlife movement across ownerships, the GMUG National Forests, under the proposed forest plan and across all action alternatives, would seek opportunities to work with other Federal, State, and private landowners to improve connectivity to large contiguous blocks of habitat (>500 acres). Keeley et al. (2018) demonstrates an example for a connectivity implementation process that could serve as a framework for the GMUG National Forests and partners to tier to. An example of a framework demonstrating the process of connectivity implementation, recognizing the importance of social processes to advance habitat connectivity to conserve biodiversity and resilient landscapes, is shown in figure 18.

USDA Forest Service
228
Figure 18. Habitat connectivity framework
Proposed forest plan direction would reduce impacts associated with physical features and maintain or improve connectivity consistent with the 2012 Planning Rule. A Forest Service Washington Office memorandum describes the importance of National Forest System lands that provide migration corridors, spawning habitats, wetlands, summer range, and winter range (French 2020). Conserving migratory corridors for elk, mule deer, and pronghorn, and improving winter range conditions, is most effectively accomplished through coordination with our State partners and adjacent Federal land management agencies holistically across the landscape (i.e., Colorado Executive Order D 2019 011 and Department of the Interior Secretarial Order 3362). Forestwide direction related to connectivity does not vary among the action alternatives, but differences in management area allocations influences connectivity effectiveness (table 115).
Table 115. Effects of management areas on habitat connectivity for all alternatives [Existing designated wilderness is not included in this table because it remains the same for all alternatives.]
No-Action Alternative Alternative B Alternative C Alternative D
Acres of recommended wilderness None 34,128 None 306,338
Percent of recommended wilderness within Colorado roadless areas
N/A 86% N/A 92%
Acres (percent) in wildlife management areas N/A 747,118 (25%) 36,393 (1%) 630,260 (21%)
Acres in special management areas None None None 119,482

GMUG National Forests Land Management Plan Draft Environmental Impact Statement: Volume 1
229
No-Action Alternative Alternative B Alternative C Alternative D
Acres of management areas beneficial to connectivity in current forest plan
565,249 N/A N/A N/A
Acres of total management area allocations that increase connectivity effectiveness
565,249 781,246 36,393 1,056,080
Relative benefit to connectivity Some More Least Most
Alternatives B and D would contribute the most to habitat connectivity due to the amount of land in wildlife management areas, special management areas, and areas to be analyzed as wilderness under those respective alternatives, which would be conducive to maintaining and improving connectivity.
Conclusion
Consistent with 36 CFR 219.9(a)(2), the effects of plan direction would maintain or restore connectivity in the plan area because proposed plan direction would maintain or restore key ecosystem characteristics necessary to support habitat connectivity, provide for connectivity through numerous plan components, and focus connectivity conservation in key areas (wildlife management areas) to facilitate species movements. Alternative D would likely provide the most connectivity benefit due to providing the greatest extent of recommended wilderness, special management areas, and wildlife management area categories, followed by alternatives B (provides wildlife management areas that benefit connectivity), A (provides multiple management areas currently with specific wildlife habitat effectiveness and habitat capability standards beneficial to connectivity), and C (provides the least amount of area that would benefit from wildlife management area-specific standards).
Cumulative Effects for General Wildlife Wildlife habitats on the GMUG National Forests are diverse and would not be converted to other land uses, and should permanently serve as wildlife habitat under all alternatives. Private lands in the planning area will likely continue to be developed, with a corresponding negative impact on wildlife habitat. Habitat loss on private land may have effects to wildlife habitat and species on adjacent national forests due to direct and indirect effects that extend beyond private land boundaries. These effects include noise, habitat loss or degradation, reduction of habitat connectivity, and area avoidance by wildlife beyond private land boundaries. Private lands make up about 6 percent (188,400 acres) of the plan area. Private lands are distributed throughout the GMUG. However, private land distribution in the plan area does not cause widescale fragmentation due to the larger contiguous areas of National Forest System lands between private land parcels. Even if most private lands in the plan area become developed in the foreseeable future where possible (topographic features and rugged terrain precludes or limits development in some cases), the surrounding National Forest System lands should continue to support wildlife needs.

USDA Forest Service
230
Given current trends in human population growth and development in Colorado and in communities in or around the plan area, increased development of private lands is likely. Increased population growth and development also leads to increased public land visitation, which elevates the need to continue to provide for wildlife habitat, connectivity, and species viability in the plan area. New technology may also impact the way national forest visitors recreate. Currently impactful new technology includes hobbyist drone aircraft (quadcopters) and E-bikes. Both of these have the ability to harass wildlife. Newer technology may also emerge that could have unanticipated impacts. The proposed plan components analyzed in previous sections should serve to meet wildlife needs and remain relevant through the life of the revised forest plan, despite increasing development and human population trends on non-federal lands.
Conclusion for General Wildlife Consistent with 36 CFR 219.9(a)(2), the effects of plan direction would maintain or restore habitat and support species persistence in all of the action alternatives. Alternative D would likely have the greatest benefit to wildlife, due to the conservation emphasis it provides from adding the greatest amount of combined recommended wilderness, special management areas, and wildlife management areas (there are more wildlife management areas in alternative B). Alternative B would benefit wildlife more than alternatives A and C, primarily due to proposing the greatest amount of wildlife management areas (25 percent of the plan area, as compared to 1 percent in alternative C and 21 percent in alternative D). Wildlife management areas would contribute to maintaining intact habitats for big game and other wildlife in the context of increasing recreational pressures. The concept of wildlife management areas is most pronounced in alternative B, adding balance to sustainable management of both wildlife and recreation. Alternative D would also add this balance through the combination of special management areas and wildlife management areas.
Air Resources
Affected Environment A detailed discussion of the affected environment of air quality is included in the assessment (USDA Forest Service 2018, air quality) and is hereby incorporated by reference. This information is summarized below for the purposes of the environmental analysis. The GMUG National Forests occur within three Colorado airsheds: 1) Central Mountains Region, including Gunnison and Hinsdale Counties, 2) San Luis Valley, including Saguache County, and 3) Western Slope Region, including Garfield, Mesa, Delta, Montrose, Ouray, and San Miguel Counties.
Air Resource Integrity Each of the three airsheds occupied by the GMUG currently comply with Federal air quality standards (CDPHE 2019). However, the Western Slope and Central Mountains Regions are projected to be the fastest growing areas of Colorado through 2020, with greater than 2 percent annual population increases, according to the Colorado Department of Local Affairs

GMUG National Forests Land Management Plan Draft Environmental Impact Statement: Volume 1
231
(CDPHE 2019). This growth has the potential to contribute to higher levels of human-caused emissions and air pollutants. Currently, we have no comprehensive emissions inventories for the administrative or permitted operations in the GMUG. However, broad emissions inventory data are available from the Intermountain West Data Warehouse (2015) Western Air Quality Study for 2011 and 2025, spanning the nine counties in which the GMUG National Forests are located. These data indicate an overall reduction in criteria air pollutant and greenhouse gas emissions from 2011 to 2025, with six minor exception. Overall, present and future reductions in emissions are expected due primarily to improved fuel efficiency of motor vehicle internal combustion engines and improved motor vehicle and industrial pollution control systems (CDPHE 2015a). However, increasing fossil fuel development and production in and near the GMUG may offset any gains in air quality improvement.
Regional Oil and Gas Development Emissions Data
The Bureau of Land Management Colorado Air Resource Management Modeling Study (CARMMS 2.0) (BLM 2017) calculated oil and gas emissions for 14 source regions that cover all of Colorado and the Mancos Shale oil and gas development in northern New Mexico for high, low, and medium development scenarios in 2025. Results for the Bureau of Land Management Grand Junction and Uncompahgre Field Office areas are most pertinent to the GMUG (table 116).

USDA Forest Service
232
Table 116. Baseline, low, medium, and high oil and gas development air pollution effects [NAAQS, National Ambient Air Quality Standards; ppb, parts per billion; PM10, particulate matter smaller than 10 microns; PM2.5, particulate matter smaller than 2.5 microns, µg/m3, micrograms per cubic meter of air; the CARMMS study (BLM 2017) used 71 ppb for comparison rather than 70 ppb because the Environmental Protection Agency recommends rounding 8‐hour ozone design values to the tenths digit until the last step in the calculation when the final base or future design value is truncated to the nearest ppb]
NAAQS Criteria Pollutant NAAQS
Standard Baseline (2011) Low Development
Scenario (2025) Medium Development
Scenario (2025) High Development
Scenario (2025) Fourth highest 8-hour average daily maximum O3 (ozone) 70 ppb
Garfield County 65.0 ppb Mesa County 67.0 ppb
Garfield County 57.4–60.3 ppb Mesa County 62.9–63.7 ppb
Garfield County 56.6–63.4 ppb Mesa County 62.5–64.6 ppb
Garfield County 56.6–63.8 ppb Mesa County 62.5–64.8 ppb
Eighth highest daily average PM2.5 concentration (particulate 2.5 microns)
35 µg/m3 GMUG area 1–5 µg/m3 GMUG area 1–5 µg/m3 GMUG area 1–5 µg/m3 GMUG area 1–5 µg/m3
Annual average PM2.5 concentration (particulate 2.5 microns)
12 µg/m3 GMUG area 1–2 µg/m3 In some areas, slight increase to 2–4
GMUG area 1–2 µg/m3 In some areas, slight increase to 2–4
GMUG area 1–2 µg/m3 In some areas, slight increase to 2–4
GMUG area 1–2 µg/m3 In some areas, slight increase to 2–4 µg/m3
Second highest daily PM10 concentration (particulate 10 microns)
150 µg/m3 GMUG area 1-10 µg/m3 In some areas 25–50 µg/m3
Not analyzed Not analyzed GMUG area 1–10 µg/m3 In some areas 25–50 µg/m3
Fourth highest 1-hour daily maximum SO2 concentration (sulfur dioxide) 75 ppb
GMUG area generally 1 ppb Most of the western area is 1–5 ppb
Not analyzed Not analyzed GMUG area generally 1 ppb In some western areas 1–5 ppb
Second highest 3-hour block average SO2 concentration (sulfur dioxide)
Not listed in CARMMS 2.0
GMUG area 1–10 ppb Not analyzed Not analyzed GMUG area 1–10 ppb
Eighth highest 1-hour daily maximum NO2 concentration (nitrogen dioxide)
100 ppb GMUG area 1–5 ppb In some areas 5–20 ppb
GMUG area 1–5 ppb In some areas 5–20 ppb
GMUG area 1–5 ppb In some areas 5–20 ppb
GMUG area 1–5 ppb In some areas 5–30 ppb

GMUG National Forests Land Management Plan Draft Environmental Impact Statement: Volume 1
233
Local Emissions Data
As noted above, while the State of Colorado forecasts overall improving air quality over the next decade, these gains may be offset by increasing fossil fuel development and production in and near the GMUG. According to reasonably foreseeable development scenarios from the Bureau of Land Management Grand Junction and Uncompahgre Field Offices, greenhouse gases and criteria air pollutants are expected to increase over the next 10 to 20 years due to coal mining activities, oil and gas development, and other cumulative emissions.
Air Quality Monitoring in Colorado and Area Designations
In the southwest Colorado region near the GMUG area there were four non-attainment areas established for non-compliance with the 1987 PM-10 National Ambient Air Quality Standards (NAAQS). Air quality in the Aspen, Cañon City, Telluride, and Pagosa Springs non-attainment areas has improved, and all have moved to a maintenance classification and are currently in compliance with the NAAQS except for Cañon City, where there is insufficient data (EPA 2021). Currently, there are no violations to the National Ambient Air Quality Standards in the GMUG region, based on data available from 2012 through 2019 for seven counties (EPA 2021). Likewise, there are currently no documented violations of ozone standards in the GMUG area, per monitoring by the Colorado Department of Public Health and Environment. However, recent ozone monitoring data in cities in proximity to the GMUG area during the last several years shows that ozone levels remain just below the established health standard of 70 ppb. Further, the Environmental Protection Agency (EPA 2011) models indicate increased cancer rates in the Grand Junction area due to hazardous air pollutant emissions from fossil fuels development and production.
Wilderness Air Quality Values
In the GMUG National Forests, the West Elk Wilderness, La Garita Wilderness, and Maroon Bells-Snowmass Wilderness are managed as Class I airsheds, which afford the highest standards for air quality and protection under the Clean Air Act of 1963. Adjacent to the GMUG and near Montrose, Colorado, Black Canyon of the Gunnison National Park is also managed as a Class I airshed. Other airsheds and wilderness areas of the GMUG are managed as Class II airsheds (areas that may receive a greater amount of human-made pollution). Air quality data specific to airsheds in the GMUG National Forests are limited. However, the assessment (USDA Forest Service 2018, air quality) describes several adjacent or regional studies that provide some indication of air quality in wilderness areas in the GMUG. The National Park Service, Air Resources Division, compiled a report (NPS 2013) describing air quality conditions (2005–2009) and trends (2000–2009) in national parks, including Black Canyon of the Gunnison National Park (table 117).

USDA Forest Service
234
Table 117. Air quality conditions and trends at four national parks near the GMUG National Forests [Condition assessments (2005–2009) and trend results (2000–2009); Source: NPS (2013)]
National Park Service Unit Visibility
Wet Nitrogen Deposition
Wet Sulfur Deposition Ozone
Black Canyon of the Gunnison National Park
• Warrants moderate concern
• Unchanged (no statistically significant trend)
• Warrants moderate concern
• Unchanged (no statistically significant trend)
• Indicator is in good condition
• Unchanged (no statistically significant trend)
• Warrants moderate concern
• Unchanged (no statistically significant trend
Canyonlands National Park
• Warrants moderate concern
• Unchanged (no statistically significant trend)
• Warrants moderate concern
• Unchanged (no statistically significant trend)
• Indicator is in good condition
• Unchanged (no statistically significant trend)
• Warrants moderate concern
• Unchanged (no statistically significant trend)
Mesa Verde National Park
• Warrants moderate concern
• Unchanged (no statistically significant trend)
• Warrants moderate concern
• Unchanged (no statistically significant trend)
• Warrants moderate concern
• Unchanged (no statistically significant trend)
• Warrants moderate concern
• Unchanged (no statistically significant trend)
Rocky Mountain National Park
• Warrants moderate concern
• Statistically significant improving trend
• Warrants significant concern
• Statistically significant improving trend
• Warrants significant concern
• Unchanged (no statistically significant trend)
• Warrants significant concern
• Unchanged (no statistically significant trend)
The Forest Service has conducted visibility monitoring using camera images in the West Elk Wilderness (1992 to 1996) and the La Garita Wilderness (1997 to 2001) to document visibility conditions in these Class I areas. The La Garita site showed a uniform haze during more than 70 percent of the sampling period (USDA Forest Service 2006a), but these results are difficult to compare to results from the state’s more detailed study, described below. In 2015, the Colorado Air Pollution Control Division released a progress report (CDPHE 2015b) concerning regional haze, updated visibility records from the IMPROVE monitoring network representing Colorado’s Class I areas, and updated emissions for haze-related air pollutants. The report also analyzed progress toward the goals for each of the 12 Colorado Class I areas as well as new efforts to reduce air pollution in the state. Visibility conditions, compared to the 2002 baseline period (2000–2004 average), showed progress toward natural conditions at all IMPROVE monitoring sites in Colorado. From 2009 to 2013, all IMPROVE sites in Colorado achieved visibility standards for the 20 percent Best Days. During the same averaging period, 9 of the 12 Colorado Class I areas (5 of 6 IMPROVE monitoring locations) have 20 percent Worst Days visibilities (in deciviews) that are better
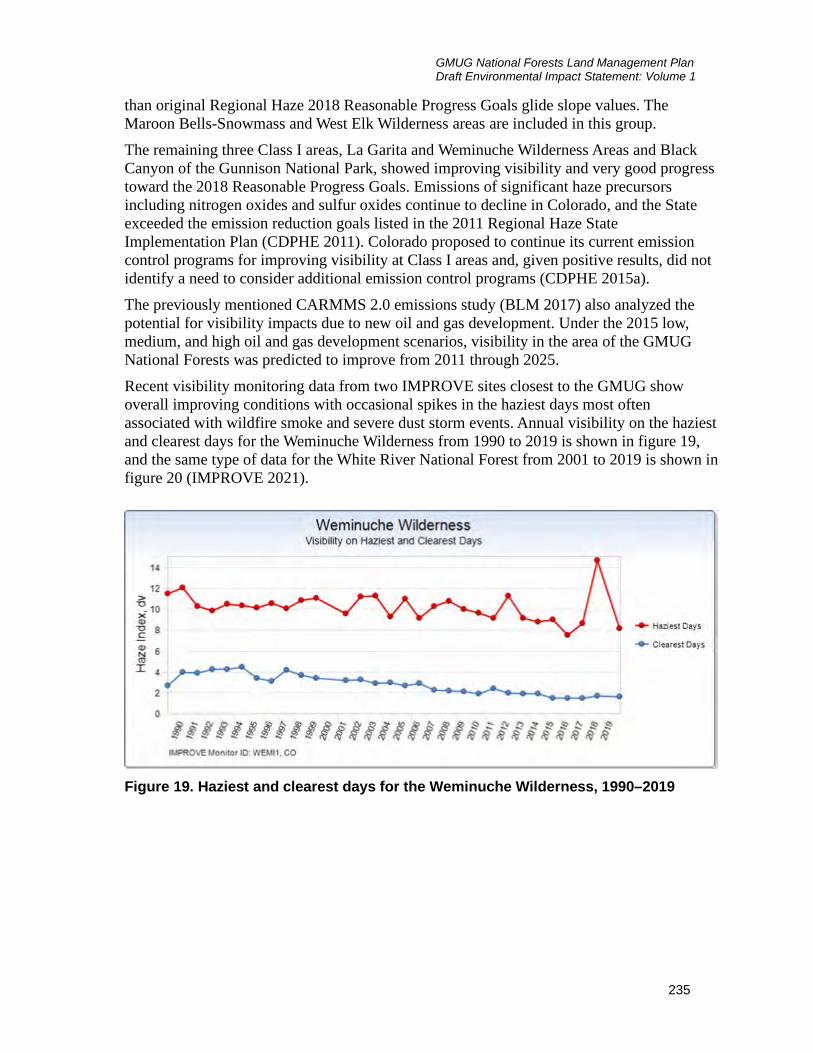
GMUG National Forests Land Management Plan Draft Environmental Impact Statement: Volume 1
235
than original Regional Haze 2018 Reasonable Progress Goals glide slope values. The Maroon Bells-Snowmass and West Elk Wilderness areas are included in this group. The remaining three Class I areas, La Garita and Weminuche Wilderness Areas and Black Canyon of the Gunnison National Park, showed improving visibility and very good progress toward the 2018 Reasonable Progress Goals. Emissions of significant haze precursors including nitrogen oxides and sulfur oxides continue to decline in Colorado, and the State exceeded the emission reduction goals listed in the 2011 Regional Haze State Implementation Plan (CDPHE 2011). Colorado proposed to continue its current emission control programs for improving visibility at Class I areas and, given positive results, did not identify a need to consider additional emission control programs (CDPHE 2015a). The previously mentioned CARMMS 2.0 emissions study (BLM 2017) also analyzed the potential for visibility impacts due to new oil and gas development. Under the 2015 low, medium, and high oil and gas development scenarios, visibility in the area of the GMUG National Forests was predicted to improve from 2011 through 2025. Recent visibility monitoring data from two IMPROVE sites closest to the GMUG show overall improving conditions with occasional spikes in the haziest days most often associated with wildfire smoke and severe dust storm events. Annual visibility on the haziest and clearest days for the Weminuche Wilderness from 1990 to 2019 is shown in figure 19, and the same type of data for the White River National Forest from 2001 to 2019 is shown in figure 20 (IMPROVE 2021).
Figure 19. Haziest and clearest days for the Weminuche Wilderness, 1990–2019

USDA Forest Service
236
Figure 20. Haziest and clearest days for the White River National Forest, 2001–2019
Sustainability of Air Resources Overall, the GMUG area has good air quality, meaning there are no chronic exceedances of national ambient air quality standards. The State of Colorado is forecasting future improving air quality conditions in the airsheds that cover the GMUG area, based on improvements in vehicle emissions efficiency and industrial processes. However, recent ozone monitoring data in cities near the GMUG area during the last several years show that maximum ozone levels remain just below the established health standard of 70 ppb. The CARMMS 2.0 study (BLM 2017) indicated improving air quality conditions in the GMUG area, from 2011 to 2025, including improvements in national ambient air quality standards, air quality related values, and visibility. Visibility is currently good and is forecasted to improve in the future. Air pollution effects to Class I and Class II airsheds are generally low, although research sources vary in their assessments and some research indicates exceedances of critical loads in the GMUG area. There are several potential emission sources that are beyond the control of the State of Colorado that may impede further visibility conditions and progress, including international and interstate pollution transport, wildfires, and regional dust storms. Air quality is affected by activities in the GMUG National Forests as well as emissions from other activities and areas in both the Rocky Mountain and Colorado Plateau regions. These activities include smoke from wildfires and prescribed burning; wind events (including secondary effects of dust on snow); dust from road construction, maintenance, and use; emissions from vehicle and equipment use; agricultural activities; and methane venting from coal mines in the GMUG. Climate change could cause an increase in air pollution and greenhouse gases. Warmer, drier summers, earlier springs, and decreasing snowpack could increase the occurrence, size, and intensity of wildfires that produce increasing amounts of particulates, carbon monoxide, ozone, hazardous air pollutants, and greenhouse gases. Increasing daytime temperatures could increase ozone impacts to human health and the environment during hot days.

GMUG National Forests Land Management Plan Draft Environmental Impact Statement: Volume 1
237
Environmental Consequences
Analysis Framework Throughout the forest plan revision process, no significant or major issues concerning air quality were raised by the public that are within the scope of the plan. To date (2018) the public has expressed concern over air quality in the GMUG at the project level as it relates to energy development, prescribed burning, and dust-on-snow wind events, and concerns about localized particulate matter as it relates to dust along roads and construction areas (GMUG Air Quality Assessment, USDA Forest Service 2018). In addition, the Forest Service has developed guidance for considering climate change in land management planning (USDA Forest Service Climate Change Considerations in Land Management Plan Revisions January 20, 2010). The 2018 air quality assessment did not analyze greenhouse gas emissions that would be produced by activities occurring in the forest from sources such as wildfires, prescribed burning, fossil fuels (development, production, processing, transportation, and end use), stationary or point sources, mobile sources (cars and trucks) and off-road mobile sources (equipment). This section addresses the effects of forest produced greenhouse gases in qualitative and quantitative terms. The air quality measurement indicators used in this report are provided in table 118.

USDA Forest Service
238
Table 118. Air quality measurement indicators [FSH, Forest Service Handbook; FSM, Forest Service Manual; NAAQS, National Ambient Air Quality Standards]
Issue Indicator Measure Legal and Policy Requirement Sources Air Quality 1
1. Current and reasonably foreseeable regional air pollution and climate change effects to human health and forest natural resources: A. Nuisance smoke and smoke management B. Human health (NAAQS) C. Regional haze D. Air quality related values
Spatial - Regional criteria air pollution sources and effects to human health and forest resources (quantitative and qualitative) Temporal – Air pollution is generally measured in tons per year of emissions and annual average air quality monitoring.
Indicator A-D. Clean Air Act National Forest Management Act 36 CFR 219.8(a)(2), National Forest System Land Management Planning FSH 1909.12 - Land Management Planning Handbook, Chapter 20 – Land Management Plan GMUG National Forests Land Management Plan FSM 2500 – Watershed and Air Management, Chapter 2580 - Air Resource Management Indicator A. FSM 5100 – Wildland Fire Management. Chapter 5140 – Hazardous Fuels Management and Prescribed Fire Colorado Department of Public Health and Environment, Air Quality Control Commission, Regulation Number 9 Open Burning, Prescribed Fire, And Permitting, 5 CCR 1001-11 (AQCC Regulation 9) Colorado Smoke Management Program Manual (CDPHE 2017) Indicator B. Colorado Department of Public Health and Environment, Air Quality Control Commission, Air Quality Standards, Designations and Emission Budgets, 5 CCR 1001-14 (Air Pollution Control Division Regulation 5-CCR-1001-14) Indicator C. Colorado Visibility and Regional Haze State Implementation Plan for The Twelve Mandatory Class I Federal Areas in Colorado, Colorado Air Pollution Control Division (CDPHE 2011) Colorado Department of Public Health and Environment, Air Quality Control Commission, Regulation Number 23, Regional Haze Limits (Air Pollution Control Division Regulation 23) Indicator D. Wilderness Act FSM 2300 - Recreation, Wilderness, And Related, Resource Management, Chapter 2320 - Wilderness Management

GMUG National Forests Land Management Plan Draft Environmental Impact Statement: Volume 1
239
Issue Indicator Measure Legal and Policy Requirement Sources Air Quality 2
2. Current and reasonably foreseeable forest produced air pollution and greenhouse gas emissions effects to human health, natural resources, and the climate: A. Nuisance smoke and smoke management B. Human health C. Regional haze D. Air Quality related values E. Climate change
Forest produced air pollution and greenhouse gas sources: • Projected wildland fire acres
(uncontrolled wildfire and wildland fire use) (quantitative and qualitative)
• Projected prescribed fire acres (quantitative and qualitative)
• Effects of forest produced air pollution emissions to human health and natural resources (qualitative)
• Effects of forest produced greenhouse gas emissions to the climate (qualitative and quantitative)
Indicators A-D Same as Above Indicator E. USDA Forest Service Climate Change Considerations in Land Management Plan Revisions January 20, 2010 (USDA Forest Service 2010d)

USDA Forest Service
240
Assumptions or Information Gaps Concerning air quality and the effects of greenhouse gases on climate change, presently there is no identified significant scientific uncertainty or disagreement regarding the issues and conclusions that follow. However, there is some uncertainty about the level of current air pollution effects to ecosystem components (air quality related values).
Management Direction The 1983 GMUG National Forests Land Management Plan and 2007 Fire Use Forest Plan Amendment followed earlier Forest Service air quality planning direction that basically directed forests to show that the plan would comply with the Clean Air Act and air quality related portions of the Wilderness Act. The 2012 Planning Rule directs the Forest Service to address air quality issues when developing, amending, or revising a forest plan. The draft revised forest plan addresses visibility in Class I areas commensurate with goals from relevant State, Federal, and Tribal implementation plans, emissions from management activities, deposition and the exposure of biophysical resources to air pollution, and smoke management (36 CFR 219.8(a)(2)(i), and FSH 1909.12, chap. 10, sec. 12.21). Oil and gas leasing availability, including surface use stipulations, remain outside the scope of forest plan revision. This will be completed in a separate and subsequent environmental analysis process. The forest plan revision does not address potential increases or decreases to vehicle use on paved or unpaved roads and trails and the topic is covered separately as travel management planning.
Forest Plan Revision 2018 Assessment Need for Change
Based on actual air quality monitoring and predictive air quality modeling, the State of Colorado is forecasting continuing improvement in compliance with human health standards (NAAQS) and visibility in Class I and II areas in the forest area into the foreseeable future. For the GMUG, a potential need for change is to establish plan direction to ensure that human health standards (NAAQS) and critical loads for air quality related values are not exceeded by cumulative future fossil fuels development and other activities on the national forests.
Effects Common to All Alternatives and Comparison of Alternatives Except for smoke and possibly mineral resource activities, under all of the alternatives, upwind regional and local non-forest air pollution sources will continue to cause the greatest air quality impacts to human health and forest ecosystem components. Forest visitor use and management activities produce very small amounts of air polluting emissions compared to interstate, state, and local county-level sources. Smoke from uncontrolled wildfires, prescribed burning, and wildland fire use will continue to produce the greatest amounts of emissions from the forest area. All other air pollution sources from the forest will continue

GMUG National Forests Land Management Plan Draft Environmental Impact Statement: Volume 1
241
to be minor compared to smoke and possibly mineral resource activities, and no significant increases are expected to occur.
Nuisance Smoke and Smoke Management
Nuisance smoke is generally public reports or complaints about smoke. Nuisance smoke can range from people seeing smoke on the horizon, to persons who are concerned about possibly being exposed to smoke, and people who are affected by smoke exposure. Smoke emissions from uncontrolled wildfires would remain unregulated, and adverse effects will continue into the foreseeable future. Uncontrolled wildfires generally produce more smoke and these emissions are less predictable compared to emissions from prescribed burning and wildland fire use. Consequently, uncontrolled wildfire smoke will have the greatest impacts to human health. For prescribed burning and wildland fire use, the State of Colorado’s Smoke Management Program is tasked with overseeing the documentation and investigation of smoke complaints and with verifying the severity of smoke impacts and the potential for exceedances of the health standards. If smoke emissions threaten to cause or cause exceedances of the human health standards, the State has the responsibility to coordinate or enforce emissions reduction actions and to provide health advisory outreach to affected communities. On the GMUG, annually during 1968-2014 about 975 to 1,291 acres were burned by wildfires, and annually during 1980-2015 about 2,259 acres were burned by prescribed fire. Under the alternatives, A would annually treat fuels by a mix of mechanical means and prescribed burning on approximately 9,050 acres; B would annually treat 11,000 acres during the first decade, and annually treat 15,000 acres during the second decade; C would annually treat 13,000 acres; and D would annually treat 5,000 acres. Alternatives B and C would produce the most smoke from prescribed burning, and consequently the most potential for nuisance smoke, followed by lesser amounts under alternatives A and D. Under alternatives A and D, emissions and nuisance smoke from uncontrolled wildfires would continue to occur at near current levels and would probably increase over time more than alternatives B and C—given the relatively fewer acres of fuels treatments—as increases to forest fuels accumulations, forest stand densities, and the departure from the natural range of variation causes potentially greater fire behavior intensity and fire size, or extent. Climate change, or global warming, is forecast to also cause an increase in the occurrence and severity of droughts, forest stand mortality, and drier and warmer fire seasons resulting in increasing wildfire intensity and extent. Under alternatives B and C, more smoke would be produced from prescribed burning and over time there would be a reduction of the amounts of smoke produced by uncontrolled wildfires compared to alternatives A and D. Alternatives A and D would have the least effect to reducing emissions from uncontrolled wildfires. The number of managed wildfires, or wildland fire use, and their extent that would occur under all alternatives is unknown and would vary based on fire weather conditions and other fire season parameters. The implementation of both prescribed burning and wildland fire use would reduce uncontrolled wildfire emissions over time, primarily in frequent fire regimes. Under all alternatives smoke emissions from prescribed burning and wildland fire use would continue to be regulated by the Colorado Air Quality Control Division through implementation of the state’s smoke management program; therefore, no exceedances of the human health standards, or NAAQS, are expected.

USDA Forest Service
242
Human Health
In addition to the smoke effects described above there are several minor sources of air pollution produced by forest management activities such as visitor use and permitted operations.
Livestock Grazing
Under all alternatives, livestock grazing would continue to encompass a maximum of 2,382,265 acres with about 51,000 permitted cattle and 27,000 permitted sheep. Livestock urine and manure have some localized impact on air quality and global warming by emitting gases into the atmosphere including carbon dioxide, methane, nitrous oxide, ammonia, and hydrogen sulfide. Livestock can also be a source of fugitive dust. Since livestock generally reside in the same airshed, impacts on a regional scale are the same regardless of where the livestock graze. Local impacts are minimal because the livestock are not often congregated together but spread out across the landscape. No significant difference among alternatives is expected.
Mineral Resource Activities
Air polluting and greenhouse gas emissions would continue from the development, production, processing, transportation, and end use of fossil fuels. Oil and gas leasing availability, including surface use stipulations, remain outside the scope of the forest plan revision. This will be completed in a separate and subsequent environmental analysis process.
Timber Harvest and Mechanical Fuels Treatments
Under alternative A the GMUG’s timber suitability area would remain at 550,000 acres, and based on average output of green sales in the past decade, a projected approximately 32,000–36,000 CCF would be produced annually. Under the action alternatives, B would designate 948,200 acres of suitable timber; C would designate 974,900 acres of suitable timber; D would designate 757,800 acres of suitable timber; and alternatives B and C would produce an estimated annual output of 55,000 CCF; and D would produce 30,000 CCF. Over the planning period, alternatives B and C would approximately double the annual timber harvest and output of wood products compared to alternative A. Dust produced by vehicles or equipment operating on unpaved roads or off road generally is localized and the dust particles typically settle back down to the ground quickly unless high winds blow the dust downwind. However, fugitive dust that is produced near populated areas can be a nuisance and may cause adverse health effects during prolonged exposure. Under all the alternatives the GMUG would continue to regulate the control of fugitive dust through contract stipulations for construction, timber harvest, and mechanical fuels reduction operations. Stipulations may require contractors to apply water or dust suppressants on unpaved roads and staging areas as needed to prevent adverse public exposure to dust. The use of timber harvest and mechanical fuels treatment equipment over the approximately at least 15-year implementation timeframe of the forest plan would include tens of gasoline and diesel fuel-powered vehicles and specialized equipment on any given day, spread out

GMUG National Forests Land Management Plan Draft Environmental Impact Statement: Volume 1
243
over a large area. Therefore the amount of emissions the equipment would produce would be insignificantly small and generally unknowable because we do not know exactly where, when and how many acres would be treated, the number of and types of vehicles and equipment that would be used, and the hours of operation. In most circumstances vehicle and equipment emissions disperse rapidly and the potential concentrations caused by only tens of vehicles and equipment would not cause NAAQS exceedances. As a means of comparison, in the air quality report for the GMUG Spruce Beetle Epidemic and Aspen Decline Management Response project, an analysis was completed that estimated the total amount of logging equipment emissions that would be produced under the proposed action over 8-12 years. For the proposed action 990,000 CCF was estimated to be harvested over the life of the project and, based on that total harvest estimate, vehicle and equipment emissions estimates were made using daily production rates. The project was forecast to harvest 82,500-123,750 CCF each year over 8-12 years compared to 55,000 CCF each year under the forest plan revision action alternatives B and C. Compared to the annual Colorado statewide non-road vehicle and equipment emissions, the amount of emissions would be insignificant (table 119) (EPA 2017). Additionally, older higher polluting equipment engines will be replaced over time with more efficient Tier 4, or next generation engines, further reducing pollutant emissions.
Table 119. Total amount of logging vehicle and equipment NAAQS and greenhouse gas emissions that would be produced by the SBEADMR proposed action compared to the annual Colorado statewide non-road vehicle and equipment emissions [Reported in tons. GHG, greenhouse gas; NAAQS, National Ambient Air Quality Standards; NMHS, non-methane hydrocarbon; VOC, volatile organic compound]
Source PM10 PM2.5 CO C02
(GHG) CH4
(GHG) NMHC or VOC NOx SO2
Total SBEADMR Emissions 0.90 0.85 75.76 245.8 0.25 NMHC
3.43 1.70 0.0022
Annual Colorado Non-Road Emissions
1,794 1,695 232,052 3,125,987 1,175 VOC 18,638 13,139 54
Visitor and Forest Management Use of Roads and Trails
The use of National Forest System roads and trails by fossil fuel-burning vehicles produces criteria air pollution (NAAQS) and greenhouse gases, and vehicle use on unpaved roads and trails produces dust. As traffic increases, so do exhaust outputs and dust. These effects are localized to the area where they occur; however, they can also contribute to regional air quality conditions. The forest plan revision does not address potential increases or decreases to vehicle use on paved or unpaved roads and trails, and the topic is covered separately as travel management planning.
Regional Haze
Visibility continues to improve, and the GMUG is expected to meet the Clean Air Act regional haze rule’s reasonable progress goals before or by 2064. Forest non-wildland fire visibility reducing emissions are expected to remain insignificant and will not significantly

USDA Forest Service
244
affect regional haze conditions in Class I and II areas. Among the alternatives, the effects of smoke impacting visibility and regional haze would follow the same path as described under nuisance smoke and smoke management above.
Air Quality Related Values
Air quality related values are affected by air pollution impacts to sensitive receptors. Sensitive receptors include water, fauna, flora, lichens, soils, and scenic vistas. The 2018 air quality assessment includes monitoring results from several national forest and park units around the GMUG area. Overall, the data show there is evidence that nitrogen and sulfur deposition has exceeded or may exceed critical loads and may begin impacting natural resources in the GMUG area, due to air pollution from increasing population growth, industrial and agricultural processes, and fossil fuels development and production. Other studies show there is moderate concern over elevated levels and the effects from ozone air pollution and arsenic, nickel, lead, and copper-zinc concentrations. These accumulation patterns suggest that at least some of the monitoring sites may be experiencing some air pollution impacts. Particularly, sites west of the Continental Divide appear to be most impacted. This pattern may be caused by the proximity of these sites to several specific air pollution sources. Under all the alternatives, non-wildland fire smoke forest emission sources would continue to cause minor effects to air quality related values in Class I and II areas. Wildland fire smoke contains nitrogen oxide, sulfur dioxide, and volatile organic compounds in lesser amounts compared to particulates and carbon monoxide, but the gases can also contribute to nitrogen and sulfur deposition and increase ground-level ozone creation and subsequent effects to vegetation. Except for wildland fire smoke emissions, regional air pollution trends and conditions essentially negate forest emissions effects because many of the air quality impacts to the GMUG come from the upwind sources like the energy production areas in northwestern New Mexico, southwestern Colorado, and southeastern Utah, as well as communities with industry such as Durango, Colorado, and Farmington, New Mexico. Due to dependence on upwind conditions and activities, there is no significant difference among alternatives related to air quality and Class I and II designated areas.
Climate Change
Currently there are no comprehensive forest emissions inventories that estimate greenhouse gas emissions exclusively from forest visitor uses and management activities. Rather, emissions inventory data are available for 2011 and 2025 for nine counties in and around the GMUG and described in detail in the 2018 air quality assessment. The inventory estimates an overall reduction in non-wildland fire smoke emissions from 2011 to 2025. Overall present and future reductions are mostly expected to result from increasing motor vehicle internal combustion engine fuel efficiency and improving motor vehicle and industrial pollution control systems. Among the alternatives, wildland fire smoke would produce the greatest amounts of greenhouse gases and would follow the same path as described under nuisance smoke and

GMUG National Forests Land Management Plan Draft Environmental Impact Statement: Volume 1
245
smoke management above. Livestock grazing, timber harvest, mechanical fuels treatments and visitor and forest management use of roads and trails would continue to produce minor greenhouse gas emissions and no significant difference among alternatives is expected.
Mineral Resource Activities
Except for wildland fire smoke, which would continue to produce the most greenhouse gas emissions, mineral resource activities would continue to produce the second greatest amount of emissions. According to the regional oil and gas development emissions and cumulative impact studies in the GMUG area (air quality assessment 2018), greenhouse gas emissions from oil and gas development are expected to increase over estimated base year emissions. An emission estimate for the 2015 Grand Junction Field Office Resource Management Plan selected alternative shows increases over the base year by approximately four times in both the short and long term. Coal mining activities are predicted to be the largest contributor to greenhouse gas emissions, followed by oil and gas development. Coal mining greenhouse gas emissions are primarily from fugitive methane emissions. The largest sources of greenhouse gas emissions within the oil and gas sector include carbon dioxide emissions from natural gas compressors and drill rig engines, and fugitive methane emissions from wellhead equipment, pneumatic devices, and tanks. Oil and gas leasing availability, including surface use stipulations, remain outside of the scope of the forest plan revision. This will be completed in a separate and subsequent environmental analysis process.
Comparison of Effects of the Alternatives Except for smoke and possibly mineral resource activities, under all the alternatives, upwind regional and local non-forest air pollution sources will continue to cause the greatest air quality impacts to human health and forest ecosystem components. Forest visitor use and management activities produce very small amounts of air polluting emissions compared to interstate, state, and local county level sources. Smoke from uncontrolled wildfires, prescribed burning, and wildland fire use will continue to produce the greatest amounts of emissions from the forest area. All other air pollution sources from the GMUG will continue to be minor compared to smoke and possibly mineral resource activities, and no significant increases are expected to occur. The alternatives are summarized in table 120.

USDA Forest Service
246
Table 120. Effects to air quality and climate change, by alternative
Resource Indicator
Alternative A No-Action Alternative
Alternative B Blended Alternative
Alternative C Active Management Emphasis
Alternative D Special Area Emphasis
A. Nuisance Smoke and Smoke Management
• From 1968-2014 wildfires burned about 975 to 1,291 acres annually
• From 1980-2015 about 2,259 acres was burned by prescribed fire annually
• 9,050 acres planned annual mechanical and prescribed fire fuels treatment
• Wildland fire use smoke continues limited by burning condition parameters
• Smoke from uncontrolled wildfires would probably increase over time compared to B and C
• Increase in prescribed fire smoke emissions
• 11,000 acres planned annual mechanical and prescribed fire fuels treatment first decade
• 15,000 acres planned annual treatment second decade
• Wildland fire use smoke continues limited by burning condition parameters
• Smoke from uncontrolled wildfires would probably decrease over time compared to A and D
• Increase in prescribed fire smoke emissions
• 13,000 acres planned annual mechanical and prescribed fire fuels treatment
• Wildland fire use smoke continues limited by burning condition parameters
• Smoke from uncontrolled wildfires would probably decrease over time compared to A and D
• Decrease in prescribed fire smoke emissions
• 5,000 acres planned annual mechanical and prescribed fire fuels treatment
• Wildland fire use smoke continues limited by burning condition parameters
• Smoke from uncontrolled wildfires would probably increase over time compared to B and C
B. Human Health
• No change in air polluting emissions from livestock grazing, visitor and management use of roads and trails
• No change in current timber harvest and mechanical fuels vehicle and equipment use emissions
• No change in air polluting emissions from livestock grazing, visitor and management use of roads and trails
• Increase in timber harvest and mechanical fuels vehicle and equipment use emissions compared to A and D
• No change in air polluting emissions from livestock grazing, visitor and management use of roads and trails
• Increase in timber harvest and mechanical fuels vehicle and equipment use emissions compared to A and D
• No change in air polluting emissions from livestock grazing, visitor and management use of roads and trails
• Timber harvest and mechanical fuels vehicle and equipment use emissions like A
C. Regional Haze
• Visibility continues to improve, and the forest area is expected to meet the Clean Air Act regional haze rule’s reasonable progress goals before or by 2064
• Visibility continues to improve, and the forest area is expected to meet the Clean Air Act regional haze rule’s reasonable progress goals before or by 2064
• Visibility continues to improve, and the forest area is expected to meet the Clean Air Act regional haze rule’s reasonable progress goals before or by 2064
• Visibility continues to improve, and the forest area is expected to meet the Clean Air Act regional haze rule’s reasonable progress goals before or by 2064

GMUG National Forests Land Management Plan Draft Environmental Impact Statement: Volume 1
247
Resource Indicator
Alternative A No-Action Alternative
Alternative B Blended Alternative
Alternative C Active Management Emphasis
Alternative D Special Area Emphasis
D. Air Quality Related Values
• Overall improvement is expected as reductions in air pollution continue
• Non-wildland fire smoke forest emission sources would continue to cause minor affects to air quality related values in Class I and II areas
• Except for smoke and possibly mineral resource activities, upwind regional and local non-forest air pollution sources will continue to cause the greatest air quality impacts to human health and forest ecosystem components
E. Climate Change
• Wildland fire smoke would produce the greatest amounts of greenhouse gases
• Livestock grazing, timber harvest, mechanical fuels treatments, and visitor and forest management use of roads and trails would continue to produce minor greenhouse gas emissions
• Wildland fire smoke would produce the greatest amounts of greenhouse gases
• Livestock grazing, timber harvest, mechanical fuels treatments, and visitor and forest management use of roads and trails would continue to produce minor greenhouse gas emissions
• Wildland fire smoke would produce the greatest amounts of greenhouse gases
• Livestock grazing, timber harvest, mechanical fuels treatments, and visitor and forest management use of roads and trails would continue to produce minor greenhouse gas emissions
• Wildland fire smoke would produce the greatest amounts of greenhouse gases
• Livestock grazing, timber harvest, mechanical fuels treatments, and visitor and forest management use of roads and trails would continue to produce minor greenhouse gas emissions

USDA Forest Service
248
Cumulative Effects Past, ongoing, and reasonably foreseeable future impacts to air quality would continue on the GMUG at similar rates over the planning period. Increases in fossil fuels extraction could increase air pollution and subsequent effects. Greenhouse gas emissions would increase from increasing uncontrolled wildfires, wildland fire use, and prescribed burning. Monitoring and modeling efforts would continue to integrate knowledge and understanding of local and regional inputs to air quality standards. Cooperation among agencies and other entities would also continue so that as monitoring results become known, adjustments or changes would be made to mitigate air quality impacts across the forest and the airshed. Cumulative effects trends are summarized in table 121.
Table 121. Cumulative air quality and greenhouse gas emissions and effects trends
Criteria Air Pollution and Greenhouse
Gas Sources Effects Trends Upwind interstate, regional and local county general sources
Impacts from large cities and local city, agricultural, and industrial emissions upwind of the GMUG will likely continue to affect air quality on the GMUG. Overall reductions in vehicle emissions and conversion of fossil fuel burning energy sources to renewable energy sources should improve air quality and reduce subsequent impacts to the GMUG over time.
Southwest Colorado fossil fuels extraction
Impacts from the energy extraction and production industry will likely continue to affect air quality on the GMUG. Reasonably foreseeable increases in production would likely increase air pollution impacts.
Southwest Colorado uncontrolled wildfires
Fire suppression, past forest management practices, and climate change are expected to continue to increase wildfire emissions into the foreseeable future.
Southwest Colorado wildland fire use
Continuing implementation of wildland fire use by Federal land management agencies may increase smoke emissions into the foreseeable future.
Southwest Colorado prescribed burning
Increases in prescribed burning by Federal land management agencies may increase smoke emissions into the foreseeable future.
Conclusion All of the alternatives are consistent with Forest Service planning direction (36 CFR 219.8(a)(2)), and the effects of plan direction would maintain or restore air quality in the plan area because:
1. Nuisance smoke and the human health effects from prescribed fire and wildland fire use would continue to be regulated to comply with the Clean Air Act through implementation of the State smoke management program.
2. Air pollution affecting human health is expected to continue to meet health standards (NAAQS) and to improve among all of the alternatives.
3. The amount of regional haze is decreasing, and visibility goals are expected to be achieved before or by 2064.
4. Air quality related values in Class I and II areas are expected to improve as air pollution is reduced over time. However, uncertainty exists about the level of current air pollution effects to ecosystem components. The situation needs to be monitored,

GMUG National Forests Land Management Plan Draft Environmental Impact Statement: Volume 1
249
and research strategies and interagency coordination may need to be addressed to assure that conditions continue to improve.
5. Except for wildland fire smoke and mineral resource activities, greenhouse gas emissions in the GMUG are expected to decrease as more fuel-efficient vehicles and equipment enter the market and fossil fuel burning energy sources are replaced by electric power.
6. Implementation of forest plan standards and guidelines would continue to maintain or improve air quality conditions, and no significant difference among the alternatives affecting air quality and climate change is expected.
Carbon Stocks
Affected Environment A detailed description of the affected environment for carbon stocks is included in the assessment (USDA Forest Service 2018, carbon) and is hereby incorporated by reference. This information is summarized below for the environmental analysis. The GMUG National Forests contain the most sequestered carbon of any national forest in the Rocky Mountain Region, which is to be expected since it is the largest unit (figure 21). Total forest ecosystem carbon in the GMUG is approximately 130 teragrams or 143,300,000 short tons, equivalent to 525,000,000 tons of carbon dioxide.
Figure 21. Total forest carbon in the Rocky Mountain Region, 2005–2013

USDA Forest Service
250
Total forest ecosystem carbon accounts for seven separate carbon pools: above-ground live tree, below-ground live tree (primarily roots), understory, standing dead trees, down dead wood, forest floor, and soil organic carbon (table 122). The GMUG National Forests have recently experienced a slight downward trend in carbon stored in live trees, while experiencing an upward trend in dead trees, likely due to contemporary aspen and spruce mortality.
Table 122. Major forest carbon pools in the GMUG National Forests, 2008–2015
Year
Live Trees, Above and Below Ground
(metric tons of carbon)
Standing Dead, Above and Below Ground
(metric tons of carbon) Soil Organic
(metric tons of carbon)
2008 57,276,824 4,201,809 35,912,640 2009 57,538,610 4,867,123 36,593,800 2010 57,453,657 5,088,287 36,830,713 2011 57,990,167 4,984,062 37,089,195 2012 57,333,414 5,106,883 36,924,822 2013 57,245,417 5,453,870 36,970,771 2014 57,199,323 5,889,619 37,123,002 2015 57,000,983 6,290,223 36,935,393
Disturbances such as timber harvest, insects and disease, and fire play an important role in the forest carbon cycle. Trends in disturbance on forestland for the GMUG during 1991–2011 are shown in figure 22. Disturbance levels from harvesting activities is fairly consistent from year to year, but fire and insects tend to fluctuate. While timber harvesting does play a role in disturbance and the carbon cycle, it is a very small percentage of changes in the overall carbon cycle of the GMUG (see Timber Resources section).
Figure 22. Major forest disturbances in the GMUG National Forests, 1991–2011

GMUG National Forests Land Management Plan Draft Environmental Impact Statement: Volume 1
251
Insect disturbance has become significantly more important since 2005, particularly with the recent beetle infestations. Large beetle outbreaks have occurred in several forests in Colorado and Wyoming, including in the GMUG National Forests. The spruce bark beetle infests all species of spruce, but is principally found in Engelmann spruce in the GMUG. It has also caused mortality in lodgepole pine. The spruce beetle may persist for decades to centuries in spruce stands as a rarely encountered, endemic insect. Under the right conditions, extensive outbreaks can occur over large areas. In 2016, 91,000 acres of the GMUG were being affected by spruce beetle activity. Cumulative acres affected by spruce beetle (1996 through 2016) total 328,000 acres, with the majority of that in the Gunnison Basin. In addition to these insect outbreaks, aspen stands are deteriorating from the impacts of sudden aspen decline on 237,000 acres of aspen in the GMUG National Forests. While no longer spreading in the GMUG, stands impacted by sudden aspen decline show significantly lower density of live overstory trees and decreased amounts of successful suckering as compared to healthy aspen stands (Worrall et al. 2015). Severely impacted stands may convert to another cover type over time if these low levels of regeneration persist. Please refer to the Landscape Disturbances section for more information on insects and disease in the GMUG.
Environmental Consequences
Analysis Framework Given the scale of effects of the proposed action (timber harvest and fuels treatments) in the context of the GMUG landscape, the effects disclosure is qualitative. The boundaries for analysis are the GMUG planning area over the next approximately 30 years.
Effects of the Alternatives Under all alternatives, an active timber and prescribed fire program would be implemented. While these activities release carbon in the short term, they may result in long-term carbon sinks as treated areas revegetate. However, the net effect is debated in the best available science. As noted in figure 22, however, the absolute percentage of national forest disturbed by timber harvest and prescribed fire on the GMUG is less than 0.5 percent; accordingly, less than 0.5 percent of GMUG carbon stocks are affected by active vegetation management. Fuels treatments would increase in alternatives B and C relative to the no-action alternative, with a corresponding slight loss of forest carbon in the near-term. The amount of forest carbon may be slightly higher in alternative D in the near-term, relative to the other alternatives, due to the nearly halved fuels treatments in that alternative. The timber program would be smaller in alternatives A and D, with potentially higher near-term carbon storage. Long-term carbon effects of both fuels and timber management are uncertain. According to a 2017 study, Carbon Sequestration in Colorado's Lands: An Integrated Spatial and Policy Analysis, “the long-term net carbon impacts of fire mitigation are debated in the literature, largely because fire mitigation generally results in short-term carbon losses or emissions. While several studies suggest potential for a long-term net carbon benefit

USDA Forest Service
252
(Hurteau and North, 2010; North and Hurteau 2011; Volkova et al. 2014), others conclude long-term net negative impacts on carbon stocks (Campbell and Ager 2013; Campbell et al. 2012; Mitchell et al. 2009). Others remain undecided about the carbon impacts of fire mitigation treatments (Reinhardt and Holsinger 2010).” It is assumed for the purposes of this analysis that the long-term effects of timber harvest on carbon stocks is also debated. Because of the uncertainty surrounding individual vegetation management project effects on carbon stocks at this time, project-level monitoring would not meaningfully inform land management. It is more meaningful to look at Forestwide stocks on a regular interval, taking into account the much greater impact of natural disturbances. However, over the very long term (centuries) for carbon, the effects of management and natural disturbances on the regional carbon balance are assumed to be neutral, assuming that similar vegetation regrows on the disturbed area and that disturbances remain the same. However, increased wildfire and drought severity and frequency due to climate change may result in the forest becoming a net source of carbon. The net effects on forest health and carbon sequestration have a high degree of uncertainty, primarily because of uncertainty in the magnitude of future climate change and the complex interactions of the forest with disturbances, changes in temperature and precipitation, and ecological processes. Two significant contributors to carbon flux are the conversion of forested land to nonforested areas and the reforestation of previously burned areas (Brandt et al. 2017). Land management practices pertinent to these factors can significantly impact forest carbon stocks. However, neither of these land use changes/practices are within the scope of the draft plan. The management action that is relevant to the plan is restocking—restocking after timber harvest in order to ensure revegetation; that is carbon that would be definitively restored in the long term.
Cumulative Effects Land-use conversions from forest to other uses is a key activity that negatively affects carbon stocks (Brandt et al. 2017). Forest lands in this plan would remain forested and would not be converted to other land uses, such as agriculture or development, and the permanent potential to serve as carbon storage would be maintained. However, private lands in the planning area will likely continue to be developed, with a corresponding negative impact on the planning area’s forest carbon stock.
Climate
Affected Environment A detailed description of the affected environment for climate is included in the Terrestrial Ecosystems Assessment (USDA Forest Service 2018) and is hereby incorporated by reference. This information is summarized below for the environmental analysis. Each of the resource sections throughout the draft environmental impact statement are predicated on this baseline information. The following information is included as part of the baseline affected environment. Climate in and of itself does not have a corresponding effects

GMUG National Forests Land Management Plan Draft Environmental Impact Statement: Volume 1
253
section, as the interactions of climate change and the forest plan are discussed in the effects sections for pertinent resources throughout the environmental impact statement.
Current and Recent Climate Climate across the GMUG National Forests is varied, due to elevations ranging from 6,000 to over 14,000 feet. The complexity of the area’s climate is reflected in the wide range of vegetation types across the GMUG. Broadly, the area can be classified as intermountain semidesert or temperate semiarid steppe. Average annual temperatures range from 35 to 50 degrees Fahrenheit (°F), and average annual precipitation ranges from 10 to 40 inches. At higher elevations, a considerable part of annual precipitation falls as snow. Summer precipitation varies spatially and by elevation and is influenced by the North American monsoon. Decades of research indicate that the Earth’s climate warmed rapidly during the 20th century, and this trend is expected to intensify in the future (USDA Forest Service 2015a; Furniss et al. 2010). Climate change-driven extreme weather events will likely have rapid, dramatic effects on ecosystems. Already observed changes in climate in Colorado include (Lukas et al. 2014):
• A statistically significant increase in mean annual temperature of 2.0 °F over the past 30 years (2.5 °F over 50 years), with daily minimum temperatures warming more than daily maximum temperatures, and temperature increases in all seasons.
• No detectable long-term (over decades) trends in mean annual precipitation or snowpack, but below-average snowpack levels in all of the state’s river basins since 2000.
• Snowmelt and peak runoff shifting earlier by 1 to 4 weeks over the past 30 years. • More severe drought conditions over the past 30 years—although there are indications
that Colorado experienced more severe or sustained droughts before 1900 than any in the observed record.
• No long-term statewide trends in heavy precipitation events or magnitude of flood events.
Specific to the GMUG National Forests, the Gunnison Basin has experienced a gradual increase in mean annual temperature from mid-century to present, similar to the statewide increase, and this trend is likely to continue.
Projected Future Climate
Future Climate Scenarios
Though climate models agree that temperatures will increase in Colorado, their projections for precipitation vary widely. To account for this uncertainty, Rondeau et al. (2017) identified three different but equally plausible future climate scenarios. The potential conditions and effects of each scenario are summarized below and in table 123. For more detailed discussion, refer to appendix G in the Terrestrial Ecosystems Assessment (USDA Forest Service 2018).

USDA Forest Service
254
A hot and dry climate would amplify effects to ecological conditions and trends associated with drought, insects and diseases, and fire. This scenario would result in the greatest impact to ecosystems in the GMUG of all three scenarios. Existing analysis highlights effects on spruce-fir, pinyon-juniper, aspen, and sagebrush ecosystems. Though system-specific analysis is lacking, all other ecosystems in the GMUG are expected to be highly impacted under this scenario. A warm and wet climate would amplify the effects of drought, insects and diseases, and fire, although to a lesser degree than the other two scenarios. Of all three scenarios, the warm and wet climate would result in the least impact to ecosystems in the GMUG. Existing analysis describes potential changes to groundwater-dependent ecosystems, grasslands, sagebrush, and pinyon-juniper ecosystems under this scenario. Though system-specific analysis is lacking, all other ecosystems in the GMUG are expected to be moderately impacted under this climate scenario, with the most significant impacts to ecosystems in the 8,500- to 9,000-foot elevation band and those affected by invasive species. Effects on ecosystems under increased variability climate are the most difficult to predict. Existing analysis highlights expected effects on sagebrush and pinyon-juniper ecosystems. Though system-specific analysis is lacking, all other ecosystems in the GMUG are expected to be impacted by this climate scenario, with the degree of impact determined by their resiliency to intense drought years. The potential effects of climate change to resources in the GMUG are summarized in table 124.
Temperature and Precipitation Trends
The trend for temperature is increased warming through the end of this century. The magnitude of warming is dependent, at least in part, on future emissions scenarios. Trends for precipitation are unknown, but even if the amount of precipitation increases, much of the southwestern United States is likely to be effectively drier. This is because any potential increase in precipitation will almost certainly fall below the amount needed to offset increases in temperature. With projected mid‐century temperatures increasing 4 °F or more under the higher emissions scenario, no areas in Colorado are projected to receive sufficient, compensatory precipitation.

GMUG National Forests Land Management Plan Draft Environmental Impact Statement: Volume 1
255
Table 123. Summary of potential future trends in climate-related variables for the GMUG National Forests [Adapted from Rondeau et al. (2017); projected changes in table are relative to climate conditions in the late 20th century (1971–2000)]
Future Climate Scenario Hot/Dry Warm/Wet Increased Variability
Summary of potential changes
• Sustained and longer duration drought: 2002‐like drought occurs every 5 years on average.
• Chronic summertime dry conditions: Summer monsoons are significantly reduced (‐20%).
• Chronic summertime heat waves: Every summer warmer compared to 2002 (5 °F above normal).
• Water availability does not change, but climate is warmer.
• Timing of snowmelt, streamflow, growing season change, but more moderate compared to other scenarios.
• Chronic flood risks because of increases in moisture and more heavy precipitation events.
• No long‐term droughts, but more frequent and intermittent severe‐drought conditions (2002 drought once per decade on average).
• Large year‐to‐year fluctuations that go from “hot and dry” to “warm and wet” conditions.
• Doubling in the frequency of alternating extreme dry and wet conditions relative to present.
Average annual temperature increase
5 °F >2 °F 2.9 °F
Average winter temperature increase
4.1 °F 3.5 °F 3.3 °F
Average spring temperature increase
3.8 °F 2.3 °F 2.2 °F
Average summer temperature increase
6 °F At lower elevations: summer days with temperature above 77 °F (25 °C) increases by about 1 month, and the number of nights with temperature above 68 °F is 10 on average.
2.8 °F At lower elevations: summer days with temperature above 77 °F (25 °C) increases by about1 week.
3.4 °F At lower elevations: summer days with temperature above 77 °F (25 °C) increases by about 2 weeks, and nights with temperature above 68 °F is 20 on average.
Average fall temperature increase
5.3 °F 2.1 °F 2.9 °F
Average annual precipitation
10% decrease 10% increase No change but large year-to-year variation
Average winter precipitation
19% increase 13% increase 6% increase
Average spring precipitation
9% decrease 6% increase 0 change
Average summer precipitation
19% decrease 8% increase 3% increase
Average fall precipitation 15% decrease 10% increase 9% decrease

USDA Forest Service
256
Future Climate Scenario Hot/Dry Warm/Wet Increased Variability
Freezing level (i.e., snowline, elevation above which ice/snow can remain year-round)
Shifts up by about 1,200 feet Shifts up by about 600 feet Shifts up by about 900 feet
Runoff volume >20% decrease Stays the same 10% decrease Timing of peak runoff Earlier by about 3 weeks Earlier by about 1 week Earlier by about 2 weeks Summer monsoon 20% decrease 10% increase Large year-to-year fluctuation Heat waves (i.e., summer like 2002)
Every summer Every 10 years on average Every 3 years on average
Severe drought duration 1 to 5 years 1 year 1 to 2 years Drought comparable to 2002/2012
More frequent (every 5th year on average) No change in frequency (every 15th year on average) but moderate increases in intensity; fewer cases of multi-year drought.
Every 10th year on average
Strong El Niño return frequency
No change No change Doubles
Wildfire Fire season widens by about 1 month; greater fire frequency (about 12x) and extent (about 16x) in high-elevation forest.
Increases in fire frequency (about 4x) and extent (about 6x).
Fire risk during dry years is very high at all elevations because of large fuel build-up from wet years; on average fire frequency increases about 8x, and area burned increases about 11x.
Dust storms Extreme spring dust events like 2009 every other year, causing snowmelt and peak runoff to be about 6 weeks earlier.
Same as current Frequency of extreme dust events increases from current, but tied to extreme dry years.
Growing season Increases by about 3 weeks Increases by about 1 week Increases by about 2 weeks

GMUG National Forests Land Management Plan Draft Environmental Impact Statement: Volume 1
257
Table 124. Resources and uses affected by climate change, potential indicators for monitoring, and direction and magnitude of potential changes
Resource/ Use Affected
Potential Indicators for Monitoring
Highly Vulnerable Resources/Uses (Neely et al. 2011 unless cited
otherwise) Direction and Magnitude of Potential Changes
Vegetation
• Species composition • Change in species
distributions (including invasive species)
• Post-disturbance regeneration
• Presence of groundwater-dependent species
• Alpine uplands (xeric and mesic) • Bristlecone-limber pine forest • Riparian ecosystems • Pinyon-juniper (CNHP 2015)
• Warming temperatures may reduce available moisture, lengthen growing seasons, and increase water demand (Lukas et al. 2014).
• Increasing temperature in spring may cause alpine plants to shift timing of flowering and leaf-out earlier, potentially leading to a mid-summer decline (Gordon and Ojima 2015).
• Longer/more severe droughts, more frequent/severe fires, more insect outbreaks and spread of non-native plant species, may lead to: o Individual trees and forested landscapes vulnerable to
insect and pathogen invasions. o Landscapes vulnerable to changes in connectivity,
shifts from carbon sinks to carbon sources, and shifts in vegetation distribution (e.g., forests shifting to grasslands) (Gordon and Ojima 2015).

USDA Forest Service
258
Resource/ Use Affected
Potential Indicators for Monitoring
Highly Vulnerable Resources/Uses (Neely et al. 2011 unless cited
otherwise) Direction and Magnitude of Potential Changes
Wildlife
• Species composition • Change in species
distributions (including non-native species)
• Boreal toad • Gunnison sage-grouse • White-tailed ptarmigan • Brown-capped rosy-finch • Snowshoe hare • Lynx • American pika • Uncompahgre fritillary butterfly • Cutthroat trout • Bluehead sucker (CNHP 2015) • Colorado pikeminnow (CNHP
2015) • Flannelmouth sucker (CNHP
2015) • Razorback sucker (CNHP 2015) • Roundtail chub (CNHP 2015) • Great Basin silverspot
Midget faded rattlesnake
• Aquatic species could decline due to rising water temperatures, more frequent and severe fires, forest fragmentation and other habitat changes (Gordon and Ojima 2015).
• Endangered fish recovery programs vulnerable to potentially reduced average streamflow (Gordon and Ojima 2015).
Aquatic habitats
• Habitat connectivity • Water temperature • Water quality • Water quantity • Bank stability • Sedimentation • Timing/volume of peak
water flows • Watershed
function/condition • Species richness and
diversity • Distribution of invasive
species
• Montane groundwater-dependent wetlands
• West Slope rivers (CNHP 2015) • Low-elevation lakes (CNHP 2015)
• Warmer stream temperatures could cause spread of non-native species and diseases to higher elevations (Lukas et al. 2014).
• Aquatic organisms and ecosystems vulnerable to lower flows and higher water temperatures, resulting in greater concentrations of pollutants (Gordon and Ojima 2015).

GMUG National Forests Land Management Plan Draft Environmental Impact Statement: Volume 1
259
Resource/ Use Affected
Potential Indicators for Monitoring
Highly Vulnerable Resources/Uses (Neely et al. 2011 unless cited
otherwise) Direction and Magnitude of Potential Changes
Rangeland resources/ livestock grazing
• Soil moisture • Regrowth following grazing • Permitted numbers • Season of use • Rangeland Health
Evaluation Matrix (R2-2200-RH) – healthy, at risk, or unhealthy? Looking at: o Abiotic Characteristics:
A-horizon, pedestalling, rills and gullies, etc.
o Rangeland Vegetation Condition: native grasses, forbs and shrubs present in normal amounts, shrub growth form, age class distribution, etc.
o Recovery Mechanisms: litter distribution, plant vigor, etc.
o Range readiness o Range condition, trend,
and changes in plant composition
• Livestock permittees • Structural range improvements,
primarily waters. If not being maintained because of non-use, it could result in fewer water sources available to wildlife.
• Native plant ecosystem, pollinators
• Ranchers potentially vulnerable to more frequent losses of forage from increasingly severe droughts (Gordon and Ojima 2015).
• Farmers and ranchers potentially vulnerable to facilities losses (structures, ditches, equipment) from extreme weather (Gordon and Ojima 2015).
• Cattle could be vulnerable to lower weight gain and other health problems due to higher temperatures (Gordon and Ojima 2015).
• Ranchers possibly vulnerable to feed price shocks from increased drought (Gordon and Ojima 2015).
• Changes in timing of precipitation may not allow grazed plants to regrow following grazing, which would result in less carbohydrate storage in vegetation and roots, potentially making plants susceptible to winter kill or unable to regrow in the spring if in poor condition following winter dormancy (Trlica 2013).
• Droughts resulting in less forage could translate into fewer permitted livestock numbers and/or shorter seasons of use. Conversely, heavy snow years may also result in shorter seasons of use due to later dates when livestock may be allowed on the national forests.
• Droughts and shifting precipitation patterns could affect the amount and quality of available water for livestock.

USDA Forest Service
260
Hydrology/ groundwater
• Water quality • Water quantity • Baseflow • Depth to water table • Soil moisture • Discharge from springs • Groundwater recharge • Subsidence • Water temperature • Volume of peak and low
flows • Timing of peak and low
flows • Presence of groundwater-
dependent species • Soil moisture • Reduction in vegetation
leading to increased erosion
• Groundwater-dependent ecosystems
• Shallow and/or unconfined aquifers
• Water supplies
• Increased groundwater use can lower baseflows in streams, spring discharge and soil moisture.
• Increased groundwater use could lower water tables, will affect groundwater-dependent ecosystem habitat quality, quantity and species composition.
• Increased groundwater use can lead to subsidence and loss of future storage.
• Warming temperatures could continue the recent trend toward earlier peak runoff and lower late summer flows (Lukas et al. 2014).
• Warmer water temperatures could cause decline in water quality indicators; reduced stream flows could increase concentrations of pollutants (Lukas et al. 2014).
• Water suppliers with inadequate storage vulnerable to earlier snowmelt timing and runoff (Gordon and Ojima 2015).
• Entities with junior water rights or little storage are potentially vulnerable to future low flows (Gordon and Ojima 2015).
• All water suppliers and customers vulnerable to longer/more intense droughts (Gordon and Ojima 2015).
• Water suppliers and private homes that rely heavily on groundwater vulnerable to potential reductions in groundwater recharge (Gordon and Ojima 2015).
• Infrastructure (older dams/ditches/canals, reservoirs in areas with high potential for wildfire) potentially vulnerable to extreme events and increased wildfire risk (Gordon and Ojima 2015).
• Agricultural producers needing late summer irrigation and some municipal / industrial utilities with junior rights may be vulnerable to earlier snowmelt timing and lower late summer flows (Gordon and Ojima 2015).
• Utilities with older treatment technology, lower treatment capacity may be vulnerable to lower flows and higher water temperatures resulting in greater concentrations of pollutants (Gordon and Ojima 2015).
• Water treatment facilities in fire-prone areas vulnerable to wildfire could lead to higher chances of erosion (Gordon and Ojima 2015).

GMUG National Forests Land Management Plan Draft Environmental Impact Statement: Volume 1
261
Resource/ Use Affected
Potential Indicators for Monitoring
Highly Vulnerable Resources/Uses (Neely et al. 2011 unless cited
otherwise) Direction and Magnitude of Potential Changes
Timber/ silviculture
• Species composition and mortality
• Insect and disease outbreaks
• Post-disturbance regeneration
Longer/more severe droughts, more frequent/severe fires, more insect outbreaks and spread of non-native plant species, may lead to: • individual trees and forested landscapes vulnerable to insect
and pathogen invasions, and • landscapes vulnerable to changes in connectivity, shifts
from carbon sinks to carbon sources, and shifts in vegetation distribution (e.g., forests shifting to grasslands) (Gordon and Ojima 2015).
Fuels/fire management
• Fuel moisture • Fire frequency and severity • Fire management options
utilized
• Potential increase in tree mortality could increase fuel loads and risk of wildfire.
• Warmer temperatures could increase frequency/severity of wildfire, make trees more vulnerable to insect infestation, and compromise water quality and watershed health (Lukas et al. 2014).
Wilderness/ special designations
Trends in: • types of visitors • season of use • types of research

USDA Forest Service
262
Resource/ Use Affected
Potential Indicators for Monitoring
Highly Vulnerable Resources/Uses (Neely et al. 2011 unless cited
otherwise) Direction and Magnitude of Potential Changes
Recreation
Trends in: • types of visitors • types of recreation activities • season of use • wildlife response to climate
shifts • location of use
Almost all types of recreation may be vulnerable, from changes in climatic conditions, seasonality, wildfire intensity and frequency, water availability, and aesthetics/viewscape (Gordon and Ojima 2015).
• Rafting, fishing, and waterfowl hunting may be vulnerable to earlier/faster runoff, reduced season length (Lukas et al. 2014, Gordon and Ojima 2015).
• Changes in reservoir storage could affect recreation on-site and downstream (Lukas et al. 2014).
• Declining snowpacks could impact winter mountain recreation and tourism (Lukas et al. 2014).
• Wildlife and wildflower viewing may be vulnerable to changing conditions and potential loss of species (marmot, pika) as climate warms (Gordon and Ojima 2015).
• Fly fishing potentially vulnerable to degraded cold water trout habitat (rising stream temperatures, declining streamflows) (Gordon and Ojima 2015).
• Skiing, rafting could be vulnerable to large swings in temperature and precipitation from year to year, and effect of such swings on perceptions of tourism / recreation in Colorado (Gordon and Ojima 2015).
• Summertime recreation and tourism opportunities may be vulnerable to wildfire (closed roads, destroyed trails/campgrounds, reduced air quality), resulting in potential visitors deciding not to travel to Colorado (Gordon and Ojima 2015).
• Potential loss in access due to damage to transportation infrastructure from disturbances (i.e., wildfire, floods) (Gordon and Ojima 2015).
• Potential increase in drought severity could negatively impact game hunting (Gordon and Ojima 2015)
Scenery
Changes in scenic character • Potentially reduced scenic value from greater drought/insect/wildfire damage (Gordon and Ojima 2015).
• Likely shift away from the snow-capped mountain aesthetic that draws many visitors (Gordon and Ojima 2015).

GMUG National Forests Land Management Plan Draft Environmental Impact Statement: Volume 1
263
Resource/ Use Affected
Potential Indicators for Monitoring
Highly Vulnerable Resources/Uses (Neely et al. 2011 unless cited
otherwise) Direction and Magnitude of Potential Changes
Engineering/ infrastructure
Types and locations of infrastructure failures
• Roads and trails, especially those that have little or no regular maintenance, are built on steep, unstable slopes, and/or are adjacent to or crossing streams (Furniss and Howe 2016)
• Infrastructure (i.e., roads, campgrounds, facilities, etc.) within 300 feet of streams or rivers, or in areas of high fuel loads (increased potential for wildfire)
• Dams, reservoirs, and water systems Culverts and cross-drains
• Reservoir operations (flood control, storage) likely vulnerable to changes in snowpack, streamflow timing (Lukas et al. 2014).
• Diversion, storage, and conveyance structures may be vulnerable to changes in the timing and magnitude of runoff (Lukas et al. 2014).
• Potential shift from snow to rain may increase erosive stress to drainage structures (i.e., culverts, cross-drains), thereby increasing the potential for erosion and road failure (Furniss and Howe 2016.)
• Potential increase in frequency and intensity of wildfires increases value of infrastructure (i.e., roads, trails, and water systems) for fire suppression and fuels reduction, and also increases the hazards of infrastructure failure or damage.
• Climate change may also affect infrastructure in other ways, including, but not limited to, thermal expansion of bridge joints, increased drought tree mortality near roads, trails, and facilities.

USDA Forest Service
264
Resource/ Use Affected
Potential Indicators for Monitoring
Highly Vulnerable Resources/Uses (Neely et al. 2011 unless cited
otherwise) Direction and Magnitude of Potential Changes
Cultural/ heritage
• Temperature change, precipitation change, soil moisture, soil chemistry, erosion or other indicators that could demonstrate potential effects to the condition of the resources
• Condition of cultural resources
Wooden buildings, structures, standing architecture, organic artifacts, ethnographic resources (culturally important plants/ animals, traditional cultural properties), cultural resources near rivers/ streams, drainages, steep slopes, high fire risk areas; essentially all cultural resources are unique and non-renewable.
• Accelerated existing threats, rapid decay of organic artifacts, increased deterioration of metal artifacts, destruction of archaeological deposits, loss of scientific data.
• Greater wildfire/erosion/flooding risk could damage cultural/historic resources.
• Increase/change in recreation patterns/land use patterns could increase erosion and vandalism.
• Loss of traditional knowledge due to loss of resources, loss of historic character, alternation/ loss of cultural landscapes/ features.
• Loss of resources may equal decrease in cultural tourism. • Potential stressors: higher temperatures, heavier downpour
events, increased recreation, increased rec season may equal increased vandalism, changes in land use, increased vulnerability to landslides due to increased rainfall/ fire, changes in vegetation, artifacts threatened by pesticides used on invasive species, deflation/ abrasion/damage from stronger winds, heat stress on culturally important plants, damage from beetle- or fire-killed tree fall, increased threat from mitigation projects / emergency cleanup.
Social/ economic
Trends in: • types of visitors • types of recreation activities • season of use or operation • types and numbers of
industries
• Industries particularly exposed to climate and extreme weather, especially agriculture, leisure and hospitality, and mining and extraction (local governments dependent on tax revenue from these industries will also be impacted, particularly those with an already high poverty rate) (Gordon and Ojima 2015).
• Recreation businesses in adjacent communities dependent on use seasonality, including, but not limited to rafting, wildflower and wildlife viewing, fishing and hunting, winter uses, etc. (Gordon and Ojima 2015).
• Earlier and/or lower runoff could complicate administration of water rights and interstate water compacts, and could affect which rights holders receive water (Lukas et al. 2014).
• Groundwater use for agriculture could increase with warmer temperatures; changes in precipitation could affect groundwater recharge rates (Lukas et al. 2014).
• Warmer temperatures could place higher demands on hydropower facilities for peaking power in summer (Lukas et al. 2014).
• Warmer lake and stream temperatures, and earlier runoff, could affect water use for cooling power plants and in other industries (Lukas et al. 2014).
• Changes in conditions impacting recreation and tourism (particularly in winter or in years of increased wildfire risk) may have economic impacts on dependent businesses and tax revenues for State and local governments.

GMUG National Forests Land Management Plan Draft Environmental Impact Statement: Volume 1
265
Resource/ Use Affected
Potential Indicators for Monitoring
Highly Vulnerable Resources/Uses (Neely et al. 2011 unless cited
otherwise) Direction and Magnitude of Potential Changes
Air quality
• National Ambient Air Quality Standards
• Wilderness Air Quality Related Values
• State Regional Haze Plan
• Potential increased frequency/intensity of wildfires would negatively impact air quality.
• Potential increased spring dust storms in hot/dry and increased variability scenarios would negatively impact air quality and visibility (regional haze).
• Increasing temperature may increase ozone levels, resulting in adverse human health impacts and potential impacts to vegetation and wildlife (Union of Concerned Scientists 2011).
Carbon stocks
• Carbon stocks • Species composition • Post-disturbance
regeneration
• Increased frequency/intensity of wildfires/insect/outbreaks would negatively impact carbon stocks, and may change Western U.S. forests from a carbon sink to a carbon source (Ryan et al. 2012, USDA Forest Service 2016)
• Increasing drought may cause conversion of aspen stands to shrublands/meadows (less carbon storage capacity), significant carbon release and positive feedback to climate change (Michaelian et al. 2011, Huang and Anderegg 2012, USDA Forest Service 2016)

USDA Forest Service
266
Invasive Species
Affected Environment A detailed description of the affected environment pertaining to invasive plants is included in the invasive plants assessment (USDA Forest Service 2018) and is hereby incorporated by reference. Detailed information regarding aquatic nuisance species is detailed in the aquatic ecosystem assessment (USDA Forest Service 2018) and is also incorporated by reference. This information is summarized below for the environmental analysis. In this analysis, the terms invasive plants and noxious weeds will be used interchangeably to describe non-native plants that meet the definition of invasive species in Executive Order 13112. Invasive plants are spread across the landscape in many ways: seeds are spread by the wind, by animals (wildlife and domestic), by vehicles (motorized and non-motorized), and by water transport. However, people are the main vector for spreading invasive plants in the GMUG. Most weeds in the GMUG are within about 2,000 feet of a disturbance: roads, trails, recreation sites, developed facilities, and other activity areas. Areas with high levels of disturbance tend to have more weeds than undisturbed areas. The forest plan can influence which areas are disturbed, what prevention measures become standard practices, and how much emphasis will be placed on weed control. The GMUG utilizes the State of Colorado noxious weed list to guide management on invasive plants, and additionally manage for its priority species (invasive species of local concern at the national forest or ranger district level). The State of Colorado Department of Agriculture ranks invasive plant species by their priority for treatment (Colorado Department of Agriculture 2020). List A species are high priority species designated by the State Agricultural Commissioner to be eradicated whenever they are found. List B species are species for which a management plan is developed to stop their spread, and management is generally prioritized. List C species are species for which the goal is to provide additional education, research, and biological control resources to jurisdictions that choose to manage these species, generally because they are already widespread, and eradication is not feasible. Management for C-listed species is determined at a local level. For example, cheatgrass (Bromus tectorum) is a priority species for the Gunnison Basin Weed Commission and the GMUG partners with them on treatment and prevention practices. The State of Colorado’s noxious weed list is available online. Impacts from non-native invasive species can occur Forestwide. Many of these species thrive on ground disturbances caused by activities including timber harvest, fire (prescribed and wild), road maintenance and construction, trail maintenance and construction, construction of range improvements, recreational livestock use, and recreational equipment use. Fluctuations in weather events, conditions, and patterns can also spread these species and increase the likelihood of a loss to native habitats. Likewise, changes to current temperature regimes, warmer temperatures, drier conditions, earlier snowmelt, and more frequent drought patterns can increase the ability of non-native species to out-compete native plants.

GMUG National Forests Land Management Plan Draft Environmental Impact Statement: Volume 1
267
The GMUG has an active program to treat non-native invasive plants. Contracts, partnerships, and agreements with other agencies and local counties are increasing the ability of the program to increase the amount of acreage inventoried and treated annually. Of additional importance is the current and predicted continuation of globalization, or the movement of goods, capital, services, people, technology, and information. Globalization processes will most likely significantly affect Colorado especially as the human population continues to grow. Globalization facilitates and intensifies the spread of invasive alien species (Meyerson and Mooney 2007). As a result, the extent and density of invasive plant infestations as well as the number of invasive plant species has the potential to increase in the GMUG.
Terrestrial Invasives Invasive plant species and inventory data for the GMUG are provided in the invasive plants assessment (USDA Forest Service 2018). A total of 39 invasive plant species occupy at least 25,500 acres in the plan area (0.008 percent of the plan area), most of which occur within 2,000 feet of a road. District rangeland management specialists believe this figure to be low and estimate that 125,000 acres are infested by invasive plants (0.04 percent of the plan area), including 100,000 acres or more on the Uncompahgre Plateau. The total acres of invasive plant infestations inventoried in the GMUG has increased by approximately 10 percent during the past 10 years. The invasibility rating for the GMUG National Forests is summarized by geographic area in table 125. The Uncompahgre Plateau Geographic Area has the highest vulnerability for future invasive plant species, with 65 percent in moderate high and high invasibility, followed by the Grand Mesa with 39 percent, Gunnison Basin with 38 percent, San Juans with 32 percent, and the North Fork Valley with 27 percent. Conversely, the North Fork Valley and the San Juans Geographic Areas have the lowest vulnerability for future invasive plant species with both 48 percent in low and moderate low invasibility, followed by the Gunnison Basin with 43 percent, Grand Mesa with 36 percent, and the Uncompahgre Plateau with 11 percent.
Table 125. Invasibility rating by geographic area
Invasibility Rating
Grand Mesa
(percent)
North Fork Valley
(percent)
Gunnison Basin
(percent)
San Juans
(percent)
Uncompahgre Plateau
(percent)
Average Invasibility (percent)
Low 15 21 21 25 2 17 Moderate low 21 27 22 23 9 21 Moderate 25 25 18 19 24 22 Moderate high 23 16 19 14 34 21
High 16 11 19 18 31 19 Total 100 100 100 100 100 100
Factors that increase habitat vulnerability to invasive plants include openings or soil fertility changes resulting from severe wildfire; openings or loss of cover from insect or disease

USDA Forest Service
268
epidemics in trees and shrubs; climate change, increasing vulnerability in areas formerly too cold for invasions; exposed soil from natural or human causes; and increased exposure to invasive plant propagules carried by people, vehicles, wildlife, or livestock. Many invasive plant species will either expand or increase, particularly in the lower-elevation grassland, shrubland, and open woodland communities as these communities become warmer and drier.
Aquatic Nuisance Species Several aquatic pathogens present in and around aquatic ecosystems in the GMUG are worth noting. These include but are not limited to Myxobolus cerebalis, Batrachochytrium dendrobatidis, and Didymosphenia geminata. The myxosporean parasite (M. cerebalis) causes whirling disease in salmon and trout, which is identifiable by spinal deformities and characteristic whirling behavior. Chytridiomycosis is the highly infectious fungal disease, caused by B. dendrobatidis, which is found among salamanders, frogs, and toads. The disease has been attributed to severe declines in frogs and especially toads in the GMUG (see at-risk species assessment, USDA Forest Service 2018). Didymo (D. geminata) is a benthic mat-forming diatom that can be thought of as the most harmful nuisance species in lotic (flowing water) systems worldwide (Blanco and Ector 2009). Although historical records suggest didymo is native to the Upper Gunnison Basin (Taylor and Bothwell 2014), it can have severe negative impacts on the structure and food web dynamics of aquatic habitats (Gillis and Chalifour 2010, Kilroy et al. 2009, Ladrera et al. 2015). Didymo has been termed an “ecological paradox” (Cullis et al. 2012) because it can rapidly produce large algal biomass under very low nutrient (oligotrophic) conditions in highly turbulent mountain streams (Kirkwood et al. 2007). Recent studies suggest that attenuated discharge favors colonization of didymo (Kirkwood et al. 2005) and that the same flushing flows associated with spring runoff and channel maintenance is a control for didymo blooms (Cullis et al. 2012). Other aquatic nuisance species that are not known to occur in the GMUG include zebra and quagga mussels, New Zealand mud snails, and invasive aquatic plants. State and Federal personnel who work in the GMUG use decontamination protocols to minimize the chance of spreading aquatic nuisance species. Decontamination protocols are also effective at limiting the spread of chytrid fungus, an organism known to contribute to the decline of boreal toad in Colorado. GMUG personnel do not monitor water bodies for the presence of aquatic nuisance species; however, all boats entering Taylor Park Reservoir, a popular destination for boaters on the Gunnison Ranger District, are inspected by Colorado Parks and Wildlife staff. The Forest Service is a partner in this inspection effort.
Environmental Consequences The analysis area for non-native invasive species and noxious weeds (hereafter ‘weeds’) includes all National Forest System lands within the GMUG. The analysis timeframe is 20 years post decision, and a qualitative discussion of certain plan components and quantitative measurements is included.

GMUG National Forests Land Management Plan Draft Environmental Impact Statement: Volume 1
269
Effects Common to All Alternatives Impacts are similar between all alternatives, including the current plan. Invasive plants will continue to have a presence in the GMUG, with existing infestations and continual introductions of new invaders. Some invasive species have become “naturalized” to vegetation communities and some level of their presence will persist in all alternatives. Canada thistle, cheatgrass, Kentucky bluegrass, smooth brome, and timothy are all examples of invasive species that have spread to many herbaceous plant communities across the GMUG. Infestations, known and yet to be discovered, are a concern for weed managers under all alternatives. Management under all alternatives would attempt to slow the spread and introductions of new invaders as well as prevent existing weed species from expanding. The GMUG will continue to conduct weed treatments with the most effective options (chemical, mechanical, cultural, and biological) as they become available and to implement mitigations such as the weed-free forage program, use of weed-free sites during fire and other incidents, and vehicle washing and inspections for contract work. Alternatives that propose relatively more amounts of timber harvest (B and C) and any associated road construction or reconstruction, and fuel treatments, could increase the amount of non-native species present (spread due to ground disturbance) and may increase the likelihood of introducing weeds into otherwise weed-free areas (again because of ground disturbance). However, this risk will continue to be mitigated by requiring contractors to wash their equipment before entering the GMUG. Likewise, anticipated increases in recreation use would cause an increased need for inspection for, and treatment of, non-native invasive species across the GMUG. The impacts of non-native invasive species to water-based recreation include a loss of revenue when areas are closed to boating or swimming due to inaccessibility or for treatment of the water. The likelihood of the introduction and spread of invasive plants increases as recreation use increases. That relationship is currently being addressed and does not need to be analyzed in depth. Under each alternative, direction for invasive plant management will continue to utilize best available science, treatment methods, and products (herbicide, biological controls, etc.) as they are developed and approved for Forest Service use.
Effects of the No-Action Alternative The current plan directs managers to use an integrated pest management program to control noxious weeds and to work with partners (other agencies and adjacent landowners) to control weeds. The effect of this has been the GMUG joining coordinated weed management areas within or adjacent to the GMUG and partnering with private landowners, non-profits, cities, towns, and counties to seek grant and other funding opportunities to work cooperatively on weed treatments.
Effects of the Proposed Action and Comparison of Alternatives The purpose of the invasive species plan components in the draft revised forest plan is to ensure that all Forest Service management activities are designed to minimize or prevent establishment or spread of invasive species on National Forest System lands, or to adjacent

USDA Forest Service
270
areas, and to provide for healthy, resilient, and resistant ecosystems. Annually, invasive species management actions are completed on at least 10 percent of inventoried acres so that new infestations are prevented; densities of existing infestations are reduced; total acres or areas infested are reduced; infested areas are restored/rehabilitated; existing infestations are contained, controlled, suppressed, or eradicated depending on infestation characteristics (size, density, species, location, etc.), management opportunities, and resource values at risk; and uninfested areas are maintained and/or protected (FW-OBJ-IVSP-02). All of the revised plan alternatives contain multiple-use resource management objectives with varying degrees of forest vegetation management. Timber production, livestock grazing, fuel treatments, wildfire, and recreational activities continue to provide endpoints for introduction and subsequent seed dispersal, as well as the environmental disturbance that enhances germination and establishment of non-native plants.
Effects of Invasive Plant Direction
Under alternatives B through D, direction for invasive plant management will utilize best available science for the prevention of, and treatment methods and products (drones, herbicide, biological controls, etc.) for, noxious weeds as they are developed and approved for Forest Service use. Management will emphasize prevention of invasives spread and invasives treatment, and must incorporate invasive plant management responsibility, funding, and accountability into all resource areas. The most effective management strategy is to focus on early detection and small infestation control strategies, and not on large infestations.
Effects of Permitted Livestock Grazing Management
Invasive species expansion may occur with the transport of seed by livestock. Seeds can be spread through livestock feces, fleeces, and hooves, and many can pass through an animal’s digestive system and retain the ability to germinate (Belsky and Gelbard 2000). Native grazers such as mule deer, bighorn sheep, moose, and elk—as well as some birds—can also perform this same method of seed spread. Conversely, prescribed livestock grazing has also been shown to be an effective method in managing some large invasive plant infestations while assisting the ecological succession process (Sheley et al. 2011). Localized areas where congregation can occur, such as water developments and supplement locations, contribute to reduced ground cover and can become potentially susceptible to invasive plant establishment. All alternatives would have equal impacts from livestock grazing relating to invasive species establishment on lands where disturbance results in reduced native plant vigor and cover. Alternatives B through D include plan components that would improve the resistance of rangeland vegetation communities to invasive species. In the long term, the revised plan alternatives would improve livestock grazing management, which in turn would promote the enhancement of desirable native plant communities. The revised plan alternatives provide plan components that would increase the resistance and resilience of native plant communities and pursue the best available invasive species management options while maintaining multiple uses such as livestock grazing.

GMUG National Forests Land Management Plan Draft Environmental Impact Statement: Volume 1
271
Effects of Vegetation, Timber, Fuels and Fire Management
Ground-disturbing activities, equipment transport and use associated with management activities such as timber harvesting, fire treatments, and fire suppression, or other authorized uses can contribute to the introduction and expansion of invasive species. Most of these risks are minimized with prevention (contract clauses to decontaminate equipment) and integrated pest management techniques, such as pre- and post-project treatments and localized site restoration and rehabilitation with native plant material. Other best management practices include pre- and post-implementation treatment of haul routes and seeding disturbed areas with native plant material after implementation to prevent establishment of infestations. The potential ground-disturbing activities associated with the overall amount of timber harvest would be similar for alternatives B and C and somewhat less for alternatives A and D, as they propose fewer acres. The potential ground-disturbing activities associated with the overall amount of fuel treatment per decade would be similar for alternatives A through C, and somewhat less for alternative D, as it proposes fewer acres. Wildfires will occur under all alternatives, although uncertainty exists as to extent and location. Weather and climatic factors along with fuels conditions would affect intensity and spread of a fire event. Effects of wildfire on invasive species spread potential is the same across alternatives. Effects of fire suppression actions that could spread non-native terrestrial and aquatic invasive species would also be the same across alternatives; however, plan components address the need for preventing spread.
Effects of Recreation Management
Many existing infestations can be found along, or have originated from, roadsides because vehicle traffic provides ideal means for noxious weed spread. Primitive two-track roads also provide opportunity for noxious weeds to become established on areas of bare soil and disturbance. If vigilant monitoring and treatments do not occur, the likelihood of noxious weeds spreading into adjacent native plant communities increases once noxious weeds establish on road or trailside prism. An even greater threat for the spread of noxious weeds is from unauthorized cross-country travel. Infestations can go undetected for years, resulting in well-established populations that are often difficult to access and more expensive to treat. In all alternatives, inadvertent seed spread could decrease in recommended wilderness and wildlife management areas (with trail caps). During road closure and decommissioning activities that require short-term ground disturbance, there could be short-term invasive plant establishment until invasive weed treatments are applied to the disturbed areas. Additionally, road closures and decommissioning make administrative access more difficult, resulting in increased expenses to treat invasive species in some areas of the GMUG. Summer motorized transport poses the greatest risk of invasive weed transport. In general, the potential for weed infestation threats would be heavily correlated to the amount of open summer motorized routes (alternative C with the most, followed by A, then B, then D).
Effects of Wilderness Designation
Generally, wilderness areas and large roadless areas are less likely to contain invasive weeds due to less widespread public access, especially via motorized means. However, these large

USDA Forest Service
272
roadless areas are vulnerable to invasive species infestation and spread from recreational and livestock use. Seed transport occurs inadvertently, by humans, dogs, pack stock, livestock, and wildlife (big and small game and birds). Trails that receive high use, including trails in wilderness areas, are vulnerable to invasive weed infestation. Areas of high use and ground disturbance occur within wilderness areas and are as vulnerable to noxious weed infestation as developed sites outside of wilderness and are more difficult to treat due to limited access.
Cumulative Effects Invasive species spread without regard to administrative boundaries. As such, the cumulative effects of GMUG invasive species management under any alternative, including the current plans, may negatively or beneficially impact adjacent Federal, State, and private lands depending upon the specific site treatment or lack thereof. Specific site conditions and weed treatment efforts on adjacent or nearby lands also would affect weed conditions and treatments on National Forest System lands. Many acres of individual and other private entity lands lie within the GMUG boundaries. Portions of the GMUG adjoin other National Forest System, Bureau of Land Management, and National Park Service lands, each with its own land management plan that addresses invasive species. In general, management of invasive species is consistent across Federal agencies due to law, regulation, and policy and plan components are relatively consistent and compatible with overall goals. Under each alternative, coordination with State and local agencies and communication with the public would continue to combat the spread of undesirable non-native invasive species. The cumulative effects of these plans in conjunction with the revised GMUG forest plan will have a beneficial cumulative effect to invasive species management.
Conclusion Consistent with 36 CFR 219.8(a)(1), the effects of plan direction would maintain or restore structure, function, and ecological integrity through the effective treatment of existing populations of invasive plants along with prevention measures applied to land uses and activities. The revised plan alternatives update the current forest plan for management of non-native invasive plants by formalizing current, effective invasive species management practices. Plan components in the revised plan alternatives would have a positive effect to slow the spread of invasive plants as well as manage existing infestations by moving toward adopting best tools and practices available in the future. Alternatives B and C have the potential to create similar and higher amounts of disturbance relating to timber harvest. Alternatives A and D have the potential to create less disturbance. Alternatives A through C have the potential to create similar and higher amounts of disturbance relating to fuel treatments. Alternative D has potential to create disturbance, but fewer acres of disturbance than alternatives A through C.

GMUG National Forests Land Management Plan Draft Environmental Impact Statement: Volume 1
273
All vegetation management projects would have plan components that prescribe best management practices that should limit the introduction of invasive species as well as implement treatment options if they are found. Alternative D, with more recommended wilderness areas (261,000 acres), would have the fewest pathways for spread by vehicles compared to alternatives A and C (no acres recommended) and alternative B (34,000 acres). All alternatives have options to implement best management practices and treat weeds in wilderness. Ultimately, consequences to invasive species from plan objectives associated with balance of funding with other resource programs or revision topics are similar under the current plan and alternatives B through D. Management activities will mitigate the risk of introduction and spread as will the early detection and rapid response approach. An aggressive integrated pest management approach must be implemented to keep invasive species from expanding beyond existing infestation levels.
Soil Resources
Affected Environment The GMUG is situated between two physiographic provinces—the Southern Rocky Mountain province to the east and the Colorado Plateau province to the west. As a result, a diverse and complex compilation of geomorphic landforms and geologic materials are present across the GMUG. Broad basins, mesas, and canyons consisting of shales and sandstones blend into the uplifted rugged basalts and intrusive igneous and volcanic materials of the mountainous areas. The soils of the GMUG are as complex and variable as the landform and geologic materials that has helped form them. The specific characteristic of a soil pedon across the GMUG depends on how the factors of climate, vegetation (organisms), relief (topography), and time have affected the geologic material (parent material). Multiple soil surveys of varying age, quality, and type cover portions of the GMUG. Each soil survey on its own might be considered as the best usable information based on its availability within an existing database. Individual soil surveys, however, vary widely in terms of mapping procedures used, accuracy and precision of map unit concepts, quality and resolution of field mapping, and ability to generate accurate soil interpretations. Natural Resources Conservation Service soil survey geographic database soils data have been published for the GMUG. Dominant soil map units include Cryoboralfs, Cryochrepts, Haplocryalfs, and Argicryolls. Parent materials are dominated by interbedded colluvium derived from sandstone and shale and/or interbedded residuum weathered from sandstone and shale; colluvium and/or slope alluvium derived from tuff and/or volcanic breccia and/or andesite and/or rhyolite and/or Quaternary mass movement deposits derived from mixed sources; slope alluvium derived from non-volcanic breccia and/or colluvium derived from non-volcanic breccia over till derived from mixed and/or alluvium derived from mixed; loess over material weathered from sandstone; and loam sandy residuum. Much of the soil on the GMUG is in a relatively undisturbed, natural condition. However, management activities including timber harvesting, mining, grazing, and recreational uses

USDA Forest Service
274
have impacted the soil resource, with timber harvesting being the greatest contributor to detrimental soil disturbance across the GMUG.
Drivers, Stressors, and Management Influences Drivers and stressors of soil resources include climate, climate change, wildfire, carbon cycling, soil erosion and loss, and weed invasion. Management influences include timber harvest activities, road management, fuels management, recreation, livestock grazing, mining, recreation activities, and restoration projects. These factors are discussed further in the watersheds, water, and soil resources assessment (USDA Forest Service 2018).
Soil Resource Integrity Erosion hazard ratings across the GMUG are listed in table 126. The most extensive areas of severe or very severe risk ratings include the steep terrain of the West Elk and San Juan mountain ranges, although notable areas also occur in the Battlements north of Collbran, and the upper East River. In contrast, the lowest ratings occur across the gentler terrain of the Uncompahgre Plateau and Grand Mesa.
Table 126. Erosion hazard ratings in the GMUG National Forests
Erosion Hazard Rating Acres Percentage of Forest Area Slight 1,025,262 28 Moderate 1,466,419 41 Severe 467,802 13 Very Severe 645,796 18
Some areas of the GMUG have characteristics (e.g., soil or bedrock features) that contribute to a greater potential for instability and therefore are considered to be more susceptible to mass failures. This includes the area in the northeastern portion of Grand Mesa and near Collbran.
Environmental Consequences
Analysis Framework The environmental consequences analysis for soil resources focuses on vegetation management activities that have measurable impacts to soils over the next planning cycle on the GMUG. The key indicators for assessing soil resources among alternatives are soil productivity based on acres of timber harvest, objectives for vegetation management, and qualitative assessment of plan components. An important factor considered in evaluating effects to soil resources is the extent of the area where long-term (over a period of decades) soil productivity might be impacted. Effects to the soils from projects are considered not significant in the GMUG when 85 percent of the activity area is unaffected and retains its potential long-term soil productivity. In other

GMUG National Forests Land Management Plan Draft Environmental Impact Statement: Volume 1
275
words, no more than 15 percent of the activity area and each individual harvest unit are affected and lose potential long-term soil productivity. Other management activities, such as dispersed recreation, livestock grazing, and mining activities can also cause ground disturbance and detrimentally impact soils. However, the scale, extent, and distribution are slight between alternatives. This programmatic land management plan analysis focuses on broadscale estimated effects related to soil productivity on National Forest System lands. The spatial analysis area for soils includes all the lands within the boundaries of the GMUG. This area represents where changes may occur because of Forest Service management actions. The temporal scope of the soils analysis assumes a time span of about 15 years, the life of the plan.
Methods and Assumptions
This analysis takes a programmatic look at the outcomes that may result from implementing the proposed management direction for each alternative over the life of the plan. For estimating effects at the programmatic forest plan level, it is assumed that the types of resource management activities allowed under the action alternatives are reasonably foreseeable future actions to achieve the Forest Service mission. Since future activity locations are not known at the programmatic forest plan level, specific spatial and temporal effects to soil productivity cannot be determined. Therefore, impacts of potential management actions are considered as indirect impacts to soil productivity. Cumulative effects from adjacent management of other Forest Service units and State and private entities would not measurably impact soil productivity for this programmatic analysis.
Management Direction Management direction under the current plan is limited to soil resources to maintain soil productivity, minimize soil erosion, and maintain the integrity of associated ecosystems. The 2012 Planning Rule broadened soil management direction, requiring plans to maintain or restore terrestrial ecosystems, described more succinctly as ecosystem services. The draft revised forest plan adds the detrimental soil disturbance protocol for vegetation management activities, allows flexibility due to new and emerging technology on managing timber harvests on steeper slopes (greater than 40 percent slope), and emphasizes the value of organic matter and coarse woody debris for soil processes. Also, the draft revised forest plan provides more strategic, adaptive direction than the prescriptive, tactical direction of the current plan.
Effects of the No-Action Alternative The no-action alternative provides limited direction for soil resources: maintain soil productivity, minimize soil erosion, and maintain the integrity of associated ecosystems. Currently, only regional direction provides guidance to follow the detrimental soil disturbance protocol in forested areas. Similarly, the slope restriction limit of 40 percent for ground-based harvest equipment has not considered new equipment and logging systems updates as does the new plan, which allows for advances in technology.

USDA Forest Service
276
Finally, current plan direction does not include adequate criteria for providing nutrients and reducing soil erosion. The new plan provides guidelines for coarse woody debris based on key ecosystem characteristics.
Maintaining Soil Productivity
Vegetation management activities would continue to produce the highest amount of ground disturbance. Under the current plan, the Forest Service Rocky Mountain Region Watershed Conservation Practices Handbook (USDA Forest Service 2006b) applies to all vegetation activity areas with field indicators for detrimental soil disturbance based on measurable field criteria.
Effects Common to All Action Alternatives and Comparison of Alternatives Overall, soils plan components in the draft revised forest plan would maintain and or improve soil productivity while allowing management flexibility with respect to mitigating soil disturbance. Draft revised forest plan direction for soils does not vary by plan alternatives. All action alternatives include the detrimental soil disturbance protocol for vegetation management activities and coarse woody debris targets. All action alternatives add soil standards and guidelines that are not present in the current plan and would move the management decisions to be more of an ecological land management approach.
Maintaining Soil Productivity
The draft revised forest plan would maintain soil productivity with stronger direction by providing desired conditions that include use of the detrimental soil disturbance protocol and organic matter with coarse woody amounts as well as broader implication of ecological functions.
Effects from Vegetation Management
Vegetation management, including timber and fuels projects, would continue as the activity having the highest impact on soil resources. Timber harvest and associated actions such as temporary roads, skid trails, landing construction, and pile burning and fuels treatments— which include mechanical treatments and prescribed burns—would continue as the management activities that produce the highest amount and level of ground disturbance that includes erosion, displacement, compaction, and soil changes due to pile burning. Timber suitability will be used to assess differences among alternatives, in relation to erosion potential. The intensity of disturbance would not vary appreciably across the draft revised forest plan alternatives, when considered in the scale of the full GMUG landscape. Alternatives B and C place more emphasis on timber production and project vegetation treatments on 4,800 acres in years 1 to 5, and 5,000 acres in years 6 to 20. This compares to 2,500 acres in years 1 to 20 for alternative D.

GMUG National Forests Land Management Plan Draft Environmental Impact Statement: Volume 1
277
Lands suitable for timber production range from 23 to 30 percent of the plan area in the draft revised forest plan alternatives. Alternative D has the lowest portion of timber-suitable soils on high erosion potential rated soils at 12 percent, followed by A, B, and C at 18 percent. Moderate soil erosion hazard is 43 percent for alternatives A, B, and C; and 44 percent for alternative D. The draft plan components would help recover the effects of timber harvest above the current plan by providing more direction on avoiding circumstances that impair soils (FW-STND-TMBR-04, FW-GDL-TMBR-08). Traditional ground-based yarding does lead to the highest soil disturbance from repeat travel and heavy loads but is excluded for these reasons from slopes greater than 40 percent. New and emerging technology in timber harvesting may increase soil disturbance over the next planning period using a mixed ground-based and skyline system on grounds with greater than 40 percent slope pitch. The use of mixed harvest systems will depend on site characteristics and operator performance, and still be subject to the 40 percent slope limit for ground-based aspects of an operation. FW-STD-SOIL-01, FW-STD-SOIL-02, and FS-GDL-01 provide plan direction to ensure that the GMUG minimizes damage to soil productivity.
Effects from Fire Management
Fire effects from wildfire and prescribed fire can have positive and negative effects on soil productivity depending on the severity of fire, site recovery potential, and erosion effects afterward. Effects from wildfire and prescribed fire will be similar across all alternatives. Alternatives B, C, and D allow for more use of fire for resource benefit than is possible under the current forest plan. Connected actions with prescribed and wildfire include the potential construction of firelines. Acknowledging that fuels treatment often requires the use of ground-based equipment, the GMUG would apply to fuels treatment the same mitigation used for timber harvest to limit the amount of soil disturbance from equipment travel. The guidelines for timber would also apply regarding retaining a minimum level of soil organic matter and groundcover (FW-GDL-SOIL-06). The levels would vary at the project level depending on fire risk, site type, and soil condition (FW-GDL-ECO-07).
Effects from Roads and Trails
Vegetation management activities may require temporary roads to access timber. Soil function would be restored on temporary roads (and decommissioned road prisms used as temporary roads) when management activities that use these roads are completed. Restoration treatments would be based on site characteristics and methods that have been demonstrated to measurably improve soil productivity. The draft revised forest plan would improve the effectiveness of these treatments by adding direction for soil restoration to temporary roads, skid trails, trails, landings, burn pile scars and non-system roads and trails. (FW-STND-SOIL-03 and FW-STND-TSTN-05). Roads and trails across the GMUG are expected to remain the same or decrease across the GMUG over time due to travel management and plan components like FW-GDL-SPEC-16.

USDA Forest Service
278
Consequences to Soils from Plan Components Associated with other Resource Programs or Management Activities
Overall, plan components associated with most of the other resource programs or management activities are complimentary to Forestwide soil resource direction in the draft revised forest plan by providing coarse and fine woody debris guidelines to prevent soil erosion (FW-DC-ECO-06), in montane-subalpine grassland ecosystems, bare soil is no more than 30 percent (FW-DC-RNG-02), soil compaction and bare ground is an indicator to address dispersed campsite issues (FW-STND-REC-080), route density is a factor in high-quality habitat blocks (reduces erosion) (FW-DC-SPEC-12), no timber harvest on lands where soils will be irreversibly damaged (FW-STND-TMBR-04), and post-fire salvage will not occur in areas with high soil burn severity (FW-GDL-TMBR-08). The plan components for other resources support management direction that protects soil resources, while at the same time efforts to protect soil productivity, provide benefits to many other resource disciplines.
Cumulative Effects On the GMUG, management activities generally result in a localized loss in soil productivity due to soil disturbance from compaction, rutting, soil displacement, erosion, unstable slopes, or alteration of soil nutrient status. Activities with the greatest long-term potential impact to soils are associated with vegetation management activities. Legacy disturbance from timber harvest and wildfire could affect the soil condition where future management activities are planned. Past actions and foreseeable future actions primarily affect soils in situ and are minimized through careful planning, design, implementation, and monitoring. Influence from adjacent management on private, State, or Federally managed areas would have immeasurable effects on site-specific soil conditions.
Conclusion The draft revised forest plan is consistent with 36 CFR 219.8(a)(2) because the effects of plan direction would maintain or restore soils and soil productivity on the GMUG. The desired conditions incorporate the need to manage for soil organic matter, including coarse woody debris, and the detrimental soil disturbance protocol. Alternative D would provide the greatest level of soils benefit, followed by alternatives B and C.
Watersheds and Water Resources
Affected Environment A detailed description of the affected environment for water resources is included in the assessment (USDA Forest Service 2018, watersheds, water, and soil resources; and supplemental groundwater reports) and is hereby incorporated by reference. This information is summarized below for the environmental analysis. Groundwater-dependent ecosystems including wetlands and streams are discussed in the Aquatic, Riparian, and Wetland Ecosystem section.

GMUG National Forests Land Management Plan Draft Environmental Impact Statement: Volume 1
279
Drivers, Stressors, and Management Influences Drivers and stressors of water resources in the GMUG include wildfire, climate, climate change, insect and disease infestations, and local human population growth and associated water use and recreational demands. Management influences include watershed and vegetation restoration projects, timber harvest, road management, livestock grazing, and recreation activities. These influence factors are described in detail in the assessment (USDA Forest Service 2018, watersheds, water, and soil resources) and are considered in this environmental analysis.
Watersheds of the GMUG The GMUG National Forests lie entirely within the Upper Colorado River Basin. Principal rivers that drain from the plan area include the Gunnison, North Fork of the Gunnison, Uncompahgre, San Miguel, and Dolores Rivers. These rivers join with the Colorado River downstream of the plan area and eventually flow into the Gulf of California. The GMUG National Forests lie within 11 sub-basins (4th-level hydrologic unit code) (table 127), 48 watersheds, and 235 subwatersheds.
Table 127. Watershed sub-basins of the GMUG National Forests [HUC, hydrologic unit code]
4th-Level HUC 4th-Level HUC Name GMUG Geographic Areas
14010005 Colorado Headwaters—Plateau Grand Mesa 14020001 East Taylor Gunnison Basin
14020002 Upper Gunnison Gunnison Basin North Fork of the Gunnison San Juan Mountains
14020003 Tomichi Gunnison Basin
14020004 North Fork Gunnison Gunnison Basin North Fork of the Gunnison
14020005 Lower Gunnison Grand Mesa Uncompahgre Plateau
14020006 Uncompahgre San Juan Mountains Uncompahgre Plateau
14030001 Westwater Canyon Uncompahgre Plateau 14030002 Upper Dolores San Juan Mountains
14030003 San Miguel San Juan Mountains Uncompahgre Plateau
14030004 Lower Dolores Uncompahgre Plateau
Water Resource Integrity
Watersheds
Of the 235 subwatersheds in the plan area, 158 are Class 1 (good) and 76 are Class 2 (fair) per watershed condition framework ratings. There are no Class 3 (poor) watersheds (figure 23). Watershed condition ratings by geographic area are summarized in table 128. The

USDA Forest Service
280
Grand Mesa Geographic Area has the highest percentage of watersheds rated as Class 1, and the North Fork of the Gunnison River has the lowest. Please refer to the assessment (USDA Forest Service 2018, watersheds, water, and soil resources) for more information on the watershed condition framework.

GMUG National Forests Land Management Plan Draft Environmental Impact Statement: Volume 1
281
Figure 23. Watershed condition classes in the GMUG National Forests

USDA Forest Service
282
Table 128. Watershed condition class ratings for watersheds in each geographic area (number of watersheds by condition class)
Geographic Area Class 1 (good)
Class 2 (fair)
Class 3 (poor)
Not Rated Total
Grand Mesa 29 8 0 0 37 Gunnison Basin 56 30 0 1 87 Gunnison Basin and North Fork of the Gunnison River1 4 0 0 0 4
Gunnison Basin and San Juan Mountains1 1 0 0 0 1 North Fork of the Gunnison River 15 12 0 0 27 San Juan Mountains 19 9 0 0 28 San Juan Mountains and Uncompahgre Plateau1 0 2 0 0 2
Uncompahgre Plateau 34 15 0 0 49 Total 158 76 0 1 235
1 Seven watersheds are located in two geographic areas.
Following are key findings from the assessment of watershed condition framework process categories across the plan area and geographic areas:
• Across the plan area and geographic areas, watersheds were most commonly rated as impaired for the aquatic biological process category and least commonly for the terrestrial biological process category.
• Following are key findings from the assessment of watershed condition framework indicators and attributes: For the terrestrial physical process category, most attributes have a high percentage
of watersheds rated as good, except for road maintenance and proximity to water attributes of the roads and trails indicator.
More than half of the watersheds were rated as fair or poor for the road maintenance attribute, 60 percent of the watersheds were rated as poor for proximity to water, and another 25 percent were rated as fair for this attribute.
Trends in Class 1 (good) watersheds are relatively static. However, several Class 1 watersheds have the potential to degrade to Class 2 (fair) with only moderate climate changes, due to the influence of multiple stressors (table 129).
Table 129. Class 1 (good) watersheds with the potential to degrade to Class 2 (fair)
Watershed Name Hydrologic Unit Code
Gunnison Basin
Bear Creek-Spring Creek 140200010111 Headwaters Los Pinos Creek 140200030504 Outlet Razor Creek 140200030202 Outlet Willow Creek 140200010106 Roaring Judy Creek 140200010209

GMUG National Forests Land Management Plan Draft Environmental Impact Statement: Volume 1
283
Watershed Name Hydrologic Unit Code
North Fork of the Gunnison River
Crawford Reservoir 140200021204
San Juan Mountains
Upper Cimarron River 140200020902
Uncompahgre Plateau
North East Creek 140200050603 Shavano Creek-Tabeguache Creek 140300030603 Spring Creek 140300030604 Upper Dry Creek 140200060502
Surface Water
An estimated 3,657 miles of perennial streams, 1,390 miles of major (named) intermittent streams, 5,815 miles of minor (unnamed) intermittent streams, and 11,650 acres of lakes and reservoirs occur in the GMUG National Forests. Stream density ranges from 0 to 8.9 miles per square mile. The vast majority of the GMUG (97 percent) has stream densities ranging from 1.8 to 5.4 miles per square mile. There are 352 dams located in the 11 4th-level HUCs that encompass the GMUG (some of this infrastructure is located outside of National Forest System lands). These dams are generally located in and around upland areas. The Grand Mesa Geographic Area has the highest density of dams, followed by the North Fork of the Gunnison River. The North Fork of the Gunnison River and Gunnison Basin Geographic Areas have approximately 75 percent of their watersheds rated as poor for the road and trail proximity to water attribute. In the Uncompahgre Plateau Geographic Area, nearly half of the watersheds were rated as fair and approximately 25 percent were rated as poor for this attribute. The Gunnison Basin Climate Change Vulnerability Assessment (Neely et al. 2011) identified high-elevation lakes as low to moderately vulnerable to climate change (high confidence), with reservoirs and associated wetlands as moderately vulnerable (medium confidence). The Colorado Bureau of Land Management Climate Change Vulnerability Assessment (CNHP 2015) indicated that high-elevation lakes should be less at-risk from the effects of climate change, with lower-elevation lakes being more vulnerable. Warmer temperatures, nitrogen deposition, and the timing of snowmelt runoff may negatively affect some species. Lakes and reservoirs, particularly those on which gas-powered motorized watercraft are allowed, are susceptible to aquatic nuisance species.
Groundwater
Spring and aquifer distribution is discussed in this section. See the Aquatic, Riparian, and Wetland Ecosystems section of this document for further discussion of groundwater-dependent ecosystems. Approximately 287 springs and seeps occur across the GMUG, most of which are on the Uncompahgre National Forest (table 130) (Springs Stewardship Institute 2018).

USDA Forest Service
284
Table 130. Number of springs and estimated springs per acre in the GMUG National Forests [Source: Springs Stewardship Institute (2018)]
Forest Approximate Acres Number of Springs1 Springs per Acre
Grand Mesa 351,200 17 <0.0001 Uncompahgre 1,041,200 140 0.0001 Gunnison 1,760,900 130 <0.0001
1 Reported values are likely an underestimate of the actual number of springs in the plan area.
Bedrock Hydrogeology
The percentage of the plan area occupied by bedrock hydrogeologic groups or units is summarized in table 131. Available data suggest that groundwater vulnerability in the GMUG is relatively higher on the Grand Mesa and valleys in the northern West Elk Mountains where glacial drift and Quaternary-Tertiary alluvium is present at the surface. Vulnerability is generally lower in areas of high relief (mountainous or steep) or where there is little to no surface water and near-surface groundwater. Other data indicate that, at least for the Delta County area, there is very little to no seepage through confining units that separate the shallow aquifer, the Mesa Verde aquifer, and deeper areas of interest for coalbed methane and other potential developments.
Table 131. Hydrogeologic groups and units in the GMUG National Forests Group or Unit Percentage of Plan Area1
Major or Principal Aquifers 62.7 Alluvial aquifers 0.9 Tertiary igneous rock aquifers 31.2 Mesa Verde aquifer 3.6 Dakota, Morrison, and Entrada aquifers 16.6 Precambrian crystalline rock aquifers 10.4
Minor Aquifers and Confining Units 23.0 Tertiary sedimentary aquifers 0.3 Upper and Lower Piceance Basin aquifer and confining units 9.0 Mancos confining unit 6.6 Mesozoic sandstone aquifer and confining units 3.0 Mesozoic-Upper Paleozoic confining units 0.5 Maroon and Minturn aquifers; Belden confining unit 2.1 Paleozoic carbonate rock aquifers 1.5
Other Units 13.9 Quaternary eolian deposits <0 Quaternary mass movement deposits 6.2 Quaternary glacial deposits 7.7
1 Percentages are approximate and do not sum to 100 percent due to rounding.

GMUG National Forests Land Management Plan Draft Environmental Impact Statement: Volume 1
285
Water Quantity and Quality
The GMUG National Forests produce approximately 2.8 million acre-feet of water yield, minus wells, feeding and supporting area perennial streams, lakes, and reservoirs. Water yield ranges from 1.5 to 36.9 inches for the 235 subwatersheds in the GMUG. The average estimated yield value for all of the subwatersheds is 10.9 inches. The majority of the subwatersheds with yields greater than 20 inches (e.g., East River basin of the upper Gunnison River) drain high-elevation areas. Certain waters in the GMUG are designated as “outstanding waters” (table 132), meaning they are to be maintained and protected at their existing quality. Except for COGUUG02, all of these segments are within wilderness areas. Although surface water quality is generally excellent in the GMUG, the State of Colorado has identified some impaired streams, meaning they currently do not meet water quality standards (table 133). Elevated metals concentrations associated with historic mining activities are the primary reason for failure to meet water quality standards in these streams.
Table 132. Segments designated as outstanding waters
Colorado Water Body ID Number Segment Description
COGUUG01 All tributaries to the Gunnison River, including wetlands, in the La Garita, Powderhorn, West Elk, Collegiate Peaks, Maroon Bells, Fossil Ridge, or Uncompahgre Wilderness Areas
COGUUG02
All tributaries and wetlands from North Beaver Creek to Meyers Gulch, from the West Elk Wilderness boundary to their confluence with Blue Mesa Reservoir, Morrow Point Reservoir, or the Gunnison River, excluding Steuben Creek, North Willow Creek, and Soap Creek
COGUUG33 All lakes and reservoirs that are tributary to the Gunnison River and within the La Garita, Powderhorn, West Elk, Collegiate Peaks, Maroon Bells, Raggeds, Fossil Ridge, or Uncompahgre Wilderness Areas
COGUNF01 All tributaries to the North Fork of the Gunnison River, including all wetlands, within the West Elk or Raggeds Wilderness Areas
COGUNF08 All lakes and reservoirs that are tributary to the North Fork of the Gunnison River and within the West Elk or Raggeds Wilderness Areas
COGUUN01 All tributaries to the Uncompahgre River, including wetlands, which are within the Mount Sneffels or Uncompahgre Wilderness Areas
COGUUN16 All lakes and reservoirs tributary to the Uncompahgre River and within the Mount Sneffels or Uncompahgre Wilderness Areas
COGULG11B All tributaries to the Smith Fork, including all wetlands, which are within the West Elk Wilderness Area
COGULG18 All lakes and reservoirs tributary to the Smith Fork and are within the West Elk Wilderness Area
COGUSM01 All tributaries, including wetlands, to the San Miguel River and within the boundaries of the Lizard Head or Mount Sneffels Wilderness Areas
COGUSM13 All lakes and reservoirs tributary to the San Miguel River and within the boundaries of the Lizard Head or Mount Sneffels Wilderness Areas

USDA Forest Service
286
Table 133. Impaired streams and reasons for impairment in the GMUG National Forests [Regulation No. 93 – Colorado’s Section 303(d) List of Impaired Waters and Monitoring and Evaluation List Source: Colorado Water Quality Control Commission (2018)]
Colorado Water Body ID Number Waterbody Name 303(d) Impairment Identified Pollutant
COGULD03a Disappointment Creek Aquatic life use Selenium, iron COGULD04 West Paradox Creek Aquatic life use Iron COGULD05 West Creek Aquatic life use Copper, iron COGULG04a Whitewater Creek Water supply,
aquatic life warm Selenium, Manganese, and Sulfate
COGULG07b Tongue Creek Aquatic life use Iron, selenium COGULG11b Lunch Creek Aquatic life use Sediment COGULG12 Muddy Creek Aquatic life use Iron COGUNF04a Ruby Anthracite Creek Water supply Arsenic COGUNF04b East Muddy Creek Aquatic life use Lead, selenium, iron COGUNF04c Lake Irwin Aquatic life use Silver, cadmium, zinc COGUNF06a North Fork of the
Gunnison Aquatic life use Selenium, iron
COGUNF06b Cottonwood Creek Aquatic life use Selenium, iron COGUSM02 San Miguel River Aquatic life use Cadmium, zinc COGUSM03b San Miguel Aquatic life use Temperature COGUSM06a Ingram Creek Aquatic life use Cooper, manganese COGUSM06b Marshall Creek Aquatic life use Lead, cooper COGUSM07 Howard Fork Aquatic life use Iron, macroinvertebrates COGUSM08 South Fork of San
Miguel Water supply use Manganese, arsenic
COGUSM10b Naturita Creek Aquatic life use Dissolved oxygen COGUSM12a Specie Creek Water supply use Arsenic COGUSM12b San Miguel River Water supply,
aquatic life Macroinvertebrates, arsenic, iron
COGUUG01 Stewart Creek Water supply, aquatic life Iron, macroinvertebrates
COGUUG02 Red Creek / E. Elk Creek
Aquatic life, water supply Temperature, manganese
COGUUG04 Taylor River Water supply, aquatic life Arsenic, macroinvertebrates
COGUUG05a East River Water supply use Arsenic COGUUG07 Slate River below Oh-
Be-Joyful Creek Aquatic life use Zinc
COGUUG08 Slate River Aquatic life use Cadmium, zinc COGUUG09 Coal Creek Aquatic life use Arsenic COGUUG10a Oh-be-Joyful Creek Aquatic life use Zinc, lead, cadmium, copper COGUUG10b Redwell Creek Aquatic life use Zinc, lead, cadmium, copper COGUUG11 Elk Creek Aquatic life use Cadmium, lead, zinc, arsenic COGUUG12 Coal Creek Aquatic life use Copper, zinc, cadmium

GMUG National Forests Land Management Plan Draft Environmental Impact Statement: Volume 1
287
Colorado Water Body ID Number Waterbody Name 303(d) Impairment Identified Pollutant
COGUUG15a South Beaver Creek Aquatic life use Iron, macroinvertebrates COGUUG16a Ohio Creek Water supply use Arsenic COGUUG17a West Antelope Creek Water supply use Manganese COGUUG17b Antelope Creek Water supply use Manganese COGUUG18b Tomichi Creek Water supply,
aquatic life Arsenic, macroinvertebrates, temperature
COGUUG19 Razor Creek Aquatic life, water supply
Macroinvertebrates, arsenic, iron, manganese
COGUUG21 Marshall Creek Water supply use Arsenic COGUUG23 Cochetopa Creek Aquatic life, water
supply Temperature, arsenic
COGUUG26 Blue Creek Water supply Arsenic COGUUG29a Deadman Creek Aquatic life use Copper, selenium, zinc,
cadmium, iron, manganese COGUUG29b Lake Fork of the
Gunnison Water supply use Arsenic
COGUUG30 Henson Creek Water supply use Arsenic COGUUG32 North Fork Henson
Creek Water supply Manganese
COGUUN02 Uncompahgre River Aquatic life use Cadmium, copper, zinc COGUUN03a Uncompahgre River Aquatic life, water
supply Zinc, manganese
COGUUN3b Uncompahgre River Water supply use Manganese COGUUN05 Uncompahgre River Aquatic life, water
supply Cadmium, copper, lead, zinc, macros
COGUUN06a Red Mountain Creek Aquatic life use Silver, copper COGUUN07 Gray Copper Gulch Aquatic life use Copper, lead, zinc COGUUN08 Mineral Creek Aquatic life use Cooper, zinc, cadmium COGUUN09 Imogene Creek Aquatic life use Macroinvertebrates, cadmium,
zinc, lead COGUUN10a Cow Creek Water supply use Arsenic COGUUN11 Coal Creek Aquatic life, water
use Macroinvertebrates, arsenic, zinc
COGUUN12 Dry Creek Aquatic life use Iron COLCLC15a Plateau Creek Water supply use Iron, arsenic COLCLC16 Plateau Creek Aquatic life use Iron
Public Water Supplies and Municipal Supply Watersheds
A total of 18 surface water providers (utilizing 32 separate systems or source water areas) depend on at least some of the water provided by the GMUG. Groundwater-dependent systems within the plan area include 42 active private providers and 39 Forest Service-administered facilities. An additional 26 private groundwater-based providers are within 2.5 miles of the GMUG. Various water sources in the GMUG serve a combined population of about 175,000 people according to the Colorado Department of Public Health and

USDA Forest Service
288
Environment. There are no Environmental Protection Agency-designated sole source aquifers in the GMUG nor Forestwide water quality data for aquifers. Nearly all of the GMUG watersheds are municipal supply watersheds. GMUG National Forest System lands are considered the principal source for surface-based systems where 70 percent or more of the total supply area lies within the boundary of the GMUG. Forestwide, this includes 21 separate systems (managed by 16 providers), totaling approximately 1,038,000 acres.
Water Uses and Trends
The majority of streams in the GMUG that are capable of supplying water for agricultural purposes have been developed to either divert water to off-forest uses or to store water for later use downstream. About 70 percent of the 235 subwatersheds (6th-level HUC) have some level of water development. As many as 2,400 water developments occur in the GMUG, most of which are stock ponds that store small volumes of water for livestock and wildlife watering. The Forest Service also maintains water developments for surface and groundwater supply at developed recreation sites. Runoff from the GMUG predominantly flows into the Gunnison River sub-basin. Runoff from National Forest System lands in the Gunnison River sub-basin contribute approximately 40 to 45 percent of the average annual surface flow of the river. As much as 99 percent of total water demand is for agricultural purposes, with about one-quarter of that water being consumptively used by crops and livestock (Colorado Water Conservation Board 2019). Municipal and industrial consumption uses less than 0.3 percent of the surface water runoff. Please refer to the Groundwater section for information regarding water well development. Non-consumptive water uses in the GMUG include instream flows resulting from water rights that identify water in stream channels as a beneficial use. The State of Colorado holds instream flow rights on approximately 1,184 miles of stream in 77 subwatersheds, or approximately one-third of the perennial stream miles in the GMUG. The Colorado Water Conservation Board (2019) estimated an 85 to 100 percent increase in municipal and industrial water demand from 2015 to 2050. The report also indicated that many of the major river basins on the east side of the Continental Divide have much greater unmet water demands than the Gunnison River sub-basin, fueling speculation and interest in development to supply eastern slope basins where water demand is greater. Surface water diversion from National Forest System lands is not expected to change substantially during this time period.
Sustainability of Water Resources In their current condition, watersheds and water in the GMUG have the capability to meet the needs of the present generation without compromising the ability of future generations to meet their needs. The environmental sustainability of aquifers will depend on the amount, timing, and quality of groundwater provided by springs, wetlands, and streams, and the use of groundwater for municipal, agricultural, domestic, and industrial water supply. Human

GMUG National Forests Land Management Plan Draft Environmental Impact Statement: Volume 1
289
population growth and regional climate change could increase water demands, which could lead to higher rates of extraction than recharge.
Environmental Consequences
Analysis Framework This programmatic land management plan analysis focuses on broadscale estimated effects related to impacts to watershed resources on National Forest System lands. The spatial analysis area for watershed resources includes all the lands within the boundaries of the GMUG. This area represents where changes may occur because of Forest Service management actions. The temporal scope of this analysis assumes a time span of about 15 years, the life of the plan. For this analysis, watershed resources include water quantity and quality in springs, streams, rivers, lakes, and wetlands. The key indicators for assessing watershed resources among alternatives are the level of protection of these areas based on a qualitative assessment of plan components, the acreage of proposed timber harvest, and the acreage of recommended wilderness in each alternative. Management activities such as dispersed recreation, livestock grazing, and mining activities can also cause ground disturbance and can detrimentally impact watershed resources. However, the difference in scale, extent, and distribution of these activities are slight between alternatives. It can be reasonably assumed that the greatest future impacts to watershed resources would come from those management activities that are known to have resulted in impacts to these areas during previous planning periods, namely roads and trails. For the purposes of this analysis, potential new temporary roads associated with proposed harvest acres offer a surrogate for future impacts to these areas.
Methods and Assumptions
This analysis takes a programmatic look at the outcomes that may result from implementing the proposed management direction for each alternative over the life of the plan. For estimating effects at the programmatic forest plan level, it is assumed that the types of resource management activities allowed under the action alternatives are reasonably foreseeable future actions to achieve the Forest Service mission. Since future activity locations are not known at the programmatic land management plan level, specific spatial and temporal effects to watershed resources cannot be exactly determined. Therefore, impacts of potential management actions are considered predominantly as indirect impacts to these ecosystems. The temporal scale for this analysis will be limited to the life of this plan. This summary impacts analysis for watershed resources relies primarily on an assessment of which management activities have the greatest ability to impact these areas, and which alternatives propose the greatest numbers of acres that are available to those management activities. It can be reasonably assumed that the greatest future impacts to watershed resources would come from those management activities that are already known to be primary influences on current forest conditions, namely roads and trails and livestock

USDA Forest Service
290
grazing. Relative to natural conditions, these activities have the potential to lead to accelerated soil erosion and compaction, sediment delivery to streams and wetlands, and alterations to stream channel form and function. Expansion of both National Forest System roads and networks of trails would be the most likely activities to impact watershed resources. Unauthorized activities will not be analyzed for effects. Existing conditions and trends for watershed health were derived from watershed condition framework surveys (USDA Forest Service 2018) and are considered in this environmental analysis. Watershed conservation practices and plan components including forest plan standards prescribe extensive measures to protect watershed health and minimize effects caused by active forest management (MacDonald and Stednick 2003, Thomas et al. 2006, Reeves et al. 2006, Reiter et al. 2009). If all applicable measures are implemented and if they are effective, then adverse effects from any of the alternatives should be minimized. It is unlikely that plan components will prevent all adverse effects from occurring for each and every action that may be implemented in the GMUG. Therefore, alternatives that propose higher levels of activity for various resources pose greater inherent risks to watershed resources. Cumulative effects from adjacent management of other Forest Service units and State and private entities could measurably impact watershed resources for this programmatic analysis. Further details of these cumulative effects would be determined during future site-specific analysis.
Effects of the No-Action Alternative Management direction under the current plan calls for protection of watersheds, and maintaining the integrity of these features through prescriptive strategies. The current plan provides extensive direction for protection of watershed resources during management activities. Outcomes for watershed resources under current management would likely continue to be maintained or improved. The 2012 Planning Rule broadened watershed protection strategies, requiring plans to maintain or restore watershed function, described more succinctly as ecosystem services derived from healthy, functioning watersheds. The draft revised forest plan provides desired conditions, objectives, standards, guidelines, and management strategies for maintaining and improving watershed conditions and key characteristics as well as providing ecosystem services like clean water.
Effects Common to Action Alternatives Overall, watershed related plan components in the draft revised forest plan would maintain or improve watershed conditions while allowing management flexibility with respect to mitigating disturbance. Draft plan components for watersheds do not vary by plan alternative. For watershed resources, the draft revised forest plan provides more strategic, adaptive direction than the prescriptive, tactical direction of the current plan. Desired condition FW-DC-WTR-01 would maintain or improve watershed conditions and the integrity of public water supplies, and move priority watersheds toward a higher functioning condition class (Watershed Condition Framework, USDA Forest Service 2018). All action alternatives add objectives and guidelines that are not present in the current plan and would

GMUG National Forests Land Management Plan Draft Environmental Impact Statement: Volume 1
291
move the management decisions to be more of an ecological land management approach. For instance, the desired condition FW-DC-WTR-01 requires that watershed conditions and the integrity of public water supplies are maintained or improved, and priority watersheds achieve or are moving toward a higher functioning condition class as defined by the national watershed condition framework (USDA Forest Service 2018). FW-DC-WTR-03 would help ensure that State of Colorado water quality standards are met and State-classified uses are supported for all waterbodies.
Direct and Indirect Effects Action alternatives B through D essentially represent varying proportions of management areas among a variety of potential uses, ranging from restrictive management prescriptions (e.g., recommended wilderness) to general forest areas suitable for timber management. Because no changes are proposed to livestock grazing allocations, watershed resource impacts from livestock grazing would not vary by alternative. Among the action alternatives, alternative D represents a minimization of acreages that would be available for expansion of the road and trail network (including temporary roads), particularly for motorized vehicles and timber harvest. As a result, alternative D would likely have the fewest overall impacts to watershed resources. Alternatively, alternative C represents a maximum number of acres available for the potential expansion of the motorized travel network via motorized recreation opportunity spectrum settings, and the maximum number of acres suitable for timber harvest and the necessary temporary access roads. Consequently, alternative C would likely have the greatest impacts to watershed resources. The potential watershed impacts of alternative B represent a relative midpoint among action alternatives B, C, and D. The provisioning of water resources have been identified as a key ecosystem service provided by the GMUG. Water resources within the plan area contribute to the use and enjoyment by the public, both consumptive use including water withdrawals and diversions for agricultural, municipal, and commercial uses and non-consumptive use including water storage for flood control, hydropower, and recreation. As noted above, alternative C proposes the most motorized travel and timber suitability and could, therefore, have the greatest impact to people that benefit from GMUG water resources. Alternative D would likely have the lowest impact.
Effects on Watershed Resources from Vegetation and Fuels Management
Timber harvesting and fuels treatments have the potential to impact watersheds and stream health. Impacts fall into two broad categories, direct and indirect impacts associated with the canopy removal itself, and impacts associated with the road network required for successful timber harvest, which are discussed later in this section. Major reductions in forest canopy can increase water yield in high-elevation forested watersheds such as spruce-fir or cool-moist mixed- conifer forests. These increases can be large in some areas. However, in the hydroclimatic regime of the planning area, annual climate variations are much more important than alterations due to timber harvest. Flow increases occur mostly during spring runoff and during the summer; they are not measurable until 25 percent of the basal area of a forested watershed is affected (USDA Forest Service 1980). Large openings can suffer snow scour that can reduce site moisture

USDA Forest Service
292
and water yield (USDA Forest Service 2006b). Given that many of the trees to be removed under this analysis are already dead from spruce beetle damage, it is likely that many of the water yield impacts that would typically be associated with harvest have already been observed. Namely, the trees have stopped transpiration, and other impacts such as canopy interception and shading have been altered from the green state. The removal of these dead trees and the subsequent creation of large openings can enhance or create localized areas of snow scour that can reduce site moisture and water yield (USDA Forest Service 2006a). Timber harvest treatments would be spread over time throughout many forested watersheds in the planning area; however, their exact amount, location, and timing is unknown until specific projects are proposed. It is not expected that watersheds would receive timber harvesting treatments that exceed 25 percent basal area removal over the life of the plan; therefore, detectable changes in water yield would, generally, not be a concern. On a site-specific basis, certain sensitive watersheds can have water yield concerns. Some watersheds are prone to mass failure and may be especially sensitive to small changes in water yield. Other watersheds have experienced large amounts of disturbance as result of past management activities, severe climatic events, or large wildfires, and may have water yield issues. Impacts to those watersheds would be considered on a project-by-project, site-specific basis in order to evaluate water yield concerns and suitability for timber management. Forest plan components address this issue. For instance, the appropriate forest plan direction for soils (FW-GDL-SOIL-05) would be applied to reduce these risks of landslides resulting from forest management. Sediment is the primary pollutant associated with water quality impacts from timber harvest. Implementation of water conservation practices, best management practices, guidelines, and relevant forest plan direction applied to all timber harvesting activities are typically effective in preventing or reducing sediment delivery to water bodies. Road construction associated with timber harvesting has a higher potential to impact water quality. New road construction has the greatest potential for direct or indirect watershed impacts associated with timber harvesting (Megahan and Kidd 1972, Reid and Dunne 1984). Reconstruction on stabilized roads that are covered with vegetation can generate increased sediment (Swift 1984), just as new road construction is a large source of sediment to forested watershed streams. Vegetation management activities in the planning area will comply with the most current best management practices (USDA Forest Service 2012b) to reduce these impacts. For fuels treatments, generally effects are beneficial to watershed condition unless burns depart from prescription, or have roads constructed to reach burn areas. Prescribed burn intensities generally are far less than typical wildfire intensities, creating lower soil burn severity. There is not substantial variation in the amount of fuels treatment proposed among the action alternatives B and C; therefore, potential impacts to watersheds from fuels treatments would likely be identical under these alternatives. Alternative D would have the lowest estimated projected fuels treatments. In general, fuels treatments would not be expected to result in measurable impacts to water yield because such treatments (including mechanical treatments and prescribed burns) primarily target the understory and small-diameter trees; therefore, they may not measurably alter basal area. For timber harvest, the nature of impacts to watershed resources are consistent by alternative, but would vary in magnitude based on the projected acres of timber harvest,
GMUG National Forests Land Management Plan Draft Environmental Impact Statement: Volume 1
293
recommended wilderness, and other special areas. Alternatives B and C would be expected to have more watershed impacts from timber harvest, followed by alternatives A and D.
Effects on Watershed Resources from Livestock Grazing
Excessive or unrestricted grazing by permitted livestock and big game may result in widespread impacts on watershed function and water resources. Grazing pressure in sensitive areas may degrade watershed conditions through the direct, physical removal of riparian and wetland vegetation, and trampling of streambanks and wet areas, or through indirect changes to vegetation species composition, decreased shading and increased water temperatures, and changes in water chemistry. Areas commonly impacted by livestock grazing include mountain grasslands, riparian areas, wetland ecosystems, alpine vegetation, semi-desert grasslands, and places where livestock concentrate directly on or near water sources. These impacts can be magnified on drier grazing allotments where animals tend to congregate around the limited available water resources. For permitted livestock grazing, as well as the acres of land suitable for livestock grazing, there is no meaningful difference among the alternatives. However, various plan direction that is common to alternatives B, C, and D places an increased emphasis on the health and functionality of various watershed components. For instance, standard FW-STND-RMGD-08 requires that in the riparian management zone, management activities must maintain or restore the connectivity, composition, function, and structure of riparian and wetland areas in the long term (decades), as consistent with the Watershed Conservation Practices Handbook and its exceptions (FSH 2509.25 and FS 990A or equivalent direction). This direction applies to all action alternatives.
Effects on Watershed Resources from Fire Management
Watershed studies and post-fire monitoring in snow-dominated hydrologic systems indicate that wildfire has the potential to increase annual water yield similar to timber harvest (Troendle and Bevenger 1996). Additionally, stand-replacing wildfires have the potential to substantially alter both snow accumulation and melt patterns, with melt typically coming earlier and more rapidly, potentially resulting in shifts in both stream peak timing and magnitude. Wildfire can also change, sometimes significantly, the response to short-duration, high-intensity summer thunderstorms, resulting in considerable soil erosion, sediment delivery, flash floods, higher peak flows, and downcutting of stream channels. High-severity fire consumes ground cover and alters the soil surface, creating water repellency. The water repellency reduces infiltration rates, resulting in erosion and overland flow to channels. The increased delivery of sediment and streamflow produces debris flows and floods that have the potential to downcut channels and produce floods. Such responses and associated effects, however, are generally seen only for the first 3 to 5 years after a significant high-severity fire due to vegetative recovery and its ability to assimilate thunderstorm intensity, duration, and volume. This can likely be attributed to a multitude of factors, including differences in vegetation type, fire regime condition class, topography, and soils. In addition to the watershed impacts from wildfire, fire management activities have the potential to impact watershed resources, primarily through temporary road and fireline

USDA Forest Service
294
construction, which can introduce erosion and sedimentation issues. As a standard practice, resource impacts from fire suppression are mitigated or rehabilitated once it is safe to do so, meaning the watershed impacts from suppression are typically minimal. For wildfire, direction does not vary by alternative; as a consequence, impacts to watershed resources from fire management are not expected to vary among alternatives B through D.
Effects on Watershed Resources from Roads and Trails
While road construction increases access to the GMUG, the construction and maintenance of roads has long been recognized as a potential and major source of sediment in forested watersheds (Megahan and Kidd 1972; Reid and Dunne 1984). Roads can change natural runoff patterns by increasing the amount of impervious surface in a watershed by intercepting overland flow or shallow subsurface runoff, or both. The network of road drainages generally routes this water, and the associated sediment, directly into streams (MacDonald and Stednick 2003). Sediment is the major pollutant associated with roads on public lands. Sedimentation in streams impacts water quality, which can, in turn, impact aquatic life. Sediment can also alter channel morphology, which can subsequently impact aquatic habitat. Road construction and maintenance activities can result in physical changes to streams, including floodplain and riparian habitat modifications, channel degradation, and fish passage reduction. Poorly designed and maintained road/stream interactions can necessitate increased road stabilization and maintenance costs, and lead to rapid sedimentation and filling in of water storage reservoirs and ponds. Ecological impacts commonly associated with stream/road interactions include aquatic, riparian, and wetland habitat degradation. The watershed impacts associated with trail networks are similar to those associated with roads, but are typically less in magnitude per mile of length. Future travel management decisions are not covered by this forest planning effort; however, these decisions can have an effect on the impacts from roads. As part of travel management, management actions can reduce motorized cross-country travel, and limitations on off-road game retrieval and dispersed camping have the potential to reduce unauthorized roads and trails, which typically have greater impacts than National Forest System roads. The magnitude of impacts to watershed resources from roads and trails would depend primarily on the number of acres that are designated for uses that could result in expanded road or trail networks, including temporary roads. The primary expansion potential for temporary roads comes from projected timber harvest. As a result, alternatives B and C would likely have the greatest watershed impacts from temporary roads. More motorized trails are likely in alternative C relative to B or D.
Effects on Watershed Resources from Designation of Wilderness; Roadless, Wildlife and Special Management Areas; Wild and Scenic Rivers; and Recreation Areas
In general, designation of special areas such as wilderness, wild, scenic, and recreational rivers, research natural areas, and special interest areas have the potential to limit the type of activities that result in a large portion of management-related watershed impacts. Particularly, it is assumed the reduction of suitable timber base due to an increase in the

GMUG National Forests Land Management Plan Draft Environmental Impact Statement: Volume 1
295
acreage of recommended wilderness would result in reduced watershed impacts from timber harvest and road construction/reconstruction. The watershed impacts from the designations such as wild, scenic, and recreational river eligibility, research natural areas, and special interest areas would vary based on the reason or purpose of the designation. As a consequence, for wilderness and other special area designations the nature and magnitude of impacts to watershed resources under alternatives B and D would comprise the least impact due to higher amounts of recommended wilderness and special management areas that reduce areas available for timber management. Alternative C would have the most impact overall because it would have less area in special designations.
Effects on Watershed Resources from Climate Variability
Over the past several decades, the mountains of western Colorado have seen reductions in peak snowpack and substantial shifts in the timing of snowmelt and snowmelt runoff toward earlier in the year (Clow 2010, Harpold et al. 2012). These trends are expected to continue or potentially accelerate in the future with rising temperatures and increasing variability of precipitation inputs (Lute et al. 2015, Scalzitti et al. 2016). Alterations in the timing and magnitude of stream discharges have the potential to generate a wide variety of watershed impacts. Increased peak discharges have the potential to alter and damage stream channels and streamside vegetation. Reduced late-season flows and increased air temperatures could reduce the spatial extent and health of riparian and wetland vegetation, further impacting streambank stability and the ability of watersheds to sustain baseflow. Increases in air temperatures and reductions in late-season flows will likely result in increased stream temperatures and have the potential to increase the concentration of various contaminants and alter the cycling of sediment and nutrients. Additionally, most streams in the headwaters of the Uncompahgre and Gunnison Rivers are anticipated to see reductions in total annual discharge, which will affect both the human and natural environment through decreased water availability during the growing season. Climate variability is the same across all alternatives; however, alternatives that limit disturbances or focus protection on key watershed components such as wetlands and riparian vegetation will most successfully function under a variety of climate scenarios. As a consequence, alternative D is likely to realize fewer impacts associated with climate change to watershed resources, followed by alternatives B, and C.
Cumulative Effects Cumulative effects were considered for the implementation period of the forest plan revision, on the watershed boundary of the forest plan project area. Watershed cumulative effects include the total impacts of runoff, erosion, sediment or water yield, and water quality that result from the incremental impact of the alternatives when added to other past, present, and reasonably foreseeable future actions occurring in the same natural drainage basin or watershed. Both public and private lands were considered. The most pertinent past and current effects that need to be considered are impacts from the management of livestock grazing, timber harvest, and future travel management decisions. Reasonably foreseeable future actions included in this analysis are widespread timber

USDA Forest Service
296
projects that are in various stages of development across the GMUG, and other projects as planned. When combined with the past, present, and reasonably foreseeable future actions, the effects discussed above do not combine to create significantly larger cumulative impacts to watershed resources. As a consequence, total cumulative impacts mirror the indirect effects, with the impacts from alternative C the highest, followed by alternative B, while the impacts from alternative D would be lesser in magnitude. Alternative D would have the fewest cumulative watershed resource impacts.
Conclusion Generally, action alternatives B through D essentially represent varying proportions of management areas among a variety of potential uses, ranging from restrictive management prescriptions (e.g., recommended wilderness) to general forest areas suitable for timber management. In summary, because no changes are proposed to livestock grazing allocations, watershed resource impacts from livestock grazing would not vary significantly by alternative. Expansion of the road and trail network, including temporary roads, represents the largest potential impact to watershed resources. Among the action alternatives, alternative D represents a minimization of acreages that would be available for expansion of the road and trail network, particularly for motorized vehicles and timber harvest. As a result, alternative D would likely have the fewest overall impacts to watershed resources. Alternatively, alternative C represents a maximum number of acres available for the potential expansion of the motorized travel network via the motorized recreation opportunity spectrum setting. Consequently, alternative C would likely have the greatest impacts to watershed resources. The potential watershed impacts of alternative B represent a relative midpoint among the action alternatives. Consistent with 36 CFR 219.8(a)(2), because of the application of plan components, the effects of plan direction for all action alternatives would maintain or restore water resources in the plan area and would comply with laws, regulation, and policy designed to protect watershed resources.
Part II. Socioeconomic Resources As discussed in the Purpose and Need for Action section, a primary goal of the revised forest plan is to guide management so that national forests and grasslands contribute to social and economic sustainability, providing communities with ecosystem services and multiple uses that deliver a range of social, economic, and ecological benefits, in the present and into the future. This section describes the conditions and trends of social and economic systems that depend on the GMUG National Forests, with a focus on the sustainability of key resources and their associated uses and benefits.

GMUG National Forests Land Management Plan Draft Environmental Impact Statement: Volume 1
297
Socioeconomics
Affected Environment A detailed description of the socioeconomic affected environment is included in the assessment (USDA Forest Service 2018, benefits to people) and is hereby incorporated by reference. This information is summarized below for the environmental analysis. The socioeconomic area of influence is determined by a variety of indicators, including timber, grazing, and recreation, as well as local knowledge from the public and Forest Service staffs. Counties were included in the analysis if supported under one or more of these criteria. For the plan area, this includes counties most closely tied economically or socially, or both, to GMUG resources and management, as follows: Delta, Fremont, Garfield, Gunnison, Mesa, Montrose, Ouray, Saguache, Hinsdale and San Miguel Counties, Colorado. Across the analysis area, approximately 70 percent of the land is Federally managed (Headwaters Economics 2017).
Economic Setting and Sustainability The assessment (USDA Forest Service 2018, benefits to people) examined several indicators of economic sustainability in the socioeconomic analysis area (table 134). In terms of market access and connectivity, most counties in the area of influence fall within the “connected” category. Fremont, Hinsdale, and Saguache Counties are “isolated,” while Mesa is considered to be a “metro” county. About 24 percent of all employment within the GMUG area of influence is in the creative class, with San Miguel County (37 percent) in the lead. All counties in the GMUG area of influence are below the national average for gross domestic product per worker, except for Garfield County, which is above the national average ($94,400). The Shannon-Weaver Diversity Index for the GMUG analysis area and the State of Colorado is 0.67 and 0.76, respectively. Delta, Garfield, Mesa, and Montrose County economies are relatively diverse (all above 0.70), while Hinsdale and Saguache Counties are less diverse (0.57).
Table 134. Factors of economic sustainability in the GMUG analysis area [GDP, gross domestic product; Sources: USDA ERS (2014); Headwaters Economics (2017); and IMPLAN (2015)]
County Market Access Classification
Creative Class Employment
GDP per Worker
(thousands of 2016 $)
GDP per Worker National
Ranking (of 3,110 counties)
Shannon-Weaver
Diversity Index
Delta Connected 17.68% $76.10 2,484 0.70 Fremont Isolated 19.39% $83.20 2,128 0.68 Garfield Connected 22.02% $99.20 1,298 0.70 Gunnison Connected 28.35% $72.60 2,644 0.68 Hinsdale Isolated 30.14% $52.40 3,105 0.57 Mesa Metro 22.84% $90.60 1,764 0.73 Montrose Connected 18.85% $80.30 2,284 0.72
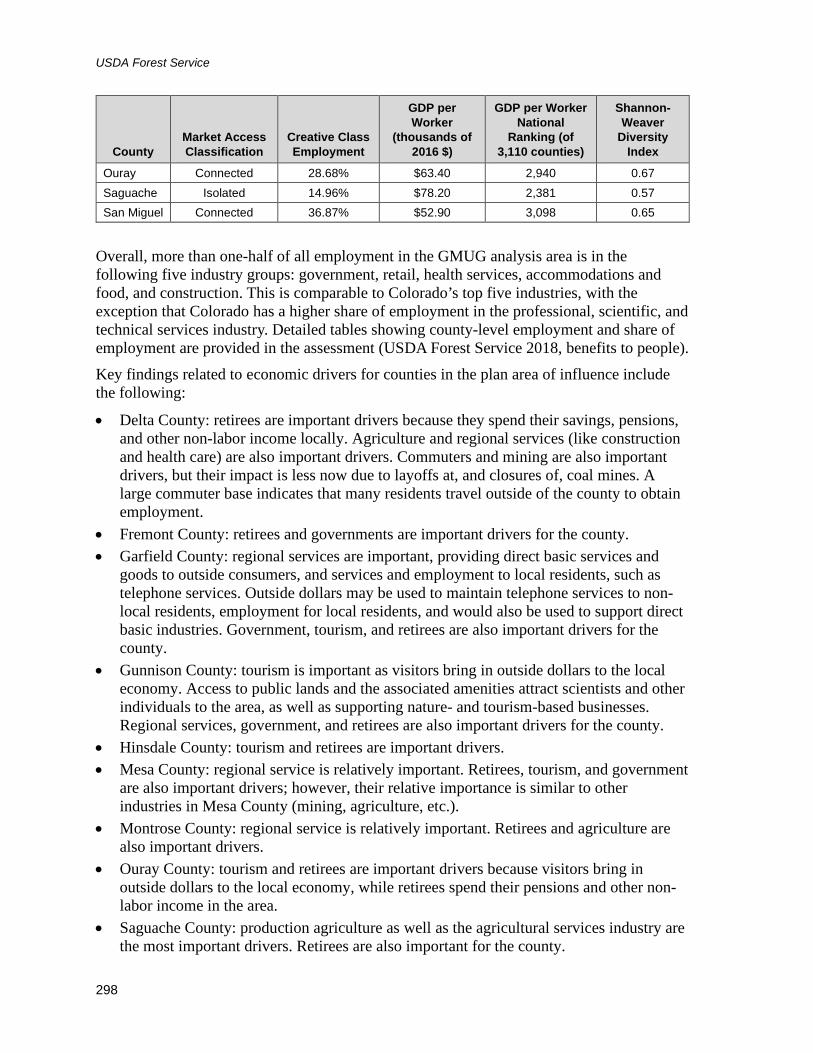
USDA Forest Service
298
County Market Access Classification
Creative Class Employment
GDP per Worker
(thousands of 2016 $)
GDP per Worker National
Ranking (of 3,110 counties)
Shannon-Weaver
Diversity Index
Ouray Connected 28.68% $63.40 2,940 0.67 Saguache Isolated 14.96% $78.20 2,381 0.57 San Miguel Connected 36.87% $52.90 3,098 0.65
Overall, more than one-half of all employment in the GMUG analysis area is in the following five industry groups: government, retail, health services, accommodations and food, and construction. This is comparable to Colorado’s top five industries, with the exception that Colorado has a higher share of employment in the professional, scientific, and technical services industry. Detailed tables showing county-level employment and share of employment are provided in the assessment (USDA Forest Service 2018, benefits to people). Key findings related to economic drivers for counties in the plan area of influence include the following:
• Delta County: retirees are important drivers because they spend their savings, pensions, and other non-labor income locally. Agriculture and regional services (like construction and health care) are also important drivers. Commuters and mining are also important drivers, but their impact is less now due to layoffs at, and closures of, coal mines. A large commuter base indicates that many residents travel outside of the county to obtain employment.
• Fremont County: retirees and governments are important drivers for the county. • Garfield County: regional services are important, providing direct basic services and
goods to outside consumers, and services and employment to local residents, such as telephone services. Outside dollars may be used to maintain telephone services to non-local residents, employment for local residents, and would also be used to support direct basic industries. Government, tourism, and retirees are also important drivers for the county.
• Gunnison County: tourism is important as visitors bring in outside dollars to the local economy. Access to public lands and the associated amenities attract scientists and other individuals to the area, as well as supporting nature- and tourism-based businesses. Regional services, government, and retirees are also important drivers for the county.
• Hinsdale County: tourism and retirees are important drivers. • Mesa County: regional service is relatively important. Retirees, tourism, and government
are also important drivers; however, their relative importance is similar to other industries in Mesa County (mining, agriculture, etc.).
• Montrose County: regional service is relatively important. Retirees and agriculture are also important drivers.
• Ouray County: tourism and retirees are important drivers because visitors bring in outside dollars to the local economy, while retirees spend their pensions and other non-labor income in the area.
• Saguache County: production agriculture as well as the agricultural services industry are the most important drivers. Retirees are also important for the county.

GMUG National Forests Land Management Plan Draft Environmental Impact Statement: Volume 1
299
• San Miguel County: tourism is the most important driver. This includes resort-based tourism, other tourism-related service industries, as well as second home residents. Retirees are also important for the county because they spend their pensions and other non-labor income in the area.
Socioeconomic conditions in many towns and counties are expected to change in the years to come. Climate change, population growth, technological advancement, and increased recreational use will likely have significant effects on the local economy. These trends will affect the area’s socioeconomic conditions in different and sometimes competing ways, such as the potential for shorter ski seasons, more location-neutral businesses (possible increased plane travel and broadband availability), and increased visitation from Colorado's Front Range population. These possibilities and other unknown factors will present challenges as well as opportunities for GMUG management.
Social Setting and Sustainability During 1990–2016, overall population growth in the GMUG analysis area kept pace with the statewide population growth rate. Garfield, Ouray, and San Miguel Counties more than doubled in size; while Delta, Fremont, and Saguache Counties experienced relatively slow population growth during this time (table 135).
Table 135. Population characteristics in the GMUG analysis area, 1990–2016 [Source: U.S. Census Bureau (1990 and 2017)]
County Population
(1990) Population
(2016)
Percentage of Population
Growth, 1990–2016
Median Age
(2016)
Percentage of Population 65
Years and Over
Percentage of Population 18
Years and Under
Delta 20,980 30,442 45% 47.7 25% 20% Fremont 32,273 47,446 47% 44.8 21% 16% Garfield 29,274 58,887 101% 36.6 12% 25% Gunnison 10,273 16,408 60% 34.6 12% 17% Hinsdale 467 788 69% 51.5 26% 20% Mesa 93,145 150,083 61% 39 18% 22% Montrose 24,423 41,471 70% 44.8 22% 22% Ouray 2,295 4,857 112% 53.5 26% 16% Saguache 4,619 6,389 38% 48.3 21 % 22% San Miguel 3,653 8,017 119% 41.8 12% 19% Colorado 3,294,394 5,540,545 68% 36.6 13% 23%
The GMUG analysis area accounts for only 7 percent of Colorado’s population, but 20 percent of its land base (U.S. Census Bureau 2017), indicating a relatively low population density. Indeed, every county in the analysis area is less densely populated than the state overall. In general, the population in the GMUG analysis area is skewed to older people, and only Garfield County has a higher share of young people than the state overall. In all GMUG analysis area counties, youth make up a greater share of the total population than the share

USDA Forest Service
300
of youth visits to the GMUG. Only 15 percent of visitors to the GMUG are 19 years or younger (USDA Forest Service 2016), suggesting that youth are less likely to engage in activities in the GMUG than other age groups. Public surveys and county planning documents reveal very similar attitudes and perceptions across the GMUG analysis area. Residents seem to agree that their communities are special because of abundant natural amenities and outdoor recreation opportunities, which contribute to sense of place and quality of life. However, residents across the GMUG analysis area appear concerned with economic and job opportunities in their communities. Given the broad nature of forest planning and the use of the GMUG by residents countywide, the assessment of environmental justice populations emphasized county-level conditions. Minority or low-income status populations were analyzed across the 10 counties that make up the GMUG analysis area: Delta, Fremont, Garfield, Gunnison, Hinsdale, Mesa, Montrose, Ouray, Saguache, and San Miguel Counties. Several counties have minority populations and low-income populations that meet the criteria to be identified as environmental justice populations, including portions of Fremont, Montrose, Garfield, and Saguache Counties. Several Tribes historically or culturally affiliated with the GMUG also meet criteria as environmental justice populations.
Environmental Consequences
Analysis Framework The GMUG National Forests contribute to the local economy in many ways, such as timber harvest, recreation, ranching, and minerals development. Therefore, activities on National Forest System lands can impact the local economy. Economic impacts were identified as an important issue in the study area, as they are related to the quality of life and sense of place for people that live and work in the area. Employment and labor income are used as indicators of effects to the local economy. This analysis estimates the changes in economic activity by alternative generated within the study area associated with harvesting and processing timber from GMUG National Forests. The study area is defined as Delta, Fremont, Hinsdale, Garfield, Gunnison, Mesa, Montrose, Ouray, Saguache, and San Miguel Counties. This analysis assumes that 85 percent of the timber harvest will be processed in the study area, which is consistent with findings published in a Bureau of Business and Economic Research study (BBER 2017). Therefore, additional economic activity will be generated outside the study area as a result of timber harvested from GMUG forests. Economic impacts were modeled using IMPLAN Professional Version 3.1 with 2017 data (IMPLAN 2017). This was the latest data available at time of analysis. IMPLAN is an input-output model, which estimates the economic impacts of projects, programs, policies, and economic changes on a region. IMPLAN analyzes the direct, indirect, and induced economic impacts. Direct economic impacts are generated by the activity itself, such as forest product harvesting. Indirect employment and labor income contributions occur when a sector purchases supplies and services from other industries in order to produce their product. Induced contributions are the employment and labor income generated as a result of spending new household income generated by direct and indirect employment. The

GMUG National Forests Land Management Plan Draft Environmental Impact Statement: Volume 1
301
employment estimated is defined as any part-time, seasonal, or full-time job. In the economic impact tables, direct, indirect, and induced contributions are included in the estimated impacts. The IMPLAN database describes the economy in 536 sectors using Federal data from 2017. Data on use levels under each alternative were collected from GMUG resource specialists. In most instances, the precise change is unknown. Therefore, the changes are based on the professional expertise of the resource specialists. These estimates assume full implementation of each alternative. If timber sales are offered or sold, but not cut, then the associated employment and labor income would be lower than the estimates reported here. Effects are estimated for the 20-year planning period.
Management Direction To comply with the 2012 Planning Rule, the new plan considers the GMUG’s roles and contributions to social and economic sustainability as well as ecosystem services. See also related assessments (USDA Forest Service 2018, range, timber, recreation, etc.) for additional potential needs for change.
Effects Common to All Alternatives The economic effects from mineral development and extraction and ranching are expected to be the same under all alternatives because the level of resource use is not expected to vary among the alternatives. All alternatives are expected to continue to contribute to ecological, social, and economic sustainability. Under all alternatives and based on the current condition, recreation contributes 528 jobs and $14 million in labor income, mineral production (including oil, gas, and coal) contributes 59 jobs and $4 million in labor income, and grazing contributes 525 jobs and $11.9 million in labor income2. The potential change in economic effects per alternative from recreation is discussed qualitatively and is not expected to differ significantly from the estimates noted here.
Effects of the No-Action Alternative Under existing management, timber harvesting and processing activities would support approximately 277 jobs and $11.6 million in labor income annually for the first 5 years of plan implementation and 229 jobs and $9.8 million in labor income annually for years 6 to 20.
Effects of Alternatives B and C Timber harvesting and processing activities in alternatives B and C would support approximately 443 jobs and $18.6 million in labor income annually for the first 5 years of
2 Recreation visitation is based on round 4 of National Visitor Use Monitoring data. Mineral production is from 2019. Grazing is based on 2020 authorized animal unit months. Values are 2020 dollars.

USDA Forest Service
302
plan implementation and 416 jobs and $17.7 million in labor income annually for years 6 to 20.
Effects of Alternative D The timber harvesting and processing activities under alternative D would support approximately 210 jobs and $9 million in labor income annually for 20 years, which is the lowest among all alternatives.
Comparison of Effects of the Alternatives The economic effects from recreation, mineral development and extraction and ranching are expected to be the same under all alternatives because the level of resource use is not expected to vary among the alternatives. The only quantifiable differences in economic effects (jobs and income) across the alternatives are based on timber harvest (table 136). Alternatives B and C would result in a greater positive economic impact (jobs and income) among the alternatives because they propose a higher level of harvest. Alternative D proposes less harvest than the other alternatives and therefore results in lower positive economic impacts.
Table 136. Effects of timber harvest on the local economy, by alternative [CCF, one hundred cubic feet; Source: IMPLAN (2017)]
Alternative A Alternatives B and C1 Alternative D
Years 1–5 Years 6–20 Years 1–5 Years 6–20 Years 1–20 Total Volume (CCF)
35,900 32,100 55,000 55,000 30,000
Average Annual Jobs
277 229 443 416 210
Average Annual Labor Income (millions 2020 $)
11.6
9.8 18.6 17.7 9
1 Years 6–20 have less salvage and more aspen harvest than years 1-5, which results in the same total harvest (55,000 CCF) for both time periods, but lower economic impacts for years 6-20.
Out of the estimated 2.3 million annual recreation visits to the GMUG, about 5 percent of visits are related to wildlife (USDA Forest Service 2019). Alternative D may result in the greatest economic benefit related to wildlife-related recreation because it proposes the greatest amount of wildlife management areas, recommended wilderness, and special management areas that would likely benefit wildlife, fishing, and hunting recreation opportunities and associated spending in the local economy. However, it would also result in more restrictions on future trail development, with fewer opportunities potentially resulting in less trail-based recreation spending. Alternative B may provide the best balance between wildlife-related recreation and trail-based recreation, and therefore the greatest economic benefits. Alternatives B and D also allow a mix of non-motorized and motorized recreation opportunities. Alternative C provides direction to manage the highest percentage, compared to the other alternatives, of the GMUG land base as motorized during the summer and

GMUG National Forests Land Management Plan Draft Environmental Impact Statement: Volume 1
303
winter months, which would result in greater access and recreation spending. However, this could have negative impacts on wildlife that visitors rely on for fishing and hunting and could actually have longer-term negative impacts on recreation spending. Because alternative D would direct the agency to manage the majority of the GMUG as non-motorized in the winter, it may negatively impact recreation spending, though likely minimally.
County-Level Summaries on Social and Economic Contributions The GMUG will continue to contribute to social and economic sustainability by providing for multiple uses, ecosystem services, and infrastructure, and by having a presence in the community. While timber harvest, ranching, recreation, and other resources including ecosystem services will continue to play an important economic and social role in the area, individual counties may experience different levels of contributions, as well as varying degrees of progress toward the path of sustainable economic development. With the concept of sustainability in mind, the following summaries focus on different indicators and factors of economic sustainability (as introduced in the assessment (USDA Forest Service 2018, benefits to people) and reiterated in the Affected Environment section) for each county in the study area, in relation to various plan area contributions. Indicators discussed throughout the county-level summaries are gross domestic product per worker in thousands of 2016 dollars (IBRC 2016), creative class employment (USDA ERS 2014), market access classification (Headwaters Economics 2017), and the Shannon-Weaver Diversity Index (IMPLAN 2015). See the Affected Environment section for additional information on the social and economic existing condition in the planning area.
Delta County
The GMUG contributes to Delta County’s economy in various ways, especially through recreation and agriculture. Based on Delta County’s reliance on the recreation industry and its dependence on recreation opportunities (including scenery and other natural amenities) the GMUG provides, plan area direction has the potential to have meaningful impacts on the local economy. Delta County also has the highest employment in timber sectors (0.4 percent) in the 10-county social and economic area of influence (U.S. Census Bureau 2020). Productivity is measured by gross domestic product per worker. At $76,100 per worker, Delta County is below the national average ($94,400) and has a fairly average productivity per worker in the 10-county social and economic area of influence (IBRC 2016). Economic productivity is a crucial determinant of living standards for future generations because productivity is interrelated with economic efficiency, and economies that lack efficiency risk being stagnant. Regarding economic diversity, Delta County has an average Shannon-Weaver diversity index of 0.70 (the State of Colorado is 0.76) in the 10-county analysis area (IMPLAN 2015). Economies with greater economic diversity are able to endure economic shocks and recessions better than highly specialized economies. Relative to contributions from the GMUG, because Delta County is more diverse, it would be less likely to experience changes in the local economy if the plan area’s contributions were to change.

USDA Forest Service
304
About 18 percent of all employees in Delta County are in the creative class, which is similar to the national and less than the Colorado average (18 percent and 23 percent, respectively) (USDA ERS 2014). Local economies with a strong creative class of employment are in a better position to attract and retain younger talents. This will become increasingly important for counties with a sizable direct basic industry that is reliant on the retiree income category, especially if the number of incoming retirees decreases in the future. Delta County is recreation-dependent but connected (Headwaters Economics 2017), with relatively low creative class employment, and average economic diversity and average productivity compared to other counties in the area. Delta County has largest share of timber-related employment relative to the other counties. Therefore, relative to plan area contributions, Delta County may be more sensitive to subsequent economic effects, if any, on its local economy than others within the area of influence. Effects overall would be small given that timber sector is 0.4 percent of the economy (U.S. Census Bureau 2020). Timber and recreation are the only resource uses that are expected to differ among the alternatives. Grazing and minerals use, and subsequent economic impacts, are expected to remain at current conditions under all alternatives in the 10-county social and economic area of influence. Because Delta County is the most reliant on timber sector jobs in the 10-county social and economic area of influence, any changes to the timber harvest volumes could impact Delta County the most relative to the other counties, though it will still be minimal since timber sector jobs represent 0.4 percent of total private employment in the county (U.S. Census Bureau 2020). Alternatives B and C will have the greatest positive impact to the timber industry among the alternatives since they would produce the highest timber harvest and related jobs. Counties with tourism-driven economies may experience the greatest benefit from alternative B because it proposes a balance between wildlife-related recreation and trail-based recreation. Alternative D may result in the greatest economic benefit related to wildlife-related recreation because it proposes the greatest amount of wildlife management areas, recommended wilderness, and special management areas, which would likely benefit wildlife, fishing, and hunting recreation opportunities and associated spending in the local economy. However, it would also result in more restrictions on future trail development, with fewer opportunities potentially resulting in less trail-based recreation spending. Alternatives B and D also allow a mix of non-motorized and motorized recreation opportunities. Alternative C provides direction to manage the highest percentage, compared to the other alternatives, of the GMUG land base as motorized during the summer and winter months, which would result in greater access and recreation spending. However, this could have negative impacts on wildlife that visitors rely on for fishing and hunting and could actually have longer-term negative impacts on recreation spending. Because alternative D would direct the agency to manage the majority of the GMUG as non-motorized in the winter, it may negatively impact recreation spending, though likely minimally.
GMUG National Forests Land Management Plan Draft Environmental Impact Statement: Volume 1
305
Fremont County
The GMUG contributes to Fremont’s economy in various ways. Retirees and governments are important economic drivers for Fremont County, and because the GMUG provides government employment and amenities for retirees, any changes to these could have meaningful impacts on the local economy. Productivity is measured by gross domestic product per worker. At $83,200 per worker, Fremont County has a relatively greater productivity than most counties in the 10-county area of influence, though still below the national average ($94,400) (IBRC 2016). Economic productivity is a crucial determinant of living standards for future generations because productivity is interrelated with economic efficiency, and economies that lack efficiency risk being stagnant. Regarding economic diversity, Fremont County has a relatively average Shannon-Weaver diversity index of 0.68 (the State of Colorado is 0.76) in the 10-county analysis area (IMPLAN 2015). Economies with greater economic diversity are able to endure economic shocks and recessions better than highly specialized economies. Relative to contributions from the GMUG, because Fremont County is less diverse than the state, it would be more likely to experience changes in the local economy if the plan area’s contributions were to change. About 19 percent of all employees in Fremont County are in the creative class, which is similar to the national and less than the Colorado average (18 percent and 23 percent, respectively) (USDA ERS 2014). Local economies with a strong creative class of employment are in a better position to attract and retain younger talents. This will become increasingly important for counties with a sizable direct basic industry that is reliant on the retiree income category, especially if the number of incoming retirees decreases in the future. Fremont County has a market access classification as isolated (Headwaters Economics 2017), with a relatively low to average creative class employment, average economic diversity, and greater productivity than other counties in the area. Therefore, relative to plan area contributions, Fremont County is slightly more sensitive to subsequent economic effects, if any, on its local economy than others within the area of influence due to it being isolated and having a lower economic diversity. Timber and recreation are the only resource uses that are expected to differ among the alternatives. Grazing and minerals use, and subsequent economic impacts, are expected to remain at current conditions under all alternatives in the 10-county social and economic area of influence.
Garfield County
The GMUG contributes to Garfield’s economy in various ways, especially through recreation. Retirees, tourism, and governments are important economic drivers for Garfield County. Based on Garfield County’s reliance on the recreation industry and its dependence on the recreation opportunities (including scenery and other natural amenities) the GMUG provides, plan area direction has the potential to have meaningful impacts on the local economy.

USDA Forest Service
306
Productivity is measured by gross domestic product per worker. At $99,200 per worker, Garfield County is above the national average ($94,400) and is the highest in the 10-county social and economic area of influence (IBRC 2016). Economic productivity is a crucial determinant of living standards for future generations because productivity is interrelated with economic efficiency, and economies that lack efficiency risk being stagnant. Regarding economic diversity, Garfield County has a relatively average Shannon-Weaver diversity index of 0.70 (the State of Colorado is 0.76) in the 10-county analysis area (IMPLAN 2015). Economies with greater economic diversity are able to endure economic shocks and recessions better than highly specialized economies. About 22 percent of all employees in Garfield County are in the creative class, which is higher than the national and similar to the Colorado average (18 percent and 23 percent, respectively) (USDA ERS 2014). Local economies with a strong creative class of employment are in a better position to attract and retain younger talents. This will become increasingly important for counties with a sizable direct basic industry that is reliant on the retiree income category, especially if the number of incoming retirees decreases in the future. Garfield County is tourism-dependent but connected (Headwaters Economics 2017), with relatively average creative class employment and economic diversity, and higher productivity than other counties in the area. Therefore, relative to plan area contributions, Garfield County is less sensitive to subsequent economic effects, if any, on its local economy than others within the area of influence. Timber and recreation are the only resource uses that are expected to differ among the alternatives. Grazing and minerals use, and subsequent economic impacts, are expected to remain at current conditions under all alternatives in the 10-county social and economic area of influence. Counties with tourism-driven economies may experience the greatest benefit from alternative B because it proposes a balance between wildlife-related recreation and trail-based recreation. Alternative D may result in the greatest economic benefit related to wildlife-related recreation because it proposes the greatest amount of wildlife management areas, recommended wilderness, and special management areas, which would likely benefit wildlife, fishing, and hunting recreation opportunities and associated spending in the local economy. However, it would also result in more restrictions on future trail development, with fewer opportunities potentially resulting in less trail-based recreation spending. Alternatives B and D also allow a mix of non-motorized and motorized recreation opportunities. Alternative C provides direction to manage the highest percentage, compared to the other alternatives, of the GMUG land base as motorized during the summer and winter months, which would result in greater access and recreation spending. However, this could have negative impacts on wildlife that visitors rely on for fishing and hunting and could actually have longer-term negative impacts on recreation spending. Because alternative D would direct the agency to manage the majority of the GMUG as non-motorized in the winter, it may negatively impact recreation spending, though likely minimally.

GMUG National Forests Land Management Plan Draft Environmental Impact Statement: Volume 1
307
Gunnison County
The GMUG contributes to Gunnison County’s economy in various ways, especially through recreation. Retirees, tourism, and governments are important economic drivers for Gunnison County. Based on the county’s reliance on the recreation industry and its dependence on the recreation opportunities (including scenery and other natural amenities) the GMUG provides, plan area direction has the potential to have meaningful impacts on the local economy. Productivity is measured by gross domestic product per worker. At $72,600 per worker, Gunnison County is below the national average ($94,400) and is relatively lower in the 10-county social and economic area of influence (IBRC 2016). Economic productivity is a crucial determinant of living standards for future generations because productivity is interrelated with economic efficiency, and economies that lack efficiency risk being stagnant. Regarding economic diversity, Gunnison County has a relatively average Shannon-Weaver diversity index of 0.68 (the State of Colorado is 0.76) in the 10-county analysis area (IMPLAN 2015). Economies with greater economic diversity are able to endure economic shocks and recessions better than highly specialized economies. About 28 percent of all employees in Gunnison County are in the creative class, which is higher than the national and Colorado averages (18 percent and 23 percent, respectively) (USDA ERS 2014). Local economies with a strong creative class of employment are in a better position to attract and retain younger talents. This will become increasingly important for counties with a sizable direct basic industry that is reliant on the retiree income category, especially if the number of incoming retirees decreases in the future. Gunnison County is tourism-dependent but connected (Headwaters Economics 2017), with relatively high creative class employment, average economic diversity, and lower productivity than other counties in the area. Therefore, relative to plan area contributions, Gunnison County is less sensitive to subsequent economic effects, if any, on its local economy than others within the area of influence. Timber and recreation are the only resource uses that are expected to differ among the alternatives. Grazing and minerals use, and subsequent economic impacts, are expected to remain at current conditions under all alternatives in the 10-county social and economic area of influence. Counties with tourism-driven economies may experience the greatest benefit from alternative B because it proposes a balance between wildlife-related recreation and trail-based recreation. Alternative D may result in the greatest economic benefit related to wildlife-related recreation because it proposes the greatest amount of wildlife management areas, recommended wilderness, and special management areas, which would likely benefit wildlife, fishing, and hunting recreation opportunities and associated spending in the local economy. However, it would also result in more restrictions on future trail development, with fewer opportunities potentially resulting in less trail-based recreation spending. Alternatives B and D also allow a mix of non-motorized and motorized recreation opportunities. Alternative C provides direction to manage the highest percentage, compared to the other alternatives, of the GMUG land base as motorized during the summer and winter months, which would result in greater access and recreation spending. However, this

USDA Forest Service
308
could have negative impacts on wildlife that visitors rely on for fishing and hunting and could actually have longer-term negative impacts on recreation spending. Because alternative D would direct the agency to manage the majority of the GMUG as non-motorized in the winter, it may negatively impact recreation spending, though likely minimally.
Hinsdale County
The GMUG contributes to Hinsdale County’s economy in various ways, especially through recreation. Based on Hinsdale County’s reliance on the recreation industry and its dependence on the recreation opportunities (including scenery and other natural amenities) the GMUG provides, plan area direction has the potential to have meaningful impacts on the local economy. Productivity is measured by gross domestic product per worker. At $52,400 per worker, Hinsdale County is below the national average ($94,400) and has the lowest productivity per worker in the 10-county social and economic area of influence (IBRC 2016). Economic productivity is a crucial determinant of living standards for future generations because productivity is interrelated with economic efficiency, and economies that lack efficiency risk being stagnant. Regarding economic diversity, Hinsdale and Saguache Counties have the lowest Shannon-Weaver diversity index of 0.57 (the State of Colorado is 0.76) in the 10-county analysis area (IMPLAN 2015). Economies with greater economic diversity are able to endure economic shocks and recessions better than highly specialized economies. Relative to contributions from the GMUG, because Hinsdale County is less diverse, it would be more likely to experience changes in the local economy if the plan area’s contributions were to change. About 30 percent of all employees in Hinsdale County are in the creative class, which is above both the national and state averages (18 percent and 23 percent, respectively) (USDA ERS 2014). Local economies with a strong creative class of employment are in a better position to attract and retain younger talents. This will become increasingly important for counties with a sizable direct basic industry that is reliant on the retiree income category, especially if the number of incoming retirees decreases in the future. In addition to a slow-growing tourism-related labor force in the near future, the county is recreation-dependent and isolated (Headwaters Economics 2017), with a relatively high creative class employment but very low economic diversity and productivity. Therefore, relative to plan area contributions, Hinsdale County is more sensitive to subsequent economic effects, if any, on its local economy than others within the area of influence. Timber and recreation are the only resource uses that are expected to differ among the alternatives. Grazing and minerals use, and subsequent economic impacts, are expected to remain at current conditions under all alternatives in the 10-county social and economic area of influence. Counties with tourism-driven economies may experience the greatest benefit from alternative B because it proposes a balance between wildlife-related recreation and trail-based recreation. Alternative D may result in the greatest economic benefit related to wildlife-related recreation because it proposes the greatest amount of wildlife management

GMUG National Forests Land Management Plan Draft Environmental Impact Statement: Volume 1
309
areas, recommended wilderness, and special management areas, which would likely benefit wildlife, fishing, and hunting recreation opportunities and associated spending in the local economy. However, it would also result in more restrictions on future trail development, with fewer opportunities potentially resulting in less trail-based recreation spending. Alternatives B and D also allow a mix of non-motorized and motorized recreation opportunities. Alternative C provides direction to manage the highest percentage, compared to the other alternatives, of the GMUG land base as motorized during the summer and winter months, which would result in greater access and recreation spending. However, this could have negative impacts on wildlife that visitors rely on for fishing and hunting and could actually have longer-term negative impacts on recreation spending. Because alternative D would direct the agency to manage the majority of the GMUG as non-motorized in the winter, it may negatively impact recreation spending, though likely minimally.
Mesa County
The GMUG contributes to Mesa County’s economy in various ways, especially through recreation. Retirees, tourism, and governments are important economic drivers for Mesa County. Based on the county’s reliance on the recreation industry and its dependence on the recreation opportunities (including scenery and other natural amenities) the GMUG provides, plan area direction has the potential to have meaningful impacts on the local economy. Productivity is measured by gross domestic product per worker. At $90,600 per worker, Mesa County is below the national average ($94,400) but is the second highest in the 10-county social and economic area of influence (IBRC 2016). Economic productivity is a crucial determinant of living standards for future generations because productivity is interrelated with economic efficiency, and economies that lack efficiency risk being stagnant. Regarding economic diversity, Mesa County has a relatively high Shannon-Weaver diversity index of 0.73 (the State of Colorado is 0.76) in the 10-county analysis area (IMPLAN 2015). Economies with greater economic diversity are able to endure economic shocks and recessions better than highly specialized economies. About 23 percent of all employees in Mesa County are in the creative class, which is higher than the national average and similar to the Colorado average (18 percent and 23 percent, respectively) (USDA ERS 2014). Local economies with a strong creative class of employment are in a better position to attract and retain younger talents. This will become increasingly important for counties with a sizable direct basic industry that is reliant on the retiree income category, especially if the number of incoming retirees decreases in the future. Mesa County is tourism-dependent but has a market access classification as metro (Headwaters Economics 2017), with average creative class employment and higher economic diversity and productivity than other counties in the area. Therefore, relative to plan area contributions, Mesa County is less sensitive to subsequent economic effects, if any, on its local economy than others within the area of influence.

USDA Forest Service
310
Timber and recreation are the only resource uses that are expected to differ among the alternatives. Grazing and minerals use, and subsequent economic impacts, are expected to remain at current conditions under all alternatives in the 10-county social and economic area of influence. Counties with tourism-driven economies may experience the greatest benefit from alternative B because it proposes a balance between wildlife-related recreation and trail-based recreation. Alternative D may result in the greatest economic benefit related to wildlife-related recreation because it proposes the greatest amount of wildlife management areas, recommended wilderness, and special management areas, which would likely benefit wildlife, fishing, and hunting recreation opportunities and associated spending in the local economy. However, it would also result in more restrictions on future trail development, with fewer opportunities potentially resulting in less trail-based recreation spending. Alternatives B and D also allow a mix of non-motorized and motorized recreation opportunities. Alternative C provides direction to manage the highest percentage, compared to the other alternatives, of the GMUG land base as motorized during the summer and winter months, which would result in greater access and recreation spending. However, this could have negative impacts on wildlife that visitors rely on for fishing and hunting and could actually have longer-term negative impacts on recreation spending. Because alternative D would direct the agency to manage the majority of the GMUG as non-motorized in the winter, it may negatively impact recreation spending, though likely minimally.
Montrose County
The GMUG contributes to Montrose County’s economy in various ways, especially through recreation and agriculture. Based on the county’s reliance on the recreation industry and its dependence on the recreation opportunities (including scenery and other natural amenities) the GMUG provides, plan area direction has the potential to have meaningful impacts on the local economy. Productivity is measured by gross domestic product per worker. At $80,300 per worker, Montrose County is below the national average ($94,400) and has a relatively high productivity per worker in the 10-county social and economic area of influence (IBRC 2016). Economic productivity is a crucial determinant of living standards for future generations because productivity is interrelated with economic efficiency, and economies that lack efficiency risk being stagnant. Regarding economic diversity, Montrose County has a relatively high Shannon-Weaver diversity index of 0.72 (the State of Colorado is 0.76) in the 10-county analysis area (IMPLAN 2015). Economies with greater economic diversity are able to endure economic shocks and recessions better than highly specialized economies. Relative to contributions from the GMUG, because Montrose County is more diverse, it would be less likely to experience changes in the local economy if the plan area’s contributions were to change. About 19 percent of all employees in Montrose County are in the creative class, which is similar to the national and less than the Colorado average (18 percent and 23 percent, respectively) (USDA ERS 2014). Local economies with a strong creative class of employment are in a better position to attract and retain younger talents. This will become

GMUG National Forests Land Management Plan Draft Environmental Impact Statement: Volume 1
311
increasingly important for counties with a sizable direct basic industry that is reliant on the retiree income category, especially if the number of incoming retirees decreases in the future. Montrose County is recreation-dependent but connected (Headwaters Economics 2017), with a relatively low creative class employment and higher economic diversity and productivity than other counties in the area. Therefore, relative to plan area contributions, Montrose County is less sensitive to subsequent economic effects, if any, on its local economy than others within the area of influence. Timber and recreation are the only resource uses that are expected to differ among the alternatives. Grazing and minerals use, and subsequent economic impacts, are expected to remain at current conditions under all alternatives in the 10-county social and economic area of influence. Counties with tourism-driven economies may experience the greatest benefit from alternative B because it proposes a balance between wildlife-related recreation and trail-based recreation. Alternative D may result in the greatest economic benefit related to wildlife-related recreation because it proposes the greatest amount of wildlife management areas, recommended wilderness, and special management areas, which would likely benefit wildlife, fishing, and hunting recreation opportunities and associated spending in the local economy. However, it would also result in more restrictions on future trail development, with fewer opportunities potentially resulting in less trail-based recreation spending. Alternatives B and D also allow a mix of non-motorized and motorized recreation opportunities. Alternative C provides direction to manage the highest percentage, compared to the other alternatives, of the GMUG land base as motorized during the summer and winter months, which would result in greater access and recreation spending. However, this could have negative impacts on wildlife that visitors rely on for fishing and hunting and could actually have longer-term negative impacts on recreation spending. Because alternative D would direct the agency to manage the majority of the GMUG as non-motorized in the winter, it may negatively impact recreation spending, though likely minimally.
Ouray County
The GMUG contributes to Ouray County’s economy in various ways, especially through recreation. Based on the county’s reliance on the recreation industry and its dependence on the recreation opportunities (including scenery and other natural amenities) the GMUG provides, plan area direction has the potential to have meaningful impacts on the local economy. Productivity is measured by gross domestic product per worker. At $63,400 per worker, Ouray County is below the national average ($94,400) and has relatively low productivity per worker in the 10-county social and economic area of influence (IBRC 2016). Economic productivity is a crucial determinant of living standards for future generations because productivity is interrelated with economic efficiency, and economies that lack efficiency risk being stagnant. Regarding economic diversity, Ouray County has a relatively average to low Shannon-Weaver diversity index of 0.67 (the State of Colorado is 0.76) in the 10-county analysis area

USDA Forest Service
312
(IMPLAN 2015). Economies with greater economic diversity are able to endure economic shocks and recessions better than highly specialized economies. About 29 percent of all employees in Ouray County are in the creative class, which is above both the national and state averages (18 percent and 23 percent, respectively) (USDA ERS 2014). Local economies with a strong creative class of employment are in a better position to attract and retain younger talents. This will become increasingly important for counties with a sizable direct basic industry that is reliant on the retiree income category, especially if the number of incoming retirees decreases in the future. In addition to a growing tourism-related labor force in the near future, the county is recreation-dependent and connected (Headwaters Economics 2017), with a relatively high creative class employment but low productivity and average to low economic diversity. Therefore, relative to plan area contributions, Ouray County is slightly more sensitive to subsequent economic effects, if any, on its local economy than others within the area of influence. Timber and recreation are the only resource uses that are expected to differ among the alternatives. Grazing and minerals use, and subsequent economic impacts, are expected to remain at current conditions under all alternatives in the 10-county social and economic area of influence. Counties with tourism-driven economies may experience the greatest benefit from alternative B because it proposes a balance between wildlife-related recreation and trail-based recreation. Alternative D may result in the greatest economic benefit related to wildlife-related recreation because it proposes the greatest amount of wildlife management areas, recommended wilderness, and special management areas, which would likely benefit wildlife, fishing, and hunting recreation opportunities and associated spending in the local economy. However, it would also result in more restrictions on future trail development, with fewer opportunities potentially resulting in less trail-based recreation spending. Alternatives B and D also allow a mix of non-motorized and motorized recreation opportunities. Alternative C provides direction to manage the highest percentage, compared to the other alternatives, of the GMUG land base as motorized during the summer and winter months, which would result in greater access and recreation spending. However, this could have negative impacts on wildlife that visitors rely on for fishing and hunting and could actually have longer-term negative impacts on recreation spending. Because alternative D would direct the agency to manage the majority of the GMUG as non-motorized in the winter, it may negatively impact recreation spending, though likely minimally.
Saguache County
The GMUG contributes to Saguache County’s economy in various ways, especially through production agriculture and the agricultural services industry. Based on the county’s reliance on the agriculture industry, plan area direction has the potential to have meaningful impacts on the local economy. Productivity is measured by gross domestic product per worker. At $78,200 per worker, Saguache County is below the national average ($94,400) but on par with the average productivity per worker in the 10-county social and economic area of influence (IBRC

GMUG National Forests Land Management Plan Draft Environmental Impact Statement: Volume 1
313
2016). Economic productivity is a crucial determinant of living standards for future generations because productivity is interrelated with economic efficiency, and economies that lack efficiency risk being stagnant. Regarding economic diversity, Hinsdale and Saguache Counties have the lowest Shannon-Weaver diversity index of 0.57 (the State of Colorado is 0.76) in the 10-county analysis area (IMPLAN 2015). Economies with greater economic diversity are able to endure economic shocks and recessions better than highly specialized economies. Relative to contributions from the GMUG, because Saguache County is less diverse, it would be more likely to experience changes in the local economy if the plan area’s contributions were to change. About 15 percent of all employees in Saguache County are in the creative class, which is below both the national and state averages (18 percent and 23 percent, respectively) (USDA ERS 2014). Local economies with a strong creative class of employment are in a better position to attract and retain younger talents. This will become increasingly important for counties with a sizable direct basic industry that is reliant on the retiree income category, especially if the number of incoming retirees decreases in the future. The county’s economy is driven by agriculture and isolated (Headwaters Economics 2017), with a relatively low creative class employment, relatively low economic diversity, and average productivity. Therefore, relative to plan area contributions, Saguache County is much more sensitive to subsequent economic effects, if any, on its local economy than others within the area of influence. Timber and recreation are the only resource uses that are expected to differ among the alternatives. Grazing and minerals use, and subsequent economic impacts, are expected to remain at current conditions under all alternatives in the 10-county social and economic area of influence.
San Miguel County
The GMUG contributes to San Miguel County’s economy in various ways, especially through recreation. Based on the county’s reliance on the recreation industry and its dependence on the recreation opportunities (including scenery and other natural amenities) the GMUG provides, plan area direction has the potential to have meaningful impacts on the local economy. Productivity is measured by gross domestic product per worker. At $52,900 per worker, San Miguel County is below the national average ($94,400) and has a relatively low productivity per worker in the 10-county social and economic area of influence (IBRC 2016). Economic productivity is a crucial determinant of living standards for future generations because productivity is interrelated with economic efficiency, and economies that lack efficiency risk being stagnant. Regarding economic diversity, San Miguel County has a relatively low Shannon-Weaver diversity index of 0.65 (the State of Colorado is 0.76) in the 10-county analysis area (IMPLAN 2015). Economies with greater economic diversity are able to endure economic shocks and recessions better than highly specialized economies. Relative to contributions from the GMUG, because San Miguel County is less diverse, it would be more likely to experience changes in the local economy if the plan area’s contributions were to change.

USDA Forest Service
314
About 37 percent of all employees in San Miguel County are in the creative class, which is above both the national and state averages (18 percent and 23 percent, respectively) (USDA ERS 2014). Local economies with a strong creative class of employment are in a better position to attract and retain younger talents. This will become increasingly important for counties with a sizable direct basic industry that is reliant on the retiree income category, especially if the number of incoming retirees decreases in the future. In addition to a growing tourism-related labor force, the county is recreation-dependent and connected (Headwaters Economics 2017), with a relatively high creative class employment but low economic diversity and productivity. Therefore, relative to plan area contributions, San Miguel County is slightly more sensitive to subsequent economic effects, if any, on its local economy than others within the area of influence. Timber and recreation are the only resource uses that are expected to differ among the alternatives. Grazing and minerals use, and subsequent economic impacts, are expected to remain at current conditions under all alternatives in the 10-county social and economic area of influence. Counties with tourism-driven economies may experience the greatest benefit from alternative B because it proposes a balance between wildlife-related recreation and trail-based recreation. Alternative D may result in the greatest economic benefit related to wildlife-related recreation because it proposes the greatest amount of wildlife management areas, recommended wilderness, and special management areas, which would likely benefit wildlife, fishing, and hunting recreation opportunities and associated spending in the local economy. However, it would also result in more restrictions on future trail development, with fewer opportunities potentially resulting in less trail-based recreation spending. Alternatives B and D also allow a mix of non-motorized and motorized recreation opportunities. Alternative C provides direction to manage the highest percentage, compared to the other alternatives, of the GMUG land base as motorized during the summer and winter months, which would result in greater access and recreation spending. However, this could have negative impacts on wildlife that visitors rely on for fishing and hunting and could actually have longer-term negative impacts on recreation spending. Because alternative D would direct the agency to manage the majority of the GMUG as non-motorized in the winter, it may negatively impact recreation spending, though likely minimally.
Cumulative Effects Increasing human populations are increasing the overall demand for all types of recreation on all public lands in the GMUG and surrounding areas. As tourism-driven economies expand, cumulative positive economic impacts from recreation spending will continue to grow. If demand for wood products increases, so too will demand for timber sales from the GMUG, and associated economic impacts will increase. Alternatively, if demand decreases and mills close, there may be less demand for GMUG timber. A decrease in timber demand may reduce the amount of timber sold under all alternatives, which would result in a loss of jobs and income in the area.

GMUG National Forests Land Management Plan Draft Environmental Impact Statement: Volume 1
315
The Great American Outdoors Act provided the USDA Forest Service with new opportunities to deliver benefits to the American public through major investments in recreation infrastructure, public lands access, and land and water conservation. These investments will also contribute to economic growth and job creation in rural America. While specific Great American Outdoors Act projects on and around the GMUG are still being determined, the projects will likely increase recreation use on and around the GMUG, which will result in corresponding increases in visitor spending and economic effects. The 2015 Colorado Parks and Wildlife Strategic Plan has goals and objectives regarding maintenance of sustainable wildlife populations to support the broad array of recreation opportunities that they provide (USDA Forest Service 2018, recreation assessment). The 2016–2026 Colorado Parks and Wildlife Statewide Trails Strategic Plan provides trail opportunities and protects sensitive species and wildlife habitat. These positive cumulative impacts to wildlife on and around the GMUG will support social and economic sustainability via the economic contributions associated with recreation opportunities that are reliant on wildlife. County plans are generally geared toward continued economic development and sustainably managed natural resources, which would also have positive cumulative impacts to social and economic resources.
Conclusion The effects of plan direction under all alternatives would be to continue to contribute to social and economic sustainability because in all cases, plan direction provides for timber production, grazing, mineral development and extraction, and recreation opportunities, which result in jobs and income for local economies. Economic contributions from timber will continue, though at a greater level under alternatives B and C. It is important to note that the economic contributions from the GMUG are a very small portion of total jobs in the analysis area; while local impacts may be greater, the overall impact of changes to the economy from the plan direction are minimal. Ecosystem services will continue to be provided under the draft revised forest plan. Outdoor recreation, especially fishing and hunting, was identified as a key ecosystem service. Alternative D provides the greatest acreage of wildlife management areas, recommended wilderness, and special management areas combined to support the wildlife for these recreation activities. This could result in greater visitor spending for hunting and fishing, which would contribute to social and economic sustainability. Alternative B provides a balance of wildlife- and trail-based recreation opportunities, which could support a broader range of outdoor recreation services that contribute to social and economic sustainability.
Multiple Uses and Ecosystem Services The GMUG National Forests provide a wide range of resources, experiences, and benefits to people and communities, contributing to social and economic sustainability in the broader landscape. This section describes the multiple uses and key ecosystem services that the national forests provide.

USDA Forest Service
316
Cultural and Historic Resources
Affected Environment A detailed description of the affected environment for cultural and historic resources is provided in the assessment (USDA Forest Service 2018, benefits to people, areas of Tribal importance, and cultural and historic resources). This information is summarized below for the environmental analysis. Also refer to the assessment for a discussion of prehistoric and historic occupation, and the administrative history of the GMUG.
Areas of Tribal Importance
The plan area is entirely within the ancestral homeland of the Utes who, despite their removal in the 1870s, have maintained deep cultural ties to the area. Therefore, the entire planning area can be considered an area of Tribal importance. It is generally accepted by researchers that the Utes were the primary occupants of the mountains and western portion of Colorado for at least the last 500 years. As a result, the majority of archaeological sites in the plan area are attributed to Ute occupation. Several other American Indian Tribes and communities may also have cultural ties to the plan area including the Navajo, Pueblos, and Jicarilla Apache, and possibly Paiute and Eastern Shoshone. The far western edge of the GMUG also contains cultural sites likely associated with Puebloan groups, including Hopi. The Ute people are culturally and spiritually affiliated to places within the planning area, including the Uncompahgre Plateau and the San Juan Mountains, in general. Tribal members depend on an array of forest products for traditional uses, and most of the Tribes affiliated with the GMUG National Forests have treaty rights to hunt and gather these resources within the plan area. Many archaeological sites and features within the planning area are affiliated to the Utes, particularly wickiup sites and culturally modified trees dispersed throughout the Uncompahgre Plateau and the Cochetopa Hills. Through previous consultations and meetings, Tribes have identified different types of areas of importance in the GMUG. These include archaeological sites and cultural landscapes, specific landforms, landscape features, and plant communities. These places have importance both to Tribal history and identity as well as to the ritual, social, and economic life of individual Tribal members. More areas of importance will likely be identified in the future, as deemed appropriate by Tribes and in association with projects and activities in the GMUG. Currently, no traditional cultural properties or sacred sites are formally identified within the plan area. However, Uncompahgre Peak, the highest peak in the San Juan Mountains, has been identified as a sacred peak during past consultations with the Utes.
Sustainability of Tribal Areas of Importance and Uses
The GMUG National Forests provide many ecosystem services important to Tribes, including opportunities for religious pilgrimages to place offerings at sacred sites or other culturally important places. The GMUG produces provisions for Tribes such as game and fish for sustenance, fresh water for drinking, and wood and fiber for heating, cooking, and construction. The GMUG also provides supporting services to Tribes including plants for

GMUG National Forests Land Management Plan Draft Environmental Impact Statement: Volume 1
317
gathering for food and medicine, plant pigments, and stone and minerals for tools and agriculture. Current and future drivers and stressors include climate change, fire management, land acquisition and disposal, limiting and increasing access to National Forest System lands, mineral development, grazing, expanding recreation use, vandalism, and theft. Tribal resources at risk in the GMUG include certain culturally and traditionally important plants and fire-sensitive archaeological features, including culturally modified trees and wickiups.
Cultural Resources
Approximately 217,000 acres (7 percent) of the GMUG have been surveyed for cultural resources. The current status of known cultural resources and sites is summarized in table 137. Cultural site condition data are provided in table 138. More than 63 percent of the total known cultural resources have no condition information.
Table 137. Current status of cultural resources in the GMUG National Forests
Prehistoric Historic Undetermined Eligible
Sites
Non-Eligible
Sites Evaluated Resources
Unevaluated Resources Total
4,125 2,428 919 773 5,437 6,283 1,374 7,657
Table 138. Cultural site condition data for the GMUG National Forests
Condition Number of Sites No data 4,858 Excellent 30 Undisturbed 167 Light disturbance 623 Good 325 Moderate disturbance 489 Fair 195 Poor / deteriorated 89 Ruins 242 Heavy disturbance 413 Destroyed / total disturbance 50 Disturbed extent unknown 133 51 to 75 percent intact 2 Unknown 41
Sixteen historic properties listed in the National Register of Historic Places and 48 priority heritage assets occur in the GMUG. No traditional cultural properties occur in the plan area. However, a series of Hispano sheepherder sites near Lone Cone Peak in the Norwood District has been identified as a potential traditional cultural property. Documentation and

USDA Forest Service
318
evaluation of this area is currently underway. One cultural special interest area occurs in the plan area, the Alpine Tunnel Historic District (National Register District).
Sustainability of Cultural Resources and Uses
Basic monitoring data indicate that most archaeological sites are in stable condition; however, most historic sites with standing architecture are in deteriorating condition. Weathering, sunlight, moisture, wind, and other natural factors have always posed challenges for protecting cultural resources. Climate change projections indicate that these irreplaceable resources are likely to be altered, deteriorated, or removed at faster rates or in ways not previously observed. Vandalism and unauthorized collection of surface artifacts is increasing, particularly involving sites close to recreation features such as roads and trails. Contemporary uses of resources and characteristics of the plan area by Native American, Hispanic, and Anglo-American traditional communities are critical to maintaining the identity of these communities. While cultural tourism can potentially threaten ecosystems and resources if not carefully managed, such tourism has tremendous benefits for the local and state economy by contributing to the lodging, food and beverage, retail, and recreation/entertainment economic sectors. In 2015, heritage tourism spending in Colorado amounted to $7.2 billion, and $15.8 million in overnight heritage tourism.
Environmental Consequences
Analysis Framework
The following analysis features a qualitative discussion of the potential effects of plan components, as well as a comparison of alternatives.
Effects Common to All Alternatives
Any project the GMUG plans, proposes, performs, conducts, supports, and/or completes may have the potential to directly affect significant cultural resources (i.e., historic properties) in the form of ground-disturbing activity. Potential impacts to cultural resources from ground-disturbing activity includes the alteration or destruction of artifacts or cultural features on the surface, as well as damage to site soil matrices and depositional strata. There is a potential for ground disturbance resulting from vehicles, personnel, and/or equipment used during the course of any potential project or activity carried out by the GMUG. Disturbance and/or destruction of surface cultural material is the greatest threat of any potentially proposed undertaking; however, shallow subsurface deposits (i.e., 1 to 30 cm below the ground surface) are also in danger of disturbance and/or destruction. Potential indirect effects caused from any project the GMUG plans, proposes, performs, conducts, supports, and/or completes may include the destruction of archaeological contexts due to ground disturbance, vegetation removal and any resultant erosion, deflation, vandalism, or artifact collection. Archaeological contexts that were initially protected from direct effects may potentially be negatively affected at a later time by erosion, deflation, and degradation of sediments and soils due to vegetation removal and/or other activities. Increased public access to archaeological sites due to roads, trails, vegetation clearing, etc.

GMUG National Forests Land Management Plan Draft Environmental Impact Statement: Volume 1
319
as a result of project work may also have the potential to negatively affect these resources in the form of increased looting and vandalism.
Effects Common to All Action Alternatives
At a forest plan level, the environmental consequences associated with all of the proposed alternatives are similar regarding potential effects to cultural resources because the alternatives are broad in scope and undefined at a project level. There are wide variations in some categories within the range of alternatives; however, in most cases the net potential for adverse effects to cultural resources is expected to be similar because all known (and unknown) sites within any given treatment area (regardless of the type of treatment or project) would have the potential to be directly affected and/or indirectly affected in similar ways by the project activities. Additionally, indirect effects in the form of resultant erosion and deflation from vegetation loss or other ground disturbance associated with either prescribed burning or timber harvesting activities has the potential to adversely affect cultural resources. All future proposed actions that tier to forest plan direction that have the potential to affect cultural resources will be subject to compliance with section 106 of the National Historic Preservation Act, which always consists of a cultural resource inventory of some kind, and then appropriate avoidance and/or mitigation measures. Different mitigation and avoidance measures would be used for different treatment activities, but the potential adverse effects to cultural resources would essentially be equivalent (direct damage and destruction by personnel, vehicles, or equipment; or indirect erosion, deflation, or site contextual degradation). In the draft plan, the focus shifts more to integrated resource management; for example, the objective and standard regarding mapping and avoiding fire-sensitive cultural resource sites. Compared to the current plan, there is also more emphasis in the draft plan on active management and stabilization of resources versus simply avoiding the resource. The combined effect of this direction would be more holistic management that may better protect, maintain, and restore cultural resources in the GMUG. Also, the draft plan addresses the Old Spanish Trail whereas the 1991 forest plan did not. Draft plan direction significantly increases protection of this resource by providing standards and guidelines for active management of the Old Spanish Trail. See the Designated Trails section for a discussion of effects to the Old Spanish Trail.
Effects of Alternative A – No-Action Alternative
Under the no-action alternative, the GMUG would continue to operate under the current 1983 forest plan. The plan has not been updated, and it was amended in 1991 to include direction on timber management. The plan currently assigns 2.9 million acres of National Forest System Lands into one of 20 areas. Key components of the 1991 Forest Plan directed that “cultural resources will be protected by avoidance and/or study”; only “high sensitivity” areas will be surveyed; must protect, use, or interpret ALL historic properties; prevent deterioration of all eligible or listed historic structures; and nominate all eligible resources to the NRHP. Plan direction provides for identification, evaluation, nomination, protection, and interpretation of cultural resources would occur. Coordination and consultation with the

USDA Forest Service
320
Colorado State Office of Historic Preservation is also required. Sites eligible for the listing on the National Register of Historic Places must be evaluated and formally nominated. Protection protocols and mitigation measures are used when cultural resources or sacred sites are identified or inadvertently discovered during project activities.
Effects of Alternative B
Alternative B represents a balance of between general active management and more restrictive management. Currently 36 percent of the GMUG is identified as general forest; however, in alternative B, 25 percent of the GMUG would be identified as a wildlife management area to maintain existing backcountry character and big game habitat in context of increasing recreation trail development. While trail development and maintenance would be limited in these wildlife management areas, studies have indicated that increased and improved public access could have an adverse effect to cultural resources in the form of vandalism and looting of sites. If more recreation opportunities are offered under alternative B, indirect effects from recreation management could increase vandalism if new trails are built in areas that have never before been accessed by people, or if existing trails have improved access.
Effects of Alternative C
Alternative C represents the greatest amount of area in the General Forest Management Area category, which would provide the most management flexibility for ongoing and future multiple uses on the GMUG. There would be a small amount of the GMUG in discretionary management categories. Under this alternative no additional wilderness is proposed, and only three wildlife management areas are proposed. Also, this alternative proposed the most acres for timber harvest and fuels treatments. Since conducting vegetation management is a ground disturbing action, cultural resources could be impacted. However, by managing hazardous fuel loads in the event of an unplanned fire fire intensity would be much lower, and the fire behavior would not be as erratic and unpredictable. Cultural resources that have been burned over (with minimal or no damage) for hundreds of years, or perhaps thousands of years as part of the natural fire ecology, would have a lower potential to be damaged or destroyed by a very high intensity fire.
Effects of Alternative D
Alternative D proposes the greatest amount of area as potential recommended wilderness. Special management areas are excluded from timber production and are generally identified as semi-primitive, and motorized recreation generally is not permitted in these areas. Special management areas also contain a variety of recreation- and travel-related direction. Given the emphasis of alternative D on conservation, effects to and potential inadvertent discoveries of cultural resources from management activities would be expected to decrease. Moreover, a positive effect of wilderness creation would be decreased management activities and by extension, fewer direct effects to cultural resources. However, creation of new wilderness areas could pose indirect effects to cultural resources. Indirect effects could include restricted access to sacred sites or traditional cultural properties, or threats of wildfire in overgrown areas.

GMUG National Forests Land Management Plan Draft Environmental Impact Statement: Volume 1
321
Effects to Cultural and Heritage Resources by Management of Other Resources
Effects from livestock management common to all alternatives include trailing along fence lines and loafing of cattle around water developments. Effects on cultural resources from road management, construction, and reconstruction would include altering drainage patterns that may result in erosion. Purchase or exchange of often has positive effects on cultural resources. Cultural resources are afforded more protections when the land is federally managed. Negative effects could include the potential for increased vandalism. Effects of wildland fire could include the exposure of artifacts to vandalism, erosion, and grazing of wild and domesticated ungulates seeking the fresh regrowth as well as loss of the resource. Mineral extraction impacts are expected to be similar to those from increased timber harvest and recreation. All action alternatives would have some potential commitments of non-renewable cultural resources. Examples are inadvertently damaged and destroyed sites, vandalized or looted sites, or as yet undiscovered sites that are undergoing loss from natural forces. Every alternative seeks to reduce this loss through inventory, monitoring, project evaluation, and improved project implementation to assure that loss is kept to a minimum.
Cumulative Effects
The loss of cultural resources generally occurred before better research methods were developed. Before the advent of the National Historic Preservation Act, previous management, or the lack thereof, resulted in cultural resources being unprotected, which typically rendered the resources as not eligible for inclusion in the National Register of Historic Places. Past and future forest management projects can cause surface disturbance, bring additional people into contact with cultural resources, and affect the integrity of historic structures. Over time, additional range improvements and domesticated ungulate grazing, especially in early springtime, could result in adverse cumulative effects to cultural resources. Population growth and public desire for new recreational experiences in conjunction with trail development on bordering Bureau of Land Management lands could result in adverse cumulative effects to cultural resources. Alternatives that result in more acres of management activities would result in increased acres of inventory. The additional required inventory and evaluation would result in more cultural resources being documented and protected from adverse effects caused by natural processes. Ground disturbance associated with implementing all alternatives may result in the inadvertent discovery of and potential damage to cultural resources or sacred sites. Protection protocols are in place under all alternatives.
Conclusion
Consistent with 36 CFR 219.8(b), the effects of plan direction would be to contribute to social and economic stability because the plan direction would continue to maintain, preserve, and restore cultural resources that are important to Tribal communities, as well as local and national communities.

USDA Forest Service
322
Energy and Mineral Resources and Geologic Hazards
Affected Environment A detailed description of the affected environment for energy and mineral resources and geologic hazards is included in the energy and mineral resources assessment (USDA Forest Service 2018) and is hereby incorporated by reference. This information is summarized below for the environmental analysis.
Renewable Energy
A small portion of the GMUG National Forests is considered suitable for solar or wind development. To date, renewable energy development, including commercial solar and wind, in the GMUG has not been proposed or developed. Due to climate-change concerns and increasing cost-competitiveness of solar photovoltaic, these renewable energy technologies and developments may continue to expand, but it is unknown whether this will affect the limited suitable acreage in the GMUG. The GMUG has three commercial-scale hydroelectric plants within its proclaimed boundaries: the Ames Hydroelectric Plant near Ophir, Colorado; Smuggler-Union Hydroelectric Power Plant near Telluride, Colorado; and Ouray Hydroelectric Power Plant in Ouray, Colorado. To date, seven geothermal leases totaling approximately 13,000 acres have been issued in the GMUG. However, five of these expired without being developed, and no proposals to develop the other two have been submitted. The majority of the GMUG is considered low to medium potential for geothermal energy. Approximately 303,462 acres have low potential, 197,623 acres have medium-low potential, 219,738 acres have medium potential, and 1,730 acres have medium-high potential (Zvolanek et al. 2013). Aspen trees may be the most economical forest product from the GMUG for biomass production; however, the GMUG currently has only low suitability (751,571 acres) for commercial biomass production because of various factors including distance to transmission lines, haul distances, etc. (Zvolanek et al. 2013). The Eagle Valley Clean Energy Biomass facility in Gypsum, Colorado, is the nearest power plant. Some aspen from the GMUG may be suitable for use in this facility.
Nonrenewable Energy and Minerals
The plan area encompasses portions of the Southern Piceance and Paradox gas-producing basins. Four gas fields occur in the plan area, including the Grand Mesa, Ragged Mountain, Oil Well Mountain, and Coal Basin fields of the Southern Piceance Basin (Carroll 2003). Approximately 900,000 acres of the GMUG have moderate to high geologic potential for oil and gas resources (USDA Forest Service 1993), although only 752,478 acres (23.8 percent of the GMUG) is available for leasing. Areas with low or no potential were not considered in the leasing analysis. More recent estimates indicate approximately 704,000 acres with moderate to high potential for oil and gas resources (Fowler and Gallagher 2004; Spencer 2006). The U.S. Geological Survey (Fact Sheet 2016-3030 (Hawkins et al. 2016) and Fact Sheet 2019-3027 (Drake et al. 2019)) estimates the Piceance has higher natural gas potential

GMUG National Forests Land Management Plan Draft Environmental Impact Statement: Volume 1
323
than previous assessments from the mid-1990s and early 2000s that could be extracted from unconventional methods. Oil and gas lease development and production has been sporadic in the GMUG since the 1980s, and current development is less than projected. The majority of oil and gas leases, development, and producing wells occurs on the Paonia Ranger District. It is difficult to predict future trends, given the volatile nature of oil and gas development in the area. Future interest and development will depend on gas prices and regulatory constraints. Portions of the GMUG National Forests have high potential for the occurrence of coal in several geologic formations. Based on Hettinger et al. (2000), the GMUG contains portions of five recognized coalfields: Carbondale, Crested Butte, Somerset, Grand Mesa, and Tongue Mesa. The only coalfield currently producing is the Somerset field near Somerset, Colorado, on the Paonia Ranger District. Coal production, values, and associated employment have been variable, but in decline since 2012. Coal demand is most susceptible to the price of natural gas—the lower the gas price, the lower the demand for coal. Coal production and use in power generation is expected to continue to decline during the plan horizon for various reasons, including climate change. Historic locatable mineral mining in the GMUG has included gold, silver, lead, copper, uranium, molybdenum, and other minerals with unique properties primarily in Gunnison, Ouray, San Juan, and San Miguel Counties. At present, there is no active production for locatable minerals occurring in the GMUG, and current trends do not indicate an increase in proposed production during the planning period. According to Bureau of Land Management data (LR2000 database, snapshot on April 1, 2016), there are 1,752 unpatented mining claims or owners in the vicinity with approximately 26,420 acres of claims in the GMUG, including 18 active plans of operations in place or under review. Since about 2018 there has been an increase in recreational prospecting interest as well as fringe leasing to connect patented claims. Locatable mineral production on private lands near Ouray is also in the process of resuming. About 600 abandoned mine sites have been inventoried and evaluated in the GMUG. About 800 mine-related features such as waste rock dumps and mill tailings piles were identified that could negatively affect environmental resources. About 850 features such as adits, shafts, and highwalls were identified as public safety hazards; approximately 206 of these have been mitigated or authorized for mitigation. The State of Colorado currently identifies 16 to 18 stream segments totaling approximately 49 to 60 miles within the GMUG boundaries that do not meet water quality standards due to metal concentrations likely related to historic mining activities (see the Water Resources section for more information). Mineral materials (common varieties of sand, gravel, stone, riprap, landscaping material, fill, etc.) use in the GMUG typically ranges from 5,000 to 10,000 tons per year. There are 25 mineral material sites (gravel pits), most of which have been mined for road maintenance and dam maintenance projects across the GMUG National Forests. In fiscal year 2015, there were 26 permits for mineral materials.
Geologic Hazards
Geologic hazards in the GMUG National Forests may occur in the form of landslides and rock falls, and earth or snow movement due to unstable or steep slopes. A combination of

USDA Forest Service
324
soil type, parent material, slope, and topography determine geologic hazard. Flood events, water infrastructure (such as dams and irrigation ditches), and ground disturbance (such as road cuts) may amplify geologic hazards. Recorded seismic activity in the area has been tied to underground coal mining and may also be related to injection wells located on private land. Seismic events have also been recorded associated with fault lines, folds, and other unspecified causes.
Sustainability of Energy and Mineral Resources and Uses
Due to climate change concerns, renewable energy interest may continue to grow; however, it is unknown whether this will affect the limited suitable acres in the GMUG National Forests. Development of oil and gas leases has been sporadic since the 1980s, and current development is less than projected for this period. It is difficult to predict future trends of oil and gas development given the volatile nature of the market, which is dependent on gas prices. Coal production and values have been variable, but mostly in decline since 2012. Employment related to coal in the North Fork Valley has declined in the past 9 years, with over 85 percent reduction in local employment in this sector. The Energy Information Administration projects coal continuing in the U.S. energy mix from 2021 to at least year 2050 at rates that continue to decline in the first decade then level off, which will continue to be inversely tied to natural gas prices. New technologies will drive the ability to extract mineral resources. Resources that were once uneconomical or unable to be produced can become feasible through technological advances. It is likely that additional upgrades or new infrastructure will be proposed in the near term, particularly for oil and gas. Infrastructure related to methane use or capture at coal mines may continue to be utilized during the planning period. Geologic hazards may be amplified by extreme weather events due to climate change.
Environmental Consequences
Analysis Framework
This section continues to focus on trends and opportunities as plan components and management areas are applied because minerals and energy development are subject to factors beyond agency control such as market conditions. The following issues have also been considered in this section:
• Considering plan direction that takes into account a changing climate, including adaptive responses to impacts of climate change.
• Considering plan direction to ensure that future air pollution from atmospheric pollutant deposition or critical load exceedances do not degrade GMUG air quality resources over the long term.
Management Direction
Many regulations have been promulgated and policies have been developed since the 1983 forest plan that dictate how energy and minerals resources are considered by various Federal

GMUG National Forests Land Management Plan Draft Environmental Impact Statement: Volume 1
325
and State agencies. These regulations and policies are incorporated by reference into the plan components to avoid duplication and to allow for adaptive management as regulations and policies are updated and to maintain relevancy. Other plan direction is contained within appropriate resource sections instead of a section that only addresses energy and minerals. Proposed activities would also be required to comply with other laws such as the Clean Air Act, Clean Water Act, Endangered Species Act, National Historic Preservation Act, etc.
Effects Common to All Alternatives
Renewable Energy
All alternatives allow for consideration of renewable energy development (i.e., solar, geothermal, wind, and hydroelectric) consistent with law, regulation, and policy and other landscape-scale planning efforts. Plan components and management areas may constrain the areas specifically available for surface development. Physical site (aspect, slope, vegetation, etc.) properties and proximity to the power grid may further hinder development opportunities or desirability. Renewable energy technologies are expected to become more advanced during the plan duration, which may make the GMUG National Forests more attractive to these industries and contribute to social and economic sustainability and help reduce effects on climate change compared to nonrenewable energy. As these activities are proponent or applicant-driven, the Forest Service has no way to predict at this time what areas may be of interest in the future. Future proposals would require site-specific analysis consistent with plan requirements and public involvement. Commercial-scale hydroelectric plant proposals are not expected to increase in number during the plan duration for several reasons including: distance to the power grid, permitting requirements on Federal lands with other agencies, and if climate predictions are correct, less reliable water quantity. Biomass production (specifically aspen) would be subject to market conditions and haul distance, and would also be required to meet forest plan direction and contract terms that relate to the timber resource. While biomass is more ecologically sustainable than fossil fuels, combustion of biomass materials also releases greenhouse gases that contribute to climate change; however, this would be expected to be offset by regenerating aspen stands.
Nonrenewable Energy and Minerals
While it is beyond the scope of the forest plan, legislative actions and Federal and State regulatory actions may have the greatest effect on lands available for nonrenewable energy and minerals in the GMUG National Forests, which would further constrain where development may occur. Climate change regulations or policies and air quality regulations may also constrain fossil fuel development during the planning period. Numerous comments have been received from the public regarding oil and gas and coal development. Consideration of these commodities is in accord with Federal regulations that govern leasing and development. This analysis is focused at the plan level, which does not authorize any particular extraction activity and, with the exception of coal, does not address

USDA Forest Service
326
areas specifically acceptable for leasing. We recognize that commenters would like more detail on exactly where development may occur and the constraints that apply, an analysis of specific quantification of climate effects including recommending specific methodology (such as social cost of carbon), how much development is considered, etc. As large portions of the GMUG have these mineral resources, development constraints will largely come from plan components, selection of an alternative, and regulations. Extraction and combustion of fossil fuels release greenhouse gases that contribute to climate change. These greenhouse gas emissions would be estimated at the oil and gas leasing stage and site-specifically at the development stage for fossil fuels. Oil and gas requires multiple analysis steps before development occurs, including: a lease availability analysis, lease parcel processing where stipulations are applied to a specific parcel consistent with leasing decision and forest plan components, Bureau of Land Management making a leasing decision, followed by development analysis that may also apply conditions of approval, then, finally, a State and Federal (and sometimes also local government) permitting process. All alternatives include Colorado roadless areas. The 2012 Colorado Roadless Rule is currently in place and it is likely to continue to constrain oil and gas leasing and development through the plan duration. The draft revised forest plan does not take the next step of analyzing which lands are available for oil and gas leasing because it depends on a detailed review of the geologic potential and how lands might be accessed or developed. However, the draft revised forest plan does provide some sideboards through plan components and management area direction that would be carried forward into the subsequent leasing analysis in the form of lease stipulations that restrict surface occupancy or timing of activities. Future analysis and public process would be needed to make an oil and leasing availability decision. This would be treated as a separate process due to the complexity of the analysis. As we have seen over the past 40 years in the GMUG National Forests, the volatility of the oil and gas markets and State and Federal regulatory environment makes leasing or drilling of wells difficult to predict, and the number of wells actually drilled is at much lower levels than previously estimated or analyzed. Existing oil and gas leases would be subject to plan components as conditions of approval where they do not conflict with existing lease stipulations during the development phase. Additional leasing and wells drilled would be expected to occur during the plan duration in compliance with law, regulation, and policy and in compliance with plan components and subsequent leasing analysis to protect other resource values. Natural gas use is expected to increase in use in the national energy portfolio during the plan period; however, that does not mean that the GMUG National Forests would see comparable growth in this industry. Greenhouse gas mitigation measures would be expected to increase in use or continue under applicable State and Federal regulations. Mineral withdrawals (legislative) for oil and gas may occur with regard to proposed legislative actions and not as a result of the draft revised forest plan. Oil and gas production will continue to contribute to federal, state, and local economies and to a more regional, transient workforce. A coal screening and unsuitability analysis has been completed for this plan. The screening process is included as appendix 10 of the plan. Under each alternative, there are areas acceptable for underground coal leasing and mining. Acreage acceptable to future coal leasing varies by alternative (alternative A, 27,200 acres; alternative B, 16,400 acres;

GMUG National Forests Land Management Plan Draft Environmental Impact Statement: Volume 1
327
alternative C, 25,000 acres; and alternative D, 13,200 acres) and is driven by variations in management areas. For all alternatives, this area represents less than one percent of the GMUG National Forests. However, the acceptable areas for leasing would be constrained by further application of the unsuitability criteria at the project level, forest plan components, and economic and developmental constraints. Coal leasing, development, and production is expected to continue to decline during the plan period and be limited to the vicinity of the West Elk Mine near Somerset, Colorado, regardless of the acreage available under each alternative. Short- and long-term reclamation activities will continue associated with prior coal mining surface disturbances in the North Fork area. Methane mitigation to reduce greenhouse gas emissions from active and inactive coal mines is expected to continue during the plan duration. Climate change regulations may result in further declines in coal use and coal is further expected to decline in the national energy portfolio. Reduction in coal production would affect contributions to federal, state, and local economies and the local workforce. Locatable minerals would continue to be available for development under all alternatives consistent with law, regulation, and policy. Plan components may constrain certain activities and protect other resource values. Existing mineral rights would be honored. There has been increased interest in locatable minerals and unpatented mining claims over the past few years; it is unknown if this interest will continue through the plan period and contribute to the local workforce beyond current commercial mining proposals near Ouray, Colorado. Mineral withdrawals would be expected to occur as a result of legislative actions. Abandoned mine land features (e.g., shafts, adits, etc.) are expected to continue to be mitigated during the plan period to reduce safety concerns and resource effects as funding becomes available. Mitigation and reclamation activities would be in compliance with forest plan components. Other Comprehensive Environmental Response, Compensation, and Liability Act (CERCLA) (a.k.a. Superfund) sites will continue to be cleaned up in cooperation with Federal and State agencies with regard to hazardous substances that may endanger public health or the environment over the plan period as funding becomes available. Plan components address the desired conditions of these sites. Mineral materials will continue to be available under all plan alternatives. Demand for mineral materials is expected to continue to be used in the next planning period, particularly for road maintenance. Additional mineral material sites or re-entry of existing sites will likely be evaluated and developed as need arises during the plan duration. While this material contributes little monetarily to the local economy, it is often used by counties to support their road maintenance needs. Rare earth minerals are likely to become more economically important during the plan duration. It is unknown whether the limited resources in GMUG National Forests will play a role in this process, but plan components and regulations would protect other resource values if development is proposed.

USDA Forest Service
328
Geologic Hazards
Plan components and underlying policy and regulations in all alternatives address slope stability and watercourses in project design to help prevent damages and safety issues from geologic hazards.
Effects of Other Program Direction on Energy and Mineral Programs
Energy and minerals development activity requires review and compliance with forest plan direction for all other program areas when not inconsistent with the requirements in law or policy (i.e., General Mining Act of 1872). The following integrated plan components would limit surface disturbance, constrain surface use, and pose timing limitations on future development, consistent with existing rights: FW-GDL-SOIL-05, FW-GDL-SPEC-22, FW-STND-SPEC-24, FW-GDL-SPEC-31, FW-GDL-SPEC-43, FW-GDL-SPEC-44, MA-GDL-SIA-04, FW-STND-DTRL-05, FW-GDL-DTRL-13, FW-GDL-SOIL-07, FW-STND-SPEC-42, FW-GDL-SPEC-57, FW-GDL-SCNY-06, FW-GDL-SPEC-07, FW-GDL-SPEC-15, FW-GDL-SPEC-20, FW-GDL-SPEC-21, FW-GDL-SPEC-25, FW-GDL-SPEC-48, FW-GDL-SPEC-49, FW-GDL-SPEC-50, FW-GDL-SPEC-51, FW-GDL-SPEC-52, and FW-GDL-SPEC-55.
Sustainability of Energy and Mineral Resources and Uses
All action alternatives would contribute to economic sustainability at various scales; would require interdisciplinary review of plan components at the project scale; would allow for access and mineral development of private mineral rights (locatable mining claims, reserved and outstanding rights) and existing oil and gas leases; are consistent with the 2012 Colorado Roadless Rule; defer oil and gas leasing decisions to a subsequent and more comprehensive analysis; and do not make minerals withdrawals.
Cumulative Effects
Energy and minerals development may have positive impacts on economies of local, regional, state, national or international levels depending on workforce, commodity, market, and supply chain. Fossil fuel development or combustion emits greenhouse gases that contribute to climate change at various local to global scales. Climate change effects have been described as having disproportionate negative effects on environmental justice populations globally. Conversely, the use of fossil fuels in power generation has ensured that reliable and affordable power supplies have been available in large areas of the United States, which contributes to higher quality of life. Specific energy or minerals developments may have air quality effects at an airshed scale, but would be required to remain in compliance with State and Federal regulations. See also the Air Resources section. Regulatory requirements at the local, State, and Federal levels ensure that minerals and energy development activities consider and minimize effects to natural, physical, and social environments.

GMUG National Forests Land Management Plan Draft Environmental Impact Statement: Volume 1
329
Renewable energy development is expected to increase globally during the planning period and would reduce greenhouse gas emissions compared to burning of fossil fuels. Development of these technologies are directly tied to availability of other mineral resources and suitable land availability. Regional shifts in oil and gas production from the Western Slope to other areas of Colorado like the Front Range or other Western states is expected to continue to occur where operating constraints and drilling costs are lower during the plan period. Coal production and use in power generation is expected to decline globally during the planning period to meet climate change threshold goals. During the planning period, locatable minerals are likely to see a gradual shift from Federal lands to production in other countries, particularly developing nations where there are fewer regulatory hurdles and mining is more socially accepted.
Conclusion All alternatives provide for energy and mineral development. Forest plan direction for all resources areas ensures that resource values are protected while maintaining opportunities for multiple use management including energy and minerals development that will meet social and economic sustainability demands. The greatest constraints on energy and mineral development in all alternatives is related to leasing, mining, or surface occupancy imposed by requirements of the Colorado Roadless Rule, recommended and existing designated wilderness, and Federal, State, and local regulatory requirements. Action alternatives are consistent with 36 CFR 219.8(b), as the effects of plan direction would contribute to social and economic sustainability as mineral and energy resources, to varying degrees, would remain available for development under all alternatives. Action alternatives are also consistent with 36 CFR 219.10(a and b), where multiple uses are maintained through integrated resource management because plan components affecting multiple resource areas would need to be considered when or if leasing or development of mineral or energy resources is proposed.
Rangeland Resources
Affected Environment A detailed description of the affected environment for rangeland resources is included in the rangeland management assessment (USDA Forest Service 2018) and is hereby incorporated by reference. This information is summarized below for the environmental analysis.
Rangeland Management
Livestock grazing has been, and continues to be, an important multiple use of National Forest System lands within the GMUG and has become an important part of the culture of the rural Western United States. Today’s rangeland management program focuses on ecological integrity and sustainability, which allows for productive lands that are capable of sustaining livestock grazing and other forest uses into the future.

USDA Forest Service
330
Rangelands include all land producing, or capable of producing, native forage for grazing and browsing animals, and lands that have been revegetated naturally or artificially to provide a forage cover that is managed like native vegetation (grasslands, forb lands, shrublands and forested lands). Livestock grazing is permitted on suitable rangeland under almost all existing management area prescriptions, though it is limited in research natural areas and excluded from developed recreation sites and administrative sites. Areas not capable for grazing (approximately 1,253,784 acres; USDA 2018, rangeland management assessment) include but are not limited to bare and rocky areas; lakes, reservoirs, rivers, and perennial streams; very wet soils; areas with mass movement risk; roads and trails; dense timber stands with canopy closure greater than 70 percent and limited understory forage; areas not capable of producing forage (nutrient-poor soils, shallow soils, alkali flats); areas without water sources or the potential to develop water; and areas fenced to keep livestock use out. Approximately 2,382,265 acres (80 percent) of the plan area are managed for livestock grazing in active allotments (table 139). At the end of the 2016 grazing season, there were 150 active grazing allotments, 15 vacant allotments, and 18 closed allotments in the GMUG. The majority of allotments are managed for cattle grazing, but domestic sheep grazing is an important component of the GMUG grazing program. At the end of the 2016 grazing season there were 223 active grazing permits authorizing a total of 253,411 animal unit months. An animal unit month is the amount of forage required by an animal unit (one cow or horse, or five sheep) for one month. Permitted animal unit months decreased during 1991–2006 because of efforts to improve rangeland conditions by changing grazing systems and practices. Permitted livestock numbers and animal unit months decreased again during 2005–2016, following the droughts of the early 2000s.
Table 139. Approximate livestock grazing acreage, by geographic area
Geographic Area Active (acres)
Vacant (acres)
Closed/Unsuitable (acres)
Total (acres)
Grand Mesa 292,886 0 7,753 300,639 North Fork Valley 393,054 14,816 0 407,870 Gunnison Basin 988,265 147,129 13,643 1,149,037 San Juans 131,066 18,077 112,104 261,247 Uncompahgre Plateau 576,994 0 0 576,994
Total 2,382,265 180,022 133,500 2,695,787
Range improvements in the plan area by district are provided in table 140. Funding for these developments continues to be a cost-share between the permittees and the Forest Service, and grazing permittees are responsible for maintaining these improvements once constructed.

GMUG National Forests Land Management Plan Draft Environmental Impact Statement: Volume 1
331
Table 140. Range improvement types by district [Source: USDA Forest Service (2017d)]
District Fencing (miles) Water Systems Handling Facilities Buildings Cattleguards Total
Grand Valley 396 822 103 21 49 1,391 Gunnison 1,045 700 21 6 139 1,911 Norwood 205 538 10 6 8 767 Ouray 281 396 17 11 51 756 Paonia 363 1,139 23 7 33 1,565
Total 2,290 3,595 174 51 280 6,390
Rangeland Conditions and Trends
Rangeland vegetation conditions are presented for the plan area (table 141) and by geographic area (table 142). The majority of suitable grazing acres in the plan area and in each geographic area are in good (late seral) condition. Further, the majority of suitable grazing acres are in an upward or stable trend (table 143).
Table 141. Rangeland vegetation condition for the GMUG National Forests
Condition 1987 acres
1987 percent
2005 acres
2005 percent
2016 acres
2016 percent
Poor 641,696 38% 42,152 3% 11,989 1% Fair 766,287 45% 585,145 44% 398,550 28% Good 235,158 14% 709,227 53% 950,342 66% Excellent 46,367 3% 0 0 54,622 4%
Total 1,689,508 100% 1,336,524 100% 1,442,003 100%
Table 142. Rangeland vegetation condition by percentage of geographic areas [Table excludes areas unsuitable for livestock grazing]
Range Condition
Grand Mesa
(percent)
North Fork Valley
(percent)
Gunnison Basin
(percent)
San Juans
(percent)
Uncompahgre Plateau
(percent) Poor <0.1 <0.1 <0.1 <1 2 Fair 25 45 7 26 38 Good 75 52 81 66 57 Excellent 0 12 3 0 Unknown 0 3 0 5 3

USDA Forest Service
332
Table 143. Range trend as a percentage of geographic areas [Table excludes areas not assessed and areas unsuitable for livestock grazing]
Trend Grand Mesa
(percent) North Fork Valley
(percent) Gunnison Basin
(percent) San Juans (percent)
Uncompahgre Plateau (percent)
Upward 2 58 26 5 18 Stable 98 42 71 89 81 Downward 0 0 2 5 1
Sustainability of Rangeland Resources and Uses
The majority of suitable grazing acres in the plan area and in each geographic area are in good (late seral) condition. Further, the majority of suitable grazing acres are in an upward or stable trend. These data indicate that intensive grazing management combined with adaptive management practices implemented over the last two decades is providing for sustainable livestock grazing operations, especially given the droughts the GMUG experienced in the early 2000s, 2012, 2018, and 2020. During 2000–2016, livestock grazing permits declined by approximately 15 percent in the GMUG, compared to a 21-percent decline statewide. However, some of that decline may be attributed to allotment and permit consolidation in recent years. Primary drivers and stressors of rangeland resources include invasive plants and noxious weeds, recreational activities, and forage competition with elk. Managing rangeland conditions for healthy and productive wildlife communities (e.g., deer, elk. moose, Gunnison sage-grouse, bighorn sheep, etc.) will continue to be a challenge.
Environmental Consequences The analysis area for rangeland management includes all National Forest System lands within the GMUG. The analysis timeframe is 20 years post decision, and a qualitative discussion of certain plan components and quantitative measurements (numbers of grazing allotments within areas to be analyzed as wilderness) is included.
Management Direction
The current forest plan direction for rangelands is to provide livestock forage commensurate with the needs of the resources and in harmony with plan direction. The GMUG cooperates with Colorado Parks and Wildlife (formerly Colorado Division of Wildlife) to achieve big game population levels that are compatible with existing uses and consistent with forage resource requirements. If the needs of the forage resource are not being met, adjustments in livestock and big game numbers would be needed. The plan has multiple allowable use levels for livestock based on the grazing system used (e.g., rest rotation, deferred rotation) as well as by the range type (e.g., bunchgrass, shrub, alpine). It also includes direction for managing grazing in existing and proposed recreation sites and a standard to maintain vegetation in mid-seral or better condition in those recreation sites. The draft revised forest plan provides direction that permanent stocking adjustments be made only after a thorough analysis of condition and trend has been made. The current plan

GMUG National Forests Land Management Plan Draft Environmental Impact Statement: Volume 1
333
does not contain such direction. Ideally this analysis would be a collaborative effort including permittees, industry (Colorado Cattlemen’s Association, Colorado Wool Growers Association, etc.), citizen scientists and other publics (such as environmental groups), university extension agents, State governmental agencies (Colorado Department of Agriculture, Colorado Parks and Wildlife), etc. The draft revised forest plan contains direction for using adaptive management to allow, for example, management flexibility in response to variable resource or climatic conditions. These strategies are already in use in the GMUG. The draft revised forest plan is descriptive for rangeland management objectives instead of prescriptive. The plan references the Forest Service Rangeland Analysis and Management Training Guide (USDA Forest Service 1996) and the Colorado Rangeland Monitoring Guide (Colorado Resource Monitoring Initiative 2014) for assessing rangeland condition and trend, and allows for the incorporation of best available science (new methods and technologies) as they are developed. The draft revised forest plan provides direction to establish grazing guidelines (FW-GDL-RNG-10) at the project (allotment) level to meet desired objectives rather than at the plan level to avoid a one-size fits-all approach. It focuses on the concept of plant development and recovery by implementing the three primary principles of range management. To maintain and improve riparian condition it considers plan direction that describes a desired plant community composition and relies on existing literature concerning best management practices for grazing management in riparian areas. The draft revised forest plan includes improved integration of livestock management, including management of range improvements, with other resource objectives. For example:
• Guideline FW-GDL-RNG-12 ensures that all future fence construction is designed as wildlife friendly, i.e., installation of elk or antelope crossings, use of smooth bottom wire, standard spacing to prevent entrapment, maximum height limits, construction type and locations. Again, new technologies are allowed for as they are developed.
• Guideline FW-GDL-RNG-12 ensures that all water developments would be designed as wildlife friendly, including wildlife escape ramps and to provide access to wildlife on existing and future water developments.
• Desired conditions FW-DC-RNG-01 and FW-DC-SPEC-02 and standard FW-STND-SPEC-13 minimize wildlife and livestock conflicts (elk, bighorn sheep, etc.) in coordination with permittees and the appropriate agencies, such as the U.S. Fish and Wildlife Service, USDA Wildlife Services, and Colorado Parks and Wildlife.
Effects of the No-Action Alternative
The rangeland management program will continue as is, with no expansion or reduction in permitted livestock numbers. Forage use will continue to be based on range condition class unless site-specific allotment analysis has occurred and different measures are used. The current plan contains no direction, standards, or guidelines for adaptive management. The current plan contains very limited direction related to livestock management and associated range improvements, both structural (fences, water) and nonstructural (seeding, burning). Rangeland management objectives will continue to be prescriptive. Effects on the program will be neutral as allotments have already gone through the site-specific analysis process and have incorporated adaptive management methods into permits, allotment management plans,

USDA Forest Service
334
and annual operating instructions, and have updated their forage utilization and range improvement standards.
Effects Common to All Action Alternatives
Desired conditions in the draft revised forest plan for livestock grazing, collectively with plan components for other resources, emphasize sustainable grazing, stable soils, diverse vegetation and native plant communities, and riparian and wetland health. Movement toward these conditions would be achieved through implementation of the standards and guidelines for grazing and the other resource areas. Necessary changes to move toward desired conditions would be determined and implemented at the allotment management plan and project level. None of the eight issues that drove alternatives will significantly affect the rangeland management program as livestock grazing will not be expanded, eliminated, or curtailed under any alternative, including the no-action alternative, and therefore there will be no negative effects to the local, regional, or national economy. Livestock grazing will continue to contribute to economic sustainability across all alternatives. However, beneficial effects to the range program will be realized from the implementation of a more integrated, adaptive approach that facilitates ecological integrity across all resource areas. Livestock grazing in the GMUG will also continue to contribute to social sustainability. Ranch ownership and the associated quality of life is not expected to be significantly impacted by any of the alternatives because forage availability for grazing will not change. However, since dispersed recreation use under all alternatives is expected to increase, the resulting potential increases in conflicts between visitors, livestock, and grazing permittees could negatively impact the values for ranching and community. Issue 1) areas of recommended wilderness fall within 19 grazing allotments in alternative B and 67 allotments in alternative D. There are no allotments in alternatives A or C. Issues 2) balance between active and passive vegetation management; 4) balance between more and less restrictive recreation use management; 5) balance between motorized and non-motorized recreation; and 6) balance between increased development and more apparently natural settings, will not significantly affect the rangeland management program as these activities are already occurring and are being mitigated for on a case-by-case basis. As uses rise via any of these issues, appropriate mitigations should be decided on at the project level and on a case-by-case basis. Issue 3) balance between increased recreation and existing wildlife habitat and backcountry hunting opportunities, would most likely benefit the rangeland management program because of plan direction for wildlife management areas; large, relatively unfragmented big game and other wildlife habitat in which there is likely to be fewer human disturbances, fewer gates being left open, no livestock being harassed, etc. Alternative B has the most acres proposed, followed by D and then C. The large, unfragmented areas with little ground disturbance from road or trail development mean there is less likelihood for invasive plants to be introduced and spread. Issues 7) citizens proposals for special management areas, and 8) modifications to management areas, will not significantly affect the rangeland management program because

GMUG National Forests Land Management Plan Draft Environmental Impact Statement: Volume 1
335
these areas are either not grazed at all, are adjacent to current wilderness areas, or are within roadless areas. Where grazing does occur, it is currently compatible with those proposed areas.
Effects of the Proposed Action and Comparison of Alternatives
Effects of Rangeland Program Direction
Grazing opportunities are the same across all alternatives and the intent of the proposed direction is to adopt adaptive management to provide for management flexibility in order to respond to changing conditions—whether those be climatic, human caused (loss of forage or impacts to livestock management due to skyrocketing numbers of dispersed campsites, new roads or trails, etc.), changes in legislation or policies—in order to maintain ecological integrity and productivity of all ecotypes. The intent of this direction is to continue to incorporate best available science in the management of rangelands and to implement strategies for doing so, when appropriate and needed (new monitoring methods; new technologies for developing water or GPS tracking of livestock; use of invisible fencing; drones, etc.). This direction will integrate the rangeland management program into other program areas across the GMUG and prioritize domestic sheep allotments with high risk of contact with bighorn sheep for sufficiency reviews.
Effects of Vegetation, Timber, Fuels, and Fire Management
Vegetation management, such as timber harvest and prescribed fire (fuels), can provide transitory rangeland that would be available for livestock and wildlife grazing. Transitional rangeland forage capacity decreases over time as the forest overstory grows back and shades out the herbaceous understory. Effects would be evident in the increase in forage as trees are harvested or prescribed burning occurs, and how protection of regeneration is addressed due to management. These transitory rangelands can allow for more dispersal of livestock as more forage becomes available. It also can allow livestock to move between allotments that were previously blocked by timber stands. To mitigate that, measures like electric fencing, more range riders, drones, or GPS tracking collars may need to be used to keep livestock on the allotment and pasture they are authorized to be in. The action alternatives (B, C, and D) increase the number of acres identified as suitable timber acres in relation to alternative A, which represents current practices and the current timber suitability being used. Not all acres identified as suitable would be harvested, but projected harvest would be higher in alternatives B and C. Regeneration is an important part of timber management, and grazing within regenerating stands is generally limited or prohibited until trees have grown to a size at which livestock impacts are minimal. Under alternatives B and C, relatively more protection of regeneration would potentially limit potential grazing acres relative to alternatives A and D. Increased budget for fencing and other infrastructure costs would need to be realized as timber is cleared, and areas of regeneration are protected. This is true of all alternatives, but more so for alternatives B through C relative to A and D. Alternative D would limit harvest the most, and fewer regeneration fencing projects or protections would be needed.

USDA Forest Service
336
Current conditions of dead and dying spruce and harvest activities would create similar issues in cost, scale, and scope in all alternatives, with slight increases in transitory grazing in all action alternatives. Fire and fuels management can have different short- and long-term effects on livestock grazing. Effects depend upon burning conditions and burn type, and the results and timing of a wildfire are much less predictable compared to a prescribed fire. Prescribed burning often results in an increase in forage production and availability, and a shrub community more compatible with a variety of wildlife species. Alternative D has the fewest acres proposed for fuels treatment per decade than alternatives A through C and would have the fewest short-term effects. A reduction in shrub and conifer density could potentially accelerate the recycling of nutrients and make water more accessible across the landscape, such as in springs, seeps, and intermittent streams. Understory burns in conifers or other types of burns can increase forage production and accessibility. Areas that are typically grazed may have to be deferred prior to a prescribed burn to ensure that there are sufficient fine fuels to meet the burn objectives and be deferred following a prescribed burn to allow for vegetation recovery depending on local conditions. This deferment requires that the permittee be flexible in management and involved in considerable advance planning and coordination. If a prescribed fire does not take place on schedule, arrangements need to be made again in successive attempts, which could accrue additional costs to the permittees and the Forest Service.
Effects of Recreation Management
Dispersed recreation use in all alternatives is expected to increase, resulting in more visibility for the grazing program and the potential for increases in conflicts between visitors, livestock, grazing permittees, range riders, and their working dogs. Because developed recreation sites are generally fenced, there is less of an impact to these sites from livestock. Increased visitor use could also result in vandalism to range improvements and increased management costs and time. Not all members of the public understand that they are to “leave gates as you find them.” Rangeland managers respond to many calls regarding livestock in the wrong place due to gates being left open, or fences being cut when someone can’t find a gate. This increased need for a response, as well as anticipated increases in maintenance, are costly. These conflicts would continue and increase regardless of alternative; thus, there is no significant difference among alternatives.
Effects of Designation of Wilderness
As discussed previously, alternatives B and D include areas of recommended wilderness that could be moved forward to Congress for designation, while alternatives A and C have no new acreage of recommended wilderness. This will not affect how these grazing allotments are managed should they be designated as wilderness because the congressional grazing guidelines specifically state that livestock grazing and the management that support those operations will continue following designation. These operations include the use of motorized equipment for access to livestock, repairing infrastructure such as fences and

GMUG National Forests Land Management Plan Draft Environmental Impact Statement: Volume 1
337
waters, and the use of chainsaws if they were used pre-designation. While the acreage figures and numbers of allotments vary among alternatives B and D (table 144), there will not be any negative effects to the grazing program simply because an area is managed as or is designated as wilderness. Some of the beneficial effects could be that prohibition of road construction, mineral development, and timber harvest, etc., may make for a more pleasant ranching experience for the grazing permittees, livestock, and wildlife, as those disturbances will not occur.
Table 144. Grazing allotment overlaps with recommended wilderness, alternatives B and D
Allotment Status
Number of Allotments by Status in MA 1.2 (Area to be Analyzed as Wilderness).
Alternative B
Number by Status in MA 1.2 (Area to be Analyzed as Wilderness).
Alternative D Active 10 51 Vacant 2 6 Closed 7 10
Congressional grazing guidelines contain specific language for nonconforming uses (including livestock grazing), which are applicable to all commercial livestock grazing operations in all wilderness areas within National Forest System lands (FSM 2323.2, WO Amendment 2300-90-2). A key provision of the congressional grazing guidelines states, “where previously established, grazing is permitted to continue in wilderness. Permittees may be allowed to maintain range improvements necessary to the livestock operation or for the protection of the range, such as fences and watering facilities.” Therefore, the anticipated acres available for livestock grazing would not change based on wilderness designation (net neutral effects). Increasing wilderness may increase costs associated with management to the GMUG and to individual permittees through management of grazing itself and increased infrastructure building and maintenance costs should any restrictions be imposed by wilderness designations. These costs would increase proportionally with the increase in acres. In terms of resource protection there is little difference among alternatives. Grazing would continue as it presently does with few changes. Any legislation adding wilderness to the system would include a determination on the continuance of grazing.
Effects of Watershed, Aquatic, Riparian, and Soil Management
The Aquatics and Terrestrial Vegetation sections discuss the effects of plan components on aquatic resources, particularly riparian areas. Management and protection of riparian and wetland resources are emphasized under all alternatives. The riparian plan components under the current plan, and the plan components under the revised plan alternatives, have had and would continue to need compliance monitoring in relation to livestock management.

USDA Forest Service
338
Effects of Invasive Species Management
Noxious and other invasive weeds have the potential to substantially decrease livestock forage when left unchecked. Impacts are similar among all alternatives, and noxious weed management would continue under all alternatives. Infestation levels of invasive plants would likely remain steady to slightly increasing over time. Some species may contract in density as new treatment and biological options become available, while other species will expand in range and density.
Cumulative Effects
Livestock grazing has occurred on the lands that are now National Forest System lands since before the GMUG National Forests existed. Past grazing practices strongly impacted current conditions and practices. Reduced numbers of livestock grazed as well as fewer days of grazing have helped environmental conditions recover or greatly improve. The rangeland management program is impacted by environmental conditions, management practices, and public use for recreation. The GMUG supports and manages many different activities. Recreation management, fire management, habitat management, and timber management can affect where and when livestock grazing can occur. Grazing within transitory rangeland is expected to increase in the next few years. These acres are likely to provide significant increases in forage in the short term. As revegetation activities take place, these acres are likely to be temporarily removed from grazing to protect regeneration. After this increase, a slow decrease in these acres and forage production would occur until closed canopy of spruce-fir stands occurs many years into the future. This decrease would be accelerated as areas are protected for regeneration and access is decreased from the fallen trees. Ground-disturbing activities in the GMUG can introduce non-native invasive species and noxious weed species. An active weed management program exists in the GMUG and would continue with cooperation from other Federal agencies, and counties. Adaptive management of allotments allows rangeland managers to adjust to these changing management conditions. Adjustments would be necessary to maintain healthy rangeland conditions. Effects of actual domestic livestock grazing would be analyzed at the project level and would also include analysis of cumulative effects on a site-specific level.
Adjacent Lands
Portions of the GMUG adjoin other national forests, each with its own forest plan. The GMUG is also intermixed with lands of other ownerships, including private lands, other Federal lands, and State lands. Timber harvest, grazing, or conversion of rangeland or forests on adjacent lands would affect vegetation conditions at the landscape level, changing composition and structures, and could potentially affect the capability of the lands to be grazed at current levels. Most national forest, state, and Bureau of Land Management rangelands are likely to remain undeveloped and suitable for livestock grazing in the foreseeable future. Private lands surrounding the GMUG could potentially be affected by conversion to agricultural lands or residential development. Development of these private lands would affect wildlife connectivity and overall landscape function within the national forest. Future

GMUG National Forests Land Management Plan Draft Environmental Impact Statement: Volume 1
339
development of private lands adjacent to the national forest boundary could also affect the spread of invasive weeds, increase fire protection responsibilities and costs, and increase the complexity of grazing livestock in the GMUG in some areas. Some adjacent lands are subject to their own resource management plans. In general, management of vegetation is consistent across all national forests due to law, regulation, and policy. The cumulative effect would be that the management of vegetation and grazing would be complementary across jurisdictions.
Livestock Grazing Use
Livestock grazing likely will continue within the GMUG for the foreseeable future. Cattle, sheep, and horses that graze here during the summer months are provided forage largely from private lands during late fall, winter, and early spring. Forage from private lands during this period consists of native grass pasture, irrigated pasture, irrigated and dry land hay, and fall crop residue. The availability of private lands in the surrounding area that can provide summer forage is somewhat limited. This demand for forage, especially during June through October, is greater than what National Forest System lands can supply. Productive lands surrounding the GMUG are generally used for crops. Demand for grazing on National Forest System lands should continue to be very high for livestock operators whose private lands are adjacent to the national forest. Livestock management is generally considered more management intense on National Forest System lands than on private lands. Livestock grazing is influenced by effects that impact the allocation of forage resources between livestock and wildlife; predation and disease transmission; management adjustments to protect cultural and historical resources; fisheries; threatened and endangered species; water quality; considerations necessary due to wildland fire management, and recreation. All these factors add to the complexity and expense for the ranching operations that are permitted to graze livestock on the GMUG. In addition livestock management is subject to factors not under the control of livestock operators, such as tourism; land values and potential subdivision of ranches; labor prices and availability; domestic and foreign demand for livestock products; markets and meat prices; fuel prices; social values; and Federal policy.
Increasing Recreation Use
It is expected that recreational uses on National Forest System lands will continue to increase as more people nationwide continue to look for places to recreate. As more people venture onto public lands, differing societal desires and ideas of what public lands should provide will continue to influence public land management policy. Increased attention and public recreation on grazing allotments in the future may make ranching on National Forest System lands more expensive for permittees and may negatively impact the ranching way of life.
Conclusion
Consistent with 36 CFR 219.8(b), the effects of plan direction would be to contribute to social and economic sustainability because they support opportunities for economic diversity by providing livestock forage while managing rangeland vegetation for ecosystem

USDA Forest Service
340
diversity and resiliency. The draft revised plan also meets the needs for rangeland uses and maintaining wildlife habitat. Consistent with 36 CFR 219.10(a), the effects of plan direction would be to provide ecosystem services and multiple uses through integrated resource management as it takes into account rangeland management, which contributes to local, regional, and national economies in a sustainable manner, and it includes plan components for integrated resource management. Desired conditions for the rangeland management program emphasize sustainable grazing, stable soils, diverse vegetation, and native plant communities, as well as riparian and wetland health. Movement toward these conditions would be achieved through implementation of the standards and guidelines for grazing. Necessary changes to meet desired conditions would be implemented at the allotment management plan and project level. Grazing standards and guidelines generally would affect how allotment planning is implemented. The plan components developed for the revised forest plan are designed to protect upland, riparian, and wetland resources, manage noxious weeds, and maintain levels of forage within capacity of the land and in consideration of other resources. Increased recreational uses of National Forest System lands within the GMUG may make grazing on the GMUG more expensive for permittees under any alternative due to potential vandalism to allotment infrastructure and gates being left open. Plan components include recreation emphasis areas, which may have a high density of human activities and a higher potential for conflict with livestock operations.
Sustainable Recreation
Affected Environment A detailed description of the affected environment for recreation is included in the assessment (USDA Forest Service 2018, recreation) and is hereby incorporated by reference. This information is summarized below for the purposes of the environmental analysis. The GMUG received nearly 2.6 million annual visits according to 2014 National Visitor Use Monitoring data (USDA Forest Service 2015b). On the basis of National Visitor Use Monitoring data on recreation visits in 2015, the GMUG is ranked eighteenth in the nation of national forests for total recreation visits. Main recreation activities included downhill skiing, viewing natural features or scenery, hiking and walking, viewing wildlife, relaxing, and driving for pleasure. Nearly 35 percent of recreation visits to the GMUG are made by local residents on a day trip away from home (25 miles or less). The Forest Service manages 166 developed recreation sites in the GMUG, including 54 campgrounds, 38 trailheads, and 8 recreation rental cabins. Dispersed recreation activities include camping, various uses of trails and roads, traditional uses such as hunting and fishing, and other pursuits such as bird watching, plant viewing and identification, rock-hounding, viewing scenery, watching wildlife, and other ways of relaxing and enjoying the natural environment. The condition of developed recreation sites has been in a downward trend. Historically, there has been a downward trend in funding for routine maintenance (such as painting) or for deferred maintenance (repair and replacement of broken or worn
GMUG National Forests Land Management Plan Draft Environmental Impact Statement: Volume 1
341
out items). Annual and deferred maintenance costs have increased since 2008, with annual and deferred maintenance costs of approximately $895,000 per year and $2,210,000, respectively, in fiscal year 2017. A detailed account of developed recreation sites and dispersed recreation activities is provided in the assessment. In 2020, the Great American Outdoors Act was signed into law. A main objective of the Act is to address deferred maintenance of Forest Service developed recreation sites around the country. The Great American Outdoors Act established a Legacy Restoration Fund to address this nationwide backlog of maintaining recreation facilities and trails. The Legacy Restoration Fund established a temporary, national fund of up to $285 million per year through 2025 to address deferred maintenance of Forest Service recreation facilities. It is expected that this funding will significantly reduce deferred maintenance in the GMUG. However, due to the temporary nature of the funding, deferred maintenance on facilities and trails will continue to be an issue during the life of the forest plan. The GMUG contains 3,615 miles of National Forest System trails, including 2,641 miles of standard trails and 974 miles of snow trails. Several trails within the GMUG hold special designations, including three national recreation trails, one national historic trail, and the Continental Divide National Scenic Trail. There are six fourteeners (mountains over 14,000 feet in elevation) in the GMUG. Visitor use focuses on scaling these peaks either by hiking or technical climbing. Thirteeners are experiencing increased interest and use from those who have completed the fourteeners or those wishing to avoid crowding on fourteeners. Some current trail designs do not meet user needs, are creating erosion issues, and are causing other environmental damage or impacts. To remain safe, sustainable, and usable, and to minimize environmental effects, trails need regular maintenance. Recent budgets, along with increased use, have resulted in a backlog of trail maintenance. Great American Outdoors Act funding will enable the GMUG to address a substantial amount of the backlog in the near term. However, since it is an ephemeral funding source, it is expected that deferred trail maintenance will continue to be an issue over the life of the plan. The GMUG National Forests issue special use permits for events and activities to facilitate access by GMUG visitors. The events and activities include one-time and recurring recreation event permits, numerous outfitter-guides, three developed ski areas, three resorts, one marina, and two organization camps. A total of 553,427 acres (20 percent) of the plan area is designated as wilderness, including 10 designated wilderness and 2 special management areas. Per legislative direction, wilderness is managed to provide outstanding recreation opportunities for solitude or primitive and unconfined recreation. Approximately 901,100 acres of Colorado roadless areas provide extensive dispersed backcountry recreation opportunities, including motorized and non-motorized trails. The GMUG hosts one National Scenic Byway (the Grand Mesa Byway), and shares an All-American Road (the San Juan Skyway). Four other scenic byways hold State designations: Alpine Loop, Unaweep, Silver Thread, and the West Elk Loop (which includes Kebler Pass). For more information on wilderness areas, Colorado roadless areas, and scenic byways, refer to the Wilderness, Wild and Scenic Rivers, and Other Designated Areas section. The two primary seasons of recreation use in the GMUG are 1) summer—snow-free period, which depending on elevation can be during the spring, summer, or fall, and 2) winter—

USDA Forest Service
342
snow-season, which generally includes late fall, winter, and early spring. Access to the GMUG in these two seasons is dramatically different, which results in different management approaches. Based on the 2018 assessment inventory, the two largest existing summer recreation opportunity spectrum setting classes in the GMUG are about 1,338,400 acres of semi-primitive non-motorized (45 percent), and 767,800 acres of semi-primitive motorized (26 percent) (table 145). These two semi-primitive classes currently account for about 71 percent of the recreation opportunity spectrum settings across the plan area. Combining the two non-motorized classes (primitive and semi-primitive non-motorized) and three motorized classes (semi-primitive motorized, roaded natural, and rural), about 60 percent of the GMUG provides a non-motorized setting, and about 40 percent of the GMUG provides a motorized setting during the summer season. Recreation opportunity spectrum conditions and trends are described in detail in the recreation assessment (USDA Forest Service 2018). The current recreation opportunity spectrum management direction that shapes these settings is further discussed in the Management Direction section of this analysis.
Table 145. Inventoried existing summer recreation opportunity spectrum settings in the GMUG National Forests [Recreation opportunity spectrum class designations are only applied to National Forest System lands and do not include private lands within the GMUG boundary]
Primitive Semi-Primitive Non-Motorized
Semi-Primitive Motorized Roaded Natural Rural
435,000 acres 1,338,400 acres 767,800 acres 415,300 acres 9,000 acres 15% 45% 26% 14% <1%
Hunting, Fishing, and Other Wildlife-Related Recreation
Seventeen game management units overlap the GMUG National Forests and five more units across the landscape are influenced by the plan area. Deer and elk hunting occurs extensively across the entire plan area and adjacent lands. In total, these game management units support approximately 49,000 elk (17.5 percent of the statewide population estimate) and 99,000 deer, based on 2016 post-hunt population estimates. Hunted species populations are considered stable. Based on Colorado Parks and Wildlife hunter harvest statistics, numbers of hunters in the plan area and broader landscape also appear to be stable. Pursuing big game is the most popular form of hunting in Colorado among both residents of the state and those traveling from other locations. However, there is concern regarding long-term declining license sales statewide. Colorado Parks and Wildlife sold more than 1 million fishing licenses to residents and nonresidents in 2016. These Colorado and out-of-state anglers incur various expenses on their trips, contributing to the recreation economy (CPW 2017). Common species pursued by anglers include brook, brown, rainbow, and cutthroat trout. Non-consumptive uses and enjoyment of wildlife are also very popular in the GMUG (USDA Forest Service 2018). These include activities such as wildlife viewing, photography, and nature study. In 2013, an estimated 713,600 Colorado residents participated just in wildlife watching in the state (CPW 2014).

GMUG National Forests Land Management Plan Draft Environmental Impact Statement: Volume 1
343
Sustainability of Recreation Resources and Uses
Recreation use is increasing, and changes in technology are opening up new ways to recreate, leading to more competition, more demands for the use of public lands, and more conflicts among visitors. Population increase in the planning area will likely have widespread impacts on the demand for outdoor recreation opportunities throughout the GMUG. Population growth on the Front Range of Colorado does and will continue to push visitors to more distant recreation opportunities like the GMUG. As the overall intensity and duration of national forest visits increase, dispersed recreation can pose health and safety concerns (i.e., littering, escaped campfires, and human waste) and resource impacts (i.e., vegetation removal, trampling, soil erosion, wildlife disturbance, etc.). Creation of unauthorized trails is an ongoing problem in many parts of the GMUG that can cause negative resource impacts. Access issues, drought, climate change, invasive and noxious species, livestock grazing, infrastructure, and motorized travel will continue to affect hunting, fishing, and other wildlife-related recreation activities. Decreased levels of Forest Service personnel and increasing recreation demand and uses are major obstacles to meeting 1991 forest plan management direction to meet public demand for developed recreation facilities and manage dispersed recreation. If shortages in Forest Service personnel continue, trails and facilities will continue to be difficult to manage at the full-service level, and more facilities, trails, and sites may be decommissioned. Barriers to visitation and recreation use by minorities, low income families, and other underrepresented groups will continue to be a challenge for the GMUG.
Environmental Consequences
Analysis Framework
The environmental consequences analysis for recreation focuses on management direction that differentiates outcomes between alternatives. Several quantitative measurement indicators will be used to compare the difference in recreation opportunities and management approaches based on management direction between alternatives. In addition, a qualitative discussion of the similarities and differences will aide comparison of the alternatives. Summer and winter recreation opportunity spectrum management direction has a large effect on measurable impacts to recreation settings over the next planning cycle on the Grand Mesa, Uncompahgre, and Gunnison National Forests. Another significant piece of management direction in the draft revised forest plan is the proposal of wildlife management areas and the substantive difference between alternatives. In this analysis, the key indicators for assessing recreation impacts between alternatives are acres of summer recreation opportunity spectrum management direction by alternative, acres of winter recreation opportunity spectrum management direction by alternative, acres of wildlife management areas by alternative, and a qualitative assessment of plan components. Another key indicator that differentiates the impacts alternatives will have on recreation is the allocation of management areas in the alternatives. Certain management areas contain

USDA Forest Service
344
direction directly affecting future decisions. For example, wildlife management areas would restrict future trail building (MA-STND-WLDF-02) while recreation emphasis areas might encourage trail building. So, along with quantitative discussions, a qualitative discussion of management area direction impacts on the future of recreation will be included in the comparison of alternatives. Other management activities such as livestock grazing, timber, and special interest areas can cause effects to recreation, but the management prescriptions, scale, extent, and distribution are slight between alternatives regarding effects to recreation. Though management direction in the recreation emphasis corridors may have large impacts on recreation, the land allocation is small as an overall percentage of the GMUG’s land base, and acreage differences between alternatives are not at a scale of meaningful comparison on a landscape level. There are some information gaps and inconsistencies with the 1991 forest plan direction and recreation opportunity spectrum maps. Recreation opportunity spectrum inventory maps matching the inventory of existing conditions from the 1991 forest plan (p. II-26) were not locatable. In addition to this, it is important to note that only 38 percent of the GMUG’s management areas (table 2table 3) from the 1991 forest plan had prescriptive direction to manage the GMUG for one recreation opportunity spectrum setting or another. Furthermore, the 1991 forest plan did not even discuss the winter recreation opportunity spectrum nor provide any winter recreation opportunity spectrum management direction. Therefore, the 2018 winter recreation opportunity spectrum inventory is simply a snapshot of current conditions present during the assessment period using best available science. As a result of this, current conditions for summer and winter recreation opportunity spectrum inventories in the assessment (USDA Forest Service 2018, recreation) are largely a result of decades of project-level decisions forming the current recreation opportunities across the GMUG landscape in the absence of comprehensive management direction. The current summer recreation opportunity spectrum inventory in the 2018 assessment was based on modern, three-dimensional mapping protocols and the public transportation network at the time of the recent assessment. The 2018 inventory (USDA Forest Service 2018, recreation) differs distinctly from what was inventoried in the 1991 forest plan’s recreation opportunity spectrum inventory (p. III-26). However, both inventories are consistent with 1991 forest plan direction, representing snapshots of different times in the same place, but neither snapshot is a comprehensive look at management direction from the 1991 forest plan (table 146). Causes and effects of management direction are discussed in the Effects of the No-Action Alternative and the Comparison of the Effects of the Alternatives sections.
Table 146. Summer recreation opportunity spectrum inventories, 1991 and 2018 [ROS, recreation opportunity spectrum]
Summer ROS – Existing Inventory Primitive
Semi-Primitive Non-Motorized
Semi-Primitive Motorized
Roaded Natural Rural
2018 Recreation Assessment: Existing ROS Inventory – using 2017 protocols
435,000 acres 1,338,400 acres 767,800 acres 415,300
acres 9,000 acres

GMUG National Forests Land Management Plan Draft Environmental Impact Statement: Volume 1
345
Summer ROS – Existing Inventory Primitive
Semi-Primitive Non-Motorized
Semi-Primitive Motorized
Roaded Natural Rural
1991 GMUG forest plan as amended1 217,900 816,800 1,265,200 619,200 33,000
1 Though acreages are available for the 1983 and 1991 ROS Inventories from the 1991 forest plan, maps were not locatable for these efforts. The Inventories are snapshots in time using different methodologies, which is different from the ROS Management direction compared between alternatives in the following analysis.
This programmatic land management plan analysis focuses on broadscale estimated effects related to recreation opportunities and management on National Forest System lands. The spatial analysis area includes all the lands within the boundary of the Grand Mesa, Uncompahgre, and Gunnison National Forests. This area represents where changes may occur because of Forest Service management actions. The temporal scope of the recreation analysis assumes a time span of about 15 years, the life of the plan.
Management Direction
The 1991 forest plan and the draft revised forest plan have some similarities. Both provide direction in managing developed recreation sites, managing dispersed recreation, and providing direction to maintain desired recreation opportunity spectrum classes. Though both plans contain recreation opportunity spectrum management direction, there are also drastic differences in the comprehensiveness of the management direction. Also, differences exist in management approaches for dispersed recreation when comparing the 1991 forest plan to the draft revised forest plan. General direction in the 1991 forest plan included: meet public demand for facilities, provide for accessibility, evaluate flood hazards for each site, and provide developed opportunities to complement wilderness management objectives (1991 forest plan, pp. III-16 – III-20). Likewise, general direction for all alternatives of the draft revised forest plan provides similar direction to manage developed recreation sites to provide for accessibility (FW-OBJ-REC-05) and meet public demand (FW-OBJ-REC-03). The 1991 forest plan directs that dispersed recreation sites where unacceptable resource damage is taking place should be closed or rehabilitated. Direction states that sites that cannot be maintained in Frissell condition class 1, 2, or 3 should be closed (1991 forest plan, p. III-18). Forestwide direction in the draft revised forest plan directs a more adaptive approach to the same issues (FW-STND-REC-08, FW-STND-REC-09). In the draft revised forest plan, the dated Frissell campsite condition survey standards are replaced with the Forest Service contemporary campsite inventory methodology, and the National Minimum Recreation Site Monitoring Protocol, and threshold values are adjusted accordingly. Furthermore, the draft revised forest plan offers a more flexible suite of management approaches to manage dispersed recreation sites rather than closure that is spelled out in the 1991 forest plan. The 1991 forest plan contained standards calling for each site’s site-development scale to be planned in accordance with the identified recreation opportunity spectrum class for the area. However, maps were not developed and incorporated on a Forestwide basis, so management direction was only applicable to defined recreation opportunity spectrum zones in management areas. Management area direction in the1991 forest plan only applies

USDA Forest Service
346
recreation opportunity spectrum standards to 38 percent of the GMUG (table 147). The analysis of the 1991 amendment even disclosed that recreation opportunity spectrum classifications would change over the life of the plan in certain management areas given lack of recreation opportunity spectrum direction and anticipated physical changes from other resources such as timber (USDA Forest Service 1991). The portion of the GMUG in which management area direction ties project actions directly to the recreation opportunity spectrum classification and development scale are Management Areas 2A, 2B, 3A, 8A, 8B, and 8C. In those management areas of the 1991 forest plan, recreation opportunity spectrum standards are prescribed in a similar fashion to all action alternatives. The percentage of management areas covered by recreation opportunity spectrum management direction is listed in table 148.
Table 147. 1983 forest plan direction on recreation opportunity spectrum, by management prescription area [ROS, recreation opportunity spectrum; P, primitive, SPNM, semi-primitive non-motorized, SPM, semi-primitive motorized, RN, roaded natural, R, rural]
Management Prescription Emphasis Corresponding ROS Setting
2A – Semi-Primitive Motorized Recreation Opportunity SPM 2B – Roaded Natural and Rural Recreation Opportunity RN, R 3A – Semi-Primitive Non-Motorized Recreation Opportunity SPNM 4B – Wildlife Habitat Management for Indicator Species SPNM, SPM, RN, R 4D – Aspen Management SPNM, SPM, RN 5A – Big Game Winter Range, non-forested SPNM, SPM, RN 5B – Big Game Winter Range, forested SPNM, SPM, RN 6B – Livestock Grazing SPNM, SPM, RN 7A – Wood fiber production on suited timber lands SPNM, SPM, RN, R 8A - Wilderness, managed for pristine opportunities P 8B - Wilderness, managed for primitive opportunities P 8C - Wilderness, managed for semi-primitive opportunities SPNM 9A – Riparian Area Management SPNM, SPM, RN, R 10C – Special Interest Area SPNM, SPM, RN, R
Table 148. Recreation opportunity spectrum settings management direction in the no-action alternative [ROS, recreation opportunity spectrum]
ROS Management Direction in 1991 Forest Plan Acres Percentage of GMUG
Rural/Roaded Natural1 73,000 2 Semi-Primitive Motorized 399,000 13 Semi-Primitive Non-Motorized2 267,073 3 Primitive3 332,008 17 Other Management Areas with no prescriptive ROS direction in 1991 forest plan5 1,866,118 62

GMUG National Forests Land Management Plan Draft Environmental Impact Statement: Volume 1
347
1 Rural and roaded natural are combined into a single management area in the 1991 forest plan, Management Area 2B. 2 Semi-primitive non-motorized acreage includes Management Area 3A and Management Area 8C, which prescribe semi-
primitive non-motorized. 3 Primitive acreage includes Management Areas 8A and 8B, which prescribe primitive ROS standards. 4 Wilderness designated after 1993 was never classified under ROS and the 1991 forest plan does not provide ROS direction. 5 Most management areas in the 1991 forest plan do not prescribe one ROS setting or another in the plan as amended.
The fundamental difference between the 1991 forest plan and all action alternatives of the draft revised forest plan is that all action alternatives contain summer and winter recreation opportunity spectrum management direction for the entire land base of the GMUG, while the 1991 forest plan does not. In this fashion, recreation opportunity spectrum management direction would be incorporated into planning for every project in order to maintain the desired physical, social, and managerial setting (FW-GDL-REC-16). The allocations of summer and winter recreation opportunity spectrum vary across the landscape based on alternatives, which is discussed in the Comparison of Effects of Alternatives section.
Effects of the No-Action Alternative
The no-action alternative leaves large gaps in recreation planning direction for both summer and winter activities. The 1991 forest plan only provides partial summer recreation opportunity spectrum direction for select management areas. The 1991 forest plan does not contain direction or discussion of winter recreation opportunities. Regarding inventoried summer recreation opportunity spectrum settings, the distribution of recreation opportunity spectrum classes in the GMUG 1991 forest plan (p. II-26) is provided in table 146 where the 1991 table is juxtaposed against the inventory modeled in 2018 (USDA Forest Service 2018, recreation). Regarding summer recreation opportunity spectrum allocations, there was a substantial shift from more semi-primitive motorized to more semi-primitive non-motorized in the 27 years between inventories. There are several explanations as to why the shift occurred. One difference is simply that the modeling techniques used were completely different, and the newer models use three-dimensional topography and different buffering techniques, so comparison is simply not one-to-one. Old, locatable maps from the 1991 inventory are sheets of mylar that were estimated with a wheel but never incorporated into the corporate data systems of new. Beyond mapping techniques, however, much of the shift in acreages between inventories can be explained because the 1991 forest plan contains a lack of management direction to maintain desired summer recreation opportunity spectrum classes on the majority of the GMUG. Rather than plan direction shaping allocations as they have formed over the life of the plan, project-level decisions such as travel management analyses have shifted recreation opportunity spectrum allocations in the absence of any firm guidance. Additionally, major policy changes occurred with the 2005 Travel Management Rule, which forced the agency to look at site-specific, motorized routes and whether they were a part of the GMUG’s desired network of sustainable routes. When the 1991 forest plan was written, the Forest Service still allowed activities like cross-country travel, but after the 2005 Travel Management Rule was in effect, the agency eliminated many motorized routes and areas from public use. Certain areas were closed that were once open to cross-country travel, administrative routes such as timber roads that were once open to the public were gated,

USDA Forest Service
348
certain trails were converted to non-motorized trails, and if a route was unsustainable, such as an eroding trail traveling straight up a fall line or a user-created trail through a riparian zone, it was closed. All of these actions were compliant with forest plan direction, regulations, and policy; however, when those locations are modeled contemporaneously, the result is a shift from roaded natural and semi-primitive motorized to semi-primitive non-motorized on the recreation opportunity spectrum in the newer inventories. This can be seen in the differences between recreation opportunity spectrum modeling in 1991 and 2018 (table 146). Likewise under the no-action alternative, future winter recreation opportunity spectrum inventories would continue to shift based entirely on project-level decisions under 1991 forest plan direction. Because there is no direction in the current plan, winter recreation opportunity spectrum settings would shift based on cumulative line officer decisions without any sort of guidance to maintain desired conditions. Under the no-action alternative, a minority of the project area would remain under prescriptive summer recreation opportunity spectrum standards, acreage provided in table 147. However, approximately 62 percent of the GMUG would remain under no explicit management direction for summer recreation opportunity spectrum under the no-action alternative. No consideration of winter recreation opportunity spectrum would be undertaken under 1991 forest plan direction. Other than the recreation opportunity spectrum, the 1991 forest plan contains some other Forestwide direction for managing recreation. Much of the Forestwide direction is aimed at developed and dispersed recreation. Direction regarding developed recreation is similar in all alternatives and not worth discussing in depth because there are no substantive differences between alternatives. However, the 1991 forest plan approaches the management of dispersed recreation with more rigid approaches and standards (p. III-18 – III-20) than the action alternatives. The 1991 forest plan has some distances written into standards, and campsite conditions are tied to a Frissell condition class scale, which has since been replaced in practice with National Minimum Protocol Monitoring standards in most monitoring applications. The 1991 forest plan prescribes closure for most sites within 100 feet of water, which the draft revised forest plan does not. This rigid guidance has led line officers to close entire areas to camping, and field personnel are simply outmatched in closing individual illegal sites. Though benefits to other resource areas or special uses may be seen by area closures, this methodology can actually lead to increased impacts in adjacent areas that remain open. As the amount of use, pressure, and impacts increase on GMUG lands, this direction could lead to more closures of popular camping areas.
Effects Common to All Alternatives
All alternatives, including the no-action alternative, contain Forestwide direction to sustainably manage developed and dispersed recreation. Management direction related to developed recreation sites in all alternatives is focused largely on providing safe, accessible sites that complement and protect the various natural resources that people access while visiting National Forest System lands (1991 forest plan, p. III-15, draft revised forest plan FW-OBJ-REC-03, 05). Management direction regarding dispersed recreation is contained in

GMUG National Forests Land Management Plan Draft Environmental Impact Statement: Volume 1
349
all four alternatives; however, dispersed recreation actions outlined in the 1991 forest plan are very rigid and site closure is the only response to dispersed recreation issued (p. III-18). On the other hand, the draft revised forest plan offers a suite of management actions in response to dispersed recreation issues, but the actions fall short of providing enforceable management direction for recreation (draft revised forest plan standards FW-STND-REC-08, 09). Furthermore, all alternatives use recreation opportunity spectrum guidance to manage sustainable recreation settings to provide a diverse array of opportunities in the GMUG. All alternatives stipulate managing recreation opportunity spectrum zones based on the development scale specified in Forest Service policy and the Recreation Opportunity Spectrum User Guide (1991 forest plan, p. III-17, and draft revised forest plan FW-GDL-REC-16). However, Forestwide recreation opportunity spectrum maps were not incorporated with the 1991 forest plan, so recreation opportunity spectrum management direction in the 1991 forest plan is not comprehensive.
Effects of Alternative B
Consistent with 36 CFR 219.10(a), the effects of alternative B would provide ecosystem services and multiple uses through integrated resource management because it contains direction to balance sustainable recreation management with other resources such as wildlife. Wildlife management areas would balance the needs of wildlife with the desires of growing recreation types such as mountain biking, off-highway vehicles, and over-snow vehicles. Furthermore, the summer and winter recreation opportunity spectrum allocations of the action alternatives are designed to integrate sustainable recreation management with the physical management of other resources such as vegetation and wildlife (FW-GDL-REC-16, MA-STND-WLDF-02, management area and recreation opportunity spectrum maps). Alternative B would balance recreation desires with wildlife needs because 740,000 acres would be managed as wildlife management areas (MA-STND-WLDF-02), which would restrict habitat fragmentation by limiting road and trail construction. In alternative B, many of these wildlife areas would also be managed under non-motorized winter recreation opportunity spectrum settings, so these areas would be conducive to big game and other species in the summer, and recreation pressures would cause less impact to big game and other species in the winter as well. Many of these wildlife management areas are on aspects that provide important winter forage during a season when the animals need to conserve as much energy as possible. These slopes are not usually known for quality over-snow vehicle recreation. During the heavy snow years, some of these areas can support over-snow vehicle recreation. In heavy snow years, big game can be the most stressed by moving through deep snow and searching harder for forage (refer to Wildlife Effects section chapter 3). Alternative B also contains other direction to manage growing impacts from recreation such as the requirement for food storage and the objective to eliminate unauthorized routes (FW-GDL-REC-14, FW-OBJ-REC-05 and 06).

USDA Forest Service
350
Effects of Recreation Program Direction on Recreation
The biggest effect of the draft revised forest plan program direction on recreation is that the recreation opportunity spectrum settings would be applied to project-level planning through plan direction on a Forestwide basis. This would shape management activities and public opportunities for various types of recreation over the life of the plan. Data provided in table 149 and table 150 represent distinct differences between the alternatives. Maps of the summer and winter recreation opportunity spectrum allocations are provided in appendix 1 of the draft revised forest plan and would guide site-specific decisions over the life of the plan (FW-GDL-REC-16).
Table 149. Summer recreation opportunity spectrum – Acreage of management direction, by alternative [ROS, recreation opportunity spectrum]
ROS Classification Alternative A Alternative B Alternative C Alternative D Primitive 73,000 360,000 335,000 812,000 Semi-Primitive Non-Motorized 399,000 1,411,000 1,086,000 936,000 Semi-Primitive Motorized 267,073 772,000 951,000 680,000 Roaded Natural 73,000 414,000 585,000 530,000 Rural 01 9,000 9,000 9,000 No Summer ROS Management Direction 1,866,1182 0 0 0
1 The 1991 forest plan combined rural and roaded natural into one Management Area – 2A, so the 73,000 acres represents the cumulative acres of both ROS zones.
2 Most management areas in the 1991 forest plan do not assign prescriptions to maintain one ROS zone or another and a map was not developed with the 1991 forest plan or 1991 amendment to adequately apply any Forestwide standards. So, these areas do not contain management direction for one ROS class or another but rather allow a variety of ROS classes within the management area.
Table 150. Winter recreation opportunity spectrum – Acreage of management direction, by alternative [ROS, recreation opportunity spectrum]
ROS Classification Alternative A Alternative B Alternative C Alternative D Pristine 01 107,000 107,000 107,000 Primitive 01 482,000 417,000 793,000 Semi-Primitive Non-Motorized 01 785,000 351,000 1,167,000 Semi-Primitive Motorized 01 1,269,000 1,653,000 588,000 Roaded Natural 01 313,000 428,000 302,000 Rural 01 10,000 10,000 10,000 No Winter ROS Management Direction 2,966,0001 0 0 0
1 The 1991 forest plan did not contain winter ROS management direction. Though it is possible to look at the ROS zones from the 1991 forest plan as applicable year-round, it is clear in reading the analyses from the 1991 forest plan that the ROS was developed for terra conditions, not over-snow conditions.

GMUG National Forests Land Management Plan Draft Environmental Impact Statement: Volume 1
351
Effects of Wildlife Management Area Direction on Recreation
Though some forms of recreation may be limited or excluded from wildlife management areas (MA-STND-WLDF-02), other forms of hunting-based recreation could be enhanced by the protection of important habitat for big game and other species. The fragmentation of habitat by roads and trails can lead to a decrease in big game and associated hunting opportunities. So, by restricting new trail or road construction above a certain density threshold, certain benefits may be seen by the hunting community. However, user groups such as mountain bikers, snowmobilers, motorized users, and others would be more restricted in where they could construct new roads and trails in alternatives B and D. Alternative C provides very few areas with restrictions on trail or road building. No such standards exist in the 1991 forest plan. The acreage of wildlife management areas for each action alternative is provided in table 151.
Table 151. Acreage of wildlife management areas for each action alternative
Alternative A Alternative B Alternative C Alternative D Acreage of Wildlife Management Area 01 740,000 36,000 621,000
1 The 1991 forest plan does not have a management area with an equivalent impact to recreation.
Comparison of Effects of the Action Alternatives
Management direction contained in the no-action alternative does not compare equally to the action alternatives. Management areas from the 1991 forest plan do not compare on a one-to-one basis to draft revised forest plan management areas. Furthermore, the recreation opportunity spectrum zones from the 1991 forest plan were only partially mapped for summer and are completely absent for winter, so comparisons between the old and new plan are only valid to further show the inadequacies of the 1991 forest plan, which was thoroughly described in the analysis of the no-action alternative. Therefore, the detailed comparison of effects of the alternatives will focus on the effects of the action alternatives. Among the action alternatives, there are some substantive differences that would affect changes in management actions and recreation opportunities over the life of the draft revised forest plan. One of the biggest differences between alternatives is the allocation of wildlife management areas over the GMUG landscape. The substantial differences between alternatives are shown in table 152. Alternative C contrasts with alternative B by offering very few acres of wildlife management areas. As a result of this allocation, alternative C might allow trail advocates to build more trails in those areas, and motorized and mechanized uses would be future options to relieve congestion in summer and winter. Along with increased motorized and mechanized use, these areas might see additional foot traffic with more development. Currently these areas are some of the largest remaining swaths of wildlife habitat in the GMUG, so traditional hunting types of recreation might be adversely affected by increasing pressure from other forms of recreation (refer to Wildlife Effects section chapter 3). Alternatives B and D present substantial acreages managed for wildlife, with alternative B containing the most acreage of wildlife management areas. This is because in alternative D,

USDA Forest Service
352
large acreages are proposed as other types of protected areas such as wilderness and special management areas rather than wildlife management areas (table 152). Alternative D is the most restrictive management option for recreation. Special management areas, areas to be analyzed as wilderness, and wildlife management areas all contain restrictions on trail construction and visitor use types, and the combined acreage of these protected areas is 1,681,000 acres (table 152). This would restrict motorized and mechanized uses on a substantial portion of the GMUG. Non-motorized, wildlife-dependent activities would be enhanced under alternative D.
Table 152. Wilderness, wildlife, and special management areas – Acreage of management direction, by alternative
Management Area Alternative A Alternative B Alternative C Alternative D Wilderness 553,000 587,0001 553,000 814,0001 Wildlife Management Area 02 740,000 36,000 621,000 Special Management Area 02 0 0 246,000 Total Acreage 553,000 1,327,000 589,000 1,681,000
1 Acreage includes wilderness and areas to be analyzed as wilderness by alternative.
2 No equivalent management area in 1991 forest plan.
Furthermore, special management areas in alternative D would set many non-motorized parameters for over-snow travel decisions (draft revised forest plan, table 19). This would cause a substantial loss of motorized recreation opportunities in winter months over the life of the plan. Likewise, alternative D sets forth non-motorized summer travel management guidelines in management direction. This would lead to a loss of motorized recreation opportunities over time; however, some non-motorized recreation opportunities would likely be enhanced by future project-level decisions and recreation opportunity spectrum prescriptions in this alternative. Beyond the allocation of wildlife management areas, another significant difference between alternatives would be the direction to manage for certain recreation opportunity spectrum settings in summer and winter across the entire GMUG landscape. All of the action alternatives contain direction for the entire GMUG to maintain desired recreation opportunity spectrum settings, so the action alternatives contain summer and winter recreation opportunity spectrum direction that would shape project-level decisions to maintain desired settings. Future management would differ substantially between the winter recreation opportunity spectrum alternatives. This would create large differences in future recreation opportunities and management as trailheads get buried with snow, some roads turn to ski trails, and some areas that are closed to motorized travel in the summer become powdery meadows for snowmobilers to play in during the winter months. Alternative C provides direction to manage a relatively larger percentage of the GMUG land base as motorized during the winter months. As a result, quiet user groups might see diminishing opportunities over the course of the plan as all use increases and new and improved motorized technologies make more terrain accessible. Impacts to wildlife would

GMUG National Forests Land Management Plan Draft Environmental Impact Statement: Volume 1
353
also be greater, potentially stressing animals such as deer and elk during heavy snow years (refer to Wildlife Effects section chapter 3). Even areas that are not quality riding areas would be managed as motorized zones in alternative C, so there would be less refuge for big game species during the winter, which could have negative effects on the opportunities for wildlife-related recreation. On the other hand, alternative D would direct the agency to manage the majority of the GMUG as non-motorized in the winter. Alternative D would place non-motorized management direction over substantial amounts of lands, including lands that are currently popular with snowmobilers. This would be unpopular with some groups of recreationists and local business owners. Currently, motorized areas of the GMUG that would be managed in the future as non-motorized under alternative D would include large portions of Taylor Park, the Grand Mesa, and Marshall Pass. This alternative would substantially reduce motorized uses around the GMUG and concentrate motorized opportunities into small areas over the life of the draft revised forest plan. Alternative B represents a more balanced approach to winter management than the other action alternatives. Though a majority of the management prescriptions would be motorized, there would be important winter range areas set aside as non-motorized settings. Many of these areas coincide with the wildlife management areas of alternative B. However, the Forest Service would plan to continue to manage important motorized use areas as open.
Cumulative Effects
Adjacent territories in all directions are abundant with recreation opportunities, motorized and non-motorized, consumptive and non-consumptive. National Forest System, Bureau of Land Management, National Park Service, and other lands in the western Colorado region offer millions of acres of public lands for people to enjoy. However, public lands are finite, and increasing populations and demands will continue to create more crowding and impacts throughout the region (USDA Forest Service 2018, recreation). The cumulative effects of population increase on recreation will be an increase in demand for all types of recreation on all public lands in the GMUG and surrounding areas. Opportunities will require more planning and even reservations, and restrictions will likely increase as impacts increase. Areas once governed by wide open spaces and first come, first served will require more management and regulations. The draft revised forest plan provides flexibility in management actions, and it provides a diversity of opportunities across the landscape. Regardless, the challenges of growth will continue to impact the project area and adjacent lands. Furthermore, the increase in use brings an increase in impacts to other resources, including wildlife. Some species have ranges or impacts that go beyond this recreation analysis but are addressed in other sections of the document. Big game might live part of the year in the GMUG and at other times on other National Forest System, Bureau of Land Management, State, National Park Service, or other lands. The cumulative impact that recreation has on wildlife extends beyond the project area as outdoor recreation is impacting all areas surrounding the GMUG. The 2015 Colorado Parks and Wildlife Strategic Plan has goals and objectives regarding maintenance of sustainable wildlife populations to support the broad array of recreation

USDA Forest Service
354
opportunities that they provide (USDA Forest Service 2018, recreation). Alternative B works toward incorporating this consideration in alternative B by protecting important habitat through the designation of wildlife management areas and winter recreation opportunity spectrum allocations. The 2016–2026 Colorado Parks and Wildlife Statewide Trails Strategic Plan is to provide for trail opportunities and to protect sensitive species and wildlife habitat, which alternative B does by allowing trail development in some areas while limiting it in others (MA-GDL-MTR-07, MA-STND-WLDF-02, MA-GDL-WLDN-12). This mitigating management direction in the forest plan helps soften the cumulative impacts that recreation has on wildlife, both inside the project area boundary and outside it by providing habitat at the right time in the right place.
Conclusion The draft revised forest plan is consistent with 36 CFR 219.10(a) because the effects of plan direction would provide ecosystem services and multiple uses through integrated resource management because it integrates sustainable recreation management with other resources by providing summer and winter recreation opportunity spectrum direction on a Forestwide basis. This recreation opportunity spectrum direction integrates physical settings, social desires, and managerial actions with multiple uses and resources such as timber, range, and wildlife. Furthermore, the inclusion of recreation standards in wildlife management areas further integrates recreation into planning with other resources. Alternative B would integrate recreation with other resources in a balanced way, providing a mix of motorized and non-motorized settings. Alternative C would provide the most motorized opportunities, even opportunities in some critical wildlife habitat. Beyond effects on wildlife, alternative C would have negative impacts on other non-motorized forms of recreation in areas that were not problematic before the draft revised forest plan. Finally, in alternative D most of the GMUG would be managed as non-motorized, preserving a large amount of habitat. However, because alternative D classifies several popular motorized areas as non-motorized management, motorized opportunities would be greatly reduced.
Scenic Resources
Affected Environment Scenic character is a combination of the physical, biological, and cultural images that gives an area its scenic identity and contributes to its sense of place. Scenery varies depending on existing natural features including vegetation, water features, landform and geology, cultural features, and management activities (such as buildings, structures, or manipulations of the land or vegetation). Cultural features and management activities may contribute to scenic character when these elements have historical backgrounds, have nostalgic connotations, reflect the cultural legacy of an area, or create a visually pleasing complement to the scenic character. Research shows there is a high degree of public agreement regarding scenic preferences and that people tend to value most highly the more visually attractive and natural-appearing landscape (USDA Forest Service 1995). The GMUG is the backyard of multiple communities and homes, providing the beautiful backdrop views from these areas. Scenery is an integral component of all forest recreation

GMUG National Forests Land Management Plan Draft Environmental Impact Statement: Volume 1
355
settings, contributes to the recreation opportunities selected, and plays a vital role in the attraction, enjoyment, and economic value of recreation use. The natural and natural-appearing scenic character of the GMUG makes it a major local, regional, and national recreation destination. A detailed description of the affected environment for scenic resources is included in the assessment (USDA Forest Service 2018, scenic character) and is hereby incorporated by reference. This information is summarized below for the environmental analysis.
Summary of Existing Conditions
The GMUG has been and continues to be a popular recreation destination locally, regionally, and nationally. Some portions of the GMUG have an international reputation for outstanding scenery. Trends to spend more time and enjoy the natural scenic beauty of the forest environment exist because viewing natural features or scenery has been among the top two recreation activities in the GMUG during the last three rounds of National Visitor Use Monitoring (USDA Forest Service 2010b, 2015b, 2020a). Further, regional population growth continues to influence scenery resources. The concern and desire for natural-appearing scenery has increased for users participating in recreation activities, traveling through the GMUG, and viewing the landscape from communities. The scenery management system provides a systematic approach to determine the relative value and importance of scenery on National Forest System lands. The GMUG completed scenery management system inventories as part of the plan revision process to map existing condition of the scenic resources (USDA Forest Service 2021). The results are summarized in the assessment. The scenery management system inventory and mapping included:
• concern levels (the relative concern for scenery along roads and trails), • visibility (the foreground, middle ground, and background areas visible from concern
level roads and trails), • scenic attractiveness (the intrinsic scenic beauty of a landscape based on landform, rock
form, water form, and vegetation), • scenic classes (the relative importance of scenery overall), • existing scenic integrity (the existing condition of scenic resources), and • scenic character descriptions (existing condition descriptions of valued scenic attributes
and scenic character written at the ecological subsection scale). The scenic character description is stand-alone document (USDA Forest Service 2020a).
The mountain landscapes, mesa, and plateau are a focal point and the backdrop to multiple travelways and communities in the area. Visitors on scenic byways, major National Forest System roads, nationally designated trails, regionally important trails, and recreation sites have high concern for viewing natural-appearing scenery. Secondary travelways and use areas typically have a moderate concern for viewing scenery where visitors still expect to see natural-appearing landscapes but may also see more management influences that blend with the scenic character. Views from concern level areas are classified based on the distance from the observer. Portions of the GMUG located away from major or secondary travelway viewsheds are referred to as seldom seen (USDA Forest Service 1995, pp. 4-11).

USDA Forest Service
356
Alpine mountain peaks; flowing streams; unique waterfalls; diverse vegetation; high-elevation tree-covered mountains; aspen fall colors; and steep, vibrantly colored cliffs and canyons combine to provide distinctive landscapes. Alpine landscapes provide a unique opportunity for scenic viewing, particularly during the early summer when wildflowers are in bloom. Aspen is an important feature of the scenic character in the southern Rocky Mountains. Aspen color and texture contribute to the character in many ways, including edge contrast between aspen and conifer stands, aspen islands in large meadows, and the lower edge of aspens adjoining large meadows and parks. Color is a dominant element in the landscape, especially during autumn color changes.
Existing Scenic Integrity
Most of the GMUG has high scenic quality and natural and natural-appearing scenic character measured using the existing scenic integrity inventory. The results of this inventory are summarized here and described in more detail in the assessment and scenery management system inventory report (USDA Forest Service 2018, scenic character, and USDA Forest Service 2021). About 20 percent of the GMUG contains naturally evolving landscapes where processes occur with very little management intervention; scenic character is intact with only minor changes. These areas include designated wilderness areas and the Roubideau and Tabeguache areas. Most of the GMUG, 51 percent, has natural-appearing scenic character or high existing scenic integrity. Management activities are unnoticed, and landscapes appear unaltered. About 23 percent of the GMUG has moderate existing scenic integrity, with landscapes that appear slightly altered. Evidence of management activities along roads and trails is noticeable but subordinate to the scenic character being viewed. About 4 percent of the GMUG has low existing scenic integrity, or landscapes that appear altered. Management activities begin to dominate landscape features by adding forms, lines, edges, and color changes to the landscape. About 2 percent of the GMUG has very low existing scenic integrity. These very low existing scenic integrity areas have a heavily altered scenic character in which the valued attributes described in the scenic character are not evident. Examples include management activities that add uncharacteristic forms, lines, and colors to the landscape such as major utility corridors, communications sites, or mining sites.
Scenic Character Contribution to the Socioeconomic Landscape
Scenic quality and scenic resources benefit regional economies since tourism, which plays a major role in the economy of western Colorado, is closely intertwined with scenic values. Communities surrounding the GMUG act as portals into the surrounding public lands. The region’s outstanding scenery is a key attraction of the GMUG and surrounding communities. Scenic National Forest System lands also serve as important backdrops in rural towns and gateway communities. Scenic resources not only promote tourism, realty, and recreation-oriented businesses but also underscore the importance of public and private lands as a setting that makes gateway communities attractive places to live and work. Benefits derived

GMUG National Forests Land Management Plan Draft Environmental Impact Statement: Volume 1
357
from scenic resources include recreational use and enjoyment, identity, self-image of communities and individuals, enhanced quality of life, and conservation of the positive cultural landscape. About 19 percent of the GMUG is designated wilderness, which provides for distinctive scenic landscape features and unaltered, naturally evolving scenic character. Scenery is part of the nature and purpose of scenic byways, nationally designated trails, and other designated areas such as the Tabeguache and Roubideau areas and Fossil Ridge Recreation Management Area. Several National Forest System roads are recognized for high quality scenery viewing opportunities. Scenery also contributes to five nationally designated trails and nationally known snowmobile trails for winter recreation. Scenic byways and other recognized roads offer unique scenic driving experiences. Scenery is also an outstandingly remarkable value for several eligible wild and scenic rivers. The GMUG hosts one National Scenic Byway (the Grand Mesa Scenic and Historic Byway) and shares an All-American Road (the San Juan Skyway). Four other scenic byways that traverse the GMUG hold State designations: Alpine Loop, Silver Thread, Unaweep-Tabeguache, and the West Elk Loop (Colorado Department of Transportation 2016). Additional National Forest System roads are recognized for high quality scenery viewing opportunities:
• Lower Taylor Canyon Road • Ohio Pass Road • Owl Creek-Cimarron Road • Canyon Creek-Yankee Boy Road • Imogene-Black Bear Road • Ophir Road • Lands End Road. The Continental Divide National Scenic Trail is intended to provide for scenic, high quality, primitive hiking and horseback riding experiences, while preserving the significant natural, historic, and cultural resources along the trail. Other nationally designated trails and nationally known snowmobile trails include the Old Spanish National Historic Trail, Bear Creek National Recreation Trail, Crag Crest National Recreation Trail and Crag Crest Cross-Country Ski Trail, Colorado Trail, and Sunlight-Powderhorn Winter Trail.
Multiple Uses and Sustainability of Scenic Resources and Uses
Scenic character, when managed though the scenery management system, recognizes that a landscape is dynamic and a constantly changing community of plants and animals. Depending on the scale and severity of management activities or natural disturbances, the resulting scenic character can be more sustainable and resilient. Resource management activity has changed and continues to change scenic character. These activities include but are not limited to timber management, oil and gas extraction, mining, road and trail development, campgrounds and picnic grounds, ski area and resort development, fire management (suppression and prescribed fire), and livestock grazing. The most obvious effects to scenic resources tend to be from vegetation and landform alterations,

USDA Forest Service
358
including natural processes such as insects and disease, wildfires, or landslides. These natural disturbances continue to shape the vegetation and landform features of the landscape, affecting the overall sustainability of the scenic character. Other factors that will continue to affect the sustainability of the scenic character of the national forests include drought conditions affecting vegetation and water features, invasive species affecting native vegetation, tree encroachment on meadows and other forest openings, and conifer encroachment on aspen. Multiple uses and their potential impacts and contributions on scenic resources are important for the sustainability and resilience of scenery in the GMUG.
Stressors and Drivers
Natural resources and settings would be vulnerable to adverse effects of atypical temperatures and rainfall patterns from climate change. Some associated effects include drought, increased number and intensity of wildfires, increased insect and disease outbreaks affecting vegetation, and decreased water yield and availability. Severe wildfires would remove forest vegetation and diminish the scenic quality of the landscape, especially when a wildfire burns at an uncharacteristic scale or severity. When fires burn at high intensities over large areas, as is more likely during severe drought and increased temperatures, heavy runoff from extreme storms may remove understory vegetation, which would reduce the quality of scenic vistas. When insect and disease outbreaks occur at epidemic levels, tree mortality with standing and fallen dead trees would reduce scenic quality especially when the mortality dominates scenic vistas. Defoliation of trees from insects and disease would also affect the scenic quality, altering the scenic views while trees are defoliated.
Environmental Consequences
Analysis Framework
This section evaluates and discloses the potential environmental consequences to scenic resources. An issue raised by the public is timber suitability at high slopes: with the increase in slope up to 60 percent slopes, based on the anticipation of newer harvesting technology, analyze potential impacts from any timber harvest on scenic resources. The environmental consequences analysis considered how each alternative would provide for scenery management using the following indicators:
• Percentage of the GMUG allocated to visual quality objective or proposed scenic integrity objective in each alternative. Existing or proposed plan direction provides for varying amounts of natural-appearing scenery for GMUG visitors.
• Percentage of lands suitable for timber production in high scenic integrity objective on steep slopes (slopes over 40 percent).
• Whether the scenery management system is being used to manage scenery (consistent with current Forest Service policy for scenery management).
• A qualitative discussion of the potential effects to scenic resources from management activities such as vegetation management (including timber harvest and fuels reduction), prescribed fire, energy development, range management, recreation activities, transportation infrastructure, special uses, and facilities.

GMUG National Forests Land Management Plan Draft Environmental Impact Statement: Volume 1
359
Methodology
Potential effects of management activities were determined through research and analysis of similar past activities, professional judgement, and review of the current 1991 plan and the draft revised forest plan and alternatives. ArcMap and GIS data layers were used to do the following:
• analyze 1991 forest plan and draft revised forest plan direction for scenic resources (referred to in the 1991 forest plan as visual resources)
• review scenery management system inventories to determine the existing condition of scenic resources
• develop desired scenic integrity objectives for the action alternatives • review proposed management areas and proposed plan components in the draft revised
forest plan • analyze the alternatives regarding desired conditions for scenic resources (visual quality
objectives or scenic integrity objectives).
Assumptions Specific to Scenery
• The principles of scenery management and environmental design will be applied in project-level planning in all National Forest System management activities.
• Scenery management techniques and principles will be used to mitigate any future site-specific, vegetation, or land-altering activity or introduced elements on the land to achieve and maintain desired scenic integrity objectives and desired scenic character.
• Managing for natural-appearing scenery is important to the public (USDA Forest Service 1995).
• Desired scenic character often includes and is linked to preferred visual settings. Gobster (1994) summarizes visually preferred settings as having four common attributes: large trees; smooth, herbaceous ground cover; an open midstory canopy with high visual penetration; and vistas with distant views and high topographic relief.
• For the no-action alternative, the visual quality objectives identified in the 1991 plan and other 1991 plan direction would be used to manage scenery.
Management Direction
The Forest Service has been managing scenery as a resource since the 1970s, first using the visual management system and later the scenery management system. Both systems provide a framework to inventory, assess, and manage scenic resources. However, the scenery management system represents the agency’s latest science in fulfilling its legal requirements for managing scenic resources and achieving high-quality scenery. The scenery management system integrates increased understanding of ecological processes, disturbance patterns, and cultural landscapes in identifying the effects of various management practices on scenic resources. The 1991 plan manages scenic resources using the visual management system (USDA Forest Service 1974). The 1991 plan established standards and guidelines for visual resources by combining visual quality objectives and visual absorption capability to identify

USDA Forest Service
360
visual management guideline classes. Some management area standards and guidelines assign specific visual quality objectives to the management areas (e.g.,, wilderness is assigned preservation visual quality objective), while other management areas are assigned a range of visual quality objectives (e.g., the direction states “manage for adopted visual quality objectives”). Geospatial maps and data of adopted visual quality objectives are not available. The visual quality objectives, visual absorption capability, and other visual resource inventories completed in the 1980s are on printed maps that are available in the Forest Supervisor’s Office. However, the map set is incomplete. The land management plan revision process used the scenery management system (USDA Forest Service 1995). The GMUG completed scenery management system inventories (existing conditions) that informed the assessment and were used to develop integrated plan components including desired conditions, objectives, standards, guidelines, and mapped desired scenic integrity objectives in the draft revised forest plan. Scenic integrity objectives are the minimum degree to which desired scenic character attributes are to remain intact (USDA Forest Service 1995, pp. 20 and 5-9). In land management plans, both systems establish a spectrum of levels or objectives to determine the acceptable level of alteration in the landscape’s scenic character. The visual management system uses visual quality objectives, while the scenery management system uses scenic integrity objectives. It is important to understand that while they incorporate the word “objective,” the scenic integrity objectives are mapped desired conditions showing the minimum degree to which desired scenic character attributes are to remain intact. The different visual quality objective and scenic integrity objective levels and how people perceive them are shown in table 153. Definitions for each visual quality objective have some differences from the perception described below. Visual quality objective definitions are contained in the revised scenic character assessment (USDA Forest Service 2018) and the 1991 forest plan.
Table 153. Scenic integrity objective, visual quality objective, and perception crosswalk [Source: USDA Forest Service (1995, pp. 2–4), and USDA Forest Service (2020a). FSM, Forest Service Manual]
Scenery Management
System Scenic Integrity Objectives
Visual Management System Visual
Quality Objectives Perception of Scenery
Very High Preservation The landscape is intact with only minor changes from the valued attributes described in the scenic character; naturally evolving.
High Retention Management activities are unnoticed, and the landscape appears unaltered.
Moderate Partial retention Management activities are noticeable but are subordinate to the scenic character. The landscape appears slightly altered; relatively natural appearing.
Low Modification
The landscape appears altered. Management activities are evident and sometimes dominate, but they are designed to blend with surroundings by repeating form, line, color, and texture of attributes described in the scenic character.

GMUG National Forests Land Management Plan Draft Environmental Impact Statement: Volume 1
361
Scenery Management
System Scenic Integrity Objectives
Visual Management System Visual
Quality Objectives Perception of Scenery
Very Low Maximum Modification
Describes landscapes that are heavily altered and in which the valued attributes described in the scenic character are not evident. FSM 2310 states that very low is used only to describe the existing scenic integrity; it is not used as a scenic integrity objective or desired condition.
Effects Common to All Alternatives
Scenic Integrity Objective Allocations
Plan direction for scenic resources is included to varying degrees in all alternatives and would complement multiple use activities and maintain or improve scenic quality and scenic character resilience and provide opportunities for the public to connect with nature. Under all alternatives, scenery would continue to be managed by direction given in Forest Service manuals and handbooks, which provide general guidance for scenery management. Each alternative provides for scenery management to varying degrees, with either visual quality objectives or proposed scenic integrity objectives. GMUG lands would continue to be managed for natural-appearing landscapes and scenic quality. Alternative A uses the visual quality objectives established in the 1991 plan. Alternatives B, C, and D use proposed scenic integrity objectives, fully implementing the scenery management system and integrating scenery management with other resources in the action alternatives. Scenic integrity objectives would help protect and improve scenic quality across most of the GMUG, yet in some locations, scenic integrity objectives would be lower to allow for necessary and accepted land uses that have lower scenic quality, such as utility corridors. The percentage of the GMUG in each visual quality objective and proposed scenic integrity objective for each alternative is summarized in table 154.
Table 154. Summary of scenic integrity objective by forest plan alternative for the GMUG National Forests [VQO, visual quality objective]
Scenic Integrity Objective
Alternative A (percent)
VQO Alternative B
(percent) Alternative C
(percent) Alternative D
(percent)
Very High 15% Preservation 21% 20% 29%
High 6%
Retention 37% 11% 41%
Moderate 19% Partial Retention 27% 51% 24%
Low 56%
Modification 14% 18% 6%

USDA Forest Service
362
Scenic Integrity Objective
Alternative A (percent)
VQO Alternative B
(percent) Alternative C
(percent) Alternative D
(percent)
Very Low 4%
Maximum Modification
0% 0% 0%
Exact acreage of visual quality objectives in alternative A is not available because the visual quality objectives map is not digital or available in GIS. The percentage of each is summarized from the 1991 plan (USDA Forest Service 1991, p. II-93). As shown above, alternative A would have a range of visual quality objectives with an emphasis on low (modification) and moderate (partial retention). For alternatives B, C, and D, the amount, location, and emphasis of scenery management is determined by scenic integrity objectives, which vary by alternative. Alternatives B and D would have emphasis on high, moderate, and very high scenic integrity. Alternative C would have emphasis on moderate scenic integrity, followed by emphasis of very high and then low scenic integrity. Scenic integrity objective maps for each action alternative are in appendix 1 of the draft revised forest plan. Designated wilderness, the Tabeguache and Roubideau designated areas, and recommended wilderness areas, when proposed, are managed for “very high” scenic integrity objective. Here, landscapes are unaltered with a naturally evolving scenic character; few changes from the natural character occur, such as dispersed campsites, non-motorized trails, or trail signs. Areas highly valued for scenery (foreground views of high concern travel routes and sites and areas with outstanding scenic quality) and designated areas in some alternatives (such as Colorado roadless areas) are managed for a “high” scenic integrity objective. Here, landscapes appear unaltered, even though some changes to the scenic character are present. Changes in the scenic character in “high” scenic integrity objective borrow from elements in the landscape, such as form, line, color, texture, and pattern. Developed recreation sites (such as campgrounds, picnic areas, and recreation residences) and lands viewed from moderate travelways and use areas or backdrops of lower scenic quality typically have a “moderate” scenic integrity objective. Here, scenic character appears slightly altered, but noticeable management activities remain visually subordinate to the scenic character. Mountain resorts, communication sites, transmission lines, active mines, and other areas seldom seen from concern level travelways and use areas have “low” scenic integrity objective. Here, scenic character appears moderately altered and deviations begin to dominate the scenic character being viewed. Disruptive activities may occur on lands managed for “low.” Although having lower scenic quality, these are necessary and accepted land uses. The composition of scenic integrity objectives across the GMUG would influence how natural appearing the landscape would remain and varies by alternative. The “very high,” “high,” and “moderate” scenic integrity objectives result in a relatively natural-appearing landscape. In particular, “very high” and “high” scenic integrity objectives provide an intact and attractive scenic setting for GMUG visitors and residents. The “low” scenic integrity objective results in more modified landscapes that are often considered less scenic and visually appealing. GMUG visitors would have lower quality experience and satisfaction if the proportion of “low” scenic integrity objective is too high in proportion to the “very high,” “high,” and “moderate” scenic integrity objectives. GMUG visitors would also have

GMUG National Forests Land Management Plan Draft Environmental Impact Statement: Volume 1
363
lower quality experience if “low” scenic integrity objectives are allocated to areas with high use where visitors expect to see a natural appearing scenic character. More detailed discussion of how the scenic integrity objectives vary by action alternative is contained in the sections below and in the Environmental Consequences section for each alternative.
Consequences of Multiple Use Management Activities on Scenic Resources
There is potential for management activities to impact the existing landscape, scenic character, and scenic integrity under all alternatives. Management activities affect scenic resources by altering the appearance of the landscape over both the short-and long-term (decades). Short term and long term should be defined in the project-level analysis based on the potential effects of the activities proposed. Short-term effects for scenery are generally noticeable after project completion and perceived as contrasts to the surrounding scenic character. Management activities, although they may have some short-term impacts on scenery, also may begin to move the landscape toward the desired scenic character. Effects that move the landscape toward the desired scenic character are often realized over a long period or cumulatively and lead to the lasting sustainability and resilience of valued scenic character attributes. Project design or mitigation would consider scenic resources under any alternative to meet the visual quality objectives or proposed scenic integrity objectives. It is assumed that, through site-specific project design or mitigation, the landscape would move toward scenery desired conditions under all alternatives. Management activities in the GMUG with the greatest potential to affect scenic resources are associated with vegetation management (including timber harvest, mechanical treatments, and fuels treatments), fire (prescribed and naturally ignited wildfire), energy development (including oil and gas or geothermal), range management, recreation facilities, transportation infrastructure, and special uses and facilities. These would impact the existing landscape and have the potential to thereby impact scenic resources. In all alternatives there are standards (1991 forest plan) and guidelines (1991 forest plan and draft revised forest plan) that specify that management activities would blend in with the landscape’s scenic character according to the visual management system and scenery management system and would help protect scenic quality with associated effects.
Vegetation Management
Vegetation management activities would be conducted to improve forest health and resilience to wildfire, disease, and insect infestation, and in time enhance and protect long-term scenic quality under all alternatives. However, these actions also would temporarily impact scenic resources. Activities including tree removal, depending on the intensity of the treatment, can have varying consequences on scenery. Mechanical treatments could change the character of the landscape in the short-term where activities occur. Some management activities may have visually dominant effects in the short term, which may be out of step with adopted scenic integrity objectives. Activities such as large-scale vegetation management projects to restore ecosystem resiliency provide short-term changes such as ground disturbance, stumps, slash, and burnt vegetation.

USDA Forest Service
364
Although management activities would have some short-term impacts on scenery, they also would begin to move the landscape toward desired conditions for scenic resources over the long term. Ultimately this would result in the lasting sustainability of valued scenic character attributes, such as clear lakes and streams, vegetative ground cover, large trees, a mosaic of conifer forests and aspen or meadows, open mid-story canopy with high visual penetration, and vistas with distant views and high topographic relief, among other attributes (Gobster 1994). Treatments maintaining or enhancing aspen are important for maintaining or enhancing valued scenic character attributes because aspen color, texture, and edge contrasts contribute to scenic character in many ways. In the long term, the removal of some trees, dependent on scale and intensity of treatment, may improve scenic character and make scenic attributes more resilient to uncharacteristic large-scale disturbance. Healthy, fire-resistant vegetation that allows fires to move through the landscape at the appropriate scale, frequency, and severity allows systems to recover relatively quickly from fire and is important for long-term scenic quality and scenic character resilience. People often describe feelings of loss due to the noticeable changes in scenic character and sense of place from uncharacteristic large-scale disturbance. “In general, natural forest disturbances that result in extensive areas of dead or dying trees (Haider and Hunt 2002, Ribe 1990) such as the destruction of the forest by fire or flooding are perceived negatively (Daniel 2001; Fanariotu and Skuras 2004; Gobster 1994, 1995)” (cited in Ryan 2005, p. 17). Hence, healthy and resilient forest environments that recover relatively quickly would maintain or improve scenic character, which maintains sense of place attachment and opportunities to connect with nature. Project design features, mitigation, or both would consider scenic resources under any alternative so vegetation would meet visual quality objectives or proposed scenic integrity objectives in the short term to the extent possible but particularly in the long term. These types of activities may be most evident in lands suitable for timber production, in the wildland-urban interface, and in management areas such as general forest or wildlife management areas or those with a restoration emphasis.
Prescribed and Managed Fire Activities
Prescribed and managed fire activities would occur under all alternatives. Treatments to restore fire-adapted ecosystems vary and include use of prescribed fire as well as wildland fire use. All fire activities would be evident in the short term with burned, blackened vegetation and charred ground surfaces. Grasses and shrubs typically recover quickly, depending on when treatment occurs and also on moisture conditions during the growing season. In the long term, prescribed fire typically increases the diversity of texture, color, vegetative size classes, and distribution across the landscape. In the long term, prescribed fire at lower intensities creates preferred scenic settings and increases sustainability of scenic character. These types of activities may be most evident in wildland-urban interface or management areas with fire dependent or frequent fire ecosystem characteristics.
Energy Development
There is potential to impact the existing landscape and scenic character from development associated with leasable energy minerals under all alternatives. Site-specific National

GMUG National Forests Land Management Plan Draft Environmental Impact Statement: Volume 1
365
Environmental Policy Act analysis precedes leasing, exploration, and development. The potential impacts of these developments are longer in duration and can include changes to scenic resources from road and pad construction and associated facilities. When activities are scattered across the landscape, borrow colors from the landscape are used for facilities, which are sited to blend with the topography of the area, so that these activities and facilities have minimal impact on scenic resources.
Range Management
Range management would continue under all alternatives. In places with the most range management activities, views may include windmills, cattle, stock tanks, fences, and other private ranchland features. Effects of range management can be negative or positive depending on an individual’s preferred setting. Impacts perceived as negative may include noticeable changes to the landscape when looking at short grazed vegetation, the difference between grazed and ungrazed vegetation at allotment boundaries and fences, cattle waste dominating grasslands and meadows, and trailing around water developments. Most range facilities are small and localized, and with some design consideration for scenery (such as natural materials or colors that blend with the landscape) would have minimal effects on, or contribute to, the scenic character. Many local residents are accustomed to viewing these structures and features and consider them a highly valued part of the traditional landscape. Some visitors may also have an appreciation of these landscape’s rural or pastoral scenic character. For many residents and some visitors, the presence of this activity contributes to the sense of place or cultural identity, while for others this activity is not viewed as positively.
Recreation Activities
Recreation activities, both developed and dispersed, would continue in all alternatives. Developments for recreation activities are evident, such as roads, trails, campgrounds, and day use areas. They are appropriate for the desired recreation opportunity spectrum setting (generally roaded natural and rural). The recreation opportunity spectrum incorporates scenery in recreation setting characteristics. Facilities may be evident and noticeable, creating a built environment in an otherwise natural environmental setting. Facilities designed to blend with the surrounding landscape would have minimal effects to scenery. When best environmental and sustainable design practices are used, facilities would harmonize with the surrounding landscape or enhance and complement the desired scenic character. Recreation facilities that conform to the desired scenic character are appropriate in high scenic integrity in roaded natural or rural settings. The location of facilities also affects the surrounding setting because the facilities raise the level of concern by becoming viewing platforms for visitors. Recreation use beyond the designed capacity can cause natural resource damage adjacent to and within recreation sites, roads, and trails, affecting the natural-appearing scenery.
Transportation Infrastructure
Road-related activities, such as road maintenance or decommissioning, would continue under all alternatives. Road construction would impact scenic resources by creating evident contrasts in color and texture and changing landforms for cut and fill slopes. Effects of road

USDA Forest Service
366
construction may be dominant in foreground, middleground, and even background distance zones depending on location and design. Roads also serve as the viewer platform, offering opportunities and access to view scenery. The somewhat modified setting of a viewer platform (road or trail) is accepted as a necessary component allowing travelers to experience the greater landscape (USDA Forest Service 1995, p. D-1). Road decommissioning would create noticeable soil color contrasts in foreground views of the concern level travel routes and use areas by exposing fresh, often lighter colored soils during decommissioning activities. In the short term, these areas visually recover quickly as the area revegetates. In the long term, road decommissioning is typically beneficial to scenic resources by recontouring slopes to mimic natural landforms and rehabilitating and revegetating exposed soils often noticeable on cut and fill slopes created during road construction. Road maintenance is beneficial for scenic resource viewing by providing access and a platform for viewing scenery from motorized vehicles.
Special Uses and Facilities
Special use activities, such as mountain resorts, utilities, or communications sites, would continue under all alternatives. Development associated with facilities and special uses would impact scenic resources by creating contrasts in form, line, color, or texture to the scenic character. Structures may not have architectural styles, materials, or colors that blend with the landscape. In the short term, active construction, vegetative clearing, and other ground-disturbing activities can dominate the landscape. Energy transmission corridors, along with communication sites, are generally long-term commitments of National Forest System lands having high potential to affect scenic resources for a long duration. In the long term, scenic effects of operations and maintenance of permanent structures are generally greatest when these developments occur within view of high public use areas and where operations or structures do not borrow from the forms, lines, colors, or textures that are present in the surrounding landscape. Cleared rights-of-way and utility structures often contrast highly with the surrounding landscape and dominate the scenic character. Structures with strong vertical elements may especially dominate the scenic character being viewed. All alternatives would have similar effects from energy corridor rights-of-way and communications sites. All alternatives also have plan direction to provide for scenery (such as emphasizing visually appealing landscapes, natural-appearing settings, and natural scenic character). Additionally, management activities or facilities associated with special uses would be designed to meet the visual quality objectives or scenic integrity objectives. Forest Service administrative and permitted facilities would continue in all alternatives. Development associated with facilities would impact scenic resources. Facilities designed to blend with the surrounding landscape (materials, colors, architectural styles) would have minimal effects to scenery or contribute to the scenic character and cultural landscape.
Effects of the No-Action Alternative
All current management areas and designated areas would continue to exist as they are described in the 1991 plan, as amended, with 20 areas providing distinct management emphasis. The 1991 plan uses visual quality objectives and visual management guideline

GMUG National Forests Land Management Plan Draft Environmental Impact Statement: Volume 1
367
classes to manage scenery. This information is based on visual resource management inventories completed in the 1980s. About 40 percent of the GMUG would be managed for relatively natural-appearing scenic character under preservation, retention, and partial retention visual quality objectives (very high, high, moderate). Preservation is assigned to designated wilderness. Alternative A has the lowest amount of retention (about 6 percent) among all the alternatives. Most of the GMUG (60 percent) is managed for altered or heavily altered scenic character (modification and maximum modification visual quality objectives) where management activities may dominate the landscape. Maximum modification (very low) is assigned to about 4 percent of the GMUG and is no longer used as a desired scenic integrity level (FSM 2310 – USDA Forest Service 2020b). Disruptive activities may occur on lands managed for modification and maximum modification with few considerations for scenery. Structures may not have architectural styles, materials, or colors that blend with the landscape. Vegetative treatments may have noticeable dominant patterns, edges, or shapes. Overall, scenic resources would be maintained at a lower scenic integrity level than for alternatives B, C, or D. Given the importance of viewing scenery in the GMUG, this may diminish visitor satisfaction, lower the quality of visitor experience, or even decrease the sense of attachment and opportunities to connect with nature. Solitude, spirituality, and sense of escape are key ecosystem services provided by the GMUG. All of these services could be impacted by the management of scenic resources. Since the no-action alternative would result in scenic resources being maintained at a lower scenic integrity level than under the action alternatives, this alternative would have the greatest negative impacts on these ecosystem services. Continued use of the visual quality objectives and visual management guideline classes to manage scenery is not likely to meet the current and future demand for natural-appearing scenery. The communities, recreation areas, roads, and waterbodies providing the basis for retention (high) are based on inventories completed in the 1980s. The scenery management system inventory completed in 2017 showed that concern for natural appearing scenery has increased since the 1991 plan was completed. Some high-concern-level travelways currently pass through areas allocated as modified visual quality objective, which provides limited protection of scenic resources in these areas. Demand for high quality scenery has changed due to increased visitation and population growth in the surrounding area. Continuing to manage scenic resources based on the inventories completed almost 40 years ago does not reflect the increased concern for scenery evidenced in the recently completed scenery management system inventory, the importance of scenery to communities and GMUG visitors as summarized in the assessment (USDA Forest Service 2018), population growth, and expectations for scenic variety and natural-appearing scenery throughout the GMUG identified by the public in the forest planning process (See the Distinctive Roles and Contributions section in the draft revised forest plan). The visual resource management information is only partially available on printed maps. This, along with alternative A plan guidance, may make it more difficult for managers to integrate scenery into project planning and work toward an improved scenic resource condition. The visual quality objectives do not reflect changes in visitor use patterns, do not incorporate views from trails, and do not reflect current public opinion, especially concerns about community backdrops and scenery. Additionally, the visual quality objectives do not

USDA Forest Service
368
recognize the cultural importance of activities such as historic sites, well-designed buildings such as visitor centers, and campgrounds. Since these inputs are important to accurately reflect scenery desires and perceptions, 1991 plan direction does not provide adequate guidance to meet anticipated future demand for natural-appearing scenery. The continued use of the visual quality objectives and visual management guideline classes in alternative A is not consistent with current Forest Service policy for scenery management. These types of classes are inconsistent with the current best practices in managing scenic resources and are not used in the scenery management system. The scenery management system incorporates considerations for ecological settings and restoration of ecosystem resiliency better than the visual management system.
Effects Common to Alternatives B, C, and D
During the assessment phase, the GMUG conducted a full scenic resource inventory using the scenery management system. The interdisciplinary team developed proposed scenic integrity objectives using the scenery management system inventories and resource integration. Under all action alternatives, the scenery management system would be fully implemented including desired conditions, objectives, and guidelines to manage scenic resources. The conversion to the scenery management system in the action alternatives aligns with current Forest Service policy. The action alternatives include desired conditions, an objective, and guidelines for scenic resources. In addition to Forestwide plan components, there are unique scenery-related plan components for multiple uses and management areas including those for scenic byways, designated trails, infrastructure, recreation, timber and other forest products, Colorado roadless areas, and recreation management areas. Scenic qualities and characteristics are also managed for in designated wilderness, the Tabeguache and Roubideau areas, recommended wilderness, the Fossil Ridge Special Recreation Area, and eligible wild and scenic rivers. Designated wilderness, the Tabeguache and Roubideau designated areas, and recommended wilderness (when proposed) would be managed for very high scenic integrity objective. High scenic integrity objective is identified for foreground (up to one-half mile) of high concern travel routes (such as scenic byways, designated trails, and other major routes) and other designated areas. Plan direction provides integrated resource management direction and results in sustainability of valued scenic attributes and scenic character resiliency to changing conditions and provides opportunities for visitors to connect with nature. Views from concern level travelways and use areas are emphasized to enhance recreation settings and meet the public expectations for scenic resources in the long term. Desired conditions emphasize natural-appearing scenery and scenic values in viewsheds with high public use as well as a range of scenic quality sustained by a diverse and resilient landscape (FW-DC-SCNY01). Desired conditions for various management areas emphasize high-quality scenery, natural-appearing settings, or natural landscape character, which would sustain scenic character and contribute to visitor’s sense of place (including but not limited to FW-DC-DTRL-01, MA-DC-CRA-01, MA-DC-MTR-02). The action alternatives have an objective to help move toward desired conditions and improve scenic integrity in areas that do not meet established scenic integrity objectives (FW-OBJ-SCNY-02). Priority for immediate foreground of scenic byways would improve

GMUG National Forests Land Management Plan Draft Environmental Impact Statement: Volume 1
369
scenery along these high concern routes and maintain or enhance the intrinsic scenic quality for which scenic byways were designated. A guideline under scenic resources directs that all national forest management activities should be consistent with or move the area toward achieving the desired scenic integrity objectives to maintain or improve scenic character over the long term and perpetuate high-quality scenic values consistent with the GMUG’s distinctive roles and contributions (FW-GDL-SCNY-03). Using scenic integrity objectives developed through the interdisciplinary planning process would maintain and improve scenic quality across the GMUG more than in alternative A. Alternatives B, C, and D all have smaller proportions of the GMUG managed for low scenic integrity and no lands managed for very low. Therefore, effects related with low and very low scenic integrity objectives are less than in alternative A. Alternatives B, C, and D manage most of the GMUG for moderate, high, and very high scenic integrity objectives (table 154). This distribution of scenic integrity objectives would result in more of the GMUG managed for more natural-appearing scenic character than alternative A. This would maintain or improve visitor satisfaction and contribute to a higher quality visitor experience than alternative A for those visitors expecting to recreate in areas with natural-appearing scenic character. The conversion to the scenery management system is consistent with a shift to ecosystem management benefits and principles and ecological restoration. Activities such as prescribed fire and large-scale vegetation management activities to restore ecosystem functions are examples of management activities that illustrate the benefits of a longer-term scenery management philosophy. In the action alternatives, timber suitability includes higher slopes with the increase in slope up to 60 percent slopes based on the anticipation of newer harvesting technology. Vegetation management on higher slopes may affect sensitive middleground viewsheds (0.5 to 4 miles from the viewer), depending on the intensity of treatment and duration of the view. Landscapes viewed at middleground distances are generally viewed more coherently and in better context with their surroundings than foreground landscapes (less than one-half mile). If middleground national forest landscapes are evenly textured before treatment, management activities that dominate natural form, line, or texture may introduce noticeable contrast. The effects of vegetation management activities are described in previous sections (see Consequences of Multiple Use Management Activities on Scenic Resources – Vegetation Management section). Under the action alternatives, the mapped scenic integrity objectives assigned to timber suitability areas would influence whether the activities in the long-term appear unaltered, slightly altered, or altered. Alternatives B and D have more emphasis on high and moderate scenic integrity (appear unaltered or slightly altered). Alternative C would have emphasis on moderate scenic integrity and more low scenic integrity than other action alternatives (appear slightly altered or appear altered). Regardless of the scenic integrity objective, even-aged regeneration cuts should be shaped and blended with natural terrain per scenery guideline FW-GDL-SCNY-03. To maintain scenic character for scenic byways, travel corridors, trails, and streams that are concern level 1 (highest concern for natural-appearing scenery), vegetation should be managed to retain or enhance scenic quality of the immediate foreground (300 feet) (FW-GDL-SCNY-05). Other scenery guidelines (FW-GDL-SCNY-04 and FW-GDL-SCNY-06) address new or reconstructed features and facilities and development of large facilities with guidance on

USDA Forest Service
370
how to maintain scenic character and meet scenic integrity objectives. The effects of activities with facilities and infrastructure are described in previous sections (see Consequences of Multiple Use Management Activities on Scenic Resources section).
Effects of Alternative B
Effects of Scenery Program Direction on Scenery Program
Alternative B would manage scenic resources under a mix of proposed scenic integrity objectives, with emphasis on high (37 percent) to moderate (27 percent) scenic integrity with some very high (21 percent) and some low (14 percent) scenic integrity (table 155). Alternative B proposes more very high, high, and moderate scenic integrity objective than alternative A. The GMUG would be managed for natural-appearing, intact scenic character across most of its landscapes.
Table 155. Effects for scenic resources, by alternative
Indicator No-Action Alternative Alternative B Alternative C Alternative D
Percent of visual quality objective or proposed scenic integrity objective allocations of each alternative
Preservation (15%)
Retention (6%)
Partial Retention
(19%) Modification
(56%) Maximum
Modification (4%)
Very High (21%) High
(37%) Moderate
(27%) Low
(14%) Very Low
(0%)
Very High (20%) High
(11%) Moderate
(51%) Low
(18%) Very Low
(0%)
Very High (29%) High
(41%) Moderate
(24%) Low (6%)
Very Low (0%)
Percentage of high scenic integrity objective assigned to lands suitable for timber production with slope over 40 percent
Not applicable 15% 15% 0%
Consistent with current Forest Service policy for scenery management (scenery management system)
No Yes Yes Yes
This distribution of scenic integrity objectives would result in more of the GMUG managed for natural and natural-appearing scenic character than alternative A, thereby providing an intact and attractive scenic setting for GMUG visitors and residents. This would maintain or improve visitor satisfaction and contribute to a higher quality visitor experience than alternative A for those visitors expecting to recreate in natural and natural-appearing scenic character. Solitude, spirituality, and sense of escape are key ecosystem services provided by the GMUG. All of these services could be impacted by the management of scenic resources.
GMUG National Forests Land Management Plan Draft Environmental Impact Statement: Volume 1
371
Since alternative B would result in more very high, high, and moderate scenic integrity objectives than alternative A, this alternative would have a positive impact on these ecosystem services. To provide for sustainable recreation, scenic integrity objectives were integrated with desired recreation opportunity spectrum classes to reduce but not fully eliminate inconsistencies between the two systems. Inconsistencies that exist are semi-primitive non-motorized may include moderate scenic integrity objective, and semi-primitive motorized may include low scenic integrity objective. High scenic integrity objective is identified for Colorado roadless areas in alternative B. Overall more lands are proposed to manage for high (37 percent) and very high (21 percent) scenic integrity objective as compared to alternative A. Alternative B proposes moderate scenic integrity objective in multiple locations across the GMUG, including utility corridor overlap with the Continental Divide National Scenic Trail, San Juan Skyway, and Grand Mesa Scenic Byway corridors. Moderate scenic integrity objective would provide for a slightly altered character with some scenery design considerations applied in these overlapping multiple use areas. See also Effects Common to All Alternatives – Scenic Integrity Objective Allocations section and Effects Common to Alternatives B, C, and D section.
Effects of Other Program Direction on Scenery Program
Potential exists for program direction for various management activities to impact the existing landscape, scenic character, and scenic integrity under alternative B. Alternative B proposes more lands as suitable for timber production than alternative A. Most of the lands suitable for timber production have moderate and low scenic integrity objective (about 581,600 acres in moderate and about 258,400 acres in low). High scenic integrity objective is assigned to about 109,800 acres of lands as suitable for timber production with about 15 percent in high scenic integrity objective occurring on slopes greater than 40 percent. When consistent with other plan components, harvest for purposes other than timber production could occur on other lands not suitable for production. Potential consequences of these types of management activities are in the previous Consequences of Multiple Use Management Activities on Scenic Resources section. All national forest management activities would be designed to be consistent with the allocated distribution of desired scenic integrity objectives per the Forestwide scenic resources guideline (FW-GDL-SCNY-03). See also Effects Common to Alternatives B, C, and D section for more information.
Effects of Alternative C
Effects of Scenery Program Direction on Scenery Program
Alternative C would manage scenic resources under a mix of proposed scenic integrity objectives with most emphasis on moderate (51 percent), followed by almost equal emphasis on very high (20 percent) and low (18 percent), and less emphasis on high (11 percent) scenic integrity (table 154). Alternative C provides the most moderate scenic integrity objective (51 percent) across all the alternatives. A moderate scenic integrity objective still

USDA Forest Service
372
provides for relatively natural-appearing scenery, although at a level lower than high scenic integrity objective. The GMUG would be managed for relatively natural-appearing scenic character across most of its landscapes. This distribution of scenic integrity objectives would result in more of the GMUG managed for natural and relatively natural-appearing scenic character than alternative A, providing a mostly intact and attractive scenic setting for GMUG visitors and residents. Solitude, spirituality, and sense of escape are key ecosystem services provided by the GMUG. All these services could be impacted by the management of scenic resources. Since alternative C emphasizes moderate scenic integrity objectives and results in more of the GMUG managed for natural scenic character than under alternative A, alternative C would have a positive impact on these ecosystem services as compared to alternative A. To provide for sustainable recreation, scenic integrity objectives were integrated with desired recreation opportunity spectrum classes. However, alternative C makes the least adjustments to reduce inconsistencies between the two systems. Inconsistencies that exist are semi-primitive non-motorized that may include moderate and low scenic integrity objective, and semi-primitive motorized that may include low scenic integrity objective. Some designated areas, such as Colorado roadless areas, would be managed for a range of scenic integrity objectives (high, moderate, or low). This alternative also proposes the most General Forest Management Area, which also has a range of scenic integrity objectives. Overall, this alternative proposes the most low (18 percent) scenic integrity objective among action alternatives. However, this alternative also has more lands proposed for high (11 percent) and very high (20 percent) scenic integrity objective as compared to alternative A. Alternative C proposes low scenic integrity objective in multiple locations across the GMUG, including where utility corridors overlap with the Continental Divide National Scenic Trail, San Juan Skyway, and Grand Mesa Scenic Byway corridors. Low scenic integrity objective would provide for scenic character that appears altered with few scenery design considerations applied in these overlapping multiple use areas. Alternative C provides the most low (18 percent) scenic integrity of the action alternatives. However, this amount of low is substantially less than the amount of low provided in alternative A (table 154). See also Effects Common to All Alternatives – Scenic Integrity Objective Allocations section and Effects Common to Alternatives B, C, and D section.
Effects of Other Program Direction on Scenery Program
The effect of other program direction on the scenery program is the same as alternative B except for the following: This alternative proposes the largest amount of lands as suitable for timber production and the most effects from vegetation management activities associated with higher timber production. Most of the lands suitable for timber production have moderate and low scenic integrity objective (about 508,100 acres in moderate and about 347,700 acres in low). High scenic integrity objective is assigned to about 120,800 acres of lands as suitable for timber production with about 15 percent in high scenic integrity objective occurring on slopes greater than 40 percent.

GMUG National Forests Land Management Plan Draft Environmental Impact Statement: Volume 1
373
See also Consequences of Multiple Use Management Activities on Scenic Resources section and Effects Common to Alternatives B, C, and D section.
Effects of Alternative D
Alternative D includes the same integrated plan components with similar effects as alternative B.
Effects of Scenery Program Direction on Scenery Program
Alternative D would manage scenic resources under a mix of proposed scenic integrity objectives and would have emphasis on high (41 percent) scenic integrity, followed by very high (29 percent) and moderate (24 percent) scenic integrity. This alternative proposes the least amount of low (6 percent) scenic integrity among all alternatives. The GMUG would be managed for natural-appearing, intact scenic character across most of its landscapes. This distribution of scenic integrity objectives would result in more of the GMUG being managed for intact, naturally evolving scenic character than other alternatives. Solitude, spirituality, and sense of escape are key ecosystem services provided by the GMUG. All these services could be impacted by the management of scenic resources. Since alternative D emphasizes high scenic integrity objectives and results in more of the GMUG managed for natural scenic character than alternative A, alternative D would have the greatest positive impact on these ecosystem services as compared to all of the other alternatives. To provide for sustainable recreation, scenic integrity objectives were integrated with desired recreation opportunity spectrum classes to reduce and eliminate inconsistencies between the two systems. Inconsistencies where utility corridors overlap with semi-primitive non-motorized or semi-primitive motorized are assigned a low scenic integrity objective. Alternative D emphasizes special areas. Alternative D has the greatest amount of lands proposed to manage for very high (29 percent) scenic integrity objective when compared to the other alternatives, corresponding to designated wilderness, the Tabeguache and Roubideau areas, and recommended wilderness areas in this alternative. Fewer changes from natural character would occur in alternative D, resulting in more undisturbed scenic vistas than other alternatives. High scenic integrity objective is identified for the foreground (up to 0.5 mile) of high concern travel routes (such as scenic byways, designated trails, and other major routes), Colorado roadless areas, other designated areas, and semi-primitive non-motorized desired recreation opportunity spectrum. Overall, more lands are proposed to be managed for high (41 percent), very high (21 percent), and moderate (24 percent) scenic integrity objective as compared to alternative A. Alternative D proposes high a scenic integrity objective where utility corridors overlap with the Continental Divide National Scenic Trail, San Juan Skyway, and Grand Mesa Scenic Byway corridors. A high scenic integrity objective would provide for a natural-appearing character with the most scenery design considerations applied in these overlapping multiple use areas.

USDA Forest Service
374
See also the Effects Common to All Alternatives – Scenic Integrity Objective Allocations section and the Effects Common to Alternatives B, C, and D section.
Effects of Other Program Direction on Scenery Program
The effect of other program direction on the scenery program is the same as the effect of alternative B except for the following. This alternative proposes the least amount of lands as suitable for timber production, as it excludes scenic byways, designated trails, all special management areas, all eligible wild and scenic river segments, and areas with a slope greater than 40 percent. Most of the lands suitable for timber production have moderate and low scenic integrity objective (about 422,300 acres in moderate and about 104,600 acres in low). High scenic integrity objective is assigned to about 230,700 acres of lands as suitable for timber production, none of which occurs on slopes greater than 40 percent. Furthermore, salvage harvest would not be conducted. Alternative D has less effects from vegetation management activities associated with timber production, with the highest amount of high scenic integrity objective assigned to lands suitable for timber production. See also Consequences of Multiple Use Management Activities on Scenic Resources section and Effects Common to Alternatives B, C, and D section.
Comparison of Effects of the Alternatives
Plan direction for scenic resources is included to varying degrees in all alternatives and would complement multiple use activities and maintain or improve scenic quality and scenic character resilience and provide opportunities for the public to connect with nature. The main difference between alternatives is the management system used (visual management system vs. scenery management system) and whether that system is consistent with current Forest Service policy for scenery management. Alternative A manages scenic resources using the visual management system visual quality objectives and visual management guideline classes. Alternatives B, C, and D use the scenery management system scenic integrity objectives and integrated plan components to manage scenic resources. Alternative A manages scenery for a more altered condition (levels equivalent to low), while alternatives B, C, and D would manage for more natural-appearing scenery (high and very high) than alternative A. Alternative D provides the most high scenic integrity objective (41 percent) and the most very high scenic integrity objective (29 percent) across all alternatives. Alternative C provides the most moderate scenic integrity objective (51 percent) across all the alternatives. Moderate scenic integrity objective still provides for relatively natural-appearing scenery, although at a level lower than high scenic integrity objective. In alternatives B and C, timber suitability includes higher slopes with the increase in slope up to 60 percent slopes based on the anticipation of newer harvesting technology. In alternatives B and C, about 15 percent of the lands suitable for timber production and assigned high scenic integrity objective occur on slopes greater than 40 percent. Alternative D has the least amount lands suitable for timber production in the action alternatives, but the greatest amount of high scenic integrity objective assigned to lands suitable for timber

GMUG National Forests Land Management Plan Draft Environmental Impact Statement: Volume 1
375
production. In alternative D, there are no lands suitable for timber production on slopes greater than 40 percent. The proposed scenic integrity objectives focus on movement toward the desired scenic character and provide more emphasis on providing for natural-appearing scenery than the visual quality objectives established in the 1991 plan. Visual quality objectives and scenic integrity objectives across alternatives are provided in table 154.
Cumulative Effects
The cumulative effects analysis timeframe for scenic resources is the next 10 to 15 years, and the analysis area is the GMUG and lands adjacent to and lands within the GMUG under other ownership. The GMUG shares borders with other National Forest System, National Park Service, Bureau of Land Management, State of Colorado, and Tribal lands; other municipalities; and private land. Any guiding documents or plans for lands in and around the GMUG were reviewed to determine if they would contribute to cumulative effects. If lands have some management direction (goals, objectives, guiding principles, etc.) for scenic resources, natural character, or open space, it is assumed that scenic resources would be considered in any future project planning. Any planning direction for other ownerships that considers scenic or visual resources or related resources (such as open space or aesthetics) during management complements scenery management on National Forest System lands by providing a similar level of scenic resource consideration across ownership boundaries. The San Juan National Forest, Rio Grande National Forest, and White River National Forest have implemented the scenery management system. The Pike-San Isabel National Forest 1984 plan uses the visual management system. Consistent management of scenic resources with the scenery management system across national forest boundaries would be beneficial to scenery in the long term. Black Canyon of the Gunnison National Park and Curecanti National Recreation Area (both administered by the National Park Service) include outstanding scenic resources adjacent to the GMUG. The management plan includes purposes to preserve and protect spectacular gorges and scenic values of Black Canyon of the Gunnison National Park and conserve the scenery, natural, historic, and archeological resources, and wildlife of Curecanti National Recreation Area. With the emphasis in the plan on preserving, protecting, and maintaining natural resources, including scenic pursuits, it is anticipated that any cumulative consequences would promote natural or natural-appearing scenery. Management on some adjacent lands complements the scenery management of the GMUG including lands managed by Bureau of Land Management, which uses a visual resource management system and recently revised resource management plans (2015–2020). Counties with open space or scenery-related language in guiding documents or plans also complement scenery management of the GMUG across ownership boundaries. Agencies or municipalities that do not manage for scenery may have noticeable differences in levels of development across boundaries that could impact the scenic quality in areas such as scenic byways and nationally designated trails.

USDA Forest Service
376
The State of Colorado issues several plans—such as comprehensive outdoor recreation plans, trail strategic plans, and forest action plans—which have connection to scenic resources. While these lands permit public access, they are not managed like other public lands such as national forests or national parks. As these lands are managed, scenic resources may or may not be considered in that action. If scenic resources are not considered, effects would be similar to those described below. Because most private lands and lands of other ownership do not have regulations for scenic resource management, the effects of ongoing developments next to National Forest System lands can sometimes have negative effects on scenic resources when viewing the continuous landscape. Forest visitors typically view scenery as a continuous landscape with little discernment regarding the land ownership being viewed. Sometimes management activities occurring on ownership boundaries can be noticeable if the change in form, line, color, or texture of the activity follows ownership boundaries rather than a natural landscape feature. If activities on private lands are designed to lessen impacts to scenic resources, the difference between private lands and National Forest System lands are less apparent. Inclusion of scenic or aesthetic resources or open space character in regional, county, and community plans helps promote the management and value of scenic resources across ownership boundaries in the cumulative consequences analysis area.
Conclusion Plan direction for scenic resources is included to varying degrees in all alternatives and would complement multiple use activities, maintain or improve scenic quality and scenic character resilience, and provide opportunities for the public to connect with nature. Alternative A manages scenery for a more altered condition, while alternatives B, C, and D would manage for more natural-appearing scenic character. Alternative B would manage scenic resources under a mix of proposed scenic integrity objectives with emphasis on high to moderate scenic integrity with some very high scenic integrity. Alternative D provides the greatest number of high and very high scenic integrity objectives across all alternatives. Alternative C provides the most moderate scenic integrity objective across all the alternatives. Management activities, although they may have some short-term impacts on scenery, also may begin to move the landscape toward the desired scenic character. Effects that move the landscape toward the desired scenic character are often realized over a long period or cumulatively and lead to the lasting sustainability and resilience of valued scenic character attributes. Project design or mitigation would consider scenic resources under any alternative to meet the visual quality objectives or proposed scenic integrity objectives. It is assumed that, through site-specific project design or mitigation, the landscape would move toward scenery desired conditions under all alternatives. The continued use of the visual quality objectives and visual management guideline classes in alternative A is not consistent with current Forest Service policy for scenery management. The combined effect of the draft revised forest plan direction upon scenery resources, common to all action alternatives, will be consistent with (36 CFR 219.10(a)). The effects of plan direction would be to provide ecosystem services and multiple uses through integrated resource management, as the interdisciplinary team developed proposed scenic integrity

GMUG National Forests Land Management Plan Draft Environmental Impact Statement: Volume 1
377
objectives using the scenery management system inventories and resource integration. Under all action alternatives, the scenery management system would be fully implemented and would include integrated plan components (desired conditions, objectives, and guidelines) to manage scenic resources as well as scenery integrated into other resource and management area plan components. The conversion to the scenery management system in the action alternatives aligns with current Forest Service policy.
Surface-Disturbing and Other Activities A variety of plan components in the draft revised forest plan would have the effect of restricting or limiting surface disturbance or placing restrictions on the timing of activities. These components would generally affect most surface-disturbing activities, including but not limited to timber harvest, the construction of utilities and other infrastructure, and energy and mineral development subject to existing rights. Timing restrictions could apply to a wide variety of activities, including but not limited to recreational use and events and timber hauling on roads. The effect of these plan components would potentially be an increased cost of operations, narrower time windows or a delay in operations, and the avoidance of small areas, such as the requirement for a 600-foot buffer around at-risk plant species. These plan components include FW-GDL-SOIL-05, FW-GDL-SPEC-22, FW-STND-SPEC-24, FW-GDL-SPEC-31, FW-GDL-SPEC-43, FW-GDL-SPEC-44, MA-GDL-SIA-04, FW-STND-DTRL-05, FW-GDL-DTRL-13, FW-GDL-SOIL-07, FW-STND-SPEC-42, FW-GDL-SPEC-57, FW-GDL-SCNY-06, FW-GDL-SPEC-07, FW-GDL-SPEC-15, FW-GDL-SPEC-20, FW-GDL-SPEC-21, FW-GDL-SPEC-25, FW-GDL-SPEC-48, FW-GDL-SPEC-49, FW-GDL-SPEC-50, FW-GDL-SPEC-51, FW-GDL-SPEC-52, and FW-GDL-SPEC-55.
Timber Resources
Affected Environment A detailed description of the affected environment for timber resources is included in the assessment (USDA Forest Service 2018, timber and vegetation management) and is hereby incorporated by reference. This information is summarized below for the purposes of the environmental analysis. Approximately 2,076,700 acres (70 percent) of the GMUG National Forests are categorized as forestlands and woodlands. Per the current forest plan, approximately 558,400 acres (27 percent) of forestlands comprise the areas suitable for timber production where primary timber production and management takes place. Factoring in wilderness, roadless area, and other designations that occurred subsequent to the 1991 GMUG forest plan amendment, 468,400 acres are currently suitable for timber production.
Forest Conditions and Trends
At the plan scale, current forest conditions are rapidly changing due to insects and disease. Recent notable outbreaks affecting merchantable tree species across the GMUG include Engelmann spruce bark beetle (also affecting lodgepole pine), round-headed pine beetle, Douglas-fir beetle, fir engraver, western spruce budworm, and a host of aspen diseases related to sudden aspen decline. Of these, Engelmann spruce bark beetle is having the most

USDA Forest Service
378
widespread impact in the plan area. As determined from aerial survey data (1996–2018), approximately 343,000 acres in the GMUG have been impacted by spruce beetle. The Terrestrial Ecosystems section provides more information regarding the current state of insects and disease, as well as vegetation characteristics and integrity across the GMUG.
Past and Current Harvest
Even-aged, uneven-aged, and intermediate treatment acreage is shown by decade in table 156.
Table 156. Harvest acres, by decade and treatment type
Decade Even-aged Treatment
(acres) Uneven-aged Treatment
(acres) Intermediate Treatment
(acres) Total
(acres) 11880–1899 1,366 7,171 1,394 9,931 1900–1909 2,436 16,159 1,331 19,926 1910–1919 1,729 10,868 913 13,510 1920–1929 1,809 11,108 1,190 14,107 1930–1939 740 6,517 2,909 10,166 1940–1949 3,527 7,490 14,045 25,062 1950–1959 7,416 11,355 11,688 30,459 1960–1969 16,111 7,408 3,462 26,981 1970–1979 17,466 1,758 6,839 26,063 1980–1989 42,086 659 14,181 56,926 1990–1999 28,561 7,650 17,921 54,132 2000–2009 6,406 3,129 12,472 22,007 2010–2020 8,299 28,261 4,326 40,886
Total 137,952 119,533 92,671 350,156 1 Table only includes harvests that were managed by the Forest Service after national forest designation. The GMUG
National Forests were not designated until 1892 (originally called the Battlements Forest Reserve, which is now the Grand Valley Ranger District). The Gunnison and Uncompahgre were also separate national forests. Further, records prior to 1950 are less consistent and reliable than records after that time. Photos and historical information indicate that forested lands close to mining districts were heavily harvested to support the mines and their communities.
Timber harvest and volume trends are influenced, in part, by insect outbreaks. The largest combined volumes sold in the GMUG National Forests occurred in 1960 at more than 228,000 CCF in response to a spruce bark beetle outbreak in the 1950s. Harvest increases in the late 1980s and early 1990s were in response to a mountain pine beetle outbreak. Classification of aspen as a commercial species and a local panel plant led to an increase in aspen management at that time, as well. Beginning in the early 1990s, combined volume sold began a general downward trend. Around 2010, the volume offered began to steadily increase again with the effects of widespread spruce beetle epidemic and increased mortality of trees. Salvage sales first started on the Grand Mesa, and as the epidemic began severely affecting the southern portions of the Gunnison Ranger District, salvage has continued there as well as on the Ouray, Norwood, and Paonia Districts. The forest sold 93,000-95,000 CCF during 2018-2019. In 2020, the forest sold approximately 76,000 CCF. It is expected that the GMUG will offer approximately 65,000

GMUG National Forests Land Management Plan Draft Environmental Impact Statement: Volume 1
379
CCF in 2021, and this will decrease in the short-term to approximately 55,000 CCF. This forecasted rate of production is based on shifting from the salvage harvests noted above to more management in stands with more complex prescriptions and less volume per acre (such as in ponderosa pine and mixed conifer) as well as more aspen regeneration harvests. The current volume offered from the GMUG is 10 to 20 percent salvage treatments, 30 to 40 percent restoration treatments, and 30 to 40 percent resiliency treatments. Historic timber volume sold on the GMUG has varied widely over the past three decades, with values as low as 9,000 CCF and as high as 95,000 CCF. Average timber volume sold from 1995 to 2011 was about 21,000 CCF. The timber program started increasing around 2012 due to the spruce beetle epidemic on the forest, in an effort to capture the value of the dead trees while still merchantable. Accordingly, the average timber volume sold from 2012 to 2020 was about 70,000 CCF. While there has been high timber volume output recently, and especially the last few years, this is not indicative of the long-term timber sale program under the current plan. The reduction of standing timber volume due to spruce beetle mortality would result in lower timber output, more similar to the early 2000s, before the spruce beetle epidemic and the associated increase in the timber program. Accordingly, alternative A assumed a total timber program of about 36,000 CCF for the first five years, followed by a slightly lower long-term program of about 32,000 CCF. This is a reasonable program given the reduction of standing timber volume as well as the suitable timber acreage, which is quite a bit lower under this alternative, relative to the action alternatives. In contrast, alternatives B and C, given the higher suitable timber acreage, are anticipated to be able to sustain a long-term timber program of 55,000 CCF.
GMUG Timber-Processing Area and Capacity
The GMUG timber processing area includes nine counties: Delta, Fremont, Garfield, Gunnison, Mesa, Montrose, Ouray, Saguache, and San Miguel Counties in Colorado. In 2016, a total of 15 timber processing facilities were operating in the timber processing area, including nine sawmills, one post and small pole facility, and five log home manufacturers; in addition, one sawmill and one co-located sawmill and post and pole plant were idle at that time. Due to changing forest conditions and the need to accommodate small-diameter and salvaged material, understanding processing capacity by size class provides meaningful insights regarding the area’s industry sustainability. Due to mill closures since 2003, capacity to process timber in the timber processing area has decreased from 77.5 to 55.1 million board feet, despite technological upgrades at existing mills that expanded capacity and increased efficiency. Mills used approximately 55 percent of capacity in 2016, and utilized approximately 74 percent of capacity to process smaller-diameter trees (McIver et al. 2017). Subsequent to the GMUG timber use and capacity study (McIver et al. 2017), at least two new mills have opened, increasing capacity, including an aspen mill in Hotchkiss and the Ironwood mill in Dolores, a sawmill that produces plywood veneers and posts. In addition, the Montrose mill was re-fitted for ponderosa pine.

USDA Forest Service
380
Sustainability of Timber Resources and Uses
Timber and biomass are key ecosystem services provided by the GMUG National Forests. Timber harvests, including salvage and restoration activities such as thinning, provide forest products and contribute to the local economy, including production of a range of forest products available to various markets and processing facilities. Timber harvest directly supports employment and income in logging and wood manufacturing firms, and indirectly contributes to a number of other industries, from transportation and local government to other support sectors in the local economy. Based on cut volumes in 2014, commercial timber harvests in the GMUG support a total of 630 full- and part-time jobs, and approximately $24 million in labor income on an annual average basis. Several factors drive the supply and demand for timber in the local area. First, supply is based on the areas in the GMUG that are available and feasible for harvesting, given forest plan direction, the type and density of vegetation present, and other factors. Second, trends in the housing market can have an impact on the demand for wood products. Third, Federal funding allocations and grants and agreements available to the GMUG influence the timber program’s treatment and production capacity. Industry is a key component to a sustainable outlet for wood products that are harvested off of National Forest System lands. Currently, the largest sawmill in the state and purchaser of the majority of the GMUG’s large timber sales is based in Montrose, Colorado. Smaller, individually owned, local mills in the plan area purchase and process lesser amounts of wood. In addition, many other operators across the region are an integral part to successful vegetation management, fuels reduction, and forest product removal. Timber harvest and production play an important role in attaining desired conditions for ecological sustainability and contribute to social and economic sustainability in the region. Timber harvest can be a useful tool for managers to achieve desired vegetative conditions at varying scales across the GMUG (see the Terrestrial Ecosystems section for key ecosystem characteristics and desired conditions). Integrated timber management projects can provide multiple outcomes such as reducing fuels near infrastructure, improving wildlife habitat, creating resilient timber stands, and removing hazardous trees near recreation sites and trails.
Environmental Consequences
Analysis Framework
Issues Analyzed
• The level of active vegetation management • Salvage wood, whether it’s offered or not and in what capacity • The effect of non-timber plan direction, particularly plan direction related to Canada
lynx and the Veg S7 standard
Key Indicators and Measures
• Qualitative

GMUG National Forests Land Management Plan Draft Environmental Impact Statement: Volume 1
381
Plan direction that affects the timber program • Quantitative Projected timber sale and wood sale quantities (CCF per year) Projected salvage quantity (CCF per year) Area harvested (acres per year) Lands suitable for timber production (acres)
Management Direction
Management Direction under the Current Plan/Alternative A
The current forest plan provides extensive direction on timber management. Plan direction ensures that timber harvest is conducted within law and policy and is sustainable over time. Plan direction includes limitations on timber harvest required by law, primarily the National Forest Management Act, such as assurance of restocking. Current Forestwide forest plan goals for timber management are to manage vegetation in a manner to provide and maintain a healthy and vigorous ecosystem resistant to insects, diseases, and other natural and human causes, to provide commercial forest products to local dependent industries at a level commensurate with adhering to the forest and management area direction and in harmony with the other plan goals, to utilize the commercial timber sales program to help decrease the risk of insect and disease infestations both now and in the future, and to provide the opportunity to supply the local residents with fuelwood and meet the demand for personal-use fuelwood. Management area-specific goals include an emphasis on aspen management and providing for even-aged sawtimber production on slopes less than 40 percent. Current forest plan objectives for timber management include projected timber outputs and management-area-specific emphases on maintaining and improving aspen and on wood-fiber production (particularly sawtimber), while also maintaining visual quality. Forest plan desired conditions are focused on maintaining structural diversity of vegetation, retaining existing medium or high contrast edges, retaining snags, managing aspen for retention, utilizing Christmas tree sales for stocking controls, and protection of riparian ecosystems. Special forest product offered under the current GMUG plan include such products as floral greenery, Christmas trees and boughs, mushrooms, transplants (trees, shrubs, or herbaceous plants), cones, medicinal plants, cuttings, herbs, nuts, berries, decorative wood, and pitch. Fuelwood is supplied (both for charge and occasionally free-use) both on lands suited and not suited for timber production. Associated rules and regulations for protection of national forest lands are specified on the tickets issued for fuelwood collection. In general, the current plan is prescriptive about the types of management activities and cutting methods and their use in different cover types.

USDA Forest Service
382
Management Direction under the Revised Plan/Action Alternatives
Like the current plan, the revised plan and action alternatives provide extensive direction to ensure that timber management complies with law and policy and is sustainable over time. All revised plan alternatives contain the same plan components for timber and other forest products. Plan components in all action alternatives are consistent with the 2012 Planning Rule and the National Forest Management Act. All action alternatives include plan components that:
• Limit clearcutting and other types of even-aged harvest, including the maximum opening size (FW-STND-TMBR-01, FW-STND-TMBR-07)
• Assure adequate restocking and define minimum restocking levels for suitable timber lands (FW-STND-TMBR-02)
• Limit timber harvested for the purpose of timber production to lands suited for timber production and allow for timber harvest on lands not suited for timber production for other purposes (FW-STND-TMBR-03)
• Prohibit timber harvest on lands where soil, slope, or other watershed conditions may be irreversibly damaged (FW-STND-TMBR-04)
• Limit the quantity of timber that may be sold per decade to the sustained yield limit, thereby ensuring that the timber harvest program is sustainable (FW-STND-TMBR-06)
• Constrain salvage harvest post-fire (FW-GDL-TMBR-08 and 09) • Include other plan direction included to ensure compliance with the National Forest
Management Act (FW-STND-TMBR-05, FW-GDL-TMBR-10) Ecosystem desired conditions provide a framework to guide harvest activities and are focused on having resilient ecosystems with a mosaic of vegetation conditions, densities, and structures. As described below, plan components in other resource areas, such as recreation, wildlife, or scenery, will affect the timber program and the design of harvest activities. While the revised plan direction (plan components) is almost all the same across all action alternatives, what does vary across the action alternatives is the 1) projected timber and wood sale quantities and 2) the acres of land suitable for timber production, as described in more detail below. Special forest products will be offered under the draft revised forest plan at the same nominal level as under the current plan. Fuelwood will be managed similar to how it is managed under the current plan and with an estimated amount of 5,000 CCF per year. While some species-related direction in the revised plan is not included in the current plan, some of this direction already is typically followed at the project level and/or is often included in timber sale contracts.

GMUG National Forests Land Management Plan Draft Environmental Impact Statement: Volume 1
383
Effects Common to All Alternatives and Alternatives Comparison
• All alternatives are designed to meet law and policy, including the National Forest Management Act.
• All alternatives provide sustainable levels of timber and other forest products. • All alternatives have plan direction that guides vegetation management activities,
ensuring protection of soil, watershed, fish, wildlife, recreation, and visual resources. • All alternatives contribute to social and economic sustainability because in all cases,
plan direction provides for timber production, one of the multiple uses that contributes to the local economy. Active vegetation management can contribute to resilient forests and ecosystems while providing social and economic benefits and contributing to a sustainable production of timber.
• All alternatives provide ecosystem services and multiple uses because the benefits to people (the good and services provided) include providing a supply of forest products, including wood products and other non-timber forest products. Plan direction is designed to manage for resilient forest conditions so that forests can adapt to whatever pressures and uncertainties the future may hold, which also provides important social and economic benefits.
Timber Suitability
Lands suitable for timber production were determined following the 2012 Planning Rule. The draft revised forest plan (appendix 8) describes this process and results from the suitability analysis in more detail. Lands that may be suitable for timber production are the same for all alternatives and total 986,500 acres (table 157). These lands are physically and biologically capable of timber production and have not been administratively withdrawn. Based on management guidance and desired conditions, the lands suitable for timber production vary by alternative, as shown in table 157. Timber suitability for the current plan (alternative A) is based on the GMUG plan as amended in 1991, but includes the removal of additional areas that were designated after that point and in which timber production is prohibited or the lands are withdrawn from timber production, such as designated wilderness and Colorado roadless areas. The total land area considered suitable for timber management under the current plan is about 16 percent of the GMUG. For alternatives B through D, a new GIS analysis was done, which resulted in higher amounts of land suitable for timber production, ranging from approximately 26 to 33 percent of national forest lands. The primary reason for the difference in suitable timber acreage between the current plan (alternative A) and the revised plan alternatives is that this new process was more inclusive and did not include removal of areas that may not be economically viable. The primary reason for the difference in suitable timber acreage between the action alternatives (B, C, and D) is the management area allocation. For instance, alternative D has a higher amount of area to be analyzed as wilderness (MA 1.2) and special management areas (MA 3.3), and these areas were removed from suitability because timber production is not compatible with their associated desired conditions and objectives. In addition, while slopes greater than 40 percent were assumed suitable for

USDA Forest Service
384
timber production under alternatives B and C, they were not considered suitable under alternative D. (Draft revised forest plan appendix 8 describes the process and logic used to determine the area suitable for timber production for each alternative in more detail.)
Table 157. Lands suitable and not suitable for timber production by alternative
Alternative A
(acres)
Alternative B
(acres)
Alternative C
(acres)
Alternative D
(acres) Total National Forest System lands in the plan area 2,967,000 2,967,000 2,967,000 2,967,000
Lands not suited for timber production due to legal or technical reasons 1,980,500 1,980,500 1,980,500
Lands that may be suited for timber production 986,500 986,500 986,500 Total lands suitable for timber production (timber production is compatible with the desired conditions and objectives established by the plan)
468,400 948,200 974,900 757,800
Lands not suited for timber production because timber production is not compatible with the desired condition and objectives established by the plan
38,300 11,600 228,700
Total lands not suited for timber production 2,498,600 2,018,800 1,992,100 2,209,200
Timber Supply
The intended timber program is identified in the plan through the projected wood sale quantity and projected timber sale quantity. The projected wood sale quantity is the estimated output of timber and all other wood products (such as fuelwood, firewood, or biomass) expected to be sold during the planning period for any purpose on all lands in the GMUG. The projected timber sale quantity is the portion of the projected wood sale quantity that meets applicable utilization standards. In this case, the projected timber sale quantity includes sawtimber volume as well as volume from aspen sales. The projected wood sale quantity includes those as well as fuelwood. The projected wood sale quantity and projected timber sale quantity (table 158) do not include volume from salvage harvests. Because salvage is likely to be a continued part of the GMUG timber sale program, the total timber program, including salvage, is also listed as a row in table 158. Key assumptions are as follows:
• The total program for alternative A is 32,100 to 35,900 CCF, and this varies by year. The program under alternative A is lower relative to the action alternatives in proportion to the lower amount of suitable timber acres.
• The total program for alternatives B and C is 55,000 CCF. Under alternatives B and C, the projected total timber sale program of 55,000 CCF per year is smaller than the recent, salvage-focused timber program, but larger than the previous pre-spruce beetle timber program (mid 1990s through 2011). Given that spruce-fir and spruce-fir-aspen make up a large portion (39 percent) of the suitable timber acres, this projection takes

GMUG National Forests Land Management Plan Draft Environmental Impact Statement: Volume 1
385
into account high mortality in these types due to spruce beetle, increased treatments (salvage) in recent years, and very slow growth in spruce-fir. (While the total program under alternatives B and C is 55,000 CCF for all years, the amount of salvage does vary, with more salvage volume projected for the first five years relative to the rest of the planning period.)
• The total program for alternative D is 30,000 CCF. Alternative D was adjusted to reflect a smaller timber program, with no salvage harvest and no commercial harvesting outside of the suitable base, in addition to no commercial harvesting on steep slopes, as described above.
• Fuelwood was assumed constant under all alternatives at 5,000 CCF. The salvage program was assumed the same for alternatives A, B, and C. In the first five years, there will be some salvage harvesting in spruce-fir and spruce-fir-aspen areas (12,500 CCF per year) in response to the current spruce-beetle epidemic. However, the overall program will be predominantly focused on green timber sales, as this spruce-beetle wood has deteriorated, making it less economically viable. After five years, the salvage program will be smaller and is estimated at 5,000 CCF per year. Epidemic levels of beetles and other pathogens-induced mortality is expected to reduce to endemic levels in most vegetation cover types. Additional assumptions are contained in the draft forest plan in appendix 2, Proposed and Possible Actions.

USDA Forest Service
386
Table 158. Projected timber sale program (annual average volume output) for each alternative [CCF, one hundred cubic feet; MBF, one thousand board feet]
Years 1 – 5 Alternatives A – C
Years 6 – 20 Alternatives A – C
Years 1 – 5 Alternatives A – C
Years 6 – 20 Alternatives A – C
Years 1 – 20 Alternative D
CCF MBF CCF MBF CCF MBF CCF MBF CCF MBF Timber Products Does not include salvage or sanitation volumes. From lands suitable for timber production
A1. Sawtimber 17,200 8,600 16,600 8,300 35,000 17,500 33,750 16,900 20,000 10,000 A2. Other products (Aspen) 1,000 4,900 2,000 10,000 5,000
From lands not suitable for timber production
B1. Sawtimber 200 100 600 300 500 300 1,250 600 0 0 B2. Other products 0 0 0 0 0 C. Projected Timber Sale Quantity (A1 + A2+B1+B2) 18,400 22,100 37,500 45,000 25,000
Other Estimated Wood Products Do not meet timber product utilization standards.
D. Fuelwood 5,000 6,000 5,000 6,000 5,000 6,000 5,000 6,000 5,000 6,000 E. Projected Wood Sale Quantity (C + D) 23,400 27,100 42,500 50,000 30,000
F. Estimated Salvage Volume 12,500 6,300 5,000 2,500 12,500 6,300 5,000 2,500 0 0
G. Total Volume including Salvage (E + F) 35,900 32,100 55,000 55,000 30,000

GMUG National Forests Land Management Plan Draft Environmental Impact Statement: Volume 1
387
The projected acreage of timber management that may occur under each alternative is listed in table 159.
Table 159. Estimated acreage of timber management under each alternative (estimated annual acreage)
Forest Cover Type and Management
Practice
Years 1 – 5 (acres)
Alternative A
Years 1 – 5 (acres)
Alternative A
Years 1 – 5 (acres)
Alternatives B - C
Years 6 – 20 (acres)
Alternatives B - C
Years 1 – 20 (acres)
Alternative D Salvage Sales 1,000 500 1,000 500 0 Live/Green Timber Harvest in Lodgepole Pine, Spruce-Fir, Spruce-Fir-Aspen, Mixed Conifer, Ponderosa Pine, and Aspen
1,800 2,200
3,800 4,500 2,500
Total Acres – Timber Management
2,800 2,700 4,800 5,000 2,500
Sustained Yield Limit
A sustained yield limit was calculated to determine the amount of timber “which can be removed from [a] forest annually in perpetuity on a sustained-yield basis” (National Forest Management Act, sec. 11, 16 U.S.C. 1611; 36 CFR 219.11(d)(6)). Based on Forest Service handbook direction (FSH 1909.12, 64.3), the sustained-yield limit is the volume that could be produced in perpetuity on lands that may be suitable for timber production. The calculation of the sustained-yield limit is not limited by land management plan desired conditions, other plan components, or the GMUG’s fiscal capability and organizational capacity. The sustained-yield limit is not a target; it is a limitation on harvest. Because it is based on lands that may be suitable for timber production, the sustained-yield limit does not vary by alternative. The sustained yield limit was determined to be 12,776,500 cubic feet per year, or 127,765 CCF per year. Assumptions regarding this calculation are contained in draft revised forest plan appendix 8.
Effects of the No-Action Alternative
Given necessary compliance with the National Forest Management Act, the effect of the current plan direction is overall similar to the proposed plan direction. Key differences are:
• A smaller acreage suitable for timber production. This combined with other current plan direction limits flexibility in terms of where commercial timber can be harvested.
• Lower projected timber sale and wood sale quantities, relative to alternatives B and C. • The current plan is rather prescriptive about the types of management activities and
cutting methods and their use in different cover types and is less flexible in this regard.

USDA Forest Service
388
Effects of the Proposed Action
Effects of the Timber Program Direction on the Timber Program
The current plan limits the maximum opening size created by even-aged management to 40 acres. The revised plan limits the maximum opening size to 40 acres in most types, but specifically increases the maximum opening size to 100 acres for lodgepole pine and aspen, in order to better mimic the larger openings created by natural disturbances in these types. Both plans include exceptions to the maximum opening size limit related to areas harvested as a result of natural catastrophic conditions or in cases where larger openings have been approved by the regional forester after a 60-day public review. The effect of this change in plan direction is increased management flexibility in these cover types. There may be larger clearcuts in these areas. Plan direction related to adequate restocking and minimum restocking levels is different between the current plan and revised plan. The current plan has both minimum and desired stocking rates and which vary based on site productivity. The revised plan has stocking levels that are lower, or at the minimum value, relative to the current plan, and additionally specifies restocking levels for warm-dry and cool-moist mixed conifer. These changes to the minimum restocking levels reflect improved understanding of regeneration dynamics of these ecosystems and ensure sufficient regeneration and recruitment while not requiring higher rates of stocking than are ecologically desirable. The effect of this change in plan direction is increased simplicity and flexibility in terms of meeting the minimum restocking levels after harvest, and potentially lower costs as well. The current plan has a desired condition that states that commercial timber sales will be scheduled only on lands suitable for timber production and can occur in all management areas except 8A, 8B, 8C, 10A, and 10C. The revised plan limits timber harvested for the purpose of timber production to lands suited for timber production. It allows for timber harvest on lands not suited for timber production for other purposes. Specifically, timber harvest may occur on these lands as a tool to assist in achieving or maintaining one or more applicable desired conditions or objectives of the plan in order to protect other multiple-use values (such as improving wildlife habitat or thinning to reduce fire risk) and for salvage, sanitation, public health, or safety (FW-STND-TMBR-03). The effect of this direction is increased timber management flexibility in terms of the potential for commercial timber sales to be used across a broader landscape. The revised plan has new direction related to post-fire salvage harvest. This direction states that post-wildfire timber salvage should not occur in areas with high soil burn severity unless the removal of hazard trees is necessary for safety or to reduce risk to infrastructure (FW-GDL-TMBR-08). In addition, it requires retention of unburned or lightly burned patches and retention of clusters of burned trees with a variety of sizes in areas burned by mixed or high-severity wildfire (FW-GDL-TMBR-09). Guideline FW-GDL-TMBR-08 will have an impact on the timber program and will limit the GMUG’s ability to salvage timber after fires in some areas. FW-GDL-TMBR-09 will have a smaller impact on the timber program and will not prohibit salvage sales but will reduce the quantity of wood sold in those sales.

GMUG National Forests Land Management Plan Draft Environmental Impact Statement: Volume 1
389
In both the current plan and the revised plan, there is a limit on the quantity of timber that may be sold per decade, thus ensuring that the timber harvest program is sustainable. In the current plan, this is set based on the allowable sale quantity of 91,270 CCF per year. In the revised plan, this is set based on the sustained yield limit of 127,765 CCF per year. The effect of this is that more timber could potentially be offered under the draft revised forest plan. However, as described above, the GMUG is only projected to produce 55,000 CCF under alternatives B and C, with alternative D lower than this. The current plan is prescriptive about the types of management activities and cutting methods and their use in different cover types. The revised plan is generally less prescriptive, with draft revised forest plan appendix 2 describing planned timber management practices by vegetation type. The effect of this is increased flexibility in terms of the type of timber management activities. The area suitable for timber production is substantially higher under the action alternatives. The biggest effect of this increase is increased flexibility in terms of where vegetation management can take place.
Effects of Ecosystem Program Direction on the Timber Program
The draft revised forest plan contains direction related to the key ecosystem characteristics identified in the assessments in the Terrestrial Ecosystems section, and this direction will have an impact on the timber program. Forestwide desired condition FW-DC-ECO-02 describes the desired amount (percentage) of different seral and structural stages for each ecosystem and is applied at the Forestwide scale. As described in the Terrestrial Ecosystem section, ST-SIM models were run at the forest scale, with model results indicating, for the most part, that alternative B keeps seral stage conditions within or moves them toward these desired ranges over 20 years. While projected acres in each seral stage vary by alternative, general trajectories are similar across alternatives, and all three action alternatives are generally consistent with each other in terms of moving toward or remaining with desired condition ranges. That analysis assumed that the Forestwide seral stage conditions are a reasonable proxy for those at the geographic area scale. This desired condition may impact the timber program in that timber harvest could be limited given the current distribution of seral and structural stages relative to the desired amounts. Guideline FW-GDL-ECO-07 has direction regarding the retention of snags and coarse woody debris when carrying out management activities. While the current GMUG plan also contains plan direction regarding snag retention, the snag retention levels are generally lower or apply to smaller trees. Current plan direction is to maintain an average of 200-300 snags in all stages of development per 100 acres. Where biologically feasible, minimum retention amounts in the current plan are 90-225 snags per 100 acres (10 inches and greater) for ponderosa pine, Douglas-fir, and spruce-fir, 120-300 snags per 100 acres (8 inches and greater) for aspen, and 90-180 snags per 100 acres (8 inches and greater) for lodgepole pine. The draft revised forest plan snag retention amounts are set by ecosystem, are higher, with larger minimum diameter at breast height values, and include snag retention amounts for pinyon-juniper and bristlecone-limber pine (table 160). The draft revised forest plan snag retention amounts do not apply to the wildland-urban interface.

USDA Forest Service
390
Table 160. Draft revised forest plan snag retention thresholds [DBH, diameter at breast height]
Forest Ecosystem
Minimum Number of Snags
per 100 Acres and Minimum
DBH
Spruce-Fir ≥ 600 (12 inch) Spruce-Fir-Aspen ≥ 550 (12 inch) Aspen ≥ 500 (10 inch) Lodgepole Pine ≥ 300 (10 inch) Ponderosa Pine ≥ 200 (12 inch)
Warm-Dry Mixed Conifer ≥ 200 (12 inch) Cool-Moist Mixed Conifer ≥ 400 (12 inch)
Pinyon-Juniper ≥ 100 (10 inch) Bristlecone-Limber Pine ≥ 200 (12 inch)
The current GMUG plan also contains direction regarding retention of coarse woody debris, specifically maintaining 10-20 tons of logs and other down woody material per acre. Direction also states to retain 50 linear feet per acre of down-dead logs, where biologically feasible, with a minimum diameter of 12 inches (ponderosa pine, Douglas-fir, and spruce-fir) or 10 inches (aspen and lodgepole pine). The draft GMUG plan direction regarding retention of coarse woody debris tends toward lower amounts in certain types (ponderosa pine, warm-dry mixed conifer, pinyon-juniper, bristlecone-limber pine) and has a wider range for some types (spruce-fir, spruce-fir-aspen, cool-moist mixed conifer). The effect of this guideline and its direction on snag and coarse woody debris retention will be minimal on the timber program. The current GMUG plan has rather specific, more quantitative direction regarding retention of old forest, with 5 to 12 percent or more, where biologically feasible, in an old growth forest classification and with direction regarding old forest patch size. The draft GMUG plan has a desired condition for old forest (FW-DC-ECO-08), is less prescriptive, but requires old forest to be well-distributed and to occur in amounts and patch sizes needed to support the species that depend on this habitat. Addition direction in the draft revised forest plan pertaining to old forest and old forest characteristics includes guideline FW-GDL-ECO-07 (snag and coarse woody debris retention), guideline FW-GDL-SPEC-11 (maintaining residual patches of large dead and live trees), Southern Rockies Lynx Amendment standard VEG S6 in alternatives B and D (limits vegetation management in multi-story mature or late-successional conifer forests), and desired condition FW-DC-ECO-02 (has desired amounts of late-mid/late seral stages for each ecosystem). While the direction regarding old forest and old forest characteristics is different between the current GMUG plan and the draft revised forest plan, the effect in terms of impact to the timber program will be similar.

GMUG National Forests Land Management Plan Draft Environmental Impact Statement: Volume 1
391
Effects of Wildlife Program Direction on the Timber Program
Excluding the timber program direction, the wildlife program direction has the largest effect on the timber program. Specific wildlife program direction in the draft revised forest plan is discussed below. FW-GDL-SPEC-07 constrains management activities when and where needed to reduce impacts to and disturbance of raptors and migratory birds. This direction is similar to current practice, with the effect being that it will limit the timing of timber management activities. FW-GDL-SPEC-11 requires retention of residual patches of large dead and live trees for the viability and habitat of cavity-dependent species. While there are a few outlined exceptions to this guideline, such as treatments within the aspen cover type and removal of hazard trees, this plan direction will have noticeable impact on the timber program. It may be difficult to implement in some cases, limits flexibility, and may lead to the elimination of small timber sale units. FW-GDL-SPEC-15 limits new activities that displace certain species above and beyond the existing disturbance baseline in wildlife production areas during their reproductive period and severe and critical winter range and winter concentration areas during the winter. This direction is similar to current practice, with the effect that it will limit the timing of timber management activities in these areas. These areas will be updated over time by Colorado Parks and Wildlife and as such, this direction could apply to additional areas, and the effect of this plan direction may change over time. FW-GDL-SPEC-16 is new direction that will apply to any project proposal in big game production areas, migration corridors, severe and critical winter range, and winter concentration areas. Any new project proposal in these areas will need to consider whether travel route realignment options make sense in order to create larger contiguous habitat blocks. This will come into play in early project development for any vegetation management activities in these areas. While travel route realignment creates an additional step that will add time and analysis for these projects, such opportunities (e.g., closing an existing route and creating a new route or using a different route) within a project area are likely to be uncommon. Plan direction for boreal toad (FW-GDL-SPEC-20, 21, 22, 23, and 56) is new direction that will likely have a small impact on the timber program, as there are currently only two breeding sites within the area that are suitable for timber production under alternative B. The impact of this direction will be greater if additional breeding sites are found. This direction limits operation of ground-based equipment off of existing roads during the winter within 1.6 miles of breeding sites to areas with at least 1 foot of packed snow or 4 inches of frozen soil. It limits operation of ground-based equipment off of existing roads during non-winter months within 0.5 mile of breeding sites. It also requires additional decontamination protocols for ground-based equipment in the Upper East River subwatershed since this area is chytrid-free. However, this plan direction applies to a limited area and will have little to no impact on the timber program as this watershed is not considered suitable for timber production under alternative B. FW-GDL-SPEC-31 prohibits surface-disturbing activities within 600 feet of known locations of at-risk plants. This will have a minimal effect on the timber program, as it only applies to approximately 1450 acres of suitable timber under alternative B.

USDA Forest Service
392
Direction for Canada lynx is different across alternatives and will have an impact on the timber program. Under the no-action (alternative A), Southern Rockies Lynx Amendment direction applies to mapped lynx habitat that covers 1.34 million acres. That acreage covers about half of the area suitable for timber production under alternative A, 235,000 acres. Under the action alternatives, the focus of lynx conservation will be on a subset of that acreage and focused on the highest priority use areas for lynx. Based on Theobald and Shenk (2011), the most currently available proxy of this area is an estimated 581,000 acres, which is 43 percent of the mapped lynx habitat under alternative A. Under alternative B, Southern Rockies Lynx Amendment direction (with the exception of Veg S2) will apply, but to the modified lynx habitat acreage, of which only 143,000 acres overlap with the area suitable for timber production. Veg S2 will no longer apply under alternative B and a new standard, Veg S7, would apply and limit salvage harvest activities in stands that represent high-quality lynx habitat. Salvage harvest in these areas would be limited to 7 percent of the high-quality lynx habitat probability lynx use area that overlaps the suitable timber base over a period of 15 years from the date of the forest plan decision. The high-probability lynx use area on the GMUG is approximately 10,600 acres. While this is a relatively small area, the area that Veg S7 applies to may be expanded once the modified lynx habitat map is finalized. Under alternative C, lynx plan direction will be similar to that in alternative B, but with a change such that Veg S5 and Veg S6 will no longer apply. This direction will apply to the modified lynx habitat acreage, of which 152,000 acres overlap with the area suitable for timber production. As in alternative B, a new standard, Veg S7, would apply and would limit salvage harvest activities in stands that represent high-quality lynx habitat to 7 percent of the high-probability lynx use area that overlaps the suitable timber base over a period of 15 years from the date of the forest plan decision. The high-probability lynx use area on the GMUG is approximately 10,600 acres. While this is a relatively small area, the area that Veg S7 applies to may be expanded once the modified lynx habitat map is finalized. Under alternative D, Southern Rockies Lynx Amendment direction will apply, but to the modified lynx habitat acreage, of which 100,000 acres overlap with the area suitable for timber production. A new standard, Veg S8, would apply and would limit harvest activities in stands that do not qualify for Veg S6 due to overstory mortality to 7 percent of mapped lynx habitat over a period of 15 years from the date of the forest plan decision. This should have little effect on the timber program given there is no planned salvage harvest under alternative D. While the addition of Veg S7 (alternatives B and C) or Veg S8 (alternative D) will add a new constraint on harvest in lynx habitat, overall, the change in lynx direction under the action alternatives will have a positive effect on the timber program as the lynx direction will apply to a much smaller area than it currently applies to. While some lynx direction varies among the action alternatives, in particular the inclusion or exclusion of Veg S2, Veg S5, and Veg S6, whether or not these standards are or are not included will have a minimal effect on the timber program, as the timber program has been operating well below the Southern Rockies Lynx Amendment caps for Veg S2 and Veg S5. The exclusion of Veg S6 under alternative C would have a beneficial effect on the timber program, relative to the other alternatives, as

GMUG National Forests Land Management Plan Draft Environmental Impact Statement: Volume 1
393
this is one Southern Rockies Lynx Amendment limit that the GMUG is coming closer to and may arrive at in the next decade, with about 2,300 acres left under the Veg S6 cap. Direction for Gunnison sage-grouse will have an impact on the timber program, primarily to the timber program on the Gunnison district, but potentially to the program on other districts as well. The biggest impacts come from FW-GDL-SPEC-48 and FW-GDL-SPEC-49, which impose timing restrictions in Gunnison sage-grouse habitat and limit motorized travel and noise from management activities. This direction would affect the timing of some timber sales, especially those near Gunnison sage-grouse habitat. In some cases, alternative haul routes outside of Gunnison sage-grouse habitat may be available for use. Area travel closures (FW-GDL-SPEC-51) could impact the timing of some timber sales but will likely be minor, with the assumption that these travel closures would be rare and only occur during especially severe winters. Plan direction related to the conservation watershed network (FW-GDL-SPEC-55 and FW-GDL-SPEC-57) will have a minimal impact on the timber program given the seasonal restrictions on ground-based equipment in perennial streams and their riparian management zone. In most cases temporary stream crossings are already avoided, but in cases where they cannot be avoided, this direction will affect the timing of activities. Watersheds in this network covered only 24,000 acres of the area suitable for timber production under alternative B. Plan direction related to road length in guideline FW-GDL-SPEC-57 applies to permanent roads and does not apply to temporary roads. Plan direction in the wildlife management area (MA-STND-WLDF-02) specifies that there shall be no net gain in system routes, both motorized and non-motorized, where the system route density already exceeds 1 linear mile per square mile, within a wildlife management area boundary. Given that temporary roads are not system routes and the clear exception for administrative routes, the effect of this plan direction in terms of the timber program will be to limit new permanent roads in some areas, which will have little to no impact because in general, new permanent roads are not currently being created for timber management activities.
Effects of Watershed, Riparian, and Aquatic Program Direction on the Timber Program
Draft revised forest plan direction regarding riparian areas is different than direction in the current GMUG plan. The current GMUG plan restricts many activities within 100 feet of aquatic and riparian areas. A plan standard (III-182) states the need to maintain at least 80 percent of the existing plant density within 100 feet from the edges of all perennial streams, lakes, and other waterbodies, or to the outer margin of the riparian ecosystems, where wider than 100 feet. Draft revised forest plan direction for the riparian management zone (FW-STND-RMGD-08 and 09) requires that management activities in these areas maintain or restore the connectivity, composition, function, and structure of riparian and wetland areas in the long term and prohibits clearcut harvest of desired native riparian vegetation. The draft revised forest plan direction, while clearly prohibiting clearcut harvest of desired native vegetation in the riparian management zone, allows for removal of some vegetation in these areas and is more accommodating when vegetation management is needed to restore these areas.

USDA Forest Service
394
Effects of Invasive Species Program Direction on the Timber Program
Invasive species program direction in the current GMUG plan is minimal. There are goals pertaining to healthy ecosystems that are relevant to the management of invasive species as well as direction regarding the priority for treatment of noxious weeds. Draft revised forest plan direction incorporates appropriate mitigation measures for invasive species, such as decontamination procedures on vehicles and equipment, the use of weed-free products, and reseeding with native plant species. While not in the current GMUG plan, these are mitigation measures that are incorporated into timber sale contracts and are current standard practice. One draft revised forest plan component, FW-STND-IVSP-04, is a departure from current practices and will impact the timber program. This standard moves the responsibility for noxious weed inventory, treatment, and monitoring to the contractor or permittee. The increased cost of this additional work may lead some timber sales to become uneconomical for purchasers and therefore, some timber sales may have no bidders. It will likely restrict where timber sales can feasibly take place.
Effects of Soils Program Direction on the Timber Program
The current GMUG plan has direction regarding maintaining soil productivity, minimizing human-caused soil erosion, and maintaining the integrity of associated ecosystems. In addition, direction from other sources, such as the Watershed Conservation Practices Handbook, is followed to ensure protection of soil resources. Draft revised forest plan soils program direction incorporates measures such as minimizing surface disturbance, avoiding landslide-prone areas, and using treatment methods that improve soil productivity and quality when decommissioning roads, temporary roads, skid trails, and landings. These measures protect soil resources and are typical of current practices. The current GMUG plan has a standard (III-41) that, to facilitate the control of soil erosion within acceptable tolerance, includes the following:
1) Permit conventional logging equipment on slopes of less than 20 percent where soil surveys or site-specific soil data are unavailable.
2) Allow conventional logging equipment on slopes up to 40 percent where soil surveys or site-specific soil data are available to design erosion mitigation needs.
3) Utilize high flotation equipment on slopes up to 60 percent or cable and aerial systems on any slope.
In contrast, in the draft revised forest plan, FW-GDL-SOIL-04 directs that ground-based equipment should only operate on slopes less than 40 percent. Exceptions will be considered only with site-specific analysis where soil, slope, and equipment are determined appropriate to maintain soil function. This plan direction is simplified and slightly expanded from the language in the current plan. In the current plan, ground-based equipment is allowed on slopes of 20 to 40 percent only with site-specific soil data. In the draft revised forest plan, the slope limit is increased to 40 percent for ground-based equipment, and site-specific exceptions are permitted.

GMUG National Forests Land Management Plan Draft Environmental Impact Statement: Volume 1
395
While areas with steeper slopes (greater than 40 percent) were included in the suitable timber areas for alternatives B and C, the draft revised forest plan guideline here will continue to constrain the ability to allow timber sales using ground-based equipment on these steeper slopes, but would allow exceptions where site-specific analysis supports the ability to maintain soil function. Cable and aerial systems would be available for use on these steeper slopes. FW-STND-SOIL-02 limits detrimental soil conditions to 15 percent of an activity area, unless more than 15 percent already has detrimental soil conditions from prior activities. This standard is similar to direction in FSH 2509.25, the Watershed Conservation Practices Handbook for the Rocky Mountain Region, that is currently followed. As such, including this standard will have little to no effect.
Effects of Air Quality Program Direction on the Timber Program
Air quality program direction will have a minor impact on the timber program. FW-GDL-AQ-06 pertains to dust mitigation measures. While the current GMUG plan does not contain direction regarding dust mitigation, these measures are typically in timber sale contracts and will not differ from current practice.
Effects of Recreation Program Direction on the Timber Program
Draft revised forest plan direction for the Continental Divide National Scenic Trail outlines how that trail should not be used for timber pile landings or as a temporary road except where the trail is currently co-located on an open road. Hauling or skidding along a co-located portion of the trail may be allowed when no other haul route or skid trail options are available and impacts to the trail infrastructure are minimized. In addition, any new temporary or permanent roads along the Continental Divide National Scenic Trail, while clearly limited, would be possible if determined to be the only prudent and feasible option and would need to be designed to minimize impacts to the trail. As such, draft revised forest plan direction for the Continental Divide National Scenic Trail will have a minimal impact on the timber program. FW-GDL-REC-16 indicates that national forest management decisions and activities, including timber and vegetation management activities, should be consistent with the desired recreation opportunity spectrum setting parameters that correspond with broadscale desired summer and winter recreation opportunity spectrum allocations and maps. The breakdown of acres in each recreation opportunity spectrum class in the suitable timber area, by alternative, is listed in table 161.

USDA Forest Service
396
Table 161. Recreation opportunity spectrum allocations within the suitable timber area, by alternative [Reported in acres and by percentage]
Alternative A: No Action
Alternative B: Blended
Alternative C: Active Management
Emphasis
Alternative D: Special Area
Emphasis
Acres Percent Acres Percent Acres Percent Acres Percent
Primitive 42 0% 0 0% 615 0% 150 0% Semi-primitive non-motorized 118,087 26% 283,853 30% 161,537 17% 193,833 26%
Semi-primitive motorized 194,385 42% 415,785 44% 436,769 45% 293,178 39%
Roaded natural 148,457 32% 245,294 26% 372,080 38% 268,735 35% Rural 1,336 0% 3,257 0% 3,923 0% 1,900 0% Total 462,307 948,190 974,925 757,796
Recreation opportunity spectrum tables in the draft revised forest plan containing setting prescriptions indicate that:
• For primitive settings, vegetation is natural, with no treatments except fire use. • For semi-primitive non-motorized settings, vegetation treatments enhance forest health
and mimic natural vegetation patterns. • For semi-primitive motorized settings, vegetation treatments improve forest health and
mimic natural vegetation patterns. • For roaded natural settings, vegetation treatment are evident but in harmony with the
scenic character. • For rural settings, vegetation treatments are often visible, but blend with the landscape.
The majority of the suitable timber area, under each alternative, is in the semi-primitive non-motorized and semi-primitive motorized settings. Given the plan direction for these settings, most vegetation management treatments will need to enhance or improve forest health and mimic natural vegetation patterns. Current and planned vegetation management activities on the GMUG reduce stand density (increasing resilience to insects and disease), reduce fuels, and/or improve wildlife habitat and generally mimic natural vegetation patterns. Given the focus on forest health in all of these activities, though not always the primary purpose and need, this plan direction, while new, should have a little to no impact on the timber program. Hazard tree removal is generally done along roadsides and near campgrounds and would likely be occurring in the roaded natural settings. One other difference between the current GMUG plan and the action alternatives is the inclusion of the recreation emphasis management area in the action alternatives. Areas in this management area were removed from the suitable timber area in alternatives B and D. In alternative B, this equates to approximately 24,000 fewer acres in the suitable timber area. In alternative D, this equates to approximately 21,000 fewer acres in the suitable timber area. While this management area was included in the suitable timber area in alternative C,

GMUG National Forests Land Management Plan Draft Environmental Impact Statement: Volume 1
397
draft revised forest plan direction (MA-GDL-EMREC-06) requires that vegetation management activities in this management area only be conducted if needed to maintain or improve the recreation setting. Given that vegetation management, while limited, can still occur in this management area and the relatively small acreage, the inclusion of this management area in the action alternatives will have a very minor impact on the timber program, with slightly less flexibility in terms of where vegetation management for purposes other than maintaining or improving the recreation setting may occur.
Effects of Scenery Program Direction on the Timber Program
Both the current GMUG forest plan and the draft revised forest plan have a focus on scenery and visual quality / scenic integrity objectives. While scenery direction in the current plan is very detailed and prescriptive, scenery is most often a focus along scenic byways and scenic trails, such as the Continental Divide National Scenic Trail. Revised plan direction related to the Continental Divide National Scenic Trail, similar to the current plan, requires screening, feathering, and other scenery management techniques to minimize visual impacts within and adjacent to the trail. Plan direction for scenery (FW-GDL-SCNY-03) specifies that all forest management activities should be consistent with or move the area toward achieving the desired scenic integrity objectives. This includes shaping and blending any even-aged regeneration cuts to the extent practicable with the natural terrain. The breakdown of acres in each scenic integrity objective class in the suitable timber area, by alternative, is listed in table 162.
Table 162. Scenic integrity objective allocations within the suitable timber area, by alternative
Alternative B: Blended
Alternative C: Active Management
Emphasis
Alternative D: Special Area
Emphasis
Acres Percent Acres Percent Acres Percent Very High 187 0 187 0 274 0
High 109,779 12 120,785 12 230,689 30 Moderate 581,616 61 508,116 52 422,250 56
Low 258,355 27 347,725 36 104,551 14
The majority of the suitable timber area, under alternatives B and C, is in the low and moderate scenic integrity classes. Some of the suitable timber area (12 percent) is in the high scenic integrity class. Under alternative D, the majority of the suitable timber area is in the moderate and high scenic integrity classes, with only 14 percent in the low category. The desired scenic integrity objectives will not preclude doing a particular type of vegetation management. It may lead to additional project design features and mitigation measures to address scenery concerns, in particular in areas with a high desired scenic integrity objective and when even-aged regeneration harvests are planned in aspen and lodgepole pine. As such,

USDA Forest Service
398
this plan direction may have some effects to the timber program, with more attention to planning and layout of some timber sales. Other scenery plan direction (FW-GDL-SCNY-05) applies to vegetation management along concern level 1 travelways, such as scenic byways, and specifies retention or enhancement of scenic quality of the immediate foreground. It includes a clear exception for maintenance of infrastructure, such as hazard tree removal along a power line.
Effects of Transportation Program Direction on the Timber Program
FW-STND-TSTN-03 requires that all temporary roads shall be closed and rehabilitated within 2 years following completion of the use of the road. This direction, even if not in the current plan, is standard practice in current timber sale contracts and will not have an effect on the timber program.
Comparison of Effects of the Alternatives – Summary
A detailed comparison of the effects of the alternatives is outlined in the Effects Common to All Alternatives and Alternatives Comparison section. In summary,
• All alternatives are designed to meet law and policy, including the National Forest Management Act, and provide sustainable levels of timber and other forest products.
• All alternatives have plan direction that guides vegetation management activities, ensuring protection of soil, watershed, fish, wildlife, recreation, and visual resources.
• All alternatives contribute to social and economic sustainability and provide ecosystem services and multiple uses because in all cases, plan direction provides for timber production.
• The area suitable for timber production is substantially larger under the action alternatives. The biggest effect of this increase is increased flexibility in terms of where vegetation management can take place.
• The projected timber and wood sale quantities are lower under alternatives A and D relative to alternatives B and C (table 163).
• The total program for alternative D is 30,000 CCF, the lowest of any alternative. Besides a smaller timber program, alternative D also assumes there is no salvage harvest, no commercial harvesting outside of the suitable base, and no commercial harvesting on steep slopes (greater than 40 percent).
Table 163. Lands suitable for timber production and total projected timber sale program, by alternative
[Reported in acres and CCF (one hundred cubic feet)]
Alternative A Alternative B Alternative C Alternative D
Total lands suitable for timber production (acres) 468,400 948,200 974,900 757,800
Total projected timber sale program (CCF) 32,1000-35,900 55,000 55,000 30,000

GMUG National Forests Land Management Plan Draft Environmental Impact Statement: Volume 1
399
Other key differences between alternatives:
• The action alternatives increase the maximum opening size to 100 acres for lodgepole pine and aspen, increasing management flexibility in these cover types. As a result, there may be larger clearcuts in these areas.
• The action alternatives have stocking levels that are lower, or at the minimum value, relative to the current plan. These changes to the minimum restocking levels reflect improved understanding of regeneration dynamics of these ecosystems and ensure sufficient regeneration and recruitment while not requiring higher rates of stocking than are ecologically desirable. The effect of this change in plan direction is increased simplicity and flexibility in terms of meeting the minimum restocking levels after harvest, and potentially lower costs as well.
• The action alternatives have new direction related to post-fire salvage harvest. This limits the GMUG’s ability to salvage timber after fires in some areas.
• The action alternatives include a Forestwide desired condition that describes the desired amount (percentage) of different seral and structural stages for each ecosystem and is applied at the Forestwide scale. This desired condition may impact the timber program in that timber harvest in certain ecosystems could be limited given the current distribution of seral and structural stages relative to the desired amounts.
• The action alternatives have new direction regarding retention of residual patches of large dead and live trees for the viability and habitat of cavity-dependent species. This direction may be difficult to implement in some cases, limits flexibility, and may lead to the elimination of small timber sale units.
• The action alternatives have new direction related to boreal toads that will likely have a small impact on the timber program, as there are currently only two breeding sites within the area suitable for timber production under alternative B. The impact of this direction will be larger if additional breeding sites are found.
• While the addition of Veg S7 (alternatives B and C) or Veg S8 (alternative D) will add a new constraint on harvest in lynx habitat overall, the change in lynx direction under the action alternatives will have a positive effect on the timber program as the lynx direction will apply to a much smaller area than it currently applies to. While some lynx direction varies among the action alternatives, in particular the inclusion or exclusion of Veg S2, Veg S5, and Veg S6, whether or not these standards are or are not included will have a minimal effect on the timber program as the timber program has been operating well below the Southern Rockies Lynx Amendment caps for Veg S2 and Veg S5. The exclusion of Veg S6 under alternative C would have a beneficial effect on the timber program, relative to the other alternatives, as this is one Southern Rockies Lynx Amendment limit that the GMUG is coming closer to and may arrive at in the next decade, with about 2,300 acres left under the Veg S6 cap.
• The action alternatives have direction for Gunnison sage-grouse that will have an impact on the timber program given timing restrictions and limitations on motorized travel and noise from management activities in Gunnison sage-grouse habitat.
• The action alternatives have direction, while clearly prohibiting clearcut harvest of desired native vegetation in the riparian management zone, that allows for removal of

USDA Forest Service
400
some vegetation in these areas and is more accommodating than the current plan when vegetation management is needed to restore these areas.
• The action alternatives include a standard, FW-STND-IVSP-04, that moves the responsibility for noxious weed inventory, treatment, and monitoring to the contractor or permittee. The increased cost of this additional work may lead some timber sales to become uneconomical for purchasers and therefore, some timber sales may have no bidders. It will likely restrict where timber sales can feasibly take place.
• While in the current plan, ground-based equipment is allowed on slopes of 20 to 40 percent only with site-specific soil data, under the action alternatives, the slope limit is increased to 40 percent for ground-based equipment, and site-specific exceptions are permitted. In addition, cable and aerial systems would be available for use on steeper slopes (greater than 40 percent).
• Under the action alternatives, the desired scenic integrity objectives will not preclude doing a particular type of vegetation management, but may lead to additional project design features and mitigation measures to address scenery concerns, in particular in areas with a high desired scenic integrity objective and when even-aged regeneration harvests are planned in aspen and lodgepole pine.
Cumulative Effects
Many factors influence timber harvest. The demand for timber products, supply from other sources, the timing and location of large disturbance events, laws, and regulations all affect the amount of timber that may be harvested from the GMUG. Budgets also impact timber supply. The effects that past activities have had on all the components of forest vegetation (such as forest composition and structure, landscape pattern, etc.) were discussed in the Affected Environment (Existing Condition) section and are reflected in the current condition.
Increasing Human Population
Additional stressors that may increase in the future are increasing population levels, both locally and nationally, with resulting increasing demands and pressures on public lands. These changes may lead to increased tensions between the demand for timber and changing societal desires related to the mix of other uses public lands may provide. The sustainable use of other forest products may become increasingly vulnerable, requiring permitting and limitation of use.
Management of Adjacent Lands
Portions of the GMUG adjoin other national forests and other Federal lands, each with its own land management plan. Harvesting or conversion of forests on adjacent lands would affect vegetation conditions at the landscape level. State law applies to all harvest activities regardless of ownership; therefore, basic resource protections would be consistent. However, harvest practices on other lands, particularly private lands, would not necessarily be conducted to meet the same desired conditions as those outlined in the GMUG plan. National Forest System lands adjacent to the GMUG include the Rio Grande National Forest, San Juan National Forest, White River National Forest, and Pike-San Isabel National Forest. The management plan for each of these national forests contains direction that

GMUG National Forests Land Management Plan Draft Environmental Impact Statement: Volume 1
401
addresses terrestrial vegetation and timber management. Management of vegetation is broadly consistent across these national forests due to law, regulation, and policy. The cumulative effect would be that timber management would be complementary. Other public lands adjacent to the GMUG are managed by Colorado Parks and Wildlife and the Bureau of Land Management (Uncompahgre Field Office, Gunnison Field Office, and Grand Junction Field Office). Timber management on these lands is similar to that on the GMUG, although with a lower intensity given the amount of forestland relative to grasslands and shrublands. The 2020 Colorado Forest Action Plan identifies a road map for improving forest health, including conditions, challenges, goals, and strategies across six forest themes: forest conditions, living with wildfire, watershed protection, forest wildlife, urban and community forestry, and forest products. The first priority is reducing the risk of uncharacteristic wildfire. Some counties associated with the GMUG have wildfire protection plans that map or define the wildland-urban interface. Vegetation management, including harvest, may be emphasized in these areas more than in others. Managing for open forests and fire-adapted species may be particularly emphasized in these areas.
Timber Demand
Demand for wood products allows for more cost-effective vegetation management and timber sales from the GMUG. If demand for wood products increases, so too will demand for timber sales from the GMUG. Alternatively, if demand decreases and mills close, there may be less demand for GMUG timber. A decrease in demand may reduce the amount of timber sold regardless of the alternatives.
Conclusion
Consistent with 36 CFR 219.8(b), the effects of plan direction under all alternatives would be to contribute to social and economic sustainability because in all cases, plan direction provides for timber production, one of the multiple uses that contributes to the local economy. Active vegetation management can contribute to resilient forests and ecosystems while providing social and economic benefits and contributing to a sustainable production of timber. Consistent with 36 CFR 219.10(a), the effects of plan direction under all alternatives would be to provide ecosystem services and multiple uses through integrated resource management because the benefits to people (the goods and services provided) include providing a supply of forest products, including wood products and other non-timber forest products. Plan direction is designed to manage for resilient forest conditions so that forests can adapt to whatever pressures and uncertainties the future may hold, which also provides important social and economic benefits.

USDA Forest Service
402
Environmental Justice
Affected Environment
Low-income and Minority Populations Poverty is an important indicator of well-being. Individuals with low incomes are more vulnerable to a number of hardships that may negatively affect their health and well-being, and they may also be more reliant on natural resources and Federal lands for subsistence and access to recreation opportunities. U.S. Census Bureau data are used to determine whether the populations residing in the study area constitute an “environmental justice population” through meeting any of the following criteria:
• At least one-half of the population is of minority of low-income status, or • The percentage of population that is of minority or low-income status that is
“meaningfully greater” in the analysis area than in the surrounding geographic area. In this analysis, a difference of more than five percentage points between the analysis area and the surrounding geographic area (the State of Colorado) is used to indicate a “meaningfully greater” environmental justice population (USDA Forest Service 2014).
Minority populations as defined by Council on Environmental Quality guidance under the National Environmental Policy Act (CEQ 1997) include individuals in the following population groups: American Indian or Alaskan Native; Asian or Pacific Islander; Black, not of Hispanic origin; or Hispanic. Minority populations are identified using the U.S. Census Population Estimates program, which provides estimates for the resident population by age, sex, race, and Hispanic origin at the national, state, and county scales. Total minority population refers to that part of the total population that is not classified as Non-Hispanic White Only by the U.S. Census Bureau. By using this definition of minority population, the percentage is inclusive of Hispanics and multiple race categories and any other minority single race categories. This definition is most inclusive of populations that may be considered as a minority population under Executive Order 12898. Population estimates and the percentage of population by minority categories and the percentage in poverty for the 10 counties of the GMUG analysis area and the State of Colorado for 2015 are provided in table 164. The table also identifies criteria that are being used as the “meaningfully greater” threshold, which is five percentage points greater than the State of Colorado. Based upon the 2015 data, Fremont, Montrose, and Saguache Counties have low-income populations that have been identified as environmental justice populations. The Hispanic or Latino populations in Garfield and Saguache Counties meet the criteria to be identified as environmental justice populations. In addition to these identified environmental justice populations, there are several Tribes with connections to the GMUG planning area due to the historical and cultural ties to the resources and landscape of this area. Tribes that may have concerns about potential Forest Service management practices and decisions and their effects on resources, uses, or areas of cultural importance are considered environmental justice populations as well. See the Cultural and Historic

GMUG National Forests Land Management Plan Draft Environmental Impact Statement: Volume 1
403
Resources and Uses and the Area of Tribal Importance assessments for more information (USDA Forest Service 2018, benefits to people). Additionally, it is important to note that Forest Service management actions may affect minority populations, low-income populations, or Tribes even if they do not reside in the immediate planning area. This may be especially true for Tribes that may not reside in the planning area but have a cultural connection to the area. Please reference the Socioeconomics section of this draft environmental impact statement for references to jobs and other economic considerations that could impact environmental justice communities. Correlations and inferences can be made to effects on low-income or minority communities by the increase in jobs resulting from more active forest management, for example, but the locations and hiring selections for those jobs cannot be analyzed at the forest plan level. Analyses including impacts to environmental justice communities will be conducted at the project level.

USDA Forest Service
404
Table 164. Estimated percentage of minority population and people in poverty, 2015 [Source: U.S. Census Bureau (2016a) and U.S. Census Bureau (2016b)]
County White Alone
(percent)
Black or African
American Alone
(percent)
American Indian and
Alaska Native Alone
(percent) Asian Alone
(percent)
Native Hawaiian and Other
Pacific Island Alone
(percent)
Two or More Races
(percent) Hispanic (percent)
Total Minority
Population (percent)
Poverty, All Ages
(percent) Colorado 87.5% 4.5% 1.6% 3.2% 0.2% 2.9% 21.3% 31.3% 11.5% 5% points greater than Colorado average
92.5% 9.5% 6.6% 8.2% 5.2% 7.9% 26.3% 36.3% 16.5%
Delta 94.9% 0.8% 1.4% 0.9% 0.1% 1.9% 15.3% 18.6% 15.8% Fremont 91.4% 4.0% 1.9% 1.0% 0.1% 1.7% 13.2% 20.9% 17.2% Garfield 94.2% 1.2% 1.8% 0.9% 0.2% 1.8% 28.1% 31.2% 10.3% Gunnison 94.2% 0.5% 2.6% 0.9% 0.0% 1.8% 9.4% 12.8% 12.5% Hinsdale 95.2% 0.5% 1.2% 0.6% 0.0% 2.5% 3.9% 8.1% 10.9% Mesa 94.1% 1.0% 1.5% 1.0% 0.1% 2.3% 14.4% 18.4% 14.1% Montrose 94.1% 0.8% 1.9% 0.9% 0.3% 2.0% 20.5% 24.0% 17.7% Ouray 96.5% 0.2% 0.6% 0.6% 0.1% 1.9% 5.9% 8.8% 9.4% Saguache 92.1% 1.0% 3.2% 0.9% 0.0% 2.7% 37.8% 42.6% 29.6% San Miguel 95.3% 0.8% 1.3% 0.9% 0.1% 1.7% 10.2% 13.5% 11.0%

GMUG National Forests Land Management Plan Draft Environmental Impact Statement: Volume 1
405
Protection of Children Executive Order 13045, Protection of Children from Environmental Health Risks and Safety Risks (April 21, 1997), recognizes a growing body of scientific knowledge demonstrating that children may suffer disproportionately from environmental health risks and safety risks. These risks arise because (1) children’s bodily systems are not fully developed, (2) children eat, drink, and breathe more in proportion to their body weight, (3) their size and weight may diminish protection from standard safety features, and (4) their behavior patterns may make them more susceptible to accidents. Based on these factors, the President directed each Federal agency to make it a high priority to identify and assess environmental health risks and safety risks that may disproportionately affect children. The President also directed each Federal agency to ensure that its policies, programs, activities, and standards address disproportionate risks to children that result from environmental health risks or safety risks. As noted in the assessment (USDA Forest Service 2018, benefits to people), the GMUG analysis area has relatively small youth populations as compared to Colorado overall. Nevertheless, youth may still be uniquely affected by Forest Service management actions that affect environmental quality and will be considered during project-level analysis.
Environmental Justice and Tribal Consultation The plan area is entirely within the ancestral homeland of the Utes, who despite their removal in the 1870s, have maintained deep cultural ties to the area. Therefore, the entire planning area can be considered an area of Tribal importance. Several other American Indian Tribes and communities may also have cultural ties to the plan area including the Navajo, Pueblos, and Jicarilla Apache, and possibly Paiute and Eastern Shoshone. The far western edge of the GMUG also contains cultural sites likely associated with Puebloan groups, including Hopi. While federally recognized Tribes fall into a minority category as defined by environmental justice, and many times their communities may also be considered low income, consideration of Indian Tribes within the requirements of Executive Order 12898 does not replace the agency’s responsibility to conduct government-to-government consultation affecting federally recognized, State-recognized, and non-recognized Tribes; individual Tribal members, including those living off-reservation and Alaska Natives; and Native Hawaiians. The Federal Government has a trust responsibility to federally recognized Tribes; the Forest Service, like other Federal agencies, must act consistently with the Federal trust responsibility when taking actions that affect Tribes. Part of this responsibility includes consulting formally with Tribes and considering their interests when taking actions that may affect them or their resources. See the Tribal Resources section of this draft environmental impact statement for more information. Some Tribes may prefer to participate only in the more formal and required consultation process and may not want to have a parallel effort with the environmental justice outreach. In some cases, the environmental justice effort will give members of a Tribe living outside a reservation or maybe having disagreement with, or different opinions than, the formal Tribal government an opportunity to express their issues or concerns. It is important to identify that Tribal populations exist in a study area, and to reach out to them as environmental justice populations, but also understand that such actions do not take the place of the formal government-to-government consultation that is required for federally recognized Tribes.

USDA Forest Service
406
Environmental Consequences
Analysis Framework Environmental justice is the fair treatment and meaningful involvement of people of all races, cultures, and incomes, with respect to the development, implementation, and enforcement of environmental laws, regulations, and policies. Executive Order 12898 states that “each Federal agency shall make achieving environmental justice part of its mission by identifying and addressing, as appropriate, disproportionately high and adverse human health or environmental effects of its programs, policies, and activities on minority populations and low-income populations.” The emphasis of environmental justice is on health effects and/or the benefits of a healthy environment. The Council on Environmental Quality has interpreted health effects with a broad definition: “Such effects may include ecological, cultural, human health, economic or social impacts on minority communities, low-income communities or Indian Tribes …when those impacts are interrelated to impacts on the natural or physical environment” (CEQ 1997). This analysis focuses on the effects of the proposed plan on environmental justice communities. This planning process includes the influence of climate change on forest resources as a baseline consideration, to be addressed through adaptive management at the project level. Given the broad nature of forest planning and the use of the GMUG by residents across the multi-county planning area, our assessment of environmental justice populations emphasized county-level conditions. Several counties in the planning area have minority populations and low-income populations that meet the criteria to be identified as environmental justice populations, including portions of Fremont, Montrose, Garfield, and Saguache Counties, as found through our assessment analysis. Several Tribes historically or culturally affiliated with the GMUG also meet criteria as environmental justice populations within the planning area. There are communities that have maintained strong ties to subsistence uses and ancestral lands they rely on for a variety of traditional, cultural, subsistence, forest product, fishing, and hunting uses. More detailed information, including pertinent definitions, is contained in the assessment (USDA Forest Service 2018, benefits to people). In summary, social and economic data describing the demographics and economic conditions of communities surrounding the GMUG indicate that concentrations of minority populations and low-income populations are present within the social and economic area of influence.
Effects Common to All Alternatives All alternatives are designed to contribute to ecological, social, and economic sustainability, and to provide sustainable levels of products and services that will eventually provide a positive effect on all communities, including environmental justice communities. All alternatives adhere to the principles of multiple use and the sustained yield of goods and services required by the Code of Federal Regulations (36 CFR 219.1 (b)). This is promoted by encouraging the development of partnerships with local communities and stakeholder groups and engaging in cooperative agreements to foster shared stewardship and get more work done on the ground. The plan’s emphasis on ecosystem resilience and watershed health will have the effect of protecting and sustaining high-quality, local sources of water that communities depend upon. The plan will continue to support local communities and a viable timber industry through production of timber, fuelwood, and other forest products; and will continue to support the development of energy and

GMUG National Forests Land Management Plan Draft Environmental Impact Statement: Volume 1
407
mineral resources as well as broadband and fiber optic infrastructure with little variation in quantities among alternatives, the effects of which are benefits to environmental justice and other communities in the planning area through increasing jobs. No disproportionate negative environmental or health effects to minority or low-income environmental justice populations are anticipated from any alternative. Public involvement throughout the planning process, including implementation and monitoring, provides the opportunity for issues of environmental justice to be raised and addressed. Under all alternatives, continued management of the GMUG ecosystems will contribute to healthy plant, fish, and wildlife populations, contributing to the resilience of forest-dependent communities. Following this forest plan revision process, implementing decisions and authorizing on-the-ground activities would require appropriate site-specific National Environmental Policy Act review in order to proceed. This would include additional evaluation to identify the location of potential environmental justice populations relative to the location of future actions and analysis to determine whether there would be disproportionately high and adverse human health or environmental effects to environmental justice populations.
Cumulative Effects As there are no disproportionate effects noted above, there are no cumulative effects.
Conclusion In the GMUG area of influence, the GMUG will continue to contribute to social and economic sustainability by providing for multiple uses, ecosystem services, infrastructure, and by having a presence in the community. While timber harvest, ranching, recreation, and other resources including ecosystem services will continue to play an important economic and social role in the area, individual counties may experience different levels of contributions, as well as varying degrees of progress toward the path of sustainable economic development. This is because some counties are more dependent upon retirees (sources of non-labor income); while other counties rely more on tourism, regional services, or agriculture. For this reason, different counties will experience different extents of contributions deriving from GMUG resources and management. The combined effect of the proposed plan direction on environmental justice communities, common to all action alternatives, will meet the requirements of Executive Order 12898 and the National Forest Management Act by assuring no disproportionate impact on low-income, minority, and Tribal communities. Future adaptive management practices to address baseline conditions such as climate change, and consideration of environmental justice communities in project-level National Environmental Policy Act analyses, will be important to minimize impacts to those communities in the future.

USDA Forest Service
408
Designated Areas
Designated Trails
National Scenic and Historic Trails
Affected Environment
Approximately 130 miles of the Continental Divide National Scenic Trail traverse the Gunnison Ranger District of the GMUG National Forests, from the district’s southern boundary with the Rio Grande National Forest, along its eastern boundary with the Pike-San Isabel National Forest, and north to boundary with the White River National Forest. The Continental Divide National Scenic Trail is primarily to be managed for non-motorized use, although much of the trail is currently located on open roads or motorized trails. It is also currently located within a more developed recreation opportunity spectrum class than is desirable for a national scenic trail, which may have impacts on scenic integrity and other natural, historic, and cultural resources along the corridor. The congressionally designated East Fork of the North Branch of the Old Spanish National Historic Trail runs through the GMUG National Forests, entering the Gunnison Basin over Cochetopa Pass and generally following the Highway 50 corridor to Grand Junction. The exact route of the Old Spanish National Historic Trail has not been mapped; therefore, condition information is limited. However, an inventory of the trail corridor is underway.
Environmental Consequences
The existing forest plan direction for the Continental Divide National Scenic Trail is minimal, but it did establish a sizeable corridor in which scenery was to be managed to the highest levels possible. The trail was to be managed for foot and horse, while allowing pre-existing motorized uses to continue. However, management of the trail is further guided by the 2009 Continental Divide National Scenic Trail Comprehensive Plan. The draft revised forest plan direction would build upon the basic framework in the existing forest plan and address a variety of other uses: no energy and mineral materials sites would be allowed within one-half mile of the trail, no motorized events would be allowed, it would be an avoidance area for larger special use infrastructure, and more direction is aimed at retaining the natural appearance and primitive nature of the trail and its surroundings. Provisions ensure continuous recreational access during timber harvest and other forest management activities. The overall effect of the proposed direction on the Continental Divide National Scenic Trail would be more comprehensive protection of the nature and purposes of the trail. Additionally, the objective to move the trail off of roads would further improve the trail setting in the long term. Alternative D would remove the trail overlay area from the area suitable for timber production, which may result in fewer commercial timber harvests in the vicinity of the trail relative to the other alternatives. There may be fewer interruptions to recreationist experiences and fewer visible impacts of harvest. But there may also be fewer opportunities for opening vistas or harvesting dead timber, which could result in a long-term difference in the scenic quality of the trail and trail middle-ground.

GMUG National Forests Land Management Plan Draft Environmental Impact Statement: Volume 1
409
Where the trail intersects the utility corridor overlay, the scenery objective would vary by alternative, from low in alternative C, to medium in alternative B, to high in alternative D. The visual impact of future development in the corridor would need to be mitigated accordingly. Alternative B represents a balanced approach to future utility development in these established corridors as well as to the natural-appearing setting of the trail. The recreation setting in alternative B would range from roaded natural (most developed) to primitive (least developed). Approximately 56 percent would be managed as primitive and semi-primitive non-motorized settings, while 44 percent would be managed as semi-primitive motorized and roaded natural settings due to the presence of existing roads and motorized trails in and crossing the trail corridor, as well as locations in which the trail is co-located on an existing road. In alternative C, approximately 5 percent more area of the trail overlay would be managed in a motorized setting. In alternative D, 99 percent of the trail overlay would be managed in a non-motorized setting. The 1983 forest plan provided no direction for the Old Spanish National Historic Trail. The effect of the proposed plan and alternatives would be to manage the trail and its corridor for its nature and purposes. The objective FW-OBJ-DTRL-17 would further the interpretation of the trail for the public, and standards and guidelines would address a variety of uses: no energy and mineral materials sites would be allowed within one-half mile of the trail, it would be an avoidance area for larger special use infrastructure, and unplanned fire and prescribed fire would be managed such that the scenic and historic character of the trail would be maintained.
Administratively Designated Trails
Affected Environment
The GMUG has two administratively designated national recreation trails: Bear Creek National Recreation Trail (3.5 miles), and Crag Crest National Recreation Trail (7.7 miles). Trail conditions are good for both trails, and use continues to increase, particularly on the Crag Crest summer and winter trails.
Environmental Consequences
The current forest plan does not contain specific provisions for either of the national recreation trails. In contrast, the draft revised forest plan proposes that a one-half-mile corridor on either side of the trail be managed for the nature and purposes of these trails, consistent with the congressionally designated trails (see the designated trails overlay on the management area map). This area would be managed for a high scenic integrity objective, which would have the effect of maintaining the high scenic character of these trails and their foregrounds. The objective FW-OBJ-DTRL-19 would begin to address deferred maintenance needs, which would have the effect of making them more passable for trail visitors and more sustainable with respect to soil resources. As with the congressionally designated trails, alternative D would remove the national recreation trails overlay area from the area suitable for timber production, which may result in fewer commercial timber harvests in the vicinity of the trail relative to the other alternatives. There may be fewer interruptions to recreationist experiences and fewer visible impacts of harvest. But

USDA Forest Service
410
there may also be fewer opportunities for opening vistas or harvesting dead timber, which could result in a long-term difference in the scenic quality of the trail and trail middle-ground.
Cumulative Effects for the National Trails As the population of Colorado increases, so too does the demand for recreation on public lands. More trail users are anticipated on the designated trails in the GMUG, which would result in more direct experiences on and awareness of the trails, but could also lead to wear and tear on the trail, use conflicts, or dispersed camping impacts. There may be demand for more motorized trails that may cross portions of the trails, which would impact the setting in their general vicinity.
Designated wilderness The wilderness area categories in the 1983 plan (8, 8A, 8B, 8C) are carried forward in the draft plan alternatives (1, 1.1 A, 1.1 B, 1.1 C), as well as the associated direction for each category. Plan direction from the 1983 plan that repeated law, regulation, and policy is omitted, consistent with the approach throughout the draft plan of avoiding redundancy. Additional plan components in the action alternatives would make permanent the forest orders that have been renewed repeatedly; there would be no change to management on the ground, but the agency's process hurdle of renewing orders would be removed.
Eligible Wild and Scenic Rivers
Affected Environment In the current forest plan, no streams are managed as eligible, as no eligibility report has been adopted and finalized. Although the 2007 proposed forest plan effort included a draft eligibility report, the report and plan were not adopted. For the current planning effort, an eligibility study has again been conducted. A total of 13 segments and their tributaries represented in approximately 118 miles were found to be eligible for wild and scenic river status. Most segments are located within wilderness or other congressionally designated areas (Tabeguache and Roubideau). A detailed description of each eligible segment’s location, preliminary classification, and outstandingly remarkable values is contained in appendix 11 of the draft revised forest plan.
Environmental Consequences
Analysis Framework
The eligibility results would be applied to each of the draft revised forest plan alternatives, including the no-action alternative. Unlike other aspects of the plan, selection of the no-action alternative (current forest plan) would still be modified by the eligibility study. However, for the sake of indicating the effects of managing river and stream corridors as eligible, the following analysis indicates the absence versus presence of eligible status for the suite of eligible segments. Indicators for analysis are total stream miles and corridor acres, as well as total acres in suitable timber by alternative.

GMUG National Forests Land Management Plan Draft Environmental Impact Statement: Volume 1
411
Management Direction
The Wild and Scenic Rivers Act (1968) established objectives, goals, and procedures for designation of wild, scenic, and recreational rivers, making it national policy to “preserve selected rivers or sections thereof in their free-flowing condition, to protect water quality of such rivers and to fulfill other vital national conservation measures.” According to the Act, these rivers “shall be preserved in free-flowing condition” and “they and their immediate environments shall be protected for the benefit and enjoyment of present and future generations.” Each stream found eligible for inclusion in the National Wild and Scenic Rivers System will be managed to maintain its eligibility until a detailed suitability study is completed. Individual suitability studies will be considered when a) strong local interest or support is demonstrated for wild and scenic designation and b) Congress expresses interest in a specific river for wild and scenic designation, or c) a proposed project would alter the free-flowing character of a stream (such as impoundment) or would affect the resources that made the stream eligible. A suitability study could conclude that a segment is not suitable; at that time, the segment would no longer be managed as eligible and would instead be managed consistent with adjacent lands. With respect to the draft revised forest plan, the plan largely defers to existing law and policy (FSH 1909.12, chapter 80, section 84, FSM 2354). Activities such as vegetation management, recreation uses, grazing, and even minerals development and water infrastructure would continue to occur in the corridors, when consistent with law and policy. Consistency with Forest Service policy would require activities to protect the free-flowing condition, water quality, and outstandingly remarkable values of a given segment. Wilderness areas are already withdrawn from mineral entry; mineral activities would therefore be moot in the GMUG segments classified as wild, as these occur exclusively within wilderness and other congressionally designated areas managed like wilderness. However, some minerals activities could proceed outside of wilderness, but they must be conducted in a manner that minimizes surface disturbance, sedimentation, pollution, and visual impairment. Variable scenic integrity objectives are established to maintain existing scenic integrity, including very high for segments classified as wild, and moderate to high for segments classified as scenic or recreational. The effect of the scenic integrity objectives would be to maintain the scenic qualities for which these streams are known. The alternatives vary as to whether or not some classifications are included in the areas suitable for timber production, as discussed below.
Comparison of Alternatives
Under all alternatives, approximately 36,700 acres would be managed as eligible corridors. Eligible segments classified as scenic and recreational would be included in the areas suitable for timber production in alternatives B and C, but they are excluded from suitable timber production in alternative D. Per existing policy, a range of vegetation management and timber harvest practices are allowed if these practices are designed to protect users or protect, restore, or enhance the river environment, including the long-term scenic character (FSH 1909.12, chapter 84.3, 9b). Alternatives B and C could have more commercial timber production within scenic and recreational segments, but would still be subject to this policy as well as the draft revised forest plan mapped scenic integrity objectives. However, more timber production could result in more short-term impacts to scenic character and recreational access, would alter the vegetation structure, and would change existing wildlife habitat. Commercial timber harvest may still occur

USDA Forest Service
412
within alternative D, but the primary purpose would be objectives other than commercial production.
Cumulative Effects
The addition of eligible segments may result in increased recreation use of the segments, and this is within the context of increasing population in the State of Colorado and increasing recreation use generally. As much as possible, the eligible segments correspond with eligible segments on adjacent, downstream Bureau of Land Management lands, so managing a given segment as eligible for a given value would be compatible across a broader landscape. Finally, climate change is expected to result in more frequent drought and extreme weather events. Managing a segment for its free-flowing nature will become more difficult as a result.
Recommended Wilderness Action alternatives B and D would recommend additional wilderness. The total recommended by alternative is indicated in table 165. The wilderness analysis (appendix 6 of this draft environmental impact statement) provides detail regarding how these areas were carried forward in alternatives, including some of the trade-offs for managing them as wilderness. Further impacts on different resources and programs from managing these areas as wilderness are included in the resource sections throughout this chapter.
Table 165. Size of recommended wilderness, by alternative
Alternative A (acres)
Alternative B (acres)
Alternative C (acres)
Alternative D (acres)
No new 34,000 No new 261,000
Research Natural Areas
Affected Environment Two research natural areas occur in the GMUG: Escalante Creek (60 acres), which is a blue spruce riparian community, and Gothic (1,080 acres), which is a high-elevation Engelmann spruce-subalpine fir community. Conditions of the Escalante Creek Research Natural Area are unknown. Increased recreation, camping, and off-route vehicle travel and parking are the primary concerns related to conditions at the Gothic Research Natural Area. An additional research natural area—Battlements—is proposed in alternative D of the draft revised forest plan, as noted in table 166. The approximately 11,000-acre area ranges in elevation from 5,500 to 9,300 feet and is primarily composed of pinyon-juniper woodlands but also Gambel oak and greasewood shrubland, Douglas-fir forest, and cottonwood riparian. The plant communities are typical of those present on the Green River and Wasatch Formation shales and sandstones of the region. The area provides major representation for many plant associations not found within other possible research natural area candidates in the section. Significant populations of several rare plant species occur within the area, including one federally listed species.

GMUG National Forests Land Management Plan Draft Environmental Impact Statement: Volume 1
413
Table 166. Research natural areas in the GMUG National Forests
Alternative Name Acres Vegetation Community No-action and all action alternatives
Gothic (existing research natural area) 1,070 Engelmann spruce-subalpine fir, alpine meadows
No-action and all action alternatives
Dry Forks Escalante Creek (existing research natural area)
50 Blue spruce riparian
Alternative D Lower Battlement Mesa 10,670 Pinyon woodland
Environmental Consequences
Analysis Framework
The indicators for analysis are 1) the qualitative effects of plan direction, and 2) the relative number of acres of research natural areas by alternative.
Comparison of Draft Revised Forest Plan to Current Plan
In both plans, true to the definition of research natural areas, the emphasis for the areas “is on research, study, observations, monitoring, and educational activities that are nondestructive and nonmanipulative and that maintain unmodified conditions” (1991 GMUG Forest Plan). The areas are intended to serve as ecological reference areas or controls. Consistent with its tendency toward more prescriptive and specific plan direction, the current forest plan contains several standards that are more restrictive than direction in the draft revised forest plan. Fuel treatments were not allowed (p. III-191), grazing was restricted to that necessary to maintain a certain vegetation type (p. III-190), and roads and other physical improvements were not permitted (p. III-191). By contrast, the draft revised forest plan simply references existing agency policy FSM 4063, which spells out much of the same direction as was repeated in the current forest plan. The current forest plan prohibits direct habitat manipulation, which would extend to prescribed fire. By contrast, a section in the environmental impact statement for the 2002 White River National Forest Plan on a research natural area that straddles the boundary between the White River and GMUG National Forests makes explicit mention of the role that prescribed fire should continue to play in the area (final environmental impact statement, appendix G-5), and policy expressly allows vegetation management activities that “provide a closer approximation of the naturally occurring vegetation and natural processes governing the vegetation than would be possible without management” (FSM 4063.34). The draft revised forest plan management direction would defer to the standard in the policy and enable fire to be restored. The current forest plan has a higher standard for scenery than the draft revised forest plan. The current plan had a retention visual quality objective, which would translate to very high scenic integrity under the present scenery management system. The draft revised forest plan instead established a scenic integrity objective of “high.” This would allow for more modification relative to the current forest plan, but it would still result in a very natural-appearing landscape. The draft revised forest plan is more restrictive than the current forest plan and general agency policy with STND-RNA-04, which prohibits camping and off-route travel within the Gothic

USDA Forest Service
414
Research Natural Area boundaries. This addresses recreation-related issues in an area that is popular for dispersed camping and mountain biking.
Comparison of Alternatives
Existing research natural areas would continue in all alternatives, as the areas are designated in perpetuity. Alternative D would add the approximately 11,000-acre Battlements Research Natural Area, which would provide continuity of management with the adjacent White River National Forest. However, due to the remoteness of the area, its steep slopes, and its vacant grazing allotment status, the effect of the administrative designation may be relatively small.
Special Interest Areas
Affected Environment Five special interest areas are designated under the current forest plan: Slumgullion Earthflow, Dry Mesa Dinosaur Quarry, Ophir Needles, Alpine Tunnel Historic District, and Mount Emmons Iron Fen (table 167). An additional Gunnison Research Special Interest Area and Taylor-Willard Special Interest Area are proposed in the draft revised forest plan, alternatives B and D.
Table 167. Existing and proposed special interest areas in the GMUG National Forests [Acreage based on 10C management prescription areas of the 1983 GMUG Forest Plan (USDA Forest Service 1983)]
Name Acres
(rounded) Existing or proposed
Average Elevation
(feet) Category Slumgullion Earthflow 300 Existing 11,400 Geologic Dry Mesa Dinosaur Quarry 60 Existing 7,500 Paleontological Ophir Needles 500 Existing 11,500 Geologic Alpine Tunnel Historic District 500 Existing 11,000 Cultural Mount Emmons Iron Fen 170 Existing 10,000 Botanical
Gunnison Research 15,100 Proposed (alternatives B and D) 9,500 Research
Taylor-Willard 500 Proposed (alternative D) Botanical
Environmental Consequences
Analysis Framework
The indicators for analysis are 1) the qualitative effects of the plan direction, and 2) the relative acres of special interest areas by alternative.

GMUG National Forests Land Management Plan Draft Environmental Impact Statement: Volume 1
415
Comparison of Draft Revised Forest Plan to Current Plan
Consistent with its tendency toward more prescriptive and specific plan direction, the current forest plan contains several standards that are more restrictive than direction in the draft revised forest plan. A standard prohibits construction of developed recreation sites (p. III-193) and permits only undesignated sites in Frissell classes 1 through 3 (p. III-194). It prohibits snowmobile use off of designated routes in alpine and krummholz ecosystems (p. III-194), prohibits any direct habitat manipulation (p. III-194), and requires the prompt control of all wildfires (p. III-195). It further requires the withdrawal of the special interest areas from mineral entry (p. III-195). These standards support the general desired condition (goal) “to protect and where appropriate, foster public use and enjoyment of these areas.” There would be no change to the scenic integrity objectives for each special interest area between the current and the draft revised forest plan (see appendix 3 of the draft revised forest plan). By contrast, the draft revised forest plan would not prohibit construction of developed recreation sites outright, but any such site would need to support the desired condition to “preserve the characteristics for which the areas are established.” Dispersed camping in special interest areas would be managed consistently with the rest of the GMUG, where multiple campsites rating above a 6 on the overall impact rating using the National Minimum Recreation Site Monitoring Protocol would warrant any of a variety of management actions (FW-STND-REC-08). The existing and proposed special interest areas are located in a variety of recreation opportunity spectrum settings, so the current plan’s prohibition of snowmobiles off of designated routes in the alpine ecosystem would be more restrictive than direction in the draft revised forest plan in some special interest areas. Approximately half of the area in special interest areas in the draft revised forest plan would be managed for non-motorized settings. In the draft revised forest plan, special interest areas are removed from the area suitable for timber production. However, timber harvest for other purposes, including fuels treatments, would be allowed as appropriate and in alignment with the desired condition to “preserve the characteristics for which the area is established.” Although the current plan prohibits direct habitat manipulation, it requires prompt control of all wildfires, limiting the opportunity for wildfire to play its natural role in the vicinity of the special interest areas. By contrast, the draft revised forest plan would enable proactive fuels treatments and would defer fire management decisions to professionals on-the-ground. There may be instances in which wildfire would be compatible with the “characteristics for which the area is established.” If historic structures were at risk from wildfire, as for instance Alpine Tunnel, there would be an emphasis on protection. The draft revised forest plan addresses special use permits and other authorizations more specifically than the current forest plan, requiring them to be compatible with the special interest area (MA-GDL-SIA-03). It also establishes an objective to complete management plans, including official boundary descriptions and maps (MA-OBJ-SIA-02). Both of these provisions would have the effect of enabling finer-grained management of these areas, tailored to the particulars of each site, as well as ensuring any permitted uses are appropriate.
Comparison of Alternatives
One new area, the Gunnison Research Special Interest Area, is proposed in alternatives B and D of the draft revised forest plan. A second area, Taylor-Willard Special Interest Area, is proposed in alternative D. The Gunnison Research Special Interest Area would acknowledge the

USDA Forest Service
416
longstanding, world-renowned ecological research that is largely administered by the Rocky Mountain Biological Laboratory in the historic townsite of Gothic, located on the Gunnison Ranger District. For alternative D, a portion of the area proposed as a special interest area in alternative B would become instead a special management area. The difference between the special interest area and special management area would be additional recreation suitability decisions: for this area, the portion proposed as a special management area in alternative D would be unsuitable for over-snow vehicles and other motorized vehicles. By contrast, in alternative B, approximately one-half of the area would be managed for a winter motorized setting and one-half would be managed for a non-motorized setting. Further, the approximately 500-acre Taylor-Willard Special Interest Area would be added in alternatives B and D. This would provide continuity with comparable management on the adjacent White River National Forest. The area located on the White River National Forest is currently managed as a special interest area with an emphasis on sensitive and endangered plant species. Most of the area is above timberline with elevations ranging from 11,200 to 12,300 feet. The area is significant for the number of identified rare high-alpine plants that grow there. Alternative C has no additional areas proposed as special interest areas; management of special interest areas would be comparable to the current plan.

GMUG National Forests Land Management Plan Draft Environmental Impact Statement: Volume 1
417
Chapter 4. Consultation and Coordination
List of Preparers The preparation of this draft environmental impact statement and the draft revised forest plan has been a major undertaking. This list of preparers is limited to those people who were members of the interdisciplinary team working on these documents. The preparation of these documents could not have been completed without the support and assistance of the employees of the GMUG National Forests and our colleagues in the Rocky Mountain Regional Office. We also recognize the leadership team of the GMUG National Forests as providing guidance during this process.
Core Interdisciplinary Team The core interdisciplinary team (table 168) developed plan components and alternatives and wrote the analysis for the draft environmental impact statement. GMUG National Forests and Rocky Mountain Regional Office team members communicated primarily virtually and met in person at critical points of integration of the documents.
Table 168. Core interdisciplinary team
Name Position Title Team Role
GMUG National Forest
Samantha Staley Forest Planner Co-Interdisciplinary Team Lead, Designated Areas, Carbon
Brittany Duffy Assistant Forest Planner (former) Co-Interdisciplinary Team Lead Jonathan Tucker Assistant Forest Planner Public Engagement
Beth Anderson Forest Soil and Water Program Lead Soils, Water, Watersheds
Aaron Drendel Gunnison Recreation Staff Recreation, Recreation Opportunity Spectrum
Clare Hydock Forest Range Program Lead Range, Invasives Nicole Hutt Forest Timber Program Lead Timber
Jeremy Karchut Forest Heritage Program Lead (former) Cultural Resources
Niccole Mortenson Forest NEPA Coordinator Minerals
Carlyn Perovich Forest Ecologist Terrestrial Ecosystems, Species of Conservation Concern, Climate Change
Amanda Sanchez Forest Heritage Program Lead Cultural Resources William (Tony) Smith Forest GIS Program Lead GIS Support Ken Straley Forest Recreation Program Lead Recreation, Wilderness Nick Szuch Forest Lands Program Lead Lands and Special Uses Matt Vasquez Forest Wildlife Program Lead Wildlife Melvin Woody Forest Aquatics Biologist (former) Aquatic Ecosystems, Fisheries
Rocky Mountain Regional Office, Forest Plan Revision Core Team

USDA Forest Service
418
Name Position Title Team Role
Alice Cohen Acting Regional Social Scientist and Public Engagement Program Lead (former)
Environmental Justice
Tim Croissant Wildlife Biologist Wildlife Ellen Hardy Writer-Editor Writer-Editor Natalie Heberling Geospatial Analyst GIS Support Dan Huisjen Fuels Program Lead (former) Fire/Fuels Stephanie Rebain Vegetation Analyst Timber, Vegetation modeling Samantha Rider Recreation Specialist (former) Recreation, Wilderness
Trey Schillie Regional Planner Regulation Compliance, Regional Office Coordination
Rocky Mountain Regional Office, Renewable Resources Staff Tyler Johnson Regional Botanist Species of Conservation Concern
Forest Service Enterprise Program Nicole Hill Landscape Architect Scenery
Mike McNamara Hydrology and Soils Specialist Water and Watersheds, Aquatic Ecosystems
Kristen Waltz Economist Socioeconomics Scott Williams Fire Management Specialist Air Quality
Extended Interdisciplinary Team The extended interdisciplinary team (table 169) primarily provided support and assistance in reviewing documents for policy consistency. In some cases, team members worked with GMUG counterparts to help write plan components and write the analysis for the draft environmental impact statement.
Table 169. Extended interdisciplinary team
Name Position Title Team Role
GMUG National Forests Daris Matos Forest Engineering Program Lead Transportation Stewart Robertson Forest Fuels Program Lead Fire/Fuels
Rocky Mountain Regional Office Delilah Jaworski Regional Social Scientist (former) Social Science, Document Review Donna Shorrock Regional Vegetation Ecologist,
Research Natural Areas Coordinator
Research Natural Areas
GMUG National Forests Leadership Team The GMUG leadership team (table 170) helped set the framework and principles for the revision effort, including making decisions on all aspects of the revision effort related to key issues, scope, and alternatives. They established timeframes, ensured accountability of all personnel involved, and assisted the interdisciplinary team on emerging issues.

GMUG National Forests Land Management Plan Draft Environmental Impact Statement: Volume 1
419
Table 170. GMUG National Forests leadership team
Name Position Title Levi Broyles Paonia District Ranger Curtis Cross Engineering Staff Officer Bill Edwards Grand Valley District Ranger Megan Eno Norwood District Ranger Dana Gardunio Ouray District Ranger Matt McCombs Gunnison District Ranger Tammy Randall-Parker Public Services Staff Officer
Clay Speas Renewable Resources Staff Officer (retired)
Chad Stewart Forest Supervisor
Shane Walker Planning and Public Affairs Staff Officer (former)
Corey Wong Public Services Staff Officer (retired)
List of Federal, State, and Local Cooperators The following entities helped develop the draft revised plan as cooperating agencies:
• Colorado Department of Natural Resources • Colorado Water Conservation Board • Colorado Parks and Wildlife • Colorado Department of Agriculture • Bureau of Land Management • U.S. Agricultural Research Service • U.S. Fish and Wildlife Service • Delta County • Gunnison County • Hinsdale County • Montrose County • Mesa County • Ouray County • Saguache County • San Miguel County • Town of Crested Butte • City of Grand Junction

USDA Forest Service
420
List of Tribal Governments Consulted The GMUG National Forests regularly consult with Tribes, including the three listed below. The GMUG notified the Tribes at each planning milestone and invited them to participate in the development of the draft revised plan and alternatives.
• Ute Indian Tribe of the Uinta and Ouray Reservation • Ute Mountain Ute Indian Tribe • Southern Ute Indian Tribe
Agencies to Which the Draft Environmental Impact Statement was Distributed • National Agricultural Library • U.S. Navy • U.S. Army Corps of Engineers • Environmental Protection Agency, Region 8 • U.S. Department of Energy • U.S. Department of the Interior, Office of Environmental Policy and Compliance • Federal Highway Administration • National Park Service, Curecanti National Recreation Area and Black Canyon of the
Gunnison National Park units • Each of the cooperating agencies

GMUG National Forests Land Management Plan Draft Environmental Impact Statement: Volume 1
421
Acronyms and Abbreviations
Plan Component Acronyms AQ – Air quality AQTC – Aquatic ecosystems CHR – Cultural and historic resources CRA – Colorado roadless area DC – Desired conditions DTRL – Designated trails ECO – Key ecosystem characteristics EMREC – Recreation emphasis area ENMI – Energy and mineral resources FFM – Fire and fuels management FW – Forestwide GA – Geographic area GDL – Guideline IND – Monitoring indicator INFR – Infrastructure IVSP – Invasive species LSU – Lands and special uses MA – Management area MON – Monitoring question MTR – Mountain resort OBJ – Objective PART – Partnerships and coordination PLEO – Paleontology REC – Recreation RECWLD – Recommended wilderness RMGD – Riparian and groundwater-dependent ecosystems RNA – Research natural area RNG – Range SBWY – Scenic byway SCEC – Socioeconomics SCNY – Scenery SIA – Special interest area SMA – Special management area SPEC – Species

USDA Forest Service
422
STND – Standard SUIT – Suitability TMBR – Timber TSTN – Transportation UC – Utility corridor WLDF – Wildlife WLDN – Wilderness WSR – Eligible wild and scenic river WTR – Watershed
Other Acronyms and Abbreviations BLM – Bureau of Land Management CCA – Candidate Conservation Agreement CCAA – Candidate Conservation Agreement with Assurances CCF – One hundred cubic feet CEQ – Council on Environmental Quality CFR – Code of Federal Regulations CPW – Colorado Parks and Wildlife DBH – Diameter at breast height FIA – Forest Inventory and Analysis FSH – Forest Service Handbook FSM – Forest Service Manual GIS – Geographic information system GMUG – Grand Mesa, Uncompahgre, and Gunnison National Forests HUC – Hydrologic unit code INFRA – Infrastructure (see glossary entry) MBF – One thousand board feet MTBS – Monitoring Trends in Burn Severity NAAQS – National Ambient Air Quality Standards NEPA – National Environmental Policy Act NPS – National Park Service NRV – Natural range of variation ROS – Recreation opportunity spectrum SCC – Species of conservation concern USDA – U.S. Department of Agriculture USDI – U.S. Department of Interior USFWS – U.S. Fish and Wildlife Service

GMUG National Forests Land Management Plan Draft Environmental Impact Statement: Volume 1
423
Glossary
A Access
Road or trail route over which a public agency claims a right-of-way for public use; a way of approach.
Adaptive management
An approach to natural resource management where actions are designed and executed and effects are monitored for the purpose of learning and adjusting future management actions, which improves the efficiency and responsiveness of management.
Administratively designated trail
The National Trails System Act of 1968 authorized creation of a national trail system consisting of national scenic, historic, and recreation trails. National recreation trails are administratively designated by the Secretary of Interior or the Secretary of Agriculture. See also congressionally designated trail.
Age class
Age class is one of the intervals, commonly 10 years, into which the age range of trees is divided for classification or use. Age class distribution refers to the location and/or proportionate representation of different age classes in a forest.
Air quality: Class I, II, and III areas
The area classification scheme established by Congress to facilitate implementation of the prevention of significant deterioration of the air quality provisions of the Clean Air Act.
Class I areas receive the highest degree of protection, with only a small amount of certain kinds of additional air pollution allowed.
Mandatory Class I areas were designated by Congress and include international parks, national wilderness areas or national memorial parks larger than 5,000 acres, or national parks larger than 6,000 acres, that were in existence (or authorized) on August 7, 1977. The 1990 amendments to the Clean Air Act specified that acreage added to these areas after 1977 must also receive Class I designation. Mandatory Class I areas may not be redesignated to any other classification.
Congress initially designated all other attainment areas as Class II and allowed a moderate increase in certain air pollutants.
No Class III areas, where a large amount of new air pollution would be allowed, were designated by Congress, but a process was established for redesignating Class II areas to the more protective Class I or the less protective Class III status. Only states or Native American governing bodies have authority to redesignate these areas, except as noted above.
Air quality related value
Resource that may be adversely affected by a change in air quality. The resource may include visibility or a specific scenic, cultural, physical, biological, ecological, or recreational resource identified for a particular area. Values are specific for each designated wilderness area. The air quality related value, or part thereof, that is the most responsive to, or the most easily affected by the type of air pollution in question, is known as a sensitive air pollution receptor. Resource

USDA Forest Service
424
concern thresholds are established for these air quality related values/sensitive receptors. See the Forest Service Wilderness Air Quality Monitoring webpage for more information.
Assessment
For the purposes of land management planning at 36 CFR 219, an assessment is the identification and evaluation of existing information to support land management planning. Assessments are not decision-making documents, but provide current information on select topics relevant to the plan area in the context of their borders.
At-risk species
A term used to collectively refer to the federally recognized threatened, endangered, proposed, and candidate species and species of conservation concern within the planning area.
Aquatic ecosystem
The stream channel, lake or estuary bed, water, and biotic communities and the habitat features that occur therein. (FSM 2526)
B Bark beetle
Bark beetles are members of the family Circulionidae, subfamily Scolytinae whose adults and larvae tunnel in the cambium region (bark and sapwood) of living, dying, and recently dead or felled trees.
Barrier
The National Wildfire Coordination Group defines barrier as an obstruction to the spread of fire, typically an area or strip devoid of combustible fuel. Barriers, often called fuelbreaks, may be natural or constructed, and may be used to stop or check fires that may occur or to provide a control line from which to work. A stream or rocky area might be considered a natural barrier, while examples of constructed barriers may include trails, agricultural fields, constructed firelines, etc.
Basal area
The cross-sectional area, in square feet, of a tree measured at breast height (4.5 feet). Basal area of an area is generally estimated in terms of square feet per acre.
Best management practice
A method or technique that has been determined to be the most effective and practical means of achieving an objective while making the optimum use of resources.
Bicycle
A device propelled solely by human power upon which a person or persons may ride on land, having one, two, or more wheels, except a manual wheelchair.
Big game
Those species of large mammals normally managed for sport hunting, generally including antelope, bighorn sheep, deer, elk, moose, and mountain goat.

GMUG National Forests Land Management Plan Draft Environmental Impact Statement: Volume 1
425
Biological diversity, or biodiversity
The full variety of life in an area, including the ecosystem, plant, and animal communities, species and genes, and the processes through which individual organisms interact with one another and with their environment.
Biotic
Typically refers to living organisms in their ecological rather than their physiological relations.
Browse
The buds, shoots, and leaves of woody plants eaten by livestock or wild animals.
C Canada lynx
The Canada lynx (Lynx canadensis) is a North American mammal of the cat family, Felidae, which ranges across Canada and into Alaska as well as some parts of the northern United States, including Colorado.
Candidate species
For species under the purview of the U.S. Fish and Wildlife Service, a species for which the agency possesses sufficient information on vulnerability and threat to support a proposal to list as endangered or threatened, but for which no proposed rule has yet been published.
Canopy
The uppermost spreading, branchy layer of a forest.
Canopy cover
The proportion of ground or water covered by the vertical projection of the outermost perimeter of the natural spread of foliage or plants.
Capability
The potential of an area to produce resources, supply goods and services, and allow resource uses under an assumed set of management practices and at a given level of management intensity. Capability depends on current management practices at a given level of management intensity. It is also dependent on existing resource and site conditions such as climate, slope, landform, soil, and geology, as well as the application of management practices, such as silviculture or the protection from fire, insects, and disease.
Carr
A type of waterlogged wooded terrain that typically represents a successional stage between swamp and the eventual formation of forest. Characteristic trees include alder and willow.
Channel
A passage, either naturally or artificially created, that periodically or continuously contains moving water, or that forms a connecting link between two bodies of water. River, creek, run, branch, and tributary are some of the terms used to describe natural channels, which may be single or braided. Canal and floodway are some of the terms used to describe artificial channels.

USDA Forest Service
426
Clearcut
1. A stand in which essentially all trees have been removed in one operation to produce an even-aged stand. Depending on management objectives, a clearcut may or may not have reserve trees left to attain goals other than regeneration (see regeneration method two-aged methods).
2. A regeneration or harvest method that removes essentially all trees in a stand. A minor live component of the stand may be retained for purposes other than regeneration. The retained trees, referred to as leave trees, should generally comprise less than 10 percent of the growing space of the stand.
Climax
The culminating stage in plant succession for a given site where the vegetation has reached a highly stable condition.
Coarse woody debris
Provides living spaces for a host of organisms and serves as long-term storage sites for moisture, nutrients, and energy. Coarse woody debris consists of any woody material greater than 3 inches in diameter and is derived from tree limbs, boles, roots, and large wood fragments and fallen trees in various stages of decay.
Code of Federal Regulations (CFR)
The listing of various regulations pertaining to management and administration of national forests and other Federal lands.
Collaboration
Working with someone to produce or create something.
Commercial thinning
An intermediate harvest of commercial-sized trees to meet a variety of management objectives including reducing stand density to improve tree growth, improving forest health, or to meet other stand structural or composition objectives.
Concern level 1
A scenery management system term, these areas generally include all visible areas from primary travel routes, use areas, and water bodies where there is high public interest in the scenic quality of the area.
Congressionally designated trail
The National Trails System Act of 1968 authorized creation of a national trail system consisting of national scenic, historic, and recreation trails. National scenic and national historic trails may only be designated by an act of Congress. See also administratively designated trail.
Connectivity
Ecological conditions that exist at several spatial and temporal scales that provide landscape linkages that permit the exchange of flow, sediments, and nutrients; the daily and seasonal movements of animals within home ranges; the dispersal and genetic interchange between populations; and the long-distance range shifts of species, such as in response to fluctuations in climate.

GMUG National Forests Land Management Plan Draft Environmental Impact Statement: Volume 1
427
Conservation watershed network
A specific set of subwatersheds (12-digit hydrologic unit codes) where prioritization for long-term conservation and preservation of Colorado River cutthroat trout and boreal toad occurs, specifically in areas where either non-native species are absent and/or where these native species (cutthroat trout and boreal toad) are self-sustaining. Evaluation of management activities in conservation watershed networks will follow appropriate levels of review prior to resource management.
Constraint
A qualification of the minimum or maximum amount of an output or cost that could be produced or incurred in a given time period.
Construction
The displacement of vegetation, soil, rock, and the installation of infrastructure involved in the process of building a complete, permanent road facility. The activities occur at a location or corridor that is not currently occupied by a road.
Coppice (Coppice with standards)
Coppice is a vegetation reproduction method with clear felling or clearcutting. Clear felling stimulates sprouting from the residual roots. Standards are selected overstory trees reserved for a longer rotation at the time each crop of coppice material is cut.
Corridor (utility or right-of-way)
A linear strip of land defined for the present or future location of transportation or utility right-of-way within its boundaries.
Council on Environmental Quality (CEQ)
An advisory council to the President established by the National Environmental Policy Act of 1969. It reviews Federal programs for their effects on the environment, conducts environmental studies, and advises the President on environmental matters.
Cover type
The dominant vegetation in an area—for example, aspen, ponderosa pine, or sedges.
Critical habitat
For a threatened or endangered species, (1) the specific areas within the geographical area occupied by the species, at the time it is listed under the Endangered Species Act, on which are found those physical or biological features (a) essential to the conservation of the species, and (b) which may require species management considerations or protection; and (2) specific areas outside of the geographical area occupied by the species at the time it is listed, upon a determination by the Secretary that such area are essential for the conservation of the species. Critical habitat is designated through rule making by the Secretary of the Interior or Commerce.
Cultural landscape
Cultural resources that represent the combined works of nature and humans.
Cultural resource
An object or definite location of human activity, occupation, or use identifiable through field survey, historical documentation, or oral evidence. Cultural resources are prehistoric, historic, archaeological, or architectural sites, structures, places, or objects and traditional cultural properties. Cultural resources include the entire spectrum of resources for which the Heritage

USDA Forest Service
428
Program is responsible, from artifacts to cultural landscapes, without regard to eligibility for listing on the National Register of Historic Places.
Culturally modified tree
A living tree that has been visibly altered or modified by Indigenous Peoples for use in their cultural traditions.
D Deciduous
A deciduous tree or shrub sheds its leaves annually.
Decommission
Demolition, dismantling, removal, obliteration, and/or disposal of a deteriorated or otherwise unneeded asset or component, including necessary cleanup work. This action eliminates the deferred maintenance needs for the fixed asset. Decommissioning roads includes activities that result in the stabilization and restoration of unneeded roads to a more natural state.
Degradation
To wear down by erosion, especially through stream action.
Demand
The amount of an output that users are willing to take at a specified price, time period, and condition of sale.
Designated campsite
A site designated and signed by the Forest Service for the purpose of overnight camping. These sites typically do not include amenities as developed campsites do, but are designated to concentrate use.
Designated road, trail, or area
A National Forest System road, National Forest System trail, or area on National Forest System lands designated for motor vehicle use and displayed on a motor vehicle use map. See also congressionally designated trail and administratively designated trail.
Designated wilderness
Designated wilderness refers to any area of land designated by Congress as part of the National Wilderness Preservation System that was established by the Wilderness Act of 1964.
Desired condition
A description of specific social, economic, and/or ecological characteristics of the plan area, or a portion of the plan area, toward which management of the land and resources should be directed. (36 CFR 219.7(e)(1)(i))
Developed recreation
Recreation that occurs at constructed developments such as campgrounds, picnic grounds, resorts, ski areas, trailheads, etc. Facilities might include roads, parking lots, picnic tables, toilets, drinking water, ski lifts, and buildings. Campgrounds and picnic areas are examples of developed recreation sites.

GMUG National Forests Land Management Plan Draft Environmental Impact Statement: Volume 1
429
Developed site
Developed recreation sites are relatively small, distinctly defined areas where facilities are provided for concentrated public use, such as campgrounds and picnic areas.
Diameter at breast height (dbh)
The diameter of a standing tree measured at a point 4 feet 6 inches from ground level on the uphill side.
Dispersed recreation
Outdoor recreation that is spread out over the land and in conjunction with roads, trails, and undeveloped waterways. Activities are typically day-use oriented and include hunting, fishing, boating, hiking, off-road vehicle use, cross-country skiing, motorbiking, and mountain climbing.
Disturbance
Any relatively discrete event in time that disrupts ecosystem, watershed, community, or species population structure and/or function and changes resources, substrate availability, or the physical environment.
Diversity
The distribution and abundance of different plant and animal communities and species within an area. This term is not synonymous with “biological diversity.”
Down or downed
A tree or portion of a tree that is dead and lying on the ground.
Downed woody material or debris
Woody material, from any source, that is dead and lying on the forest floor.
E Easement
A right afforded a person or agency to make limited use of another’s real property for access or other purposes.
Ecological conditions
The biological and physical environment that can affect the diversity of plant and animal communities, the persistence of native species, and the productive capacity of ecological systems. Ecological conditions include habitat and other influences on species and the environment. Examples of ecological conditions include the abundance and distribution of aquatic and terrestrial habitats, connectivity, roads, and other structural developments, human uses, and invasive species.
Ecological integrity
The quality or condition of an ecosystem when its dominant ecological characteristics (for example, composition, structure, function, connectivity, and species composition and diversity) occur within the natural range of variation and can withstand and recover from most perturbations imposed by natural environmental dynamics or human influences.

USDA Forest Service
430
Ecological process
The actions or events that link organisms (including humans) and their environment, such as disturbance, successional development, nutrient cycling, carbon sequestration, productivity, and decay.
Ecological sustainability
The capability of ecosystems to maintain ecological integrity.
Economic sustainability
The capability of society to produce and consume or otherwise benefit from goods and services, including contributions to jobs and market and nonmarket benefits.
Ecosystem
A spatially explicit, relatively homogeneous unit of the Earth that includes all interacting organisms and elements of the abiotic environment within its boundaries. Usually described in terms of its composition, structure, function, and connectivity.
Ecosystem services
The direct and indirect contributions of ecosystems to human well-being. They directly or indirectly support survival and quality of life. Ecosystem services can be categorized into types:
Provisioning services – products obtained from ecosystems such as food, fresh water, wood, fiber, genetic resources, and medicines.
Regulating services – benefits obtained from the regulation of ecosystem processes such as climate and natural hazards, water purification, waste management, pollination, and pest control.
Cultural services – nonmaterial benefits that people obtain from ecosystems such as spiritual enrichment, intellectual development, recreation, and aesthetic values.
Supporting services – ecosystem services that are necessary for the production of all other ecosystem services. Examples include biomass production, production of atmospheric oxygen, soil formation and retention, nutrient cycling, water cycling, and provisioning of habitat.
Edge
The place where plant communities meet or where successional stages or vegetative conditions within plant communities come together.
Endangered species
Any species that the Secretary of Interior or the Secretary of Commerce has determined is in danger of extinction throughout all or a significant portion of its range.
Endangered Species Act
Public Law 93-205, approved in 1973 and since amended, the Endangered Species Act provides for the conservation of ecosystems upon which threatened and endangered species of fish, wildlife, and plants depend.
Environmental impact statement
A formal public document prepared to analyze the impacts on the environment of a proposed project or action and released for comment and review. It is prepared first in draft or review form and later in final form. An environmental impact statement must meet the requirements of the National Environmental Policy Act, the Council on Environmental Quality guidelines, and directives of the agency responsible for the proposed project. An impact statement includes the

GMUG National Forests Land Management Plan Draft Environmental Impact Statement: Volume 1
431
following points: 1) the environmental impact of the proposed action, 2) any adverse impacts that cannot be avoided by the action, 3) the alternative courses of actions, 4) the relationships between local short-term use of the human environment and the maintenance and enhancement of long-term productivity, and 5) a description of the irreversible and irretrievable commitment of resources, which would occur if the action were accomplished.
Erosion
Detachment or movement of the land surface by water, wind, ice, gravity, or other geologic activity. Accelerated erosion is much more rapid than normal, natural, geologic erosion, primarily as a result of the influence of activities of man, animals, or natural catastrophes.
Even-aged management
The application of a combination of actions that results in the creation of stands in which trees of essentially the same age grow together. Managed even-aged forests are characterized by a distribution of stands of varying ages (and therefore, tree sizes throughout the forested area). The difference in age between trees forming the main canopy level of a stand generally does not exceed 20 percent of the age of the stand at harvest rotation age. Regeneration in a particular stand is obtained during a short period at or near the time that a stand has reached the desired age or size for regeneration and is harvested. Clearcut, shelterwood, or seed-tree cutting methods produce even-aged stands (36 CFR 219.3).
Executive order
An order of regulation issued by the President or some administrative authority under his or her direction.
F Facility
Structures needed to support the management, protection, and use of the national forests, including buildings, utility systems, dams, and other construction features. There are three types of facilities: recreation, administrative, and permittee.
Fen
Wetlands that develop where a relatively constant supply of groundwater to the plant rooting zone maintains saturated conditions most of the time and the water chemistry reflects the mineralogy of the surrounding and underlying soils and geologic materials (Groundwater-Dependent Ecosystem Inventory Field Guide WO-86a).
Fire regime
A description of historical fire conditions that influenced how vegetation communities evolved and were maintained over time, generally characterized by fire frequency (the average number of years between fires) and fire severity (the effect fire has on the dominant overstory vegetation). A given fire severity class is not characterized by the presence of only one kind of fire, but by the relative frequency of low, moderate, and high severity fire in an average burn.
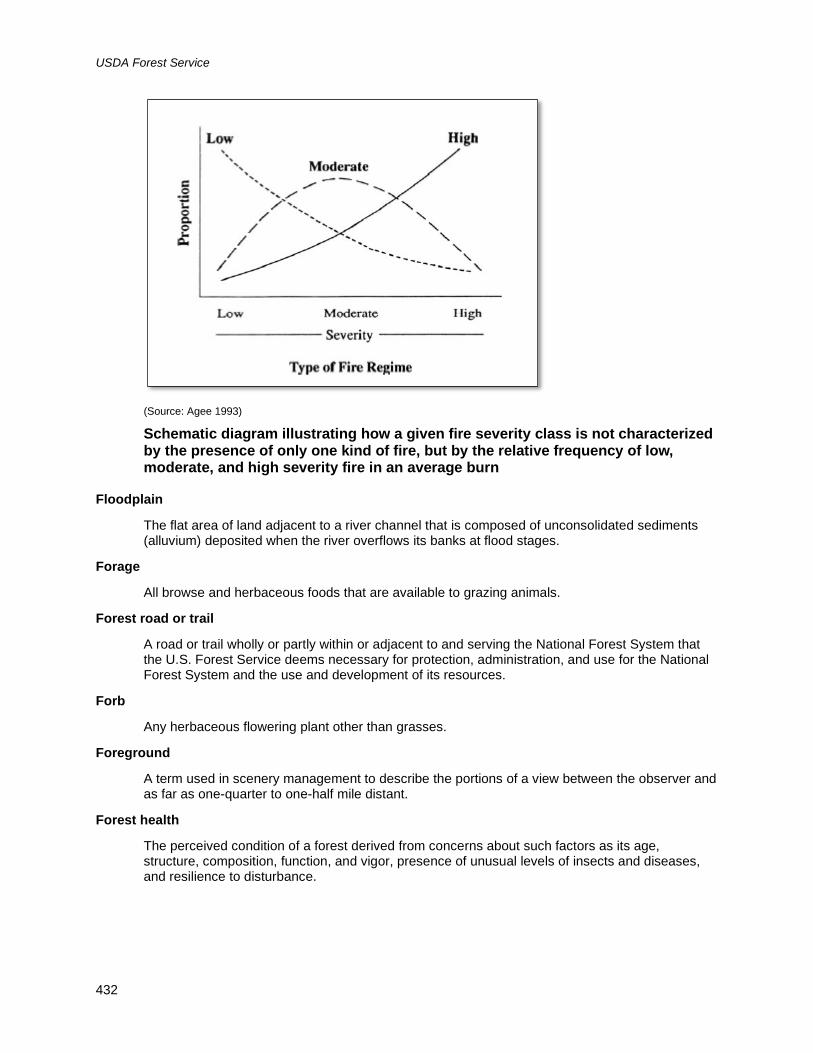
USDA Forest Service
432
(Source: Agee 1993)
Schematic diagram illustrating how a given fire severity class is not characterized by the presence of only one kind of fire, but by the relative frequency of low, moderate, and high severity fire in an average burn
Floodplain
The flat area of land adjacent to a river channel that is composed of unconsolidated sediments (alluvium) deposited when the river overflows its banks at flood stages.
Forage
All browse and herbaceous foods that are available to grazing animals.
Forest road or trail
A road or trail wholly or partly within or adjacent to and serving the National Forest System that the U.S. Forest Service deems necessary for protection, administration, and use for the National Forest System and the use and development of its resources.
Forb
Any herbaceous flowering plant other than grasses.
Foreground
A term used in scenery management to describe the portions of a view between the observer and as far as one-quarter to one-half mile distant.
Forest health
The perceived condition of a forest derived from concerns about such factors as its age, structure, composition, function, and vigor, presence of unusual levels of insects and diseases, and resilience to disturbance.

GMUG National Forests Land Management Plan Draft Environmental Impact Statement: Volume 1
433
Forest plan
Source of management direction for an individual national forest that specifies activity and output levels for a period of time. Management direction in the plan is based on the issues identified at the time of the plan’s development.
Forest plan revision
The process for revising a forest plan includes working identification of the need to change the plan based on the assessment, development of a proposed plan, consideration of the environmental effects of the proposal and preparation of a draft environmental impact statement, providing an opportunity for the public to comment on the proposed plan, providing an opportunity for the public to object before the proposal is approved, and finally, approval of the plan and preparation of the final environmental impact statement.
Fragmentation
A process that occurs wherever a large, contiguous habitat is transformed into smaller patches that are isolated from each other by a landscape matrix unlike the original. This matrix can differ from the original habitat in either composition or structure. The crucial point is that it functions as either a partial or total barrier to dispersal for species associated with the original habitat. A clear threat to population persistence occurs when fragmentation isolates pairs and populations, as opposed to fragmentation within the home range of individual pairs.
Fuel
Organic material that will support the start and spread of a fire: duff, litter, grass, weeds, forbs, brush, trees, and dead wood materials.
Fuel load
The amount of fuel present expressed quantitatively in terms of weight of fuel per unit area. This may be available (consumable) fuel or total fuel and is typically dry weight.
Fuels management
The manipulation of vegetation for the purpose of changing the characteristics of a fire as it burns.
Fuels reduction treatment
Manipulation or removal of fuels to lessen potential damage and resistance to control (includes mechanical and prescribed fire treatments). Fuels reduction treatments result in a change in the amount, configuration, and spacing of live and dead vegetation, with the purpose of creating conditions that result in more manageable fire behavior and reduced severity during wildland fires.
Fuelwood
Round, split, or sawed wood of general refuse material, which is cut into short lengths for burning as fuel.
G Game species
Any species of wildlife or fish for which hunting seasons and bag limits have been established, and are normally harvested by hunters and fishermen.

USDA Forest Service
434
General Mining Act of 1872
Provides for claiming and gaining title to locatable minerals on public lands. Also referred to as the “general mining laws” or “mining laws.”
Geographic area
A spatially contiguous land area identified within the planning area. A geographic area may overlap with management areas.
Geographic information system (GIS)
An information processing technology to input, store, manipulate, analyze, and display spatial resource data to support the decision-making processes of an organization. Generally, an electronic medium for processing map information.
Goal
A concise statement that describes a desired condition to be achieved sometime in the future. It is normally expressed in broad, general terms, and is timeless in that it has no specific date by which it is to be completed. Goal statements form the principal basis from which objectives are developed. (36 CFR 219.3)
Grass/forb
An early forest successional stage during which grasses and forbs are the dominant vegetation.
Groundwater
All water below the ground surface, including water in the saturated and unsaturated zones. (USDA Forest Service General Technical Report WO-86a, 2012)
Groundwater-dependent ecosystem
Communities of plants, animals, and other organisms whose extent and life processes are dependent on access to or discharge of groundwater.
Group selection
A method of regenerating uneven-aged stands in which trees are cut, in small groups, and new age classes are established. The width of groups is commonly approximately twice the height of the mature trees, with small openings providing suitable microclimates for shade-tolerant tree species to regenerate, and the larger openings providing suitable microclimates for more shade-intolerant tree species to regenerate.
Guideline
A constraint on project or activity decision-making that allows for departure from its terms, so long as the purpose of the guideline is met. Guidelines are intended to help achieve or maintain a desired condition or conditions, avoid or mitigate undesirable effects, or meet applicable legal requirements.
H Habitat
The natural environment of a plant or animal. In wildlife management, the major components of habitat are considered to be food, water, cover, and living space.

GMUG National Forests Land Management Plan Draft Environmental Impact Statement: Volume 1
435
Healthy ecosystem
An ecosystem in which structure and functions allow the maintenance of biological diversity, biotic integrity, and ecological processes over time.
Herbaceous
Of, denoting, or relating to herbs.
Hydrologic unit code (HUC)
A unique numeric code that is used to identify watersheds in the United States for the purpose of providing a standardized base for use by water-resource organizations in locating, storing, retrieving, and exchanging hydrologic data (Seaber et al. 1987).
I Ignition
The initiation of combustion.
IMPLAN
Input-output modeling software used to estimate the economic contribution or impact associated with the production of goods and services.
Indicator
A measurable attribute of social and ecological conditions that is used to answer monitoring questions and evaluate progress toward maintaining or achieving desired conditions.
INFRA
INFRA is a collection of web-based data entry forms, reporting tools, and GIS tools that enable the Forest Service to manage and report accurate information about the inventory of constructed features and land units as well as the permits sold to the public and to partners.
Infrastructure
The facilities, utilities, and transportation system needed to meet public and administrative needs for operation, e.g., buildings, roads, and power supplies.
Inholding
Land within the proclaimed boundaries of a national forest that is owned by a private citizen, an organization, or an agency.
Interdisciplinary team
A group of individuals with different training assembled to solve a problem or perform a task. The team is assembled out of recognition that no one scientific discipline is sufficiently broad enough to adequately solve the problem.
Intermittent stream
A stream or reach of stream channel that flows, in its natural condition, only during certain times of the year or in several years. Characterized by interspersed, permanent surface water areas containing aquatic flora and fauna adapted to the relatively harsh environmental conditions found in these types of environments.

USDA Forest Service
436
Interpretation
Explaining the meaning or significance of something.
Invasive species
Native species are those that have occurred, now occur, or may occur in a given area as a result of natural processes.
Exotic (a.k.a. non-native, foreign, or alien) species are those that live outside their native range and arrived there by human activity, either deliberate or accidental.
Invasive species have the ability to thrive and spread aggressively outside their natural range. They affect both aquatic and terrestrial areas and can be plants, vertebrates, invertebrates, and pathogens.
Invertebrate
An animal lacking a spinal column.
Irretrievable
Applies to losses of production, harvest, or uses of renewable natural resources. For example, some or all of the timber production from an area is irretrievably lost while an area is used as a road surface. If the use is changed, timber production can be resumed. The production lost is irretrievable, but the action is not irreversible.
Irreversible
Applies primarily to the use of nonrenewable resources, such as minerals or cultural resources, or to those factors that are renewable only over long time spans, such as soil productivity. Irreversible also includes loss of future options.
K Key area
A relatively small portion of a range selected because of its location, use or grazing value as a monitoring point for grazing use. It is assumed that key areas, if properly selected, will reflect the overall acceptability of current grazing management over the range. Society for Range Management. 1998. Glossary of terms used in range management, fourth edition. Edited by the Glossary Update Task Group, Thomas E. Bedell, Chairman. Used with permission.
L Land exchange
The conveyance of non-Federal land or interests to the United States in exchange for National Forest System land or interests in land.
Landscape
A defined area irrespective of ownership or other artificial boundaries, such as a spatial mosaic of terrestrial and aquatic ecosystems, landforms, and plant communities, repeated in similar form throughout such a defined area.

GMUG National Forests Land Management Plan Draft Environmental Impact Statement: Volume 1
437
Landscape scale
A heterogeneous land area composed of a cluster of interacting ecosystems that are repeated in similar form throughout. Landscapes vary in size, from many thousands of acres to only a few kilometers in diameter.
Landslide
The moderately rapid to rapid downslope movement of soil and rock that may or may not be saturated with water.
Late-successional forest
A stage of forest succession where the majority of trees are mature or overmature.
Large woody debris
Large pieces of relatively stable woody material located within the bankfull channel and appearing to influence bankfull flows.
Single – A single piece that has a length equal to or greater than 3 meters or two-thirds of the wetted stream width and 10 centimeters in diameter one-third of the way from the base.
Aggregate – Two or more clumped pieces, each of which qualifies as a single piece.
Rootwad – Rootmass or boles attached to a log less than 3 meters in length.
Leasable mineral - see Mineral, leasable.
Leave tree
A tree marked to be left standing in an area where it would otherwise be felled.
Linkage
Broader regions of connectivity that are important to facilitate the movement of multiple species and maintain ecological processes.
Litter
A surface layer of loose organic debris, consisting of freshly fallen or slightly decomposed organic materials.
Locatable mineral – see Mineral, locatable.
Lynx analysis unit
An area of at least the size used by an individual lynx, from about 25 to 50 square miles.
M Maintenance
The upkeep of the entire Forest Development Transportation Facility, including surfaces and shoulders, parking and side areas, structures, and such traffic control devices as are necessary for its safe and efficient use (36 CFR 212.1). Maintenance is not for the purpose of upgrading a facility, but to bring it to the originally constructed or subsequently reconstructed conditions.

USDA Forest Service
438
Maintenance level
The level of service provided by, and maintenance required for, a specific road. For more information, see the entry for road maintenance level.
Management action
An action humans impose on a landscape for the purpose of managing natural resources.
Management approach
Management approaches describe the principal strategies and program priorities the responsible official intends to employ to carry out projects and activities developed under the plan. They can convey a sense of priority and focus among objectives and likely management emphasis. They are optional plan content.
Management area
A land area identified within the planning are that has the same set of applicable plan components. A management area does not have to spatially contiguous.
Management direction
A statement of multiple-use and other goals and objectives, the associated management prescriptions, and standards and guidelines for attaining them. (36 CFR 219.3)
Management prescription
Management practices and intensity selected and scheduled for application on a specific area to attain multiple use and other goals and objectives. (36 CFR 219.3)
MBF
One thousand board feet of timber.
Mechanical treatment
Mechanical vegetation treatment is any activity undertaken to modify the existing condition of the vegetation accomplished with mechanical equipment.
Mechanized activity
An activity that incorporates the use of mechanical means of assistance or transport. This includes, but is not limited to, non-motorized carts, wheelbarrows, bicycles, mountain bikes, unicycles, tricycles, skateboards, mountain boards, and unmanned aerial systems/drones (considered mechanized transport as well as aircraft).
Memorandum of understanding
A legal agreement between the Forest Service and other agencies resulting from consultation between agencies that states specific measures the agencies will follow to accomplish a large or complex project. A memorandum of understanding is not a fund-obligating document.
Migratory Birds
Those species specified in the Migratory Bird Treaty Act.
Mineral
Locatable – Locatable minerals are minerals for which a statutory right exists to go onto public domain Federal lands open to mineral entry to stake (i.e., “locate”) a mining claim for the purpose of mineral prospecting, exploration, development, and extraction as granted under the General Mining Act of 1872, as amended. All National Forest System lands classified as public domain

GMUG National Forests Land Management Plan Draft Environmental Impact Statement: Volume 1
439
lands are open to prospecting and developing locatable minerals unless they have been appropriated, withdrawn, or segregated from mineral location and entry (16 U.S.C. 482). Locatable minerals include metallic minerals, nonmetallic/industrial minerals, and certain “uncommon variety” minerals having a unique or special quality giving it a higher value. Locatable metallic minerals include those minerals with a higher value including gold, silver, platinum, copper, lead, zinc, molybdenum, uranium, thorium, and tungsten. Locatable nonmetallic and/or industrial mineral resources include mineral commodities like fluorspar, mica, certain limestones and gypsum, tantalum, heavy minerals in placer form, and gemstones.
Leasable – Those minerals or materials designated as leasable under the Mineral Leasing Act of 1920, as amended, or by other specific legislation. They include coal, phosphate, asphalt, sulfur, potassium, sodium minerals, and oil and gas, and hardrock minerals on acquired National Forest System lands. Geothermal resources are also leasable under the Geothermal Steam Act of 1970.
Salable (or mineral materials) – A collective term to describe common varieties of sand, gravel, stone, pumice, cinders, clay, and other similar materials. Common varieties do not include deposits of those materials that may be locatable. In general, these minerals are widely spread and are relatively low in unit value. They are generally used for construction materials and for road building purposes.
Mineral entry
Claiming public lands administered by the Forest Service under the General Mining Act of 1872 for the purpose of exploiting minerals. May also refer to mineral exploration and development under the mineral leasing laws and Material Sale Act of 1947.
Mineral lease
A legal contract issued by the U.S. Department of Interior that conveys the right to explore for, develop and produce the specified mineral commodity for a specific period of time under certain agreed-upon terms and conditions.
Mining
Extraction of valuable minerals or other geologic materials from the earth.
Mitigate, or mitigation
To avoid, minimize, rectify, reduce, or compensate the adverse environmental impacts associated with an action.
Modification
A description in scenic quality objectives when activities may dominate, but must use naturally established form, color, and texture. These areas should appear natural when viewed in the background.
Monitoring
A systematic process of collecting information to evaluate effects of actions or changes in conditions or relationships.
Montane
Of or inhabiting mountainous country.
Mosaic
The intermingling of plant communities and their successional stages in such a manner as to give the impression of an interwoven design.

USDA Forest Service
440
Motor vehicle
Any self-propelled vehicle other than a vehicle operated on rails or any wheelchair or mobility device, including battery-powered chairs, designed solely for use by a mobility-impaired person for locomotion and suitable for use in an indoor pedestrian area.
Motor vehicle use map
A map reflecting designated roads, trails, and areas on a National Forest System administrative unit or ranger district.
Motorized activities
Activities that incorporate the use of a motor, engine, or other non-living power source. This includes, but is not limited to, machines such as aircraft, hovercraft, motorboats, automobiles, motor bikes, electric-assist bikes, snowmobiles, snow bikes, bulldozers, chainsaws, rock drills, and generators.
Motorized equipment
A machine that uses a motor, engine, or other nonliving power source. This includes, but is not limited to, machines such as chain saws, aircraft, snowmobiles, generators, motorboats, and motor vehicles. It does not include small battery or gas-powered, hand-carried devices such as shavers, wristwatches, flashlights, cameras, stoves, or other similar small equipment.
Motorized use
The designation of roads, trails, and areas that are open to motor vehicle use as specified in the Federal Register / Vol. 70, No. 216 / Wednesday, November 9, 2005 / 36 CFR Parts 212, 251, 261, Travel Management; Designated Routes and Areas for Motor Vehicle Use; Final Rule.
Multiple use
The management of all the various renewable surface resources of the national forests so that they are used in the combination that will best meet the needs of the American people; making the most judicious use of the land for some or all of these resources or related services over areas large enough to provide sufficient latitude for periodic adjustments in the use to conform to changing needs and conditions; that some lands will be used for less than all of the resources; and harmonious and coordinated management of the various resources, each with the other, without impairment of the productivity of the land, with consideration being given to the relative values of the various resources, and not necessarily the combination of uses that will give the greatest dollar return or the greatest unit output. (36 CFR 219.19)
N National Environmental Policy Act
A 1969 act declaring a national policy that encourages productive and enjoyable harmony between humankind and the environment, to promote efforts that will prevent or eliminate damage to the environment and biosphere and stimulate the health and welfare of humanity, to enrich the understanding of the ecological systems and natural resources important to the nation, and to establish a Council on Environmental Quality. (The Principal Laws Relating to Forest Service Activities, Agriculture Handbook No. 453, USDA Forest Service, 359 pp.) The National Environmental Policy Act process is an interdisciplinary process that concentrates decision-making around issues, concerns, alternatives, and the effects of alternatives on the environment. National Environmental Policy Act regulations are set out in Forest Service Handbook 1909.15.

GMUG National Forests Land Management Plan Draft Environmental Impact Statement: Volume 1
441
National Forest Management Act
A law passed in 1976 as an amendment to the Forest and Rangeland Renewable Resources Planning Act, requiring the preparation of regional guides and forest plans, and the preparation of regulations to guide that development.
National Forest System lands
All national forest lands reserved or withdrawn from the public domain of the United States, all national forest lands acquired through purchase, exchange, donation, or other means, the national grasslands and land utilization projects administered under title III of the Bankhead-Jones Farm Tenant Act (50 Stat. 525, 7 USC 1010-1012), and other lands, waters, or interests therein which are administered by the Forest Service or are designated for administration through the Forest Service as a part of the system. 16 USC 1609(a).
National Forest System road
A forest road other than a road that has been authorized by a legally documented right-of-way held by a state, county, or other local public road authority.
National Forest System trail
A forest trail other than a trail that has been authorized by a legally documented right-of-way held by a state, county, or other local public road authority. See also congressionally designated trail and administratively designated trail.
National Historic Preservation Act
Extends the policy in the Historic Sites Act to State and local historical sites as well as those of national significance, expands the National Register of Historic Places, establishes the Advisory Council on Historic Preservation and the State Historic Preservation Officers, and requires agencies to designate Federal Preservation Officers. Section 106 directs all Federal agencies to take into account the effects of their undertakings (actions, financial support, and authorizations) on historic properties included in or eligible for the National Register. Section 110 establishes inventory, nomination, protection, and preservation responsibilities for federally owned historic properties.
National minimum recreation site monitoring protocol
This protocol provides a consistent process for monitoring recreation sites. The process calculates an overall impact rating for each site by assessing and tallying ratings for the following factors: (a) groundcover disturbance of the main campsite (1-4); (b) impact to standing trees and roots (1-2); and, (c) the size of the disturbed area, including satellite tent pads and stock-holding areas (0-2). The sum of these ratings is the overall impact rating that ranges from 0 to 8. More information is available on the national minimum recreation site monitoring protocol webpage.
National Register of Historic Places
The Nation’s official list of cultural resources worthy of preservation. Authorized under the National Historic Preservation Act of 1966, the National Register is part of a national program to coordinate and support public and private efforts to identify, evaluate, and protect our historic and archaeological resources. Properties listed in the Register include districts, sites, buildings, structures, and objects that are significant in American history, architecture, archaeology, engineering, and culture. The National Register is administered by the National Park Service.
National quality standard
National quality standards define the corporate level of quality the Forest Service expects to provide the public at full service (forest plan) levels. Recreation site national quality standards are available online at http://fsweb.wo.fs.fed.us/rhwr/ibsc/rs-standards.shtml.

USDA Forest Service
442
Native American Graves Protection and Repatriation Act (NAGPRA)
Provides a process for museums and Federal agencies to return certain Native American cultural items—human remains, funerary objects, sacred objects, or objects of cultural patrimony—to lineal descendants, and culturally affiliated [Indian] Tribes and Native Hawaiian organizations. NAGPRA includes provisions for unclaimed and culturally unidentifiable Native American cultural items, intentional excavation, and unanticipated discovery of Native American cultural items on Federal and Tribal lands, and penalties for noncompliance and illegal trafficking. The Act requires agencies and museums to identify holdings of such remains and objects and to work with appropriate Native American groups toward their repatriation. Permits for the excavation and/or removal of “cultural items” protected by the Act require Tribal consultation, as do discoveries of “cultural items” made during activities on Federal or Tribal lands.
Natural range of variation
The variation of ecological characteristics and processes over scales of time and space that are appropriate for a given management application. In contrast to the generality of historical ecology, the natural range of variation concept focuses on a distilled subset of past ecological knowledge developed for use by resource managers; it represents an elicit effort to incorporate a past perspective into management and conservation decisions. The pre-European influenced reference period considered should be sufficiently long, often several centuries’, to include the full range of variation produced by dominant natural disturbance regimes such as fire and flooding and should also include short-term variation and cycles in climate. The natural range of variation is a tool for assessing the ecological integrity and does not necessarily constitute a management target or desired condition. The natural range of variation can help identify key structural, functional, compositional, and connectivity characteristics, for which plan components may be important for either maintenance or restoration of such ecological conditions.
Natural Resource Manager
A system of database tools for managing agency data across the Forest Service and for most of the agency’s natural resource business areas. Natural Resource Manager includes Forest Service ACtivity Tracking System (FACTS), Infrastructure (INFRA), Natural Resource Information System (NRIS), and Timber Information Manager (TIM) applications.
Non-motorized activities
Activities that do not incorporate the use of a motor, engine, or other nonliving power source.
O Objective
A concise, measurable, and time-specific statement of a desired rate of progress toward a desired condition or conditions. Objectives should be based on reasonably foreseeable budgets.
Old forest
The overstory is dominated by late seral or climax species of a certain age and size, and has other characteristics such as snags, canopy layers, downed woody material, and trees with rotten, dead, or broken tops.
Opening
Meadows, clearcuts, and other areas of vegetation that do not provide cover.

GMUG National Forests Land Management Plan Draft Environmental Impact Statement: Volume 1
443
Oshá
Oshá, also known as osha (Ligusticum porteri), is a perennial herb found in parts of the Rocky Mountains and northern Mexico, especially in the southwestern United States. Oshá is strictly a mountain plant that requires partial shade. It is most commonly found in deep, moist soils rich in organic material.
Output
The goods, end products, or services that are purchased, consumed, or used directly by people. Goods, services, products, and concerns produced by activities that are measurable and capable of being used to determine the effectiveness of programs and activities in meeting objectives.
Over-snow vehicle
A motor vehicle designed for use over snow that runs on a track or tracks and/or a ski or skis while in use over snow.
Overlay
Overlays are mapped and represent areas with more specific emphases and direction. These include scenic integrity objectives, desired recreation opportunity spectrum settings; designated trails; scenic byways; eligible wild and scenic river segments; and utility corridors. The direction for these areas builds on Forestwide and any underlying management area direction. An example of this is the designated trails overlay, which includes the Continental Divide National Scenic Trail. While Continental Divide National Scenic Trail direction would apply along the entirety of the trail in the GMUG, how the corridor is managed would be impacted by the underlying management area direction, which adjusts as this trail traverses through several management areas, including Designated Wilderness (1.1), Colorado Roadless Areas (3.1), Mountain Resorts (4.1), and General Forest (5).
Overstory
That portion of a plant community consisting of the taller plants on the site; the forest or woodland canopy.
P Parallel system route
Routes that run parallel to one another, typically jeep, all-terrain vehicle, or fire roads. Parallel routes allow for a variety of use types to occur side-by-side within a common corridor.
Party
A group of people readily recognized as traveling together.
Perennial stream
A stream or reach of a channel that flows continuously or nearly so throughout the year and whose upper surface is generally lower than the top of the zone of saturation in areas adjacent to the stream.
Planned ignition
The intentional initiation of a wildland fire by a hand-held, mechanical, or aerial device where the distance and timing between ignition lines or points and the sequence of igniting them is determined by environmental conditions (weather, fuel, topography), firing technique, and other factors that influence fire behavior and fire effects (see prescribed fire).

USDA Forest Service
444
Planning period
The lifetime of the plan. The time interval within the planning horizon that is used to show incremental changes in yields, costs, effects, and benefits.
Planning Rule
The 2012 Planning Rule provides the overarching framework for individual forests and grasslands in the National Forest System to use in developing, amending, and revising land management plans, which are also known as forest plans. The planning rule identifies a framework for revising land management plans that consists of three phases: assessment, plan revision, and monitoring.
The Forest Service is required by statute to have a national planning rule: the Forest and Rangeland Renewable Resources Planning Act of 1974, as amended by the National Forest Management Act of 1976, requires the Secretary of Agriculture to issue regulations under the principles of the Multiple-Use Sustained-Yield Act of 1960 for the development and revision of land management plans.
Plant community
Any assemblage of plants that occur in the same area and form a distinct ecological unit.
Precommercial thinning
The selective felling, deadening, or removal of trees from a young stand maintaining a specific stocking or density stand management.
Prescribed fire
A wildland fire originating from a planned ignition to meet specific objectives identified in a written, approved, prescribed fire plan for which National Environmental Policy Act requirements (where applicable) have been met prior to ignition (see planned ignition).
Prescription
A planned sequence of treatments designed to change current stand structures to one that meets management goals
Primitive road
A road constructed with no regard for grade control or designed drainage, sometimes by merely repeatedly driving over an area. These roads are of single lane, typically with native surfacing, and sometimes usable with 4-wheel-drive vehicles only.
Priority watershed
The 2012 Planning Rule requires land management plans to: (i) Identify watershed(s) that are a priority for maintenance or restoration; (36 CFR 219.7(f)(1)). Identification of priority watersheds is done to focus effort on the integrated restoration of watershed conditions in these areas. Priority watersheds are those watersheds where plan objectives for restoration would concentrate on maintaining or improving watershed condition. However, selection of priority watersheds does not preclude watershed restoration efforts in other areas. The identification of priority watersheds is intended to be helpful to Forest Service managers as they schedule work after plan approval, especially in circumstances of limited budgets and resources. Changes as to which watersheds in the plan are “priority” are made by administrative change (sec. 21.5 of FSH 1909.12) (USDA Forest Service 2012a).
Productive
The ability of an area to provide goods and services and sustain ecological values.

GMUG National Forests Land Management Plan Draft Environmental Impact Statement: Volume 1
445
Project record
The documents and materials considered in the making of a forest plan, plan revision, or plan amendment. Also known as the planning record.
Projected timber sale quantity
The estimated quantity of timber meeting applicable utilization standards that is expected to be sold during the plan period. As a subset of the projected wood sale quantity, the projected timber sale quantity includes volume from timber harvest for any purpose for all lands in the plan area based on expected harvests that would be consistent with the plan components. The projected timber sale quantity is also based on the planning unit’s fiscal capability and organizational capacity. projected timber sale quantity is not a target nor a limitation on harvest, and is not an objective unless the responsible official chooses to make it an objective in the plan (FSH 1909.12 CH 60.5).
Projected wood sale quantity
The estimated quantity of timber and all other woods products expected to be sold from the plan area for the plan period. The projected wood sale quantity consists of the projected timber sale quantity as well as other woody material such as fuelwood, firewood, or biomass that is also expected to be available for sale. The projected wood sale quantity includes volume from timber harvest for any purpose based on expected harvests that would be consistent with the plan components. The projected wood sale quantity is also based on the planning unit’s fiscal capability and organizational capacity. projected wood sale quantity is not a target nor a limitation on harvest, and is not an objective unless the responsible official chooses to make it an objective in the plan (FSH 1909.12 CH 60.5).
Proposed action
In terms of the National Environmental Policy Act, the project, activity, or decision that a Federal agency intends to implement or undertake, which is the subject of an environmental impact statement or environmental assessment.
Public access
Generally refers to a road or trail route over which a public agency claims right-of-way for public use.
Public participation
Meetings, conferences, seminars, workshops, tours, written comments, responses to survey questionnaires, and similar activities designed and held to obtain comments from the public about Forest Service planning.
R Range allotment
Rangelands are managed as allotments and pastures. An allotment is a designated area of land available for permitted livestock grazing. Grazing is authorized for a specified number and kind of livestock. It is the basic land unit used to facilitate management of the range resource on National Forest System lands administered by the Forest Service.

USDA Forest Service
446
Range condition
The state of the plant community on a range site in relation to the potential natural community or the desired plant community for that site. It is typically rated in the general category of satisfactory or unsatisfactory.
Rangeland
Land on which vegetation is predominantly grasses, forbs, or shrubs suitable for grazing or browsing. Rangeland may include some forest and barren land.
Ranger district
An administrative subdivision of a national forest that is supervised by a district ranger who reports to the forest supervisor.
Reclamation
Returning disturbed lands to a form and productivity that will be ecologically balanced and in conformity with a predetermined land management plan.
Reconstruction
Activities performed on an existing road or other facility to restore it to a specified standard.
Recreation opportunity spectrum
Also known as recreation setting (see entry below). Allocations that identify a variety of recreation experience opportunities categorized into six classes on a scale from primitive to urban. Each class is defined in terms of the degree to which it satisfies certain recreation experience needs, based on the extent to which the natural environment has been modified, the type of facilities provided, the degree of outdoor skills needed to enjoy the area, and the relative density of recreation use. The six classes are:
Primitive – Very high probability of experiencing solitude, self-reliance, and challenge; natural landscape with natural processes allowed to function; very low interaction between users; restrictions and controls not evident; access limited; generally cross-country travel.
Semi-primitive non-motorized – Good probability of experiencing solitude, self-reliance, and challenges; natural primitive landscapes; some evidence of users; minimum subtle controls; access by low standard trails and cross-country travel; natural processes allowed to function with subtle vegetative alterations. Managed for non-motorized use.
Semi-primitive motorized – Moderate probability for self-reliance and experiencing solitude away from travelways (roads/trails); risk associated with motorized equipment; predominantly natural landscapes; low concentration of users and interaction by users along travelways; minimum but subtle restrictions; vegetative alterations visually blend with the landscape. Existing routes are designated for off highway vehicles and other high clearance vehicles. Mountain bikes and other mechanized equipment are present.
Roaded natural – Low opportunity to avoid other users; little opportunity for risk or challenge; substantial modified landscapes; moderate evidence and interaction of users; controls and restrictions present; variety of motorized users and access; various shapes and sizes of vegetative alterations that blend with the landscape. The road system is well defined and can accommodate sedan travel.
Rural – Good opportunity to affiliate with others; facilities important; self-reliance of little importance; altered landscapes but attractive; high interaction among users; obvious and prevalent controls; extensive motorized use; vegetation maintained. Rural settings represent most developed recreation sites.
GMUG National Forests Land Management Plan Draft Environmental Impact Statement: Volume 1
447
Urban – Opportunity to affiliate with others important; outdoor skills associated with competitive events; landscapes extensively changed with dominant structures; large numbers of user interactions; intensive controls are numerous; motorized use prevalent, including mass transit; vegetation planted and maintained. Highly developed ski areas and resorts are examples of a typical urban setting on National Forest System lands.
Recreation setting
The social, managerial, and physical attributes of a place that, when combined, provide a distinct set of recreation opportunities. The Forest Service uses the recreation opportunity spectrum to define recreation settings and categorize them into six distinct classes: primitive, semi-primitive non-motorized, semi-primitive motorized, roaded natural, rural, and urban.
Recreation site
A defined, public recreation area. The Forest Service uses two categories for recreation sites: dispersed and developed. Both types may have improvements needed to protect resources such as signs, road closure devices, bear resistant food storage devices, and/or sanitation facilities. Some recreation sites are designed and managed for overnight use and some are designed and managed for day-use only (e.g., interpretive signs at roadside pull-outs, trailheads at roadside pull-outs or at road closures, picnic areas or boat launches that are closed at night, ski areas that do not have overnight lodging).
Developed sites have agency improvements made out of manmade materials that are intended to provide for public recreation and user comfort/convenience. Examples on National Forest Service lands include, but are not limited to, ski areas, campgrounds, sites with cabins, huts, lodges, recreation residences, visitor centers, and trailheads.
Dispersed sites have minimal to no agency improvements made out of manmade materials. Dispersed sites may include outfitter camps or other primitive camping spots along a road, trail, or water body, or at a road closure.
Reforestation
Management activities used to increase or accelerate the establishment of forest cover to meet resource objectives.
Regeneration
Natural – A group or stand of young trees created from germination of seeds from trees on the site or sprouting from trees on the site.
Artificial – A group or stand of young trees created by direct seeding or by planting seedlings or cuttings.
Regeneration harvest
Timber harvest system intended to create a new age class (see regeneration method).
Regeneration method
A cutting procedure by which a new age class is created. The major methods are clearcutting, seed-tree, shelterwood, selection, and coppice. Regeneration methods are grouped into four categories: coppice, even-aged, two-aged, and uneven-aged.
Region
An administrative unit within the National Forest System based on geographical location. Each of the nine Forest Service regional offices is supervised by a regional forester. The Rio Grande National Forest is part of the Rocky Mountain Region, also known as Region 2. The Rocky

USDA Forest Service
448
Mountain Regional Office is strategically located in Lakewood, Colorado, between the foothills of the Rocky Mountains and downtown Denver.
Rehabilitation
1) Actions taken to protect or enhance site productivity, water quality, or other values for a short period of time.
2) A short-term scenic condition objective used to restore landscapes containing undesirable visual or other resource impacts to the desired scenic or other acceptable quality level.
Research natural area
Designated areas of land established by the Chief of the Forest Service under 36 CFR 251.23 for research and educational purposes and to typify important forest and range types of the national forest, as well as other plant communities that have special or unique characteristics of scientific interest and importance.
Resilience
The ability of an ecosystem and its component parts to absorb, or recover from the effects of disturbances through preservation, restoration, or improvement of its essential structures and functions and redundancy of ecological patterns across the landscape.
Resistance
The capacity of ecosystems to tolerate disturbances without exhibiting significant change in structure and composition. The concepts of resistance and resilience are jointly referred to as resilience.
Responsible official
The Forest Service employee who has the delegated authority to make a specific decision. For example, the forest supervisor will select the preferred alternative for the forest plan.
Restore/restoration
Assisting the recovery of an ecosystem that has been degraded, damaged, or destroyed. It is an intentional activity that initiates or accelerates the recovery of an ecosystem with respect to its health, integrity, and sustainability.
Revegetation
The reestablishment and development of a plant cover. This may take place naturally through the reproductive processes of the existing flora or artificially through the direct action of reforestation or reseeding.
Right-of-way
Land authorized to be used or occupied for the construction, operation, maintenance, and termination of a project or facility passing over, upon, under, or through such land (36 CFR 251.51). The privilege that one person or persons particularly described may have of passing over the land of another in some particular line (FSH 2709.12 05 10).
Riparian area
A riparian ecosystem is a transition area between the aquatic ecosystem and the adjacent terrestrial ecosystem, identified by soil characteristics or distinctive vegetation communities that require free or unbound water (FS-990A). Riparian areas may be associated with lakes, reservoirs, estuaries, hot springs, marshes, streams, fens, wet meadows, and intermittent or permanent streams where free and unbound water is available. This habitat is transitional

GMUG National Forests Land Management Plan Draft Environmental Impact Statement: Volume 1
449
between true bottomland wetlands and upland terrestrial habitats, and while associated with watercourses, may extend inland or upland for considerable distances.
Riparian management zone
Riparian management zones are delineated as follows (See FW-STND-RMGD-07):
Category 1: Perennial and intermittent streams: consist of the stream and the area on either side of the stream extending from the edges of the active channel to the top of the inner gorge, or to the outer edges of riparian vegetation, or 100-feet slope distance (200 feet, including both sides of the stream channel), whichever is greatest.
Category 2: Fens, wetlands, lakes/ponds and reservoirs: consist of the body of water or wetland and the area to the outer edges of the riparian vegetation; or to the extent of the seasonally saturated soil; or 100-feet slope distance from the edge of the wetland or the maximum pool elevation of constructed pond and reservoirs with shorelines composed of riparian vegetation, whichever is greatest.
Road
A motor vehicle route more than 50 inches wide, unless identified and managed as a trail.
Road maintenance level
Defines the level of service provided by, and maintenance required for, a specific road, consistent with road management objectives and maintenance criteria (FSH 7709.58, section 12.3). More information is available in “Guidelines for Road Maintenance Levels” at https://www.fs.fed.us/t-d/pubs/pdf/11771811.pdf. The maintenance levels are:
Maintenance level 1 – Intermittent service roads, also known as administrative use only roads. Not open to public motorized use. Basic custodial maintenance is performed.
Maintenance level 2 – Roads open for public use by high-clearance vehicles, minor traffic, no warning signs. Passenger car traffic is not a consideration.
Maintenance level 3 – Roads open for public use and maintained for a prudent driver in a standard passenger car, low speed travel, warning signs provided. User comfort and convenience are not considered priorities.
Maintenance level 4 – Roads that provide a moderate degree of user comfort and convenience at moderate travel speeds, single or double lane, aggregate or paved surface.
Maintenance level 5 – Roads that provide a high degree of user comfort and convenience, single or double lane, generally paved surface, or aggregate-surfaced with dust abatement.
Rocky Mountain Region
The Forest Service organizational unit consisting of Colorado, Wyoming, South Dakota, Nebraska, and Kansas. Also called Region 2.
Rotation
The planned number of years between the formation of a generation of trees and its final cutting at a specified stage of maturity.

USDA Forest Service
450
S Sacred site
Per Executive Order 13007 – any specific, discrete, narrowly delineated location on Federal land that is identified by an [Indian] Tribe, or [Indian] individual determined to be an appropriately authoritative representative of an [Indian] religion, as sacred by virtue of its established religious significance to, or ceremonial use by, an [Indian] religion; provided that the [Indian] Tribe or appropriately authoritative representative of an Indian religion has informed the agency of the existence of such a site.
Salvage harvest
The removal of dead trees or trees damaged or dying because of injurious agents, other than competition, that recovers economic value that would otherwise be lost, or because the removal of the dead or damaged trees contributes to achieving plan desired conditions or objectives.
Sanitation harvest
Intermediate harvest to remove trees to improve stand health by stopping or reducing the actual or anticipated spread of insects and diseases.
Sawtimber
Larger diameter trees of sufficient size and quality to be manufactured into dimensional lumber products. Species and minimum diameters of sawtimber trees are established by regional timber markets.
Scale
The degree of resolution at which ecological processes, structures, and changes across space and time are observed and measured.
Scenic character
A combination of the physical, biological, and cultural images that gives an area its scenic identity and contributes to its sense of place; scenic character provides a frame of reference from which to determine scenic attractiveness and to measure scenic integrity.
Scenic condition
Measurable standard for scenic resource management based on the acceptable degree of alteration of the characteristic landscape. The acceptable degree of alternation for a given landscape is dictated by the area’s scenic integrity objective.
Scenic integrity objective
Scenic integrity objectives are the minimum degree to which desired scenic character attributes are to remain intact (Agriculture Handbook 701, page 20 and 5-9). Four nationally defined scenic integrity objectives serve as desired conditions, and one (very low) is used only in describing existing (not desired) conditions. Each is defined below.
Very high – The landscape is intact with only minor changes from the valued attributes described in the scenic character.
High – Management activities are unnoticeable, and the landscape character appears unaltered.
Moderate – Management activities are noticeable but are subordinate to the landscape character. The landscape appears slightly altered.

GMUG National Forests Land Management Plan Draft Environmental Impact Statement: Volume 1
451
Low – The landscape appears altered. Management activities are evident and sometimes dominate, but are designed to blend with surroundings by repeating form, line, color, and texture of attributes described in the scenic character.
Very Low - Used to describe landscapes that are heavily altered and in which the valued attributes described in the scenic character are not evident. Very low is used only to describe the existing scenic integrity. It is NOT used as a scenic integrity objective or desired condition.
Scenic resource
The composite of basic physiographic features, patterns, and land-use effects that typify a land unit and influence the scenic appeal the unit may have for visitors.
Sedge
A grass-like plant with triangular stems and inconspicuous flowers, typically growing in wet ground.
Sediment
Material suspended in water or that has been deposited in streams and lakes.
Seedling/sapling
A forest successional stage in which trees are less than 5 inches in diameter.
Seral
The gradual supplanting of one community of plants by another, the sequence of communities being termed a sere and each stage seral (successional).
Seral stage
A phase in the sequential development of a climax community.
Shrub/seedling
A forest successional stage in which shrubs and seedling trees are the dominant vegetation.
Silviculture
The art and science of controlling the establishment, growth, composition, health, and quality of forests and woodlands to meet the diverse needs and values of landowners and society on a sustainable basis.
Site capability (also known as ecological response unit)
A unit of land that is homogeneous in character such that similar units will respond in the same way to disturbance or manipulation. Syn. ecological site, ecological type. Society for Range Management. 1998. Glossary of terms used in range management, fourth edition. Edited by the Glossary Update Task Group, Thomas E. Bedell, Chairman. Used with permission.
Skidding
Moving logs by sliding from stump to a collecting point.
Slope
The amount or degree of deviation from the horizontal or vertical.

USDA Forest Service
452
Slope stability
The resistance of any inclined surface, as the wall of an open pit or cut, to failure by sliding or collapsing.
Snag
A standing, dead tree.
Social sustainability
The capability of society to support the network of relationships, traditions, culture, and activities that connects people to the land and to one another and supports vibrant communities.
Soil productivity
The capacity of a soil to support the growth of specified plants, plant communities, or a sequence of plant communities. Soil productivity may be expressed in terms of volume or weight/unit, area/year, percentage of plant cover, or other measures of biomass accumulation.
Soil survey
The systematic examination, description, classification, and mapping of soils in an area.
Spatial
Referring to the distance, interval, or area between or within things.
Special area
Area designated by law (by Congress) or statute or through administrative process (by the Secretary of Agriculture or a Forest Service official).
Special interest area
A type of management area designated by the forest supervisor for scenic, geologic, botanic, zoologic, paleontological, archaeological, historic, scenic, or recreational values, or combinations of these values. A special interest area is a type of special area designated through administrative process. Special interest areas are addressed in Forest Service Manuals 2360 and 2372.
Special use authorization or permit
A permit, term permit, lease, or easement that allows occupancy, use, rights, or privileges of National Forest System land.
Species
Organisms that successfully reproduce among themselves and cannot reproduce successfully with other organisms.
Stand
A community of trees or other vegetation sufficiently uniform in composition, constitution, age, spatial arrangement, or condition to be distinguishable from adjacent communities. In silviculture/vegetation management, a distinct silvicultural or management unit.
Standards and guidelines
Standard – a mandatory constraint on project and activity decision-making, established to help achieve or maintain the desired condition or conditions, to avoid or mitigate undesirable effects, or to meet applicable legal requirements. (36 CFR 219.7(e)(1)(iii))
GMUG National Forests Land Management Plan Draft Environmental Impact Statement: Volume 1
453
Guideline – a constraint on project and activity decision-making that allows for departure from its terms, so long as the purpose of the guideline is met. Guidelines are established to help achieve or maintain a desired condition or conditions, to avoid or mitigate undesirable effects, or to meet applicable legal requirements. (36 CFR 219.7(e)(1)(iv))
Guidelines are similar to standards in that they are design criteria for projects and activities to help achieve the desired conditions and objectives, or at least to ensure that projects or activities do not foreclose their maintenance or attainment. Guidelines differ from standards in that they provide flexibility for compliance, while standards are concrete limitations.
Stewardship
Caring for the land and associated resources and passing healthy ecosystems to future generations.
Stipulation
A provision that modifies standard lease rights and is attached to and made a part of the lease.
Stocking
Live trees per acre needed to meet resource objectives as identified in the forest plan or through other management decisions.
Structural stage
Any of several developmental stages of tree stands described in terms of tree age or size and density. In general, the habitat structural stages developed by the Forest Service Rocky Mountain Region staff are used. This classification has different structural stages based on tree size (diameter at breast height) and percentage of tree canopy cover.
Structure
The horizontal and vertical physical elements of forests and grasslands and the spatial interrelationships of ecosystems.
Substrate
The rock material varying in size from boulders to silt that is found in the bed of rivers and streams.
Succession
The sequential process of long-term plant community change and development that occurs following a disturbance.
Successional stage (seral stage)
The relatively transitory communities that replace one another during development to potential natural community.
Suitable timber
Area that defines where timber harvest for the purpose of timber production may occur, subject to subsequent project-level, site-specific data and analysis. Timber harvest for purposes other than timber production may also occur here. Scheduled timber harvests occur on these lands, among other active management activities, to contribute to Forestwide desired conditions and multiple use goals.
Suppression
The work of extinguishing a fire or confining fire spread.

USDA Forest Service
454
Surface water
Water on the surface of the earth.
Surface-disturbing activities
Surface-disturbing activities are those that normally result in more than negligible (i.e., immeasurable, not readily noticeable) disturbance to vegetation and soils and accelerate the natural erosive process. Surface disturbances could require reclamation and normally involve use and/or occupancy of the surface, causing disturbance to soils and vegetation. They include, but are not limited to: the use of mechanized earth-moving and logging equipment; skid trails; truck-mounted drilling and geophysical exploration equipment off designated routes; off-road vehicle travel in areas designated as limited or closed to off road vehicle use; construction of infrastructure such as communication sites and oil and gas wells and/or pads; major recreation sites; new trail and temporary road construction; and use of pyrotechnics and explosives. Surface disturbance is not normally caused by casual-use activities. Activities that are not normally considered surface disturbing include, but are not limited to: livestock grazing, cross-country hiking, minimum impact filming, vehicular travel on designated routes, and minimum impact emergency response activities such as construction of fireline using hand tools as a tactic for suppression and management of unplanned fire.
Sustainability
The capability to meet the needs of the present generation without compromising the ability of future generations to meet their needs.
Sustained yield
The amount of renewable resources that can be produced continuously at a given intensity of management.
“Sustained yield of the several products and services” means the achievement and maintenance in perpetuity of a high-level annual or regular periodic output of the various renewable resources of the national forests without impairment of the productivity of the land. (36 CFR 219.3)
Sustained yield limit
(FSH 1909.12 CH 60.5) - The amount of timber, meeting applicable utilization standards that can be removed from a forest annually in perpetuity on a sustained yield basis. It is the volume that could be produced in perpetuity on lands that may be suitable for timber production. Calculation of the limit includes volume from lands that may be deemed not suitable for timber production after further analysis during the planning process. The calculation of sustained yield limit is not limited by land management plan desired condition, other plan components, or the planning unit’s fiscal capability and organizational capacity. The sustained yield limit is not a target but is a limitation on harvest, except when the plan allows for a departure.
T Temporary road
A road necessary for emergency operations or authorized by contract, permit, lease, or other written authorization. Temporary roads are not included in a national forest’s transportation atlas.
Terrestrial ecosystem
A plant community that is not dependent on a perpetual source of water to grow.

GMUG National Forests Land Management Plan Draft Environmental Impact Statement: Volume 1
455
Thinning
Intermediate treatment to reduce stand density or stocking levels to meet a variety of management objectives including increasing tree growth or vigor, improving stand health or species composition, reducing fuels, or improving wildlife habitat.
Threatened and endangered species
An endangered species is a plant or animal species listed under the Endangered Species Act that is in danger of extinction throughout all or a significant portion of its range. A threatened species is any species that is likely to become an endangered species within the foreseeable future throughout all or a significant portion of its range.
Threshold
The point or level of activity beyond which an undesirable set of responses begins to take place within a given resource system.
Timber harvest
The removal of trees for wood fiber utilization and other multiple-use purposes.
Timber production
The purposeful growing, tending, harvesting, and regeneration of regulated crops of trees to be cut into logs, bolts, or other round sections for industrial or consumer use.
Managing land to provide commercial timber products on a regulated basis with planned, scheduled entries.
Timber sale
Selling of forest products with monetary value to meet forest plan objectives, including providing raw material for both commercial manufacturing and personal use.
Trail
A route 50 inches or less in width, or a route greater than 50 inches wide that is identified and managed as a trail.
Travel management
Providing for safe, environmentally responsible, and customer-responsive movement of vehicles and people to and through public lands. Travel management decisions are not made by this forest plan.
U Understory
That portion of a plant community growing underneath the taller plants on the site.
Uneven-aged management
The application of a combination of actions needed to simultaneously maintain continuous high-forest cover, recurring regeneration of desirable species, and orderly growth and development of trees through a range of diameter or age classes to provide a sustained yield of forest products. Cutting is typically regulated by specifying the number or proportion of trees of particular sizes to retain within each area, thereby maintaining a planned distribution of size

USDA Forest Service
456
classes. Cutting methods that develop and maintain uneven-aged stands are single-tree and group selection. (36 CFR 219.3)
Unplanned ignition
The initiation of a wildland fire by lightning, volcanoes, or unauthorized or accidental human-caused fire (see wildland fire).
V Vegetation management
Activities designed primarily to promote the health of forest vegetation in order to achieve desired results. When vegetation is actively managed, it is manipulated or changed by humans to produce desired results. Where active management of vegetation is required, techniques are based on the latest scientific research and mimic natural processes as closely as possible. Vegetation management is the practice of manipulating the species mix, age, fuel load, and/or distribution of wildland plant communities within a prescribed or designated management area in order to achieve desired results.
Viewshed
The visible portion of the landscape seen from viewpoints. Viewpoints can include residences, recreational facilities, and travelways.
W Water right
A property right granted by a State for the use of a portion of the public’s surface water resource obtained under applicable legal procedures.
Weed management area
A cooperatively identified area that facilitates land managers and owners to manage a common weed problem. The formation of a weed management area replaces jurisdictional boundaries that are barriers to weed management programs in favor of natural or more logical boundaries that facilitate weed management and control.
Watershed
An area of land with a characteristic drainage network that contributes surface or groundwater to the flow at that point; a drainage basin or a major subdivision of a drainage basin.
Wetlands
Those areas that are inundated or saturated by surface or groundwater at a frequency and duration sufficient to support and that, under normal circumstances, do support, a prevalence of vegetation typically adapted for life in saturated soil conditions. Wetlands generally include swamps, marshes, bogs, and similar areas.” (40 CFR 122. 2)
Wild, scenic, and recreational rivers
A river or section of a river designated under the 1968 Wild and Scenic Rivers Act as wild, scenic, or recreational. Rivers may be designated by Congress or, if certain requirements are met, the Secretaries of Interior or Agriculture, as appropriate. Once designated under the Act, rivers
GMUG National Forests Land Management Plan Draft Environmental Impact Statement: Volume 1
457
receive special management direction that ensures the maintenance of the free-flowing nature and the outstanding natural, cultural, and recreational values of the river segment. Under the Act, river segments are required to be classified as wild, scenic, or recreational:
Wild Rivers – Those rivers or sections of rivers that are free of impoundments and generally inaccessible except by trail, with watersheds or shorelines essentially primitive and waters unpolluted. These represent vestiges of primitive America.
Scenic Rivers – Those rivers or sections of rivers that are free of impoundments, with shorelines or watersheds still largely primitive and shorelines largely undeveloped, but accessible in places by roads.
Recreational Rivers – Those rivers or sections of rivers that are readily accessible by road or railroad, that may have some development along their shorelines, and that may have undergone some impoundment or diversion in the past.
Wilderness
All lands included in the National Wilderness Preservation System by public law; generally defined as undeveloped Federal land retaining its primeval character and influence without permanent improvements or human habitation.
Wildland fire
A general term describing any nonstructural fire that occurs in the wildland. Wildland fires are categorized into two distinct types:
Wildfires – Unplanned ignitions or prescribed fires that are declared wildfires
Prescribed fires – Planned ignitions.
Wildland fire use
Management of wildland fire to meet resource objectives specified in land and resource management plans.
Wildland-urban interface
The line, area, or zone where structures and other human developments meet or intermingle with undeveloped wildland or vegetation fuels. Describes an area within or adjacent to private and public property where mitigation actions can prevent damage or loss from wildfire.
Windthrow
The act of trees being uprooted by the wind.
Winter range
An area used by deer and elk during the winter months, generally at lower elevations with south and west exposures.
Withdrawal
An action that restricts the use of public land and segregates the land from the operation of some or all of the public land and mineral laws. Withdrawals are also used to transfer jurisdiction of management of public lands to other Federal agencies.

USDA Forest Service
458
References Cited Alexander, K.D. 2009. Unpublished data submitted via e-mail to Terry Ireland, U.S. Fish
and Wildlife Service Biologist, about Uncompahgre fritillary butterfly calculated abundance in 2008. February 18, 2009. 1 p.
Alexander, K.D., and Keck, A.G. 2016. Uncompahgre fritillary butterfly monitoring and inventory: 2015 report and status. Western State Colorado University, Gunnison, Colorado.
Bailey, J.A., and A.Y. Cooperrider. 1982. Final report: Trickle Mountain research study. Contract number ya-512-ct8-22. 137 pp.
Bain, M.B., J.T. Finn, and H.E. Booke. 1988. Streamflow regulation and fish community structure. Ecology. 69:382–392.
Baker, W.L. 2006. Fire and restoration of sagebrush ecosystems. Wildlife Society Bulletin 34:177–185.
Baker, W.L, and R.L. Knight. 2000. Roads and forest fragmentation in the southern Rocky Mountains. Chapter 5, pp. 97-122, in: Knight, R.L., F.W. Smith, S.W. Buskirk, W.H. Romme, and W.L. Baker (eds.). Forest Fragmentation in the Southern Rocky Mountains. University Press of Colorado. Boulder, Colorado.
Beecham, J.J. Jr., C.P. Collins, and T.D. Reynolds. 2007. Rocky Mountain bighorn sheep (Ovis Canadensis): A technical conservation assessment. USDA Forest Service, Rocky Mountain Region.
Beier, P., and B. Brost. 2010. Use of land facets to plan for climate change: Conserving the arenas, not the actors. Conservation Biology 24(3):701-10.
Beier, P., D.R. Majka, and W.D. Spencer. 2008. Forks in the road: Choices in procedures for designing wildland linkages. Conservation Biology, 22: 836-851. Accessed July 8, 2021, at: https://doi.org/10.1111/j.1523-1739.2008.00942.x
Belsky, A.J., and D.M. Blumenthal. 1997. Effects of livestock grazing on stand dynamics and soils in upland forests of the interior West. Conservation Biology, 11(2):315-327.
Belsky, A.J., and J.L. Gelbard. 2000. Livestock grazing and weed invasions in the arid west. Oregon Natural Desert Association. Bend, Oregon.
Beukema, S.J., W.A. Kurz, C.B. Pinkham, K. Milosheva, and L. Frid. 2003. Vegetation Dynamics Development Tool user’s guide, Version 4.4c. Prepared by ESSA Technologies, Ltd., Vancouver, BC. 239 pp. Available at: https://essa.com/
Blanco, S., and Ector, L. 2009. Distribution, ecology and nuisance effects of the freshwater invasive diatom Didymosphenia geminata (Lyngbye) M. Schmidt: A literature review. Nova Hedwigia 88(3-4):347-422, doi: 10.1127/0029-5035/2009/0088-0347.
Brandt, N.E., Brazeau, A.G., Browning, K.C., and Meier, R.M. 2017. Carbon sequestration in Colorado’s lands: An integrated spatial and policy analysis. University of Colorado, Boulder, Colorado. Accessed July 29, 2021, at: https://www.conservationgateway.org/ConservationByGeography/NorthAmerica/UnitedS

GMUG National Forests Land Management Plan Draft Environmental Impact Statement: Volume 1
459
tates/Colorado/Documents/Carbon%20Sequestration%20in%20Colorado%27s%20Lands_%20An%20Integated%20Spatial%20and%20Policy%20AnalysisRevised1272017.pdf
Buddle, C.M., D.W. Langor, G.R. Pohl, and J.R. Spence. 2006. Arthropod responses to harvesting and wildfire: Implications for emulation of natural disturbance in forest management. Biological Conservation 128:346-357.
Bureau of Business and Economic Research (BBER). 2017. Timber use, processing capacity and capability of mills to utilize timber by diameter size class in the Grand Mesa, Uncompahgre, and Gunnison National Forests timber-processing area. University of Montana.
Campbell, J.L., and Ager, A.A. 2013. Forest wildfire, fuel reduction treatments, and landscape carbon stocks: A sensitivity analysis. Journal of Environmental Management. 121:124-132. Accessed July 29, 2021, at: https://www.fs.usda.gov/treesearch/pubs/45344
Campbell, J.L., Harmon, M.E., and Mitchell, S.R. 2012. Can fuel-reduction treatments really increase forest carbon storage in the western US by reducing future fire emissions? Frontiers in Ecology and the Environment 10(2):83-90.
Carroll, C. 2003. Summary of coal resources in Colorado (SP-54). Colorado Geological Survey, Department of Natural Resources, Denver, Colorado.
Carter, S.K., E. Fleishman, I.I.F. Leinwand, C.H. Flather, N.B. Carr, F.A. Fogarty, M. Leu, B.R. Noon, M.E. Wohlfeil, and D.J.A. Wood. 2019. Quantifying ecological integrity of terrestrial systems to inform management of multiple-use public lands in the United States. Environmental Management 64:1-19.
Chambers, J.C., C.R. Allen, and S.A. Cushman. 2019. Operationalizing ecological resilience concepts for managing species and ecosystems at risk. Frontiers in Ecology and Evolution 7:1-27.
Ciuti S., Northrup, J.M., Muhly, T.B., Simi, S., Musiani, M., et al. 2012. Effects of humans on behaviour of wildlife exceed those of natural predators in a landscape of fear. PLoS ONE 7(11): e50611.10.1371/journal.pone.0050611
Clow, D.W. 2010. Changes in the timing of snowmelt and streamflow in Colorado: A response to recent warming. Journal of Climate, vol. 23, pp. 2293-2306.
Code of Federal Regulations. Parks, Forests, and Public Property. 36 CFR 293.7. July 1, 2007.
Colorado Department of Agriculture. 2020. The official state web portal. Accessed May 12, 2021, at https://ag.colorado.gov
Colorado Department of Public Health and Environment (CDPHE). 2011. Colorado visibility and regional haze state implementation plan for the twelve mandatory Class I Federal areas in Colorado. Colorado Department of Public Health and Environment, Air Pollution Control Division.
Colorado Department of Public Health and Environment (CDPHE). 2015a. Air quality data report. Colorado Department of Public Health and Environment, Air Pollution Control Division, Technical Services Program.

USDA Forest Service
460
Colorado Department of Public Health and Environment (CDPHE). 2015b. Colorado regional haze plan 5-year progress report. Appendix E: Regional haze state implementation plan. Colorado Department of Public Health and Environment, Air Pollution Control Division.
Colorado Department of Public Health and Environment (CDPHE). 2017. Colorado smoke management program manual. Colorado Air Pollution Control Division. Accessed July 8, 2021, at: https://www.colorado.gov/airquality/smoke_docs.aspx?action=open&file=ManualColoSmoke.pdf
Colorado Department of Public Health and Environment (CDPHE). 2019. Air quality data report. Colorado Air Pollution Control Division, Technical Services Program.
Colorado Department of Transportation. 2016. Colorado scenic and historic byways. Accessed January 26, 2016, at https://www.codot.gov/travel/scenic-byways
Colorado Forest Restoration Institute (CFRI). 2016. Grand Mesa, Uncompahgre, and Gunnison National Forests’ rapid stakeholder assessment report in preparation for plan revision. Fort Collins, Colorado: Colorado State University. 13 pp.
Colorado Natural Heritage Program (CNHP). 2014. Climate change vulnerability assessment for rare plants of the San Juan region of Colorado. J. Handwerk, B. Kuhn, R. Rondeau, and L. Grunau (eds.) Colorado Natural Heritage Program, Colorado State University, Fort Collins, Colorado.
Colorado Natural Heritage Program (CNHP). 2015. Climate change vulnerability assessment for Colorado Bureau of Land Management. K. Decker, L. Grunau, J. Handwerk, and J. Siemers (eds.). Colorado Natural Heritage Program, Colorado State University, Fort Collins, Colorado.
Colorado Parks and Wildlife (CPW). 2014. Colorado statewide comprehensive outdoor recreation plan. Accessed January 13, 2016, at: http://cpw.state.co.us/aboutus/Pages/SCORP.aspx
Colorado Parks and Wildlife (CPW). 2017. Colorado Parks and Wildlife 2017 factsheet. Accessed July 14, 2021, at: http://cpw.state.co.us/Documents/About/Reports/StatewideFactSheet.pdf
Colorado Resource Monitoring Initiative. 2014. Colorado rangeland monitoring guide. Accessed July 21, 2021, at: https://www.onpasture.com/wp-content/uploads/2017/03/RangelandMonitoringGuide-Web_2-Version.pdf
Colorado Water Conservation Board. 2019. Analysis and technical update to Colorado’s water plan. Accessed July 12, 2021, at: https://cwcb.colorado.gov/colorado-water-plan/technical-update-to-the-plan
Connelly, J.W., Schroeder, M.A., Sands, A.R., and Braun, C.E. 2000. Guidelines to manage sage grouse populations and their habitats. Wildlife Society Bulletin (1973-2006), 28(4), 967–985. Accessed July 7, 2021, at: www.jstor.org/stable/3783856

GMUG National Forests Land Management Plan Draft Environmental Impact Statement: Volume 1
461
Coop, J.D., Barker, K.J., Knight, A.D., and Pecharich, J.S. 2014. Aspen (Populus tremuloides) stand dynamics and understory plant community changes over 46 years near Crested Butte, Colorado. Forest Ecology and Management 318:1-12.
Council on Environmental Quality (CEQ). 1997. Environmental justice: Guidance under the National Environmental Policy Act. Washington DC., 40 pp.
Covington W.W., P.Z., Fulé, M.M. Moore, S.C. Hart, T.E., Kolb, J.N. Mast, S.S. Sackett, and M.R. Wagner. 1997. Restoring ecosystem health in ponderosa pine forests of the southwest. Journal of Forestry 95:23-29.
Cullis, J.D., Gillis, C.A., Bothwell, M.L., Kilroy, C., Packman, A., and Hassan, M. 2012. A conceptual model for the blooming behavior and persistence of the benthic mat‐forming diatom Didymosphenia geminata in oligotrophic streams. Journal of Geophysical Research, Biogeosciences 117(G2).
Davies, K.W., C.S. Boyd, J.L. Beck, J.D. Bates, T.J. Svejcar, and M.A. Gregg. 2011. Saving the sagebrush sea: An ecosystem conservation plan for big sagebrush plant communities. Biological Conservation 144:2573-2584.
Drake, R.M., II, Schenk, C.J., Mercier, T.J., Le, P.A., Finn, T.M., Johnson, R.C., Woodall, C.A., Gaswirth, S.B., Marra, K.R., Pitman, J.K., Leathers-Miller, H.M., Haines, S.S., and Tennyson, M.E. 2019. Assessment of undiscovered continuous tight-gas resources in the Mesaverde Group and Wasatch Formation, Uinta-Piceance Province, Utah and Colorado, 2018: U.S. Geological Survey Fact Sheet 2019–3027, 2 pp. Accessed July 13, 2021, at: https://doi.org/10.3133/fs20193027
Dunne, T., and L.B. Leopold. 1978. Water in environmental planning. San Francisco: W.H. Freeman. 818 pp.
Environmental Protection Agency (EPA). 2011. National air toxics assessment. Washington DC. Accessed June 2017, at: https://www.epa.gov/national-air-toxics-assessment/nata-overview
Environmental Protection Agency (EPA). 2017. 2017 national emissions inventory (NEI) data. Washington DC. Accessed April 14, 2020, at: https://www.epa.gov/air-emissions-inventories/2017-national-emissions-inventory-nei-data
Environmental Protection Agency (EPA). 2021. AirData Air Quality Monitors interactive map website. Environmental Protection Agency, Washington DC. Accessed March 2021, at: https://epa.maps.arcgis.com/apps/webappviewer/index.html?id=5f239fd3e72f424f98ef3d5def547eb5&extent=-146.2334,13.1913,-46.3896,56.5319
Executive Order 13112. 1999. Invasive species. Accessed July 22, 2021, at: http://www.invasivespeciesinfo.gov/laws/execorder.shtml
Fisher, J.T. and L. Wilkinson. 2005. The response of mammals to forest fire and timber harvest in the North American boreal forest. Mammal Review 35:51-81.
Fowler B., and P. Gallagher. 2004. Oil and gas potential and reasonable foreseeable development (RFD) scenarios in the Grand Mesa, Uncompahgre, and Gunnison (GMUG) National Forests, Colorado. Bureau of Land Management report.

USDA Forest Service
462
French, C.B. 2020. Big game migration grant program. Memorandum from Christopher B. French, Deputy Chief, National Forest System, dated October 14, 2020. Forest Service Washington Office, 1400 Independence Avenue SW, Washington DC. 2 pp.
Furniss, M.J., and C. Howe. 2016. Regional-scale climate change vulnerability assessment for infrastructure in the national forests and grasslands of the Rocky Mountain Region: Including roads, trails, and recreational facilities. For: Rocky Mountain Region, U.S. Forest Service, and Rocky Mountain Research Station, USDA Forest Service. 117 pp.
Furniss, M.J., B.P. Staab, S. Hazelhurst, C.F. Clifton, K.B. Roby, B.L. Ilhadrt, E.B. Larry, A.H. Todd, L.M. Reid, S.J. Hines, K.A. Bennett, C.H. Luce, and P.J. Edwards. 2010. Water, climate change, and forests: Watershed stewardship for a changing climate. General Technical Report PNW-GTR-812. Portland, Oregon: U.S. Department of Agriculture, Forest Service, Pacific Northwest Research Station. 75 pp.
Gall, L.F., and F.A.H. Sperling. 1980. A new high altitude species of Boloria from southwestern Colorado (Nymphalidae), with a discussion of phenetics and hierarchical decisions. Journal of the Lepidopterists’ Society 34:230-252.
George, J.L., R. Kahn, M.W. Miller, and B. Watkins. 2009. Colorado bighorn sheep management plan 2009–2019. Special Report Number 81, Colorado Division of Wildlife, Terrestrial Resources. Denver, Colorado. 83 pp. plus appendices.
Gillis, C.A., and M. Chalifour. 2010. Changes in the macrobenthic community structure following the introduction of the invasive algae Didymosphenia geminata in the Matapedia River (Québec, Canada). Hydrobiologia 647(1):63-70.
Gobster, P.H. 1994. The aesthetic experience of sustainable forest ecosystems. In: Covington, W.W., and L.F. Debano (eds.), Sustainable Ecological Systems: Implementing an Ecological Approach to Land Management, Flagstaff, Arizona, July 1993. General Technical Report RM-247, pp. 246−255. Fort Collins, Colorado: U.S. Department of Agriculture, Forest Service, Rocky Mountain Forest and Range Experiment Station. Accessed July 29, 2021, at: https://nau.pure.elsevier.com/en/publications/sustainable-ecological-systems-implementing-an-ecological-approac-2
Gordon, E., and D. Ojima (eds.). 2015. Colorado climate change vulnerability study. A report by the University of Colorado Boulder and Colorado State University to the Colorado Energy Office. Lead authors: A. Childress, E. Gordon, T. Jedd, R. Klein, J. Lukas, and R. McKeown. University of Colorado, Boulder, Colorado, and Colorado State University, Fort Collins, Colorado.
Gunnison Sage-grouse Rangewide Steering Committee (GSRSC). 2005. Gunnison sage-grouse rangewide conservation plan. Colorado Division of Wildlife, Denver, Colorado. Accessed July 7, 2021, at: http://cpw.state.co.us/learn/Pages/GunnisonSagegrouseConservationPlan.aspx
Haines, A. 2017. Personal communication between Carlyn Perovich, GMUG National Forest Ecologist, and Arthur Haines, Silviculturist. November 2017.
Harpold, A., Brooks, P., Rajagopal, S., Heidbuchel, I., Jardine, A., and Stielstra, C. 2012. Changes in snowpack accumulation and ablation in the Intermountain West. Water Resources Research. 48(11). W11501. doi:10.1029/2012WR011949.
GMUG National Forests Land Management Plan Draft Environmental Impact Statement: Volume 1
463
Hawkins, S.J., Charpentier, R.R., Schenk, C.J., Leathers-Miller, H.M., Klett, T.R., Brownfield, M.E., Finn, T.M., Gaswirth, S.B., Marra, K.R., Le, P.A., Mercier, T.J., Pitman, J.K., and Tennyson, M.E. 2016. Assessment of continuous (unconventional) oil and gas resources in the Late Cretaceous Mancos Shale of the Piceance Basin, Uinta-Piceance Province, Colorado and Utah, 2016: U.S. Geological Survey Fact Sheet 2016-3030, 4 pp. Accessed July 13, 2021, at: http://dx.doi.org/10.3133/fs20163030
Headwaters Economics. 2017. Economic profile system. Accessed August 2017, at: https://headwaterseconomics.org/tools/economic-profile-system/
Hebblewhite, M. 2008. A Literature review of the effects of energy development on ungulates: Implications for central and eastern Montana. Wildlife Biology Faculty Publications, 48. Accessed July 22, 2021, at: https://scholarworks.umt.edu/wildbio_pubs/48
Hettinger, R.D., L.N.R. Roberts, and T.A. Gognat. 2000. Investigations of the distribution and resources of coal in the southern part of the Piceance Basin, Colorado. In: Kirschbaum, M.A., L.N.R. Roberts, and L.H. Biewick, (eds.) 2000. Geologic Assessment of Coal in the Colorado Plateau: Arizona, Colorado, New Mexico, and Utah. U.S. Geological Survey Professional Paper 1625-B, Chapter O, CD-ROM.
Heyborne, W.H., J.C. Miller, and G.L. Parsons. 2003. Ground dwelling beetles and forest vegetation change over a 17-year-period, in western Oregon, USA. Forest Ecology and Management 179:123–134.
Hill, R., and C.M. Pickering. 2009. Differences in the resistance of three subtropical vegetation types to experimental trampling. Journal of Environmental Management 90:1305–1312.
Hoctor, T., W. Allen, M.H. Carr, P. Zwick, E. Huntley, D.J. Smith, D.S. Maehr, R. Buch, and R. Hilsenbeck. 2007. Land corridors in the southeast USA: Connectivity to protect biodiversity and ecosystem services. Journal of Conservation Planning, 4:90-122.
Holechek, J.L., R.D. Pieper, and C.H. Herbel. 2010. Range management principles and practices. 6th ed. Prentice Hall. Englewood Cliffs, New Jersey. 501 pp.
Holling, C.S. 1973. Resilience and stability of ecological systems. Annual Review of Ecology and Systematics 4:1-23.
Huang, C., and W.R.L. Anderegg. 2012. Large drought-induced aboveground live biomass losses in southern Rocky Mountain aspen forests. Global Change Biology 18: 1016-1027. Accessed July 9, 2021, at: http://dx.doi.org/10.1111/j.1365-2486.2011.02592.x
Hunter, M.L. Jr., Jacobson, G.L. Jr., and Webb III, T. 1988. Paleoecology and the coarse-filter approach to maintaining biological diversity. Conservation Biology 2:375-385.
Hurteau, M.D., and North, M. 2010. Carbon recovery rates following different wildfire risk mitigation treatments. Forest Ecology and Management 260(5):930-937.
IMPLAN. 2015 and 2017. IMpacts for PLANning (IMPLAN). Minnesota IMPLAN Group, Inc. Version 3.1.1001.13. Accessed July 13, 2021, at: www.implan.com
IMPROVE 2021. Interagency monitoring of protected visual environments, Federal land manager environmental database.

USDA Forest Service
464
Indiana Business Research Center (IBRC). 2016. Driving regional innovation: The innovation index 2.0. August 2016. Accessed July 13, 2021, at: https://www.statsamerica.org/ii2/reports/Driving-Regional-Innovation.pdf
Interagency Lynx Biology Team. 2013. Canada lynx conservation assessment and strategy. 3rd edition. USDA Forest Service, USDI U.S. Fish and Wildlife Service, USDI Bureau of Land Management, and USDI National Park Service. Forest Service Publication RI-13-19, Missoula, Montana. 128 pp. Available at: https://www.fs.fed.us/biology/resources/pubs/wildlife/LCAS_revisedAugust2013.pdf
Intermountain West Data Warehouse. 2015. Accessed June 2017, at: http://views.cira.colostate.edu/tsdw/
Janowiak, M.K., C.W. Swanston, L.M. Nagel, L.A. Brandt, P.R. Butler, S.D. Handler, P.D. Shannon, L.R. Iverson, S.N. Matthews, A. Prasad, and M.P. Peters. 2014. A practical approach for translating climate change adaptation principles into forest management actions. Journal of Forestry 112:424-433.
Jeffries, J.M., R.J. Marquis, and R.E. Forkner. 2006. Forest age influences oak insect herbivore community structure, richness, and density. Ecological Applications 16:901–912.
Johansson, T., J. Hjalten, H. Gibb, J. Hilszczanski, J. Stenlid, J.P. Ball, O. Alinvi, and K. Danell. 2007. Variable response of different functional groups of saproxylic beetles to substrate manipulation and forest management: Implications for conservation strategies. Forest Ecology and Management 242:496-510.
Keane, R.E., P.F. Hessburg, P.B. Landres, and F.J. Swanson. 2009. The use of historical range and variability (HRV) in landscape management. Forest Ecology and Management 258:1025-1037.
Keeley, A.T.H., G. Basson, D.R. Cameron, N.E. Heller, P.R. Huber, C.A. Schloss, J.H. Thorne, and A.M. Merenlender. 2018. Making habitat connectivity a reality. Conservation Biology. 32(6):1221-1232.
Kilroy, C., Larned, S.T., and Biggs, B.J.F. 2009. The non‐indigenous diatom Didymosphenia geminata alters benthic communities in New Zealand rivers. Freshwater Biology, 54(9):1990-2002.
King, C. 2021. There’s snow(shoe) place like home: Integrating field measurements and remotely sensed data to assess and model snowshoe hare habitat. Master of Science in Ecology Thesis, Department of Environment and Sustainability, Western Colorado University, Gunnison, Colorado. 25 pp.
Kirkwood, A.E., Jackson, L.J., and McCauley, E. 2005. Didymosphenia geminata distribution and bloom formation along the south-eastern slopes of the Canadian Rockies. In: Proceedings of the 2007 International Workshop on Didymosphenia geminata, pp.22-24.
Kirkwood, A.E., T. Shea, L.J. Jackson, and E. McCauley. 2007. Didymosphenia geminata in two Alberta headwater rivers: An emerging invasive species that challenges conventional views on algal bloom development. Canadian Journal of Fisheries and Aquatic Science 64:1703-1709.
GMUG National Forests Land Management Plan Draft Environmental Impact Statement: Volume 1
465
Knight, R.L., F.W. Smith, S.W. Buskirk, W.H. Romme, and W.L. Baker (eds.). 2000. Forest fragmentation in the southern Rocky Mountains, University Press of Colorado.
Kulakowski, D., Veblen, T.T., and Drinkwater, S. 2004. The persistence of quaking aspen (Populus tremuloides) in the Grand Mesa area, Colorado. Ecological Applications 14(5):1603-1614.
Ladrera, R., M. Rieradevall, and N. Prat. 2015. Massive growth of the invasive algae Didymosphenia geminata associated with discharges from a mountain reservoir alters the taxonomic and functional structure of macroinvertebrate community. River Research and Applications, 31(2):216-227.
Landres, P., P. Morgan, and F.J. Swanson. 2009. Overview of the use of natural variability concepts in managing ecological systems. Ecological Applications. 9(4):1179-1188.
Lindenmayer, D.B., and R.F. Noss. 2006. Salvage logging, ecosystem processes, and biodiversity conservation. Conservation Biology 20(4):949-958.
Ludwig, F., and M. Moench. 2009. The impacts of climate change on water. Pages 35–50 in: Ludwig, F., Kabat, P., van Schaik, H., and van der Valk, M. (eds.). Climate Change Adaptation in the Water Sector. London: Earthscan Publishing.
Lukas, J., J. Barsugli, N. Doesken, I. Rangwala, and K. Wolter. 2014. Climate change in Colorado. A synthesis to support water resources management and adaptation, 2nd ed. A report by Western Water Assessment, Cooperative Institute for Research in Environmental Sciences, University of Colorado Boulder for the Colorado Water Conservation Board.
Lute, A.C., Abatzoglou, J.T., and Hegewisch, K.C. 2015. Projected changes in snowfall extremes and interannual variability of snowfall in the Western United States. Water Resources Research. 51(2):960-972.
MacDonald, L.H., and J.D. Stednick. 2003. Forests and water: A state-of-the-art review for Colorado. Colorado Water Resources Research Institute (CWRRI) Completion Report No. 196. Colorado State University, Fort Collins, Colorado. Accessed July 25, 2017, at: http://www.fs.fed.us/rm/pubs_exp_forests/manitou/rmrs_2003_macDonald_l001.pdf
Manier, D.J., N.T. Hobbs, D.M. Theobald, R.M. Reich, M.A. Kalkhan, and M.R. Campbell. 2003. (Draft) Canopy dynamics and human caused disturbance on a semi-arid landscape in the Rocky Mountains, USA. Natural Resource Ecology Laboratory. Colorado State University. Fort Collins, Colorado. 56 pp.
Mast, J.N., and J.J. Wolf. 2004. Ecotonal changes and altered tree spatial patterns in lower mixed-conifer forests, Grand Canyon National Park, Arizona, U.S.A. Landscape Ecology 19:167-180.
McGarigal, K., S.A. Cushman, and E. Ene. 2012. FRAGSTATS v4: Spatial pattern analysis program for categorical and continuous maps. Computer software program produced by the authors at the University of Massachusetts, Amherst. Accessed June 30, 2021, at: http://www.umass.edu/landeco/research/fragstats/fragstats.html

USDA Forest Service
466
McIver, C.P., E.A. Simmons, and T.A. Morgan. 2017. Timber use, processing capacity and capability of mills to utilize timber by diameter size class in the Grand Mesa, Uncompahgre, and Gunnison National Forest Timber Processing Area.
Meddens, A.J., Kolden, C.A., Lutz, J.A., Abatzoglou, J.T., and Hudak, A.T. 2018. Spatiotemporal patterns of unburned areas within fire perimeters in the northwestern United States from 1984 to 2014. Ecosphere, 9(2).
Megahan, W., and W. Kidd. 1972. Effects of logging and logging roads on erosion and sediment deposition from steep terrain. Journal of Forestry 70(3):136–141.
Meiklejohn, K., R. Ament, and G. Tabor. 2010. Habitat corridors and landscape connectivity: Clarifying the terminology. Center for Large Landscape Conservation: A Project of the Wild Foundation. Accessed June 25, 2021, at: https://www.wildlandsnetwork.org/sites/default/files/terminology%20CLLC.pdf
Meyerson, L.A., and H.A. Mooney. 2007. Invasive alien species in an era of globalization. Frontiers in Ecology and the Environment 5:199-208.
Michaelian, M., E.H. Hogg, R.J. Hall, and E. Arsenault. 2011. Massive mortality of aspen following severe drought along the southern edge of the Canadian boreal forest. Global Change Biology 17(6):2084-2094. Accessed July 9, 2021, at: https://www.ncbi.nlm.nih.gov/pmc/articles/PMC3597257/
Millar, C.I. 2014. Historic variability: Informing restoration strategies, not prescribing targets. Journal of Sustainable Forestry 33:S28-S42.
Millar, C.I., Stephenson, N.L. and Stephens, S.L., 2007. Climate change and forests of the future: managing in the face of uncertainty. Ecological applications, 17(8), pp.2145-2151.
Mitchell, S.R., Harmon, M.E., and O' Connell, K.E.B. 2009. Forest fuel reduction alters fire severity and long-term carbon storage in three Pacific Northwest ecosystems. Ecological Applications. 19(3):643-655. Accessed July 29, 2021, at: https://esajournals.onlinelibrary.wiley.com/doi/full/10.1890/08-0501.1
Naylor, L.M., M.J. Wisdom, and R.G. Anthony. 2009. Behavioral responses of North American elk to recreational activity. Journal of Wildlife Management, 73(3):328-338. Accessed July 22, 2021, at: https://doi.org/10.2193/2008-102
Neely, B., R. Rondeau, J. Sanderson, C. Pague, B. Kuhn, J. Siemers, L. Grunau, J. Robertson, P. McCarthy, J. Barsugli, T. Schulz, and C. Knapp (eds.). 2011. Gunnison Basin: Vulnerability assessment for the Gunnison Climate Working Group by The Nature Conservancy, Colorado Natural Heritage Program, Western Water Assessment, University of Colorado, Boulder, and University of Alaska, Fairbanks. Project of the Southwest Climate Change Initiative.
New Mexico Game and Fish Department. 2005. Long-range plan for management of Rocky Mountain bighorn sheep in New Mexico 2005–2014. Wildlife Management Division, New Mexico Department of Game and Fish, Santa Fe, New Mexico.
North, M.P., and Hurteau, M.D. 2011. High-severity wildfire effects on carbon stocks and emissions in fuels treated and untreated forest. Forest Ecology and Management. 261(6):1115-1120.

GMUG National Forests Land Management Plan Draft Environmental Impact Statement: Volume 1
467
Peterson, D.L., C.I. Millar, L.A. Joyce, M.J. Furniss, J.E. Holafsky, R.P. Neilson, P. Ronald, and T. L. Morelli. 2011. Responding to climate change in national forests: A guidebook for developing adaptation options. General Technical Report. PNW-GTR-855. Portland, Oregon. U.S. Department of Agriculture, Forest Service, Pacific Northwest Research Station. 109 pp.
Pieper, R.D. 1994. Ecological implications of livestock grazing. Pages 177-211 in: Vavra, M.L., W.A. Laycock, and Pieper, R.D. (eds.), Ecological Implications of Herbivory in the West. Society for Range Management. Denver, Colorado. 297 pp.
Platts, W.S. 1991. Livestock grazing. Pages 389–423 in: W.R. Meehan (ed.). Influences of Forest and Rangeland Management on Salmonid Fishes and their Habitats. American Fisheries Society Special Publication 19. American Fisheries Society, Bethesda, Maryland.
Preisler, H.K., A.A. Ager, and M.J. Wisdom. 2013. Analyzing animal movement patterns using potential functions. Ecosphere 4(3):32. Accessed July 22, 2021, at: http://dx.doi.org/10.1890/ES12-00286.1
Reeves, G.H., J.E. Williams, K.M. Burnett, and K. Gallo. 2006. The aquatic conservation strategy of the Northwest forest plan. Conservation Biology 20(2):319–329.
Rehfeldt, G.E., J.J. Worrall, S.B. Marchetti, and N.L. Crookston. 2015. Adapting forest management to climate change using bioclimate models with topographic drivers. Forestry, 88(5):528-539.
Reid, L., and T. Dunne. 1984. Sediment production from forest road surfaces. Water Resources Research 20(1):61-78.
Reinhardt, E., and Holsinger, L. 2010. Effects of fuel treatments on carbon-disturbance relationships in forests of the northern Rocky Mountains. Forest Ecology and Management 259:1427-1435. Accessed July 29, 2021, at: https://www.fs.usda.gov/treesearch/pubs/34995
Reiter, M., J.T. Heffner, S. Beech, T. Turner, and R.E. Bilby. 2009. Temporal and spatial turbidity patterns over 30 years in a managed forest of western Washington. Journal of the American Water Resources Association, doi: 10.1111/j.1752-1688.2009.00323x.
Rieman, B.E., and D.J. Isaak. 2010. Climate change, aquatic ecosystems, and fishes in the Rocky Mountain West: Implications and alternatives for management. General Technical Report RMRS-GTR-250. USDA Forest Service, Rocky Mountain Research Station. Fort Collins, Colorado. 46 pp.
Roccaforte, J.P., P.Z. Fulé, W.W. Chancellor, and D.C. Laughlin. 2012. Woody debris and tree regeneration dynamics following severe wildfires in Arizona ponderosa pine forests. Canadian Journal of Forest Research 42(3):593-604.
Rogala, J.K., M. Hebblewhite, J. Whittington, C.A. White, J. Coleshill, and M. Musiani. 2011. Human activity differentially redistributes large mammals in the Canadian Rockies national parks. Ecology and Society 16(3):16. Accessed July 22, 2021, at: http://dx.doi.org/10.5751/ES-04251-160316

USDA Forest Service
468
Romme, W.H., M.L. Floyd, and D.D. Hanna. 2009. Historical range of variability and current landscape condition analysis: South central highlands section, southwestern Colorado and northwestern New Mexico. Report produced by the Colorado Forest Restoration Institute at Colorado State University and Region 2 of the U.S. Forest Service.
Romme, W.H., Floyd-Hanna, L., Hanna, D.D., and Bartlett, E. 2001. Aspen’s ecological role in the West. In: Shepperd, W.D., Binkley, D., Bartos, D.L., Stohlgren, T.J., Eskew, L.G. (eds.), Sustaining Aspen in Western Landscapes: Symposium Proceedings; 13–15 June 2000; Grand Junction, Colorado. Proceedings RMRS-P-18. U.S. Department of Agriculture, Forest Service, Rocky Mountain Research Station, Fort Collins, Colorado, pp. 243–259.
Rondeau, R., B. Neely, M. Bidwell, N. Burkardt, I. Rangwala, K. R. Schuster, L. Yung, K. Clifford, and T. Schulz. 2016. Sagebrush landscape: Upper Gunnison River basin, Colorado. Social-Ecological Climate Resilience Project. North Central Climate Science Center, Fort Collins, Colorado.
Rondeau, R., B. Neely, M. Bidwell, I. Rangwala, L. Yung, K. Clifford, and T. Schulz. 2017. Spruce‐fir and sagebrush landscape reports: Upper Gunnison River basin, Colorado. Social‐Ecological Climate Resilience Project. North Central Climate Science Center, Fort Collins, Colorado.
Ruediger, B., J. Claar, S. Gniadek, B. Holt, L. Lewis, S. Mighton, B. Naney, G. Patton, T. Rinaldi, J. Trick, A. Vandehey, F. Wahl, N. Warren, D. Wenger, and A. Williamson. 2000. Canada lynx conservation assessment and strategy. USDA Forest Service, USDI U.S. Fish and Wildlife Service, USDI Bureau of Land Management, and USDI National Park Service. Forest Service Publication Number R1-00-53, Missoula, Montana, 142 pp.
Ruggiero, L.F., Aubry, K.B., Buskirk, S.W., Koehler, G.M., Krebs, C.J., McKelvey, K.S., and Squires, J.R. (eds.). 2000. Ecology and conservation of lynx in the United States. University Press of Colorado, Boulder, Colorado.
Ryan, R.L. 2005. Social science to improve fuels management: A synthesis of research on aesthetics and fuels management. General Technical Report NC-261. St. Paul, Minnesota: U.S. Department of Agriculture, Forest Service, North Central Research Station. 58 pp.
Ryan, M.G., R.A. Birdsey, and S.J. Hines. 2012. Forests and carbon storage. U.S. Forest Service, Climate Change Resource Center. Accessed July 9, 2021, at: https://www.fs.usda.gov/ccrc/topics/forests-and-carbon-storage-2012
Sallabanks, R., J.B. Haufler, and C.A. Mehl. 2006. Influence of forest vegetation structure on avian community composition in west-central Idaho. Wildlife Society Bulletin 34:1079-1093.
Savage, M., and J.N. Mast. 2005. How resilient are southwestern ponderosa pine forests after high-severity fires? Canadian Journal of Forest Research 35:967–977.
Scalzitti, J., Strong, C., and Kochanski, A. 2016. Climate change impact on the roles of temperature and precipitation in Western U.S. snowpack variability. Geophysical Research Letters. 43:5361–5369. doi:10.1002/2016GL068798.

GMUG National Forests Land Management Plan Draft Environmental Impact Statement: Volume 1
469
Schroeder, M.A., J.R. Young, and C.E. Braun. 1999. Sage grouse (Centrocercus urophasianus). Pages 1-28 in: A. Poole and F. Gill (eds.). The Birds of North America, No. 425. Philadelphia, Pennsylvania.
Seaber, P.R.; Kapinos, F.P.; Knapp, G.L. 1987. Hydrologic unit maps. Water-Supply Paper 2294. Washington, DC: U.S. Department of the Interior, U.S. Geological Survey. 63 pp. Accessed July 22, 2021, at: https://pubs.usgs.gov/wsp/wsp2294/pdf/wsp_2294.pdf
Sheley, R.L., J.J. James, M.J. Rinella, D. Blumenthal, and J.M. Ditomaso. 2011. Chapter 7: Invasive plant management on anticipated conservation benefits: A scientific assessment. Pages 291–336 in: D.D. Briske (ed.) Conservation Benefits of Rangeland Practices: Assessment, Recommendations, And Knowledge Gaps. U.S. Department of Agriculture, Natural Resources Conservation Science, Lawrence, Kansas.
Shinneman, D.J., Baker, W.L., Rogers, P.C., and Kulakowski, D. 2013. Fire regimes of quaking aspen in the Mountain West. Forest Ecology and Management 299:22-34.
Silins, U., K.D. Blandon, E.N., Kelly, E. Esch, J.R. Spence, M. Stone, M.B. Emelko, S. Boon, M.J. Wagner, C.H.S. Williams, and I. Tichkowsky. 2014. Five-year legacy of wildfire and salvage logging impacts on nutrient runoff and aquatic plant, invertebrate, and fish productivity. Ecohydrology 7(6):1508–1523. doi:10.1002/eco.1474.
Smith, T.S., J.T. Flinders, and D.S. Winn. 1991. A habitat evaluation procedure for Rocky Mountain bighorn sheep in the Intermountain West. Great Basin Naturalist 51(3):205-225.
Smith, A.E., and Smith, F.W. 2005. Twenty-year change in aspen dominance in pure aspen and mixed aspen/conifer stands on the Uncompahgre Plateau, Colorado, USA. Forest Ecology and Management 213(1-3):338-348.
Spencer, D. 2006. Review of the drilling forecast contained in the August 27, 2004, reasonable foreseeable development (RFD). Bureau of Land Management letter to the USDA Forest Service.
Springs Stewardship Institute. 2018. Springs Stewardship Institute database. Museum of Northern Arizona. Accessed November 13, 2018, at: http://springstewardshipinstitute.org/
Squires, J.R., DeCesare, N.J., Olson, L.E., Kolbe, J.A., Hebblewhite, M., and Parks, S.A. 2013. Combining resource selection and movement behavior to predict corridors for Canada lynx at their southern range periphery. Biological Conservation, 157, pp. 187-195. doi:10.1016/j.biocon.2012.07.018.
Suding, K., Higgs, E., Palmer, M., Callicott, J.B., Anderson, C.B., Baker, M., Gutrich, J.J., Hondula, K.L., LaFevor, M.C., Larson, B.M.H., Randall, A., Ruhl, J.B., and Schwartz, K.Z.S. 2015. Committing to ecological restoration. Science. 348(6235)638-640. DOI: 10.1126/science.aaa4216.
Sullivan, T.P., D.S. Sullivan, and P.M.F. Lindgren. 2000. Small mammals and stand structure in young pine, seedtree, and old-growth forest, southwest Canada. Ecological Applications 11:1151-1173.

USDA Forest Service
470
Sullivan, T.P., D.S. Sullivan, and P.M.F. Lindgren. 2001. Stand structure and small mammals in young lodgepole pine forest, 10-yr results after thinning. Ecological Applications 10:1367-1383.
Sullivan, T.P., D.S. Sullivan, P.M.F. Lindgren, and D.B. Ransome. 2007. Long-term responses of ecosystem components to stand thinning in young lodgepole pine forest IV. Relative habitat use by mammalian herbivores. Forest Ecology and Management 240:32-41.
Swift, L.W., Jr. 1984. Gravel and grass surfacing reduces soil loss from mountain roads. Forest Science 30(3):657-670.
Taylor, E. 2001. Effects of spring cattle grazing on bighorn sheep habitat use. Job Final Report, August 20, 2001. USDI U.S. Geological Survey, Forest and Rangeland Ecosystem Science Center, Snake River Field Station, Boise, Idaho. 10 pp.
Taylor, B.W., and Bothwell, M.L. 2014. The origin of invasive microorganisms matters for science, policy, and management: The case of Didymosphenia geminata. Bioscience 64(6):531-538.
Tepley, A.J., and Veblen, T.T. 2015. Spatiotemporal fire dynamics in mixed‐conifer and aspen forests in the San Juan Mountains of southwestern Colorado, USA. Ecological Monographs 85(4):583-603.
Theobald, D.M., and Shenk, T.M., 2011. Areas of high habitat use from 1999‐2010 for radio‐collared Canada lynx reintroduced to Colorado, Colorado Division of Wildlife, Mammals Research. Accessed July 20, 2021, at: http://cpw.state.co.us/Documents/Research/Mammals/Publications/LynxHabitatUseMapReport.pdf
Thomas, J.W., J.F. Franklin, J. Gordon, and K.N. Johnson. 2006. The northwest forest plan: 23 origins, components, implementation experience, and suggestions for change. 24 Conservation Biology 20:277–287.
Thompson, I., Mackey, B., McNulty, S., Mosseler, A. 2009. Forest resilience, biodiversity, and climate change. A synthesis of the biodiversity/resilience/stability relationship in forest ecosystems. Secretariat of the Convention on Biological Diversity, Montreal. Technical Series no. 43, 67 pp.
Trlica, M.J. 2013. Grass growth and response to grazing. Natural Resources Series, Range Fact Sheet No. 6.108. Colorado State University Extension. Accessed July 9, 2021, at: http://extension.colostate.edu/docs/pubs/natres/06108.pdf
Troendle, C.A., and G.S. Bevenger. 1996. Effect of fire on streamflow and sediment transport, Shoshone National Forest, Wyoming. In: Greenlee, J.M. (ed.). The Ecological Implications of Fire in Greater Yellowstone. Second Biennial Conference on the Greater Yellowstone Ecosystem, September 17–21, 1993, Yellowstone National Park, Wyoming. Fairfield, Washington: International Association of Wildland Fire. 139 pp.
Union of Concerned Scientists. 2011. Climate change and your health: Rising temperatures, worsening ozone pollution. Accessed May 18, 2021 at: www.ucsusa.org/climateandozonepollution

GMUG National Forests Land Management Plan Draft Environmental Impact Statement: Volume 1
471
U.S. Census Bureau. 2016a. Table PEPSR6H: Annual estimates of the resident population by sex, race, and Hispanic origin for the United States, states, and counties: April 1, 2010, to July 1, 2015. Release date June 2016. U.S. Census Bureau, Population Division. Accessed December 2016, at: https://data.census.gov/cedsci/
U.S. Census Bureau. 2016b. 2015 poverty and median household income estimates – counties, states, and national. Accessed December 2016, at: https://data.census.gov/cedsci/
U.S. Census Bureau. 2017. Population and housing unit estimates datasets. Accessed July 2021, at: https://www.census.gov/programs-surveys/popest/data/data-sets.html
U.S. Census Bureau. 1990. Census of population: General population characteristics. Accessed August 2017, at: https://www.census.gov/library/publications/1992/dec/cp-1.html
U.S. Census Bureau. 2020. County business patterns. Washington DC. Accessed March 2021, through Headwaters Economics, Economic Profile System, Human Dimensions Toolkit.
USDA Economic Research Service (USDA ERS). 2014. Creative class county codes. Accessed July 12, 2021, at: https://www.ers.usda.gov/data-products/creative-class-county-codes/
USDA Forest Service. 1974. The visual management system. Agricultural Handbook. National Forest Landscape Management, Volume 2. Washington DC.: U.S. Government Printing Office. 462 pp.
USDA Forest Service. 1980. An approach to water resources evaluation of non-point silvicultural sources (A procedural handbook). U.S. Environmental Protection Agency, Environmental Research Laboratory, Athens, Georgia. EPA-600/8-80-012. 861 pp.
USDA Forest Service. 1983. Grand Mesa, Uncompahgre, and Gunnison National Forests amended land and resource management plan. Accessed July 23, 2021, at: https://www.fs.usda.gov/detail/gmug/landmanagement/planning/?cid=fseprd541790
USDA Forest Service. 1991. Final supplemental environmental impact statement for the Grand Mesa, Uncompahgre, and Gunnison National Forests land and resource management plan as amended. Grand Mesa, Uncompahgre, and Gunnison National Forests, Delta, Colorado.
USDA Forest Service. 1993. Final oil and gas leasing environmental impact statement and record of decision. Grand Mesa, Uncompahgre, and Gunnison National Forests.
USDA Forest Service. 1995. Landscape aesthetics: A handbook for scenery management. Agriculture Handbook 701. Accessed July 23, 2021, at: https://www.fs.usda.gov/Internet/FSE_DOCUMENTS/stelprdb5412126.pdf
USDA Forest Service. 1996. Rangeland analysis and management training guide. Rocky Mountain Region, Denver, Colorado. Accessed July 21, 2021, at: https://www.fs.usda.gov/Internet/FSE_DOCUMENTS/stelprdb5172123.pdf

USDA Forest Service
472
USDA Forest Service. 2004. 2003 Annual monitoring and evaluation report, Grand Mesa, Uncompahgre, and Gunnison National Forests. Accessed July 21, 2021, at: https://www.fs.usda.gov/Internet/FSE_DOCUMENTS/fseprd507106.pdf
USDA Forest Service. 2006a. Comprehensive evaluation report: Air, watershed and aquatic resources. Grand Mesa, Uncompahgre, and Gunnison National Forests.
USDA Forest Service. 2006b. Forest Service Handbook 2509.25: Watershed Conservation Practices Handbook, Chapter 10, Management Measures and Design Criteria. Denver: U.S. Department of Agriculture. U.S. Forest Service. Rocky Mountain Region.
USDA Forest Service. 2007. Grand Mesa, Uncompahgre, and Gunnison National Forests proposed land management plan. 186 pp.
USDA Forest Service. 2008a. National Forest System Land Management Planning (Forest Planning Rule). Accessed July 30, 2018, from the History of Forest Planning website at: https://www.fs.usda.gov/main/planningrule/history
USDA Forest Service. 2008b. Southern Rockies Lynx Management Direction Record of Decision. National Forests in Colorado and Southern Wyoming, October 2008. USDA Forest Service, Rocky Mountain Region. Accessed July 23, 2021, at: http://www.fs.usda.gov/detail/r2/landmanagement/planning/?cid=stelprdb5356865
USDA Forest Service. 2010a. Uncompahgre Plateau collaborative forest landscape restoration project proposal. Accessed February 6, 2019, at: https://www.fs.usda.gov/detail/gmug/landmanagement/projects/?cid=stelprdb5193325
USDA Forest Service. 2010b. 2009 National Visitor Use Monitoring (NVUM) results. Grand Mesa Uncompahgre, and Gunnison National Forest. Rocky Mountain Region.
USDA Forest Service. 2010c. Final supplement to the forest plan biological evaluation and conservation assessment for the Rocky Mountain bighorn sheep: Rio Grande National Forest. Rio Grande National Forest internal document, R. Ghormley, preparer. 75 pp. plus appendices.
USDA Forest Service. 2010d. Climate change considerations in land management plan revisions. USDA Forest Service Washington Office Ecosystem Management Coordination document dated January 20, 2010. Accessed July 19, 2021, at: https://www.fs.fed.us/emc/nepa/climate_change/includes/cc_land_mgmt_plan_rev_012010.pdf
USDA Forest Service. 2012a. National Forest system land management planning (2012 Planning Rule). 36 CFR Part 219.
USDA Forest Service. 2012b. National best management practices for water quality management on National Forest System lands, Volume 1: National core BMP technical guide. USDA Forest Service publication number FS-990a. 165 pp. Accessed July 23, 2021, at: https://www.fs.fed.us/biology/resources/pubs/watershed/FS_National_Core_BMPs_April2012.pdf
USDA Forest Service. 2014. Striving for inclusion: Addressing environmental justice for Forest Service NEPA. Authored by E. Grinspoon, J. Schaefers, R. Periman, J. Smalls, C.

GMUG National Forests Land Management Plan Draft Environmental Impact Statement: Volume 1
473
Manning, and T.L. Porto. Washington DC: U.S. Department of Agriculture, Forest Service. 20 pp.
USDA Forest Service. 2015a. The U.S. forest carbon accounting framework: Stocks and stock exchange, 1990-2016. General Technical Report NRS-154.
USDA Forest Service. 2015b. 2014 National Visitor Use Monitoring (NVUM) report. Grand Mesa Uncompahgre, and Gunnison National Forests, Delta, Colorado. Accessed July 23, 2021, at: https://www.fs.fed.us/recreation/programs/nvum/
USDA Forest Service. 2016. Spruce beetle epidemic and aspen decline management response final environmental impact statement and record of decision. Grand Mesa, Uncompahgre, and Gunnison National Forests, Delta, Colorado. Accessed February 6, 2019, at: https://www.fs.usda.gov/project/?project=42387
USDA Forest Service. 2017a. Grand Mesa, Uncompahgre, and Gunnison National Forests public participation strategy. Land and resource management plan revision. 7 pp. Forest plan revision website. Accessed October 11, 2018, at: https://www.fs.usda.gov/Internet/FSE_DOCUMENTS/fseprd542433.pdf
USDA Forest Service. 2017b. 2016 forest insect and disease conditions for the Grand Mesa, Uncompahgre, and Gunnison National Forests. Internal report from the Gunnison Service Center, Forest Health Protection, Rocky Mountain Region.
USDA Forest Service. 2017c. NorWeST stream temp regional database and modeled stream temperatures website. Accessed November 8, 2018, at: https://www.fs.fed.us/rm/boise/AWAE/projects/NorWeST.html
USDA Forest Service. 2017d. Natural Resource Manager – Infrastructure (NRM–Infra). Internal database and tools for natural resource management. Natural Resource Manager, Washington, DC. Accessed July 23, 2021, at: https://www.fs.fed.us/nrm/index.shtml
USDA Forest Service 2017e. Forest Inventory and Analysis. Internal database for forest vegetation status and trends. Forest Inventory and Analysis National Office, Washington DC. Accessed July 23, 2021, at: https://www.fia.fs.fed.us/
USDA Forest Service. 2018. Grand Mesa, Uncompahgre, and Gunnison National Forests draft revised forest plan assessment reports. Accessed November 3, 2018, at: https://www.fs.usda.gov/detail/gmug/landmanagement/planning/?cid=fseprd563243
USDA Forest Service. 2019. National Visitor Use Monitoring program. Accessed May 18, 2021, at: https://apps.fs.usda.gov/nvum/results/ReportCache/2019_A02004_Master_Report.pdf
USDA Forest Service. 2020a. Scenic character descriptions. Grand Mesa, Uncompahgre, and Gunnison National Forests. Nicole Hill, U.S. Forest Service Landscape Architect. Unpublished.
USDA Forest Service. 2020b. Sustainable recreation planning. Chapter 2310 of Forest Service Manual 2300 – Recreation, Wilderness, and Related Resource Management.
USDA Forest Service. 2021. Scenery management system inventory report. Grand Mesa, Uncompahgre, and Gunnison National Forests. Forest Plan Revision. Nicole Hill, U.S. Forest Service Landscape Architect. Unpublished.

USDA Forest Service
474
USDA Forest Service and USDI U.S. Fish and Wildlife Service (USDA Forest Service and USFWS). 2005. Canada lynx conservation agreement. USFS Agreement #00-MU-11015600-013.
USDI Bureau of Land Management (BLM). 2017. Colorado air resources management modeling study (CARMMS 2.0). 2025 modeling results for the high, low and medium oil and gas development scenarios, final. ENVIRON International Corporation 773 San Marin Drive, Suite 2115, Novato, California, 94998, (415) 899-0700.
USDI Bureau of Land Management and National Park Service, and USDA Forest Service (BLM, NPS, and USDA Forest Service). 2013. Gunnison Basin candidate conservation agreement programmatic biological assessment: Gunnison sage-grouse (Centrocercus minimus). Authors: Japuntich, R., and D. Long, BLM Gunnison Field Office. 139 pp.
USDI National Park Service (NPS). 2013. Air quality in national parks: Trends (2000–2009) and conditions (2005–2009). Natural Resource Report NPS/NRSS/ARD/NRR—2013/683. Air Resources Division, Denver, Colorado.
USDA Natural Resources Conservation Service (NRCS). 2021. A framework for conservation action in the Sagebrush Biome. Working Lands for Wildlife, USDA-NRCS. Washington DC. Accessed July 8, 2021, at: https://wlfw.rangelands.app/sagebrush/
USDI U.S. Fish and Wildlife Service (USFWS). 1994. Uncompahgre fritillary butterfly recovery plan. Denver, Colorado. 20 pp. Accessed July 23, 2021, at: https://ecos.fws.gov/docs/recovery_plan/940317.pdf
USDI U.S. Fish and Wildlife Service (USFWS). 2008. Biological opinion on the effects of the Southern Rockies Lynx Amendment on the distinct population segment of Canada lynx (Lynx canadensis) in the contiguous United States, in accordance with section 7 of the Endangered Species Act of 1973, as amended (16 U.S.C. 1531 et seq.). USFWS Ecological Services, Colorado Filed Office, Denver, Colorado. ES/CO: USFS/SRLA Tails: 65412-2008-F-00370 BO ES/LK-6-CO-08-F-024. Accessed July 23, 2021, at: http://www.fs.usda.gov/detail/r2/landmanagement/planning/?cid=stelprdb5356865
USDI U.S. Fish and Wildlife Service (USFWS). 2014a. Endangered and threatened wildlife and plants; threatened status for Gunnison sage-grouse. Federal Register 79(224): 69191-69310.
USDI U.S. Fish and Wildlife Service (USFWS). 2014b. Endangered and threatened wildlife and plants; designation of critical habitat for Gunnison sage-grouse, Final Rule. Federal Register 79(224):69192-69310.
USDI U.S. Fish and Wildlife Service (USFWS). 2019. Species status assessment report for the Gunnison sage-grouse (Centrocercus minimus) version: April 20, 2019. Accessed July 7, 2021, at: https://ecos.fws.gov/ecp0/profile/speciesProfile?sId=6040
USDI U.S. Fish and Wildlife Service (USFWS). 2020a. Final recovery plan for Gunnison sage-grouse (Centrocercus minimus). October 2020. U.S. Fish and Wildlife Service, Upper Colorado River Region, Lakewood, Colorado. 32 pp. Accessed July 7, 2021, at: https://ecos.fws.gov/docs/recovery_plan/2020-10-23_GUSG_FinalRP_v8.pdf
USDI U.S. Fish and Wildlife Service (USFWS). 2020b. Recovery implementation strategy for Gunnison sage-grouse (Centrocercus minimus). September 2020. U.S. Fish and

GMUG National Forests Land Management Plan Draft Environmental Impact Statement: Volume 1
475
Wildlife Service, Upper Colorado Basin Region, Lakewood, Colorado. 75 pages. Available online: https://ecos.fws.gov/ecp0/profile/speciesProfile?sId=6040
Vanbianchi, C., Gaines, W.L., Murphy, M.A., Pither, J., and Hodges, K.E. 2017. Habitat selection by Canada lynx: Making do in heavily fragmented landscapes. Biodiversity and Conservation, 26(14), 3343-3361. Doi:10.007/s10531-017-1409-6.
Volkova, L., Meyer, C.P., Murphy, S., Fairman, T., Reisen, F, and Weston, C. 2014. Fuel reduction burning mitigates wildfire effects on forest carbon and greenhouse gas emission. International Journal of Wildland Fire 23:771-780. Accessed July 29, 2021, at: https://doi.org/10.1071/WF14009
Vose, J.M., D.L. Peterson, and T. Patel-Weynand (eds.). 2012. Effects of climatic variability and change on forest ecosystems: A comprehensive science synthesis for the U.S. forest sector. General Technical Report PNW-GTR-870. Portland, Oregon: U.S. Department of Agriculture, Forest Service, Pacific Northwest Research Station. 265 pp.
Welch, B.L., and C. Criddle. 2003. Countering misinformation concerning big sagebrush. USDA Forest Service Research Paper RMRS-RP-40.
Welsh, H.H. 1990. Relictual amphibians and old-growth forests. Conservation Biology 4(3):309-319.
West, N.E., and J.A. Young 2000. Intermountain valleys and lower mountain slopes. Chapter 7. Pages 255–284 in: Barbour, M.G., and W.D. Billings (eds.), Northern American Terrestrial Vegetation. Second Edition. Cambridge University Press, Cambridge, England.
Westerling, A.L., H.G. Hidalgo, D.R Cayan, and T.W. Swetnam. 2006. Warming and earlier spring increase western U.S. forest wildfire activity. Science 313(18):940-943.
White, P.S., and Pickett, S.T.A. 1985. Natural disturbance and patch dynamics: An introduction. Accessed July 23, 2021, at: https://doi.org/10.1016/B978-0-12-554520-4.50002-2
White, M.A., and J.L. Vankat. 1993. Middle and high elevation coniferous forest communities of the North Rim region of Grand Canyon National Park, Arizona, USA. Vegetation 109:161-174.
Wiens, J.A., G.D. Hayward, H.D. Safford, and C.M. Giffen (eds.). 2012. Historical environmental variation in conservation and natural resource management. Wiley-Blackwell, Hoboken, New Jersey.
Wisdom, M.J., A.A. Ager, H.K. Preisler, N.J. Cimon, and B.K. Johnson. 2005. Effects of off-road recreation on mule deer and elk. Pages 67-80 in: Wisdom, M.J. (ed.). The Starkey Project: A Synthesis of Long-Term Studies of Elk and Mule Deer. Reprinted from the 2004 Transactions of the North American Wildlife and Natural Resources Conference, Alliance Communications Group, Lawrence, Kansas.
Wisdom, M.J., Preisler, H.K., Naylor, L.M., Anthony, R.G., Johnson, B.K., and Rowland, M.M. 2018. Elk responses to trail-based recreation on public forests. Forest Ecology and Management, vol. 411, pp. 223-233. Accessed July 23, 2021, at: https://doi.org/10.1016/j.foreco.2018.01.032

USDA Forest Service
476
Worrall J.J., A.G. Keck, and S.B. Marchetti. 2015. Populus tremuloides stands continue to deteriorate after drought-incited sudden aspen decline. Canadian Journal of Forest Research 45(12):1768-1774.
Wright, H.A., L.F. Neuenschwander, and C.M. Britton. 1979. The role and use of fire in sagebrush-grass and pinyon-juniper plant communities: A state-of the art review. General Technical Report INT-58. Ogden, Utah: USDA Forest Service, Intermountain Forest and Range Experiment Station.
Wurtzebach, Z., and C. Schultz. 2016. Measuring ecological integrity: History, practical applications, and research opportunities. BioScience 66(6):446–457.
Young, J.R., C.E. Braun, S.J. Oyler-McCance, C.L. Aldridge, P.A. Magee, and M.A. Schroeder. 2020. Gunnison sage-grouse (Centrocercus minimus), version 1.0. In: Birds of the World website (P.G. Rodewald (ed.). Cornell Lab of Ornithology, Ithaca, New York. Accessed July 7, 2021, at: https://doi.org/10.2173/bow.gusgro.01
Zvolanek, E., J. Kuiper, A. Carr, and K. Hlava. 2013. Analysis of renewable energy potential on U.S. national forest lands. University of North Texas Digital Library. Accessed May 18, 2017, at: https://digital.library.unt.edu/ark:/67531/metadc871583/


United States Department of Agriculture Forest Service Grand Mesa, Uncompahgre, and Gunnison National Forests 2250 South Main Street Delta, CO 81416 www.fs.usda.gov/gmug/