DRAFT BUDGET AND SUPPORTING DOCUMENTATION OF ...
72
1 DRAFT BUDGET AND SUPPORTING DOCUMENTATION OF MUNICIPALITIES TABLE OF CONTENTS PART 1 – ANNUAL BUDGET 1.1 MAYORS REPORT 5 1.2 COUNCIL RESOLUTION 6 1.3 EXECUTIVE SUMMARY 7 1.4 OPERATION REVENUE FRAMEWORK 8 1.5 OPERATING EXPENDITURE FRAMEWORK 15 1.6 CAPITAL EXPENDITURE 17 1.7 ANNUAL BUDGET TABLES - PARENT MUNICIPALITY 18 PART 2 – SUPPORTING DOCUMENTATION 2.1 OVERVIEW OF THE ANNUAL BUDGET PROCESS 28 2.2 OVERVIEW OF ALIGNMENT OF ANNUAL BUDGET WITH IDP 33 2.3 MEASURABLE PERFORMANCE OBJECTIVES AND INDICATORS.... 36 2.4 OVERVIEW OF BUDGET RELATED-POLICIES. 45 2.5 OVERVIEW OF BUDGET ASSUMPTIONS.. 46 2.6 OVERVIEW OF BUDGET FUNDING.. 48 2.7 EXPENDITURE ON GRANTS AND RECONCILIATIONS OF UNSPENT FUNDS.. 61 2.8 COUNCILLOR AND EMPLOYEE BENEFITS 63 2.9 MONTHLY TARGETS FOR REVENUE, EXPENDITURE AND CASH 68 FLOW 2.10 ANNUAL BUDGETS AND SDBIPS – INTERNAL DEPARTMENTS. 68 2.11 CONTRACTS HAVING FUTURE BUDGETARY IMPLICATIONS 68 2.12 CAPITAL EXPENDITURE DETAILS 68 2.13 LEGISLATION COMPLIANCE STATUS 69
Transcript of DRAFT BUDGET AND SUPPORTING DOCUMENTATION OF ...
1
DRAFT BUDGET AND SUPPORTING DOCUMENTATION OF MUNICIPALITIES
TABLE OF CONTENTS
PART 1 – ANNUAL BUDGET
1.1 MAYORS REPORT 5
1.2 COUNCIL RESOLUTION 6
1.3 EXECUTIVE SUMMARY 7
1.4 OPERATION REVENUE FRAMEWORK 8
1.5 OPERATING EXPENDITURE FRAMEWORK 15
1.6 CAPITAL EXPENDITURE 17
1.7 ANNUAL BUDGET TABLES - PARENT MUNICIPALITY 18
PART 2 – SUPPORTING DOCUMENTATION
2.1 OVERVIEW OF THE ANNUAL BUDGET PROCESS 28
2.2 OVERVIEW OF ALIGNMENT OF ANNUAL BUDGET WITH IDP 33
2.3 MEASURABLE PERFORMANCE OBJECTIVES AND INDICATORS.... 36
2.4 OVERVIEW OF BUDGET RELATED-POLICIES. 45
2.5 OVERVIEW OF BUDGET ASSUMPTIONS.. 46
2.6 OVERVIEW OF BUDGET FUNDING.. 48
2.7 EXPENDITURE ON GRANTS AND RECONCILIATIONS OF UNSPENT FUNDS.. 61
2.8 COUNCILLOR AND EMPLOYEE BENEFITS 63
2.9 MONTHLY TARGETS FOR REVENUE, EXPENDITURE AND CASH 68
FLOW
2.10 ANNUAL BUDGETS AND SDBIPS – INTERNAL DEPARTMENTS. 68
2.11 CONTRACTS HAVING FUTURE BUDGETARY IMPLICATIONS 68
2.12 CAPITAL EXPENDITURE DETAILS 68
2.13 LEGISLATION COMPLIANCE STATUS 69
2
2.14 OTHER SUPPORTING DOCUMENTS 69
List of Tables
Table 1 Consolidated Overview of the 2015/16 MTREF 8
Table 2 Summary of revenue classified by main revenue source 9
Table 3 Percentage growth in revenue by main revenue source 10
Table 4 Operating Transfers and Grant Receipts 11
Table 5 Proposed Water Tariffs 13
Table 6 Comparison between current sanitation charges and increases 14
Table 7 Comparison between current waste removal fees and increases 14
Table 8 Summary of operating expenditure by standard classification item 15
Table 9 2011/12 Medium-term capital budget per vote 17
Table 10 MBRR Table A1 - Budget Summary 18
Table 11 MBRR Table A2 - Budgeted Financial Performance (revenue and expenditure by standard
classification) 19
Table 12 MBRR Table A3 - Budgeted Financial Performance (revenue and expenditure by municipal
vote) 20
Table 13 MBRR Table A4 - Budgeted Financial Performance (revenue and expenditure) 20
Table 14 MBRR Table A5 - Budgeted Capital Expenditure by vote, standard classification and
funding source 20
Table 15 MBRR Table A6 - Budgeted Financial Position 21
Table 16 MBRR Table A7 - Budgeted Cash Flow Statement 22
Table 17 MBRR Table A8 - Cash Backed Reserves/Accumulated Surplus Reconciliation 22
Table 18 MBRR Table A9 - Asset Management 23
Table 19 MBRR Table A10 - Basic Service Delivery Measurement 23
Table 20 IDP/ Budget Activity Schedule 31
Table 21 MBRR Table SA4 - Reconciliation between the IDP strategic objectives and budgeted
revenue 34
Table 22 MBRR Table SA5 - Reconciliation between the IDP strategic objectives and budgeted
operating expenditure 35
3
Table 23 MBRR Table SA7 - Reconciliation between the IDP strategic objectives and budgeted
capital expenditure 36
Table 24 MBRR Table SA7 - Measurable performance objectives 39
Table 25 MBRR Table SA8 - Performance indicators and benchmarks 40
Table 26 Credit rating outlook 47
Table 27 budget financial performance revenue and expenditure 48
Table 28 Breakdown of the operating revenue over the medium-term 49
Table 29 Proposed tariff increases over the medium-term 50
Table 30 MBRR SA15 – Detail Investment Information 51
Table 31 MBRR SA16 – Investment particulars by maturity 51
Table 32 Sources of capital revenue over the MTREF 52
Table 33 MBRR Table SA 18 - Capital transfers and grant receipts 53
Table 34 MBRR Table A7 - Budget cash flow statement 54
Table 35 MBRR Table A8 - Cash backed reserves/accumulated surplus reconciliation 55
Table 36 MBRR SA10 – Funding compliance measurement 57
Table 37 MBRR SA19 - Expenditure on transfers and grant programmes 61
Table 38 MBRR SA 20 - Reconciliation between of transfers, grant receipts and unspent funds 62
Table 39 MBRR SA22 - Summary of councilor and staff benefits 63
Table 40 MBRR SA23 - Salaries, allowances and benefits (political office bearers/councilors/ senior
managers 66
Table 41 MBRR SA24 – Summary of personnel numbers 67
Table 42 MBRR SA25 - Budgeted monthly revenue and expenditure 68
Table 43 MBRR SA26 - Budgeted monthly revenue and expenditure (municipal vote) 68
Table 44 MBRR SA27 - Budgeted monthly revenue and expenditure (standard classification) 68
Table 45 MBRR SA28 - Budgeted monthly capital expenditure (municipal vote) 68
Table 46 MBRR SA29 - Budgeted monthly capital expenditure (standard classification) 68
Table 47 MBRR SA30 - Budgeted monthly cash flow 68
Table 48 MBRR SA 34a - Capital expenditure on new assets by asset class 68
Table 49 MBRR SA34b - Capital expenditure on the renewal of existing assets by asset class 68
4
Table 50 MBRR SA34c - Repairs and maintenance expenditure by asset class 68
Table 51 MBRR SA34d- Depreciation by assets classifications 68
Table 52 MBRR SA35 - Future financial implications of the capital budget 68
Table 53 MBRR SA36 - Detailed capital budget per municipal vote 68
Table 54 MBRR SA37 - Projects delayed from previous financial year 68
Quality Certificate
5
PART 1 – DRAFT BUDGET
1.1 MAYORAL SPEECH
Madam Speaker
Exco members
Chief Whip of the ruling party
Fellow Councillors
Municipal Manager
Directors
Ba ka difokeng
Ladies and gentlemen
Today we hold this council with the principal aim of adopting the 2015/2016 Draft IDP and
budget. We presented both the draft IDP and budget to the IDP Representative Forum on
the 31st March 2015 at Kampersrus. It must be emphasized that all IDP phases were duly
presented to the IDP Representative Forum.
Let me indicate that the enthusiasm that was displayed by our communities in making
meaningful and constructive contributions is quite humbling. People raised very genuine
concerns and some tenets of appreciation for the good work that this council is doing in
ensuring that Maruleng communities access most of the services according to the RDP
standards. Madam Speaker council must note that both oral and written submissions that
were of enriching nature were made to the draft IDP and budget. The council today must
robustly engage on those submissions to ensure that the people’s participation was not in
vain.
Madam Speaker, the council will agree with me that our IDP and budget are well aligned
and primarily intend to achieve the government’s objective of fighting poverty and job
creation. The 2011 census indicated that unemployment is rife in our area. When we begin
to implement our projects, we will continue to be bias in terms of offering employment
opportunities to women and young people, as they are in majority.
In conclusion Madam Speaker, I request our people to conduct themselves in a dignified
manner during the public consultation process that will be conducted by the MDB on
6
proposed municipal disestablishment. Robust debates bear fruitful results. Let us all keep it
in mind that Minister Gordhan will only do what is good for the country. Thank you.
1.2 COUNCIL RESOLUTIONS
On the of 31 of March 2015 Council of Maruleng Local Municipality met in the Council Chambers
to adopt the draft budget of the municipality for the financial year 2015/16. The Council discussed
the budget and the following resolutions were considered and taken in to consideration for public
participation.
1. The Council of Maruleng Local Municipality, acting in terms of section 24 of the Municipal
Finance Management Act, (Act 56 of 2003) adopt and consider:
1.1. The draft budget of the municipality for the financial year 2015/16 and the multi-year and
single-year capital appropriations as set out in the following tables:
1.1.1. Budgeted Financial Performance (revenue and expenditure by standard classification) as
contained in Table 11 on page 19;
1.1.2. Budgeted Financial Performance (revenue and expenditure by municipal vote) as contained in
Table 12 on page 20;
1.1.3. Budgeted Financial Performance (revenue by source and expenditure by type as contained in
Table 13 on page 20; and
1.1.4. Multi-year and single-year capital appropriations by municipal vote and standard
classification and associated funding by source as contained in Table 14 on page
20
Maruleng Local Municipality 2015/16 draft budget and MTREF
1.2. The financial position, cash flow budget, cash-backed reserve/accumulated surplus,
Assets management and basic service delivery targets are approved as set out in the
Following tables:
1.2.1. Budgeted Financial Position as contained in Table 15 on page 21;
1.2.2. Budgeted Cash Flows as contained in Table 16 on page 22;
1.2.3. Cash backed reserves and accumulated surplus reconciliation as contained in
Table 17 on page 22;
1.2.4. Asset management as contained in Table 18 on page 23; and
1.2.5. Basic service delivery measurement as contained in Table 19 on page 23.
2. The Council of Maruleng Local Municipality, acting in terms of section 75A of the Local
Government: Municipal Systems Act (Act 32 of 2000) noted and adopts with effect from 1 July
2015:
2.1. The tariffs for the supply of water
2.2. The tariffs for sanitation services
2.3. The tariffs for solid waste services
3. The Council of Maruleng Local Municipality, acting in terms of 75A of the Local Government:
Municipal Systems Act (Act 32 of 2000) noted and adopts with effect from 1 July 2015 the tariffs
for other services.
4. To give proper effect to the municipality’s draft budget, the Council of Maruleng Local
Municipality noted:
7
4.1. That cash backing is implemented through the utilization of a portion of the revenue generated
from property rates to ensure that all capital reserves and unspent conditional grants are cash backed
as required in terms of the municipality’s funding and reserves policy as prescribed by section 8 of the
Municipal Budget and Reporting Regulations
1.3. EXECUTIVE SUMMARY
The application of sound financial planning and financial management principles are very critical
in achieving the Municipality’s financial objectives
The following were the challenges experience during the compilation of the 2015/2016 MTREF
The ongoing difficulties in the national and local economy
Ageing and poorly maintained water and roads infrastructure
The need to reprioritise projects and expenditure within the existing limited resource
taking into account the current cash flow limitations
Wage increases for municipal staff and need to fill critical vacancies
The following budget principles and guidelines directly informed the compilation of the
2015/2016 MTREF
The 2014/15 Adjustments budget priorities and targets, as well as the base line allocations
contained in that Adjustments were adopted as the upper limits for the new baselines for
the 2015/2016 draft budget
Tariff and property rate increases should be affordable and should generally not exceed
inflation as measured by the CPI, except where there are price increases in the inputs of
services that are beyond the control of the municipality, for instance the cost of bulk
water. In addition, tariffs need to remain or move towards being cost reflective, and
should take into account the need to address infrastructure backlogs;
There will be no budget allocated to national and provincial funded projects unless the
necessary grants to the municipality are reflected in the national and provincial budget
and have been gazette as required by the annual Division of Revenue Act;
The following table is a consolidated overview of the proposed 2015/2016 MTREF
8
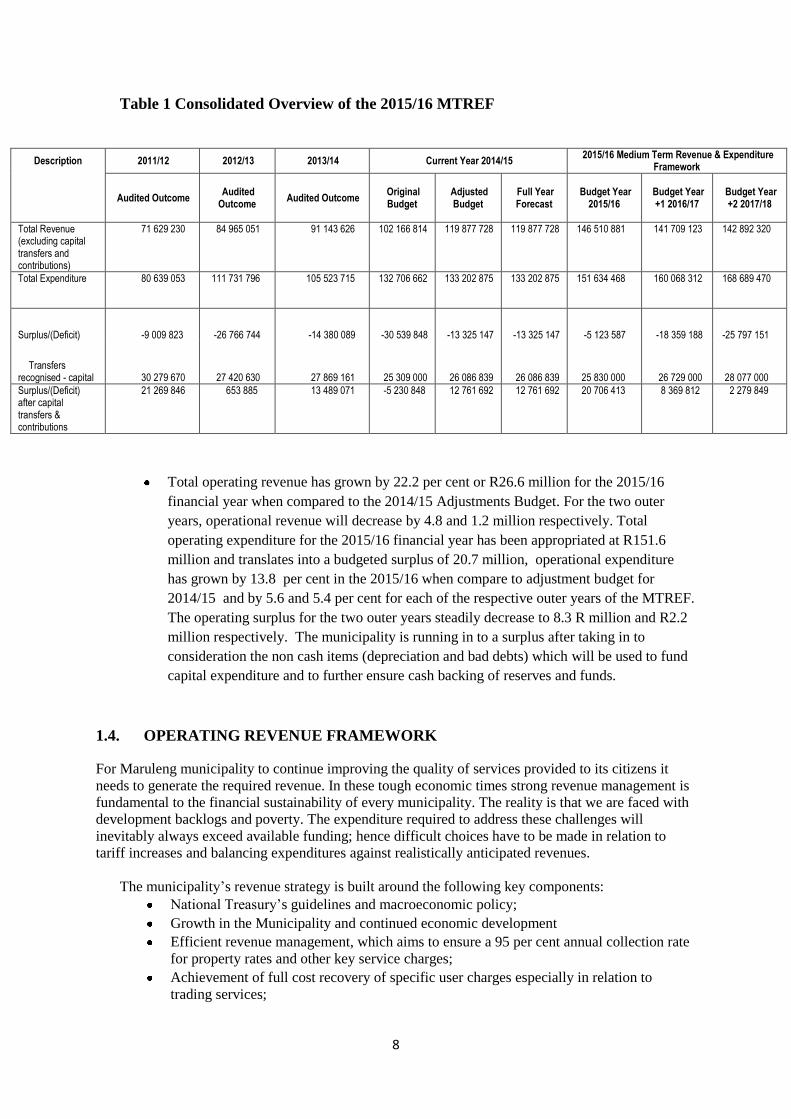
Table 1 Consolidated Overview of the 2015/16 MTREF
Description 2011/12 2012/13 2013/14 Current Year 2014/15 2015/16 Medium Term Revenue & Expenditure
Framework
Audited Outcome Audited Outcome
Audited Outcome Original Budget
Adjusted Budget
Full Year Forecast
Budget Year 2015/16
Budget Year +1 2016/17
Budget Year +2 2017/18
Total Revenue (excluding capital transfers and contributions)
71 629 230 84 965 051 91 143 626 102 166 814 119 877 728 119 877 728 146 510 881 141 709 123 142 892 320
Total Expenditure 80 639 053 111 731 796 105 523 715 132 706 662 133 202 875 133 202 875 151 634 468 160 068 312 168 689 470
Surplus/(Deficit) -9 009 823 -26 766 744 -14 380 089 -30 539 848 -13 325 147 -13 325 147 -5 123 587 -18 359 188 -25 797 151
Transfers recognised - capital 30 279 670 27 420 630 27 869 161 25 309 000 26 086 839 26 086 839 25 830 000 26 729 000 28 077 000
Surplus/(Deficit) after capital transfers & contributions
21 269 846 653 885 13 489 071 -5 230 848 12 761 692 12 761 692 20 706 413 8 369 812 2 279 849
Total operating revenue has grown by 22.2 per cent or R26.6 million for the 2015/16
financial year when compared to the 2014/15 Adjustments Budget. For the two outer
years, operational revenue will decrease by 4.8 and 1.2 million respectively. Total
operating expenditure for the 2015/16 financial year has been appropriated at R151.6
million and translates into a budgeted surplus of 20.7 million, operational expenditure
has grown by 13.8 per cent in the 2015/16 when compare to adjustment budget for
2014/15 and by 5.6 and 5.4 per cent for each of the respective outer years of the MTREF.
The operating surplus for the two outer years steadily decrease to 8.3 R million and R2.2
million respectively. The municipality is running in to a surplus after taking in to
consideration the non cash items (depreciation and bad debts) which will be used to fund
capital expenditure and to further ensure cash backing of reserves and funds.
1.4. OPERATING REVENUE FRAMEWORK
For Maruleng municipality to continue improving the quality of services provided to its citizens it
needs to generate the required revenue. In these tough economic times strong revenue management is
fundamental to the financial sustainability of every municipality. The reality is that we are faced with
development backlogs and poverty. The expenditure required to address these challenges will
inevitably always exceed available funding; hence difficult choices have to be made in relation to
tariff increases and balancing expenditures against realistically anticipated revenues.
The municipality’s revenue strategy is built around the following key components:
National Treasury’s guidelines and macroeconomic policy;
Growth in the Municipality and continued economic development
Efficient revenue management, which aims to ensure a 95 per cent annual collection rate
for property rates and other key service charges;
Achievement of full cost recovery of specific user charges especially in relation to
trading services;
9
Determining the tariff escalation rate by establishing/calculating the revenue requirement
of each service;
The municipality’s Property Rates Policy approved in terms of the Municipal Property
Rates Act, 2004 (Act 6 of 2004) (MPRA);
The municipality’s Indigent Policy and rendering of free basic services; and
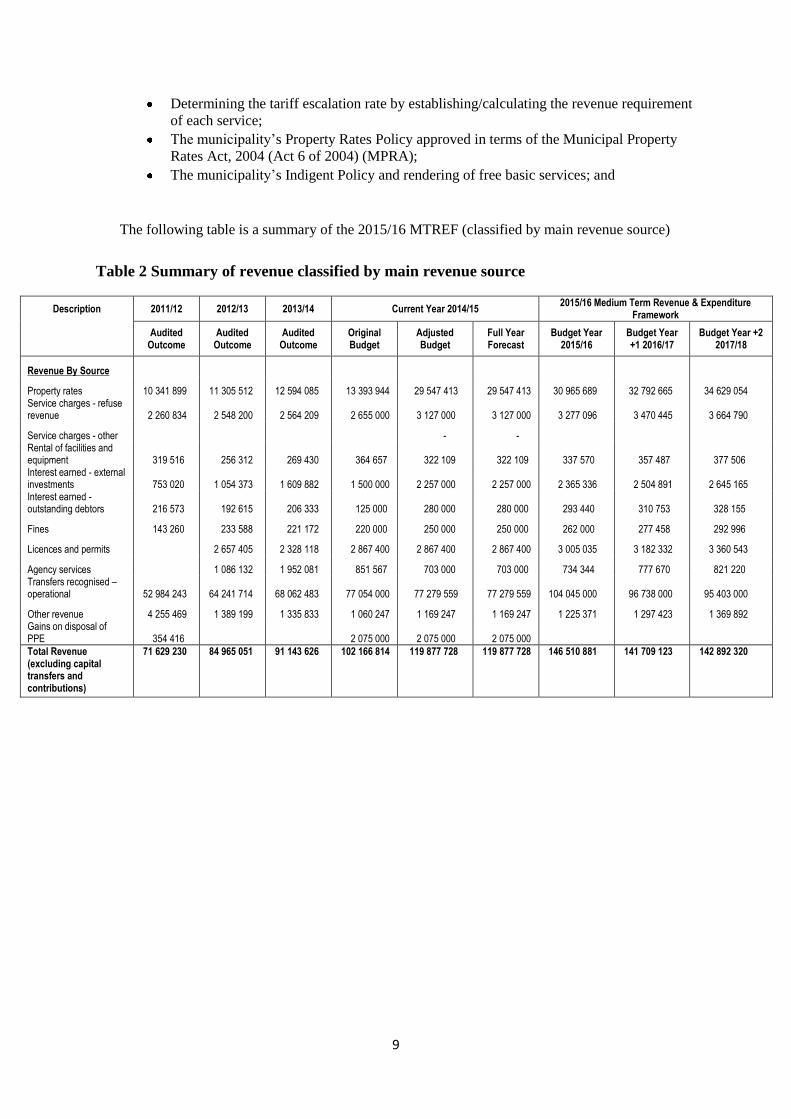
The following table is a summary of the 2015/16 MTREF (classified by main revenue source)
Table 2 Summary of revenue classified by main revenue source
Description 2011/12 2012/13 2013/14 Current Year 2014/15 2015/16 Medium Term Revenue & Expenditure
Framework
Audited
Outcome Audited
Outcome Audited
Outcome Original Budget
Adjusted Budget
Full Year Forecast
Budget Year 2015/16
Budget Year +1 2016/17
Budget Year +2 2017/18
Revenue By Source
Property rates 10 341 899 11 305 512 12 594 085 13 393 944 29 547 413 29 547 413 30 965 689 32 792 665 34 629 054 Service charges - refuse revenue 2 260 834 2 548 200 2 564 209 2 655 000 3 127 000 3 127 000 3 277 096 3 470 445 3 664 790
Service charges - other - - Rental of facilities and equipment 319 516 256 312 269 430 364 657 322 109 322 109 337 570 357 487 377 506 Interest earned - external investments 753 020 1 054 373 1 609 882 1 500 000 2 257 000 2 257 000 2 365 336 2 504 891 2 645 165 Interest earned - outstanding debtors 216 573 192 615 206 333 125 000 280 000 280 000 293 440 310 753 328 155
Fines 143 260 233 588 221 172 220 000 250 000 250 000 262 000 277 458 292 996
Licences and permits 2 657 405 2 328 118 2 867 400 2 867 400 2 867 400 3 005 035 3 182 332 3 360 543
Agency services 1 086 132 1 952 081 851 567 703 000 703 000 734 344 777 670 821 220 Transfers recognised – operational 52 984 243 64 241 714 68 062 483 77 054 000 77 279 559 77 279 559 104 045 000 96 738 000 95 403 000
Other revenue 4 255 469 1 389 199 1 335 833 1 060 247 1 169 247 1 169 247 1 225 371 1 297 423 1 369 892 Gains on disposal of PPE 354 416 2 075 000 2 075 000 2 075 000
Total Revenue (excluding capital transfers and contributions)
71 629 230 84 965 051 91 143 626 102 166 814 119 877 728 119 877 728 146 510 881 141 709 123 142 892 320

10
Table 3 Percentage growth in revenue by main revenue source
Description 2014/15 2015/16 Medium Term Revenue & Expenditure Framework
Adjusted Budget
% Budget Year
2015/16 %
Budget Year +1 2016/17
% Budget Year +2 2017/18 %
Revenue By Source
Property rates 29 547 413 25% 30 965 689 21% 32 792 665 23% 34 629 054 24% Service charges - refuse revenue 3 127 000 3% 3 277 096 2% 3 470 445 2% 3 664 790 3% Rental of facilities and equipment 322 109 0% 337 570 0% 357 487 0% 377 506 0% Interest earned - external investments 2 257 000 2% 2 365 336 2% 2 504 891 2% 2 645 165 2% Interest earned - outstanding debtors 280 000 0% 293 440 0% 310 753 0% 328 155 0%
Fines 250 000 0% 262 000 0% 277 458 0% 292 996 0%
Licences and permits 2 867 400 2% 3 005 035 2% 3 182 332 2% 3 360 543 2%
Agency services 703 000 1% 734 344 1% 777 670 1% 821 220 1% Transfers recognised – operational 77 279 559 64% 104 045 000 71% 96 738 000 68% 95 403 000 67%
Other revenue 1 169 247 1% 1 225 371 1% 1 297 423 1% 1 369 892 1%
Gains on disposal of PPE 2 075 000 2% 0% 0% 0%
Total Revenue (excluding capital transfers and contributions)
119 877 728 100% 146 510 881 100% 141 709 123 100% 142 892 320 100%
In line with the formats prescribed by the Municipal Budget and Reporting Regulations, capital
transfers and contributions are excluded from the operating statement, as inclusion of these revenue
sources would distort the calculation of the operating surplus/deficit.
Revenue generated from rates and services charges forms only 23 percentage of the revenue basket
for the Municipality because the Municipality depends mainly on grants.
In the 2015/16 financial year, revenue from rates and services charges totaled R34.2 million or 23 per
cent as calculated to the total revenue. This increases to R36.3 million and R38.3 million in the
respective financial years of the MTREF. The above table excludes revenue foregone arising from
discounts and rebates associated with the tariff policies of the Municipality
Apart from Transfers recognized – operational which is about 71 percentage of the total revenue mix,
property rates is the largest own revenue source in 2015/16 financial period. The second largest own
sources are licenses and permits which is 2 percent of the total revenue. The other revenue consists
of various items such as town planning fees, building plan fees, clearance certificates, rental sign
boards, tender documents ,etc. contained 1 percent when compared to total revenue. Municipality
has been urged to review the tariffs of these items on an annual basis to ensure they are cost reflective
and market related.
Operating grants and transfers totals R104 million in the 2015/16 financial year and steadily
decreased to R96.7 million by 2016/17 and R95.4 respectively. Note that the year-on-year growth for
the 2015/16 and 2016/17 financial year are 71 per cent and decreased to 68 and 67 percent in the two
outer years. The reason for decreased for the two outer years is that, in 205/16 financial period the
municipality will be allocated the money for INEG and EPWP according to the DORA and the
11
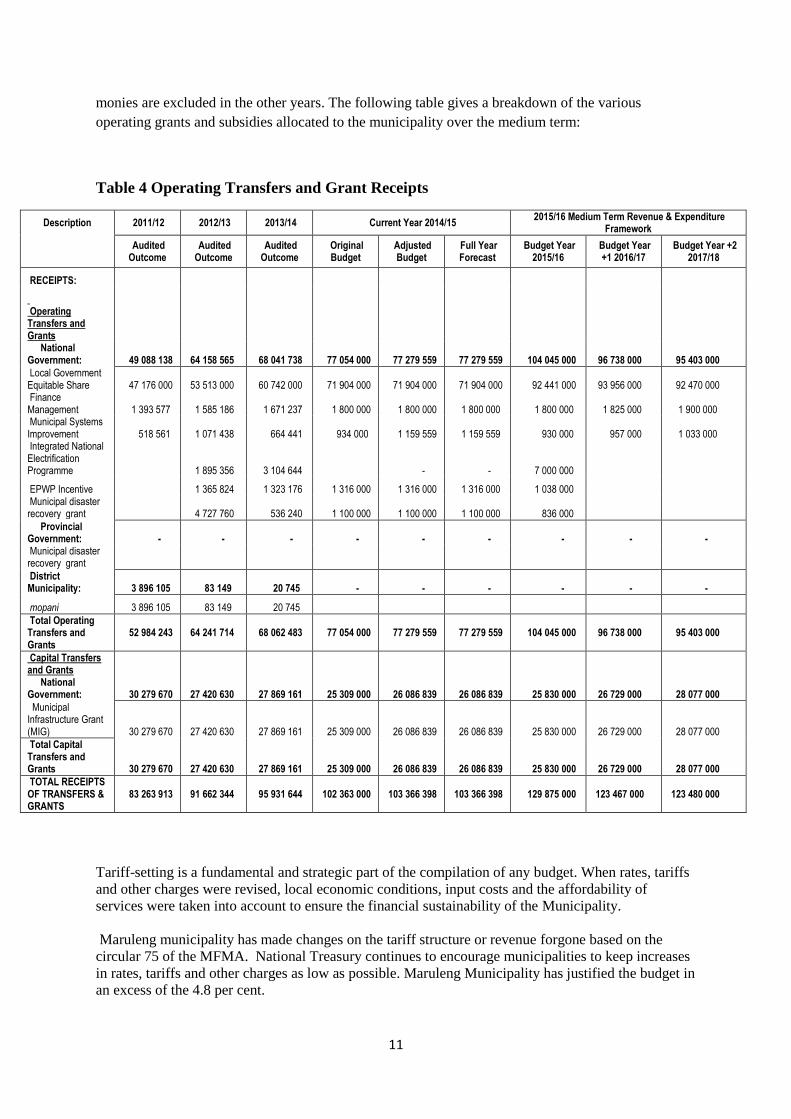
monies are excluded in the other years. The following table gives a breakdown of the various
operating grants and subsidies allocated to the municipality over the medium term:
Table 4 Operating Transfers and Grant Receipts
Description 2011/12 2012/13 2013/14 Current Year 2014/15 2015/16 Medium Term Revenue & Expenditure
Framework
Audited Outcome
Audited Outcome
Audited Outcome
Original Budget
Adjusted Budget
Full Year Forecast
Budget Year 2015/16
Budget Year +1 2016/17
Budget Year +2 2017/18
RECEIPTS:
Operating Transfers and Grants
National Government: 49 088 138 64 158 565 68 041 738 77 054 000 77 279 559 77 279 559 104 045 000 96 738 000 95 403 000
Local Government Equitable Share 47 176 000 53 513 000 60 742 000 71 904 000 71 904 000 71 904 000 92 441 000 93 956 000 92 470 000 Finance Management 1 393 577 1 585 186 1 671 237 1 800 000 1 800 000 1 800 000 1 800 000 1 825 000 1 900 000 Municipal Systems Improvement 518 561 1 071 438 664 441 934 000 1 159 559 1 159 559 930 000 957 000 1 033 000 Integrated National Electrification Programme 1 895 356 3 104 644 - - 7 000 000
EPWP Incentive 1 365 824 1 323 176 1 316 000 1 316 000 1 316 000 1 038 000 Municipal disaster recovery grant 4 727 760 536 240 1 100 000 1 100 000 1 100 000 836 000
Provincial Government: - - - - - - - - - Municipal disaster recovery grant
District Municipality: 3 896 105 83 149 20 745 - - - - - -
mopani 3 896 105 83 149 20 745
Total Operating Transfers and Grants
52 984 243 64 241 714 68 062 483 77 054 000 77 279 559 77 279 559 104 045 000 96 738 000 95 403 000
Capital Transfers and Grants
National Government: 30 279 670 27 420 630 27 869 161 25 309 000 26 086 839 26 086 839 25 830 000 26 729 000 28 077 000
Municipal Infrastructure Grant (MIG) 30 279 670 27 420 630 27 869 161 25 309 000 26 086 839 26 086 839 25 830 000 26 729 000 28 077 000
Total Capital Transfers and Grants 30 279 670 27 420 630 27 869 161 25 309 000 26 086 839 26 086 839 25 830 000 26 729 000 28 077 000
TOTAL RECEIPTS OF TRANSFERS & GRANTS
83 263 913 91 662 344 95 931 644 102 363 000 103 366 398 103 366 398 129 875 000 123 467 000 123 480 000
Tariff-setting is a fundamental and strategic part of the compilation of any budget. When rates, tariffs
and other charges were revised, local economic conditions, input costs and the affordability of
services were taken into account to ensure the financial sustainability of the Municipality.
Maruleng municipality has made changes on the tariff structure or revenue forgone based on the
circular 75 of the MFMA. National Treasury continues to encourage municipalities to keep increases
in rates, tariffs and other charges as low as possible. Maruleng Municipality has justified the budget in
an excess of the 4.8 per cent.

12
It must also be appreciated that the consumer price index, as measured by CPI, is not a good measure
of the cost increases of goods and services relevant to municipalities. The basket of goods and
services utilised for the calculation of the CPI consist of items such as food, petrol and medical
services, whereas the cost drivers of a municipality are informed by items such as the cost of
remuneration, bulk purchases of Municipality and water, petrol, diesel, chemicals, cement etc. The
current challenge facing the Municipality is managing the gap between cost drivers and tariffs levied,
as any shortfall must be made up by either operational efficiency gains or service level reductions.
Within this framework the Municipality has undertaken the tariff setting process relating to service
charges as follows
1.4.1. Property Rates
Property rates cover the cost of the provision of general services. Determining the effective property
rate tariff is therefore an integral part of the municipality’s budgeting process.
National Treasury’s MFMA Circular No. 51 deals, inter alia with the implementation of the
Municipal Property Rates Act, with the regulations issued by the Department of Co-operative
Governance. These regulations came into effect on 1 July 2009 and prescribe the rate ratio for the
non-residential categories, public service infrastructure and agricultural properties relative to
residential properties to be 0, 73:1 the implementation of these regulations was done in the previous
budget process and the Property Rates Policy of the Municipality has been amended accordingly.
The following stipulations in the Property Rates Policy are highlighted:
The first R15 000 of the market value of a property used for residential purposes is excluded
from the rate-able value (Section 17(h) of the MPRA).
For pensioners, physically and mentally disabled persons, a maximum/total rebate of 50 per cent
(calculated on a sliding scale) will be granted to owners of rate-able property if the total gross
income of the applicant and/or his/her spouse, if any, does not to exceed the amount equal to
twice the annual state pension as approved by the National Government for a financial year. In
this regard the following stipulations are relevant:
o The rate-able property concerned must be occupied only by the applicant and his/her
spouse, if any, and by dependants without income;
o The applicant must submit proof of his/her age and identity and, in the case of a
physically or mentally handicapped person, proof of certification by a Medical Officer of
Health, also proof of the annual income from a social pension;
o The applicant’s account must be paid in full, or if not, an arrangement to pay the debt
should be in place; and
o The property must be categorized as residential.
The Municipality may award a 100 per cent grant-in-aid on the assessment rates of rate-able
properties of certain classes such as registered welfare organizations, institutions or
organizations performing charitable work, sports grounds used for purposes of amateur sport. The owner of such a property must apply to the Chief Financial Officer in the prescribed format for such a grant.
The Municipality does not have special rating; one levying rate is applied for all categories. The current levying rate is 0.0107 for 2015/2016.
13
1.4.2. Sale of Water and Impact of Tariff Increases
South Africa faces similar challenges with regard to water supply as it did with Municipality, since
demand growth outstrips supply. Consequently, National Treasury is encouraging all municipalities to
carefully review the level and structure of their water tariffs to ensure:
Water tariffs are fully cost-reflective – including the cost of maintenance and renewal of
purification plants, water networks and the cost associated with reticulation expansion;
Water tariffs are structured to protect basic levels of service and ensure the provision of free
water to the poorest of the poor (indigent); and
Water tariffs are designed to encourage efficient and sustainable consumption.
Maruleng Municipality is not a water authority in terms of the Act but rendering the service on behalf
of the District. The Municipality receives bulk water from the Department of Public Works.
A tariff increase of 4.8 per cent from 1 July 2015 for water is proposed. This is based on the increase
in the cost of other inputs.
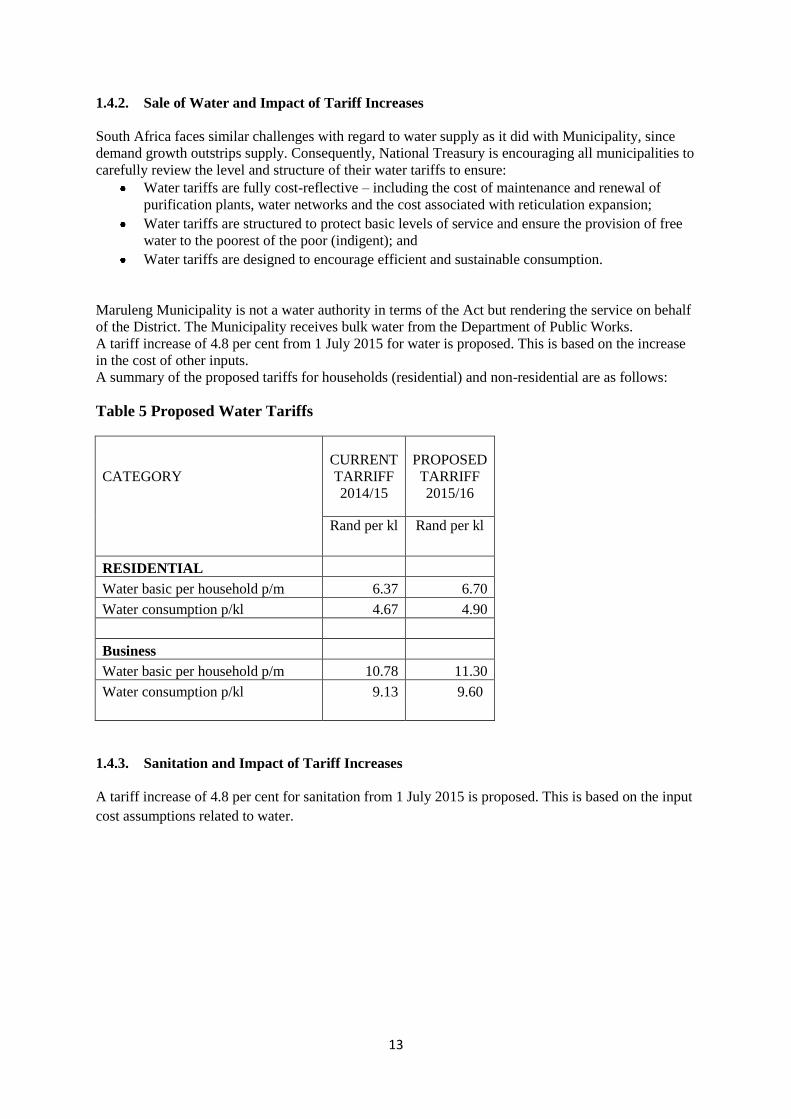
A summary of the proposed tariffs for households (residential) and non-residential are as follows:
Table 5 Proposed Water Tariffs
CATEGORY
CURRENT
TARRIFF
2014/15
PROPOSED
TARRIFF
2015/16
Rand per kl Rand per kl
RESIDENTIAL
Water basic per household p/m 6.37 6.70
Water consumption p/kl 4.67 4.90
Business
Water basic per household p/m 10.78 11.30
Water consumption p/kl 9.13 9.60
1.4.3. Sanitation and Impact of Tariff Increases
A tariff increase of 4.8 per cent for sanitation from 1 July 2015 is proposed. This is based on the input
cost assumptions related to water.
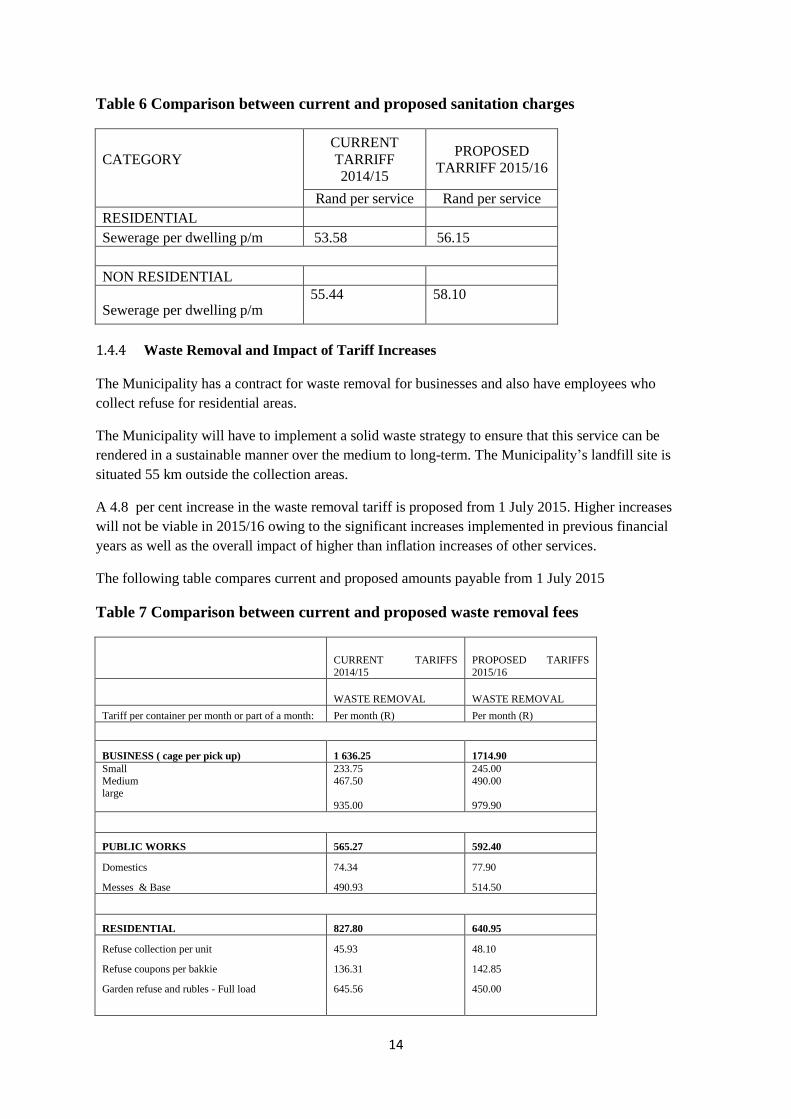
14
Table 6 Comparison between current and proposed sanitation charges
CATEGORY
CURRENT
TARRIFF
2014/15
PROPOSED
TARRIFF 2015/16
Rand per service Rand per service
RESIDENTIAL
Sewerage per dwelling p/m 53.58 56.15
NON RESIDENTIAL
Sewerage per dwelling p/m 55.44 58.10
1.4.4 Waste Removal and Impact of Tariff Increases
The Municipality has a contract for waste removal for businesses and also have employees who
collect refuse for residential areas.
The Municipality will have to implement a solid waste strategy to ensure that this service can be
rendered in a sustainable manner over the medium to long-term. The Municipality’s landfill site is
situated 55 km outside the collection areas.
A 4.8 per cent increase in the waste removal tariff is proposed from 1 July 2015. Higher increases
will not be viable in 2015/16 owing to the significant increases implemented in previous financial
years as well as the overall impact of higher than inflation increases of other services.
The following table compares current and proposed amounts payable from 1 July 2015
Table 7 Comparison between current and proposed waste removal fees
CURRENT TARIFFS
2014/15
PROPOSED TARIFFS
2015/16
WASTE REMOVAL WASTE REMOVAL
Tariff per container per month or part of a month: Per month (R) Per month (R)
BUSINESS ( cage per pick up) 1 636.25 1714.90
Small
Medium
233.75
467.50
245.00
490.00 large
935.00 979.90
PUBLIC WORKS 565.27 592.40
Domestics 74.34 77.90
Messes & Base 490.93 514.50
RESIDENTIAL 827.80 640.95
Refuse collection per unit 45.93 48.10
Refuse coupons per bakkie 136.31 142.85
Garden refuse and rubles - Full load 645.56 450.00
15
1.5. OPERATING EXPENDITURE FRAMEWORK
The Municipality’s expenditure framework for the 2015/16 budget and MTREF is informed by
the following:
Balanced budget constraint (operating expenditure should not exceed operating revenue)
unless there are existing uncommitted cash-backed reserves to fund any deficit;
Funding of the budget over the medium-term as informed by Section 18 and 19 of the
MFMA;
The capital programme is aligned to the asset renewal strategy and backlog eradication
plan;
Operational gains and efficiencies will be directed to funding the capital budget and other
core services; and
Strict adherence to the principle of no budget no spending.
The following table is a high level summary of the 2015/16 budget and MTREF
(classified per main type of operating expenditure):
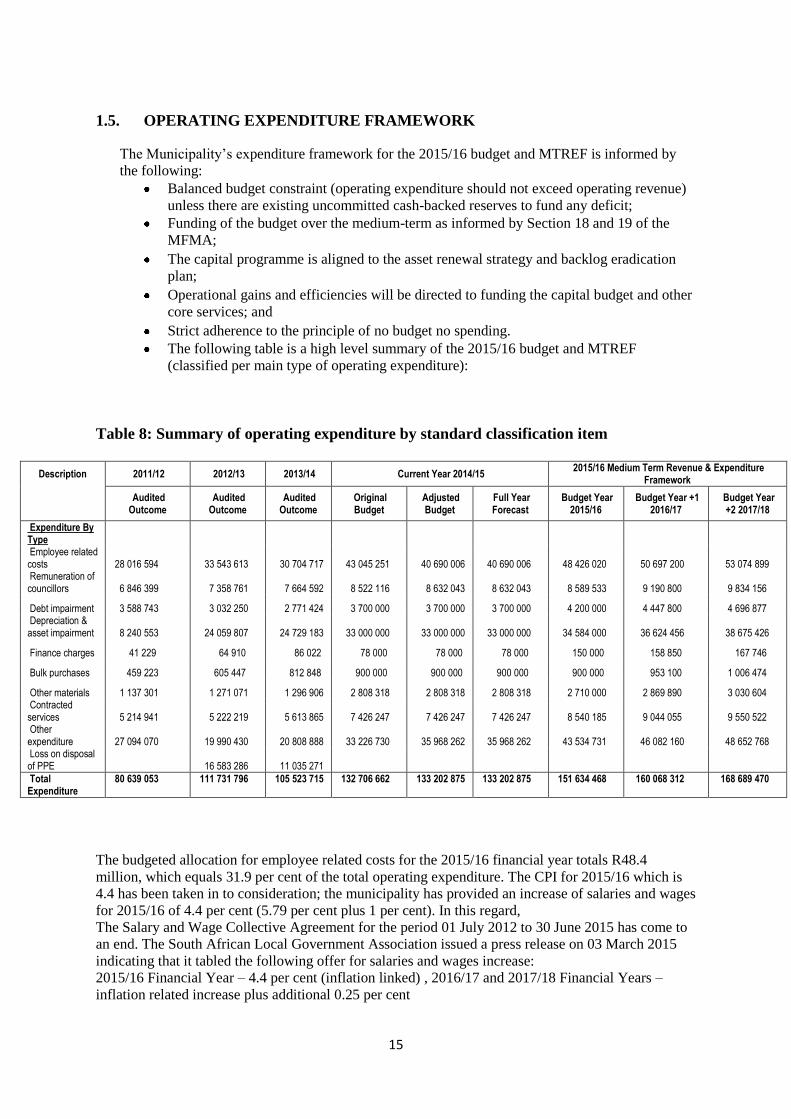
Table 8: Summary of operating expenditure by standard classification item
Description 2011/12 2012/13 2013/14 Current Year 2014/15 2015/16 Medium Term Revenue & Expenditure
Framework
Audited Outcome
Audited Outcome
Audited Outcome
Original Budget
Adjusted Budget
Full Year Forecast
Budget Year 2015/16
Budget Year +1 2016/17
Budget Year +2 2017/18
Expenditure By Type Employee related costs 28 016 594 33 543 613 30 704 717 43 045 251 40 690 006 40 690 006 48 426 020 50 697 200 53 074 899 Remuneration of councillors 6 846 399 7 358 761 7 664 592 8 522 116 8 632 043 8 632 043 8 589 533 9 190 800 9 834 156
Debt impairment 3 588 743 3 032 250 2 771 424 3 700 000 3 700 000 3 700 000 4 200 000 4 447 800 4 696 877 Depreciation & asset impairment 8 240 553 24 059 807 24 729 183 33 000 000 33 000 000 33 000 000 34 584 000 36 624 456 38 675 426
Finance charges 41 229 64 910 86 022 78 000 78 000 78 000 150 000 158 850 167 746
Bulk purchases 459 223 605 447 812 848 900 000 900 000 900 000 900 000 953 100 1 006 474
Other materials 1 137 301 1 271 071 1 296 906 2 808 318 2 808 318 2 808 318 2 710 000 2 869 890 3 030 604 Contracted services 5 214 941 5 222 219 5 613 865 7 426 247 7 426 247 7 426 247 8 540 185 9 044 055 9 550 522 Other expenditure 27 094 070 19 990 430 20 808 888 33 226 730 35 968 262 35 968 262 43 534 731 46 082 160 48 652 768 Loss on disposal of PPE 16 583 286 11 035 271
Total Expenditure
80 639 053 111 731 796 105 523 715 132 706 662 133 202 875 133 202 875 151 634 468 160 068 312 168 689 470
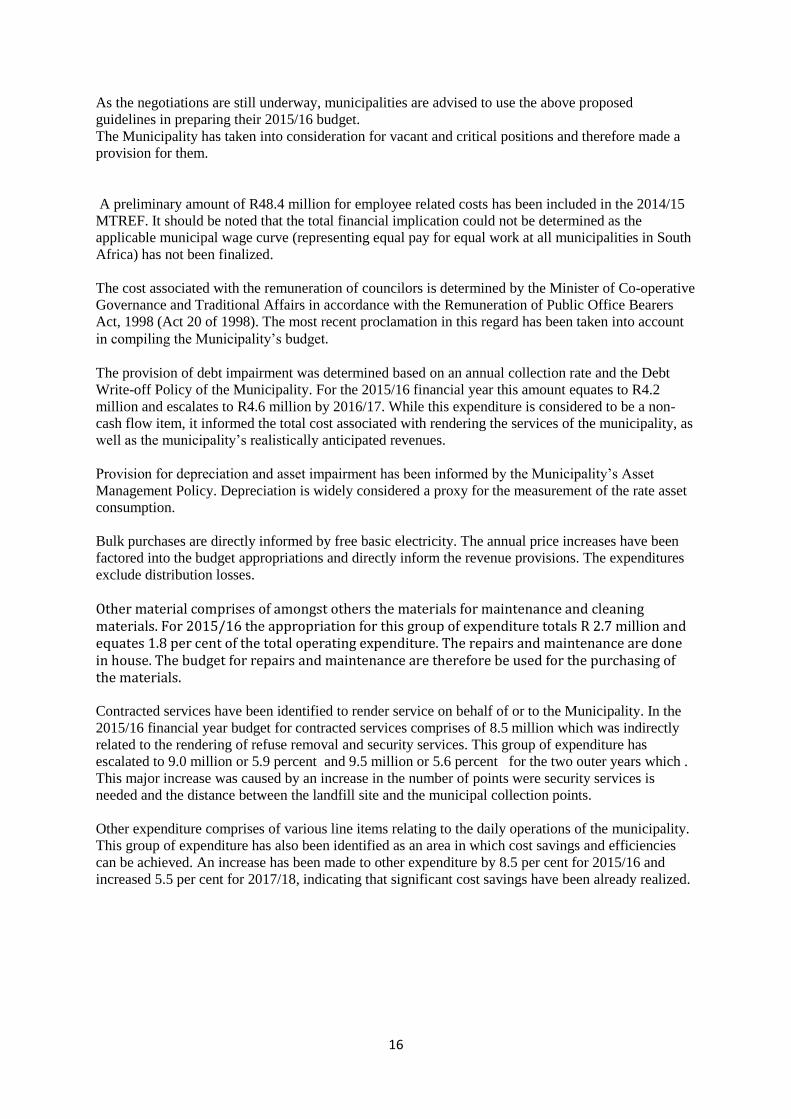
The budgeted allocation for employee related costs for the 2015/16 financial year totals R48.4
million, which equals 31.9 per cent of the total operating expenditure. The CPI for 2015/16 which is
4.4 has been taken in to consideration; the municipality has provided an increase of salaries and wages
for 2015/16 of 4.4 per cent (5.79 per cent plus 1 per cent). In this regard,
The Salary and Wage Collective Agreement for the period 01 July 2012 to 30 June 2015 has come to
an end. The South African Local Government Association issued a press release on 03 March 2015
indicating that it tabled the following offer for salaries and wages increase:
2015/16 Financial Year – 4.4 per cent (inflation linked) , 2016/17 and 2017/18 Financial Years –
inflation related increase plus additional 0.25 per cent
16
As the negotiations are still underway, municipalities are advised to use the above proposed
guidelines in preparing their 2015/16 budget.
The Municipality has taken into consideration for vacant and critical positions and therefore made a
provision for them.
A preliminary amount of R48.4 million for employee related costs has been included in the 2014/15
MTREF. It should be noted that the total financial implication could not be determined as the
applicable municipal wage curve (representing equal pay for equal work at all municipalities in South
Africa) has not been finalized.
The cost associated with the remuneration of councilors is determined by the Minister of Co-operative
Governance and Traditional Affairs in accordance with the Remuneration of Public Office Bearers
Act, 1998 (Act 20 of 1998). The most recent proclamation in this regard has been taken into account
in compiling the Municipality’s budget. The provision of debt impairment was determined based on an annual collection rate and the Debt
Write-off Policy of the Municipality. For the 2015/16 financial year this amount equates to R4.2
million and escalates to R4.6 million by 2016/17. While this expenditure is considered to be a non-
cash flow item, it informed the total cost associated with rendering the services of the municipality, as
well as the municipality’s realistically anticipated revenues.
Provision for depreciation and asset impairment has been informed by the Municipality’s Asset
Management Policy. Depreciation is widely considered a proxy for the measurement of the rate asset
consumption.
Bulk purchases are directly informed by free basic electricity. The annual price increases have been
factored into the budget appropriations and directly inform the revenue provisions. The expenditures
exclude distribution losses.
Other material comprises of amongst others the materials for maintenance and cleaning materials. For 2015/16 the appropriation for this group of expenditure totals R 2.7 million and equates 1.8 per cent of the total operating expenditure. The repairs and maintenance are done in house. The budget for repairs and maintenance are therefore be used for the purchasing of the materials. Contracted services have been identified to render service on behalf of or to the Municipality. In the
2015/16 financial year budget for contracted services comprises of 8.5 million which was indirectly
related to the rendering of refuse removal and security services. This group of expenditure has
escalated to 9.0 million or 5.9 percent and 9.5 million or 5.6 percent for the two outer years which .
This major increase was caused by an increase in the number of points were security services is
needed and the distance between the landfill site and the municipal collection points.
Other expenditure comprises of various line items relating to the daily operations of the municipality.
This group of expenditure has also been identified as an area in which cost savings and efficiencies
can be achieved. An increase has been made to other expenditure by 8.5 per cent for 2015/16 and
increased 5.5 per cent for 2017/18, indicating that significant cost savings have been already realized.
17
Table 9 the following table gives a breakdown of the main expenditure categories for the
2015/16 financial year.
1.6. CAPITAL EXPENDITURE
The following table provides a breakdown of budgeted capital expenditure by vote:
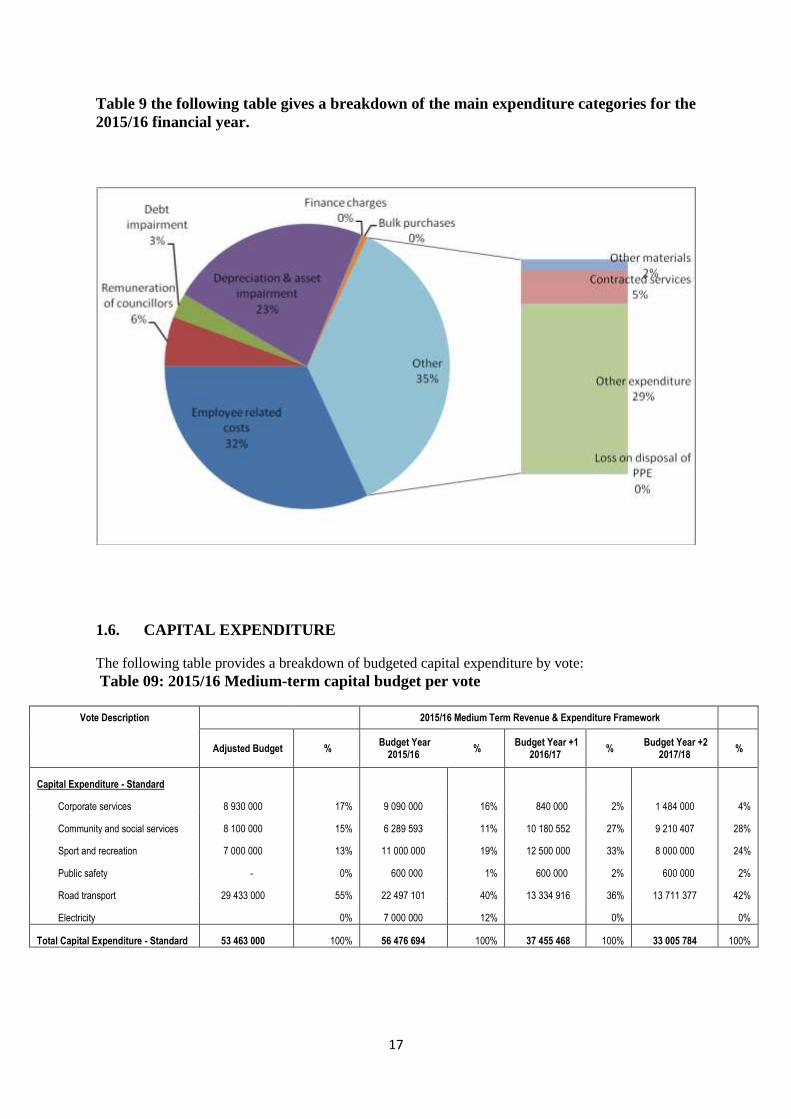
Table 09: 2015/16 Medium-term capital budget per vote
Vote Description 2015/16 Medium Term Revenue & Expenditure Framework
Adjusted Budget %
Budget Year 2015/16
% Budget Year +1
2016/17 %
Budget Year +2 2017/18
%
Capital Expenditure - Standard
Corporate services 8 930 000 17% 9 090 000 16% 840 000 2% 1 484 000 4%
Community and social services 8 100 000 15% 6 289 593 11% 10 180 552 27% 9 210 407 28%
Sport and recreation 7 000 000 13% 11 000 000 19% 12 500 000 33% 8 000 000 24%
Public safety - 0% 600 000 1% 600 000 2% 600 000 2%
Road transport 29 433 000 55% 22 497 101 40% 13 334 916 36% 13 711 377 42%
Electricity 0% 7 000 000 12% 0% 0%
Total Capital Expenditure - Standard 53 463 000 100% 56 476 694 100% 37 455 468 100% 33 005 784 100%
18
For 2015/16 an amount of R22.4 million has been appropriated for the development of Roads
Transport which represents 40 per cent of the total capital budget. In the outer years this amount totals
13.3 million, 36 per cent and R13.7 million, 42 per cent respectively for each of the financial years.
Transport and roads receives the highest allocation for the year ended 2016 followed by sports and
recreation with 16 percent and corporate services with an amount of 9 million which represents 16
percent of total capital expenditure
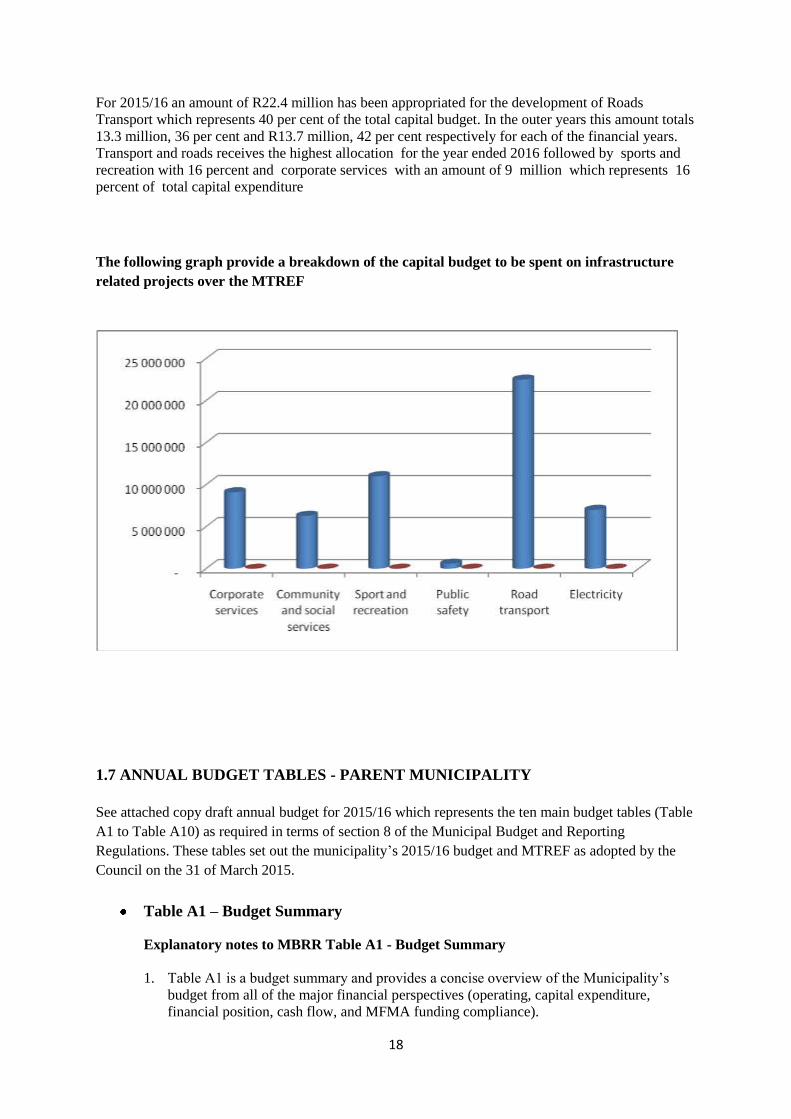
The following graph provide a breakdown of the capital budget to be spent on infrastructure
related projects over the MTREF
1.7 ANNUAL BUDGET TABLES - PARENT MUNICIPALITY
See attached copy draft annual budget for 2015/16 which represents the ten main budget tables (Table
A1 to Table A10) as required in terms of section 8 of the Municipal Budget and Reporting
Regulations. These tables set out the municipality’s 2015/16 budget and MTREF as adopted by the
Council on the 31 of March 2015.
Table A1 – Budget Summary
Explanatory notes to MBRR Table A1 - Budget Summary
1. Table A1 is a budget summary and provides a concise overview of the Municipality’s
budget from all of the major financial perspectives (operating, capital expenditure,
financial position, cash flow, and MFMA funding compliance).

19
2. The table provides an overview of the amounts approved by Council for operating
performance, resources deployed to capital expenditure, financial position, cash and
funding compliance, as well as the municipality’s commitment to eliminating basic
service delivery backlogs.
3. Financial management reforms emphasize the importance of the municipal budget being
funded. This requires the simultaneous assessment of the Financial Performance,
Financial Position and Cash Flow Budgets, along with the Capital Budget. The Budget
Summary provides the key information in this regard:
a. The operating surplus/deficit (after Total Expenditure) is positive over the
MTREF
b. Capital expenditure is balanced by capital funding sources, of which
I. Transfers recognized are reflected on the Financial Performance Budget;
II. Internally generated funds are financed from a combination of the current
operating surplus and accumulated cash-backed surpluses from previous
years. The amount is incorporated in the Net cash from investing on the
Cash Flow Budget. The fact that municipality’s cash flow remains
positive, and is improving indicates that the necessary cash resources are
available to fund the Capital Budget.
4. The Cash backing/surplus reconciliation shows that in previous financial years the
municipality was not paying much attention to managing this aspect of its finances, and
consequently many of its obligations are not cash-backed. This place the municipality in a
very vulnerable financial position, as the recent slow-down in revenue collections
highlighted. Consequently Council has taken a deliberate decision to ensure adequate
cash-backing for all material obligations in accordance with the recently adopted Funding
and Reserves Policy. This cannot be achieved in one financial year. But over the MTREF
there is progressive improvement in the level of cash-backing of obligations.
5. Even though the Council is placing great emphasis on securing the financial sustainability
of the municipality, this is not being done at the expense of services to the poor. The
section of Free Services shows that the amount spent on Free Basic Services and the
revenue cost of free services provided by the municipality continues to increase. In
addition, the municipality continues to make progress in addressing service delivery
backlogs.
Table A2 - Budgeted Financial Performance (revenue and expenditure by
standard classification)
Explanatory notes to MBRR Table A2 - Budgeted Financial Performance (revenue and
expenditure by standard classification)
1. Table A2 is a view of the budgeted financial performance in relation to revenue and
expenditure per standard classification. The modified GFS standard classification divides
the municipal services into 15 functional areas. Municipal revenue, operating expenditure
and capital expenditure are then classified in terms if each of these functional areas which
enables the National Treasury to compile ‘whole of government’ reports.
2. The Total Revenue on this table includes capital revenues (Transfers recognized –
capital) and so does not balance to the operating revenue shown on Table A4.
20
3. Note that as a general principle the revenues for the Trading Services should exceed their
expenditures. Table 2 shows the surplus of R20.7 million for 2015/16 financial periods,
this prove that the municipality follows section 18 of the MFMA.The municipality shows
a surplus for all perspective years.
Table A3 - Budgeted Financial Performance (revenue and expenditure by municipal
vote)
Explanatory notes to MBRR Table A3 - Budgeted Financial Performance (revenue and
expenditure by municipal vote)
1. Table A3 is a view of the budgeted financial performance in relation to the revenue and
expenditure per municipal vote. This table facilitates the view of the budgeted operating
performance in relation to the organizational structure of the municipality. This means it
is possible to present the operating surplus or deficit of a vote.
Table A4 - Budgeted Financial Performance (revenue and expenditure) Explanatory notes to Table A4 - Budgeted Financial Performance (revenue and
expenditure)
1. Total revenue excluding capital transfer and contributions is R146.5 million in 2015/16
and plummets to R141.7 million and R142.8 million for each of the respective years of
the MTREF. This shows an increase of 22.2 per cent for the 2015/16 financial year and
decreased to 3.2 percent and 0.8 percent for each of the respective years.
2. Revenue to be generated from property rates is R30.9 million in the 2015/16 financial
year and increases to R34.6 million by 2017/18 which represents 24.2 per cent of the
operating revenue base of the municipality and therefore remains a significant funding
source for the municipality. It remains relatively constant over the medium-term and tariff
increases have been factored in at 4.8 per cent, 5.9 per cent and 5.6 per cent for each of
the respective financial years of the MTREF.
3. Other revenue like town planning fees, building plans, clearance certificates, etc
constitutes 0.8 percent of the total operating revenue for the year ended 2016. For
2015/16 financial period other revenue has an amount of 1.3 million, and 1.4 million for
the two outers years. Transfers recognized – operating includes the local government
equitable share and other operating grants from national and provincial government. The
grants receipts from national government are growing rapidly over the MTREF by 34.6
per cent for 2015/16 financial period and 7 per cent and 1.4 percent for the two outer
years when compared to the operating grants for previous years.
4. Bulk purchases have increased from R900 000 to 1 million by 2017/18 financial period.
The bulk purchased is mainly for electricity and the registered indigents.
6. Employee related costs and bulk purchases are the main cost drivers within the
municipality
Table A5 - Budgeted Capital Expenditure by vote, standard classification and
funding source Explanatory notes to Table A5 - Budgeted Capital Expenditure by vote, standard
classification and funding source
21
1. Table A5 is a breakdown of the capital programme in relation to capital expenditure by
municipal vote (multi-year and single-year appropriations); capital expenditure by
standard classification; and the funding sources necessary to fund the capital budget,
including information on capital transfers from national and provincial departments.
2. The MFMA provides that a municipality may approve multi-year or single-year capital
budget appropriations. In relation to multi-year appropriations, for 2015/16 ; R34.2
million has been allocated for capital expenditure , for single year capital expenditure
22.1 million has been allocated for 2015/16 financial period which make a total of R56.4
million . The percentage increase is 5.6 when compared to 2014/15 adjustment budget
and decreased by 27.6 percent and 10 percent for the two outers years.
3. The capital programme is funded from National and provincial grants and transfers and
internally generated funds from current year surpluses. For 2015/16 capital funds
transfers by national government is R33.6 and escalates to R26.7 and 28 million for the
two outer years
Table A6 - Budgeted Financial Position
Explanatory notes to Table A6 - Budgeted Financial Position
1. Table A6 is consistent with international standards of good financial management practice,
and improves understandability for councilors and management of the impact of the budget
on the statement of financial position (balance sheet).
2. This format of presenting the statement of financial position is aligned to GRAP1, which is
generally aligned to the international version which presents Assets less Liabilities as
“accounting” Community Wealth. The order of items within each group illustrates items in
order of liquidity; i.e. assets readily converted to cash, or liabilities immediately required to
be met from cash, appear first.
3. Table A6 is supported by an extensive table of notes SA3 which providing a detailed
analysis of the major components of a number of items, including:
Call investments deposits;
Consumer debtors;
Property, plant and equipment;
Trade and other payables;
Provisions noncurrent;
Changes in net assets; and
Reserves
4. The municipal equivalent of equity is Community Wealth/Equity. The justification is that
ownership and the net assets of the municipality belong to the community.
5. Any movement on the Budgeted Financial Performance or the Capital Budget will inevitably
impact on the Budgeted Financial Position. As an example, the collection rate assumption will
impact on the cash position of the municipality and subsequently inform the level of cash and
cash equivalents at year end. Similarly, the collection rate assumption should inform the
budget appropriation for debt impairment which in turn would impact on the provision for
bad debt. These budget and planning assumptions form a critical link in determining the
applicability and relevance of the budget as well as the determination of ratios and financial
indicators. In addition the funding compliance assessment is informed directly by forecasting
the statement of financial position

22
Table A7 - Budgeted Cash Flow Statement
Explanatory notes to Table A7 - Budgeted Cash Flow Statement
1. The budgeted cash flow statement is the first measurement in determining if the budget is
funded.
2. It shows the expected level of cash in-flow versus cash out-flow that is likely to result from
the implementation of the budget.
3. The 2015/16 MTREF has been informed by the planning principle of ensuring adequate cash
reserves over the medium-term.
4. Cash and cash equivalents totals R38.6 million as at the end of the 2015/16 financial year and
escalates to R63.2 million by 2017/18 financial period. The cash flow statement shows the
positive movement from 2011/12 to 2017/18
Table A8 - Cash Backed Reserves/Accumulated Surplus Reconciliation
Explanatory notes to Table A8 - Cash Backed Reserves/Accumulated Surplus
Reconciliation
1. The cash backed reserves/accumulated surplus reconciliation is aligned to the requirements
of MFMA Circular 42 – Funding a Municipal Budget.
2. In essence the table evaluates the funding levels of the budget by firstly forecasting the
cash and investments at year end and secondly reconciling the available funding to the
liabilities/commitments that exist.
3. The outcome of this exercise would either be a surplus or deficit. A deficit would indicate
that the applications exceed the cash and investments available and would be indicative of
non-compliance with the MFMA requirements that the municipality’s budget must be
“funded”. The municipality shows the positive movement for all the years.
4. Non-compliance with section 18 of the MFMA is assumed because a shortfall would
indirectly indicate that the annual budget is not appropriately funded.
5. Considering the requirements of section 18 of the MFMA, it can be shown that
municipality has funded all the projects by having the positive cash
6. As part of the budgeting and planning guidelines that informed the compilation of the
2015/16 MTREF the end objective of the medium-term framework was to ensure the
budget is funded aligned to section 18 of the MFMA.
23
Table A9 - Asset Management
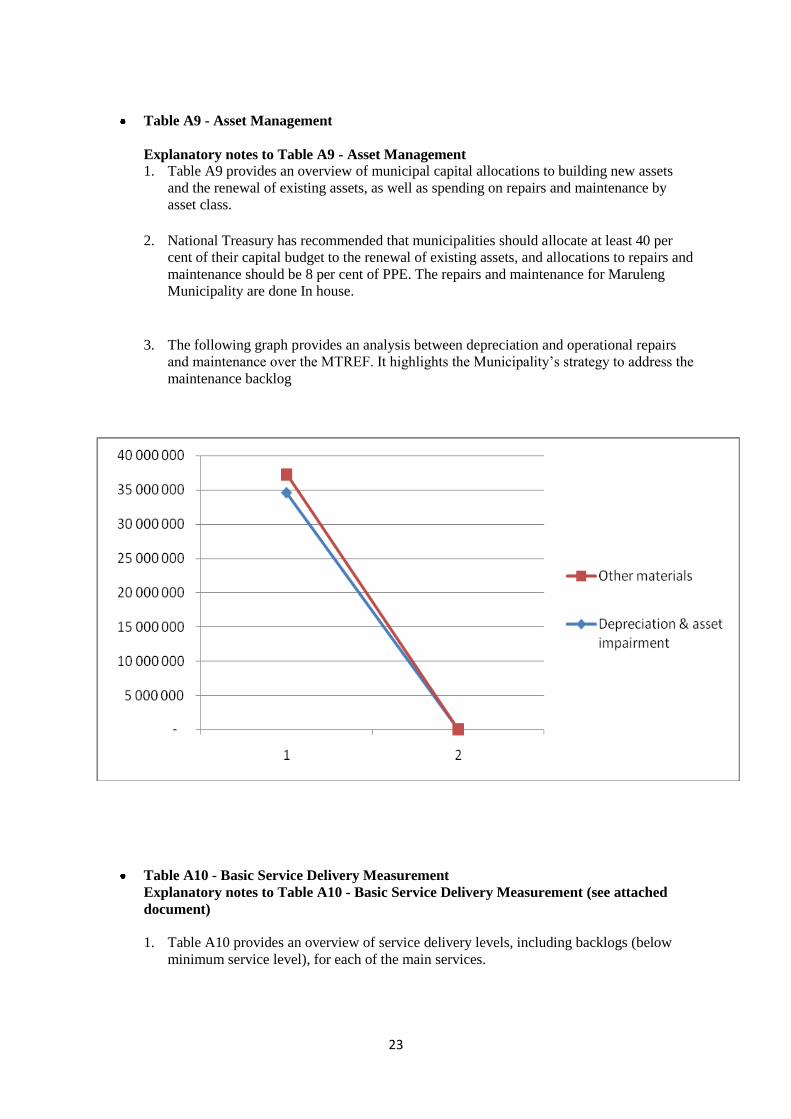
Explanatory notes to Table A9 - Asset Management 1. Table A9 provides an overview of municipal capital allocations to building new assets
and the renewal of existing assets, as well as spending on repairs and maintenance by
asset class.
2. National Treasury has recommended that municipalities should allocate at least 40 per
cent of their capital budget to the renewal of existing assets, and allocations to repairs and
maintenance should be 8 per cent of PPE. The repairs and maintenance for Maruleng
Municipality are done In house.
3. The following graph provides an analysis between depreciation and operational repairs
and maintenance over the MTREF. It highlights the Municipality’s strategy to address the
maintenance backlog
Table A10 - Basic Service Delivery Measurement
Explanatory notes to Table A10 - Basic Service Delivery Measurement (see attached
document)
1. Table A10 provides an overview of service delivery levels, including backlogs (below
minimum service level), for each of the main services.
24
Background
Section 152 subsection c of Act 108 of 1996 indicates that municipalities must “ensure the provision
of services to communities in a sustainable manner”. The success of local economic development is
tied to the provision of basic and other types of infrastructure to the people. All services under
analysis in this section are located in a specific locality (as per SDF) and have potential to boast socio-
economic development. Infrastructure analysis focuses on the status quo regarding water supply,
sanitation facilities, energy and housing provision, roads and public transport, waste management and
telecommunications – all of which underpins socio-economic development and determines people’s
quality of life. The provision of adequate municipal infrastructure remains a challenge throughout the
municipality.
3.4.1. Water and Sanitation Provision
Mopani District Municipality is the Water Service Authority (WSA) and the municipality is the Water
Service Provider (WSA). Mopani district municipality is responsible for bulk water supply and
sanitation infrastructure. The municipality provides these services in terms of the service level
agreement it has with the district municipality.
3.4.1.1 Water analysis
The Maruleng municipality is characterized by low rainfall. This results in limited water resources
culminating in severe water shortages and drought condition. There is stiff competition amongst
different water users. Water for domestic purpose becomes crucial.
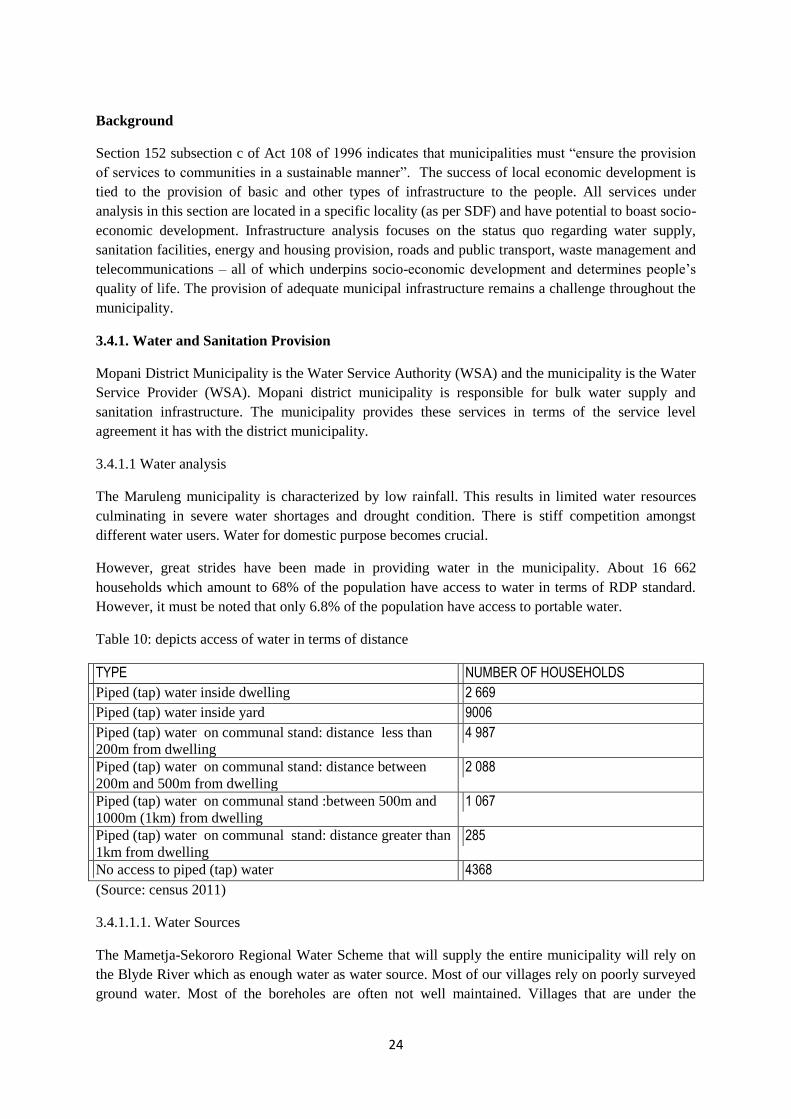
However, great strides have been made in providing water in the municipality. About 16 662
households which amount to 68% of the population have access to water in terms of RDP standard.
However, it must be noted that only 6.8% of the population have access to portable water.
Table 10: depicts access of water in terms of distance
TYPE NUMBER OF HOUSEHOLDS
Piped (tap) water inside dwelling 2 669
Piped (tap) water inside yard 9006
Piped (tap) water on communal stand: distance less than
200m from dwelling 4 987
Piped (tap) water on communal stand: distance between
200m and 500m from dwelling
2 088
Piped (tap) water on communal stand :between 500m and
1000m (1km) from dwelling
1 067
Piped (tap) water on communal stand: distance greater than
1km from dwelling
285
No access to piped (tap) water 4368
(Source: census 2011)
3.4.1.1.1. Water Sources
The Mametja-Sekororo Regional Water Scheme that will supply the entire municipality will rely on
the Blyde River which as enough water as water source. Most of our villages rely on poorly surveyed
ground water. Most of the boreholes are often not well maintained. Villages that are under the

25
mountains rely on water from the mountains. Other villages rely on the water supply by the
municipality through water tankers.
SOURCE NUMBER OF HOUSEHOLDS
Regional/local water scheme (operated by the municipality
or other water service provider)
8209
Borehole 4 427
Spring 223
Rain water tank 211
Dam/pool/stagnant water 2 777
River/stream 6 924
Water vendor 881
(Source: census 2011)
3.4.1.2 Sanitation
The municipality through Mopani District Municipality has made a major stride regarding provision
of sanitation. About 22 983 households which account to 93.9 of the population have access to basic
sanitation..
Table 11: depicts percentage distribution of households by type of toilet facility as of 2011.
Type of toilet facility Census 2001 Census 2011
Flush toilet(sewerage system) 8.8 2001
Flush toilet (septic tank) 2.9 1088
Chemical toilet 1.1 102
Pit latrine with ventilation 8.3 7 335
Pit latrine without ventilation 40.8 12 240
None 38,2 1 487
Total 100 100
Census 2011
3.4.1.3 Water and sanitation backlog
Water backlog in terms the RDP standard is at 7 808 households (32%) while sanitation is about 1
487 (6.1%) households
3.4.1.4 Water and sanitation challenges
The main challenge is bulk water supply but Mopani District Municipality which is the WSA
is currently constructing water purification plant in The Oaks which will carter almost all
villages and major developments
Ageing water and sanitation infrastructure (Hoedspruit and Kampersus)
Over-reliance on boreholes
26
Illegal connections, theft and vandalism
Inadequate funding
Water rights and allocation
Quality of drinking water
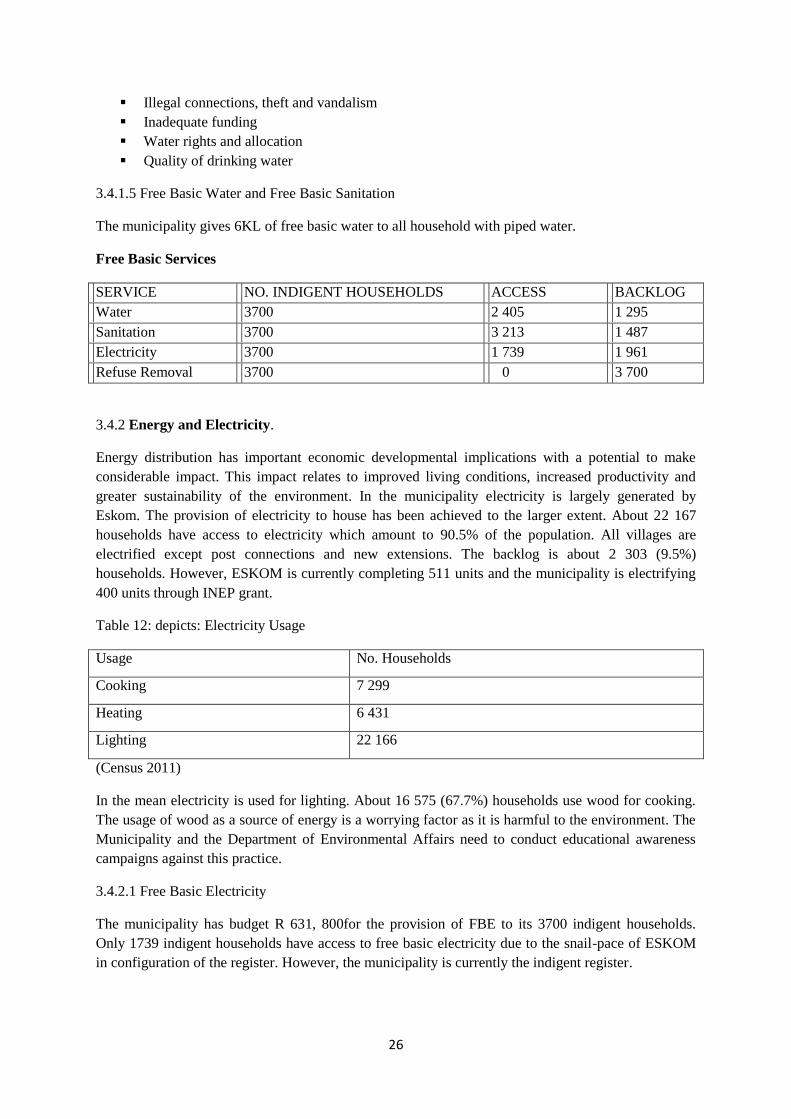
3.4.1.5 Free Basic Water and Free Basic Sanitation
The municipality gives 6KL of free basic water to all household with piped water.
Free Basic Services
SERVICE NO. INDIGENT HOUSEHOLDS ACCESS BACKLOG
Water 3700 2 405 1 295
Sanitation 3700 3 213 1 487
Electricity 3700 1 739 1 961
Refuse Removal 3700 0 3 700
3.4.2 Energy and Electricity.
Energy distribution has important economic developmental implications with a potential to make
considerable impact. This impact relates to improved living conditions, increased productivity and
greater sustainability of the environment. In the municipality electricity is largely generated by
Eskom. The provision of electricity to house has been achieved to the larger extent. About 22 167
households have access to electricity which amount to 90.5% of the population. All villages are
electrified except post connections and new extensions. The backlog is about 2 303 (9.5%)
households. However, ESKOM is currently completing 511 units and the municipality is electrifying
400 units through INEP grant.
Table 12: depicts: Electricity Usage
Usage No. Households
Cooking 7 299
Heating 6 431
Lighting 22 166
(Census 2011)
In the mean electricity is used for lighting. About 16 575 (67.7%) households use wood for cooking.
The usage of wood as a source of energy is a worrying factor as it is harmful to the environment. The
Municipality and the Department of Environmental Affairs need to conduct educational awareness
campaigns against this practice.
3.4.2.1 Free Basic Electricity
The municipality has budget R 631, 800for the provision of FBE to its 3700 indigent households.
Only 1739 indigent households have access to free basic electricity due to the snail-pace of ESKOM
in configuration of the register. However, the municipality is currently the indigent register.

27
3.4.2.2 Indigent Register
The municipality has an adopted indigent policy and register. This register facilitates the provision of
free basic services. The municipality has budgeted R631, 800 for free basic services for the year
2013/14. The updated indigent register has about 3700 households as beneficiaries.
3.4.4 Waste Management
3.4.4.1. Refuse removal.
The municipality provides waste collection services in three urbanized areas: Hoedspruit, Kampersrus
for a total of 1666 households and it accounts to about 6.8% of households. In both commercial and
residential areas collection takes place once a week. No refuse removal is provided to the 33 villages.
These households rely mostly on backyard dumping and burning. Maruleng has outsourced collection
and transportation. The municipality is planning to roll-out waste collections to all villages.
3.4.4.2 Waste disposal.
The municipality has one licensed land fill in Worcester area.
Table 15: depicts percentage distribution of households by type of refuse disposal
Type of refuse removal Census 2001 Census 2011
Removed by local municipality/private company at least once a week
- 1 434
Removed by local municipality/private company less often
- 232
Communal refuse dump 275 250
Own refuse dump 14 692 19 410
No rubbish disposal 3 678 2 828
Other - 315
Total 19 668 24 470
Census 2011
28
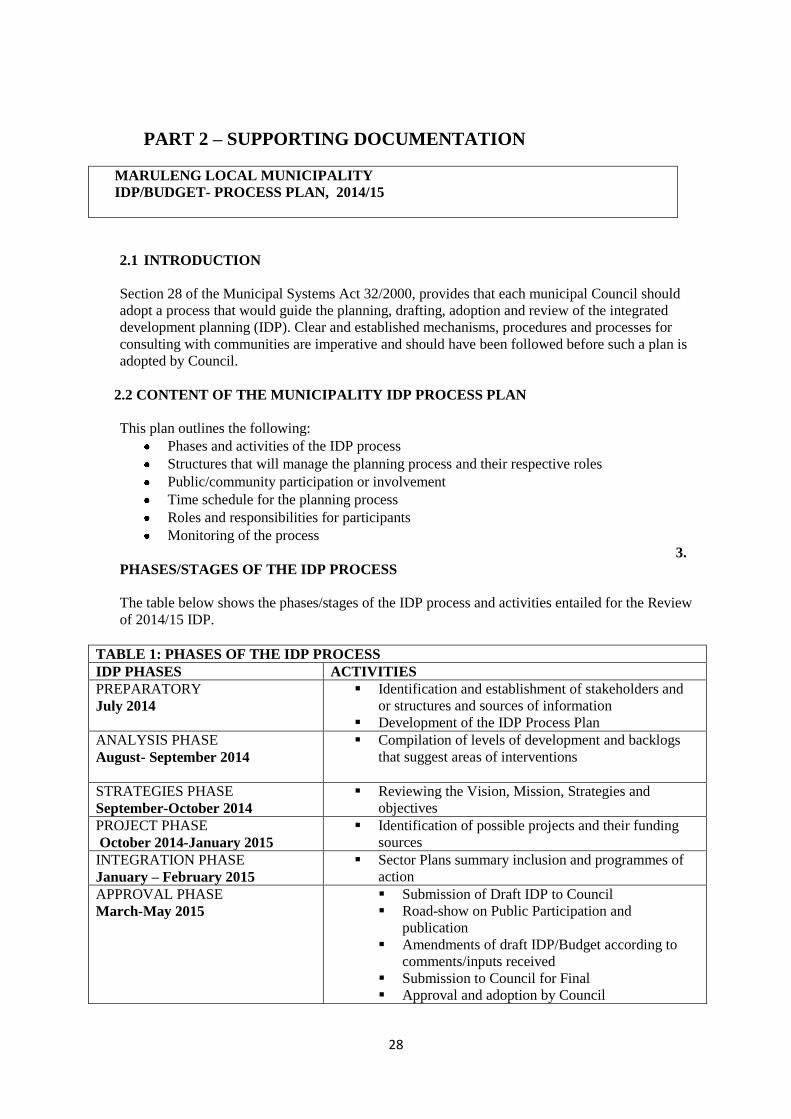
PART 2 – SUPPORTING DOCUMENTATION
MARULENG LOCAL MUNICIPALITY
IDP/BUDGET- PROCESS PLAN, 2014/15
2.1 INTRODUCTION
Section 28 of the Municipal Systems Act 32/2000, provides that each municipal Council should
adopt a process that would guide the planning, drafting, adoption and review of the integrated
development planning (IDP). Clear and established mechanisms, procedures and processes for
consulting with communities are imperative and should have been followed before such a plan is
adopted by Council.
2.2 CONTENT OF THE MUNICIPALITY IDP PROCESS PLAN
This plan outlines the following:
Phases and activities of the IDP process
Structures that will manage the planning process and their respective roles
Public/community participation or involvement
Time schedule for the planning process
Roles and responsibilities for participants
Monitoring of the process
3.
PHASES/STAGES OF THE IDP PROCESS
The table below shows the phases/stages of the IDP process and activities entailed for the Review
of 2014/15 IDP.
TABLE 1: PHASES OF THE IDP PROCESS
IDP PHASES ACTIVITIES
PREPARATORY
July 2014
Identification and establishment of stakeholders and
or structures and sources of information
Development of the IDP Process Plan
ANALYSIS PHASE
August- September 2014
Compilation of levels of development and backlogs
that suggest areas of interventions
STRATEGIES PHASE
September-October 2014
Reviewing the Vision, Mission, Strategies and
objectives
PROJECT PHASE
October 2014-January 2015
Identification of possible projects and their funding
sources
INTEGRATION PHASE
January – February 2015
Sector Plans summary inclusion and programmes of
action
APPROVAL PHASE
March-May 2015
Submission of Draft IDP to Council
Road-show on Public Participation and
publication
Amendments of draft IDP/Budget according to
comments/inputs received
Submission to Council for Final
Approval and adoption by Council
29
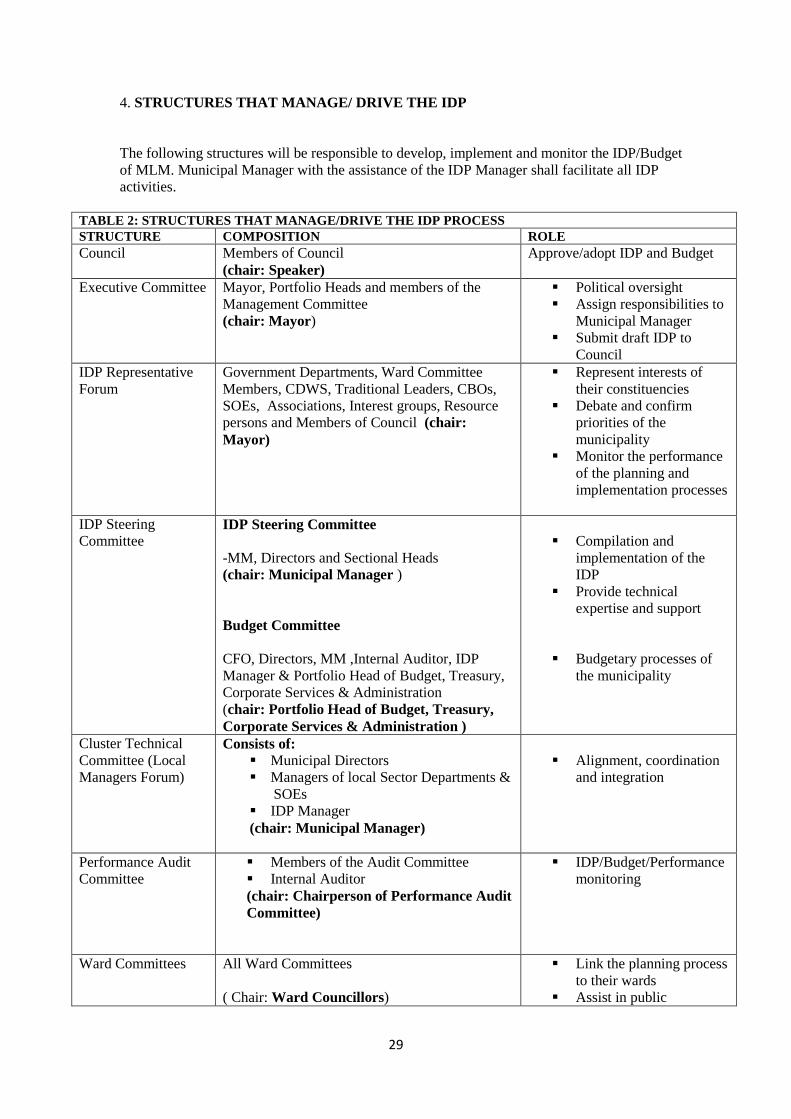
4. STRUCTURES THAT MANAGE/ DRIVE THE IDP
The following structures will be responsible to develop, implement and monitor the IDP/Budget
of MLM. Municipal Manager with the assistance of the IDP Manager shall facilitate all IDP
activities.
TABLE 2: STRUCTURES THAT MANAGE/DRIVE THE IDP PROCESS
STRUCTURE COMPOSITION ROLE
Council Members of Council
(chair: Speaker)
Approve/adopt IDP and Budget
Executive Committee Mayor, Portfolio Heads and members of the
Management Committee
(chair: Mayor)
Political oversight
Assign responsibilities to
Municipal Manager
Submit draft IDP to
Council
IDP Representative
Forum
Government Departments, Ward Committee
Members, CDWS, Traditional Leaders, CBOs,
SOEs, Associations, Interest groups, Resource
persons and Members of Council (chair:
Mayor)
Represent interests of
their constituencies
Debate and confirm
priorities of the
municipality
Monitor the performance
of the planning and
implementation processes
IDP Steering
Committee IDP Steering Committee
-MM, Directors and Sectional Heads
(chair: Municipal Manager )
Budget Committee
CFO, Directors, MM ,Internal Auditor, IDP
Manager & Portfolio Head of Budget, Treasury,
Corporate Services & Administration
(chair: Portfolio Head of Budget, Treasury,
Corporate Services & Administration )
Compilation and
implementation of the
IDP
Provide technical
expertise and support
Budgetary processes of
the municipality
Cluster Technical
Committee (Local
Managers Forum)
Consists of:
Municipal Directors
Managers of local Sector Departments &
SOEs
IDP Manager
(chair: Municipal Manager)
Alignment, coordination
and integration
Performance Audit
Committee
Members of the Audit Committee
Internal Auditor
(chair: Chairperson of Performance Audit
Committee)
IDP/Budget/Performance
monitoring
Ward Committees All Ward Committees
( Chair: Ward Councillors)
Link the planning process
to their wards
Assist in public
30
consultation and
participation
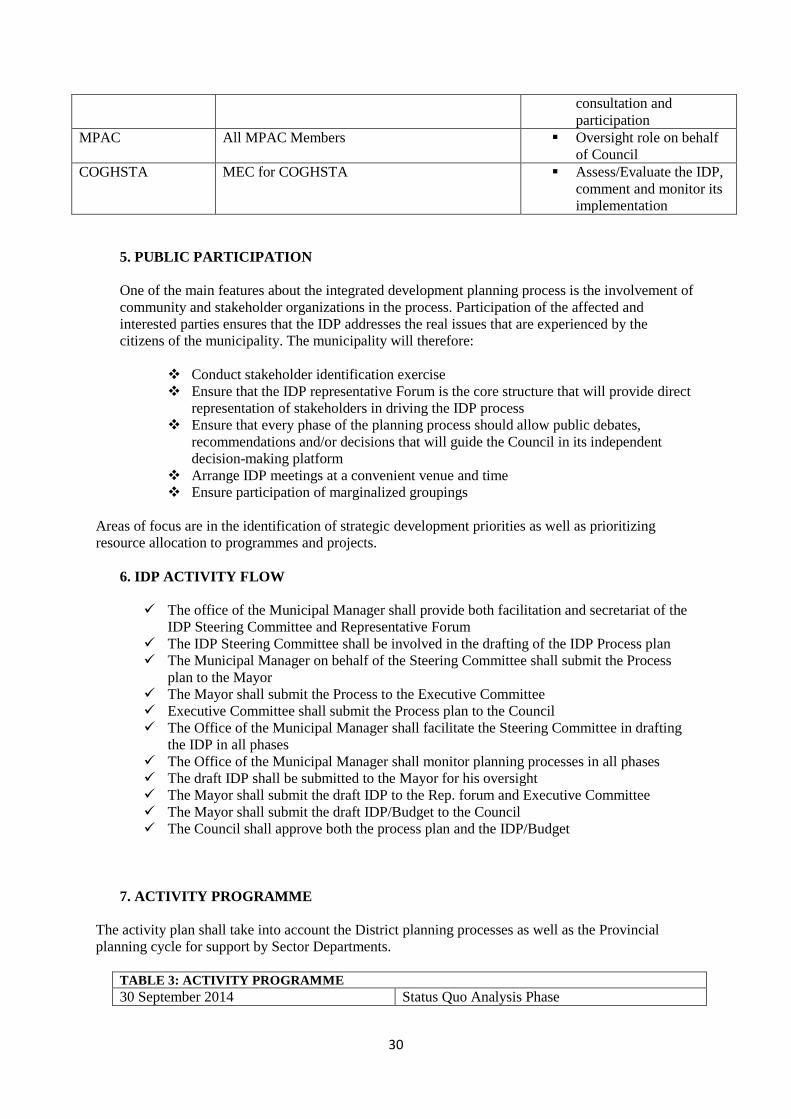
MPAC All MPAC Members Oversight role on behalf
of Council
COGHSTA MEC for COGHSTA Assess/Evaluate the IDP,
comment and monitor its
implementation
5. PUBLIC PARTICIPATION
One of the main features about the integrated development planning process is the involvement of
community and stakeholder organizations in the process. Participation of the affected and
interested parties ensures that the IDP addresses the real issues that are experienced by the
citizens of the municipality. The municipality will therefore:
Conduct stakeholder identification exercise
Ensure that the IDP representative Forum is the core structure that will provide direct
representation of stakeholders in driving the IDP process
Ensure that every phase of the planning process should allow public debates,
recommendations and/or decisions that will guide the Council in its independent
decision-making platform
Arrange IDP meetings at a convenient venue and time
Ensure participation of marginalized groupings
Areas of focus are in the identification of strategic development priorities as well as prioritizing
resource allocation to programmes and projects.
6. IDP ACTIVITY FLOW
The office of the Municipal Manager shall provide both facilitation and secretariat of the
IDP Steering Committee and Representative Forum
The IDP Steering Committee shall be involved in the drafting of the IDP Process plan
The Municipal Manager on behalf of the Steering Committee shall submit the Process
plan to the Mayor
The Mayor shall submit the Process to the Executive Committee
Executive Committee shall submit the Process plan to the Council
The Office of the Municipal Manager shall facilitate the Steering Committee in drafting
the IDP in all phases
The Office of the Municipal Manager shall monitor planning processes in all phases
The draft IDP shall be submitted to the Mayor for his oversight
The Mayor shall submit the draft IDP to the Rep. forum and Executive Committee
The Mayor shall submit the draft IDP/Budget to the Council
The Council shall approve both the process plan and the IDP/Budget
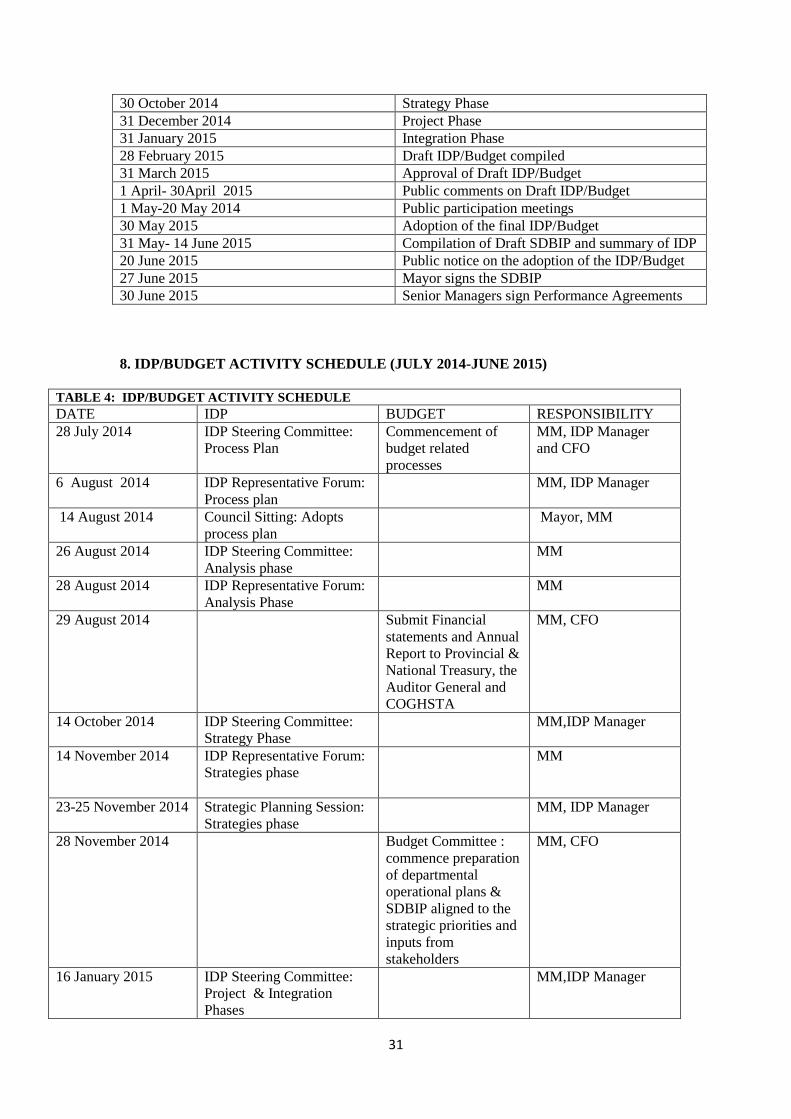
7. ACTIVITY PROGRAMME
The activity plan shall take into account the District planning processes as well as the Provincial
planning cycle for support by Sector Departments.
TABLE 3: ACTIVITY PROGRAMME
30 September 2014 Status Quo Analysis Phase
31
30 October 2014 Strategy Phase
31 December 2014 Project Phase
31 January 2015 Integration Phase
28 February 2015 Draft IDP/Budget compiled
31 March 2015 Approval of Draft IDP/Budget
1 April- 30April 2015 Public comments on Draft IDP/Budget
1 May-20 May 2014 Public participation meetings
30 May 2015 Adoption of the final IDP/Budget
31 May- 14 June 2015 Compilation of Draft SDBIP and summary of IDP
20 June 2015 Public notice on the adoption of the IDP/Budget
27 June 2015 Mayor signs the SDBIP
30 June 2015 Senior Managers sign Performance Agreements
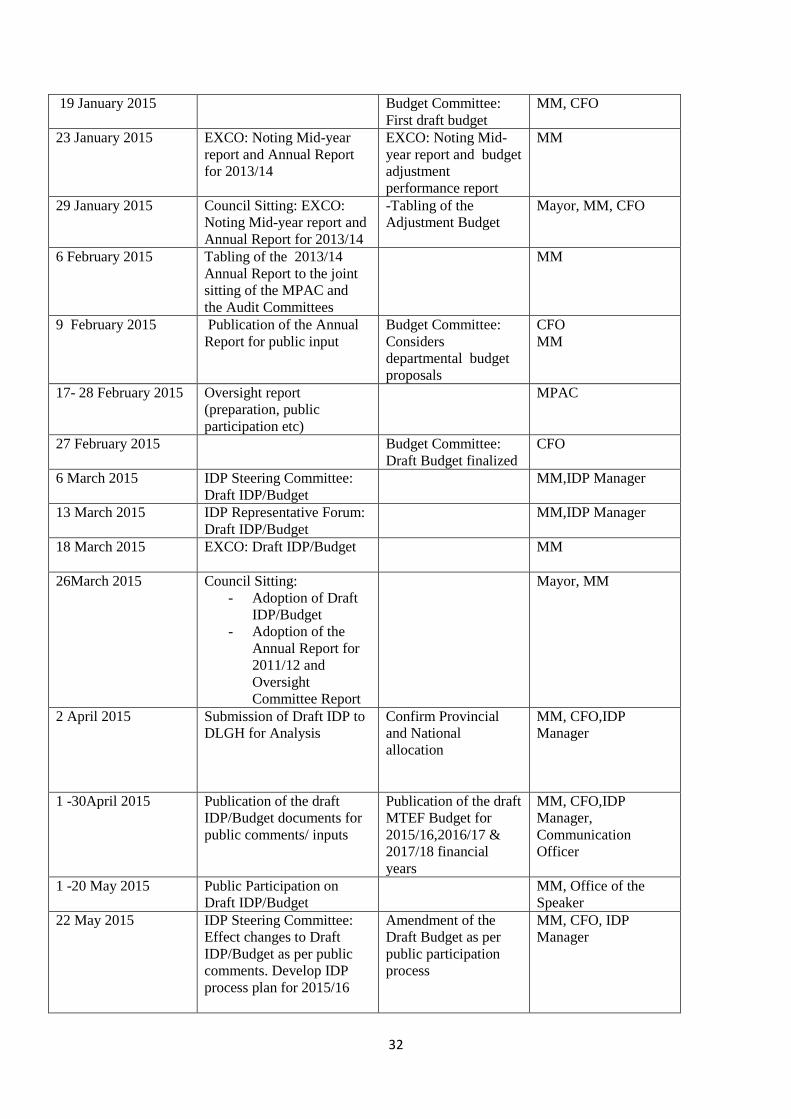
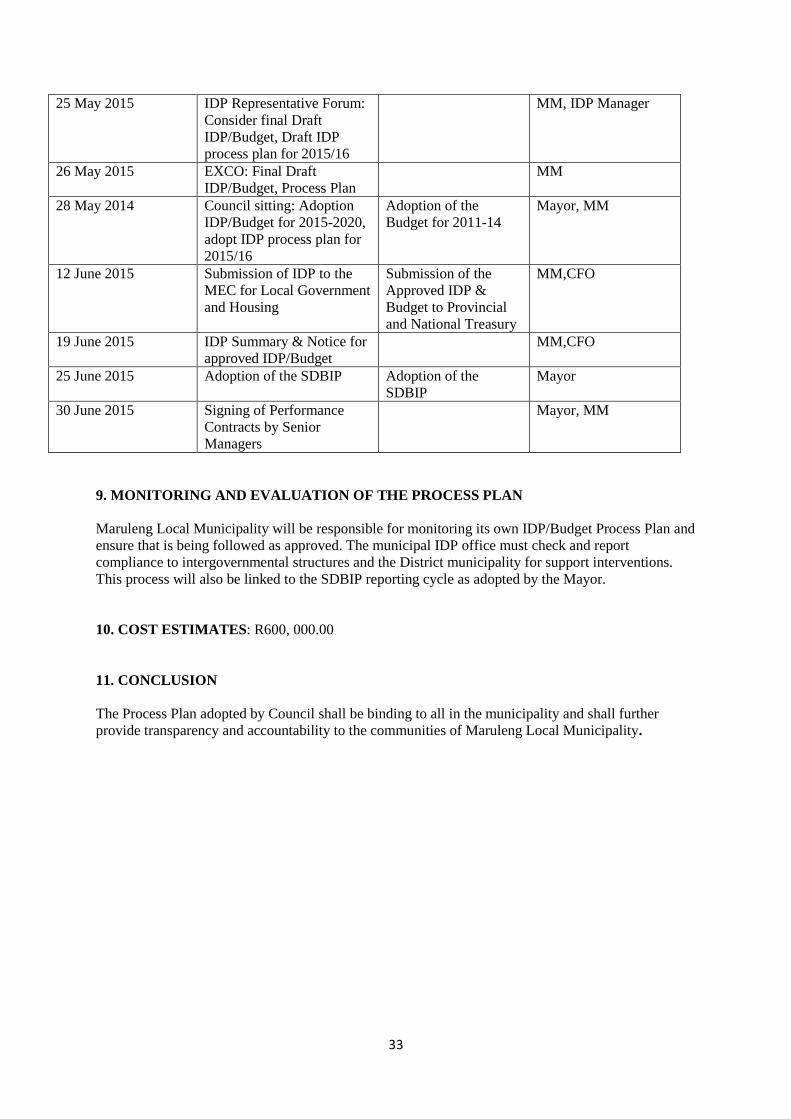
8. IDP/BUDGET ACTIVITY SCHEDULE (JULY 2014-JUNE 2015)
TABLE 4: IDP/BUDGET ACTIVITY SCHEDULE
DATE IDP BUDGET RESPONSIBILITY
28 July 2014
IDP Steering Committee:
Process Plan
Commencement of
budget related
processes
MM, IDP Manager
and CFO
6 August 2014
IDP Representative Forum:
Process plan
MM, IDP Manager
14 August 2014
Council Sitting: Adopts
process plan
Mayor, MM
26 August 2014 IDP Steering Committee:
Analysis phase
MM
28 August 2014 IDP Representative Forum:
Analysis Phase
MM
29 August 2014 Submit Financial
statements and Annual
Report to Provincial &
National Treasury, the
Auditor General and
COGHSTA
MM, CFO
14 October 2014 IDP Steering Committee:
Strategy Phase
MM,IDP Manager
14 November 2014
IDP Representative Forum:
Strategies phase
MM
23-25 November 2014
Strategic Planning Session:
Strategies phase
MM, IDP Manager
28 November 2014 Budget Committee :
commence preparation
of departmental
operational plans &
SDBIP aligned to the
strategic priorities and
inputs from
stakeholders
MM, CFO
16 January 2015 IDP Steering Committee:
Project & Integration
Phases
MM,IDP Manager
32
19 January 2015 Budget Committee:
First draft budget
MM, CFO
23 January 2015 EXCO: Noting Mid-year
report and Annual Report
for 2013/14
EXCO: Noting Mid-
year report and budget
adjustment
performance report
MM
29 January 2015 Council Sitting: EXCO:
Noting Mid-year report and
Annual Report for 2013/14
-Tabling of the
Adjustment Budget
Mayor, MM, CFO
6 February 2015 Tabling of the 2013/14
Annual Report to the joint
sitting of the MPAC and
the Audit Committees
MM
9 February 2015
Publication of the Annual
Report for public input
Budget Committee:
Considers
departmental budget
proposals
CFO
MM
17- 28 February 2015 Oversight report
(preparation, public
participation etc)
MPAC
27 February 2015 Budget Committee:
Draft Budget finalized
CFO
6 March 2015 IDP Steering Committee:
Draft IDP/Budget
MM,IDP Manager
13 March 2015 IDP Representative Forum:
Draft IDP/Budget
MM,IDP Manager
18 March 2015
EXCO: Draft IDP/Budget MM
26March 2015 Council Sitting:
- Adoption of Draft
IDP/Budget
- Adoption of the
Annual Report for
2011/12 and
Oversight
Committee Report
Mayor, MM
2 April 2015 Submission of Draft IDP to
DLGH for Analysis
Confirm Provincial
and National
allocation
MM, CFO,IDP
Manager
1 -30April 2015 Publication of the draft
IDP/Budget documents for
public comments/ inputs
Publication of the draft
MTEF Budget for
2015/16,2016/17 &
2017/18 financial
years
MM, CFO,IDP
Manager,
Communication
Officer
1 -20 May 2015 Public Participation on
Draft IDP/Budget
MM, Office of the
Speaker
22 May 2015 IDP Steering Committee:
Effect changes to Draft
IDP/Budget as per public
comments. Develop IDP
process plan for 2015/16
Amendment of the
Draft Budget as per
public participation
process
MM, CFO, IDP
Manager
33
25 May 2015 IDP Representative Forum:
Consider final Draft
IDP/Budget, Draft IDP
process plan for 2015/16
MM, IDP Manager
26 May 2015 EXCO: Final Draft
IDP/Budget, Process Plan
MM
28 May 2014 Council sitting: Adoption
IDP/Budget for 2015-2020,
adopt IDP process plan for
2015/16
Adoption of the
Budget for 2011-14
Mayor, MM
12 June 2015 Submission of IDP to the
MEC for Local Government
and Housing
Submission of the
Approved IDP &
Budget to Provincial
and National Treasury
MM,CFO
19 June 2015 IDP Summary & Notice for
approved IDP/Budget
MM,CFO
25 June 2015 Adoption of the SDBIP Adoption of the
SDBIP
Mayor
30 June 2015 Signing of Performance
Contracts by Senior
Managers
Mayor, MM
9. MONITORING AND EVALUATION OF THE PROCESS PLAN
Maruleng Local Municipality will be responsible for monitoring its own IDP/Budget Process Plan and
ensure that is being followed as approved. The municipal IDP office must check and report
compliance to intergovernmental structures and the District municipality for support interventions.
This process will also be linked to the SDBIP reporting cycle as adopted by the Mayor.
10. COST ESTIMATES: R600, 000.00
11. CONCLUSION
The Process Plan adopted by Council shall be binding to all in the municipality and shall further
provide transparency and accountability to the communities of Maruleng Local Municipality.
34
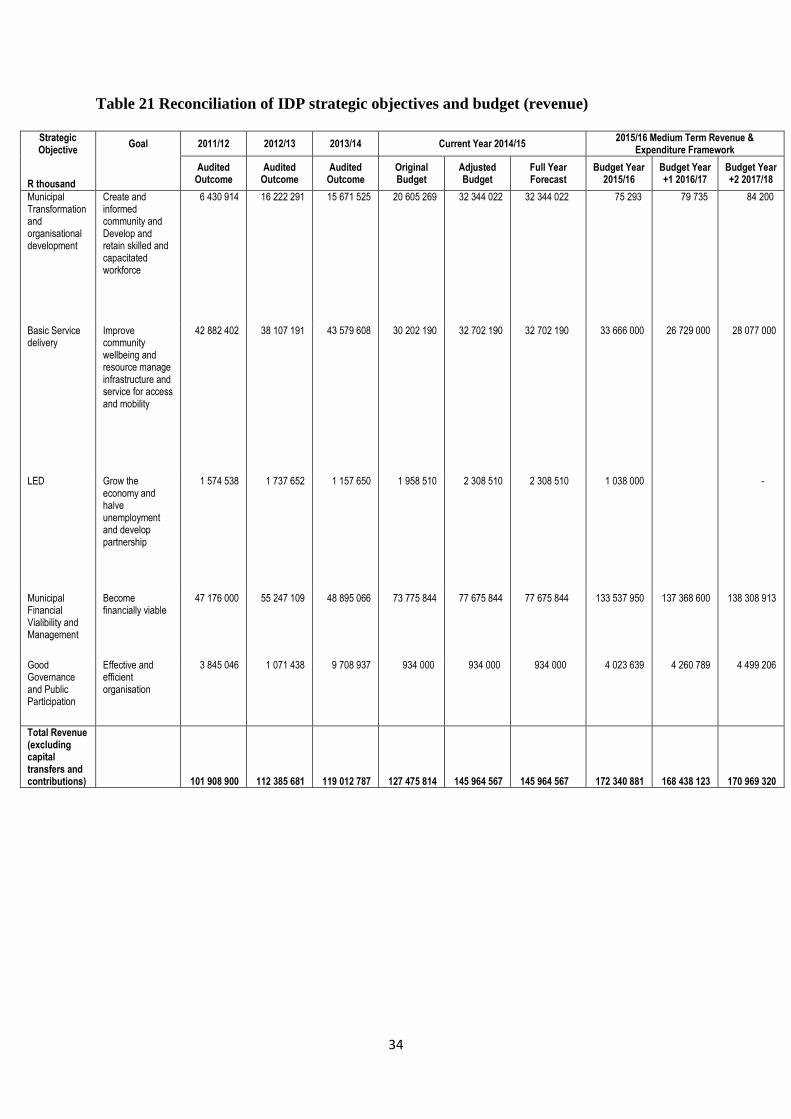
Table 21 Reconciliation of IDP strategic objectives and budget (revenue)
Strategic Objective
Goal 2011/12 2012/13 2013/14 Current Year 2014/15 2015/16 Medium Term Revenue &
Expenditure Framework
R thousand
Audited Outcome
Audited Outcome
Audited Outcome
Original Budget
Adjusted Budget
Full Year Forecast
Budget Year 2015/16
Budget Year +1 2016/17
Budget Year +2 2017/18
Municipal Transformation and organisational development
Create and informed community and Develop and retain skilled and capacitated workforce
6 430 914 16 222 291 15 671 525 20 605 269 32 344 022 32 344 022 75 293 79 735 84 200
Basic Service delivery
Improve community wellbeing and resource manage infrastructure and service for access and mobility
42 882 402 38 107 191 43 579 608 30 202 190 32 702 190 32 702 190 33 666 000 26 729 000 28 077 000
LED Grow the economy and halve unemployment and develop partnership
1 574 538 1 737 652 1 157 650 1 958 510 2 308 510 2 308 510 1 038 000 -
Municipal Financial Vialibility and Management
Become financially viable
47 176 000 55 247 109 48 895 066 73 775 844 77 675 844 77 675 844 133 537 950 137 368 600 138 308 913
Good Governance and Public Participation
Effective and efficient organisation
3 845 046 1 071 438 9 708 937 934 000 934 000 934 000 4 023 639 4 260 789 4 499 206
Total Revenue (excluding capital transfers and contributions) 101 908 900 112 385 681 119 012 787 127 475 814 145 964 567 145 964 567 172 340 881 168 438 123 170 969 320
35
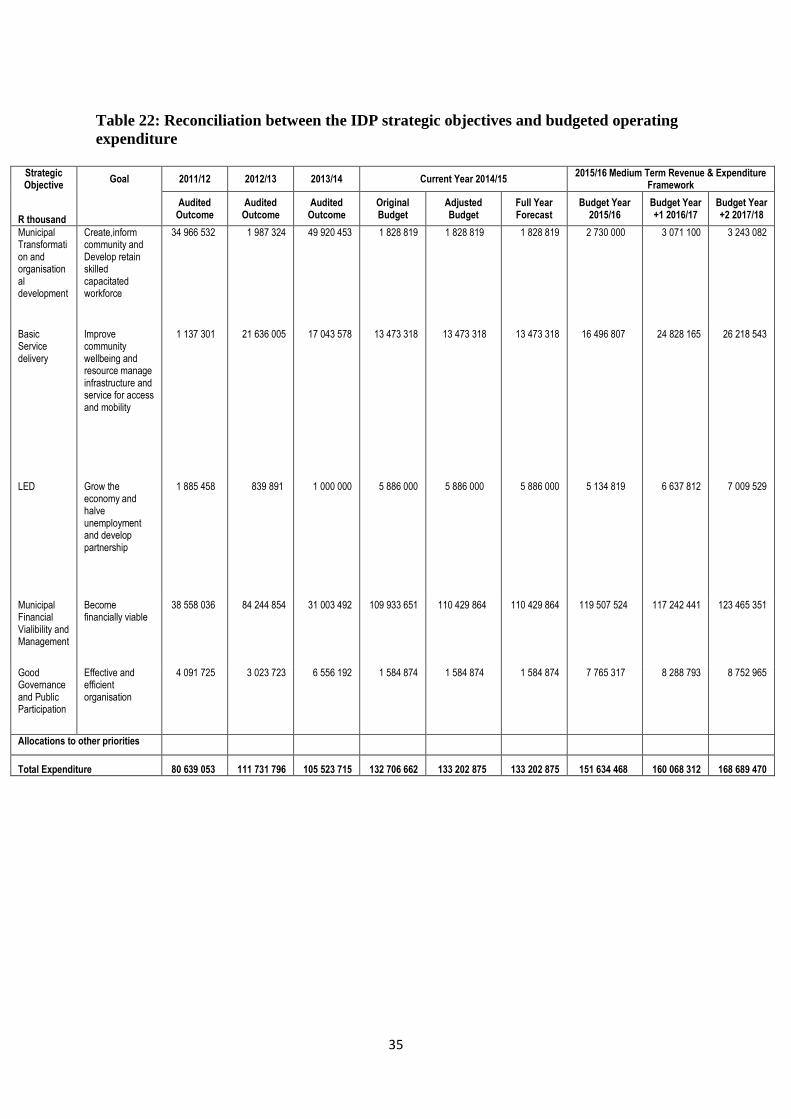
Table 22: Reconciliation between the IDP strategic objectives and budgeted operating
expenditure
Strategic Objective
Goal 2011/12 2012/13 2013/14 Current Year 2014/15 2015/16 Medium Term Revenue & Expenditure
Framework
R thousand
Audited Outcome
Audited Outcome
Audited Outcome
Original Budget
Adjusted Budget
Full Year Forecast
Budget Year 2015/16
Budget Year +1 2016/17
Budget Year +2 2017/18
Municipal Transformation and organisational development
Create,inform community and Develop retain skilled capacitated workforce
34 966 532 1 987 324 49 920 453 1 828 819 1 828 819 1 828 819 2 730 000 3 071 100 3 243 082
Basic Service delivery
Improve community wellbeing and resource manage infrastructure and service for access and mobility
1 137 301 21 636 005 17 043 578 13 473 318 13 473 318 13 473 318 16 496 807 24 828 165 26 218 543
LED Grow the economy and halve unemployment and develop partnership
1 885 458 839 891 1 000 000 5 886 000 5 886 000 5 886 000 5 134 819 6 637 812 7 009 529
Municipal Financial Vialibility and Management
Become financially viable
38 558 036 84 244 854 31 003 492 109 933 651 110 429 864 110 429 864 119 507 524 117 242 441 123 465 351
Good Governance and Public Participation
Effective and efficient organisation
4 091 725 3 023 723 6 556 192 1 584 874 1 584 874 1 584 874 7 765 317 8 288 793 8 752 965
Allocations to other priorities
Total Expenditure 80 639 053 111 731 796 105 523 715 132 706 662 133 202 875 133 202 875 151 634 468 160 068 312 168 689 470
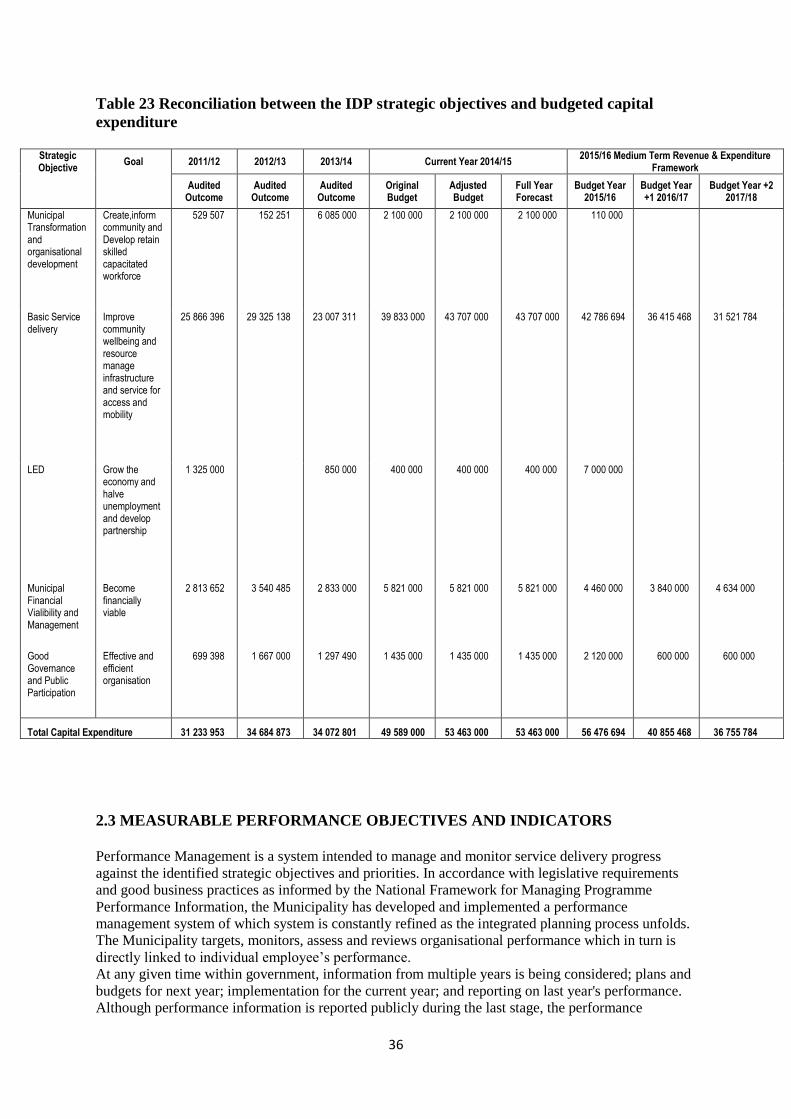
36
Table 23 Reconciliation between the IDP strategic objectives and budgeted capital
expenditure
Strategic Objective
Goal 2011/12 2012/13 2013/14 Current Year 2014/15 2015/16 Medium Term Revenue & Expenditure
Framework
Audited Outcome
Audited Outcome
Audited Outcome
Original Budget
Adjusted Budget
Full Year Forecast
Budget Year 2015/16
Budget Year +1 2016/17
Budget Year +2 2017/18
Municipal Transformation and organisational development
Create,inform community and Develop retain skilled capacitated workforce
529 507 152 251 6 085 000 2 100 000 2 100 000 2 100 000 110 000
Basic Service delivery
Improve community wellbeing and resource manage infrastructure and service for access and mobility
25 866 396 29 325 138 23 007 311 39 833 000 43 707 000 43 707 000 42 786 694 36 415 468 31 521 784
LED Grow the economy and halve unemployment and develop partnership
1 325 000 850 000 400 000 400 000 400 000 7 000 000
Municipal Financial Vialibility and Management
Become financially viable
2 813 652 3 540 485 2 833 000 5 821 000 5 821 000 5 821 000 4 460 000 3 840 000 4 634 000
Good Governance and Public Participation
Effective and efficient organisation
699 398 1 667 000 1 297 490 1 435 000 1 435 000 1 435 000 2 120 000 600 000 600 000
Total Capital Expenditure 31 233 953 34 684 873 34 072 801 49 589 000 53 463 000 53 463 000 56 476 694 40 855 468 36 755 784
2.3 MEASURABLE PERFORMANCE OBJECTIVES AND INDICATORS
Performance Management is a system intended to manage and monitor service delivery progress
against the identified strategic objectives and priorities. In accordance with legislative requirements
and good business practices as informed by the National Framework for Managing Programme
Performance Information, the Municipality has developed and implemented a performance
management system of which system is constantly refined as the integrated planning process unfolds.
The Municipality targets, monitors, assess and reviews organisational performance which in turn is
directly linked to individual employee’s performance.
At any given time within government, information from multiple years is being considered; plans and
budgets for next year; implementation for the current year; and reporting on last year's performance.
Although performance information is reported publicly during the last stage, the performance

37
information process begins when policies are being developed, and continues through each of the
planning, budgeting, implementation and reporting stages.
Reporting in the monitoring process also involves giving feedback about the progress of the project to
the donors, implementers and beneficiaries of the project.
The planning, budgeting and reporting cycle can be graphically illustrated as follows:
Figure 5 Planning, budgeting and reporting cycle
Monitoring is the regular observation and recording of activities taking place in a project or
programme. Relevant data is gathered in an efficient and timely manner and in sufficient quantities to
provide meaningful results after which it is processed to identify and categorize factors relevant to
specific concerns. In monitoring, data should be analysed and the results displayed so that personnel
can take appropriate actions.
Monitoring which involves a process of routinely gathering information on all aspects of the
objective, programme or project has been operationalised within the Maruleng Local Municipality by
making use of the SDBIP reporting to monitor quarterly progress towards targets as set out.
Cascading the SDBIP further down to the departmental/sectional level will help Maruleng Local
Municipality to review performance quarterly and be able to take necessary steps to improve
performance where performance targets are not met.
Assessment is a process of measuring or quantifying the level of attainment or competence within a
specified domain whereby scores are attached to see how well the theme, objective, programmes or
projects have been achieved. On the other hand evaluation is determining of value, or the
measurement of value added. The municipality needs to determine whether, or not, the programme or
project adds value or is contributing to the organisation’s strategy.
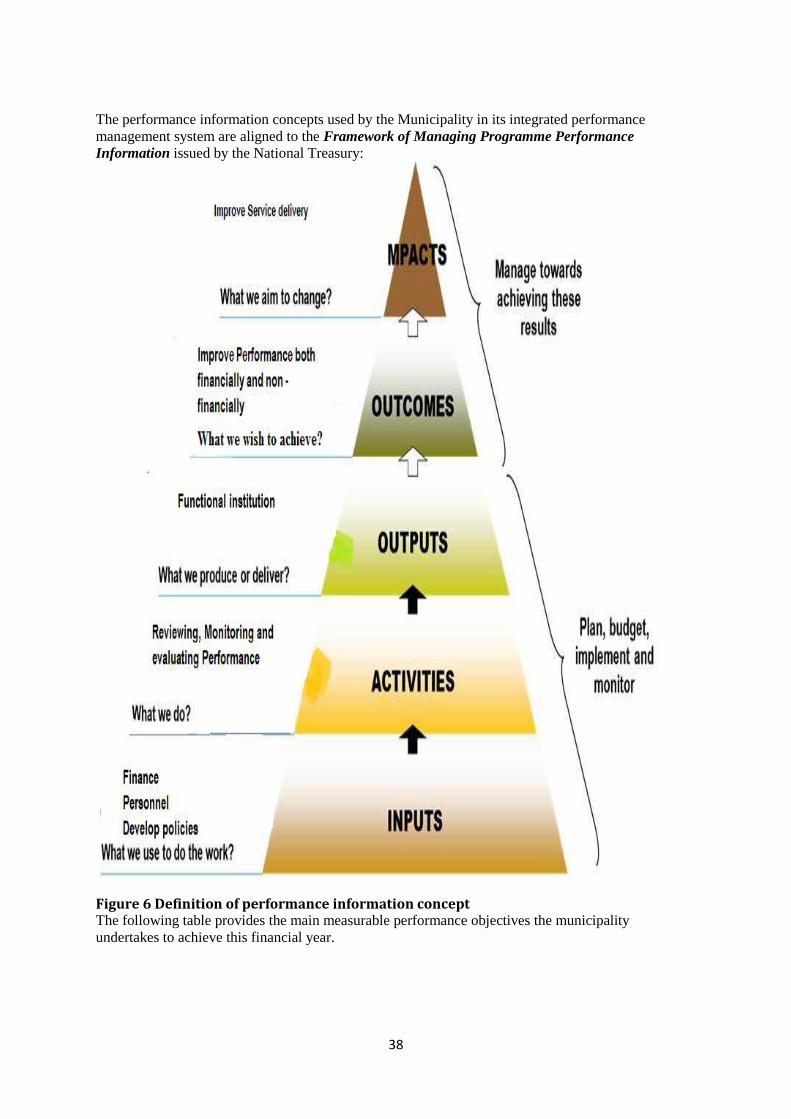
38
The performance information concepts used by the Municipality in its integrated performance
management system are aligned to the Framework of Managing Programme Performance
Information issued by the National Treasury:
Figure 6 Definition of performance information concept The following table provides the main measurable performance objectives the municipality
undertakes to achieve this financial year.

39
Table 24: MBRR Table SA7 Measureable performance objectives
Description Unit of
measurement
2011/12 2012/13 2013/14 Current Year 2014/15 2015/16 Medium Term Revenue
& Expenditure Framework
Audited Outcome
Audited Outcome
Audited Outcome
Original Budget
Adjusted Budget
Full Year
Forecast
Budget Year
2015/16
Budget Year +1 2016/17
Budget Year +2 2017/18
Reduce roads backlogs
Kilometer 4,5% 4,0% 6,0% 30,0% 30,0% 30,0% 30,0% 30,0% 29,8%
Sub-function - Roads maintained
surfaced roads resurfaced/ rehabilitation
Kilometer 0,0% 0,0% 4,0% 0,0% 0,0% 0,0% 0,0% 0,0% 0,0%
Sub-function - Roads for growth
New roads to be constructed Kilometer 4,5% 6,0% 6,0% 30,0% 30,0% 30,0% 30,0% 30,0% 32,0%
Function - Stormwater
Sub-function - Reduction of backlog
stormwater drainage to reduce backlogs
Kilometer 1,0% 5,0% 1,0% 2,0% 2,0% 2,0% 2,0% 2,0% 1,8%
Sub-function - Stormwater for growth
Stormwater drainage to stimulate growth
Kilometer 3,0% 21,0% 2,0% 2,0% 2,0% 2,0% 3,0% 4,0% 3,0%
Households provided with a water connection
Number 0,0% 0,0% 0,0% 0,0% 0,0% 0,0% 0,0% 0,0% 0,0%

40
new bulk water pipeline Meter 0,0% 0,0% 0,0% 0,0% 0,0% 0,0% 0,0% 0,0% 0,0%
New Internal water pipelines
Meter 0,0% 0,0% 0,0% 0,0% 0,0% 0,0% 0,0% 0,0% 0,0%
upgrade and replace of internal water pipeline
Meter 0,0% 0,0% 0,0% 0,0% 0,0% 0,0% 0,0% 0,0% 0,0%
household provided with a sanitation connection
Number 79,9% 0,0% 0,0% 0,0% 0,0% 0,0% 0,0% 0,0% 0,0%
New bulk sewer pipelines Meter
New internal sewer pipelines
Meter 15,0% 0,0% 0,0% 0,0% 0,0% 0,0% 0,0% 0,0% 0,0%
The following table sets out the municipalities main performance objectives and benchmarks for the 2014/15 MTREF. Table 25: MBRR Table SA8 Performance indicators and benchmarks
Description of financial indicator
Basis of calculation
2011/12 2012/13 2013/14 Current Year 2014/15 2015/16 Medium Term Revenue &
Expenditure Framework
Audited Outcome
Audited Outco
me
Audited Outco
me
Original
Budget
Adjusted Budget
Full Year Forecast
Budget Year
2015/16
Budget Year +1 2016/17
Budget Year +2 2017/18
Borrowing Management
Credit Rating

41
Capital Charges to Operating Expenditure
Interest & Principal Paid /Operating Expenditure
0,1% 0,1% 0,1% 0,1% 0,1% 0,1% 0,1% 0,1% 0,1%
Capital Charges to Own Revenue
Finance charges & Repayment of borrowing /Own Revenue
0,2% 0,3% 0,4% 0,3% 0,2% 0,2% 0,4% 0,4% 0,4%
Borrowed funding of 'own' capital expenditure
Borrowing/Capital expenditure excl. transfers and grants and contributions
0,0% 0,0% 0,0% 0,0% 0,0% 0,0% 0,0% 0,0% 0,0%
Safety of Capital
Gearing Long Term Borrowing/ Funds & Reserves
0,0% 0,0% 0,0% 0,0% 0,0% 0,0% 0,0% 0,0% 0,0%
Liquidity
Current Ratio Current assets/current liabilities
3,2 3,2 3,6 7,1 9,6 9,6 7,5 9,4 9,6
Current Ratio adjusted for aged debtors
Current assets less debtors > 90 days/current liabilities
3,2 3,2 3,6 7,1 9,6 9,6 7,5 9,4 9,6
Liquidity Ratio Monetary Assets/Current Liabilities
1,7 2,0 2,3 4,9 4,9 4,9 4,0 5,1 5,5
Revenue Management
Annual Debtors Collection Rate (Payment Level %)
Last 12 Mths Receipts/Last 12 Mths Billing
83,2% 80,8% 92,8% 99,4% 99,3% 0,0% 99,3% 99,3%
Current Debtors Collection Rate (Cash receipts % of Ratepayer & Other revenue)
83,2% 80,8% 92,8% 99,4% 99,3% 99,3% 99,3% 99,3% 99,3%
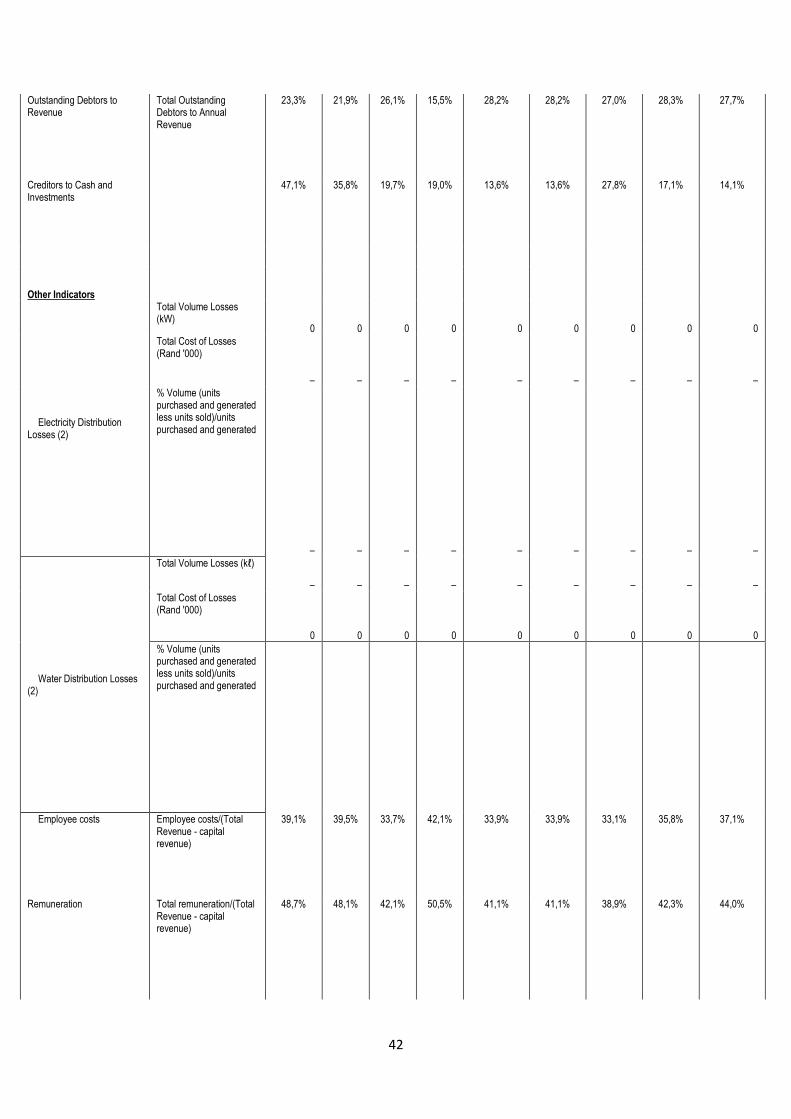
42
Outstanding Debtors to Revenue
Total Outstanding Debtors to Annual Revenue
23,3% 21,9% 26,1% 15,5% 28,2% 28,2% 27,0% 28,3% 27,7%
Creditors to Cash and Investments
47,1% 35,8% 19,7% 19,0% 13,6% 13,6% 27,8% 17,1% 14,1%
Other Indicators
Electricity Distribution Losses (2)
Total Volume Losses (kW)
0 0 0 0 0 0 0 0 0
Total Cost of Losses (Rand '000)
– – – – – – – – –
% Volume (units purchased and generated less units sold)/units purchased and generated
– – – – – – – – –
Water Distribution Losses (2)
Total Volume Losses (kℓ)
– – – – – – – – –
Total Cost of Losses (Rand '000)
0 0 0 0 0 0 0 0 0
% Volume (units purchased and generated less units sold)/units purchased and generated
Employee costs Employee costs/(Total Revenue - capital revenue)
39,1% 39,5% 33,7% 42,1% 33,9% 33,9% 33,1% 35,8% 37,1%
Remuneration Total remuneration/(Total Revenue - capital revenue)
48,7% 48,1% 42,1% 50,5% 41,1% 41,1% 38,9% 42,3% 44,0%
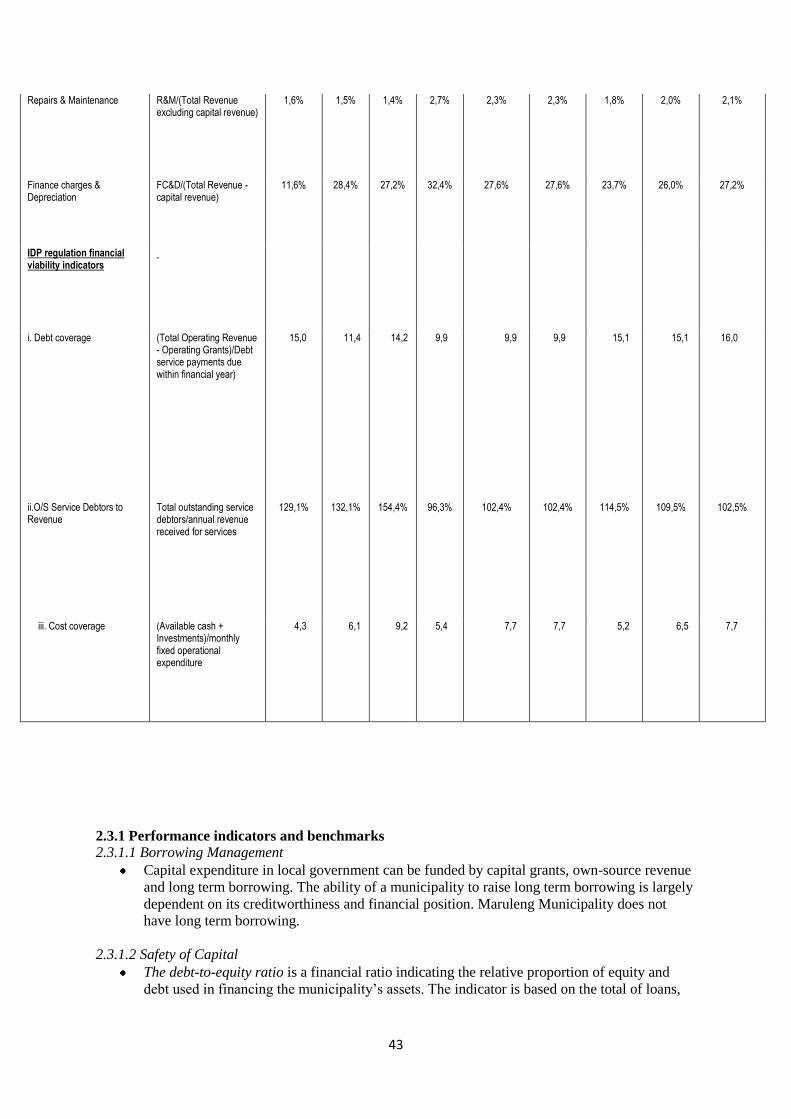
43
Repairs & Maintenance R&M/(Total Revenue excluding capital revenue)
1,6% 1,5% 1,4% 2,7% 2,3% 2,3% 1,8% 2,0% 2,1%
Finance charges & Depreciation
FC&D/(Total Revenue - capital revenue)
11,6% 28,4% 27,2% 32,4% 27,6% 27,6% 23,7% 26,0% 27,2%
IDP regulation financial viability indicators
i. Debt coverage (Total Operating Revenue - Operating Grants)/Debt service payments due within financial year)
15,0 11,4 14,2 9,9 9,9 9,9 15,1 15,1 16,0
ii.O/S Service Debtors to Revenue
Total outstanding service debtors/annual revenue received for services
129,1% 132,1% 154,4% 96,3% 102,4% 102,4% 114,5% 109,5% 102,5%
iii. Cost coverage (Available cash + Investments)/monthly fixed operational expenditure
4,3 6,1 9,2 5,4 7,7 7,7 5,2 6,5 7,7
2.3.1 Performance indicators and benchmarks 2.3.1.1 Borrowing Management
Capital expenditure in local government can be funded by capital grants, own-source revenue
and long term borrowing. The ability of a municipality to raise long term borrowing is largely
dependent on its creditworthiness and financial position. Maruleng Municipality does not
have long term borrowing.
2.3.1.2 Safety of Capital
The debt-to-equity ratio is a financial ratio indicating the relative proportion of equity and
debt used in financing the municipality’s assets. The indicator is based on the total of loans,
44
creditors and overdraft and tax provisions as a percentage of funds and reserves. The debt to
equity ratio for the Municipality is 0%
2.3.1.3 Liquidity
Current ratio is a measure of the current assets divided by the current liabilities and as a
benchmark the Municipality has set a limit of 2, hence at no point in time should this ratio be
less than 2. For the 2015/16 MTREF the current ratio is 4:0 and 5:1 and 5:5 for the two outer
years of the MTREF.
The liquidity ratio is a measure of the ability of the municipality to utilize cash and cash
equivalents to extinguish or retire its current liabilities immediately. Ideally the municipality
should have the equivalent cash and cash equivalents on hand to meet at least the current
liabilities, which should translate into a liquidity ratio of 1. Anything below 1 indicates a
shortage in cash to meet creditor obligations. For the 2015/16 financial year the ratio is 4:0
and 5:5 in the 2017/18 financial year. This shows that the municipality will be able to funds
their projects and operating expenditure without borrowings.
2.3.1.4 Revenue Management
As part of the financial sustainability strategy, an aggressive data cleansing and debt
management strategy needs to been implemented to increase cash inflow, not only from
current billings but also from debtors that are in arrears in excess of 90 days. The intention of
the strategy is to streamline the revenue value chain by ensuring accurate billing, customer
service, and credit control and debt collection.
2.3.1.5 Creditors Management
The Municipality has managed to ensure that creditors are settled within the legislated 30
days of invoice. While the liquidity ratio is of concern, by applying daily cash flow
management the municipality has managed to ensure a 100 per cent compliance rate to this
legislative obligation. This has had a favorable impact on supplier’s perceptions of risk of
doing business with the Municipality, which is expected to benefit the Municipality in the
form of more competitive pricing of tenders, as suppliers compete for the Municipality’s
business.
2.3.1.6 Other Indicators
The Municipality does not distribute electricity to the public the function is carried out by
Eskom. Employee costs as a percentage of operating revenue continues to increase over the
MTREF. This is primarily due to the increase in vacancy rate and budget for salary disparity.
2.3.2 Free Basic Services: basic social services package for indigent households
The social package assists residents that have difficulty paying for services and are registered as
indigent households in terms of the Indigent Policy of the Municipality. With the exception of water,
only registered indigents qualify for the free basic services.
For the 2015/16 financial year 4 145 registered indigents have been provided for in the budget , In
terms of the Municipality’s indigent policy registered households are entitled to 6kℓ fee water, and 6
kℓ sanitation.
45
Further detail relating to the number of households receiving free basic services, the cost of free basic
services, highest level of free basic services as well as the revenue cost associated with the free basic
services is contained in MBRR A10 (Basic Service Delivery Measurement
Note that the number of households in informal areas that receive free services and the cost of these
services (e.g. the provision of water through stand pipes, water tankers, etc) are not taken into account
in the table noted above.
2.3.3 Providing clean water and managing waste water The Municipality is not the Water Services Authority for the municipality in terms of the Water
Services Act, 1997 but only acts as water services provider. Approximately 100 per cent of the
Municipality’s bulk water needs are provided by Department of Public Work in the form of purified
water.
2.4 OVERVIEW OF BUDGET RELATED-POLICIES The Municipality’s budgeting process is guided and governed by relevant legislation, frameworks,
strategies and related policies.
2.4.1 Review of credit control and debt collection procedures/policies
The Reviewed Collection Policy was applied by Council and still need to be adopted in May
2015, the policy is credible, sustainable, manageable and informed by affordability and value
for money there has been a need to review certain components to achieve a higher collection
rate. Some of the revisions included the lowering of the credit periods for the down payment
of debt. In addition emphasis will be placed on speeding up the indigent registration process
to ensure that credit control and debt collection efforts are not fruitlessly wasted on these
debtors.
The 2015/16 MTREF has been prepared on the basis of achieving an average debtors’
collection rate on current billings. In addition the collection of debt in excess of 90 days has
been prioritized as a relevant strategy in increasing the Municipality’s cash levels. In
addition,
2.4.2 Inventory and Asset Management Policy
A proxy for asset consumption can be considered the level of depreciation each asset incurs
on an annual basis. Preserving the investment in existing infrastructure needs to be
considered a significant strategy in ensuring the future sustainability of infrastructure and the
Municipality’s revenue base.
2.4.3 Budget and Virement Policy
The adjustments budget process is governed by various provisions in the MFMA and is aimed
at instilling and establishing an increased level of discipline, responsibility and accountability
in the financial management practices of municipalities. To ensure that the Municipality
continues to deliver on its core mandate and achieves its developmental goals, the mid-year
review and adjustment budget process will be utilised to ensure that underperforming
functions are identified and funds redirected to performing functions.
2.4.4 Supply Chain Management Policy
The Supply Chain Management Policy was reviewed and still need to be adopted by Council .
An amended policy will be considered by Council in due course of which the amendments
will be extensively consulted on.
2.4.5 Cash Management and Investment Policy

46
The Municipality’s Cash Management and Investment Policy were reviewed by Council but
still need to be adopted. The aim of the policy is to ensure that the Municipality’s surplus
cash and investments are adequately managed, especially the funds set aside for the cash
backing of certain reserves. The policy details the minimum cash and a cash equivalent
required at any point in time and introduces time frames to achieve certain benchmarks.
2.4.6 Tariff Policies
The Municipality’s tariff policies provide a broad framework within which the Council can
determine fair, transparent and affordable charges that also promote sustainable service
delivery. The policies envisaged to be compiled for ease of administration and
implementation of the next two years.
2.4.7 Indigent Policies
In terms of the Municipality’s Indigent policy, Households with a total monthly gross income
of R1 500,00 or less qualifies to a subsidy on property rates and services charges for
sewerage and refuse removal and will additionally receive 6 kl of water per month free of
charge.
2.5. OVERVIEW OF BUDGET ASSUMPTIONS
2.5.1 External factors
Owing to the economic slowdown, financial resources are limited due to reduced payment
levels by consumers. This has resulted in declining cash inflows, which has necessitated
restrained expenditure to ensure that cash outflows remain within the affordability parameters
of the Municipality’s finances.
2.5.2 General inflation outlook and its impact on the municipal activities There are five key factors that have been taken into consideration in the compilation of the 2015/16
MTREF:
National Government macro economic targets;
The general inflationary outlook and the impact on Municipality’s residents and
businesses;
The impact of municipal cost drivers;
The wage agreement SALGBC concluded by municipal union s Municipalities
must take into account the multi-year Salary and Wage Collective Agreement
for the period 1 July 2012 to 30 June 2015. The agreement provides for a wage
increase based on the average CPI for the period 1 July 2015 with an increase
of 4.4 percent.
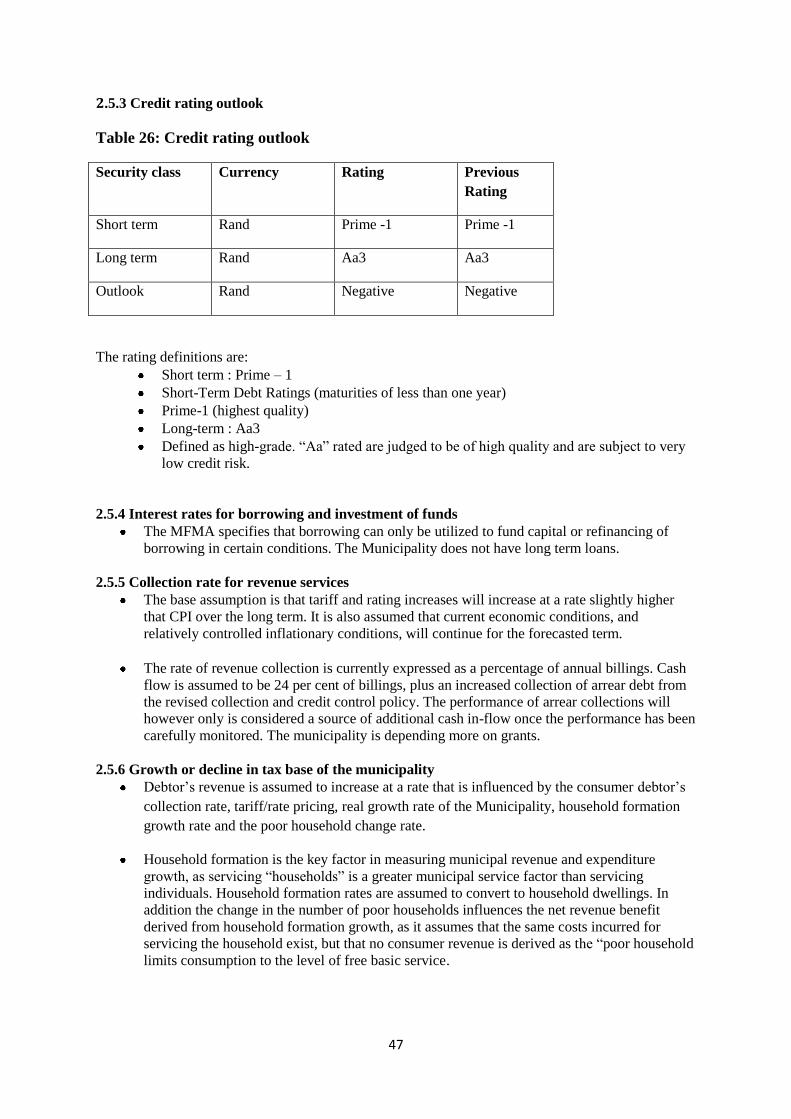
47
2.5.3 Credit rating outlook
Table 26: Credit rating outlook
Security class Currency Rating Previous
Rating
Short term Rand Prime -1 Prime -1
Long term Rand Aa3 Aa3
Outlook Rand Negative Negative
The rating definitions are:
Short term : Prime – 1
Short-Term Debt Ratings (maturities of less than one year)
Prime-1 (highest quality)
Long-term : Aa3
Defined as high-grade. “Aa” rated are judged to be of high quality and are subject to very
low credit risk.
2.5.4 Interest rates for borrowing and investment of funds
The MFMA specifies that borrowing can only be utilized to fund capital or refinancing of
borrowing in certain conditions. The Municipality does not have long term loans.
2.5.5 Collection rate for revenue services
The base assumption is that tariff and rating increases will increase at a rate slightly higher
that CPI over the long term. It is also assumed that current economic conditions, and
relatively controlled inflationary conditions, will continue for the forecasted term.
The rate of revenue collection is currently expressed as a percentage of annual billings. Cash
flow is assumed to be 24 per cent of billings, plus an increased collection of arrear debt from
the revised collection and credit control policy. The performance of arrear collections will
however only is considered a source of additional cash in-flow once the performance has been
carefully monitored. The municipality is depending more on grants.
2.5.6 Growth or decline in tax base of the municipality
Debtor’s revenue is assumed to increase at a rate that is influenced by the consumer debtor’s
collection rate, tariff/rate pricing, real growth rate of the Municipality, household formation
growth rate and the poor household change rate.
Household formation is the key factor in measuring municipal revenue and expenditure
growth, as servicing “households” is a greater municipal service factor than servicing
individuals. Household formation rates are assumed to convert to household dwellings. In
addition the change in the number of poor households influences the net revenue benefit
derived from household formation growth, as it assumes that the same costs incurred for
servicing the household exist, but that no consumer revenue is derived as the “poor household
limits consumption to the level of free basic service.
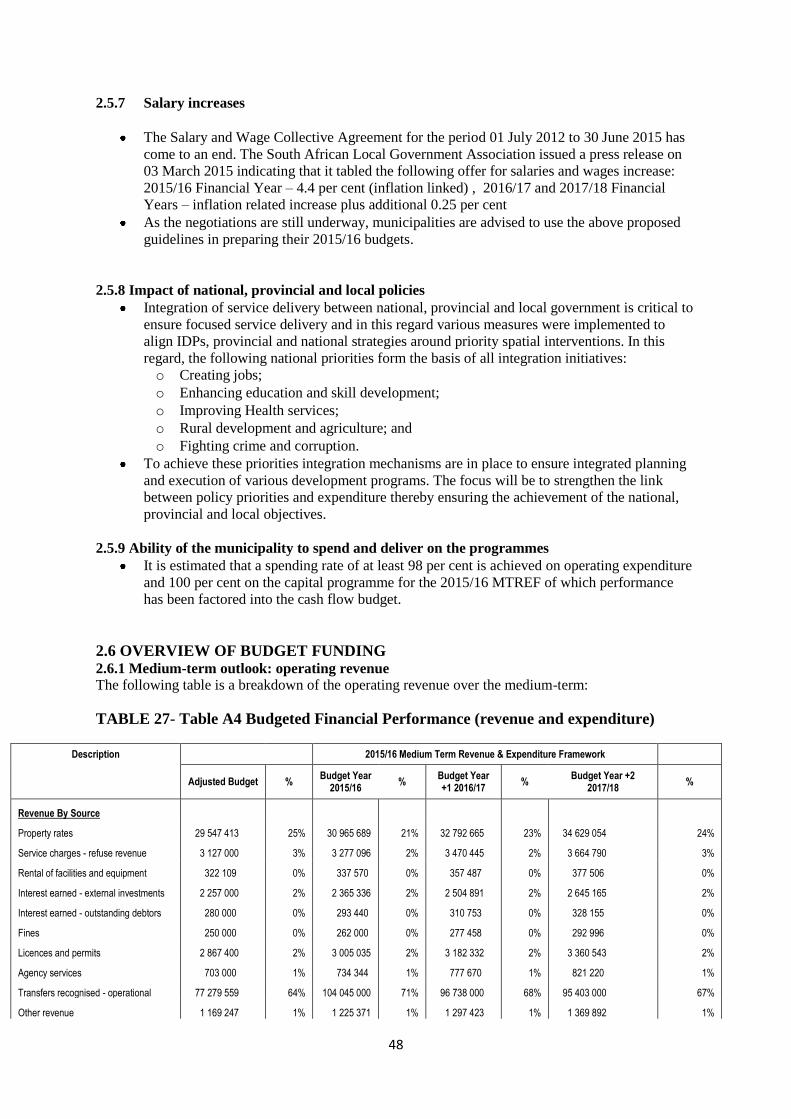
48
2.5.7 Salary increases
The Salary and Wage Collective Agreement for the period 01 July 2012 to 30 June 2015 has
come to an end. The South African Local Government Association issued a press release on
03 March 2015 indicating that it tabled the following offer for salaries and wages increase:
2015/16 Financial Year – 4.4 per cent (inflation linked) , 2016/17 and 2017/18 Financial
Years – inflation related increase plus additional 0.25 per cent
As the negotiations are still underway, municipalities are advised to use the above proposed
guidelines in preparing their 2015/16 budgets.
2.5.8 Impact of national, provincial and local policies
Integration of service delivery between national, provincial and local government is critical to
ensure focused service delivery and in this regard various measures were implemented to
align IDPs, provincial and national strategies around priority spatial interventions. In this
regard, the following national priorities form the basis of all integration initiatives:
o Creating jobs;
o Enhancing education and skill development;
o Improving Health services;
o Rural development and agriculture; and
o Fighting crime and corruption.
To achieve these priorities integration mechanisms are in place to ensure integrated planning
and execution of various development programs. The focus will be to strengthen the link
between policy priorities and expenditure thereby ensuring the achievement of the national,
provincial and local objectives.
2.5.9 Ability of the municipality to spend and deliver on the programmes
It is estimated that a spending rate of at least 98 per cent is achieved on operating expenditure
and 100 per cent on the capital programme for the 2015/16 MTREF of which performance
has been factored into the cash flow budget.
2.6 OVERVIEW OF BUDGET FUNDING 2.6.1 Medium-term outlook: operating revenue
The following table is a breakdown of the operating revenue over the medium-term:
TABLE 27- Table A4 Budgeted Financial Performance (revenue and expenditure)
Description 2015/16 Medium Term Revenue & Expenditure Framework
Adjusted Budget % Budget Year
2015/16 %
Budget Year +1 2016/17
% Budget Year +2
2017/18 %
Revenue By Source
Property rates 29 547 413 25% 30 965 689 21% 32 792 665 23% 34 629 054 24%
Service charges - refuse revenue 3 127 000 3% 3 277 096 2% 3 470 445 2% 3 664 790 3%
Rental of facilities and equipment 322 109 0% 337 570 0% 357 487 0% 377 506 0%
Interest earned - external investments 2 257 000 2% 2 365 336 2% 2 504 891 2% 2 645 165 2%
Interest earned - outstanding debtors 280 000 0% 293 440 0% 310 753 0% 328 155 0%
Fines 250 000 0% 262 000 0% 277 458 0% 292 996 0%
Licences and permits 2 867 400 2% 3 005 035 2% 3 182 332 2% 3 360 543 2%
Agency services 703 000 1% 734 344 1% 777 670 1% 821 220 1%
Transfers recognised - operational 77 279 559 64% 104 045 000 71% 96 738 000 68% 95 403 000 67%
Other revenue 1 169 247 1% 1 225 371 1% 1 297 423 1% 1 369 892 1%

49
Gains on disposal of PPE 2 075 000 2% 0% 0% 0%
Total Revenue (excluding capital transfers and contributions)
119 877 728 100% 146 510 881 100% 141 709 123 100% 142 892 320 100%
Table 28-The following graph is a breakdown of the operational revenue per main
category for the 2015/16 financial year.
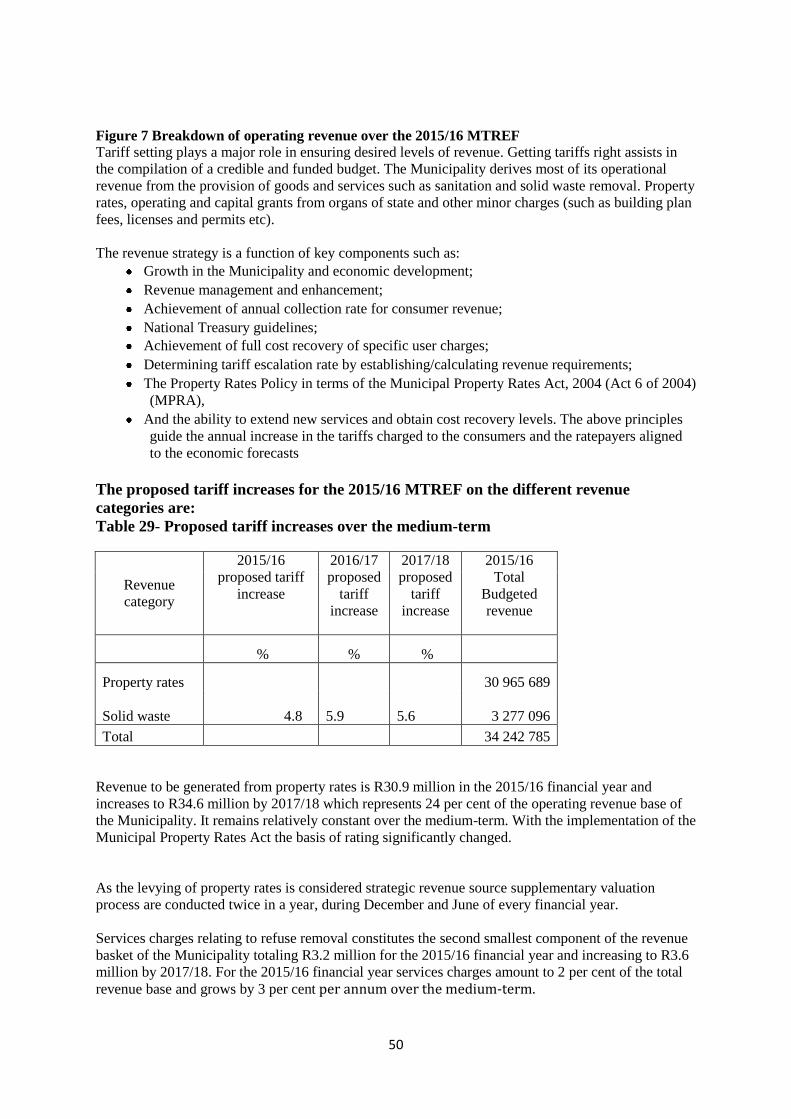
50
Figure 7 Breakdown of operating revenue over the 2015/16 MTREF Tariff setting plays a major role in ensuring desired levels of revenue. Getting tariffs right assists in
the compilation of a credible and funded budget. The Municipality derives most of its operational
revenue from the provision of goods and services such as sanitation and solid waste removal. Property
rates, operating and capital grants from organs of state and other minor charges (such as building plan
fees, licenses and permits etc).
The revenue strategy is a function of key components such as:
Growth in the Municipality and economic development;
Revenue management and enhancement;
Achievement of annual collection rate for consumer revenue;
National Treasury guidelines;
Achievement of full cost recovery of specific user charges;
Determining tariff escalation rate by establishing/calculating revenue requirements;
The Property Rates Policy in terms of the Municipal Property Rates Act, 2004 (Act 6 of 2004)
(MPRA),
And the ability to extend new services and obtain cost recovery levels. The above principles
guide the annual increase in the tariffs charged to the consumers and the ratepayers aligned
to the economic forecasts
The proposed tariff increases for the 2015/16 MTREF on the different revenue
categories are:
Table 29- Proposed tariff increases over the medium-term
Revenue
category
2015/16
proposed tariff
increase
2016/17
proposed
tariff
increase
2017/18
proposed
tariff
increase
2015/16
Total
Budgeted
revenue
% % %
Property rates 30 965 689
Solid waste 4.8
5.9
5.6 3 277 096
Total 34 242 785
Revenue to be generated from property rates is R30.9 million in the 2015/16 financial year and
increases to R34.6 million by 2017/18 which represents 24 per cent of the operating revenue base of
the Municipality. It remains relatively constant over the medium-term. With the implementation of the
Municipal Property Rates Act the basis of rating significantly changed.
As the levying of property rates is considered strategic revenue source supplementary valuation
process are conducted twice in a year, during December and June of every financial year.
Services charges relating to refuse removal constitutes the second smallest component of the revenue
basket of the Municipality totaling R3.2 million for the 2015/16 financial year and increasing to R3.6
million by 2017/18. For the 2015/16 financial year services charges amount to 2 per cent of the total
revenue base and grows by 3 per cent per annum over the medium-term.
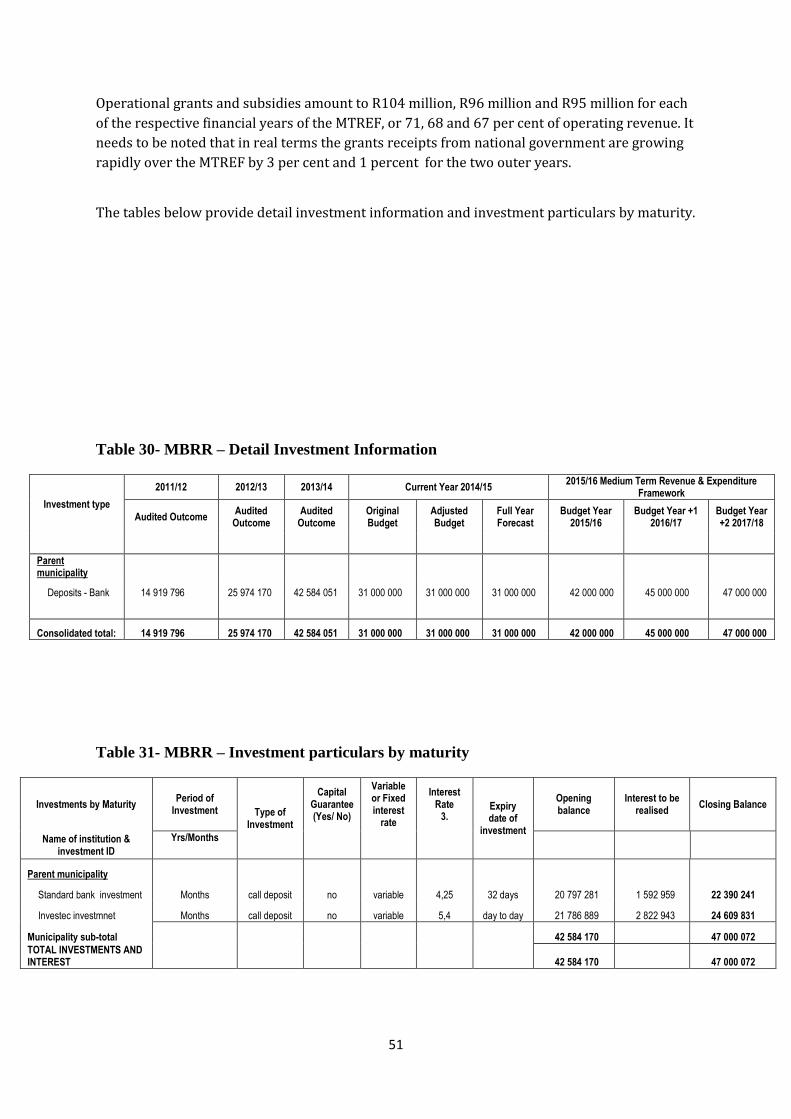
51
Operational grants and subsidies amount to R104 million, R96 million and R95 million for each
of the respective financial years of the MTREF, or 71, 68 and 67 per cent of operating revenue. It
needs to be noted that in real terms the grants receipts from national government are growing
rapidly over the MTREF by 3 per cent and 1 percent for the two outer years.
The tables below provide detail investment information and investment particulars by maturity.
Table 30- MBRR – Detail Investment Information
Investment type
2011/12 2012/13 2013/14 Current Year 2014/15 2015/16 Medium Term Revenue & Expenditure
Framework
Audited Outcome Audited
Outcome Audited
Outcome Original Budget
Adjusted Budget
Full Year Forecast
Budget Year 2015/16
Budget Year +1 2016/17
Budget Year +2 2017/18
Parent municipality
Deposits - Bank 14 919 796 25 974 170 42 584 051 31 000 000 31 000 000 31 000 000 42 000 000 45 000 000 47 000 000
Consolidated total: 14 919 796 25 974 170 42 584 051 31 000 000 31 000 000 31 000 000 42 000 000 45 000 000 47 000 000
Table 31- MBRR – Investment particulars by maturity
Investments by Maturity Period of
Investment Type of Investment
Capital Guarantee (Yes/ No)
Variable or Fixed interest
rate
Interest Rate
3. Expiry date of
investment
Opening balance
Interest to be realised
Closing Balance
Name of institution & investment ID
Yrs/Months
Parent municipality
Standard bank investment Months call deposit no variable 4,25 32 days 20 797 281 1 592 959 22 390 241
Investec investmnet Months call deposit no variable 5,4 day to day 21 786 889 2 822 943 24 609 831
Municipality sub-total 42 584 170 47 000 072
TOTAL INVESTMENTS AND INTEREST 42 584 170 47 000 072
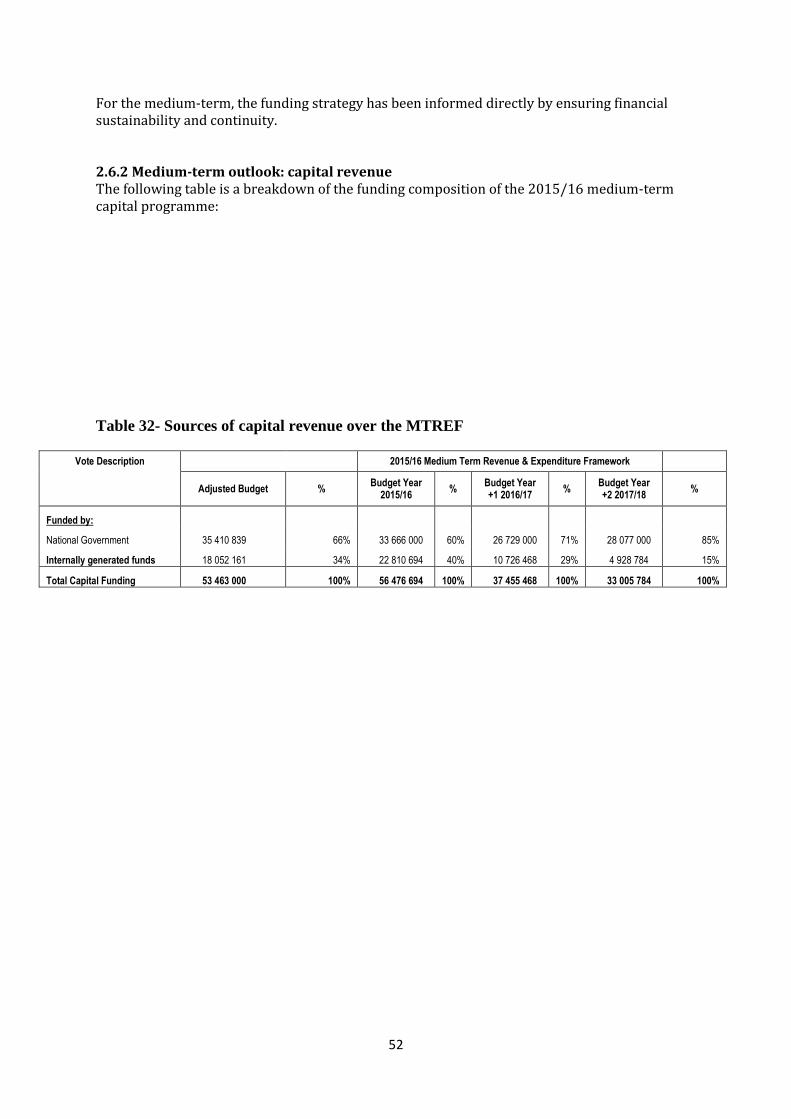
52
For the medium-term, the funding strategy has been informed directly by ensuring financial sustainability and continuity. 2.6.2 Medium-term outlook: capital revenue The following table is a breakdown of the funding composition of the 2015/16 medium-term capital programme:
Table 32- Sources of capital revenue over the MTREF
Vote Description 2015/16 Medium Term Revenue & Expenditure Framework
Adjusted Budget %
Budget Year 2015/16
% Budget Year +1 2016/17
% Budget Year +2 2017/18
%
Funded by:
National Government 35 410 839 66% 33 666 000 60% 26 729 000 71% 28 077 000 85%
Internally generated funds 18 052 161 34% 22 810 694 40% 10 726 468 29% 4 928 784 15%
Total Capital Funding 53 463 000 100% 56 476 694 100% 37 455 468 100% 33 005 784 100%
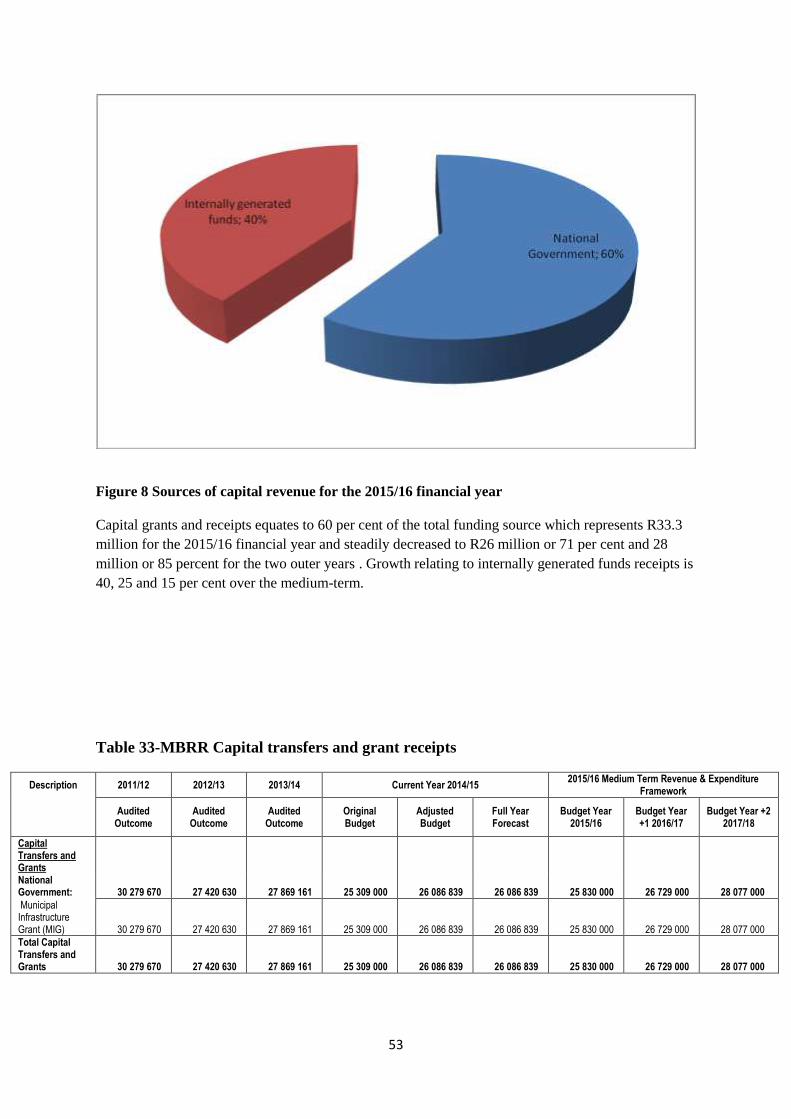
53
Figure 8 Sources of capital revenue for the 2015/16 financial year
Capital grants and receipts equates to 60 per cent of the total funding source which represents R33.3
million for the 2015/16 financial year and steadily decreased to R26 million or 71 per cent and 28
million or 85 percent for the two outer years . Growth relating to internally generated funds receipts is
40, 25 and 15 per cent over the medium-term.
Table 33-MBRR Capital transfers and grant receipts
Description 2011/12 2012/13 2013/14 Current Year 2014/15 2015/16 Medium Term Revenue & Expenditure
Framework
Audited
Outcome Audited
Outcome Audited
Outcome Original Budget
Adjusted Budget
Full Year Forecast
Budget Year 2015/16
Budget Year +1 2016/17
Budget Year +2 2017/18
Capital Transfers and Grants
National Government: 30 279 670 27 420 630 27 869 161 25 309 000 26 086 839 26 086 839 25 830 000 26 729 000 28 077 000
Municipal Infrastructure Grant (MIG) 30 279 670 27 420 630 27 869 161 25 309 000 26 086 839 26 086 839 25 830 000 26 729 000 28 077 000
Total Capital Transfers and Grants 30 279 670 27 420 630 27 869 161 25 309 000 26 086 839 26 086 839 25 830 000 26 729 000 28 077 000
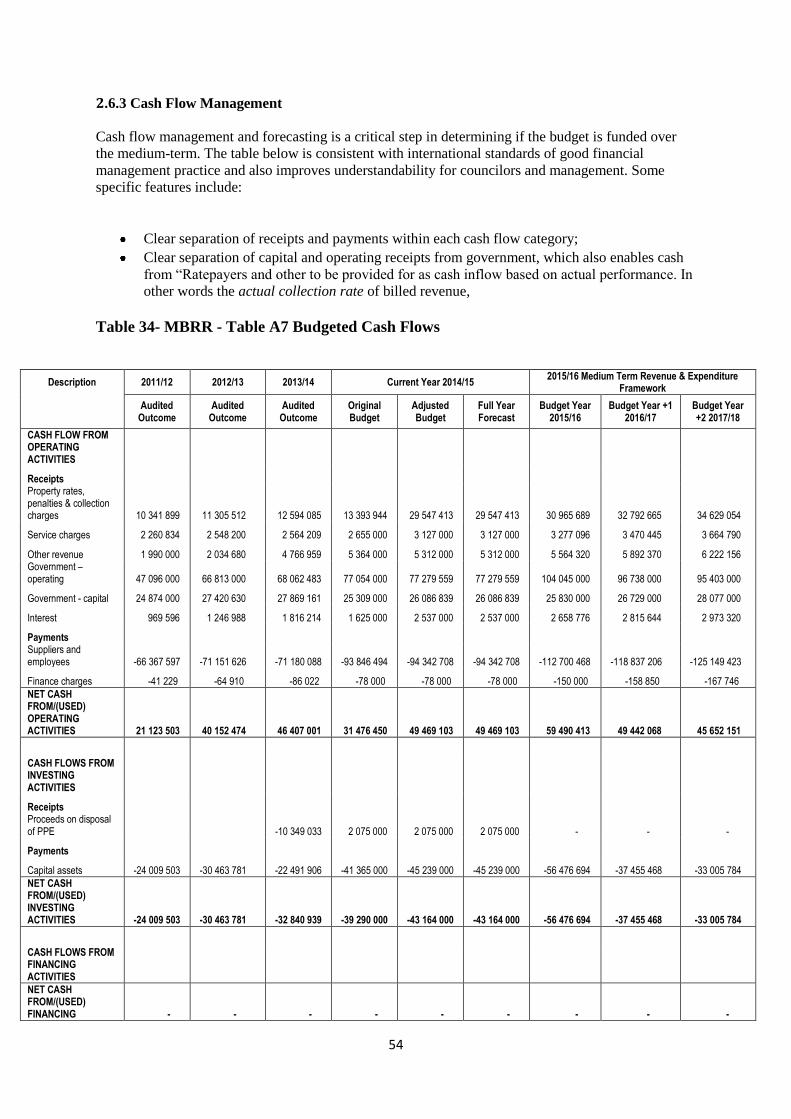
54
2.6.3 Cash Flow Management
Cash flow management and forecasting is a critical step in determining if the budget is funded over
the medium-term. The table below is consistent with international standards of good financial
management practice and also improves understandability for councilors and management. Some
specific features include:
Clear separation of receipts and payments within each cash flow category;
Clear separation of capital and operating receipts from government, which also enables cash
from “Ratepayers and other to be provided for as cash inflow based on actual performance. In
other words the actual collection rate of billed revenue,
Table 34- MBRR - Table A7 Budgeted Cash Flows
Description 2011/12 2012/13 2013/14 Current Year 2014/15 2015/16 Medium Term Revenue & Expenditure
Framework
Audited
Outcome Audited
Outcome Audited
Outcome Original Budget
Adjusted Budget
Full Year Forecast
Budget Year 2015/16
Budget Year +1 2016/17
Budget Year +2 2017/18
CASH FLOW FROM OPERATING ACTIVITIES
Receipts Property rates, penalties & collection charges 10 341 899 11 305 512 12 594 085 13 393 944 29 547 413 29 547 413 30 965 689 32 792 665 34 629 054
Service charges 2 260 834 2 548 200 2 564 209 2 655 000 3 127 000 3 127 000 3 277 096 3 470 445 3 664 790
Other revenue 1 990 000 2 034 680 4 766 959 5 364 000 5 312 000 5 312 000 5 564 320 5 892 370 6 222 156 Government – operating 47 096 000 66 813 000 68 062 483 77 054 000 77 279 559 77 279 559 104 045 000 96 738 000 95 403 000
Government - capital 24 874 000 27 420 630 27 869 161 25 309 000 26 086 839 26 086 839 25 830 000 26 729 000 28 077 000
Interest 969 596 1 246 988 1 816 214 1 625 000 2 537 000 2 537 000 2 658 776 2 815 644 2 973 320
Payments Suppliers and employees -66 367 597 -71 151 626 -71 180 088 -93 846 494 -94 342 708 -94 342 708 -112 700 468 -118 837 206 -125 149 423
Finance charges -41 229 -64 910 -86 022 -78 000 -78 000 -78 000 -150 000 -158 850 -167 746
NET CASH FROM/(USED) OPERATING ACTIVITIES 21 123 503 40 152 474 46 407 001 31 476 450 49 469 103 49 469 103 59 490 413 49 442 068 45 652 151
CASH FLOWS FROM INVESTING ACTIVITIES
Receipts Proceeds on disposal of PPE -10 349 033 2 075 000 2 075 000 2 075 000 - - -
Payments
Capital assets -24 009 503 -30 463 781 -22 491 906 -41 365 000 -45 239 000 -45 239 000 -56 476 694 -37 455 468 -33 005 784
NET CASH FROM/(USED) INVESTING ACTIVITIES -24 009 503 -30 463 781 -32 840 939 -39 290 000 -43 164 000 -43 164 000 -56 476 694 -37 455 468 -33 005 784
CASH FLOWS FROM FINANCING ACTIVITIES
NET CASH FROM/(USED) FINANCING - - - - - - - - -
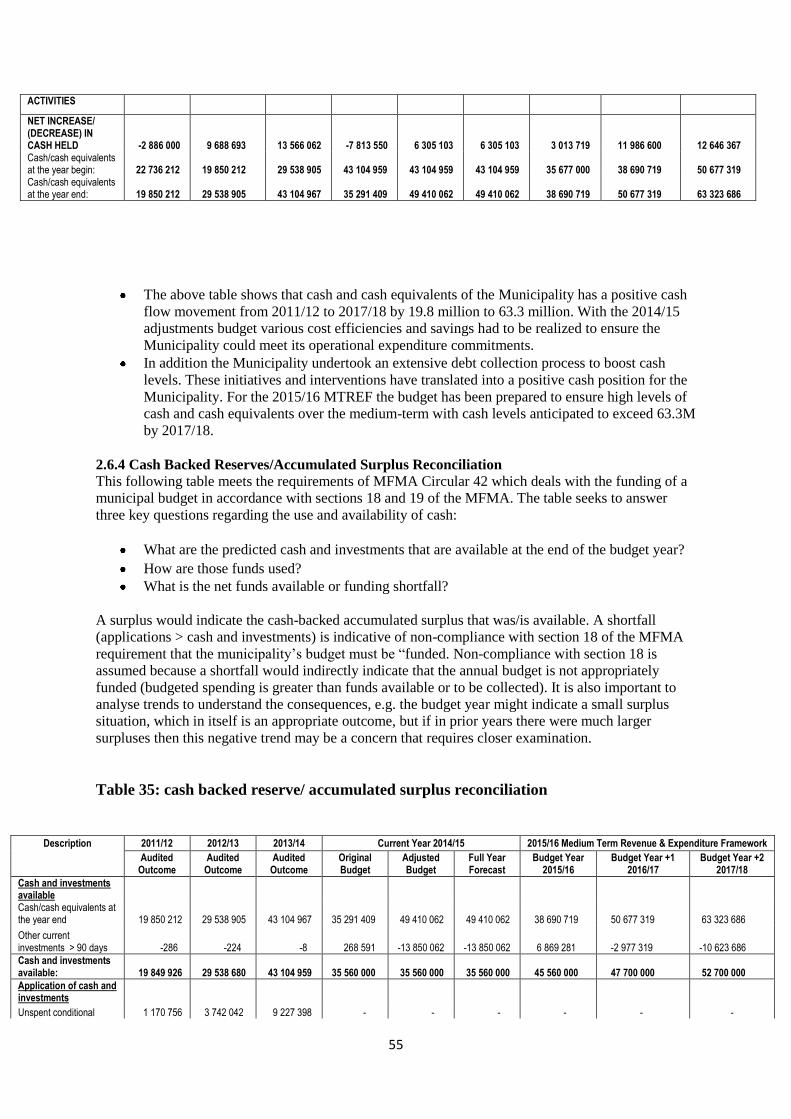
55
ACTIVITIES
NET INCREASE/ (DECREASE) IN CASH HELD -2 886 000 9 688 693 13 566 062 -7 813 550 6 305 103 6 305 103 3 013 719 11 986 600 12 646 367 Cash/cash equivalents at the year begin: 22 736 212 19 850 212 29 538 905 43 104 959 43 104 959 43 104 959 35 677 000 38 690 719 50 677 319 Cash/cash equivalents at the year end: 19 850 212 29 538 905 43 104 967 35 291 409 49 410 062 49 410 062 38 690 719 50 677 319 63 323 686
The above table shows that cash and cash equivalents of the Municipality has a positive cash
flow movement from 2011/12 to 2017/18 by 19.8 million to 63.3 million. With the 2014/15
adjustments budget various cost efficiencies and savings had to be realized to ensure the
Municipality could meet its operational expenditure commitments.
In addition the Municipality undertook an extensive debt collection process to boost cash
levels. These initiatives and interventions have translated into a positive cash position for the
Municipality. For the 2015/16 MTREF the budget has been prepared to ensure high levels of
cash and cash equivalents over the medium-term with cash levels anticipated to exceed 63.3M
by 2017/18.
2.6.4 Cash Backed Reserves/Accumulated Surplus Reconciliation This following table meets the requirements of MFMA Circular 42 which deals with the funding of a
municipal budget in accordance with sections 18 and 19 of the MFMA. The table seeks to answer
three key questions regarding the use and availability of cash:
What are the predicted cash and investments that are available at the end of the budget year?
How are those funds used?
What is the net funds available or funding shortfall?
A surplus would indicate the cash-backed accumulated surplus that was/is available. A shortfall
(applications > cash and investments) is indicative of non-compliance with section 18 of the MFMA
requirement that the municipality’s budget must be “funded. Non-compliance with section 18 is
assumed because a shortfall would indirectly indicate that the annual budget is not appropriately
funded (budgeted spending is greater than funds available or to be collected). It is also important to
analyse trends to understand the consequences, e.g. the budget year might indicate a small surplus
situation, which in itself is an appropriate outcome, but if in prior years there were much larger
surpluses then this negative trend may be a concern that requires closer examination.
Table 35: cash backed reserve/ accumulated surplus reconciliation
Description 2011/12 2012/13 2013/14 Current Year 2014/15 2015/16 Medium Term Revenue & Expenditure Framework
Audited
Outcome Audited
Outcome Audited
Outcome Original Budget
Adjusted Budget
Full Year Forecast
Budget Year 2015/16
Budget Year +1 2016/17
Budget Year +2 2017/18
Cash and investments available Cash/cash equivalents at the year end 19 850 212 29 538 905 43 104 967 35 291 409 49 410 062 49 410 062 38 690 719 50 677 319 63 323 686
Other current investments > 90 days -286 -224 -8 268 591 -13 850 062 -13 850 062 6 869 281 -2 977 319 -10 623 686
Cash and investments available: 19 849 926 29 538 680 43 104 959 35 560 000 35 560 000 35 560 000 45 560 000 47 700 000 52 700 000
Application of cash and investments
Unspent conditional 1 170 756 3 742 042 9 227 398 - - - - - -
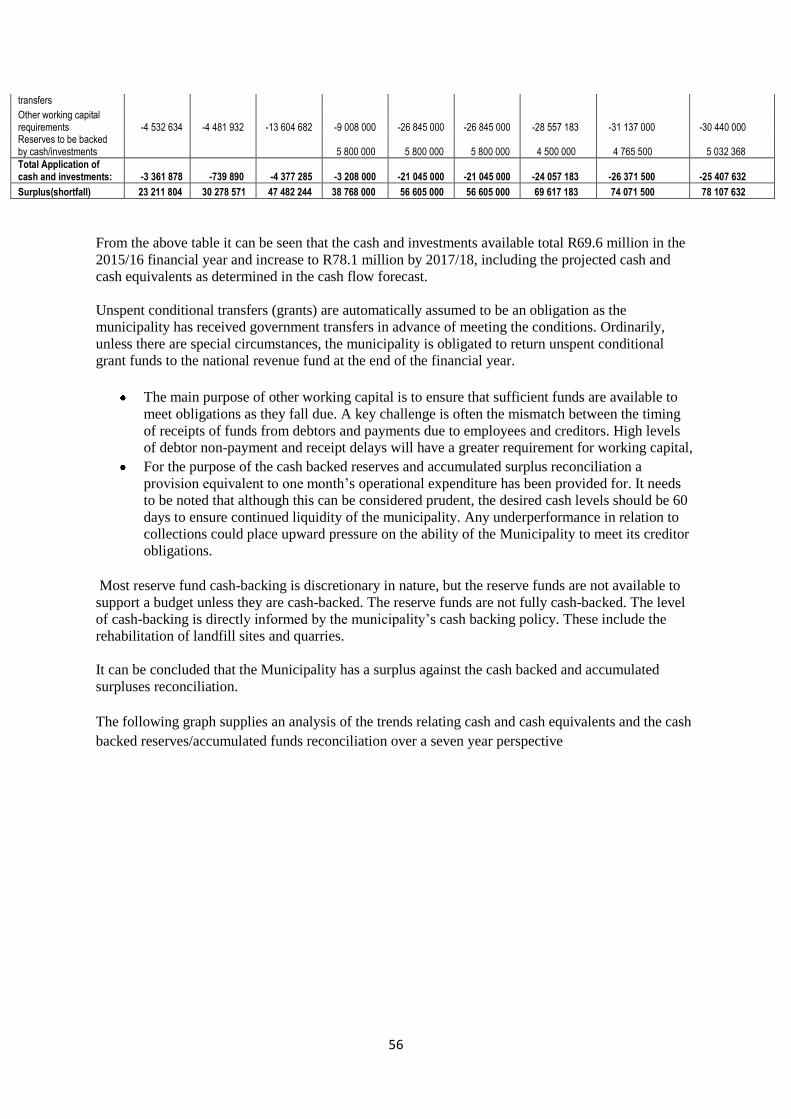
56
transfers
Other working capital requirements -4 532 634 -4 481 932 -13 604 682 -9 008 000 -26 845 000 -26 845 000 -28 557 183 -31 137 000 -30 440 000 Reserves to be backed by cash/investments 5 800 000 5 800 000 5 800 000 4 500 000 4 765 500 5 032 368
Total Application of cash and investments: -3 361 878 -739 890 -4 377 285 -3 208 000 -21 045 000 -21 045 000 -24 057 183 -26 371 500 -25 407 632
Surplus(shortfall) 23 211 804 30 278 571 47 482 244 38 768 000 56 605 000 56 605 000 69 617 183 74 071 500 78 107 632
From the above table it can be seen that the cash and investments available total R69.6 million in the
2015/16 financial year and increase to R78.1 million by 2017/18, including the projected cash and
cash equivalents as determined in the cash flow forecast.
Unspent conditional transfers (grants) are automatically assumed to be an obligation as the
municipality has received government transfers in advance of meeting the conditions. Ordinarily,
unless there are special circumstances, the municipality is obligated to return unspent conditional
grant funds to the national revenue fund at the end of the financial year.
The main purpose of other working capital is to ensure that sufficient funds are available to
meet obligations as they fall due. A key challenge is often the mismatch between the timing
of receipts of funds from debtors and payments due to employees and creditors. High levels
of debtor non-payment and receipt delays will have a greater requirement for working capital,
For the purpose of the cash backed reserves and accumulated surplus reconciliation a
provision equivalent to one month’s operational expenditure has been provided for. It needs
to be noted that although this can be considered prudent, the desired cash levels should be 60
days to ensure continued liquidity of the municipality. Any underperformance in relation to
collections could place upward pressure on the ability of the Municipality to meet its creditor
obligations.
Most reserve fund cash-backing is discretionary in nature, but the reserve funds are not available to
support a budget unless they are cash-backed. The reserve funds are not fully cash-backed. The level
of cash-backing is directly informed by the municipality’s cash backing policy. These include the
rehabilitation of landfill sites and quarries.
It can be concluded that the Municipality has a surplus against the cash backed and accumulated
surpluses reconciliation.
The following graph supplies an analysis of the trends relating cash and cash equivalents and the cash
backed reserves/accumulated funds reconciliation over a seven year perspective
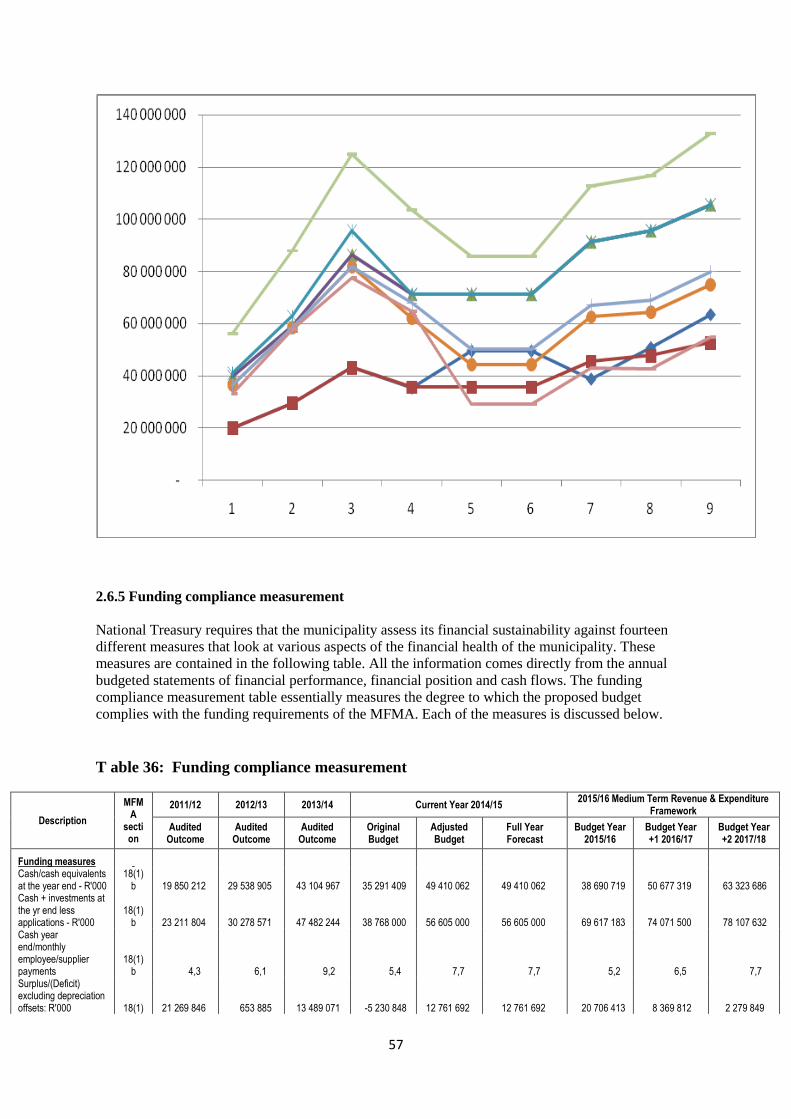
57
2.6.5 Funding compliance measurement
National Treasury requires that the municipality assess its financial sustainability against fourteen
different measures that look at various aspects of the financial health of the municipality. These
measures are contained in the following table. All the information comes directly from the annual
budgeted statements of financial performance, financial position and cash flows. The funding
compliance measurement table essentially measures the degree to which the proposed budget
complies with the funding requirements of the MFMA. Each of the measures is discussed below.
T able 36: Funding compliance measurement
Description
MFMA
section
2011/12 2012/13 2013/14 Current Year 2014/15 2015/16 Medium Term Revenue & Expenditure
Framework
Audited Outcome
Audited Outcome
Audited Outcome
Original Budget
Adjusted Budget
Full Year Forecast
Budget Year 2015/16
Budget Year +1 2016/17
Budget Year +2 2017/18
Funding measures Cash/cash equivalents at the year end - R'000
18(1)b 19 850 212 29 538 905 43 104 967 35 291 409 49 410 062 49 410 062 38 690 719 50 677 319 63 323 686
Cash + investments at the yr end less applications - R'000
18(1)b 23 211 804 30 278 571 47 482 244 38 768 000 56 605 000 56 605 000 69 617 183 74 071 500 78 107 632
Cash year end/monthly employee/supplier payments
18(1)b 4,3 6,1 9,2 5,4 7,7 7,7 5,2 6,5 7,7
Surplus/(Deficit) excluding depreciation offsets: R'000 18(1) 21 269 846 653 885 13 489 071 -5 230 848 12 761 692 12 761 692 20 706 413 8 369 812 2 279 849

58
Service charge rev % change - macro CPIX target exclusive
18(1)a,(2) N.A. 3,9% 3,4% (0,1%) 97,6% (6,0%) (1,2%) (0,1%) (0,4%)
Cash receipts % of Ratepayer & Other revenue
18(1)a,(2) 83,2% 80,8% 92,8% 99,4% 99,3% 99,3% 99,3% 99,3% 99,3%
Debt impairment expense as a % of total billable revenue
18(1)a,(2) 28,5% 21,9% 18,3% 23,1% 11,3% 11,3% 12,3% 12,3% 12,3%
Capital payments % of capital expenditure
18(1)c;19 76,9% 87,8% 66,0% 83,4% 84,6% 84,6% 100,0% 91,7% 89,8%
Borrowing receipts % of capital expenditure (excl. transfers)
18(1)c 0,0% 0,0% 0,0% 0,0% 0,0% 0,0% 0,0% 0,0% 0,0%
Grants % of Govt. legislated/gazetted allocations
18(1)a 100,0% 100,0% 100,0%
Current consumer debtors % change - incr(decr)
18(1)a N.A. 11,8% 27,8% (33,7%) 113,9% 0,0% 17,2% 1,3% (1,1%)
Long term receivables % change - incr(decr)
18(1)a N.A. 0,0% 0,0% 0,0% 0,0% 0,0% 0,0% 0,0% 0,0%
R&M % of Property Plant & Equipment
20(1)(vi) 0,7% 0,4% 0,5% 0,7% 0,7% 0,7% 0,7% 0,8% 0,8%
Asset renewal % of capital budget
20(1)(vi) 4,8% 14,2% 10,7% 5,2% 4,5% 4,5% 6,2% 5,9% 8,4%
2.6.5.1 Cash/cash equivalent position
The Municipality’s forecast cash position was discussed as part of the budgeted cash flow
statement. A ‘positive cash position, for each year of the MTREF would generally be a
minimum requirement, subject to the planned application of these funds such as cash-backing
of reserves and working capital requirements.
If the municipality’s forecast cash position is negative, for any year of the medium term
budget, the budget is very unlikely to meet MFMA requirements or be sustainable and could
indicate a risk of non-compliance with section 45 of the MFMA which deals with the
repayment of short term debt at the end of the financial year. The forecasted cash and cash
equivalents for the 2015/16 MTREF shows R38.6 million, R50.6 million and R63.3 million
for each respective financial year.
2.6.5.2 Cash plus investments less application of funds
The purpose of this measure is to understand how the municipality has applied the available
cash and investments as identified in the budgeted cash flow statement. The detail
reconciliation of the cash backed reserves/surpluses is contained in Table 35; the
reconciliation is intended to be a relatively simple methodology for understanding the
budgeted amount of cash and investments available with any planned or required applications
to be made. This has been extensively discussed above.
2.6.5.3 Monthly average payments covered by cash or cash equivalents
The purpose of this measure is to understand the level of financial risk should the
municipality be under stress from a collection and cash in-flow perspective. Regardless of the
annual cash position an evaluation should be made of the ability of the Municipality to meet
monthly payments as and when they fall due. It is especially important to consider the
position should the municipality be faced with an unexpected disaster that threatens revenue
collection such as rate boycotts. Notably, the ratio has been increasing significantly for the
period 2015/16 to 2017/18, moving from 5.2 to 7.7 as indicated above the Municipality aims
to achieve at least one month’s cash coverage in the medium term, and then gradually move
towards five months coverage. This measure will have to be carefully monitored going
forward.

59
2.6.5.4 Surplus/deficit excluding depreciation offsets
The main purpose of this measure is to understand if the revenue levels are sufficient to
conclude that the community is making a sufficient contribution for the municipal resources
consumed each year. An adjusted surplus/deficit is achieved by offsetting the amount of
depreciation related to externally funded assets. Municipalities need to assess the result of this
calculation taking into consideration its own circumstances and levels of backlogs. If the
outcome is a deficit, it may indicate that rates and service charges are insufficient to ensure
that the community is making a sufficient contribution toward the economic benefits they are
consuming over the medium term. For the 2015/16 MTREF the indicative outcome is a
surplus of R20.7 million and R8.3 million and R2.2 million for the two outer years. Which is
affected by non cash items It needs to be noted that a surplus does not necessarily mean that
the budget is funded from a cash flow perspective
2.6.5.5 Property Rates/service charge revenue as a percentage increase less macro inflation target
The purpose of this measure is to understand whether the municipality is contributing
appropriately to the achievement of national inflation targets. This measure is based on the increase in revenue, which will include both the change in the tariff as well as any assumption
about real growth such as new property development, services consumption growth etc.
The factor is calculated by deducting the maximum macro-economic inflation target increase
(which is currently 0.2 per cent). The result is intended to be an approximation of the real
increase in revenue. From the table above it can be seen that the percentage growth to -0.1 to -
0.4 percent for the two respective years
2.6.5.6 Cash receipts as a percentage of ratepayers and other revenue
This factor is a macro measure of the rate at which funds are collected. This measure is
intended to analyze the underlying assumed collection rate for the MTREF to determine the
relevance and credibility of the budget assumptions contained in the budget. It can be seen
that the outcome is at 99.3 percent , In addition the risks associated with objections to the
valuation roll need to be clarified and hence the conservative approach, also taking into
consideration the cash flow challenges experienced in the current financial year. This measure
and performance objective will have to be meticulously managed. Should performance with
the mid-year review and adjustments be positive in relation to actual collections of billed
revenue, the adjustments budget will be amended accordingly?
2.6.5.7 Debt impairment expense as a percentage of billable revenue
This factor measures whether the provision for debt impairment is being adequately funded
and is based on the underlying assumption that the provision for debt impairment (doubtful
and bad debts) has to be increased to offset under-collection of billed revenues. The provision
has been appropriated at 12.3, 12.3 and 12.3 per cent over the MTREF. Considering the debt
incentive scheme and the municipality’s revenue management strategy’s objective to collect
outstanding debtors of 90 days, the provision is not well within the accepted leading practice.
2.6.5.8 Capital payments percentage of capital expenditure
The purpose of this measure is to determine whether the timing of payments has been taken
into consideration when forecasting the cash position. It can be seen that a 2 per cent timing
discount has been factored into the cash position forecasted over the entire financial year. The
municipality aims to keep this as low as possible through strict compliance with the
legislative requirement that debtors be paid within 30 days.
2.6.5.9 Borrowing as a percentage of capital expenditure (excluding transfers, grants and
contributions)
The purpose of this measurement is to determine the proportion of a municipality’s „own-
funded capital expenditure budget that is being funded from borrowed funds to confirm
MFMA compliance. Externally funded expenditure (by transfers/grants and contributions) has
60
been be excluded. It can be seen that borrowing equates to 0 per cent of own funded capital.
The municipality does not borrow money from external stakeholders
2.6.5.10 Transfers/grants revenue as a percentage of Government transfers/grants available
The purpose of this measurement is mainly to ensure that all available transfers from national
and provincial government have been budgeted for. A percentage less than 100 per cent could
indicate that not all grants as contained in the Division of Revenue Act (DoRA) have been
budgeted for. The Municipality has budgeted for all transfers.
2.6.5.11 Consumer debtors change (Current and Non-current)
The purpose of these measures is to ascertain whether budgeted reductions in outstanding
debtors are realistic. There are 2 measures shown for this factor; the change in current debtors
and the change in long term receivables, both from the Budgeted Financial Position. Both
measures show a relatively stable trend in line with the Municipality’s policy of settling
debtor’s accounts within 30 day
2.6.5.12 Repairs and maintenance expenditure level
This measure must be considered important within the context of the funding measures
criteria because a trend that indicates insufficient funds are being committed to asset repair
could also indicate that the overall budget is not credible and/or sustainable in the medium to
long term because the revenue budget is not being protected. Details of the Municipality’s
strategy pertaining to asset management and repairs and maintenance are contained in MBRR
SA34C
2.6.5.13 Asset renewal/rehabilitation expenditure level
This measure has a similar objective to aforementioned objective relating to repairs and
maintenance. A requirement of the detailed capital budget (since MFMA Circular 28 which
was issued in December 2005) is to categorise each capital project as a new asset or a
renewal/rehabilitation project. The objective is to summarise and understand the proportion of
budgets being provided for new assets and also asset sustainability. A declining or low level
of renewal funding may indicate that a budget is not credible and/or sustainable and future
revenue is not being protected, similar to the justification for „repairs and maintenance
budgets.
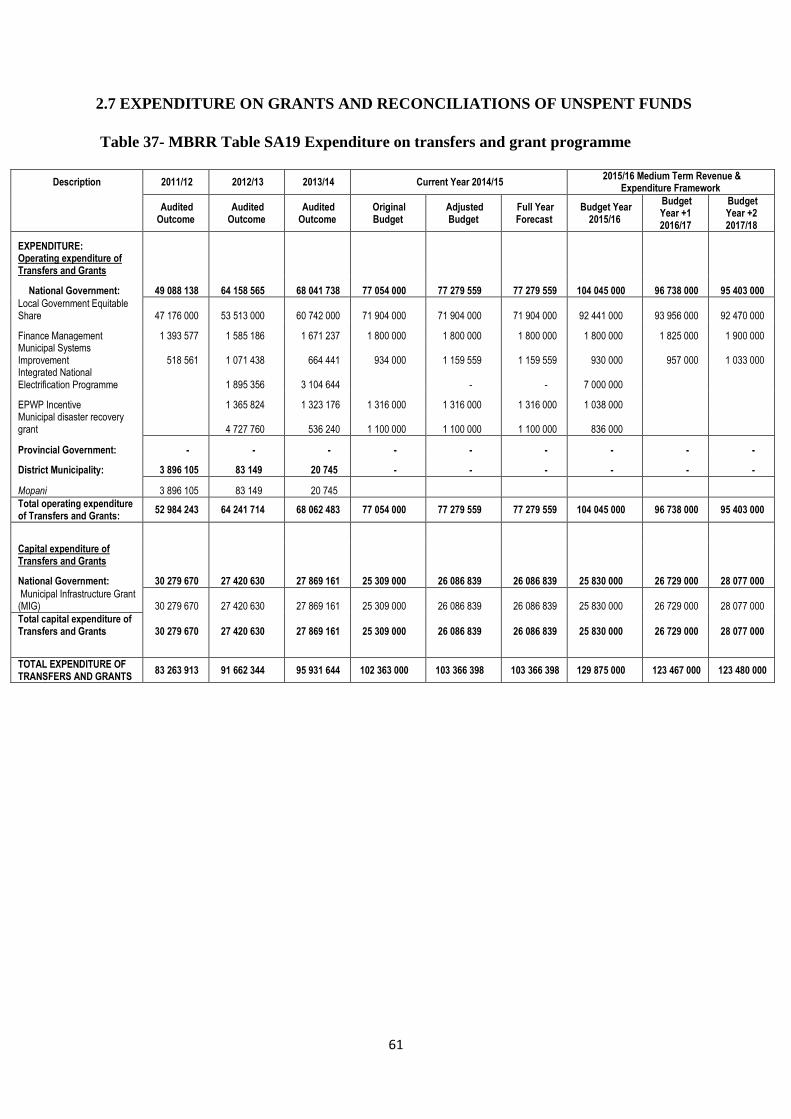
61
2.7 EXPENDITURE ON GRANTS AND RECONCILIATIONS OF UNSPENT FUNDS
Table 37- MBRR Table SA19 Expenditure on transfers and grant programme
Description 2011/12 2012/13 2013/14 Current Year 2014/15 2015/16 Medium Term Revenue &
Expenditure Framework
Audited Outcome
Audited Outcome
Audited Outcome
Original Budget
Adjusted Budget
Full Year Forecast
Budget Year 2015/16
Budget Year +1 2016/17
Budget Year +2 2017/18
EXPENDITURE: Operating expenditure of Transfers and Grants
National Government: 49 088 138 64 158 565 68 041 738 77 054 000 77 279 559 77 279 559 104 045 000 96 738 000 95 403 000
Local Government Equitable Share 47 176 000 53 513 000 60 742 000 71 904 000 71 904 000 71 904 000 92 441 000 93 956 000 92 470 000
Finance Management 1 393 577 1 585 186 1 671 237 1 800 000 1 800 000 1 800 000 1 800 000 1 825 000 1 900 000 Municipal Systems Improvement 518 561 1 071 438 664 441 934 000 1 159 559 1 159 559 930 000 957 000 1 033 000 Integrated National Electrification Programme 1 895 356 3 104 644 - - 7 000 000
EPWP Incentive 1 365 824 1 323 176 1 316 000 1 316 000 1 316 000 1 038 000 Municipal disaster recovery grant 4 727 760 536 240 1 100 000 1 100 000 1 100 000 836 000
Provincial Government: - - - - - - - - -
District Municipality: 3 896 105 83 149 20 745 - - - - - -
Mopani 3 896 105 83 149 20 745
Total operating expenditure of Transfers and Grants:
52 984 243 64 241 714 68 062 483 77 054 000 77 279 559 77 279 559 104 045 000 96 738 000 95 403 000
Capital expenditure of Transfers and Grants
National Government: 30 279 670 27 420 630 27 869 161 25 309 000 26 086 839 26 086 839 25 830 000 26 729 000 28 077 000
Municipal Infrastructure Grant (MIG) 30 279 670 27 420 630 27 869 161 25 309 000 26 086 839 26 086 839 25 830 000 26 729 000 28 077 000
Total capital expenditure of Transfers and Grants 30 279 670 27 420 630 27 869 161 25 309 000 26 086 839 26 086 839 25 830 000 26 729 000 28 077 000
TOTAL EXPENDITURE OF TRANSFERS AND GRANTS
83 263 913 91 662 344 95 931 644 102 363 000 103 366 398 103 366 398 129 875 000 123 467 000 123 480 000
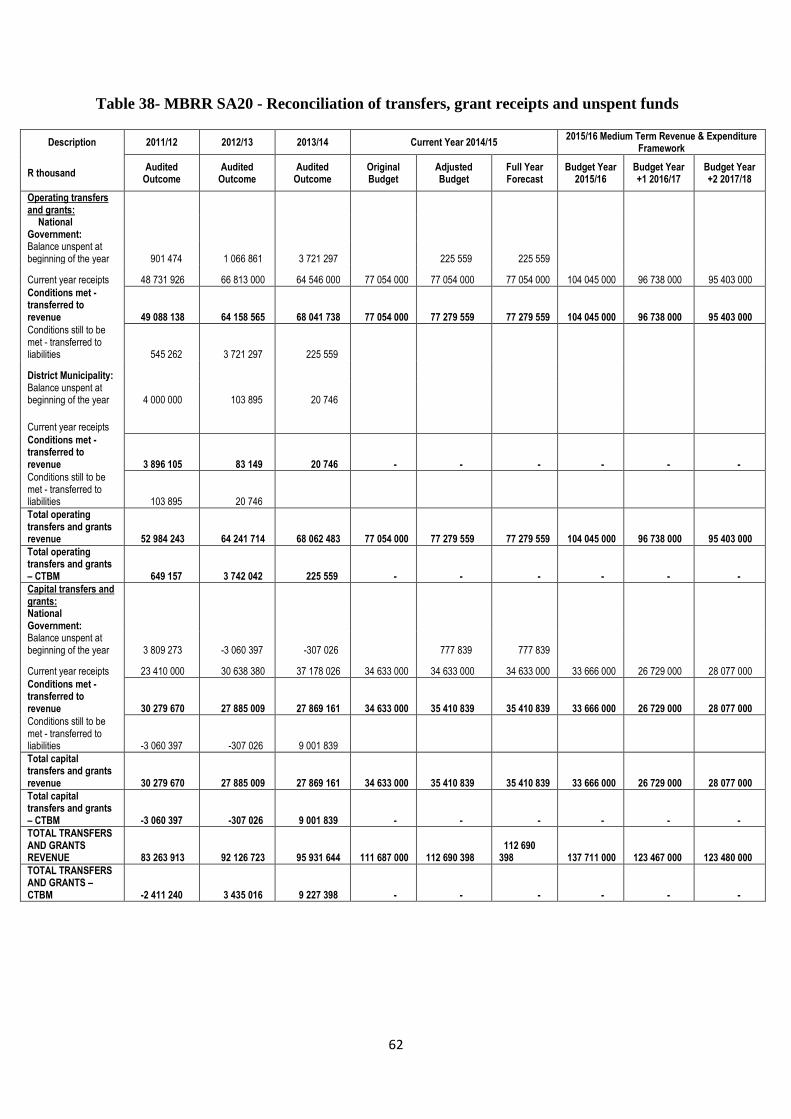
62
Table 38- MBRR SA20 - Reconciliation of transfers, grant receipts and unspent funds
Description 2011/12 2012/13 2013/14 Current Year 2014/15 2015/16 Medium Term Revenue & Expenditure
Framework
R thousand Audited
Outcome Audited
Outcome Audited
Outcome Original Budget
Adjusted Budget
Full Year Forecast
Budget Year 2015/16
Budget Year +1 2016/17
Budget Year +2 2017/18
Operating transfers and grants:
National Government:
Balance unspent at beginning of the year 901 474 1 066 861 3 721 297 225 559 225 559
Current year receipts 48 731 926 66 813 000 64 546 000 77 054 000 77 054 000 77 054 000 104 045 000 96 738 000 95 403 000
Conditions met - transferred to revenue 49 088 138 64 158 565 68 041 738 77 054 000 77 279 559 77 279 559 104 045 000 96 738 000 95 403 000
Conditions still to be met - transferred to liabilities 545 262 3 721 297 225 559
District Municipality:
Balance unspent at beginning of the year 4 000 000 103 895 20 746
Current year receipts
Conditions met - transferred to revenue 3 896 105 83 149 20 746 - - - - - -
Conditions still to be met - transferred to liabilities 103 895 20 746
Total operating transfers and grants revenue 52 984 243 64 241 714 68 062 483 77 054 000 77 279 559 77 279 559 104 045 000 96 738 000 95 403 000
Total operating transfers and grants – CTBM 649 157 3 742 042 225 559 - - - - - -
Capital transfers and grants:
National Government:
Balance unspent at beginning of the year 3 809 273 -3 060 397 -307 026 777 839 777 839
Current year receipts 23 410 000 30 638 380 37 178 026 34 633 000 34 633 000 34 633 000 33 666 000 26 729 000 28 077 000
Conditions met - transferred to revenue 30 279 670 27 885 009 27 869 161 34 633 000 35 410 839 35 410 839 33 666 000 26 729 000 28 077 000
Conditions still to be met - transferred to liabilities -3 060 397 -307 026 9 001 839
Total capital transfers and grants revenue 30 279 670 27 885 009 27 869 161 34 633 000 35 410 839 35 410 839 33 666 000 26 729 000 28 077 000
Total capital transfers and grants – CTBM -3 060 397 -307 026 9 001 839 - - - - - -
TOTAL TRANSFERS AND GRANTS REVENUE 83 263 913 92 126 723 95 931 644 111 687 000 112 690 398
112 690 398 137 711 000 123 467 000 123 480 000
TOTAL TRANSFERS AND GRANTS – CTBM -2 411 240 3 435 016 9 227 398 - - - - - -
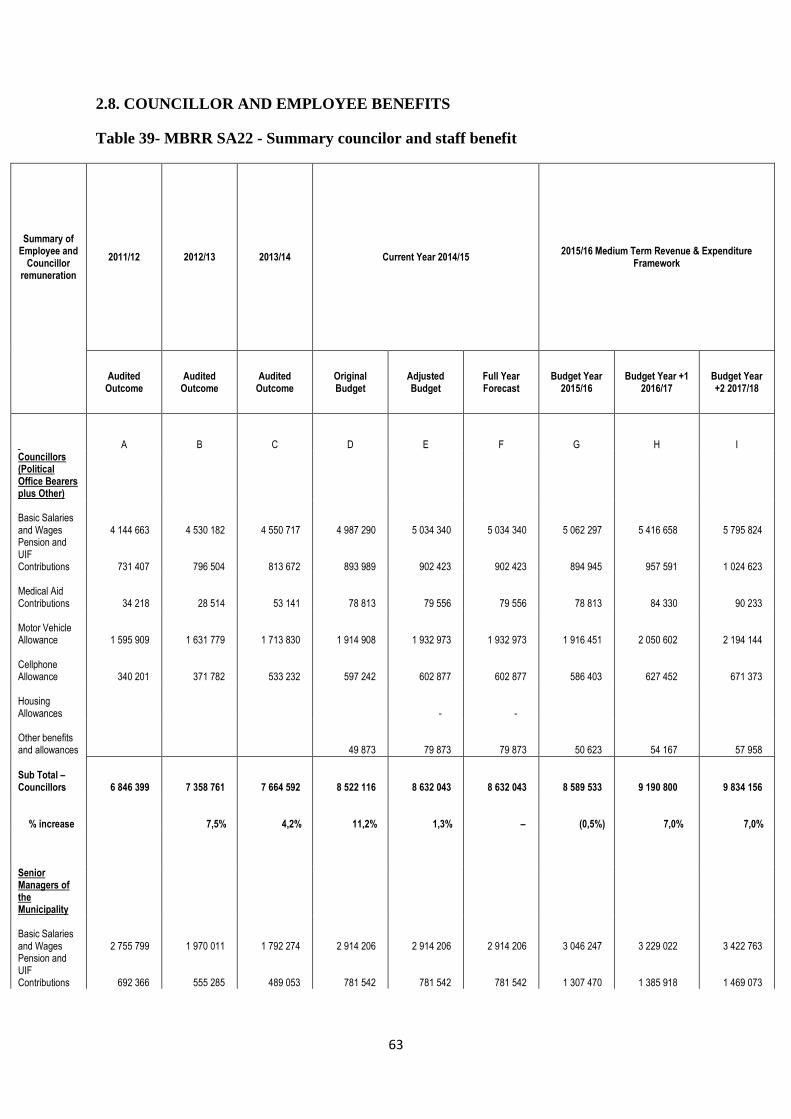
63
2.8. COUNCILLOR AND EMPLOYEE BENEFITS
Table 39- MBRR SA22 - Summary councilor and staff benefit
Summary of Employee and
Councillor remuneration
2011/12 2012/13 2013/14 Current Year 2014/15 2015/16 Medium Term Revenue & Expenditure
Framework
Audited
Outcome Audited
Outcome Audited
Outcome Original Budget
Adjusted Budget
Full Year Forecast
Budget Year 2015/16
Budget Year +1 2016/17
Budget Year +2 2017/18
A B C D E F G H I Councillors (Political Office Bearers plus Other)
Basic Salaries and Wages 4 144 663 4 530 182 4 550 717 4 987 290 5 034 340 5 034 340 5 062 297 5 416 658 5 795 824 Pension and UIF Contributions 731 407 796 504 813 672 893 989 902 423 902 423 894 945 957 591 1 024 623
Medical Aid Contributions 34 218 28 514 53 141 78 813 79 556 79 556 78 813 84 330 90 233
Motor Vehicle Allowance 1 595 909 1 631 779 1 713 830 1 914 908 1 932 973 1 932 973 1 916 451 2 050 602 2 194 144
Cellphone Allowance 340 201 371 782 533 232 597 242 602 877 602 877 586 403 627 452 671 373
Housing Allowances - -
Other benefits and allowances 49 873 79 873 79 873 50 623 54 167 57 958
Sub Total – Councillors 6 846 399 7 358 761 7 664 592 8 522 116 8 632 043 8 632 043 8 589 533 9 190 800 9 834 156
% increase 7,5% 4,2% 11,2% 1,3% – (0,5%) 7,0% 7,0%
Senior Managers of the Municipality
Basic Salaries and Wages 2 755 799 1 970 011 1 792 274 2 914 206 2 914 206 2 914 206 3 046 247 3 229 022 3 422 763 Pension and UIF Contributions 692 366 555 285 489 053 781 542 781 542 781 542 1 307 470 1 385 918 1 469 073
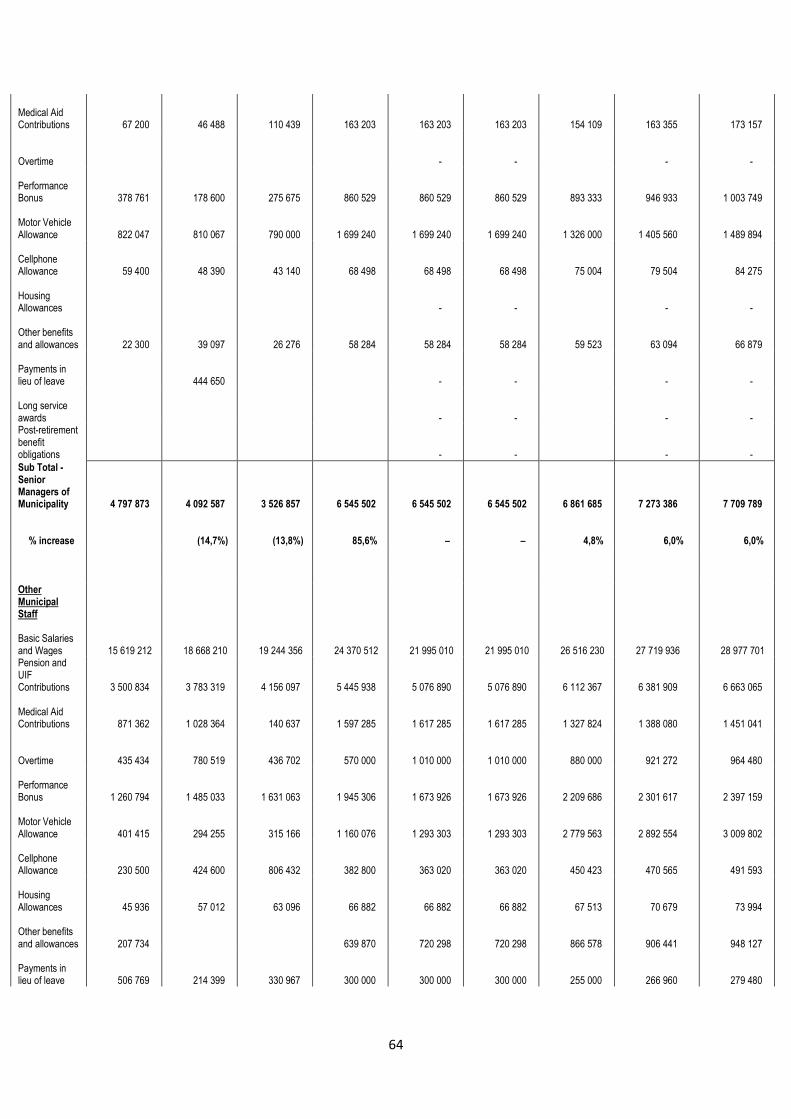
64
Medical Aid Contributions 67 200 46 488 110 439 163 203 163 203 163 203 154 109 163 355 173 157
Overtime - -
- -
Performance Bonus 378 761 178 600 275 675 860 529 860 529 860 529 893 333 946 933 1 003 749
Motor Vehicle Allowance 822 047 810 067 790 000 1 699 240 1 699 240 1 699 240 1 326 000 1 405 560 1 489 894
Cellphone Allowance 59 400 48 390 43 140 68 498 68 498 68 498 75 004 79 504 84 275
Housing Allowances - -
- -
Other benefits and allowances 22 300 39 097 26 276 58 284 58 284 58 284 59 523 63 094 66 879
Payments in lieu of leave 444 650 - -
- -
Long service awards - -
- -
Post-retirement benefit obligations - -
- -
Sub Total - Senior Managers of Municipality 4 797 873 4 092 587 3 526 857 6 545 502 6 545 502 6 545 502 6 861 685 7 273 386 7 709 789
% increase (14,7%) (13,8%) 85,6% – – 4,8% 6,0% 6,0%
Other Municipal Staff
Basic Salaries and Wages 15 619 212 18 668 210 19 244 356 24 370 512 21 995 010 21 995 010 26 516 230 27 719 936 28 977 701 Pension and UIF Contributions 3 500 834 3 783 319 4 156 097 5 445 938 5 076 890 5 076 890 6 112 367 6 381 909 6 663 065
Medical Aid Contributions 871 362 1 028 364 140 637 1 597 285 1 617 285 1 617 285 1 327 824 1 388 080 1 451 041
Overtime 435 434 780 519 436 702 570 000 1 010 000 1 010 000 880 000 921 272 964 480
Performance Bonus 1 260 794 1 485 033 1 631 063 1 945 306 1 673 926 1 673 926 2 209 686 2 301 617 2 397 159
Motor Vehicle Allowance 401 415 294 255 315 166 1 160 076 1 293 303 1 293 303 2 779 563 2 892 554 3 009 802
Cellphone Allowance 230 500 424 600 806 432 382 800 363 020 363 020 450 423 470 565 491 593
Housing Allowances 45 936 57 012 63 096 66 882 66 882 66 882 67 513 70 679 73 994
Other benefits and allowances 207 734 639 870 720 298 720 298 866 578 906 441 948 127
Payments in lieu of leave 506 769 214 399 330 967 300 000 300 000 300 000 255 000 266 960 279 480

65
Long service awards 138 730 957 307 53 344 21 080 27 890 27 890 99 151 103 801 108 669 Post-retirement benefit obligations 1 757 903 - -
Sub Total - Other Municipal Staff 23 218 721 29 450 921 27 177 860 36 499 749 34 144 504 34 144 504 41 564 335 43 423 814 45 365 110
% increase 26,8% (7,7%) 34,3% (6,5%) – 21,7% 4,5% 4,5%
Total Parent Municipality 34 862 994 40 902 269 38 369 308 51 567 367 49 322 048 49 322 048 57 015 553 59 888 000 62 909 055
17,3% (6,2%) 34,4% (4,4%) – 15,6% 5,0% 5,0%
TOTAL SALARY, ALLOWANCES & BENEFITS
34 862 994 40 902 269 38 369 308 51 567 367 49 322 048 49 322 048 57 015 553 59 888 000 62 909 055
% increase 17,3% (6,2%) 34,4% (4,4%) – 15,6% 5,0% 5,0%
TOTAL MANAGERS AND STAFF 28 016 594 33 543 508 30 704 717 43 045 251 40 690 006 40 690 006 48 426 020 50 697 200 53 074 899

66
Table 40 MBRR SA23 - Salaries, allowances & benefits (political office
bearers/councilors/senior managers)
Disclosure of Salaries, Allowances & Benefits 1.
Salary
Contributions
Allowances Performance Bonuses
In-kind benefits
Total Package
Rand per annum 1. 2.
Councillors
Speaker 537 229 31 319 81 107
649 654
Chief Whip 498 427 30 931 81 107
610 464
Executive Mayor 441 231 146 903 215 769
803 903
Deputy Executive Mayor
-
Executive Committee 1 233 365 90 174 243 320
1 566 859
Total for all other councillors 2 352 046 725 054 1 881 552
4 958 653
Total Councillors 5 062 297 1 024 381 2 502 854 8 589 533
Senior Managers of the Municipality
Municipal Manager (MM) 657 022 330 363 299 584 174 846
1 461 815
Chief Finance Officer 498 466 170 211 82 284 102 391
853 352
Director coimmunity service 426 187 302 976 268 284 136 558
1 134 004
Director Technical services 606 763 269 543 130 284 137 825
1 144 414
Director SPED 396 988 290 175 310 284 136 558
1 134 004
Director corporate services 460 822 226 432 310 284 136 558
1 134 095
Total Senior Managers of the Municipality 3 046 247 1 589 699 1 401 004 824 735 6 861 685
TOTAL COST OF COUNCILLOR, DIRECTOR and EXECUTIVE REMUNERATION
8 108 544 2 614 080 3 903 858 824 735 15 451 218
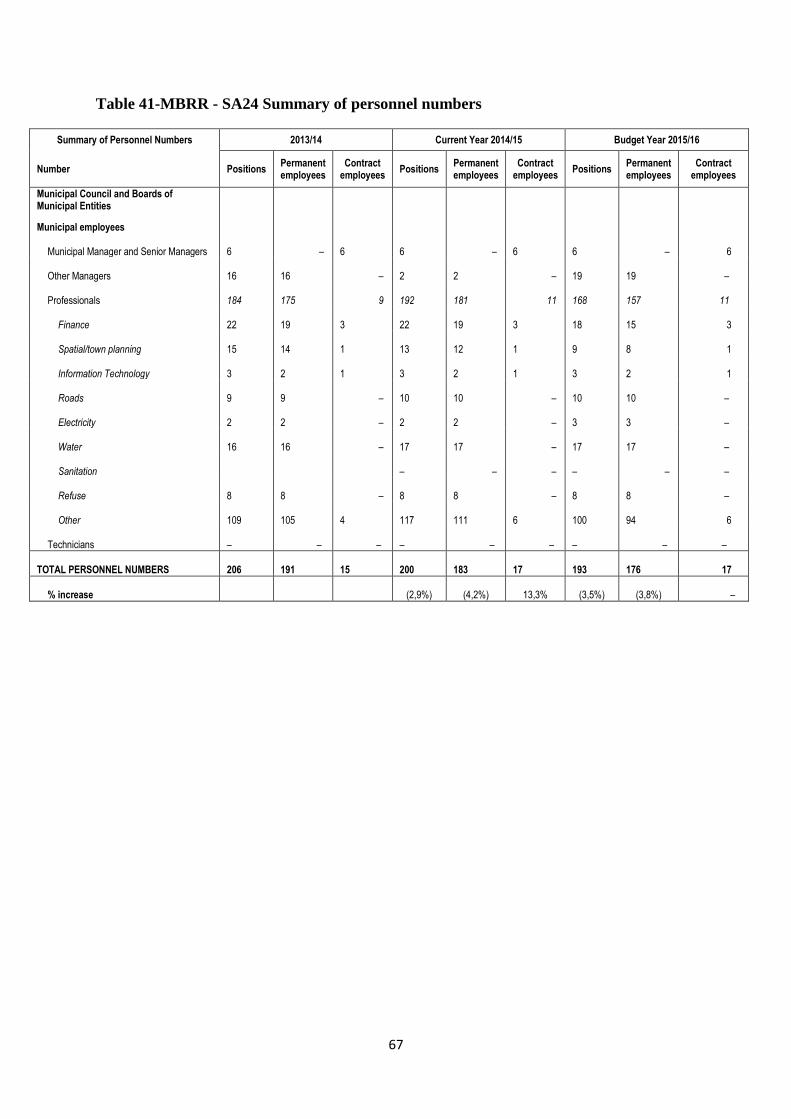
67
Table 41-MBRR - SA24 Summary of personnel numbers
Summary of Personnel Numbers 2013/14 Current Year 2014/15 Budget Year 2015/16
Number Positions Permanent employees
Contract employees
Positions Permanent employees
Contract employees
Positions Permanent employees
Contract employees
Municipal Council and Boards of Municipal Entities
Municipal employees
Municipal Manager and Senior Managers 6 –
6
6 –
6
6 – 6
Other Managers 16
16 –
2
2 –
19
19 –
Professionals 184
175 9
192
181 11
168
157 11
Finance 22
19
3
22
19
3
18
15 3
Spatial/town planning 15
14
1
13
12
1
9
8 1
Information Technology 3
2
1
3
2
1
3
2 1
Roads 9
9 –
10
10 –
10
10 –
Electricity 2
2 –
2
2 –
3
3 –
Water 16
16 –
17
17 –
17
17 –
Sanitation – – –
– – –
Refuse 8
8 –
8
8 –
8
8 –
Other 109
105
4
117
111
6
100
94 6
Technicians – – –
– – –
– – –
TOTAL PERSONNEL NUMBERS 206
191
15
200
183
17
193
176 17
% increase
(2,9%)
(4,2%)
13,3%
(3,5%)
(3,8%) –
68
2.9 MONTHLY TARGETS FOR REVENUE, EXPENDITURE AND CASH FLOW
See attached copy of the Draft Annual Budget for the following tables
TABLE 42:MBRR SA25 - Budgeted monthly revenue and expenditure – see attached copy of
the Annual Budget
TABLE 43: MBRR SA26 - Budgeted monthly revenue and expenditure (municipal vote)
TABLE 44: MBRR SA27 - Budgeted monthly revenue and expenditure (standard
classification)
TABLE 45:MBRR SA28 - Budgeted monthly capital expenditure (municipal vote)
TABLE 46: MBRR SA29 - Budgeted monthly capital expenditure (standard classification)
TABLE 47: MBRR SA30 - Budgeted monthly cash flow
2.10 ANNUAL BUDGETS AND SDBIPS – INTERNAL DEPARTMENTS
2.10.1 Water Services Department
Maruleng Municipality is not a water service authority
2.11 CONTRACTS HAVING FUTURE BUDGETARY IMPLICATIONS In terms of the Municipality’s Supply Chain Management Policy, no contracts are awarded beyond
the medium-term revenue and expenditure framework (three years). In ensuring adherence to this
contractual time frame limitation, all reports submitted to either the Bid Evaluation and Adjudication
Committees must obtain formal financial comments from the Financial Management Division of the
Treasury Department.
2.12 CAPITAL EXPENDITURE DETAILS
See attached copy of the Annual Budget for the following tables
TABLE 48:MBRR SA 34a – Capital expenditure on new assets by assets class
TABLE 49:MBRR SA 34b – Capital Expenditure on the renewal of existing
assets by assets class
TABLE 50:MBRR SA 34c – Repairs and maintenance expenditure by assets
class
TABLE 51: MBRR SA34d- Depreciation by assets classification
TABLE 52:MBRR SA 35 – Future financial implications of the capital budget
TABLE 53 :MBRR SA 36 – Detailed capital budget per municipal vote
TABLE 54: MBRR SA 37– Projects delayed from previous financial year
69
2.13 LEGISLATION COMPLIANCE STATUS
Compliance with the MFMA implementation requirements have been substantially adhered to through
the following activities:
1. in year reporting
Reporting to National Treasury in electronic format was fully complied with on a monthly
basis. Section 71 reporting to the Executive Mayor (within 10 working days) has
progressively improved and includes monthly published financial performance on the
Municipality’s website.
2. Internship programme
The Municipality is participating in the Municipal Financial Management Internship
programme and has employed 5 interns undergoing training in various divisions of the
Financial Services Department.
3. Budget and Treasury Office
The Budget and Treasury Office has been established in accordance with the MFMA.
4. Audit Committee
A district shared Audit Committee has been established and is fully functional.
5. Service Delivery and Implementation Plan
The detail SDBIP document is at a draft stage and will be finalized after approval of the
2015/16 MTREF in May 2015 directly aligned and informed by the 2015/16 MTREF.
6. Annual Report
Annual report is compiled in terms of the MFMA and National Treasury requirements.
7. MFMA Training
The MFMA training module in electronic format is presented at the Municipality’s internal
centre and training is ongoing.
8. Policies
An amendment of the Municipal Property Rates Regulations as published in Government
Notice 363 of 27 March 2009 was announced in Government Gazette 33016 on 12 March
2010. The ratios as prescribed in the Regulations have been complied with.
2.14 OTHER SUPPORTING DOCUMENTS
See attached copy of the Annual Budget for the following supporting tables
TABLE 55: MBRR SA 1 – Supporting detail to budgeted financial
performance
TABLE 56: MBRR SA 2 – Matrix financial Performance budget ( revenue
source/expenditure type and department)
TABLE 57: MBRR SA 3 – Supporting detail to statement of financial position
70
TABLE 58: MBRR SA 9 – Social, economic and demographic statistics and
assumptions
TABLE 59: MBRR SA 32 – List of external mechanisms
71
2.15 MUNICIPAL MANAGER’S QUALITY CERTIFICATE I, Refilwe Jonas Ramothwala, municipal manager of Maruleng Municipality, hereby certify that the draft annual budget and supporting documentation have been prepared in accordance with the Municipal Finance Management Act and the regulations made under the Act, and that the annual budget and supporting documents are consistent with the Integrated Development Plan of the municipality. RJ Ramothwala Municipal Manager: Maruleng Municipality Signature _______________________________ Date _______________________________

72