Draft - 3a2vzv37nkuw3esf6a3u2t7s-wpengine.netdna-ssl.com
16
Draft Measurement of Water Droplets in Water-in-Oil Emulsions Using Low Field Nuclear Magnetic Resonance for Gas Hydrate Slurry Application Journal: Canadian Journal of Chemistry Manuscript ID: cjc-2014-0608 Manuscript Type: Article Date Submitted by the Author: 30-Dec-2014 Complete List of Authors: Majid, Ahmad; Colorado School of Mines, Chemical & Biological Engineering Saidian, Milad; Colorado School of Mines, Petroleum Engineering Prasad, Manika; Colorado School of Mines, Petroleum Engineering Koh, Carolyn; Colorado School of Mines, Chemical & Biological Engineering Keyword: NMR, Emulsion, Gas Hydrate https://mc06.manuscriptcentral.com/cjc-pubs Canadian Journal of Chemistry
Transcript of Draft - 3a2vzv37nkuw3esf6a3u2t7s-wpengine.netdna-ssl.com

Draft
Measurement of Water Droplets in Water-in-Oil Emulsions
Using Low Field Nuclear Magnetic Resonance for Gas Hydrate Slurry Application
Journal: Canadian Journal of Chemistry
Manuscript ID: cjc-2014-0608
Manuscript Type: Article
Date Submitted by the Author: 30-Dec-2014
Complete List of Authors: Majid, Ahmad; Colorado School of Mines, Chemical & Biological Engineering
Saidian, Milad; Colorado School of Mines, Petroleum Engineering Prasad, Manika; Colorado School of Mines, Petroleum Engineering Koh, Carolyn; Colorado School of Mines, Chemical & Biological Engineering
Keyword: NMR, Emulsion, Gas Hydrate
https://mc06.manuscriptcentral.com/cjc-pubs
Canadian Journal of Chemistry

Draft
Measurement of Water Droplets in Water-in-Oil
Emulsions Using Low Field Nuclear Magnetic
Resonance for Gas Hydrate Slurry Application
Ahmad AA Majid1, Milad Saidian2, Manika Prasad2, Carolyn A. Koh1*
1. Center for Hydrate Research, Department of Chemical and Biological
Engineering, Colorado School of Mines, 80401 USA
2. Department of Petroleum Engineering, Colorado School of Mines,
80401 USA
Abstract
Turbulent flow in oil and gas pipelines often results in the formation of a water-in-oil
(W/O) emulsion. Small water droplets in the pipeline provide large total surface area for
hydrate formation at the water/gas saturated oil interface, which can lead to full conversion
of water to gas hydrate. As a result, this may prevent the formation of large hydrate
aggregates that can cause hydrate particle settling and eventually plugging. It is thus of
particular interest to determine the water droplet size of an emulsion. Since the water
droplet size of the emulsion provides information about the hydrate particle size in the
slurry, it is crucial to determine the water droplet size in a W/O emulsion. In this work, the
water droplet size of model W/O emulsion systems was measured using two techniques:
Diffusion-Transverse Relaxation (T2) experiments using low field Nuclear Magnetic
Resonance (NMR) and optical microscopy image analysis techniques. The T2 distribution
of the emulsion was also measured. The water volume fraction was varied from 10 – 70
vol.%. The NMR and microscopy image analysis results show the droplet size ranging
from 3.5 to 4.5 µm and 2 to 3 µm, respectively. Both techniques show a minimum at 2 and
4 µm at 50 vol.% water cut. There are two main reasons for the small difference in droplet
size distribution (DSD) measured using these techniques: NMR provides DSD of the entire
emulsion sample as opposed to an optical microscopy technique that only capture a small
Page 1 of 15
https://mc06.manuscriptcentral.com/cjc-pubs
Canadian Journal of Chemistry
Draft
sample of the emulsion. In addition, since the NMR method does not require sample
preparation, the characteristics and properties of the emulsion are maintained. On the
contrary, using microscopy images, the sample is compressed between two glass slides.
This will disturb the properties of the emulsion. By combining the diffusion-T2 and T2
distributions, the surface relaxivity was determined to be 1.22 µm/s for the W/O emulsion.
The DSD obtained from the NMR method in this work was compared with microscopy
analysis, and results show there is reasonable agreement between the two methods. This
paper provides a comparison of the two methods that can be used to determine the water
droplet size of W/O emulsions. This study indicates that a relatively simple quantitative
NMR method can be utilized to determine the water droplet size of W/O emulsions before
gas hydrate formation, and hence can be used to assess the gas hydrate slurry properties
and plugging risk of W/O systems.
Introduction
Gas hydrates (also known as clathrate hydrates) are crystalline compounds in which
small gas molecules such as methane, ethane, propane and cyclopentane are enclathrated
by hydrogen-bonded water molecules (1). The water molecules form a network of
hydrogen bonds around the gas molecules thereby forming water cages. Gas hydrates
typically form at high pressure and low temperature (e.g. 10 MPa, 277 K for methane
hydrates) (1). At these conditions, hydrates can form and plug subsea oil/gas pipelines and
are considered a nuisance.
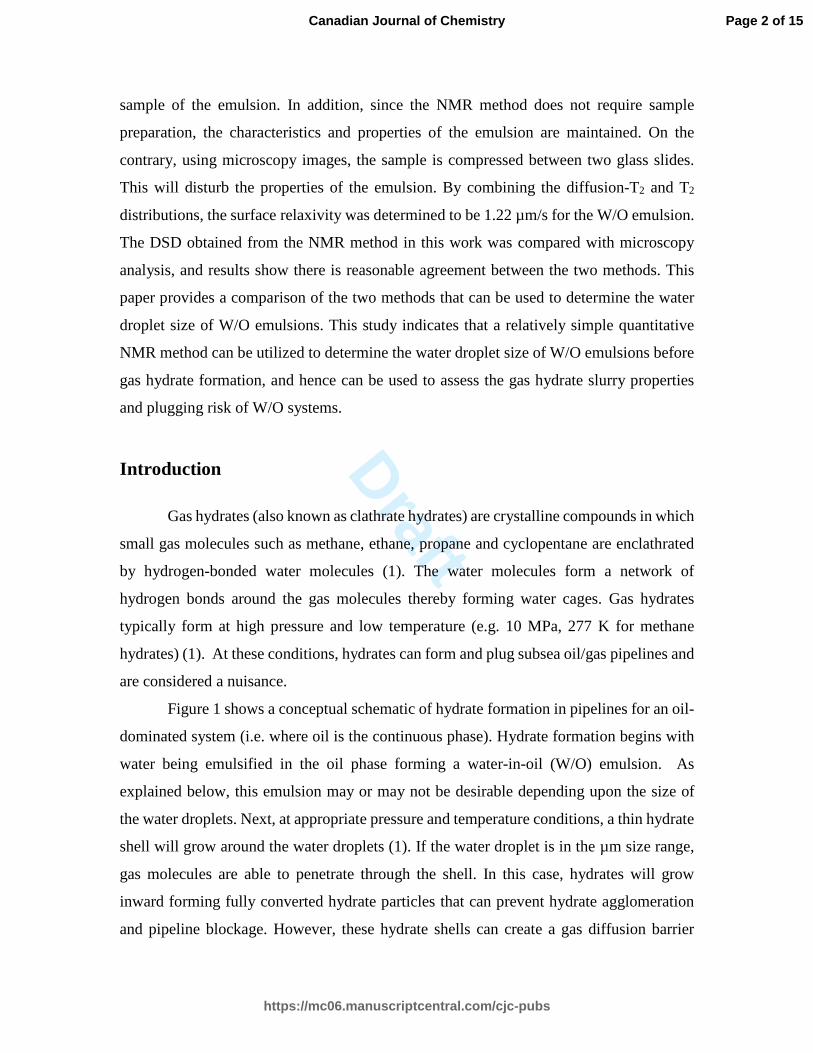
Figure 1 shows a conceptual schematic of hydrate formation in pipelines for an oil-
dominated system (i.e. where oil is the continuous phase). Hydrate formation begins with
water being emulsified in the oil phase forming a water-in-oil (W/O) emulsion. As
explained below, this emulsion may or may not be desirable depending upon the size of
the water droplets. Next, at appropriate pressure and temperature conditions, a thin hydrate
shell will grow around the water droplets (1). If the water droplet is in the µm size range,
gas molecules are able to penetrate through the shell. In this case, hydrates will grow
inward forming fully converted hydrate particles that can prevent hydrate agglomeration
and pipeline blockage. However, these hydrate shells can create a gas diffusion barrier
Page 2 of 15
https://mc06.manuscriptcentral.com/cjc-pubs
Canadian Journal of Chemistry
Draft
between the oil and the water phase if water droplets are larger than the µm size range (1).
Then there will be capillary attraction forces between hydrate particles due to water
bridging (from unconverted free water) that cause the particles to agglomerate forming
large hydrate aggregates (1). Since these aggregates may then form a blockage in the
pipeline, it is crucial to determine the water droplet size in an emulsion since this will
influence the resultant the hydrate particle size in a slurry.
Figure 1: Conceptual schematic of hydrate plug formation in an oil dominated pipeline system (cf. (2) and
J. Abrahamson, (3)).
There are several methods being employed by researchers and operators to
determine droplet size of the emulsion such as microscopy (4), and Nuclear magnetic
resonance (NMR) (5). Each method has its own advantages and disadvantages. For
instance, the microscopy imaging method is relatively simple and fast. The size of the
droplet is measured by analyzing optical microscopy images of the emulsion. However, in
this method, only a small sample of the emulsion is analyzed (e.g. ~250 water droplets)
and thus the method may not reflect the actual condition in pipelines. Another method to
determine the DSD of emulsions is using Nuclear Magnetic Resonance (NMR). This
method has gained interest since it is non-destructive and can measure a considerable
amount of sample. However, the application of NMR to assess the DSD of emulsions and
subsequent hydrate slurry properties is severely underexplored.
In this paper, the DSD of the system is determined by studying the diffusion of the
system using low field NMR measurements, specifically by taking advantage of the
differences in relaxation times for oil and water. In this work, we present a method for the
conversion of the T2 distribution signal to droplet size distribution.
Page 3 of 15
https://mc06.manuscriptcentral.com/cjc-pubs
Canadian Journal of Chemistry

Draft
Materials and Methods
Emulsion Preparation
The model water-in-oil emulsion consists of a mineral oil, a mixture of surfactants
and deionized water. The mineral oil in this work was Crystal Plus mineral oil 70T
purchased from STE Oil Company Inc. The oil is a Newtonian fluid with a viscosity of 20
cP at 25 °C and density of 0.857 g/cm3 at 20 °C. The chemical composition of the mineral
oil is given in Table S1.
The surfactant mixture consists of a nonionic surfactant, Sorbitan Monooleate
(known as Span 80) and an ionic surfactant, Sodium Di-2-Ethylhexylsulfosuccinate
(known as AOT). The molecular structures of the surfactants are shown in Figure 2. The
concentration of surfactant in the model W/O emulsions is 5 wt.% with respect to the total
mass of the emulsion. Furthermore, the ratio concentration of the surfactants used in this
work is 90 wt.% of Span 80 and 10 wt.% of the AOT. Span 80 was purchased from Sigma
Aldrich. It has a reported molecular weight of 428.61 g/mol and Hydrophilic Lipophilic
Balance (HLB) value of 4.3 (6). AOT surfactant was purchased from Fischer Scientific and
has a reported molecular weight of 444.56 g/mol. The water volume fraction (also known
as water cut) for this model emulsion system ranges from 10 to 70 vol.%.
Figure 2: Molecular structure of the surfactants used in this work, (a) Span 80 and (b) AOT.
In this work, 30 ml of emulsion sample was prepared by first, dissolving the pre-
weighed surfactant mixture in the mineral oil at low heat (~50°C) and medium stirring.
This was done using a hotplate and a magnetic stirrer. Next, the sample was cooled to room
temperature. Once cooled, the sample was stirred at 8000 rpm using a high-speed
homogenizer (Virtis Sentry Cyclone IQ2 Homogenizer), while water was added slowly
Page 4 of 15
https://mc06.manuscriptcentral.com/cjc-pubs
Canadian Journal of Chemistry

Draft
using a syringe. (7). The total stirring time depends on water cut of the emulsion. For
emulsions with water cuts ≤ 50 vol. %, the system was stirred for 3 minutes where water
was added during the first minute. As for 60 and 70 vol.% water cut emulsions, the system
was stirred for 6 minutes and water was added during the first 4 minutes. A longer stirring
time was required for the high water cut system to allow water to be added slowly into the
system. This method ensures that W/O emulsion will be produced.
Microscopy Droplet Size Measurement
The water droplet size of the emulsion was measured using an optical microscope
(Olympus IX71) connected to a digital camera (Olympus XM10). The microscope images
were analyzed using ImageJ. At each water cut investigated, a minimum of 250 water
droplets were measured and the mean droplet size was calculated and reported in this work.
NMR Droplet Size Measurements
The NMR measurements were performed using a 2 MHz Magritek Rock Core
Analyzer. All measurements are at room temperature and pressure. Two main pulse
sequences are used to measure the NMR response for the emulsion samples. In this section,
the pulse sequences and the analysis techniques are discussed.
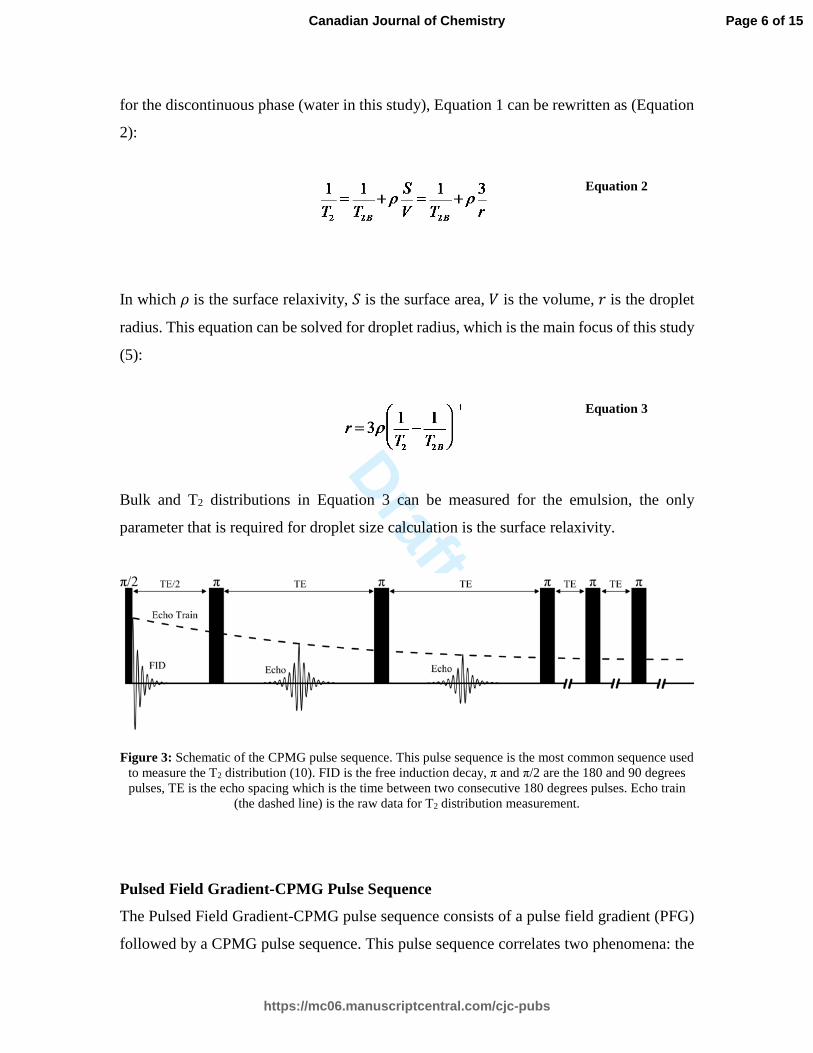
Carr-Purcell-Meiboom-Gill (CPMG) Pulse Sequence
The CPMG pulse sequence (Figure 3) was introduced by Carr and Purcell (1954) and then
modified by Meiboom and Gill (1958) to measure the transverse relaxation time (T2) of
hydrogen nuclei in fluid samples. The T2 relaxation mechanism is a combination of three
relaxation mechanisms (Equation 1): bulk relaxation (T2B), surface relaxation (T2S), and
diffusion induced relaxation (T2B) (8).
Equation 1
By minimizing the echo spacing (TE in Figure 3) the diffusion induced relaxation becomes
negligible compared to bulk and surface relaxations (9). Surface relaxation is a function of
surface relaxivity and the ratio of surface area to the volume. Assuming spherical bubbles
Page 5 of 15
https://mc06.manuscriptcentral.com/cjc-pubs
Canadian Journal of Chemistry
Draft
for the discontinuous phase (water in this study), Equation 1 can be rewritten as (Equation
2):
Equation 2
In which 𝜌𝜌 is the surface relaxivity, 𝑆𝑆 is the surface area, 𝑉𝑉 is the volume, 𝑟𝑟 is the droplet
radius. This equation can be solved for droplet radius, which is the main focus of this study
(5):
Equation 3
Bulk and T2 distributions in Equation 3 can be measured for the emulsion, the only
parameter that is required for droplet size calculation is the surface relaxivity.
Figure 3: Schematic of the CPMG pulse sequence. This pulse sequence is the most common sequence used
to measure the T2 distribution (10). FID is the free induction decay, π and π/2 are the 180 and 90 degrees pulses, TE is the echo spacing which is the time between two consecutive 180 degrees pulses. Echo train
(the dashed line) is the raw data for T2 distribution measurement.
Pulsed Field Gradient-CPMG Pulse Sequence
The Pulsed Field Gradient-CPMG pulse sequence consists of a pulse field gradient (PFG)
followed by a CPMG pulse sequence. This pulse sequence correlates two phenomena: the
Page 6 of 15
https://mc06.manuscriptcentral.com/cjc-pubs
Canadian Journal of Chemistry

Draft
translational diffusion coefficient of water molecules restricted by droplet walls (replicated
in the diffusion measurement) and the chemical properties of water and oil (replicated in
the T2 measurement). A two dimensional distribution function accounts for these
phenomena and an inverse Laplace transform is used to produce the D-T2 maps. More
information about D-T2 data acquisition and mathematical inversion can be found in (11–
13)
Figure 4: Schematic of the PFG-CPMG pulse sequence. This pulse sequence consists of a pulsed field
gradient pulse sequence followed by a CPMG pulse sequence. It is used to measure the D-T2 maps. π and π/2 are the 180 and 90 degrees pulses, ∆ is the diffusion time which is the time between gradient pulses, 𝜹𝜹
is the gradient pulse duration, TE is the echo spacing which is the time between two consecutive 180 degrees pulses.
In some cases (14–17), the PFG pulse sequence has been solely used to measure the
diffusion coefficient of the discontinuous phase. Since the PFG pulse sequence measures a
combination of oil and water diffusion coefficients, only water diffusion data have been
extracted using two approaches: The first approach is to extract the discontinuous phase
diffusion coefficient which requires the fraction and the NMR properties of the continuous
phase (14–17). The second approach is to use very long diffusion times to allow the
continuous phase NMR signal to decay during this time period (15,16,18,19). This
approach compromises the signal to noise ratio since a major portion of the signal decays
before the data acquisition. This approach only works if the continuous phase relaxation is
faster than the discontinuous phase.
In this study we used 2D D-T2 maps, even though the experiment time is longer
than PFG experiments. Using 2D maps we can differentiate the water and oil diffusion
Page 7 of 15
https://mc06.manuscriptcentral.com/cjc-pubs
Canadian Journal of Chemistry

Draft
responses based on their respective T2 distributions. Figure 5 shows an example of the 2D
map specifically the 20% water cut emulsion.
Figure 5: (a) 2D D-T2 map for 20 vol.% water cut emulsion and (b) corresponding Diffusion coefficient
and T2 distribution extracted from 2D map. In (a) Both water and oil responses are shown distinctively, but separate D and T2 responses were not able to resolve the differences.
The diffusion values are converted to radius using the following approach. The water
molecules are restricted by the droplet walls; as a result the measured diffusion is lower
than the bulk water diffusion. This reduction in diffusion coefficient value depends on the
droplet size and the PFG acquisition parameters. Murday and Cotts (1968) developed a
model to relate the echo-signal attenuation to the diffusion coefficient of the fluid in a
sphere with specific radius considering the experimental acquisition parameters (20). We
use this model to calculate the droplet radius using measured diffusion coefficients.
Results and Discussions
Microscopy Droplet Size Measurements
Figure 6 shows the microscopy images of the water-in-oil emulsions prepared using
mineral oil 70T at 10 and 50 vol.% of water cut. Analysis of the microscopy images shows
that the numerical average droplet size of this emulsion system is in the range of 2 – 3 μm
across all water cut emulsions investigated in this work (Figure 7). This average droplet
size is in agreement with a typical water-in-crude oil emulsion system reported by us and
other researchers (21).
Page 8 of 15
https://mc06.manuscriptcentral.com/cjc-pubs
Canadian Journal of Chemistry

Draft
Figure 6: Microscopy images of mineral oil 70T emulsion system at (a) 10 vol.% and (b) 50 vol.% water
cut.
Figure 7: Microscopy droplet size measurement for mineral oil 70T emulsions at various water cuts
(vol.%).
The water droplets size microscopy measurement shows that there is minimal
change in the size of the water droplets across the water cuts investigated in this work. It
is likely that the water droplet size does not change due to the high concentration of
surfactant used in this work. Our study shows that the critical concentration of aggregation
(CCA), which is, the concentration at which inverse micelles form was measured to be 0.1
wt.% for all water cuts (4). Thus, the emulsions used in this work were prepared at
concentrations above the CCA.
Page 9 of 15
https://mc06.manuscriptcentral.com/cjc-pubs
Canadian Journal of Chemistry

Draft
NMR Droplet Size Measurements
Figure 8: T2 distribution for (a) bulk oil and water and (b) emulsions at various water cuts
Figure 8 shows the T2 distribution for bulk oil and water, as well as all the
emulsions measured using the CPMG pulse sequence (Figure 3). Bulk responses show a
clear distinction between oil and water T2 distributions (Figure 8(a)). When water is
emulsified in the oil phase, the T2 response for the discontinuous phase (water droplet) is
affected by the emulsion properties. Figure 8(b) shows the T2 response for emulsion
samples. The T2 relaxation times for oil do not change by varying the water cut because oil
is the continuous phase. The T2 response for water varies depending on the water cut. The
surface relaxivity for the emulsions can be calculated by solving Equation 3 for ρ. We used
the T2 distribution of the water phase for samples with water cuts of 50-70 vol% since they
show a distinct peak for the water phase. The average surface relaxivity is 1.22 µm/s. Using
this surface relaxivity the droplet size derived from T2 distributions varies from 3.3 to 4.7
µm, which is close to the range of the droplet size measured by the diffusion method. The
difference is because for low water cut samples (10 to 30 vol%) the water T2 distribution
is not distinct from the oil distribution.
Figure 9 shows the numerical average water droplet size across all water cut
emulsions studied in this work determined from NMR investigations. As can be seen in
Figure 9, the average droplet size is ~ 4 μm. Similarly to the microscopy analysis, the size
Page 10 of 15
https://mc06.manuscriptcentral.com/cjc-pubs
Canadian Journal of Chemistry

Draft
of water droplets shows minimal change with change in the water cut of the system. As
mentioned earlier, the relatively constant water droplet size across the water cuts is likely
to be due to the high concentration of surfactant used in this study. However, it should be
mentioned here that the minimum water droplet size observed at 50 vol.% water cut is
relatively small and thus not significant.
Figure 9: NMR droplet size measurements for mineral oil 70T emulsions at various water cuts.
Comparison Between NMR and Microscopy Results
Figure 10 shows the comparison of the water droplet size obtained from the two
methods used in this work: NMR and optical microscopy measurements. From Figure 10,
the size of the water droplet reported in both methods is on the same order of magnitude,
with the NMR method showing a slightly larger droplet size (average of 1 μm larger) as
compared to the optical microscopy method. The difference in the size of the water droplet
reported by both methods is currently being investigated. Some of the expected error from
optical microscopy method includes poor edge detection due to the shadow effects.
Page 11 of 15
https://mc06.manuscriptcentral.com/cjc-pubs
Canadian Journal of Chemistry

Draft
Figure 10: Comparison of NMR and Microscopy water droplet size for all water cuts (vol. %).
Furthermore, it can be seen in Figure 10 that in both methods, the trend of the water
droplets across all water cuts studied is relatively similar; both show a minimum droplet
size at 50 vol.% water cut. This shows that the NMR method proposed here is able to
measure the water droplet size in emulsion systems. In addition, it should be noted that
when comparing the two methods, larger deviation was observed for the microscopy
method results as compared to the NMR method. It is thought that this large deviation in
the size of the water droplet measured is due to the optical microscopy method that was
used. In optical microscopy, a small emulsion droplet is flattened between two glass slides.
This resulted to the water droplets being closer to each other in the images and creating an
error in detecting the edge of the water droplets.
Conclusions
Our results have shown that Diffusion-Transverse Relaxation (T2) experiments using a low
field Nuclear Magnetic Resonance method can be used to measure the DSD of an emulsion
sample. The results obtained from this method were compared with the results obtained
from microscopy image analysis techniques. The investigations show that the average
droplet size obtained from NMR is on average 1 μm larger as compared to the microscopy
technique. However, both methods show a similar trend across the water cuts investigated
in this work. There are relatively small changes in the size of the water droplets across the
water cuts studied here. The method also allows the determination of average surface
Page 12 of 15
https://mc06.manuscriptcentral.com/cjc-pubs
Canadian Journal of Chemistry

Draft
relaxivity for water droplets in an oil continuous phase and was calculated to be 1.22 µm/s.
The determination of average surface relaxivity of this model emulsion system, allows
direct calculation and determination of average water droplet size in this model system
without performing diffusion tests. This NMR method will be immensely useful in
determining the droplet size of water-in-oil emulsions, and hence provides a simple
quantitative approach to assessing gas hydrate slurry formation and hydrate plugging risk.
References
1. E. Sloan, C. Koh, Clathrate Hydrates of Natural Gases, 2008.
2. D.J. Turner, Clathrate Hydrate Formation in Water-in-Oil Dispersions, Colorado School of Mines, 2006.
3. D.J. Turner, K.T. Miller, E. Dendy Sloan, Chem. Eng. Sci. 64 3996 (2009).
4. J.G. Delgado-Linares, A.A.A. Majid, E.D. Sloan, C. a. Koh, A.K. Sum, Energy & Fuels. 27 4564 (2013).
5. C.P. Aichele, M. Flaum, T. Jiang, G.J. Hirasaki, W.G. Chapman, J. Colloid Interface Sci. 315 607 (2007).
6. J. Peixinho, P.U. Karanjkar, J.W. Lee, J.F. Morris, Langmuir. 26 11699 (2010).
7. J. Sjöblom, B. Øvrevoll, G. Jentoft, C. Lesaint, T. Palermo, … C. a. Koh, J. Dispers. Sci. Technol. 31 1100 (2010).
8. K.J. Dunn, D.J. Bergman, G.A. Latorraca, Nuclear Magnetic Resonance Petrophysical and Logging Applications, Pergamon, 2002.
9. G.R. Coates, L. Xiao, M.G. Prammer, NMR Logging Principles & Applications, Halliburton Energy Services Publication, 1999.
10. C.P. Aichele, M. Flaum, T. Jiang, G.J. Hirasaki, W.G. Chapman, J. Colloid Interface Sci. 315 607 (2007).
11. M.D. Hürlimann, L. Venkataramanan, C. Flaum, P. Speier, C. Karmonik, … N. Heaton, Diffusion-Editing: New NMR Measurement of Saturation and Pore Geometry, in: SPWLA 43rd Annu. Logging Symp., 2002.
12. Y.-Q. Song, Vadose Zo. J. 9 828 (2010).
Page 13 of 15
https://mc06.manuscriptcentral.com/cjc-pubs
Canadian Journal of Chemistry

Draft
13. L. Venkataramanan, Y. Song, M.D. Hürlimann, IEEE Trans. Signal Process. 50 1017 (2002).
14. K.. Packer, C. Rees, J. Colloid Interface Sci. 40 206 (1972).
15. G.J. Hirasaki, A.A. Pena, Advanves Colloid Interface Sci. 105 103 (2003).
16. M.L. Johns, Curr. Opin. Colloid Interface Sci. 14 178 (2009).
17. E.O. Fridjonsson, L.S. Flux, M.L. Johns, J. Magn. Reson. 221 97 (2012).
18. N.V.D.T. Opedal, G. Sørland, J. Sjöblom, J. Basic Princ. Diffus. Theory, Exp. Appl. 9 1 (2009).
19. G.H. Sørland, S. Keleşoğlu, S. Simon, J. Basic Princ. Diffus. Theory, Exp. Appl. 19 1 (2013).
20. J.S. Murday, R.. Cotts, J. Chem. Phys. 48 4938 (1968).
21. C. Noïk, J. Trapy, A. Mouret, I.F.P. Institut, G. Laborie, Design of a Crude Oil Dehydration Unit, in: Soc. Petroelum Eng., 2002.
Page 14 of 15
https://mc06.manuscriptcentral.com/cjc-pubs
Canadian Journal of Chemistry

Draft
Supporting Information for
Measurement of Water Droplets in Water-in-Oil
Emulsions Using Low Field Nuclear Magnetic
Resonance for Gas Hydrate Slurry Application
Ahmad AA Majid1, Milad Saidian2, Manika Prasad2, Carolyn A. Koh1*
1. Center for Hydrate Research, Department of Chemical and Biological
Engineering, Colorado School of Mines, 80401 USA
2. Department of Petroleum Engineering, Colorado School of Mines,
80401 USA
Table S 1: Composition of Mineral Oil 70T*
Component Mass % C16 0.09 C17 1.23 C18 5.22 C19 11.75 C20 16.04 C21 17.04 C22 12.20 C23 6.34 C24 4.23 C25 3.76 C26 3.29 C27 2.66 C28 2.27 C29 1.56 C30
+ 12.34 Average MW : 311 * Provided by Chevron ETC [4]
Page 15 of 15
https://mc06.manuscriptcentral.com/cjc-pubs
Canadian Journal of Chemistry


![HOME [hq3v243wqqe3dgv253uelk9o-wpengine.netdna-ssl.com]](https://static.fdocuments.in/doc/165x107/6170bc947fa5c3257e137324/home-hq3v243wqqe3dgv253uelk9o-.jpg)
![Welcome [36p8dn1mx3ec4frl162m3qn2-wpengine.netdna-ssl.com]](https://static.fdocuments.in/doc/165x107/61eac4e51e929d74fc483cb0/welcome-36p8dn1mx3ec4frl162m3qn2-.jpg)