
Agenda - 2lwej44565rn2mmjlk31pmwq-wpengine.netdna-ssl.com
51
Agenda Welcome, candidates! Sept. 8, 2014 Minnetonka, Minnesota
Transcript of Agenda - 2lwej44565rn2mmjlk31pmwq-wpengine.netdna-ssl.com
Agenda
Welcome, candidates!
Sept. 8, 2014 Minnetonka, Minnesota

Why we are here: Energy drives our economy
Clean energy approaches offer opportunities to promote and
improve:
• Innovation
• Economic growth
• Human health and the environment
• National security
• Equity
• Local resilience

Intended takeaways of this briefing
• Learn more about issues that impact your constituents and
the state
• Understand interconnections among economic, social, and
environmental issues related to energy and transportation
• Inform your strategy, decision-making, and legislative
agenda

About Fresh Energy
Research and
Analysis
Advocacy Innovative
Policy Models
Stakeholder
Engagement
For more than 20 years, Fresh Energy has transformed
widely held economic and environmental ideas into
smart energy policy.

Shawntera M. Hardy
director, transportation &
built environment
J. Drake Hamilton director, science policy
Alison Lindburg
senior policy associate
Michael Noble
executive director
Erin Stojan Ruccolo
director, electricity markets
Sarah J. Lynch
managing director
Will Nissen
policy associate
Allen Gleckner
senior policy associate
Fresh Energy policy staff
Ross Abbey policy associate
Alexis Williams
policy associate

Agenda
Today’s
agenda
Today’s agenda • National climate context
• Minnesota energy profile
• Clean energy policy
• Transportation connections
• Recent polling information
• Wrap up, Q&A
Sources of MN Electricity
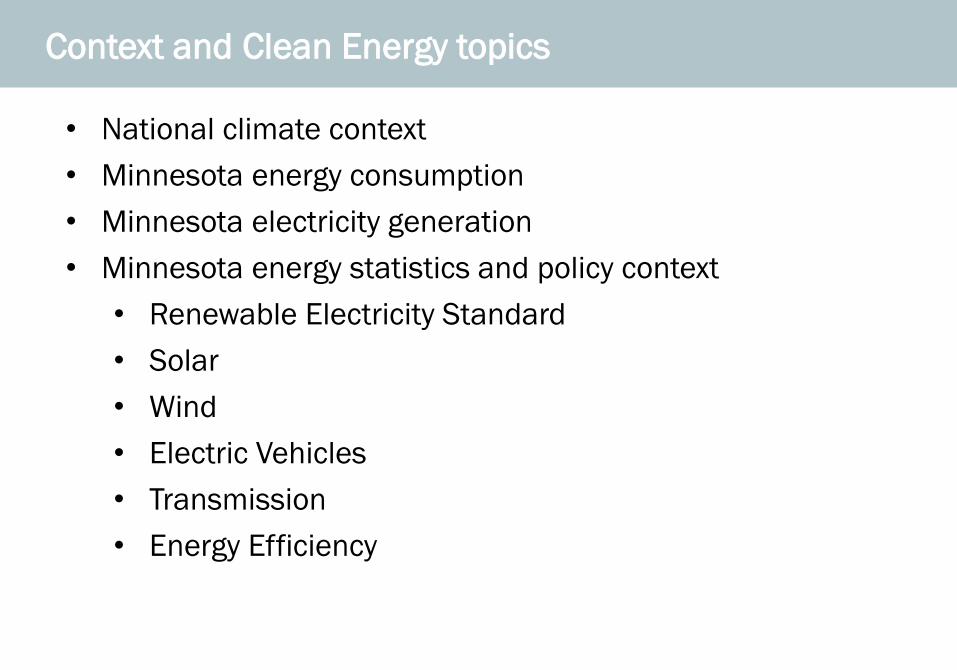
Context and Clean Energy topics
• National climate context
• Minnesota energy consumption
• Minnesota electricity generation
• Minnesota energy statistics and policy context
• Renewable Electricity Standard
• Solar
• Wind
• Electric Vehicles
• Transmission
• Energy Efficiency

Agenda
National Climate Context

Regulations
• Current limits on power plant emissions include mercury, sulfur, arsenic,
cyanide, lead
• Proposed limits include carbon dioxide
Estimated benefits of limits to date
• 160 thousand adult deaths prevented
• 1.7 million asthma attacks avoided
• 86 thousand emergency room visits avoided
• 3.2 million lost school days avoided
• 13 million lost work days avoided
• 30:1 return on investment from regulations
Last four decades of pollution regulations and associated costs
and benefits
Sources : U.S. Environmental Protection Agency, The Benefits and Costs of the Clean Air Act from 1990 to 2020 and
Congressional Budget Office.

Clean Power Plan intends to cut nationwide carbon pollution by
30 percent by 2030
• Proposed limit on carbon dioxide based on the Clean Air Act, June 2014
• Guidelines for states to follow in reducing carbon emissions from existing
fossil fuel-fired plants; will result in cutting soot and smog emissions by 25%
• States get to decide how to meet target at lowest cost in a manner that fits
their situation
• States in the driver’s seat now, with 2 years to develop an implementation
plan
– Minnesota Pollution Control Agency is holding open stakeholder meetings with
utilities, businesses, clean energy organizations and state agencies; advisory
group will begin in January to evaluate elements of the state plan, due in June
2016

“Extreme heat, heavy downpours, and flooding will affect infrastructure, health,
agriculture, forestry, transportation, air and water quality, and more. Climate
change will also exacerbate a range of risks to the Great Lakes.”
-- National Climate Assessment, 1958-2011
• Observed changes include 37% more heavy downpours for Midwest
• More of Minnesota’s rain is coming in 2- and 3- inch downpours
• Minnesota has had four 1-in-1,000 year floods just since 2004
• Minnesota has been the third fastest-warming state
Sources: Minnesota State Climatology Office; National Climate Assessment 2014
Minnesota is already seeing expensive impacts of climate change

Coal
16%
Natural Gas
26%
Petroleum
36%
Nuclear
8%
Hydro
0.29% Biomass
9%
Geothermal
0.06%
Solar
0.02%
Wind
4%
Net Imports
1%
Coal
Natural Gas
Petroleum
Nuclear
Hydro
Biomass
Geothermal
Solar
Wind
Net Imports
Minnesota’s energy consumption: statistics
Source: Energy Information Administration, 2012; Energy Consumption Estimates for Major Energy Sources in Physical Units, 1960-2012,Minnesota

A few facts about Minnesota’s energy profile
• Despite its use of significant oil, coal, and natural gas,
Minnesota has no fossil fuel resources
• Minnesota sends about $13 billion out of state and country
to buy fossil fuels, which could pay for:
– 53,000 teachers
– 9,000 police officers
– 30,000 entrepreneurship loans
– 10,000 new affordable homes
…and have billions of dollars left over
Source: Minnesota Department of Commerce Division of Energy Resources; Scoping an energy future study for Minnesota

Sources of MN Electricity
Other
(including
petroleum,
hydro)
2%
2012
Nuclear
23%
Natural
Gas
14%
Renewables
18%
Coal
43%
Minnesota’s electricity generation: statistics
From 1990 to 2010:
• Decrease in electricity
generation from coal: -13.1%
• Increase in renewable
generation: +10.3%
• Increase in natural gas: +6.9%
Result: On a path to a more diverse
energy mix
Source: Energy Information Administration, Electric power industry generation by primary energy source, 1990-2012, Minnesota

Sources of MN Electricity
Who makes Minnesota’s energy policy?
• The legislature
• Minnesota Public Utilities Commission (PUC)
• Responsible for regulating public utilities and setting rates
• Oversees utilities’ least-cost and integrated resource
planning
• Has required utilities to do side-by-side cost comparisons
on future options for our oldest coal plants
• Program implementation is largely directed by state agencies
in compliance with state and federal laws, regulations, codes,
and standards

Sources of MN Electricity
Major clean energy policies in Minnesota
Next
Generation
Energy Act
of 2007
• Renewable Electricity Standard (RES) of 25% renewable energy by 2025 (30% by 2020 for Xcel Energy)
• Reducing carbon pollution by at least 15% below 2005 levels by 2015, 30% by 2025, and 80% by 2050 across all sectors
• 1.5% Energy Efficiency Resource Standard for electric utilities, and 1% for gas utilities
Requires:

Progress toward state renewable goals
Utilities are currently on track or exceeding Renewable
Electricity Standard (RES) goals
• Minnesota has 3,000+ megawatts of installed wind
energy—enough to power 840,000 Minnesotan homes
• Several utilities stated that they would have added wind in
any scenario because it is the least-cost resource
• According to statewide utility reporting in 2012, there has
been almost no rate impact due to compliance with RES
Source: AWEA, 2014; Minnesota Wind Energy Fact Sheet

Sources of MN Electricity
Minnesota’s current solar energy policy
Solar electricity standard (2013) in addition to the RES
• Standard: 1.5% of public utilities’ electricity from solar by 2020
• Goal: 10% of the entire state’s electricity from solar by 2030
• Specific policies on
– Value of Solar
– Community Solar

.
Why more solar in Minnesota?
Sources: National Renewable Energy Laboratory, Lopez (2012), Lawrence Berkeley National Laboratory, Barboose et al. (2013)
• Solar energy is our single largest energy resource: Minnesota’s
technical solar potential exceeds 6 million megawatts (12,000
MW on rooftops alone)
>>> equivalent to supplying 150 times our state’s electricity
needs
• Solar prices are falling: from around $8/W per installed kW to
$4.5-$5.3 (depends on size and whether residential or
commercial) -- and are expected to continue to fall
• In March 2014, the PUC voted unanimously to require Xcel to
source energy from a large new solar project, marking the first
time that solar competed toe-to-toe with natural gas – and won

Sources of MN Electricity
Wind power generation in Minnesota
Wind as percent of total power generated by state, 2013:
1 Iowa 27.4%
2 South Dakota 26.0%
3 Kansas 19.4%
4 Idaho 16.2%
5 Minnesota 15.7%
6 North Dakota 15.6%
7 Oklahoma 14.8%
8 Colorado 13.8%
9 Oregon 12.4%
10 Wyoming 8.4%
Source: AWEA, 2014; Wind generation records & turbine productivity

Sources of MN Electricity
Standards Should Drive the Market
“What’s more important than
incentives is standards.”
“It’s more important that states like
Minnesota are leaders setting a
renewable energy standard and
let the market figure out how to do
it.”
David Mortenson
Clean Energy Economy Summit
July 2014

Sources of MN Electricity
Benefits to Minnesotans from the wind industry
Source: AWEA, 2014; Minnesota Wind Energy Fact Sheet ; Minnesota Department of Revenue Property Tax Division
• Minnesota’s wind resource could provide more than 24 times the state’s
current electricity needs
• An estimated 2000 jobs supported in 2012
• Capital investments of more than $5.6 billion in the state
• More than $10 million paid to landowners in lease payments annually,
providing diversified income to Minnesota’s farm families
• Since 2007, more than $42 million total in production tax payments to
counties as well as cities/townships
• Wind power is cost-effective in Minnesota—as evidenced by Xcel’s 750 MW
wind procurement in fall 2013, ahead of its RES compliance schedule; the
project is projected to save Xcel customers $225 million over 10 years

Sources of MN Electricity
Minnesota is a part of a regional transmission grid
MISO (Midcontinent Independent
System Operator)
• Grid operator in central US
• Runs the wholesale electricity
market, the transmission system,
and transmission system
planning
• Charged with ensuring electricity
system reliability

The plug-in electric vehicle (EV): a technology that crosses
boundaries
• New policy: Electric vehicle
“time of use” rate for customers
• Statistics: 2000 EVs on the
road in Minnesota, and
adoption rates are accelerating
• Long-term growth will depend
on:
• Ease of charging at home
and work
• Regulatory support
• Utility investment
• Fleet adoption
• Availability of “fast charging”
infrastructure
Source: HybridCars.com

Understanding energy efficiency
• Policies and programs often focus on both combined and specific approaches to
residential, commercial, and industrial activities
• State administration offices, utilities, and other entities run a range of different
programs to incentivize adoption of energy efficiency practices and products
Efficiency solutions are
easiest, cheapest energy
sources---yet we don’t
sufficiently use them

Progress toward state efficiency goals
Utilities are on track or exceeding efficiency requirements
• Increased energy efficiency reduces rates for consumers
because efficiency is the cheapest form of energy
• Xcel’s energy savings alone have been enough to eliminate
the need to build 10 new power plants, reducing rates for
consumers
• Based on utility reporting, for every $1 utilities that spent
on conservation, their customers save $5--and it’s hard to
get that level of return with any other investment

Is Minnesota on track in efficiency?
• Minnesota was a regional
leader in implementing its
Energy Efficiency
Resource Standard in
2010
• Other states in the region
and nationally have
adopted more aggressive
standards; a few have
halted implementation of
their standards
Source: Minnesota Database for State Incentives for Renewables and Efficiency

Is Minnesota on track in efficiency?
Residential and commercial building codes
The building sector consumes nearly half (47.6%) of all energy
produced in the United States
• Minnesota is currently updating its entire building code, including energy
codes
• MN is behind other Midwestern states in adopting updates to both
residential and commercial codes
• Residential: updates from 2006 to 2012 = 20% more energy efficient
than current code, and include improvements to insulation, HVAC,
windows, lighting, and mandatory air tightness test (blower door)
• Commercial: updates from 2004 to 2010/2012 = 30% more efficient
than current code, and include improvements to mechanical systems
and lighting

Is Minnesota on track in efficiency?
Untapped efficiency savings for large industrial consumers
Current Minnesota policy does not maximize industrial energy
efficiency for large users
>> 41 large industrial customers to date have opted out of the state’s
conservation programs; just 11 of these customers represent more
than 10 percent of the total electricity sales in the entire state
>> This represents a significant opportunity to engage industrial
customers to help them save money and improve productivity
Agenda
Minnesota’s
Transportation
Connections

Generate economic growth
and keep us competitive
More efficiently move goods, services and
people
Equitable access to jobs, housing, education and healthy living
Attract and retain talent to grow
Minnesota businesses
Greater accountability,
transparency and efficiency
The Future of Transportation – What Does it Look Like?
Transportation is
about more than a
specific mode – it is
about ensuring that
MN is a leader

• The state's 65 and older population will double between 2010 and 2035,
at which time Minnesota will have about 1.37 million older adults.
• Anticipated rural to urban shift
• Trend: Increasing urbanization and urban density, which presents new
challenges and opportunities for investment
• Minnesota is in a race to attract and retain young talent
• Minnesota is losing 20- and 30-somethings to places like Denver,
Portland, and Austin; millennials are looking for vibrant downtowns
and accessible transit
Sources of MN Electricity Case for a 21st century transportation system
Source: Metropolitan Council; ThriveMSP 2040 and MN State Demographer

Sources of MN Electricity
How behind is Minnesota on transportation investment?
The ASCE reports the following about Minnesota:
• 52% of our major roads are in mediocre or poor
condition
• Driving on roads in need of repair costs Minnesota
motorists $797 million a year in extra vehicle
repairs and operating costs – $250 per motorist
• 12.3% of bridges in Minnesota are considered
structurally deficient or functionally obsolete
The American Society of Civil Engineers (ASCE) produced the 2013 Report Card on
America’s Infrastructure which gave the nation’s infrastructure a grade of D+.
Source: American Society of Civil Engineers; 2013 Report Card on America’s Infrastructure

• Transit is unavailable or
sparse in many parts of
the state
• Safe bike and walk
connections are missing
in many communities
Sources of MN Electricity
How behind are Minnesota’s transportation investments?

Sources of MN Electricity
Investment in public transit is lagging
Sources: University of Minnesota Center for Transportation Studies;
American Public Transportation Association, Economic Impact of Public Transportation Investment, 2014 update
Miles of transitways (existing or under construction)
• Investment offers an
economic return of $4 for
every $1 invested
• Investment will lead to an
estimated 50,700 jobs
per $1 billion invested

Sources of MN Electricity
Minnesota needs to be connected

Sources of MN Electricity
Vision for a 21st Century Transportation System
Comprehensive
Balanced Sustainable
Dedicated

Agenda
Recent Polling Results

Key Results: Recent Polling on Energy Topics
• 421 randomly selected Minnesota
registered voters
• Survey interviews on landline,
wireless phones from 7/26/14-
8/3/14
• Bipartisan team with 25+ years of
experience conducted polling
• Margin of sampling error of +/- 4.9%

74%
64%
58%
49%
47%
23%
18%
16%
21%
28%
27%
36%
42%
39%
37%
38%
8%
6%
8%
19%
6%
24%
6%
15%
18%
8%
36%
0% 20% 40% 60% 80% 100%
Energy efficiency
Solar
Wind
Hydropower
^Natural gas
Nuclear
Biomass
^Coal
Strng. Supp. Smwt. Supp. Smwt. Opp. Strng. Opp. DK/NA
Minnesota voters support increasing the use of many
sources of energy
Q6a/b/d/e/f/h/i/l. ^Not Part of Split Sample
Here is a list of specific sources of energy. Please tell me whether you would support or oppose
increasing use of that source of energy to meet your state’s future needs.
Total Supp.
Total Opp.
95% 3%
93% 6%
85% 14%
84% 8%
88% 10%
62% 35%
55% 9%
55% 42%

A large majority of voters generally see many benefits to
renewables – security, reliability, jobs, affordability
Thinking about renewable energy like wind and solar power, please tell me if you think each of the
following phrases describe renewable energy – very well, somewhat well, not very well, or not at all
well.
49%
46%
35%
34%
30%
29%
30%
19%
36%
35%
44%
41%
42%
40%
34%
40%
7%
10%
12%
14%
15%
17%
21%
25%
5%
6%
5%
6%
8%
8%
10%
9%
5%
5%
7%
6%
7%
0% 20% 40% 60% 80% 100%
Allow us to be more self-reliant for energy
Will help to make our energy supply more
secure
Reliable
An increasing source of good jobs
Affordable
The best power source for our state
Increasingly able to replace coal and fossil fuels
Available here and now
Very Well Somewhat Well Not Very Well Not At All Well No Opinion/Don't Know
Total
Well
Total Not
Well
86% 12%
81% 16%
80% 17%
75% 20%
72% 23%
69% 24%
63% 31%
59% 34%

Demographic Groups Total Support Total Oppose DK/NA
Minnesota Voters 95% 3% 1%
Party
Democrats 98% 2% 0%
Independents 99% 0% 1%
Republicans 89% 8% 3%
Gender
Men 97% 3% 0%
Women 94% 3% 2%
Age
18-49 95% 5% 0%
50-64 100% 0% 0%
65+ 91% 4% 6%
Income
$0-$25,000 100% 0% 0%
$25,000-$50,000 94% 3% 4%
$50,000-$75,000 97% 3% 0%
$75,000-$100,000 97% 3% 0%
$100,00+ 94% 6% 0%
6h. Here is a list of specific sources of energy. Please tell me whether you would support or oppose increasing use of that
source of energy to meet your state’s future needs. Split Sample
Support for energy efficiency is near-unanimous across
demographic groups

35%
35%
14%
14%
3%
0% 15% 30% 45% 60% 75%
Strongly support
Somewhat support
Somewhat oppose
Strongly oppose
DK/NA
Total
Oppose
27%
Total
Support
70%
Seven in ten Minnesota voters back an increase in the
renewable energy standard.
16a. I would like to read you some ideas related to energy that might be proposed by people in Minnesota. Please tell me
whether it sounds like something you would support or oppose. Not Part of Split Sample
Requiring that Minnesota get 50% of its electricity from renewable sources

Total
Support
Total
Oppose
87% 10%
86% 13%
83% 16%
77% 21%
72% 25%
70% 26%
62%
58%
48%
44%
44%
32%
26%
28%
35%
34%
28%
37%
5%
6%
9%
9%
11%
13%
6%
7%
7%
12%
14%
13%
0% 20% 40% 60% 80% 100%
Making it more affordable for residents and businesses to install solar power at their homes
or businesses
Investing in retraining workers to work in clean energy jobs such as wind and solar
Increasing requirements for utilities to invest in energy efficiency improvements in homes and
businesses
Increasing state government investment in the development of clean, renewable energy sources
Closing down older coal-burning power plants and replacing them with greater use of renewable
energy and energy efficiency
Requiring utilities to double the amount of renewable energy they provide
Strongly support Somewhat support Somewhat oppose Strongly oppose Don't Know/NA
Large majorities of voters support policy proposals that advance
our clean energy economy
16h/i/j/m/n/o. I would like to read you some ideas related to energy that might be proposed by people in [STATE]. After you hear
each one, please tell me whether it sounds like something you would support or oppose. Split Sample

I should have the right to put solar on my own home and pay for it how I
choose.
We should ensure that all utilities and electricity customers in our state are
subject to the same clean, renewable energy requirements.
Our state should build additional electrical transmission lines so that our state can have greater access to wind-
generated electricity.
Utilities should be able to block residential customers from installing
solar power, energy storage and other similar systems on their property.
69%
54%
36%
26%
30%
44%
7%
8%
11%
18%
5%
71%
0% 20% 40% 60% 80% 100%
Strng. Agr. Smwt. Agr. Smwt. Disagr. Strng. Disagr. DK/NA
7d/e/f/h. Now I'm going to read you a series of statements about energy. Please tell whether you generally agree or disagree.
Split Sample
Voters have strong feelings about the way clean
energy should be generated.
Total
Agr. Total
Disagr.
95% 3%
84% 12%
80% 16%
9% 89%

Agenda
Wrap Up
Q & A

Agenda
www.fresh-energy.org
@freshenergy

Demographic Groups Total Support Total Oppose DK/NA
Minnesota Voters 93% 6% 1%
Party
Democrats 99% 1% 0% Independents 94% 5% 1% Republicans 84% 14% 2% Gender
Men 90% 8% 2% Women 95% 5% 0% Age
18-49 94% 5% 1% 50-64 95% 5% 0% 65+ 86% 13% 2% Income
$0-$25,000 96% 4% 0% $25,000-$50,000 94% 4% 3% $50,000-$75,000 93% 5% 2% $75,000-$100,000 100% 0% 0% $100,00+ 92% 8% 0%
6l. Here is a list of specific sources of energy. Please tell me whether you would support or oppose increasing use of that
source of energy to meet your state’s future needs. Split Sample
Support for solar power is only slightly lower than for energy efficiency.

Demographic Groups Total Support Total Oppose DK/NA
Minnesota Voters 85% 14% 1% Party
Democrats w/Leans 95% 5% 0% Independents/Undecided 87% 13% 0% Republicans w/Leans 71% 27% 2% Gender
Men 84% 15% 1% Women 87% 13% 0% Age
18-49 91% 9% 0% 50-64 76% 21% 2% 65+ 84% 16% 0% Income
$0-$25,000 88% 12% 0% $25,000-$50,000 91% 9% 0% $50,000-$75,000 83% 17% 0% $75,000-$100,000 88% 12% 0% $100,00+ 86% 14% 0%
6f. Here is a list of specific sources of energy. Please tell me whether you would support or oppose increasing use of that
source of energy to meet your state’s future needs. Split Sample
At least seven in ten voters from every major demographic group back wind power.
(Wind)

A solid majority of voters generally think that increasing renewable energy and
energy efficiency projects will have positive job implications
Q10 & Q12. Split Sample
Increasing the use of clean, renewable
energy sources like wind and solar power…
Energy efficiency projects like weatherizing and
insulating buildings, and upgrading appliances
and technology in homes and businesses…
65%
16%
9%
10%
0% 15% 30% 45% 60% 75%
Will create new jobs in Minnesota
Will not affect jobs in Minnesota
Will cost jobs in Minnesota
All/None/Don’t Know
70%
16%
6%
8%
0% 15% 30% 45% 60% 75%

A majority also think that both increased energy efficiency and
renewable activities will reduce energy costs
Increasing the use of clean, renewable
energy sources like wind and solar power...
Energy efficiency projects like weatherizing and
insulating buildings, and upgrading appliances
and technology in homes and businesses ….
48%
22%
21%
10%
0% 15% 30% 45% 60% 75%
Will reduce energy costs in Minnesota
Will increase energy costs in Minnesota
Will not affect energy costs in Minnesota
All/None/Don’t know
62%
15%
16%
7%
0% 15% 30% 45% 60% 75%

![HOME [hq3v243wqqe3dgv253uelk9o-wpengine.netdna-ssl.com]](https://static.fdocuments.in/doc/165x107/6170bc947fa5c3257e137324/home-hq3v243wqqe3dgv253uelk9o-.jpg)


![Welcome [36p8dn1mx3ec4frl162m3qn2-wpengine.netdna-ssl.com]](https://static.fdocuments.in/doc/165x107/61eac4e51e929d74fc483cb0/welcome-36p8dn1mx3ec4frl162m3qn2-.jpg)