Dr. Jorge Cordovez M, Use of lesion volumes and loads … · en nuestra práctica habitual, así...
9
Revista Chilena de Radiología. Vol. 19 Nº 4, año 2013; 156-164. 156 Use of lesion volumes and loads for monitoring patients with multiple sclerosis. Local experience and literature review Dres. Jorge Cordovez M (1) , Marcelo Gálvez M (1) , Gonzalo Rojas C (2) , Cristóbal Bravo C. (3) , Alejandro Cerda E (4) . 1. Neuroradiologist, Department of Diagnostic Imaging, Clínica Las Condes, Santiago, Chile. 2. Computer Engineer, Medical Imaging Laboratory, Clínica Las Condes. 3. Radiologist, Department of Diagnostic Imaging, Clínica Las Condes, Santiago, Chile. 4. Medical Technologist, Department of Diagnostic Imaging, Clínica Las Condes, Santiago, Chile. Cordovez J. Uso de volumetría y carga lesional en el seguimiento de pacientes con esclerosis múltiple. Experiencia local y revisión de la literatura. Rev Radiol 2013; 19(4): 156-164. Correspondence: Dr. Jorge Cordovez M. / [email protected] Work received 30 August 2013. Accepted 18 December 2013. Abstract: Multiple sclerosis (MS) is a common demyelinating disease that involves the central nervous system causing focal lesions in the brain and spinal cord causing diverse neurological development deficits, many of them severe and irreversible, affecting and invaliding a large percentage of young productive-aged patients. MRI exams have improved diagnostic capability compared to computed tomography, but in this decade the development of new magnets, coils and software have allowed the development of quantitative neuroradiology which achieves the evaluation of parameters such as total brain volume, of each of its structures, as well as semi-automated or automated counting of the lesion load, allowing better monitoring of each individual patient in relation to a parti- cular event such as a new neurological deficit in an outbreak of the disease, a previously undetected cognitive impairment or in related to a given treatment. We will show our local experience using the FreeSurfer software in our habitual practice, as well as other post-processing software, this being the first experience of its use in multiple sclerosis published in our country. Keywords: Brain volume, FreeSurfer, Magnetic resonance imaging, MIPAV software, Multiple sclerosis, Lession load, Resumen. La esclerosis múltiple (EM) es una frecuente enfermedad desmielinizante que afecta el sistema nervioso central produciendo lesiones focales a nivel cerebral y medular que condicionan diversos déficit neu- rológicos evolutivos, muchos de ellos severos e irreversibles, afectando e invalidando un gran porcentaje de pacientes jóvenes en edad productiva. El estudio con resonancia magnética mejoró la capacidad diagnóstica respecto a la tomografía computada, pero en esta década el desarrollo de nuevos magnetos, bobinas y software han permitido desarrollar la neurorradiología cuantitativa que logra evaluar parámetros como el volumen cerebral global, de cada una de sus estructuras así como el recuento semi o automatizado de la carga lesional, lo que permite el mejor seguimiento de cada paciente individual en relación a un evento determinado como un nuevo déficit neurológico dentro de un brote de la enfermedad, un deterioro cognitivo no detectado previamente o en relación a un tratamiento determinado. Mostraremos nuestra experiencia local utilizando el software freesurfer en nuestra práctica habitual, así como otro software de postproceso, siendo la primera experiencia de su uso en esclerosis múltiple publicada en nuestro país. Palabras clave: Carga lesional, Esclerosis múltiple, Freesurfer, MIPAV, Resonancia magnética, Volumen cerebral. Introduction Multiple sclerosis (MS) is a common demyelinating disease that affects the central nervous system, pro- ducing focal lesions that cause diverse neurological deficits with progressive evolution, many of them severe and irreversible. A significant percentage affects young people (between 20 and 40 years of age), more common in women (2:1), which determines a significant economic and social impact. Its etiology has not been exactly defined making it difficult to find a cure. For these reasons, its study is an important source of research in many centers worldwide.
Transcript of Dr. Jorge Cordovez M, Use of lesion volumes and loads … · en nuestra práctica habitual, así...

Revista Chilena de Radiología. Vol. 19 Nº 4, año 2013; 156-164.
156
Dr. Jorge Cordovez M, et al.
Use of lesion volumes and loads for monitoring patients with multiple sclerosis. Local experience and literature review
Dres. Jorge Cordovez M(1), Marcelo Gálvez M(1), Gonzalo Rojas C(2), Cristóbal Bravo C.(3), Alejandro Cerda E(4).
1. Neuroradiologist, Department of Diagnostic Imaging, Clínica Las Condes, Santiago, Chile.2. Computer Engineer, Medical Imaging Laboratory, Clínica Las Condes.3. Radiologist, Department of Diagnostic Imaging, Clínica Las Condes, Santiago, Chile.4. Medical Technologist, Department of Diagnostic Imaging, Clínica Las Condes, Santiago, Chile.
Cordovez J. Uso de volumetría y carga lesional en el seguimiento de pacientes con esclerosis múltiple. Experiencia local y revisión de la literatura. Rev Radiol 2013; 19(4): 156-164.Correspondence: Dr. Jorge Cordovez M. / [email protected] received 30 August 2013. Accepted 18 December 2013.
Abstract: Multiple sclerosis (MS) is a common demyelinating disease that involves the central nervous system causing focal lesions in the brain and spinal cord causing diverse neurological development deficits, many of them severe and irreversible, affecting and invaliding a large percentage of young productive-aged patients. MRI exams have improved diagnostic capability compared to computed tomography, but in this decade the development of new magnets, coils and software have allowed the development of quantitative neuroradiology which achieves the evaluation of parameters such as total brain volume, of each of its structures, as well as semi-automated or automated counting of the lesion load, allowing better monitoring of each individual patient in relation to a parti-cular event such as a new neurological deficit in an outbreak of the disease, a previously undetected cognitive impairment or in related to a given treatment. We will show our local experience using the FreeSurfer software in our habitual practice, as well as other post-processing software, this being the first experience of its use in multiple sclerosis published in our country.Keywords: Brain volume, FreeSurfer, Magnetic resonance imaging, MIPAV software, Multiple sclerosis, Lession load,
Resumen. La esclerosis múltiple (EM) es una frecuente enfermedad desmielinizante que afecta el sistema nervioso central produciendo lesiones focales a nivel cerebral y medular que condicionan diversos déficit neu-rológicos evolutivos, muchos de ellos severos e irreversibles, afectando e invalidando un gran porcentaje de pacientes jóvenes en edad productiva. El estudio con resonancia magnética mejoró la capacidad diagnóstica respecto a la tomografía computada, pero en esta década el desarrollo de nuevos magnetos, bobinas y software han permitido desarrollar la neurorradiología cuantitativa que logra evaluar parámetros como el volumen cerebral global, de cada una de sus estructuras así como el recuento semi o automatizado de la carga lesional, lo que permite el mejor seguimiento de cada paciente individual en relación a un evento determinado como un nuevo déficit neurológico dentro de un brote de la enfermedad, un deterioro cognitivo no detectado previamente o en relación a un tratamiento determinado. Mostraremos nuestra experiencia local utilizando el software freesurfer en nuestra práctica habitual, así como otro software de postproceso, siendo la primera experiencia de su uso en esclerosis múltiple publicada en nuestro país.Palabras clave: Carga lesional, Esclerosis múltiple, Freesurfer, MIPAV, Resonancia magnética, Volumen cerebral.
IntroductionMultiple sclerosis (MS) is a common demyelinating
disease that affects the central nervous system, pro-ducing focal lesions that cause diverse neurological deficits with progressive evolution, many of them severe and irreversible. A significant percentage
affects young people (between 20 and 40 years of age), more common in women (2:1), which determines a significant economic and social impact. Its etiology has not been exactly defined making it difficult to find a cure. For these reasons, its study is an important source of research in many centers worldwide.

Revista Chilena de Radiología. Vol. 19 Nº 4, año 2013; 156-164.
157
NEURORRADIOLOGÍA
From the diagnostic point of view, one of the significant developments was the incorporation of magnetic resonance imaging in the 1980s, which allows us to visualize the lesions that were missed by computed tomography. Incorporating better magnets, new coils and post processing software has increased the sensitivity in the diagnosis of this disease.
An important feature of MS is the heterogeneity in its clinical expression(1) which correlates with its neuropathological heterogeneity.
Different clinical courses of MS: relapsing-remitting (RR), secondary progressive (SP), primary progressive (PP), and progressive relapsing (PR)(2).
RRMS is characterized by self-limited acute neu-rological dysfunction followed by a variable degree of recovery. To the contrary, PPMS is characterized by a steady decline in neurologic function from the onset, without evident outbreaks in the clinical course of the disease. Approximately 50-80% of the individuals who present a clinically isolated syndrome already have lesions on MRI, which would be previous (hidden) to the activity of the disease(2). Lucchinetti(3) has propo-sed four different pathological forms of the disease where there are multifocal lesions with destruction and repair of myelin, axonal loss and reactive astrogliosis.
For the routine clinical diagnosis T2-weighted sequences were used (Figure 1) which allow the ra-diologist to evaluate the number, position and shape of the lesions in the spinal cord and brain to establish a presumptive diagnosis of multiple sclerosis. In T1 sequences the so called “black holes” can be seen, which indicates extensive tissue damage.
In 2001 the McDonald criteria were incorporated, which established specific diagnostic criteria for mul-tiple sclerosis in MRI both in dissemination in time and in space(4).
A correlation between MRI findings and inflam-matory activity has been observed, which has been used as a biomarker for progression, with a good correlation to the neuropathological findings. Several studies have confirmed the relationship between the uptake of gadolinium (Gd) of the lesions in T1 with inflammatory activity(5-8). This has led to the acceptance of MRI as a substitute marker in various clinical trials of anti-inflammatory treatments for MS.
Technical advances in resonance with high-field magnets and new coils, allow us to routinely acquire T1 and T2 enhanced volumetric studies. With this, and the new automatic or semiautomatic post pro-cessing techniques allow us to evaluate the total brain volume, as well as different brain regions or structures and to determine the lesion load in each of our patients. The latter is an important element of useful judgment to determine the course of the disease within a short time such as a year, which introduces us to the use of quantitative parameters in multiple sclerosis.
Quantitative NeuroradiologyThe development of new sequences in resonance,
new coils, and greater power in the magnet fields (high fields) have yielded images with greater sensitivity in relation to neuropathological changes and improved anatomical resolution.
Furthermore, the development of new software such as FSL (www.fmrib.ox.ac.uk/fsl/(9) and SPM (www.fil.ion.ucl.ac.uk/spm/(10)), allows the analysis
Figure 1. In the MPR reconstructions of volumetric FLAIR sequence (a) multiple hyperintense lesions in the white matter with periventricular demyelinating pattern, were observed, with callososeptal interface commitment, noting the typical morphology of Dawson’s fingers. Similar MPRAGE slice (b) is included.
Revista Chilena de Radiología. Vol. 19 Nº 4, año 2013; 156-164.
158
Dr. Jorge Cordovez M, et al.
and quantitative interpretation of the obtained data. Thus quantitative neuroradiology emerges changing the view that was had of the disease, trying to change the management of MS as it allows the identification of small previously undetectable quantitative variations and, therefore, improves our precision to evaluate the individual responses to a given treatment.
Measurements of lesion load and inflammatory activity of the disease through MRI quantitative te-chniques are used with increasing frequency in both clinical and research areas. These techniques require an analysis flow to ensure efficiency, reproducibility and quality control of MRI images in MS patients, which requires advanced image processing. Due to advances in computer science with the implementa-tion of PACS (Picture Archiving and Communication Systems) databases have been made available that allow analysis directed at a particular pathology.
Software for determining brain volume uses image segmentation techniques, co-registration and analysis of time-series(11).
Since the quantitative analysis of MR images is based on relative intensities, as a first step in the process, field inhomogeneity (very important in high-field equipment, greater than T3, and with the use of phased-array coils) must be corrected, and then the registration and segmentation is carried out.
At registration images taken on different equip-ment overlap in the same anatomical locations(12). The time between studies can be days or years, allowing a long-term comparative monitoring. Studies can be performed with the same weighting, for example T1 to assess atrophy(13) or different weighting, even using different imaging methods, e.g. MRI v/s PET.
Lesional Load MeasurementAn important use of segmentation in the study
of MS is to determine the number and volume of T2 hyperintense lesions, which can be quantified in cubic millimeters to compare with future studies. Changes in lesion volume are used in clinical trials of new treatments for MS(14,15).
The MS lesion segmentation can be done manually slice by slice by an operator, where it is possible to achieve a reasonable reproducibility, but it is slow and requires extensive use of labor. In addition, intra-observer (same operator) or inter-observer (different operators) errors occur.
Multiple studies have addressed the problem of reducing the amount of operator time and to improve the reproducibility of the MS lesion volume measurement, using semi- or fully automated methods (16-18), which include edge detection techniques, contour following, neural networks, fractal image compression, etc.
Probably the most promising approach is based on segmentation using multiple parameters, where information from a number of sequences (e.g. T1, PD
and FLAIR) combine to segment lesions based on the position of the pixels in an N-dimensional space, depending on intensity.
The semi-automatic lesion classification can give an adequate sensitivity with a good reproducibility in the detection method of MS lesions, together with the elimination of the variability and subjectivity (intra-observer variability, inter-observer) and cost reduction associated with the manual process. But the operator is still required to manually identify some MS lesions.
Most identification and automatic as well as semi-automatic segmentation methods of lesions are based on a range of intensities for the different tissues of the brain. However, large variations in intensity may violate these assumptions and adversely affect the success of the process. These variations arise from different manufacturers and models of resonators, differences in protocol acquisition (slice thickness, etc.), as well as for being used in different stages of the disease or the presence of concomitant disea-ses that can significantly affect the tissue intensity behavior(19,20). Because of this, some software such as TOADS-CRUISE, besides using gray levels for detecting MS lesions use anatomical atlases to eli-minate false positives(21).
Cerebral atrophyBrain atrophy is a normal feature of aging, with
progressive loss of brain tissue from early adulthood. To assess brain atrophy, we must take into conside-ration that brain volume is highly variable between individuals.
It is believed that neuronal tissue loss is a long term indicator of irreversible tissue damage. This is somewhat complex when the pseudoatrophy global phenomenon exists for the anti-inflammatory effect of some MS treatments, where an initial rapid shrinkage of brain volume occurs due to a reduction in the ex-cess fluid in the brain, a phenomenon that should be considered when evaluating the volume(22).
Brain atrophy can be measured longitudinally or transversely. The transversal is to estimate the total volume of brain tissue. Since the brain volume is variable, results are not readily comparable, except in studies of large populations. One way to standar-dize the measurements is to provide a “normalized” brain volume. There is a way to do this: dividing the volume of brain parenchyma by intracranial volume, as the intracranial volume remains unchanged during adulthood(23).
In longitudinal studies it is possible to measure the brain volume reduction normalized with respect to the baseline study. However, sophisticated records of the studies done at different points of time make it possible not only to evaluate the gross change in tissue volume, but also to display the anatomical location of the tissue loss(24).
Revista Chilena de Radiología. Vol. 19 Nº 4, año 2013; 156-164.
159
NEURORRADIOLOGÍA
Pathological and imaging studies suggest that the development of permanent neurological damage in MS is associated with the progressive atrophy of the brain and spinal cord.
Material and methodsWith Siemens Avanto and General Electric (GE)
1.5T Optima 450 resonators, volumetric T1 sequen-ces were acquired (MPRAGE sequence on Siemens equipment with parameters: TR 2400 ms, TE: 3.4 ms, Ti: 1000 ms, FOV: 250 x 250. FSPGR sequence (BRAVO) on GE equipment with parameters TR: 9.7 ms, TE: 3.7 ms, Ti: 600 ms, FOV: 256 x 256. FLAIR sequence on Siemens equipment with parameters TR: 7000 ms, TE: 430 ms, Ti: 2200 ms, FOV: 256 x 256. FLAIR sequence on GE equipment with pa-rameters TR: 6000 ms, TE: 146.7 ms, Ti: 1812 ms, FOV: 256 x 256) on 50 patients referred by their treating physicians for routine control of multiple sclerosis, or the occurrence of a clinical outbreak. From these 11 were selected (9 women and 2 men) because they had at least one MRI control over time (average: 12.6 months), whose ages ranged between 23 and 54 years (average: 38 years). Monitoring with resonance was performed between the 5th and 15th months (average: 12.6 months). Volumetric analysis was performed with FreeSurfer v.4.5.0 software (FreeSurfer, http://surfer.nmr.mgh-harvard.edu; segmentation example) and with MIPAV software with TOADS-CRUISE plug-in (http://www.nitrc.org/projects/toads-cruise/) for lesion count, which allows the use of T1-weighted, FLAIR, T2 and PD sequences, but better results are obtained using T1 and FLAIR sequences. These were compared with our normal volumetric database according to age range.
In order to compare images of the different pa-tients it is necessary to transform them to a standard anatomical space(12). In our cases we rely on the MNI brain atlas from the Montreal Neurological Institute, which is made up of the registry of studies from a large sample of control subjects, from which an average brain is obtained, which was approximately co-registered to the atlas of Talairach and Tournoux(26).
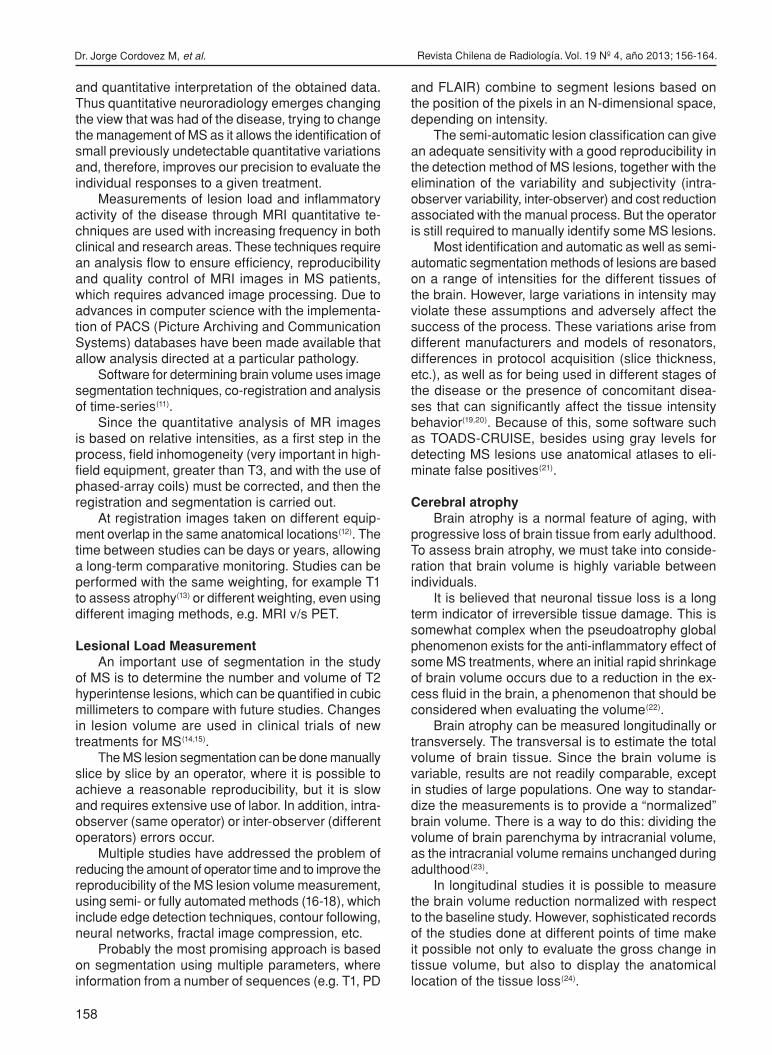
ResultsIn Figure 2, coronal slice segmentation for an MS
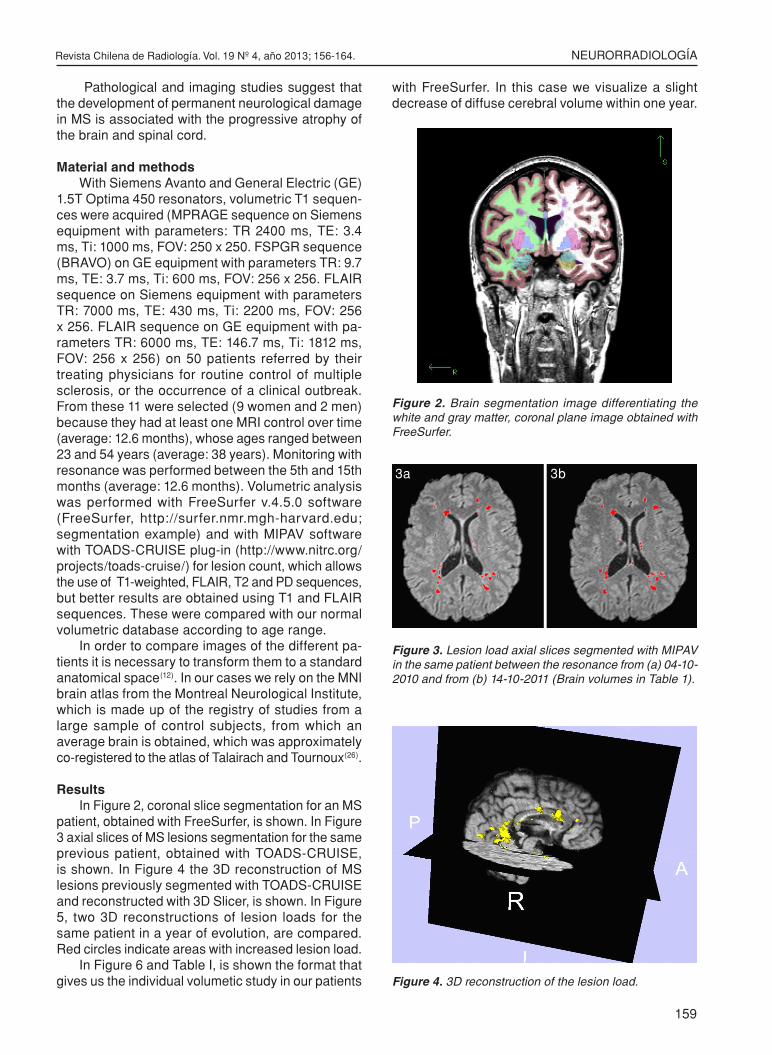
patient, obtained with FreeSurfer, is shown. In Figure 3 axial slices of MS lesions segmentation for the same previous patient, obtained with TOADS-CRUISE, is shown. In Figure 4 the 3D reconstruction of MS lesions previously segmented with TOADS-CRUISE and reconstructed with 3D Slicer, is shown. In Figure 5, two 3D reconstructions of lesion loads for the same patient in a year of evolution, are compared. Red circles indicate areas with increased lesion load.
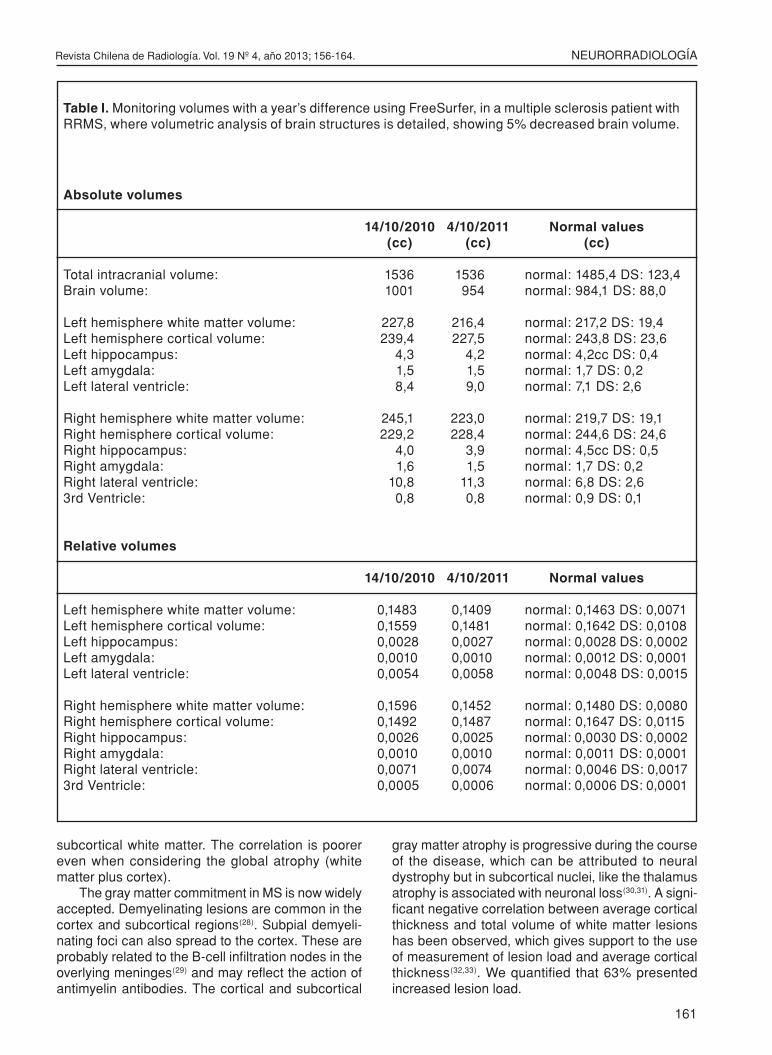
In Figure 6 and Table I, is shown the format that gives us the individual volumetic study in our patients
with FreeSurfer. In this case we visualize a slight decrease of diffuse cerebral volume within one year.
Figure 2. Brain segmentation image differentiating the white and gray matter, coronal plane image obtained with FreeSurfer.
Figure 3. Lesion load axial slices segmented with MIPAV in the same patient between the resonance from (a) 04-10-2010 and from (b) 14-10-2011 (Brain volumes in Table 1).
Figure 4. 3D reconstruction of the lesion load.
3a 3b

Revista Chilena de Radiología. Vol. 19 Nº 4, año 2013; 156-164.
160
Dr. Jorge Cordovez M, et al.
Figure 5. 3D comparative reconstructions of lesion loads of the same patient in a year of evolution. Red circles indicate areas with increased lesion load.
Figure 6. Graph of the right and left hippocampal volume according to age. Hippocampal volume of patient P7 is specified (see circles).
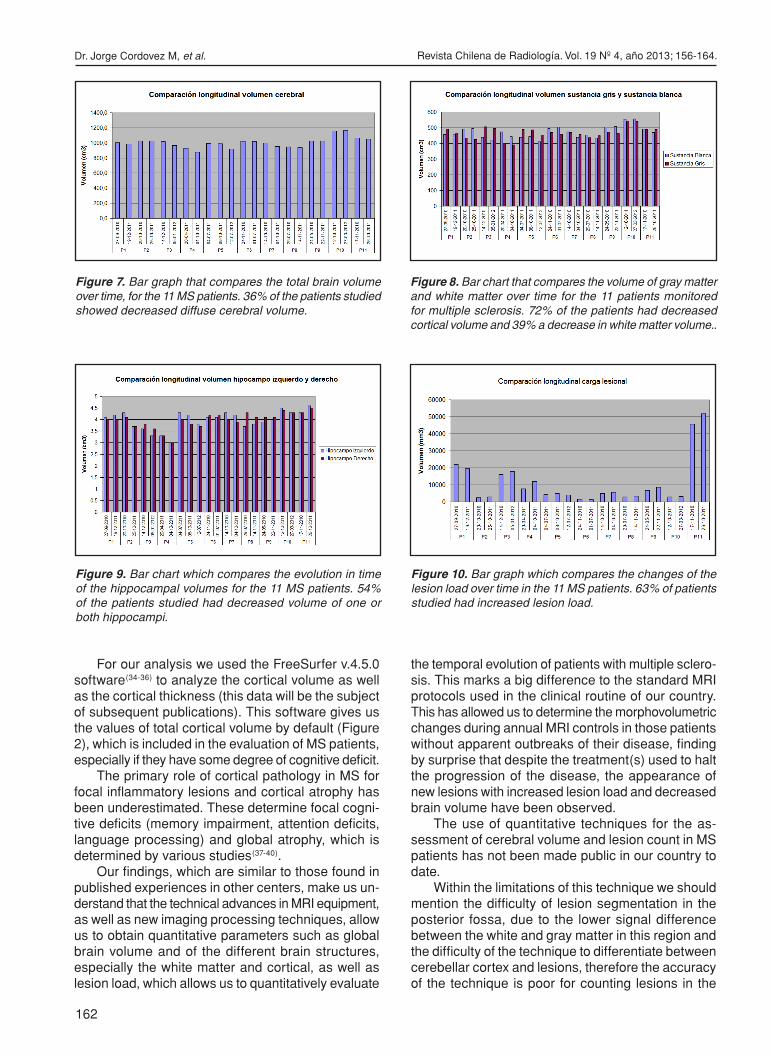
36% of the patients studied had decreased diffuse cerebral volume (Figure 7), but we must differentiate if the white matter or the cerebral cortex is more affected. Volume decrease of the cortical gray mat-ter (72% of the 11 patients) affects a larger number of patients that the reduction in volume of the white matter (39%, Figure 8).
54% of the patients showed a decrease in volume of one or both hippocampi (Figure 9).
The MIPAV study allows us to compare the lesion load in the same patient, which can be visualized in three dimensions (3D). 63% of patients studied had increased lesion load (Figure 10).
DiscussionAtrophy has been suggested as a potential pro-
gression marker for the disease. Serial resonance registration provides a useful alternative to assess brain
atrophy with this technique, since the measurements are sensitive and reproducible, which allows detection of the progressive atrophy within short periods such as, for example, a year of evolution of a disease and may have potential as a marker of disease progression in the monitoring of therapeutic trials. In the study by Fox et al (2006)(26), baseline brain volumes in the MS group were lower v/s the controls, the rate of brain atrophy in the MS group was 0.8% per year, more than twice that of the controls (0.3%). Ventricular growth rate was five times higher than the controls (28), which we viewed in 36% of the cases.
Cognitive impairment is an important clinical event in the evolution of MS, depending on the stage and type of disease, between 45-65% will develop a varia-ble degree of cognitive dysfunction. Pathological and MRI studies have failed to show a strict relationship between cognitive impairment and pathology in the
Revista Chilena de Radiología. Vol. 19 Nº 4, año 2013; 156-164.
161
NEURORRADIOLOGÍA
Absolute volumes
14/10/2010 4/10/2011 Normal values (cc) (cc) (cc)
Total intracranial volume: 1536 1536 normal: 1485,4 DS: 123,4Brain volume: 1001 954 normal: 984,1 DS: 88,0 Left hemisphere white matter volume: 227,8 216,4 normal: 217,2 DS: 19,4Left hemisphere cortical volume: 239,4 227,5 normal: 243,8 DS: 23,6Left hippocampus: 4,3 4,2 normal: 4,2cc DS: 0,4Left amygdala: 1,5 1,5 normal: 1,7 DS: 0,2Left lateral ventricle: 8,4 9,0 normal: 7,1 DS: 2,6 Right hemisphere white matter volume: 245,1 223,0 normal: 219,7 DS: 19,1Right hemisphere cortical volume: 229,2 228,4 normal: 244,6 DS: 24,6Right hippocampus: 4,0 3,9 normal: 4,5cc DS: 0,5Right amygdala: 1,6 1,5 normal: 1,7 DS: 0,2Right lateral ventricle: 10,8 11,3 normal: 6,8 DS: 2,63rd Ventricle: 0,8 0,8 normal: 0,9 DS: 0,1
Relative volumes
14/10/2010 4/10/2011 Normal values
Left hemisphere white matter volume: 0,1483 0,1409 normal: 0,1463 DS: 0,0071Left hemisphere cortical volume: 0,1559 0,1481 normal: 0,1642 DS: 0,0108Left hippocampus: 0,0028 0,0027 normal: 0,0028 DS: 0,0002Left amygdala: 0,0010 0,0010 normal: 0,0012 DS: 0,0001Left lateral ventricle: 0,0054 0,0058 normal: 0,0048 DS: 0,0015 Right hemisphere white matter volume: 0,1596 0,1452 normal: 0,1480 DS: 0,0080Right hemisphere cortical volume: 0,1492 0,1487 normal: 0,1647 DS: 0,0115Right hippocampus: 0,0026 0,0025 normal: 0,0030 DS: 0,0002Right amygdala: 0,0010 0,0010 normal: 0,0011 DS: 0,0001Right lateral ventricle: 0,0071 0,0074 normal: 0,0046 DS: 0,00173rd Ventricle: 0,0005 0,0006 normal: 0,0006 DS: 0,0001
Table I. Monitoring volumes with a year’s difference using FreeSurfer, in a multiple sclerosis patient with RRMS, where volumetric analysis of brain structures is detailed, showing 5% decreased brain volume.
subcortical white matter. The correlation is poorer even when considering the global atrophy (white matter plus cortex).
The gray matter commitment in MS is now widely accepted. Demyelinating lesions are common in the cortex and subcortical regions(28). Subpial demyeli-nating foci can also spread to the cortex. These are probably related to the B-cell infiltration nodes in the overlying meninges(29) and may reflect the action of antimyelin antibodies. The cortical and subcortical
gray matter atrophy is progressive during the course of the disease, which can be attributed to neural dystrophy but in subcortical nuclei, like the thalamus atrophy is associated with neuronal loss(30,31). A signi-ficant negative correlation between average cortical thickness and total volume of white matter lesions has been observed, which gives support to the use of measurement of lesion load and average cortical thickness(32,33). We quantified that 63% presented increased lesion load.
Revista Chilena de Radiología. Vol. 19 Nº 4, año 2013; 156-164.
162
Dr. Jorge Cordovez M, et al.
For our analysis we used the FreeSurfer v.4.5.0 software(34-36) to analyze the cortical volume as well as the cortical thickness (this data will be the subject of subsequent publications). This software gives us the values of total cortical volume by default (Figure 2), which is included in the evaluation of MS patients, especially if they have some degree of cognitive deficit.
The primary role of cortical pathology in MS for focal inflammatory lesions and cortical atrophy has been underestimated. These determine focal cogni-tive deficits (memory impairment, attention deficits, language processing) and global atrophy, which is determined by various studies(37-40).
Our findings, which are similar to those found in published experiences in other centers, make us un-derstand that the technical advances in MRI equipment, as well as new imaging processing techniques, allow us to obtain quantitative parameters such as global brain volume and of the different brain structures, especially the white matter and cortical, as well as lesion load, which allows us to quantitatively evaluate
the temporal evolution of patients with multiple sclero-sis. This marks a big difference to the standard MRI protocols used in the clinical routine of our country. This has allowed us to determine the morphovolumetric changes during annual MRI controls in those patients without apparent outbreaks of their disease, finding by surprise that despite the treatment(s) used to halt the progression of the disease, the appearance of new lesions with increased lesion load and decreased brain volume have been observed.
The use of quantitative techniques for the as-sessment of cerebral volume and lesion count in MS patients has not been made public in our country to date.
Within the limitations of this technique we should mention the difficulty of lesion segmentation in the posterior fossa, due to the lower signal difference between the white and gray matter in this region and the difficulty of the technique to differentiate between cerebellar cortex and lesions, therefore the accuracy of the technique is poor for counting lesions in the
Figure 7. Bar graph that compares the total brain volume over time, for the 11 MS patients. 36% of the patients studied showed decreased diffuse cerebral volume.
Figure 8. Bar chart that compares the volume of gray matter and white matter over time for the 11 patients monitored for multiple sclerosis. 72% of the patients had decreased cortical volume and 39% a decrease in white matter volume..
Figure 10. Bar graph which compares the changes of the lesion load over time in the 11 MS patients. 63% of patients studied had increased lesion load.
Figure 9. Bar chart which compares the evolution in time of the hippocampal volumes for the 11 MS patients. 54% of the patients studied had decreased volume of one or both hippocampi.
Revista Chilena de Radiología. Vol. 19 Nº 4, año 2013; 156-164.
163
NEURORRADIOLOGÍA
posterior fossa, but this limitation does not affect the comparison in the same subject, as the omission of lesions in this region is constant in the different studies of a patient and does not condition a significant lesion load variation, which is determined by the supraten-torial lesions that are of greater volume and number and which are well defined by this technique. It would be interesting to have the correlation of our findings with neuropsychological examinations of the patients studied, as well as the exact correlation of treatment that each of them used and its evolution with them, which will be the subject of further studies.
In summary, brain volumetry together with the automated counting of lesions in MS patients allows longitudinal monitoring of the patients, comparing studies from different dates with multiple parameters in a reproducible and reliable manner. If this is done at an early stage in the course of the disease we can expect to improve the management of this condition, in the hope that new therapies in development are able to stop the course of the disease and achieve substantial improvements in the long-term prognosis, preventing the generation of new lesions and the subsequent cerebral atrophy, which are responsible for the irreversible neurological damage we see today.
Bibliography1. Confavreux C, Vukusic S. Natural history of multiple
sclerosis: a unifying concept. Brain 2006; 129: 606-616.
2. Frohman EM, Goodin DS, Calabresi PA, Corboy JR, Coyle PK, Filippi M. The utility of MRI in suspected MS Report of the Therapeutics and Technology As-sessment Subcommittee of the American Academy of Neurology. Neurology 2003; 61; 602-611.
3. Lucchinetti C, Bruck W, Parisi J, Scheithauer B, Ro-dríguez M, Lassmann H. Heterogeneity of multiple sclerosis lesions: implications for the pathogenesis of demyelination. Ann Neurol 2000; 47: 707-717.
4. McDonald WI, Compston G, Edan G, Goodkin D, Hartung HP, Lublin FD, et al. Recommended diag-nostic criteria for multiple sclerosis: guidelines from the International Panel on the Diagnosis of Multiple Sclerosis. Ann Neurol 2001; 50: 121-127.
5. Lee MA, Smith S, Palace J, Narayanan S, Silver N, Minicucci L, et al. Spatial mapping of T2 and gadolinium-enhancing T1 lesion volumes in multiple sclerosis: evidence for distinct mechanisms of lesion genesis? Brain 1999; 122: 1261-1270.
6. Lycklama à Nijeholt G, Barkhof F. Differences between subgroups of MS: MRI findings and correlation with histopathology. J Neurol Sci 2003; 206: 173-174.
7. Smith ME, Stone LA, Albert PS, Frank JA, Martin R, Armstrong M, Maloni H, et al. Clinical worsening in multiple sclerosis is associated with increased frequency and area of gadopentetate dimeglumine-enhancing magnetic resonance imaging lesions. Ann Neurol 1993; 33: 480-489.
8. Arnold DL, Matthews PM. MRI in the diagnosis and management of multiple sclerosis. Neurology 2002; 58: S23-S31.
9. Smith SM, Jenkinson M, Woolrich MW, Beckmann CF, Behrens TEJ, Johansen-Berg H, et al. Advances in functional and structural MR image analysis and implementation as FSL. NeuroImage 2004; 23(S1): 208-219.
10. Friston K. Introduction: experimental design and statistical parametric mapping. In Frackowiak et al. (Eds.) Human brain function, 2nd Edition, 2003.
11. Liu L, Meier D, Polgar-Turcsanyi M, et al. Multiple sclerosis medical image analysis and information management. J Neuroimaging 2005; 15(4 Suppl): 103S-117S.
12. Hill DLG, Batchelor PG, Holden M, Hawkes DJ. Medical image registration. Phys Med Biol 2001; 46: R1-R45.
13. Fox NC, Freeborough PA. Brain atrophy progression measured from registered serial MRI: Validation and application to Alzheimer’s disease. J Magn Reson Imaging. 1997; 7: 1069-1075.
14. Filippi M, Horsfield MA, Adèr HJ, Barkhof F, Bruzzi P, Evans A, et al. Guidelines for using quantitative measures of brain magnetic resonance imaging abnormalities in monitoring the treatment of multiple sclerosis. Ann Neurol 1998; 43: 499-506.
15. Tomassini V, Paolillo A, Russo P, Giugni E, Prosperini L, Gasperini. C. Predictors of long-term clinical res-ponse to interferon beta therapy in relapsing multiple sclerosis. J Neurol 2006; 253: 287-293.
16. Grimaud J, Lai M, Thorpe J, Adeleine P, Wang L, Barker GJ, et al. Quantification of MRI lesion load in multiple sclerosis: a comparison of three computer-assisted techniques. Magn Reson Imaging 1996; 14: 495-505.
17. Raff U, Vargas PF, Rojas GM, Scherzinger AL, Simon JH. Quantitation of T2 Lesion Load in Multiple Sclerosis with Magnetic Resonance Imaging: A Pilot Study of a Probabilistic Neural Network Approach. Acad Radiol 1997; 4: 431-437.
18. Raff U, Rojas GM, Hutchinson M, Simon JH. Quantitation of T2 Lesion Load in Patients with Multple Sclerosis: A Novel Semiautomated Segmented Technique. Acad Radiol 2000; 7: 237-247
19. Horsfield MA, Bakshi R, Rovaris M, Rocca MA, Dan-damudi VS, Valsasina P, et al. Incorporating domain knowledge into the fuzzy connectedness framework: Application to brain lesion volume estimation in multiple sclerosis. IEEE Trans Med Imaging 2007; 26: 1670-1680.
20. Arnold DL, Arbel T. Medical Image Analysis on Multi-ple Sclerosis: validation and methodological issues. MICCAI Workshop on. Med. Imag. Analysis on Multiple Sclerosis, 2009; 15-26.
21. Shiee N, Bazin PL, Ozturk A, Reich DS, Calabresi PA, Pham DL. A topology-preserving approach to the segmentation of brain images with multiple sclerosis lesions. Neuroimage 2010; 49: 1524-1535.
22. Fisher E, Rudick RA, Simon JH, Cutter G, Baier M, Lee JC, et al. Eight-year follow-up study of brain atrophy in patients with MS. Neurology 2002; 59: 1412-1420.
23. Smith SM, Zhang YY, Jenkinson M, Chen J, Matthews PM, Federico A, et al. Accurate, robust, and automated longitudinal and cross-sectional brain change analysis. Neuroimage 2002; 17: 479-489.
24. Freeborough PA, Fox NC. Modeling brain deformations in Alzheimer disease by fluid registration of serial 3D MR images. J Comput Assist Tomogr 1998; 22: 838-843.

Revista Chilena de Radiología. Vol. 19 Nº 4, año 2013; 156-164.
164
Dr. Jorge Cordovez M, et al.
25. Collins DL, Neelin P, Peters TM, Evans AC. Automatic 3D intersubject registration of MR volumetric data in standardized Talairach space. J Comput Assist Tomogr 1994; 18:192-205.
26. Talairach J, Tournoux P. Co-planar Stereotaxic Atlas of the Human Brain: 3-Dimensional Proportional System: An Approach to Medical Cerebral Imaging. Stuttgart: Thieme Medical Publishers; 1988t. 122 pp.
27. Fox NC, Jenkins R, Leary SM, Stevenson VL, Losseff NA, Crum WR, et al. Progressive cerebral atrophy in MS - a serial study using registered, volumetric MRI. Neurology 2000; 54: 807-812.
28. Wegner C, Esiri MM, Chance SA, Palace J, Matthews PM. Neocortical neuronal, synaptic, and glial loss in multiple sclerosis. Neurology 2006; 67: 960-967.
29. Magliozzi R, Howell O, Vora A, Serafini B, Nicholas R, Puopolo M, et al. Meningeal Bcell follicles in se-condary progressive multiple sclerosis associate with early onset of disease and severe cortical pathology. Brain 2007; 130: 1089-1104.
30. Chen JT, Narayanan S, Collins DL, Smith SM, Matthews PM, Arnold DL. Relating neocortical pathology to disability progression in multiple sclerosis using MRI. Neuroimage 2004; 23: 1168-1175.
31 Cifelli A, Arridge M, Jezzard P, Esiri MM, Palace J, Matthews PM. Thalamic neurodegeneration in multiple sclerosis. Ann Neurol 2002; 52: 650-653.
32. Dickerson BC, Fenstermacher E, Salat DH, Wolk DA, Maguire RP, Desikan R, et al. Detection of cortical thickness correlates of cognitive performance: Relia-bility across MRI scan sessions, scanners, and field strengths. Neuroimage 2008; 39: 10-18.
33. Charil A, Dagher A, Lerch JP, Zijdenbos AP, Worsley KJ, Evans AC. Focal cortical atrophy in multiple sclero-sis: Relation to lesion load and disability. Neuroimage 2007; 34: 509-517.
34. Dale AM, Fischl B, Sereno MI. Cortical surface-based analysis. I. Segmentation and surface reconstruction. Neuroimage 1999; 9: 179-194.
35. Fischl B, Sereno MI, Dale AM. Cortical surface-based analysis. II: inflation, flattening, and a surface-based coordinate system. Neuroimage 1999; 9: 195–207.
36. Fischl B, Dale AM. Measuring the thickness of the human cerebral cortex from magnetic resonance ima-ges. Proc Natl Acad Sci USA 2000; 97: 11050-11055. Freesurfer (http://surfer.nmr.mgh-harvard.edu/)
37. Ramasamy DP, Benedict RH, Cox JL, Fritz D, Ab-delrahman N, Hussein S, et al. Extent of cerebellum, subcortical and cortical atrophy in patients with MS. A case-control study. J Neurol Sci 2009; 282: 47-54.
38. Calabrese M, Rinaldi F, Grossi P, Gallo P. Cortical pathology and cognitive impairment in multiple scle-rosis. Expert Rev Neurother 2011; 11: 425-432.
39. Grassiot B, Desgranges B, Eustache F, Defer G. Quantification and clinical relevance of brain atrophy in multiple sclerosis: a review. J Neurol 2009; 256: 1397-1412.
40. Matthews PM. Brain Imaging of Multiple Sclerosis: the Next 10 Years. Neuroimaging Clin N Am 2009; 19: 101-112.
41. Shiee N, Bazin PL, Zackowski KM, Farrell SK, Harrison DM. Revisiting Brain Atrophy and Its Relationship to Disability in Multiple Sclerosis. PLoS One. 2012; 7(5): e37049.