DQO Implementation Process: Flow Chart and Wall Charts
39
1 of 39 DQO Implementation Process: Flow Chart and Wall Charts 30 minutes DQO Training Course Day 2 Module 8 Presenter: Sebastian Tindall
-
Upload
tate-dennis -
Category
Documents
-
view
39 -
download
0
description
DQO Training Course Day 2 Module 8. DQO Implementation Process: Flow Chart and Wall Charts. Presenter: Sebastian Tindall. 30 minutes. Key Points. The flow chart illustrates how to integrate a systematic planning process for decision making into an environmental program - PowerPoint PPT Presentation
Transcript of DQO Implementation Process: Flow Chart and Wall Charts
1 of 39
DQO Implementation Process:Flow Chart and Wall Charts
30 minutes
DQO Training CourseDay 2
Module 8
Presenter: Sebastian Tindall

2 of 39
Key Points The flow chart illustrates how to integrate
a systematic planning process for decision making into an environmental program
Getting decision-makers involved both early and often in the process is a pivotal element of the DQO Process
Use the DQO e-Workbook to document the process
Use SCA and VSP to ensure defensibility
3 of 39
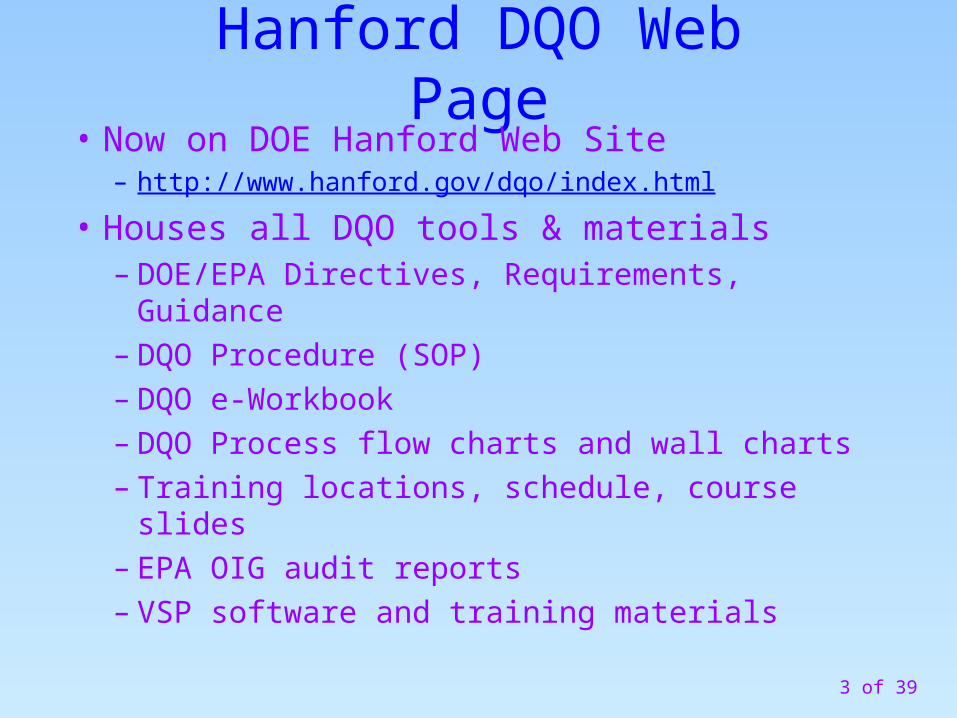
Hanford DQO Web Page• Now on DOE Hanford Web Site
– http://www.hanford.gov/dqo/index.html
• Houses all DQO tools & materials– DOE/EPA Directives, Requirements, Guidance– DQO Procedure (SOP)– DQO e-Workbook – DQO Process flow charts and wall charts– Training locations, schedule, course slides– EPA OIG audit reports– VSP software and training materials
4 of 39
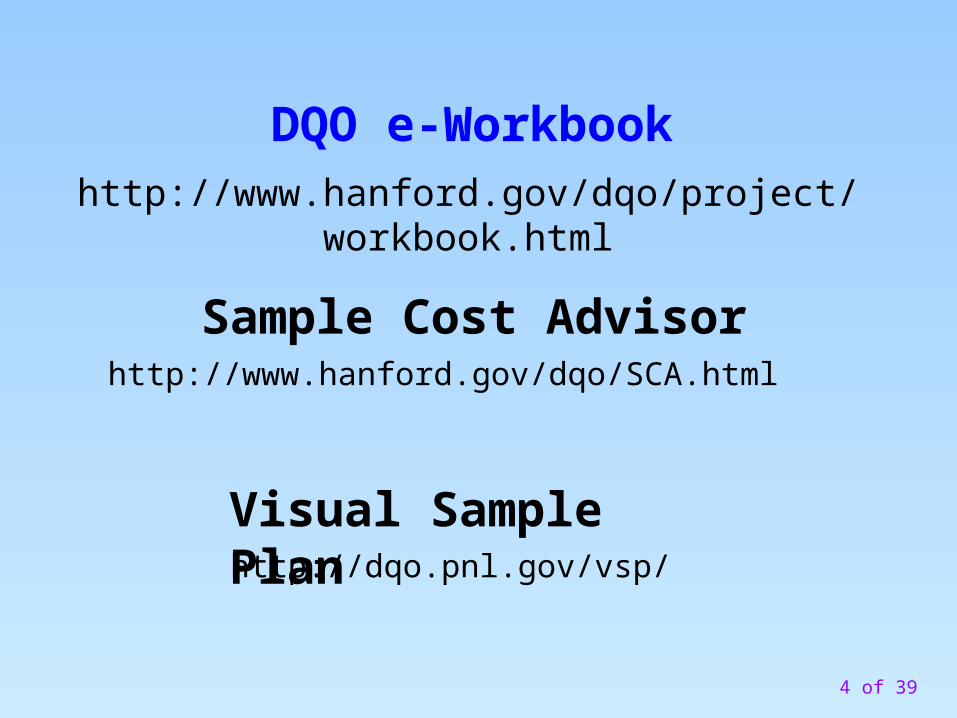
DQO e-Workbookhttp://www.hanford.gov/dqo/project/workbook.html
http://www.hanford.gov/dqo/SCA.html
Sample Cost Advisor
Visual Sample Planhttp://dqo.pnl.gov/vsp/
5 of 39
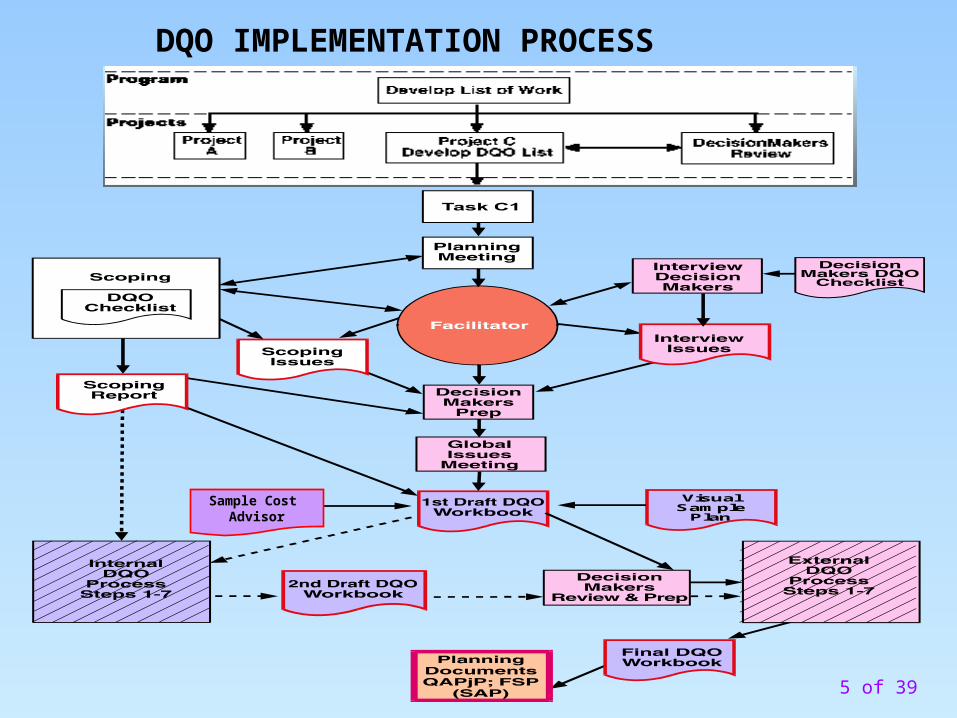
DQO IMPLEMENTATION PROCESS
VisualSample
Plan
StatisticalCost Spread
Sheet
Sample Cost Advisor
6 of 39
VisualSample
Plan
StatisticalCost Spread
Sheet
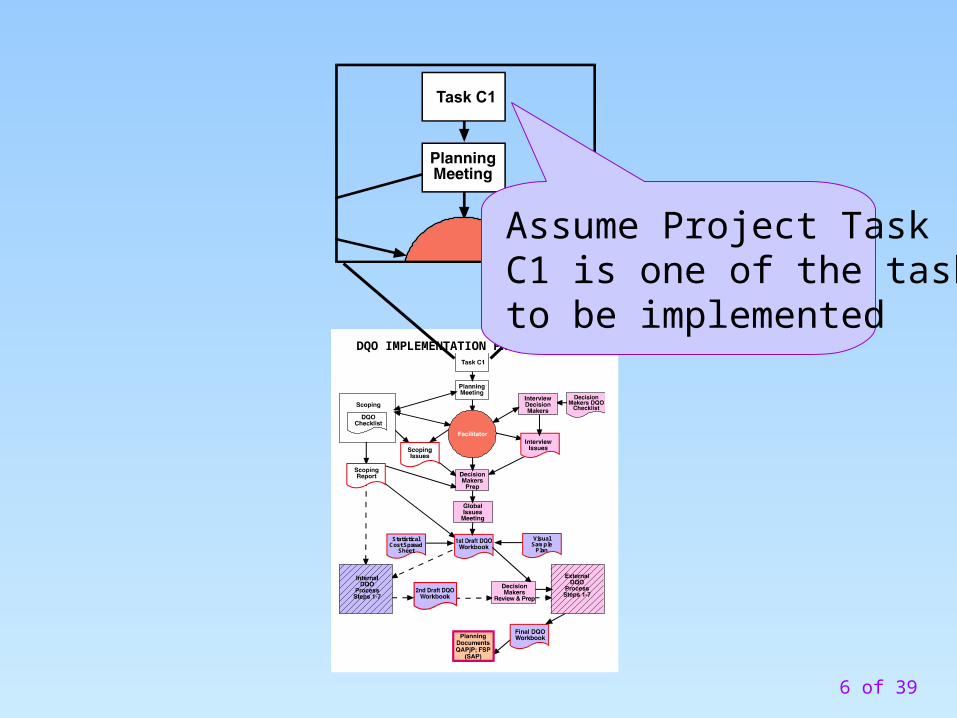
DQO IMPLEMENTATION PROCESS
Assume Project Task C1 is one of the tasks to be implemented
7 of 39
VisualSample
Plan
StatisticalCost Spread
Sheet
STATE DQO IMPLEMENTATION PROCESS
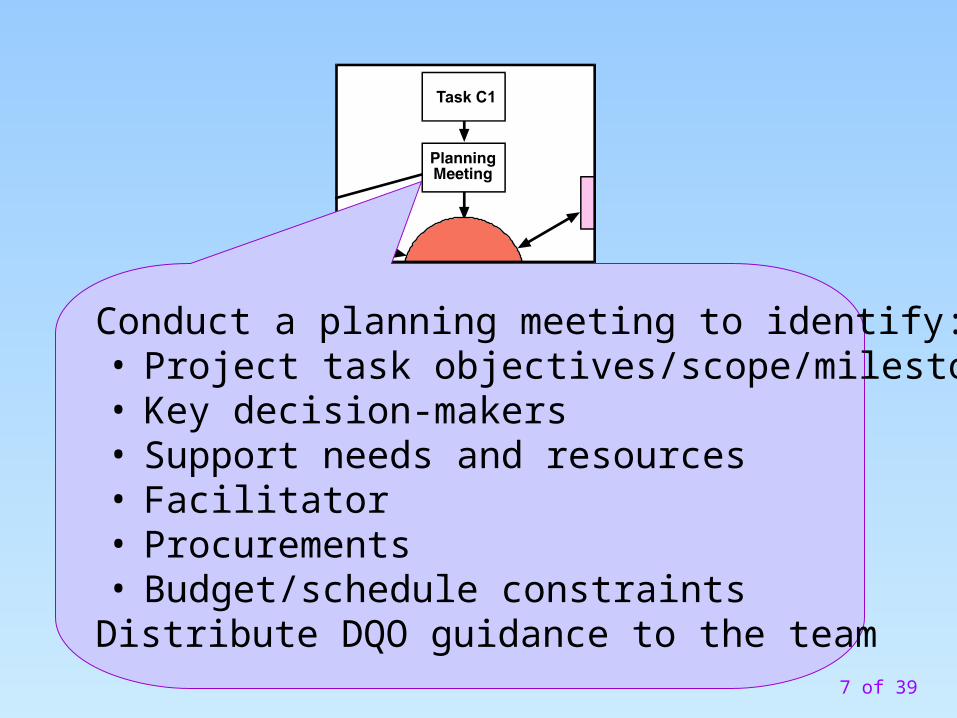
Conduct a planning meeting to identify:• Project task objectives/scope/milestones• Key decision-makers• Support needs and resources• Facilitator• Procurements• Budget/schedule constraints
Distribute DQO guidance to the team
8 of 39
VisualSample
Plan
StatisticalCost Spread
Sheet
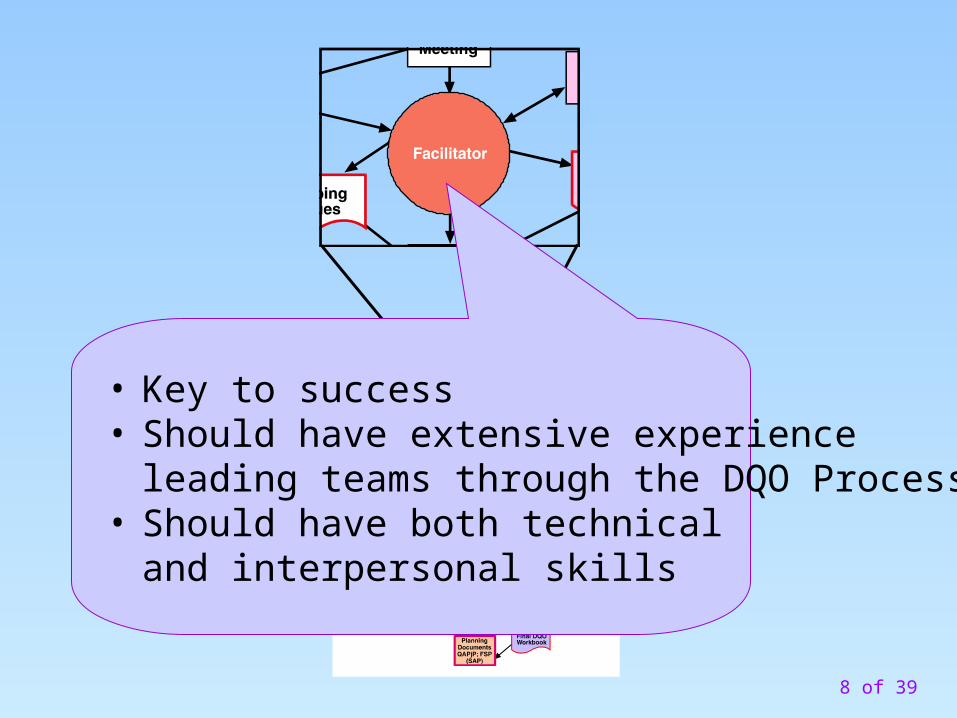
STATE DQO IMPLEMENTATION PROCESS
• Key to success• Should have extensive experience
leading teams through the DQO Process• Should have both technical
and interpersonal skills
9 of 39
VisualSample
Plan
StatisticalCost Spread
Sheet
STATE DQO IMPLEMENTATION PROCESS
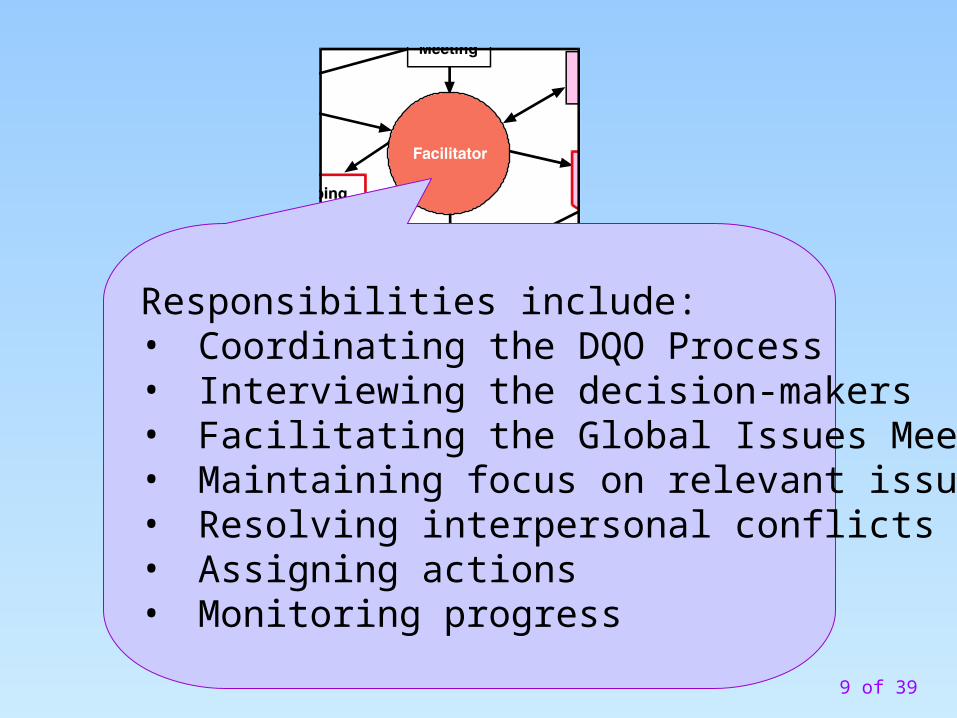
Responsibilities include:• Coordinating the DQO Process• Interviewing the decision-makers• Facilitating the Global Issues Meeting • Maintaining focus on relevant issues• Resolving interpersonal conflicts• Assigning actions• Monitoring progress

10 of 39
VisualSample
Plan
StatisticalCost Spread
Sheet
STATE DQO IMPLEMENTATION PROCESS
Project DQO Team:Key Technical Staff with background in:
• Chemistry• Hydrogeology• Statistics• Health & Safety • Data Management • Waste Management• Etc.
11 of 39
VisualSample
Plan
StatisticalCost Spread
Sheet
STATE DQO IMPLEMENTATION PROCESS
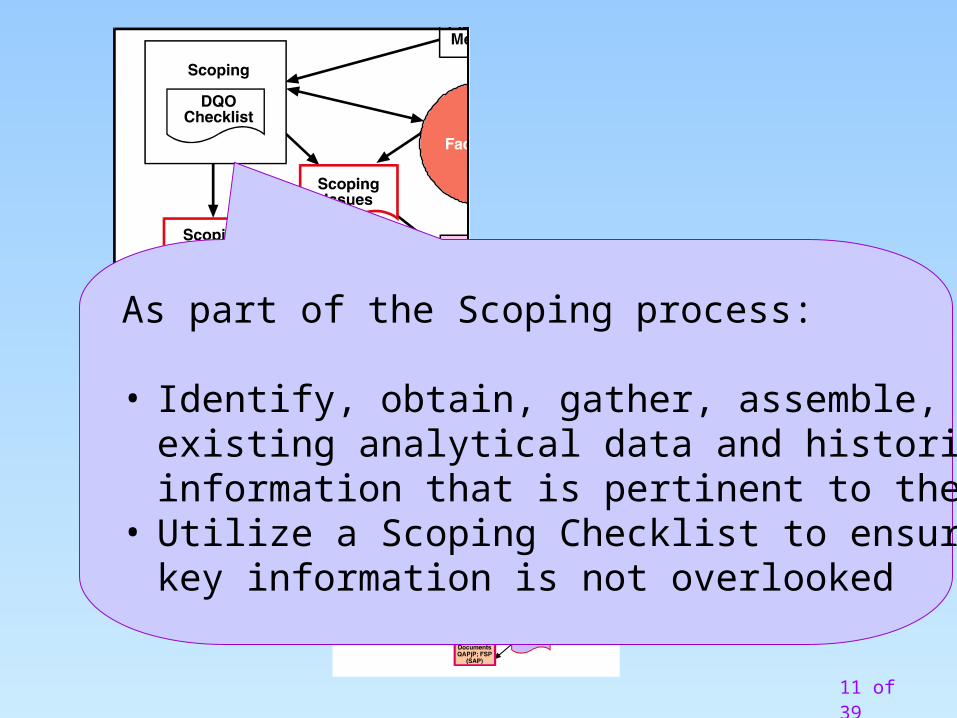
As part of the Scoping process:
• Identify, obtain, gather, assemble, and review allexisting analytical data and historicalinformation that is pertinent to the project task
• Utilize a Scoping Checklist to ensure thatkey information is not overlooked
12 of 39
VisualSample
Plan
StatisticalCost Spread
Sheet
STATE DQO IMPLEMENTATION PROCESS
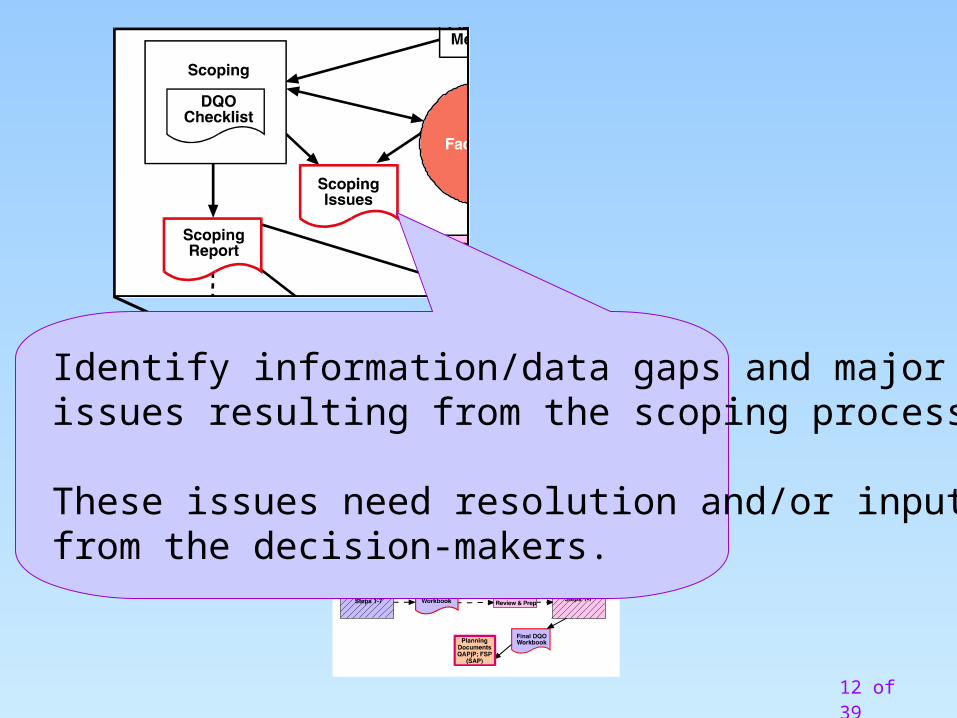
Identify information/data gaps and major issues resulting from the scoping process.
These issues need resolution and/or input from the decision-makers.
13 of 39
VisualSample
Plan
StatisticalCost Spread
Sheet
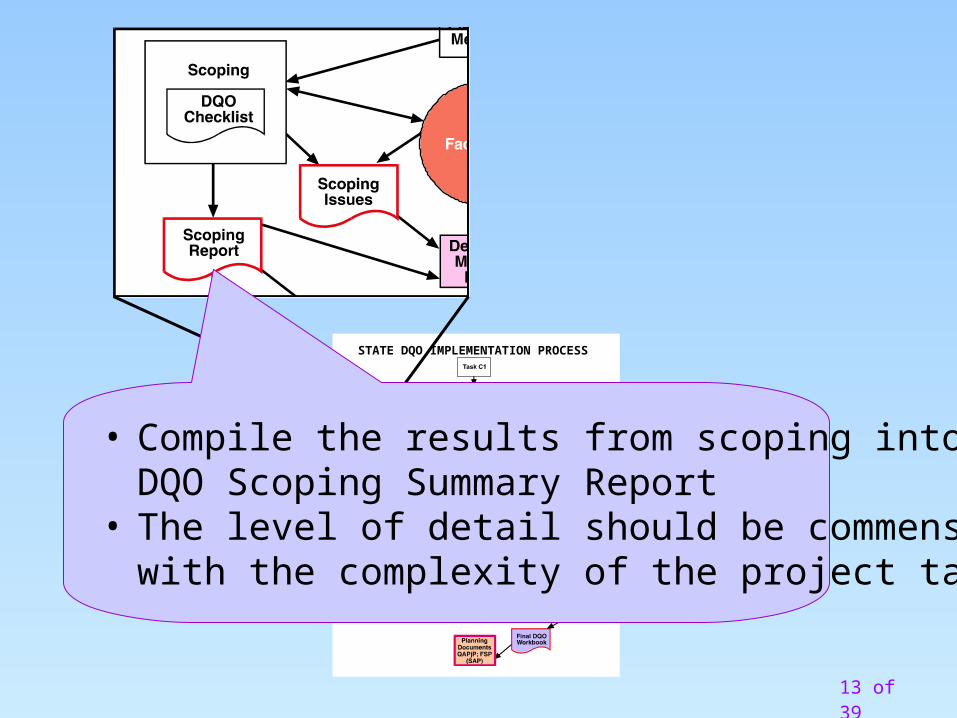
STATE DQO IMPLEMENTATION PROCESS
• Compile the results from scoping into aDQO Scoping Summary Report
• The level of detail should be commensuratewith the complexity of the project task
14 of 39
VisualSample
Plan
StatisticalCost Spread
Sheet
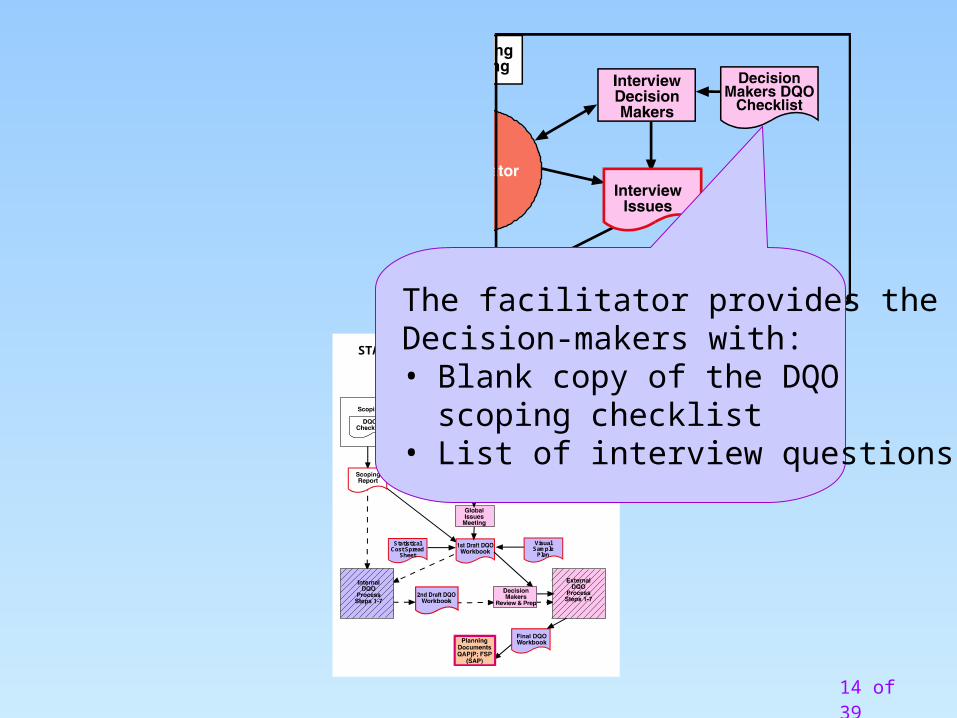
STATE DQO IMPLEMENTATION PROCESS
The facilitator provides theDecision-makers with:• Blank copy of the DQO
scoping checklist• List of interview questions
15 of 39
VisualSample
Plan
StatisticalCost Spread
Sheet
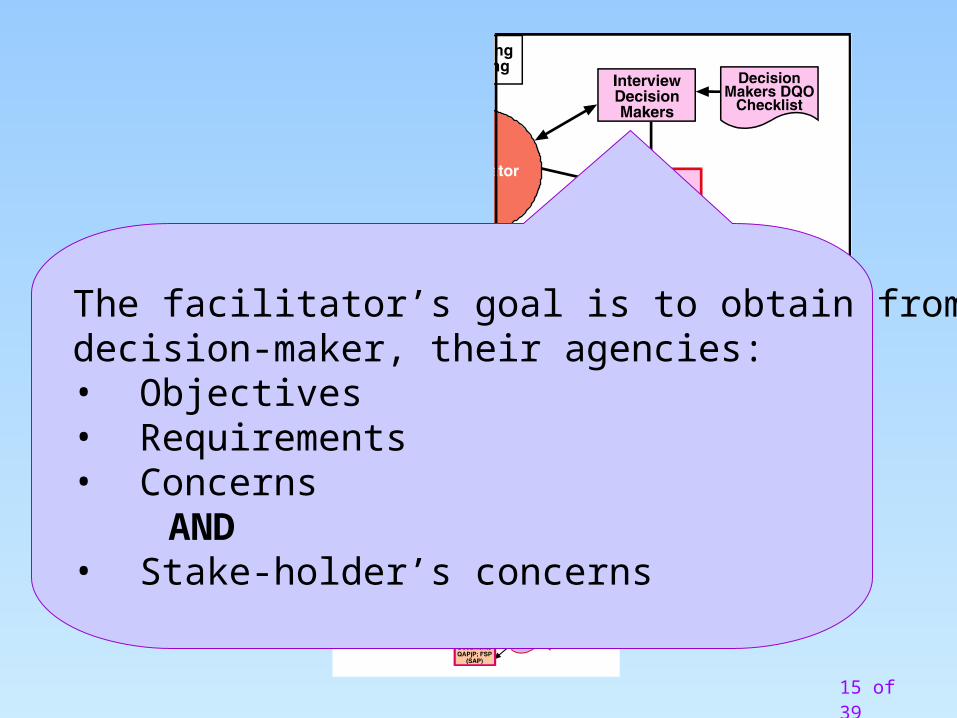
STATE DQO IMPLEMENTATION PROCESS
The facilitator’s goal is to obtain from each decision-maker, their agencies:• Objectives• Requirements• Concerns AND• Stake-holder’s concerns
16 of 39
VisualSample
Plan
StatisticalCost Spread
Sheet
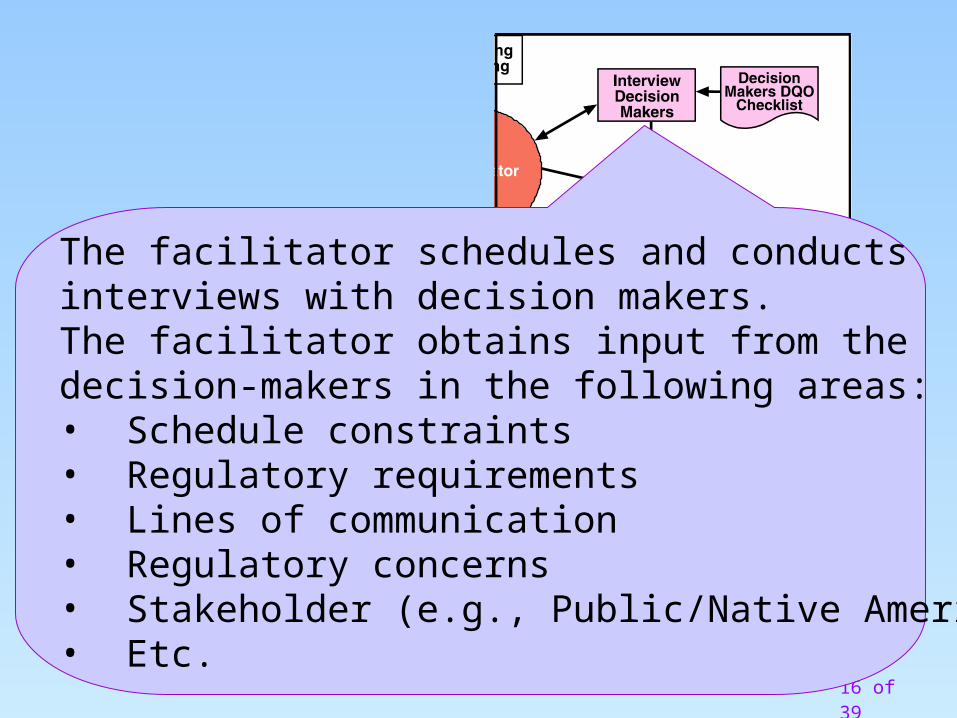
STATE DQO IMPLEMENTATION PROCESS
The facilitator schedules and conducts interviews with decision makers.The facilitator obtains input from the decision-makers in the following areas:• Schedule constraints• Regulatory requirements• Lines of communication• Regulatory concerns• Stakeholder (e.g., Public/Native American) concerns• Etc.
17 of 39
VisualSample
Plan
StatisticalCost Spread
Sheet
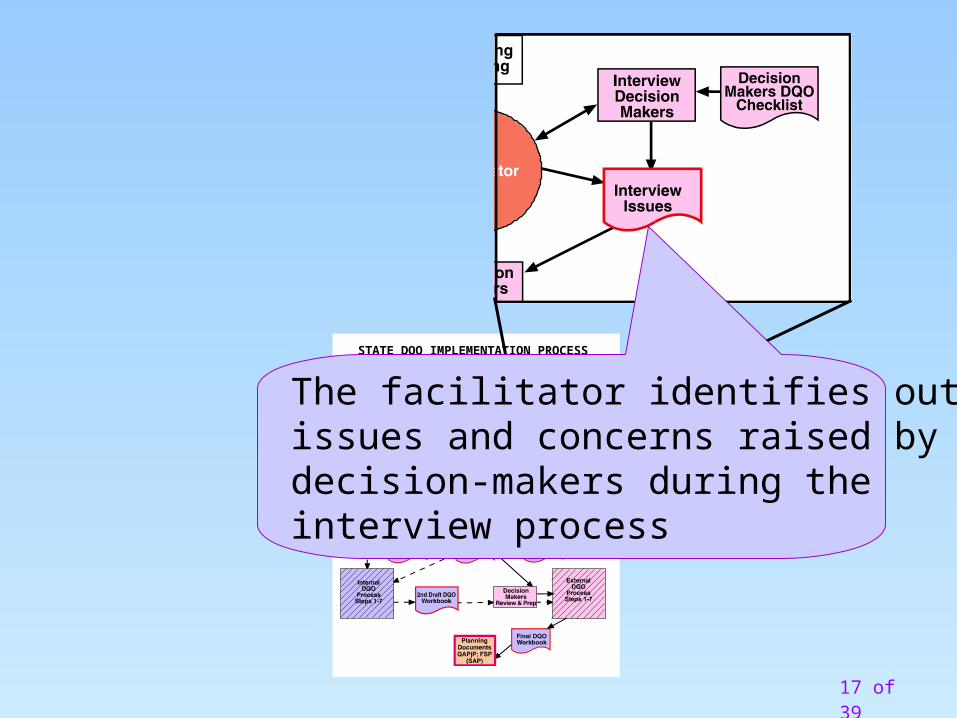
STATE DQO IMPLEMENTATION PROCESS
The facilitator identifies outstanding issues and concerns raised by thedecision-makers during the interview process
18 of 39
VisualSample
Plan
StatisticalCost Spread
Sheet
STATE DQO IMPLEMENTATION PROCESS
Vtistical
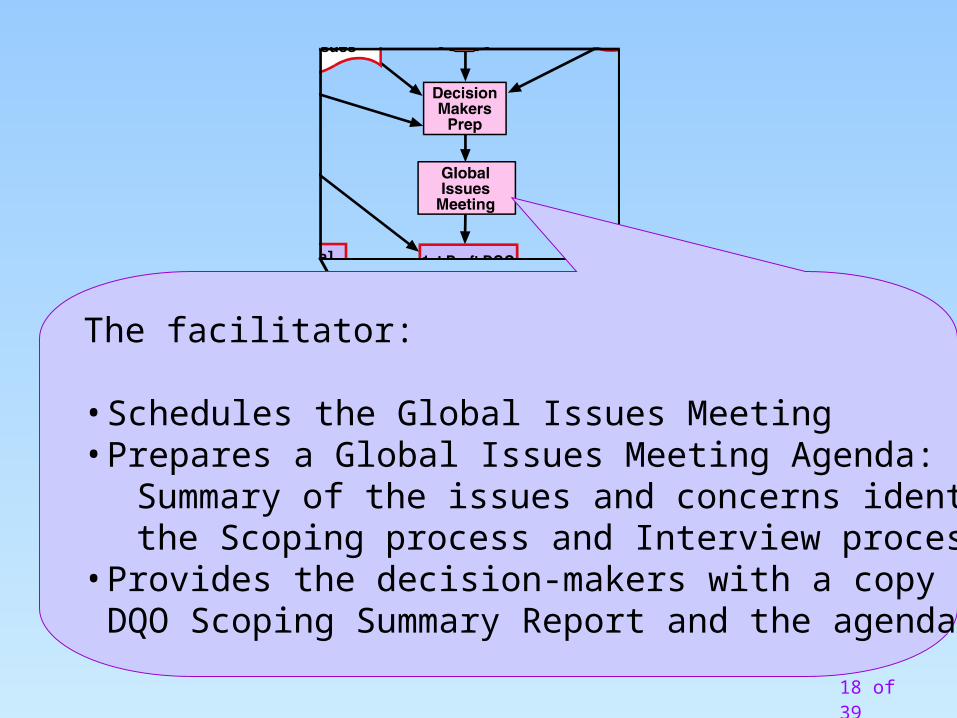
The facilitator:
• Schedules the Global Issues Meeting• Prepares a Global Issues Meeting Agenda:
Summary of the issues and concerns identified during the Scoping process and Interview process
• Provides the decision-makers with a copy of theDQO Scoping Summary Report and the agenda

19 of 39
VisualSample
Plan
StatisticalCost Spread
Sheet
STATE DQO IMPLEMENTATION PROCESS
Vtistical
The facilitator conducts the Global Issues Meeting for the purpose of addressing all unresolved issues.Attended by:• Facilitator• Decision-makers• Key technical staffMeeting minutes are prepared to document the issue resolutions and action items.
20 of 39
VisualSample
Plan
StatisticalCost Spread
Sheet
STATE DQO IMPLEMENTATION PROCESS
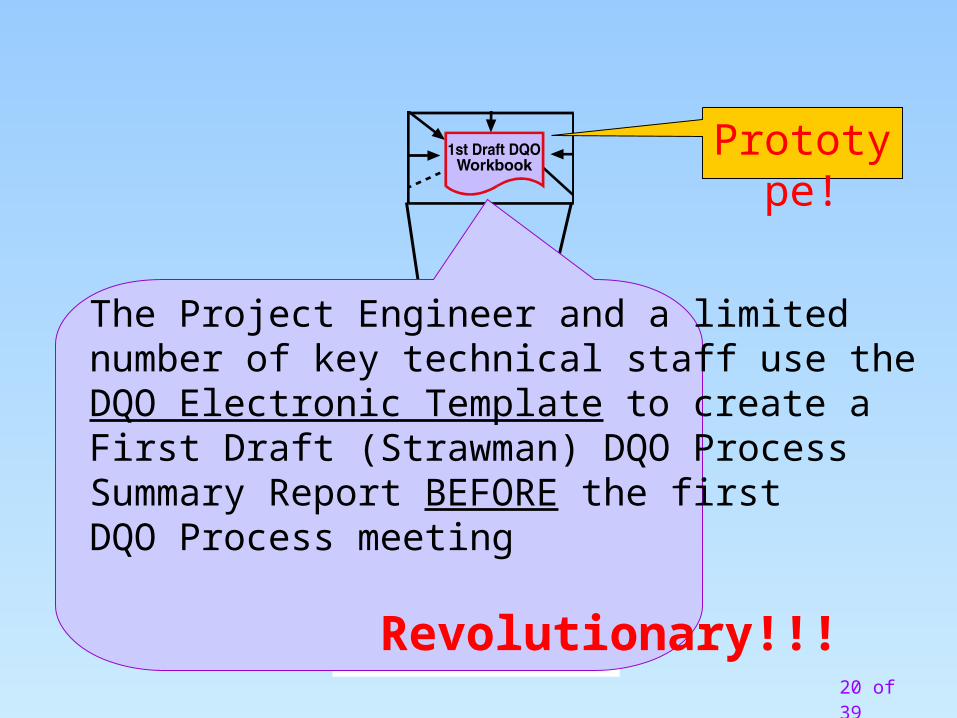
The Project Engineer and a limited number of key technical staff use the DQO Electronic Template to create a First Draft (Strawman) DQO ProcessSummary Report BEFORE the first DQO Process meeting
Revolutionary!!!
Prototype!
21 of 39
Show DQO e-Workbook (Electronic Template)
Now available to download and install from the DOE Hanford DQO Web Site:
http://www.hanford.gov/dqo/project/workbook.html
22 of 39
VisualSample
Plan
StatisticalCost Spread
Sheet
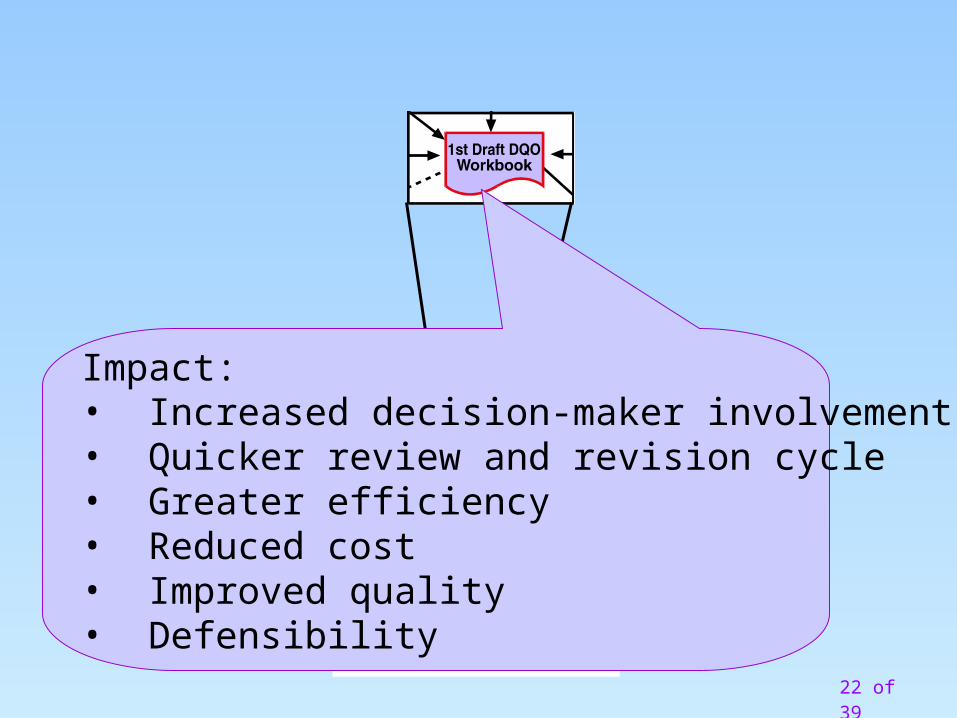
STATE DQO IMPLEMENTATION PROCESS
Impact:• Increased decision-maker involvement• Quicker review and revision cycle• Greater efficiency• Reduced cost• Improved quality• Defensibility
23 of 39
VisualSample
Plan
StatisticalCost Spread
Sheet
STATE DQO IMPLEMENTATION PROCESS
StatisticalCost Spread
Sheet
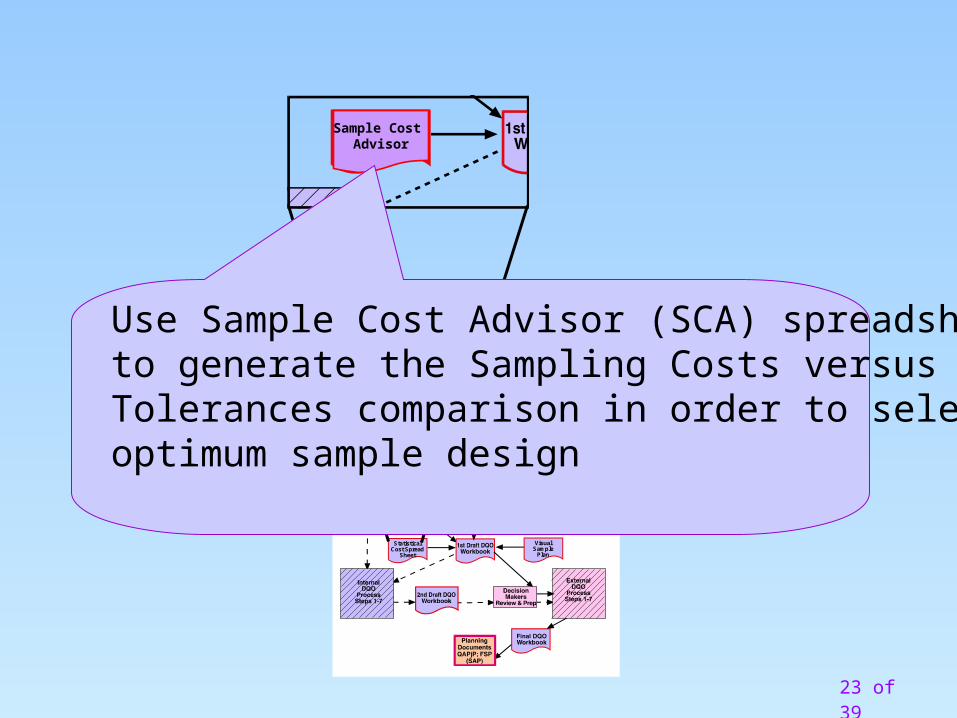
Sample Cost Advisor
Use Sample Cost Advisor (SCA) spreadsheet(s)to generate the Sampling Costs versus Error Tolerances comparison in order to select the optimum sample design
24 of 39
VisualSample
Plan
StatisticalCost Spread
Sheet
STATE DQO IMPLEMENTATION PROCESS
StatisticalCost Spread
Sheet
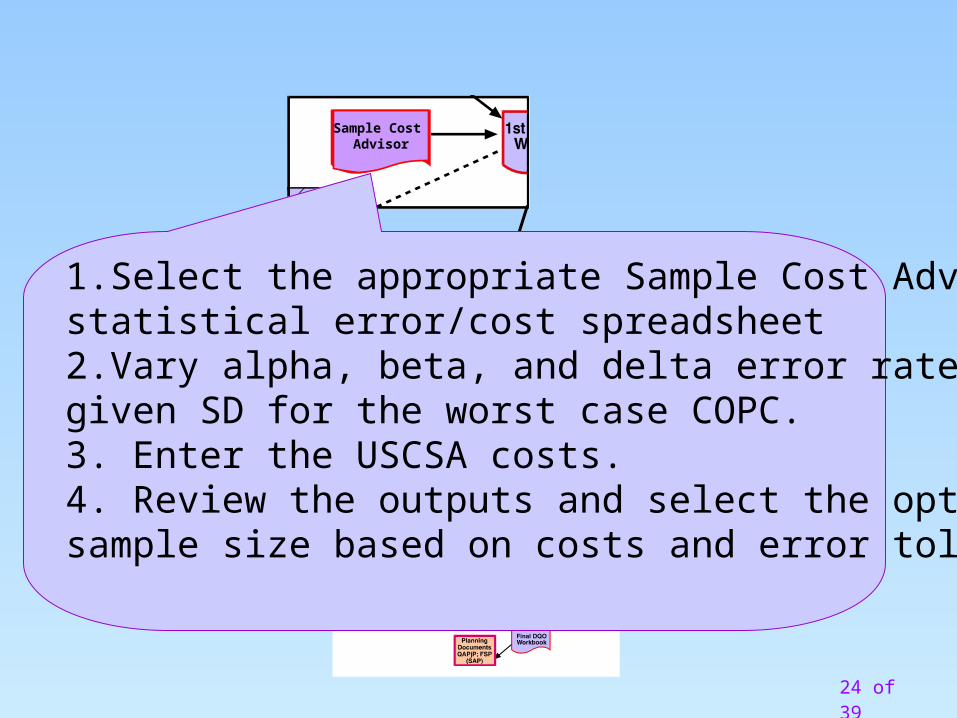
Sample Cost Advisor
1.Select the appropriate Sample Cost Advisor (SCA) statistical error/cost spreadsheet2.Vary alpha, beta, and delta error rates for agiven SD for the worst case COPC.3. Enter the USCSA costs.4. Review the outputs and select the optimumsample size based on costs and error tolerances.
25 of 39
VisualSample
Plan
StatisticalCost Spread
Sheet
STATE DQO IMPLEMENTATION PROCESS
StatisticalCost Spread
Sheet
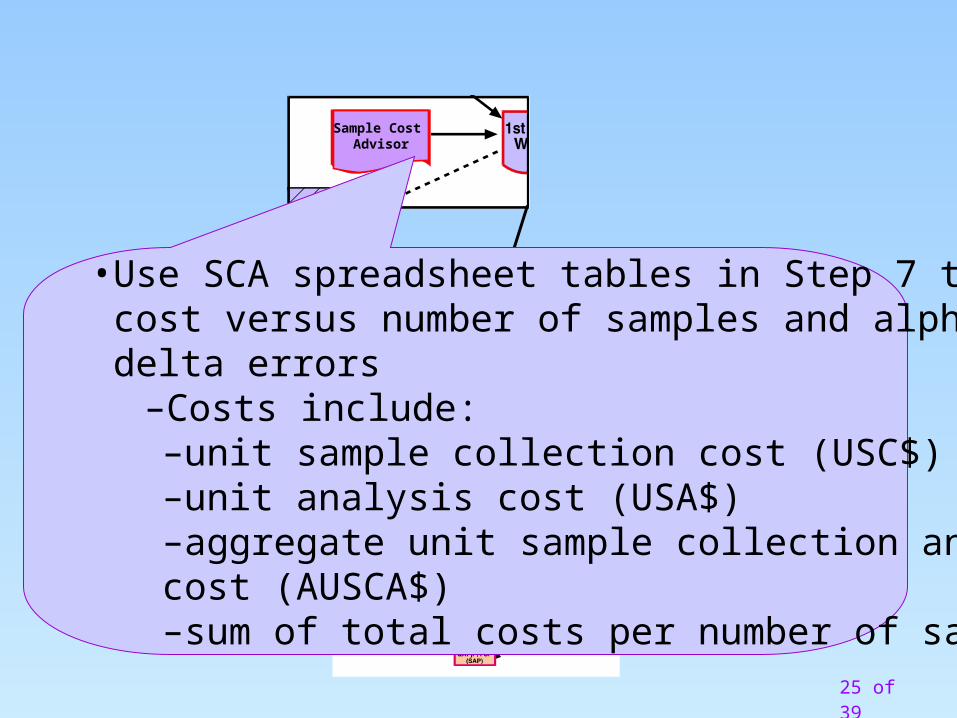
Sample Cost Advisor
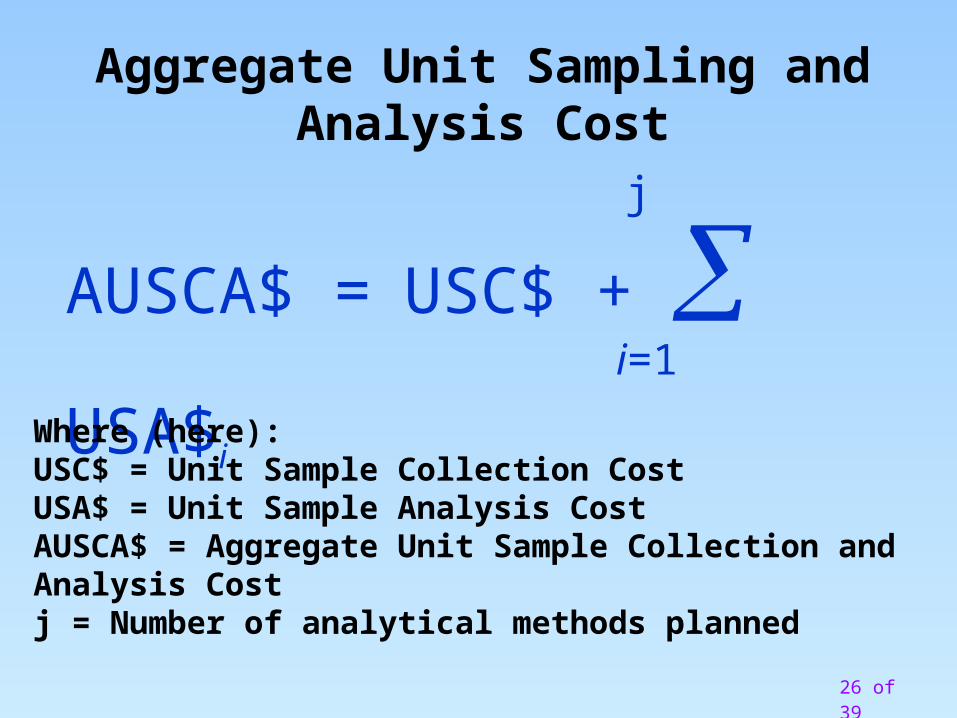
•Use SCA spreadsheet tables in Step 7 to summarize cost versus number of samples and alpha, beta, & delta errors
–Costs include:–unit sample collection cost (USC$)–unit analysis cost (USA$)–aggregate unit sample collection and analysiscost (AUSCA$)–sum of total costs per number of samples
26 of 39
AUSCA$ = USC$ + USA$i Where (here):USC$ = Unit Sample Collection CostUSA$ = Unit Sample Analysis CostAUSCA$ = Aggregate Unit Sample Collection and Analysis Costj = Number of analytical methods planned
Aggregate Unit Sampling and Analysis Cost
i=1
j
27 of 39
SHOW SCA EXCEL File
28 of 39
VisualSample
Plan
StatisticalCost Spread
Sheet
STATE DQO IMPLEMENTATION PROCESS
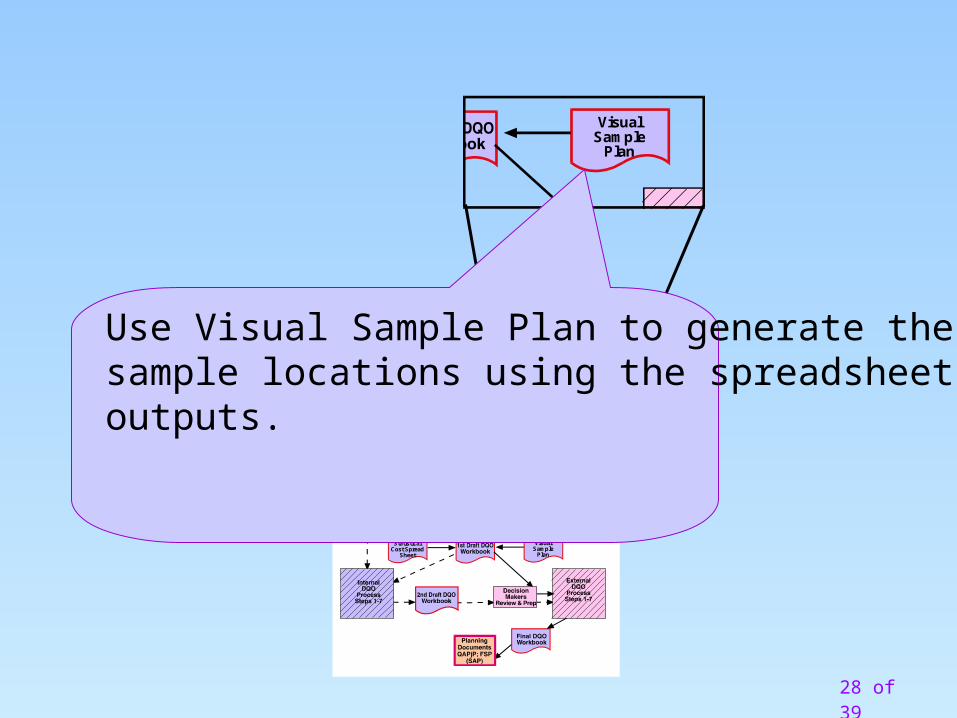
VisualSample
Plan
Use Visual Sample Plan to generate the sample locations using the spreadsheetoutputs.
29 of 39
VisualSample
Plan
StatisticalCost Spread
Sheet
STATE DQO IMPLEMENTATION PROCESS
VisualSample
Plan
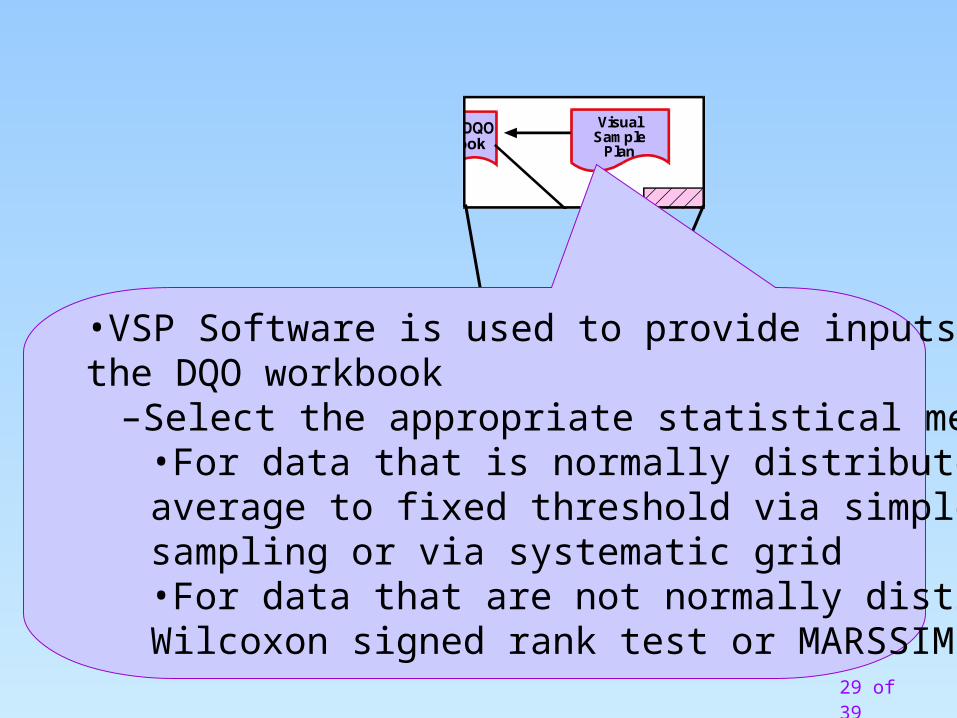
•VSP Software is used to provide inputs to Step 7 in the DQO workbook
–Select the appropriate statistical method, for example:•For data that is normally distributed compared average to fixed threshold via simple random sampling or via systematic grid•For data that are not normally distributed may use Wilcoxon signed rank test or MARSSIM sign test
30 of 39
VisualSample
Plan
StatisticalCost Spread
Sheet
STATE DQO IMPLEMENTATION PROCESS
VisualSample
Plan
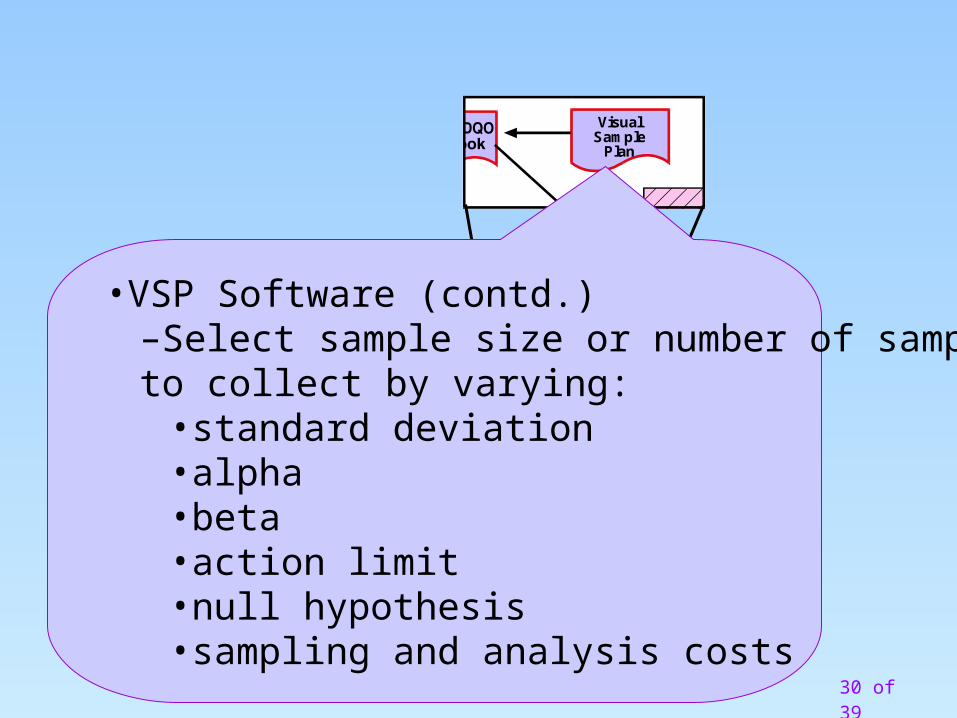
•VSP Software (contd.) –Select sample size or number of samples to collect by varying:
•standard deviation•alpha•beta•action limit•null hypothesis•sampling and analysis costs
31 of 39
VisualSample
Plan
StatisticalCost Spread
Sheet
STATE DQO IMPLEMENTATION PROCESS
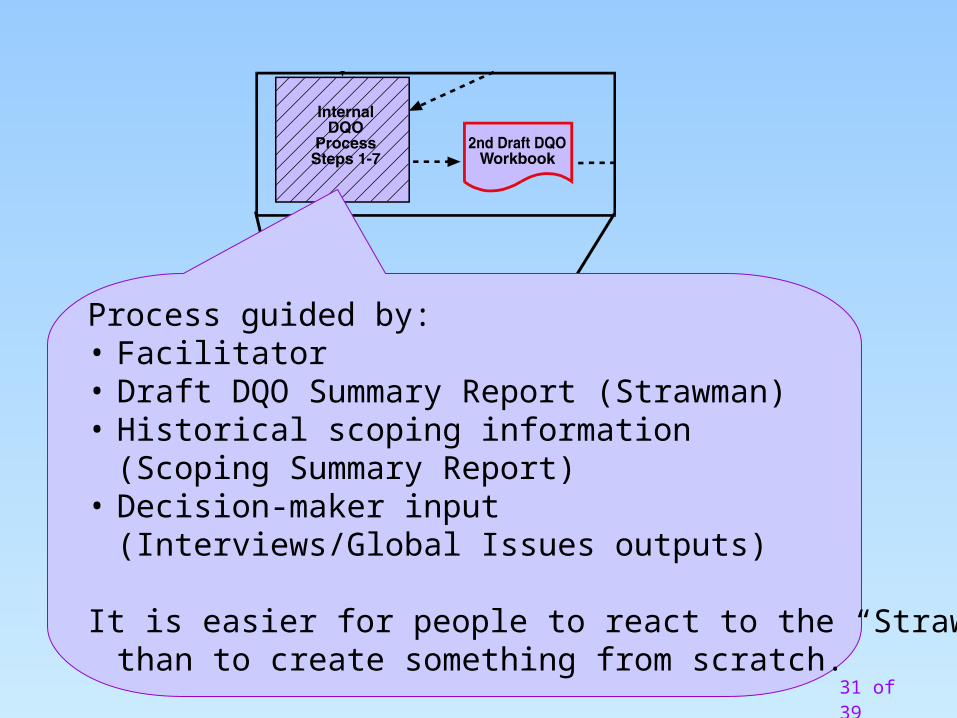
Process guided by:• Facilitator• Draft DQO Summary Report (Strawman)• Historical scoping information
(Scoping Summary Report)• Decision-maker input
(Interviews/Global Issues outputs)
It is easier for people to react to the “Strawman” than to create something from scratch.
32 of 39
VisualSample
Plan
StatisticalCost Spread
Sheet
STATE DQO IMPLEMENTATION PROCESS
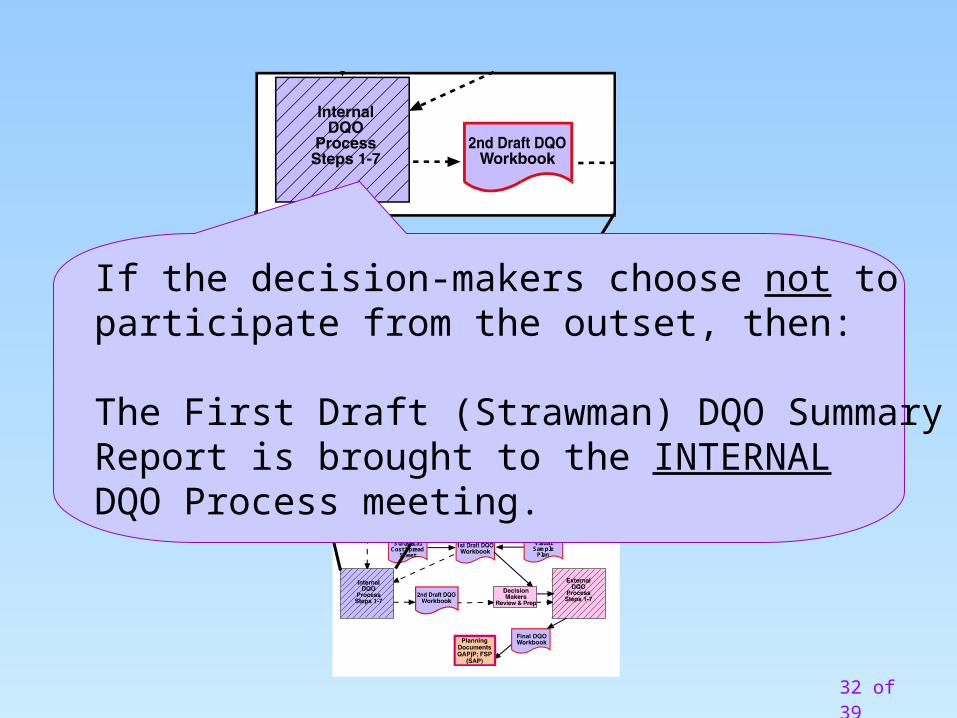
If the decision-makers choose not to participate from the outset, then:
The First Draft (Strawman) DQO Summary Report is brought to the INTERNAL DQO Process meeting.
33 of 39
VisualSample
Plan
StatisticalCost Spread
Sheet
STATE DQO IMPLEMENTATION PROCESS
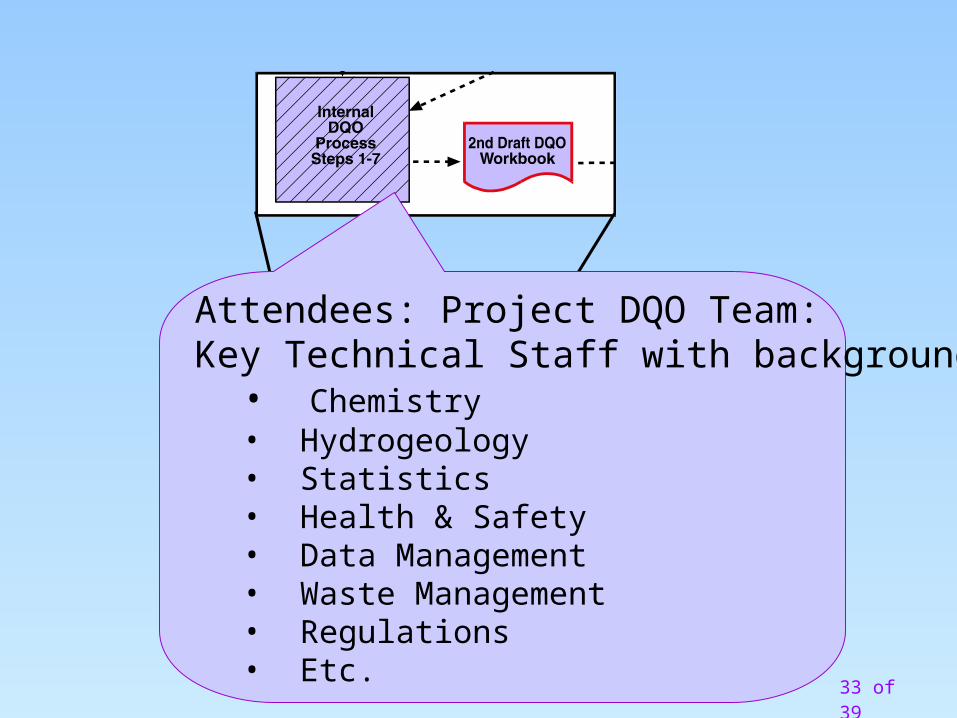
Attendees: Project DQO Team:Key Technical Staff with background in:
• Chemistry• Hydrogeology• Statistics• Health & Safety • Data Management • Waste Management• Regulations• Etc.
34 of 39
VisualSample
Plan
StatisticalCost Spread
Sheet
STATE DQO IMPLEMENTATION PROCESS
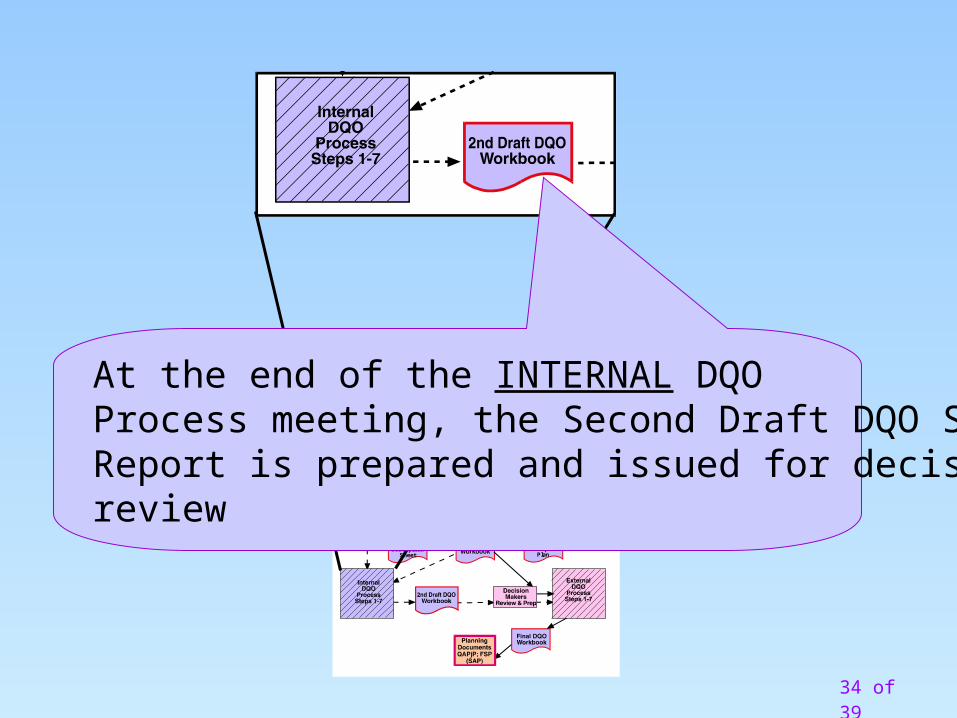
At the end of the INTERNAL DQO Process meeting, the Second Draft DQO Summary Report is prepared and issued for decision-makerreview

35 of 39
VisualSample
Plan
StatisticalCost Spread
Sheet
STATE DQO IMPLEMENTATION PROCESSIf the INTERNAL DQO Process was implemented, the decision-makers perform their review of the Second Draft DQO Summary Report to prepare for the External DQO Process meeting.
Decision-maker comments are resolved during the External DQO Process meeting.
36 of 39
VisualSample
Plan
StatisticalCost Spread
Sheet
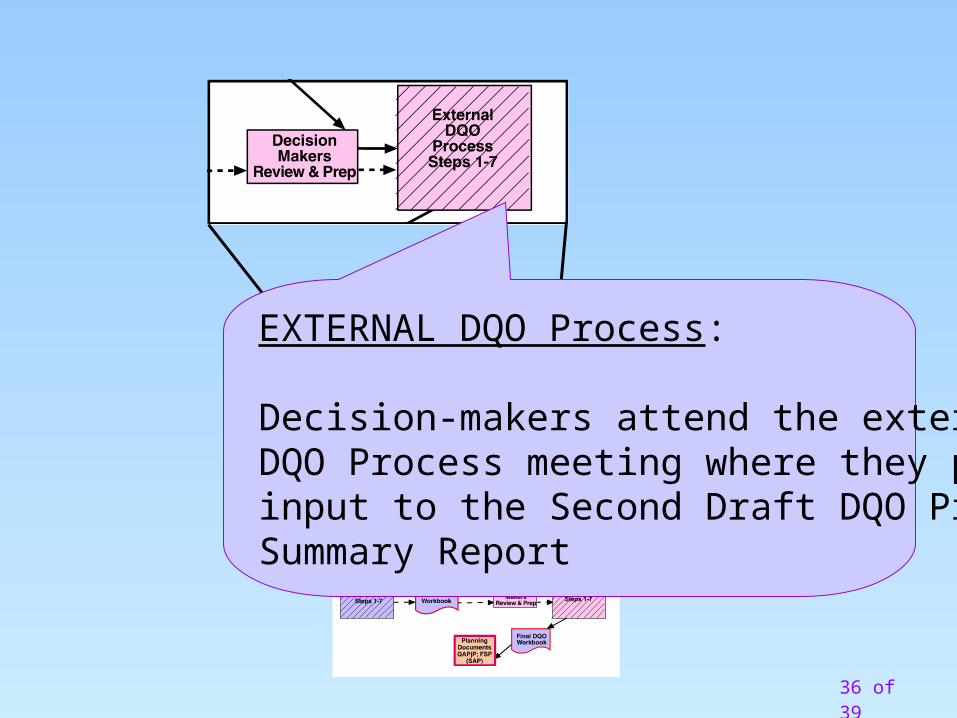
STATE DQO IMPLEMENTATION PROCESSEXTERNAL DQO Process:
Decision-makers attend the external DQO Process meeting where they provide input to the Second Draft DQO ProcessSummary Report

37 of 39
VisualSample
Plan
StatisticalCost Spread
Sheet
STATE DQO IMPLEMENTATION PROCESS
• Final revisions/reviews/approvals• Issue final DQO Process Summary Report• Documentation of What/Why/How
38 of 39
VisualSample
Plan
StatisticalCost Spread
Sheet
STATE DQO IMPLEMENTATION PROCESS
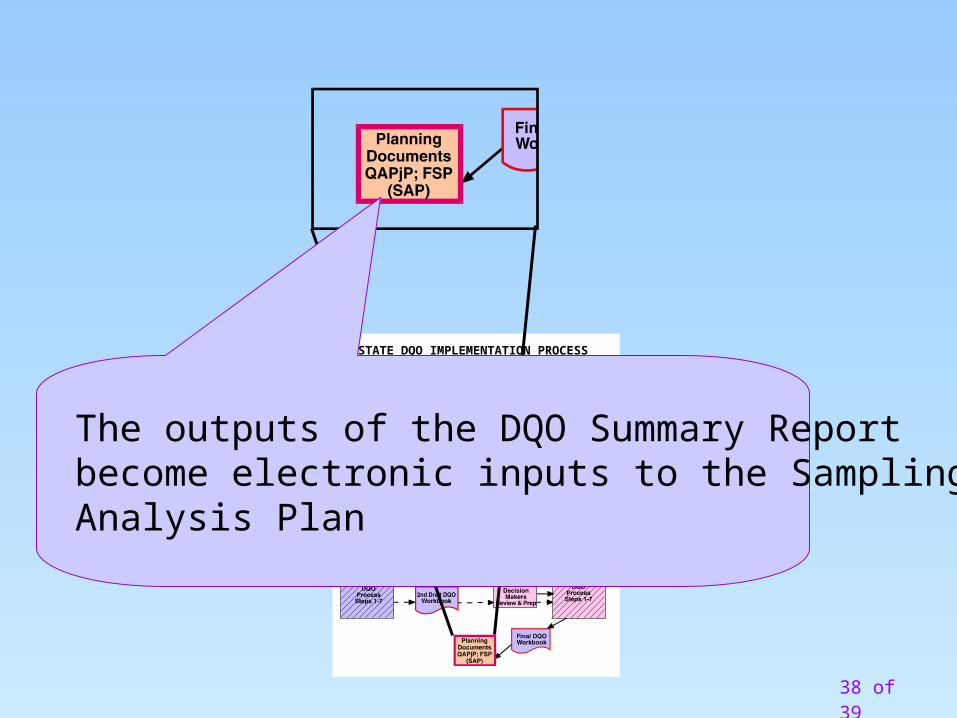
The outputs of the DQO Summary Report become electronic inputs to the Sampling and Analysis Plan
39 of 39
End of Module 8
Thank you
Questions?