Dp-Rnn: Type Ii Diabetic Prediction Using Gkfcm And Rnn
13
Turkish Journal of Computer and Mathematics Education Vol.12 No.10 (2021),6093- 6105 Research Article 6093 Dp-Rnn: Type Ii Diabetic Prediction Using Gkfcm And Rnn Mrs.K.Gandhimathi 1 and Dr.N.Umadevi 2 1 Ph.D Scholar, Department of Computer Science Sri Jayendra Saraswathy Maha Vidyalaya CAS, Coimbatore, India 2 Associate Professor & Head, Department of Computer Science & Information Technology Sri Jayendra Saraswathy Maha Vidyalaya CAS, Coimbatore, India [email protected] Article History: Received: 11 January 2021; Revised: 12 February 2021; Accepted: 27 March 2021; Published online: 20 April 2021 Abstract: Diabetes is a form of metabolic disorder marked by elevated persistent blood glucose (BG), leading to several severe problems in the long term. Continuous monitoring and prediction of BG concentration are needed to help diabetic patients maintain their wellbeing. If insulin is minimized, machine learning models, such as CNN, RNN, and others, are standard data-driven BG prediction solutions. They use several patients' BG data to train the prediction model. However, all of the training data with the same parameters can not accurately capture BG fluctuation characteristics. Motivated by the possibility that various subgroups of diabetic patients have different BG fluctuation trends, we suggest a new BG prediction method called DP-RNN focused on recurrent neural networks (RNN) and incorporates a clustering pre-process using GKFCM. In terms of BG estimation precision, numerical finding shows that the suggested DP-RNN methodology uses more than one cluster for type II diabetes and outperforms Logistic regression (LR) and other CNN approaches. Keywords: CNN, RNN, BG, Clustering, Classification, GKFCM I. INTRODUCTION Diabetes, commonly known as diabetes mellitus, is a progressive and lifelong condition in which the body cannot produce or utilize insulin. The level of glucose/sugar in the blood is high [1]. The World Health Organization predicts that the number of people with diabetes worldwide would increase to 333 million by 2025, up from 135 million in 1995 [3]. Diabetes that is poorly regulated and unmonitored can contribute to complications that impact various human body sections, including the skin, kidneys, heart, nerves, blood vessels, and feet [2]. Diabetes mellitus may trigger coronary autonomic neuropathy as well as a variety of complications [1]. Specific blood arteries that nourish the retina become blocked if the disease advances, denying blood flow to some retinal regions [4]. The American Diabetes Association (ADA) proposed CAD (Coronary Artery Disease) screening of type II diabetic patients with two or more additional risk factors, complications, or EKG changes indicating CAD and the presence of carotid or peripheral arterial disease in 1998 [6]. It was also said that the EKG stress test was insensitive [8]. In our new world, where information and data are produced, stored, and accessible from everywhere while we talk, changing the way we empower patients by continuous exporting and exchanging of expertise and empowering people to handle their health awareness and aspirations in a customized and timely manner [11] is not challenging. Deep learning has grown exponentially in recent years, and the concept has become daunting. Deep learning approaches, such as medical prognostics and optical character recognition, are being utilized in various fields [5]. This paper proposes a high-precision model for diabetes prediction using advanced computational techniques, including a deep neural learning network [14]. Dropout, a regularization layer, is used to address the over-fitting issue caused by closely linked columns. We used the GKFCM as the clustering and RNN classification result in this proposed framework and compared it to Logistic Regression, and CNN approaches. When the blood sugar content is too high, type 2 diabetes will develop [7]. Blood glucose is the main form of sugar, and it is obtained from the food we consume. Insulin facilitates glucose transport from the bloodstream through our cells, where it is converted into electricity. Glucose, though, does not reach cells of type 2 diabetes and therefore persists in the bloodstream.
Transcript of Dp-Rnn: Type Ii Diabetic Prediction Using Gkfcm And Rnn
Turkish Journal of Computer and Mathematics Education Vol.12 No.10 (2021),6093- 6105
Research Article
6093
Dp-Rnn: Type Ii Diabetic Prediction Using Gkfcm And Rnn
Mrs.K.Gandhimathi1 and Dr.N.Umadevi2
1Ph.D Scholar, Department of Computer Science Sri Jayendra Saraswathy Maha Vidyalaya CAS,
Coimbatore, India
2Associate Professor & Head, Department of Computer Science & Information Technology Sri
Jayendra Saraswathy Maha Vidyalaya CAS, Coimbatore, India
Article History: Received: 11 January 2021; Revised: 12 February 2021; Accepted: 27 March 2021; Published
online: 20 April 2021
Abstract: Diabetes is a form of metabolic disorder marked by elevated persistent blood glucose (BG), leading to
several severe problems in the long term. Continuous monitoring and prediction of BG concentration are needed to
help diabetic patients maintain their wellbeing. If insulin is minimized, machine learning models, such as CNN,
RNN, and others, are standard data-driven BG prediction solutions. They use several patients' BG data to train the
prediction model. However, all of the training data with the same parameters can not accurately capture BG
fluctuation characteristics. Motivated by the possibility that various subgroups of diabetic patients have different BG
fluctuation trends, we suggest a new BG prediction method called DP-RNN focused on recurrent neural networks
(RNN) and incorporates a clustering pre-process using GKFCM. In terms of BG estimation precision, numerical
finding shows that the suggested DP-RNN methodology uses more than one cluster for type II diabetes and
outperforms Logistic regression (LR) and other CNN approaches.
Keywords: CNN, RNN, BG, Clustering, Classification, GKFCM
I. INTRODUCTION
Diabetes, commonly known as diabetes mellitus, is a progressive and lifelong condition in which the body cannot
produce or utilize insulin. The level of glucose/sugar in the blood is high [1]. The World Health Organization
predicts that the number of people with diabetes worldwide would increase to 333 million by 2025, up from 135
million in 1995 [3]. Diabetes that is poorly regulated and unmonitored can contribute to complications that impact
various human body sections, including the skin, kidneys, heart, nerves, blood vessels, and feet [2]. Diabetes
mellitus may trigger coronary autonomic neuropathy as well as a variety of complications [1]. Specific blood
arteries that nourish the retina become blocked if the disease advances, denying blood flow to some retinal regions
[4].
The American Diabetes Association (ADA) proposed CAD (Coronary Artery Disease) screening of type II diabetic
patients with two or more additional risk factors, complications, or EKG changes indicating CAD and the presence
of carotid or peripheral arterial disease in 1998 [6]. It was also said that the EKG stress test was insensitive [8].
In our new world, where information and data are produced, stored, and accessible from everywhere while we talk,
changing the way we empower patients by continuous exporting and exchanging of expertise and empowering
people to handle their health awareness and aspirations in a customized and timely manner [11] is not challenging.
Deep learning has grown exponentially in recent years, and the concept has become daunting. Deep learning
approaches, such as medical prognostics and optical character recognition, are being utilized in various fields [5].
This paper proposes a high-precision model for diabetes prediction using advanced computational techniques,
including a deep neural learning network [14]. Dropout, a regularization layer, is used to address the over-fitting
issue caused by closely linked columns.
We used the GKFCM as the clustering and RNN classification result in this proposed framework and compared it to
Logistic Regression, and CNN approaches. When the blood sugar content is too high, type 2 diabetes will develop
[7]. Blood glucose is the main form of sugar, and it is obtained from the food we consume. Insulin facilitates glucose
transport from the bloodstream through our cells, where it is converted into electricity. Glucose, though, does not
reach cells of type 2 diabetes and therefore persists in the bloodstream.
Dp-Rnn: Type Ii Diabetic Prediction Using Gkfcm And Rnn
6094
As a consequence, blood sugar levels rise, and the pancreas produces more insulin. Eventually, the cells that produce
insulin become damaged and are unable to fulfill the body's needs. Weight, fat density, inactivity, family
background, and age contribute to type 2 diabetes. Nerve injury, organ damage, a heart attack, vision loss, and slow
wound healing are potential risks for the patient [16].
In this article, we will concentrate on a data-driven method. Motivated by [15] and the reality that various subgroups
of diabetic patients have different BG fluctuation trends, we propose DP-RNN, a modern BG prediction method
focused on recurrent neural networks (RNN) that incorporates a clustering pre-process into the classical RNN [13].
This paper is distributed as follows; Section II contains relevant works in the area, and Section III outlines the
proposed technique, which includes dataset selection, processing, and classification using RNN. Section IV consists
of the findings and evaluations, supplemented by Section V, which contains an overall conclusion.
II BACKGROUND STUDY
Diabetic retinopathy screening and diagnosis are standard research fields, and several researchers are interested in
developing research in this field. A manual screening problem such as high expense, low sensitivity and specificity,
time consumption, and insufficient human detection capacity was suggested for automated diabetic retinopathy
screening. Automatic screening detection aims to diagnose the need for more care.
Bouallal, D. et al. [2] The multimodal approach performs better than the thermal image-based process, especially
for complex cases. On the other side, before ulceration emerged, a cross-sectional clinical trial has been conducted
on a 122 patient diabetic type II group. The three classes of people at risk of ulcer development were identified
through a diagnostic test: the low-risk (R0) category, the medium-risk group, and the high-risk group (R2). The
results demonstrate that the medium-risk (MR1) community had a higher average foot surface temperature than the
low-risk (R0) group with p<0, 1. The temperature differential measured during a cold stress test differs significantly
from R0 to R1, on the one side, and from R1 to R2, on the other with p<0.01. Finally, the mean absolute deviation
from left to right foot was R1 to R2 (p<0.1).
Choden, P. et al. [3], The manufacturing system of six chemiresistive gas sensors was successfully designed and
improvised by the author. In the screening of diabetic patients from stable individuals, the nose's gas sensors showed
their ability to discriminate against the urinary VOC (volatile organic compounds).
Chandran, A. et al. [4], The proposed hybridized patch method was established in this paper to diagnose
proliferative diabetic retinopathy. The electronic ophthalmology systems allow specialists to save time and effort
and immediately handle severe cases.
Kumar, S., & Kumar, B. [9] The author designed a new method for identifying diabetic retinopathy by accurately
determining the amount and size of microaneurysms. The sensitivity and accuracy values obtained demonstrate that
the diagnostic procedure suggested was better for detecting non-proliferative diabetes.
Peng, Y. et al. [10] According to the author, FCM protects against hyperglycemia and diabetic nephropathy in a type
II diabetes mellitus rat model by improving blood glucose levels, insulin tolerance, lipid metabolism disease, and
antioxidant tension. All of the findings indicated that FCM might be used as a pharmaceutical preparation to guard
against diabetes and diabetic complications.
Vahidi, O. et al. [15] In the previous study, the author had used a model for a diabetic community of patients Form
II to diagnose cardiovascular deficiencies. The model conditions and glucose metabolic rates in several organs and a
pancreatic insulin secretion rate were evaluated using a particle filtering process. The misconduct in other organs
was observed by the euglycemic insulin clamp and hyperglycemic silicon clamp. These methods and a nonlinear
filtering system and mathematical model may diagnose hepatic anomalies, pancreas, and peripheral patients with
diabetes type II.
Yang, J. et al. [17] The author states that DOP (Dendrobium Officinale stem) effects had been studied in type 2
diabetic rats on improving metabolic homeostasis. DOP therapy enhanced hepatic metabolism, protects the liver
from oxidative and inflammatory stress. Besides, the amount of bile acid and xanthine was decreased by DOP
Mrs.K.Gandhimathi1 and Dr.N.Umadevi2
6095
therapy. This research would be helpful for the cost-effective, practical implementation of DOP for diabetes
management.
III SYSTEM MODEL
The suggested RNN DP-RNN method, commonly used in natural language processing, speech acknowledgment,
and other time series-related tasks because of its natural advantages for quick capture, is presented in this portion.
BG data is a time series and can, of course, be processed through RNN.
3.1 Dataset
In this system, the Indian Diabetes Dataset has been used, which is available at the Kaggle Platform. The main
objective is to diagnostically predict the patient that the patient is suffering from diabetes or not. All the data present
in the dataset is about females of Pima Indian heritage and are at least 21 years. This dataset contains a medical
record of females infected with Type 2 Diabetes with the minimum age of 21. This medical record has a total of 9
attributes through which the disease will be predicted.
3.2 System Architecture
The proposed system represents the architecture for type 2 diabetes prediction. This system consists of the standard
dataset which is obtained from Kaggle. This dataset is further pre-processed so that the dataset can be used
efficiently to predict the disease's outcomes. This pre-processing is done manually by changing the columns' values
based on that particular row's development. After pre-processing, the data is segregated. This segregated data is
trained with the RNN. After the prediction is made, we can obtain the results of the process. To evaluate the model,
many metrics can be used. We have emphasized accuracy, precision, and F-measure as these metrics greatly
influence the model's betterment.
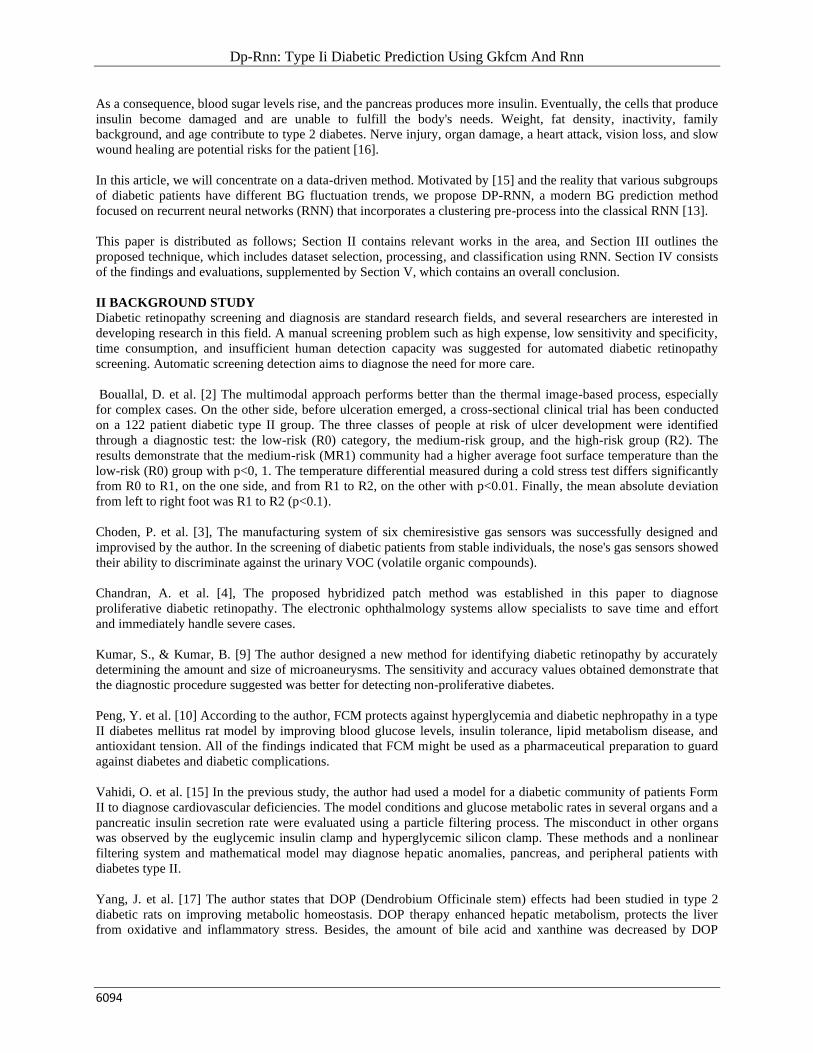
Figure 1: Architecture of DP-RNN
The architecture for the proposed system is shown in figure 1. It represents the Differential classifier as GKFCM has
classified, and the RNN Layer processes the clustered input.
3.3 Methods
We also introduced profound methods of studying how to diagnose diabetes. The conventional steps in the
extraction, sorting, and classification of functions in traditional computer methods do not need to be described
directly in deep learning networks. In exchange, they are integrated into the broad network of learning. Self-learning
from the data is the primary mechanism.
3.4 Convolutional neural network (CNN)
Every kind of multilayer perception is a convolutionary neural network (CNN) (MLP). In the following dimensions,
they resemble neural networks. They consist of neurons that have to be studied with weights and prejudice. Each
neuron has specific inputs. The product is then controlled, accompanied by an optional nonlinearity feature. Initially,
Dp-Rnn: Type Ii Diabetic Prediction Using Gkfcm And Rnn
6096
CNNs were used in image processing, where the imaged pixels are received on the input end, transformed by several
hidden layers. At the other end, the class values are finally provided. CNN consists essentially of three key layer
groups. They are the revolutionary layer, the swimming layer, and a fully linked layer with a corrected linear
activation function (ReLU). Our application analyzes the dimensional signals, layers, pooling ID layers, and a fully
connected piece. Here, CNN takes one-dimensional time-series information, in which the details are sequentially
ordered.
In our case, the input one-dimensional data vector is x= (x1,x2,….,xn-1,xn,cl) where xn € Rd denotes features (here time
series HRV data) and cl € R denotes a class label (either diabetic or standard). Convolution 1D constructs a feature
map fm by applying the convolution operation on the input data with a filter w € Rfd where f denotes the features
inherent in the input data producing at its output, a new set of features which is fed to the input of the next block in
line.
A new feature map fm is obtained from a set of features f as follows
ℎ𝑙𝑖𝑓𝑚
= tanh (wfm xi:i+f-1+b) (1)
The filter hl is employed to each set of features f in the input data defined by {x1:f, x2:f+1,…,xn-f+1} so as to generate a
feature map as h1 = [hl1, hl2,…,hln-f+1]
Where b € R denotes a bias term and hl € Rn-f+1
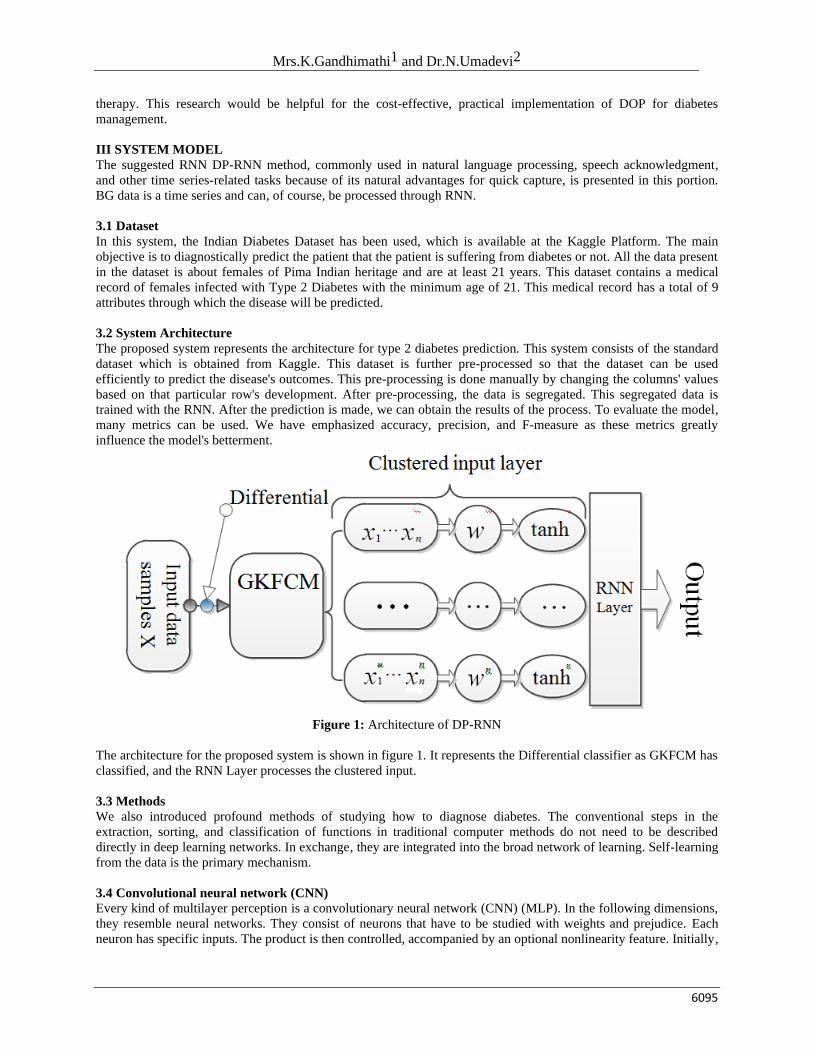
The pooling layer is supplied with the output of the convolution layer. The convolutional layer uses the activation
feature of ReLU, which max (0, x) applies to each ReLU input described by x. A sampling operation is carried out
in the next layer (POOL). In this case, each function map hl=max{hl} applies to the max-pooling process. This
creates the most important characteristics (here the selection of features with the highest values).
3.5 Logistic Regression
Logistic regression is a machine learning methodology that has taken its concept from statistics. After
linear regression, it is the most popular machine learning algorithm. Linear regression and logistic regression are
similar in different respects. The main difference, though, is how they are used. The prediction of values is made
using linear regression, while logistic regression is used in classification-related activities. Logistic regression takes
its names from a logistical feature, which is the foundation of this approach (also called the sigmoid function).
Mrs.K.Gandhimathi1 and Dr.N.Umadevi2
6097
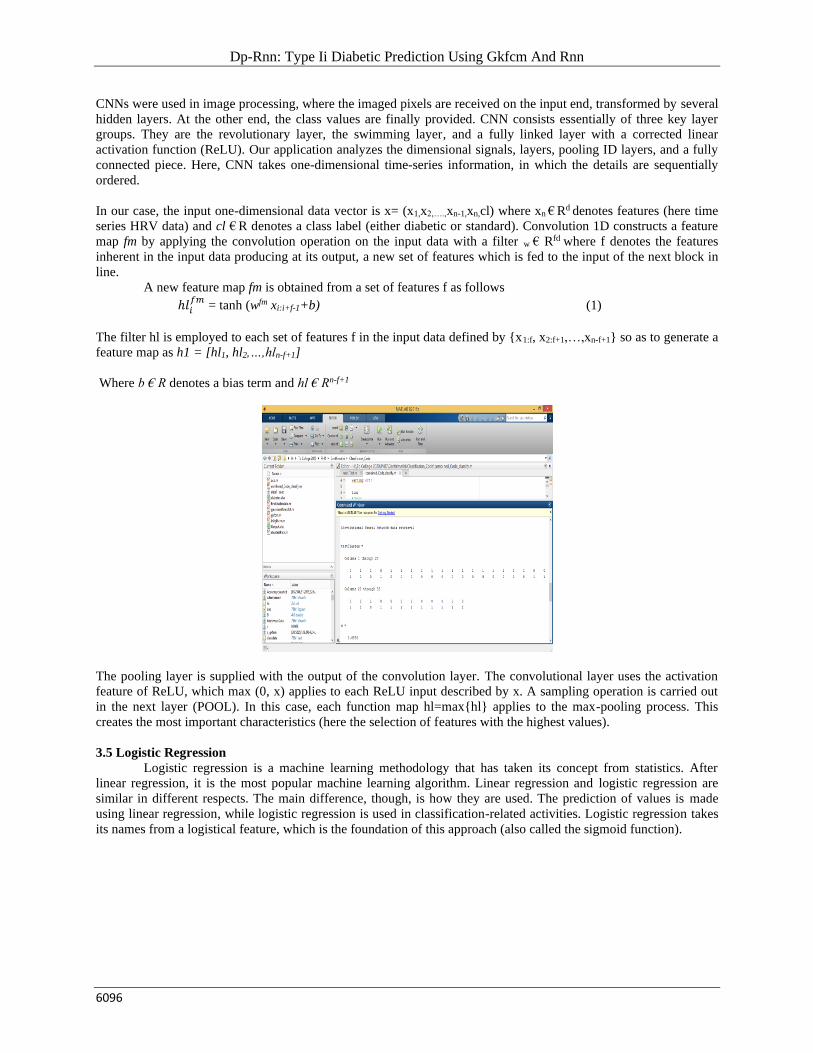
Figure 3 Logistic Regression output
The logistic regression outcome is shown in Figure 3. The input variables are x1, x2, x3,... xn. The model's
coefficients are w1, w2, w3, ... wn. The estimated production is known to be y. Logistic regression calculates and
performs a specific process known as a logistic function or sigmoid function that generates y output—the input
variables' weighted average.
3.6 Algorithmic steps for Gaussian Kernel Fuzzy C-Means clustering
We are to fix c where c is (2<=c<n) and then select a value for parameter 'm' and after that initializing the
partition matrix U(0). Each step in this algorithm will be labeled as 'r' where r=0, 1, 2,…
1) We are to calculate the c center vector {Vij} for each step.
Vij=∑ (𝜇𝑖𝑘)𝑚 𝑥𝑘𝑗𝑛
𝑘=1
∑ (𝑛𝑘=1 𝜇𝑖𝑗)𝑚
→ (2)
2) Calculate the distance matrix D[c,n].
Dij = ∑ (𝑥𝑘𝑗 − 𝑣𝐼𝑗𝑚𝑗=1 )2 → (3)
3) Update the partition matrix for the rth step U(R) as
µr-1ij =
(1/∑ 𝑑𝑖𝑘/𝑑𝑗𝑘)𝑐𝑗−1
2/m-1) → (4)
IF || U(k+1) – U(k)||<δ then we are to stop. Otherwise, we have to return to step 2 by updating the cluster centers
iteratively and the membership grades for data points [13].
FCM carries the cluster centers in a dataset to the correct spot. The Fuzzy C-Means algorithm is generally the basic
introduction of the Fuzzy logic in K-Means. In particular, FCM clustering techniques are natural to produce a cluster
where membership weights have a natural yet improbable interpretation.
3.7 Long short term memory (LSTM)
LSTM is an enhanced neural network form (RNN). LSTM presents memory blocks to accommodate disappearing
and bursting gradients instead of traditional plain RNN modules. LSTMs are more capable than conventional RNNs
of handling long-term dependencies. This means LSTMs will recall and link history (which is too far behind today)
to the current. A LSTM memory block consists of one or two cells, a dynamic processing device. As an input and
output lock, a pair of multiplicative gates is used. The entire function of a memory block is controlled with an
Dp-Rnn: Type Ii Diabetic Prediction Using Gkfcm And Rnn
6098
adaptive multiplicative gate. The input gate enables the process or discards the output state of a memory cell in other
nodes.
The LSTM is controlled accordingly. The performance series is supplied to LSTM architecture with arbitrary data of
x=(x1,x2,...xT-1,xT). The output stream o=(o1, o2,...oT-2,oT) of the memory cell (cl) with continuously writing, read and
reset operations is calculated from t = 1 to T in the recurrent secret layer of the LSTM architecture by three
multiplicative units (input(in), output(ot), and forget gate(fr)). The series of LSTM operations at phase T can be
expressed momentarily by the following equations. xt, ht-1, clt-1 → ht, clt
int= (wxinxt+whinht−1+wclinclt−1+bin) → (5)
frt= (wxfrxt+whfrht−1+wclfrclt−1+bfr) → (6)
clt=frt clt−1+int tanh(wxclxt+whclht−1+bcl) → (7)
ott=(wxotxt+whotht−1+wclotclt+bot) → (8)
ht=ott tanh(clt) → (9)
The LSTM memory block is a dynamic multi-unit computing device. With the power from the three adaptive
multiplying gating modules, the memory cell retains the knowledge over several stages. The input and exit gates in
the memory cell modulate the input flows of cell activation. If it becomes meaningless, Forget Gate can use the self-
recurring attribute to reset. Gate forgets the values 0 and 1 by multiplying them with the cell to remove and maintain
the next move's weight. The memory cell and all gates are connected with a peephole to learn the outputs' exact
time.
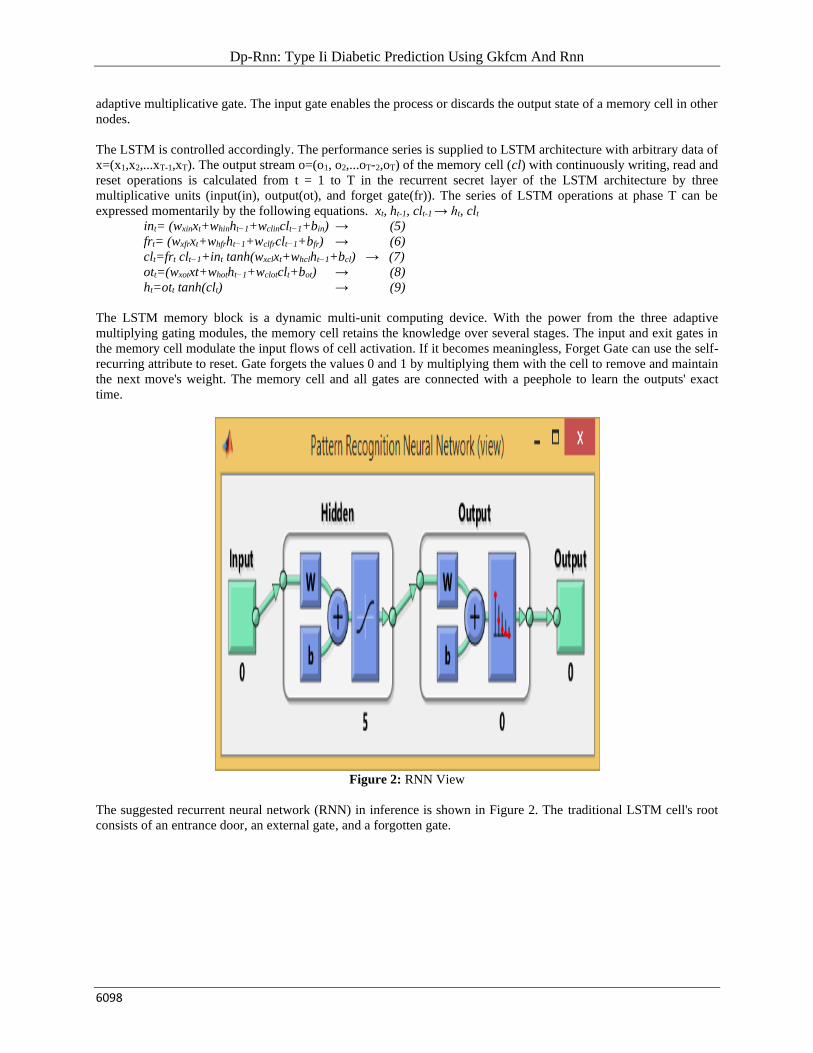
Figure 2: RNN View
The suggested recurrent neural network (RNN) in inference is shown in Figure 2. The traditional LSTM cell's root
consists of an entrance door, an external gate, and a forgotten gate.
Mrs.K.Gandhimathi1 and Dr.N.Umadevi2
6099
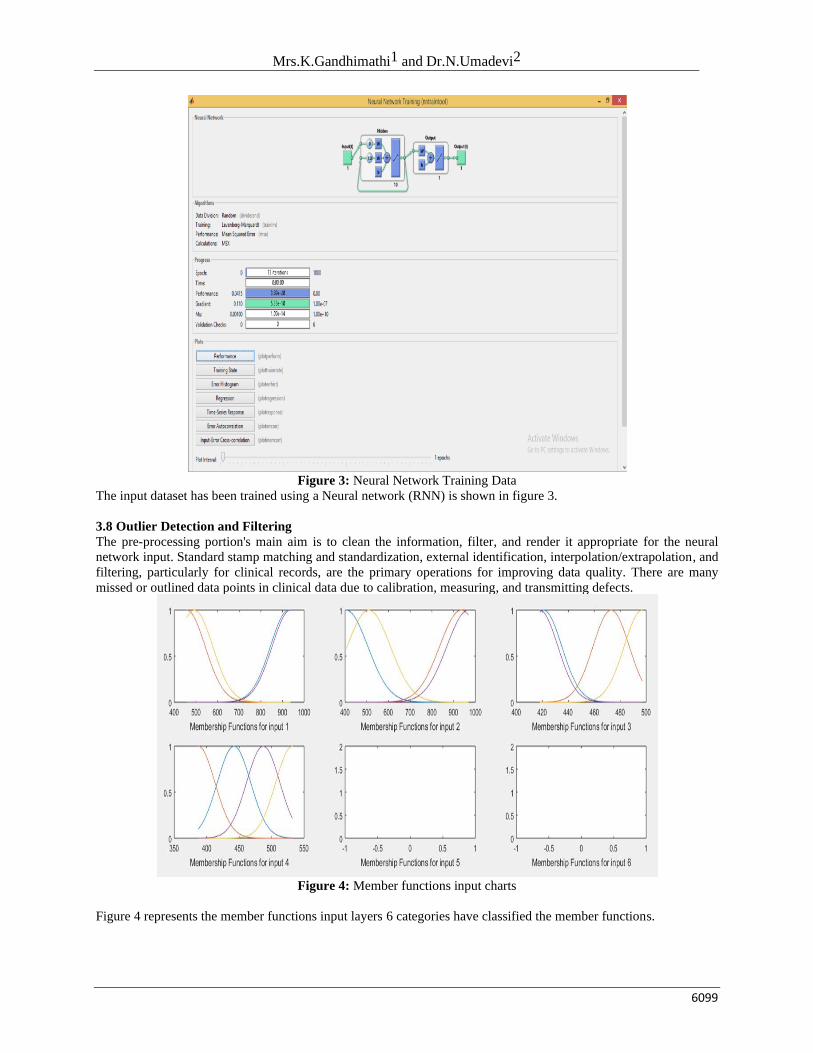
Figure 3: Neural Network Training Data
The input dataset has been trained using a Neural network (RNN) is shown in figure 3.
3.8 Outlier Detection and Filtering
The pre-processing portion's main aim is to clean the information, filter, and render it appropriate for the neural
network input. Standard stamp matching and standardization, external identification, interpolation/extrapolation, and
filtering, particularly for clinical records, are the primary operations for improving data quality. There are many
missed or outlined data points in clinical data due to calibration, measuring, and transmitting defects.
Figure 4: Member functions input charts
Figure 4 represents the member functions input layers 6 categories have classified the member functions.
Dp-Rnn: Type Ii Diabetic Prediction Using Gkfcm And Rnn
6100
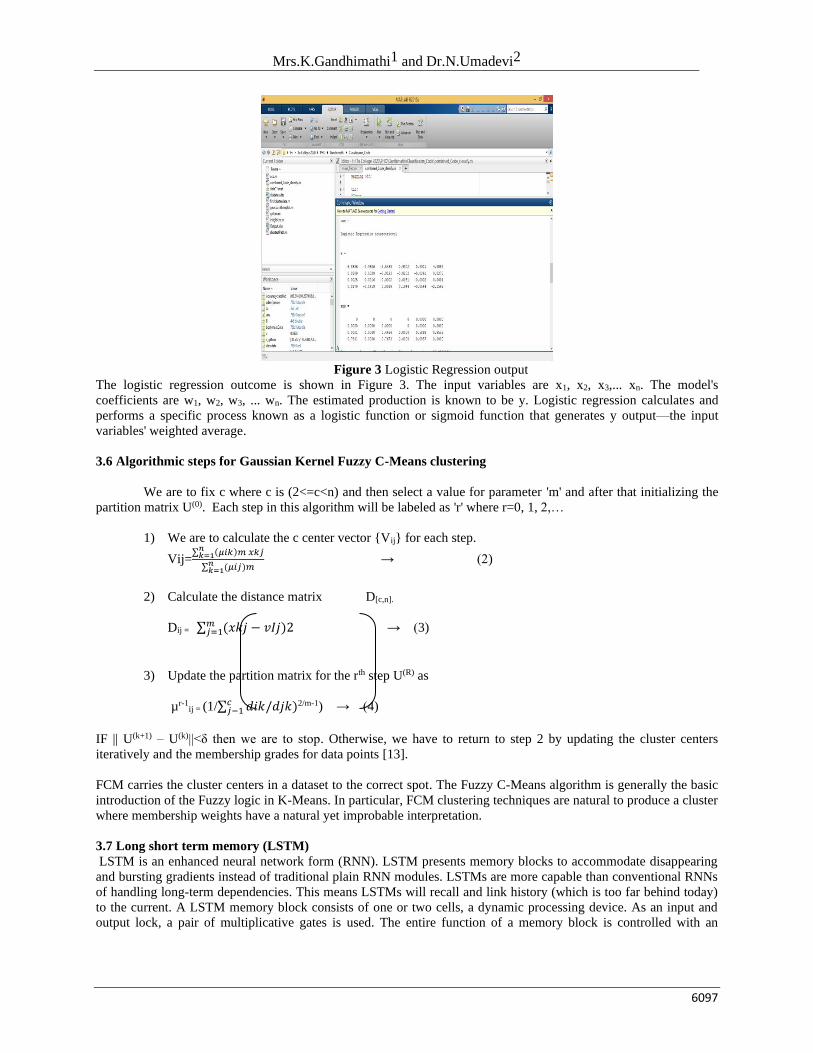
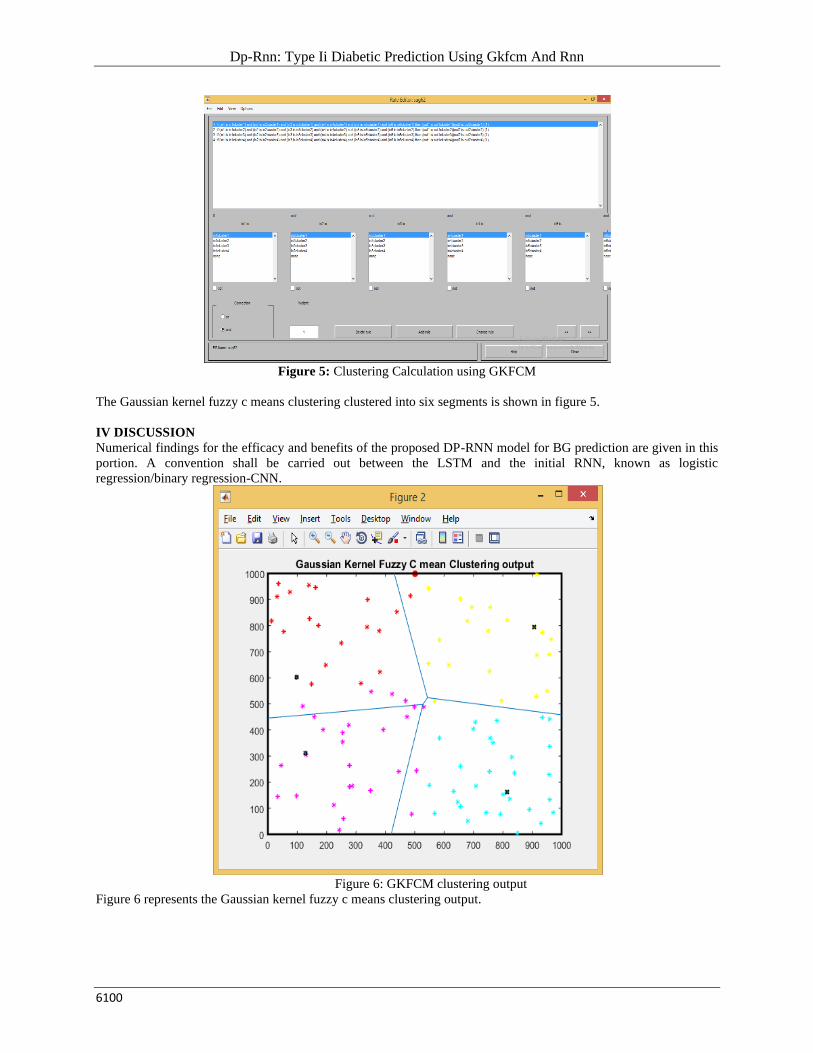
Figure 5: Clustering Calculation using GKFCM
The Gaussian kernel fuzzy c means clustering clustered into six segments is shown in figure 5.
IV DISCUSSION
Numerical findings for the efficacy and benefits of the proposed DP-RNN model for BG prediction are given in this
portion. A convention shall be carried out between the LSTM and the initial RNN, known as logistic
regression/binary regression-CNN.
Figure 6: GKFCM clustering output
Figure 6 represents the Gaussian kernel fuzzy c means clustering output.
Mrs.K.Gandhimathi1 and Dr.N.Umadevi2
6101
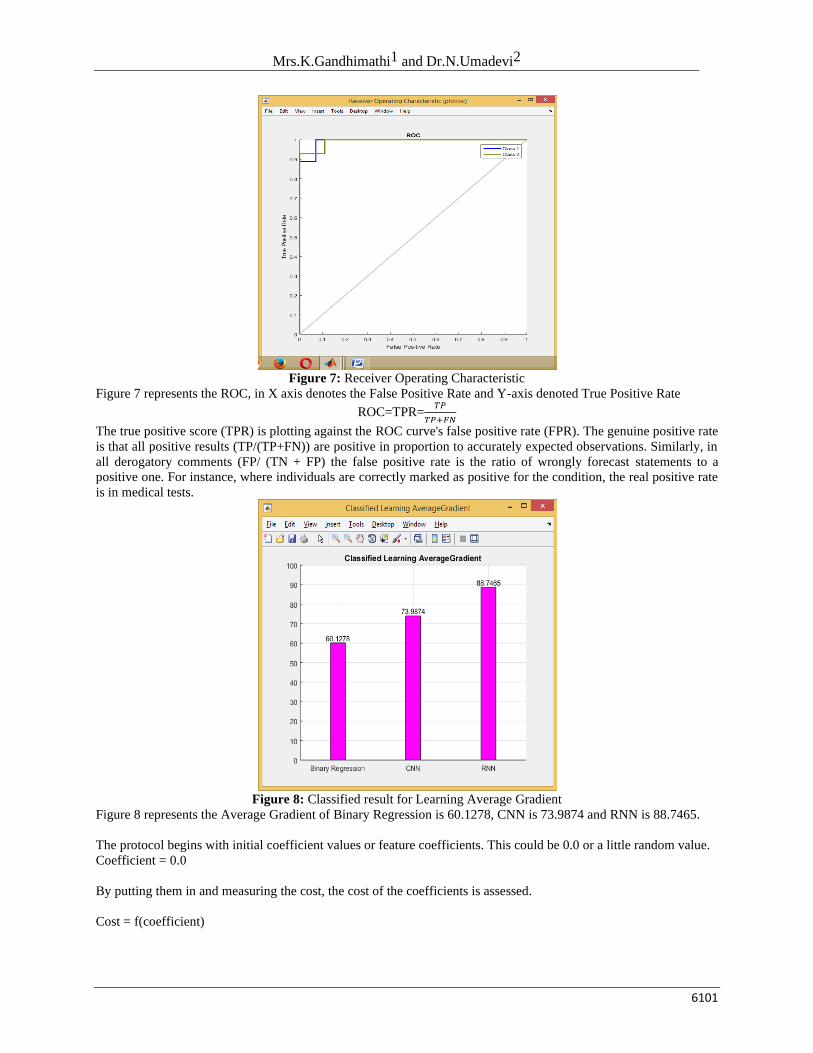
Figure 7: Receiver Operating Characteristic
Figure 7 represents the ROC, in X axis denotes the False Positive Rate and Y-axis denoted True Positive Rate
ROC=TPR=𝑇𝑃
𝑇𝑃+𝐹𝑁
The true positive score (TPR) is plotting against the ROC curve's false positive rate (FPR). The genuine positive rate
is that all positive results (TP/(TP+FN)) are positive in proportion to accurately expected observations. Similarly, in
all derogatory comments (FP/ (TN + FP) the false positive rate is the ratio of wrongly forecast statements to a
positive one. For instance, where individuals are correctly marked as positive for the condition, the real positive rate
is in medical tests.
Figure 8: Classified result for Learning Average Gradient
Figure 8 represents the Average Gradient of Binary Regression is 60.1278, CNN is 73.9874 and RNN is 88.7465.
The protocol begins with initial coefficient values or feature coefficients. This could be 0.0 or a little random value.
Coefficient = 0.0
By putting them in and measuring the cost, the cost of the coefficients is assessed.
Cost = f(coefficient)
Dp-Rnn: Type Ii Diabetic Prediction Using Gkfcm And Rnn
6102
The expense derivative is determined. The derivative is a calculus term that corresponds at a certain stage to the
pitch of the equation.
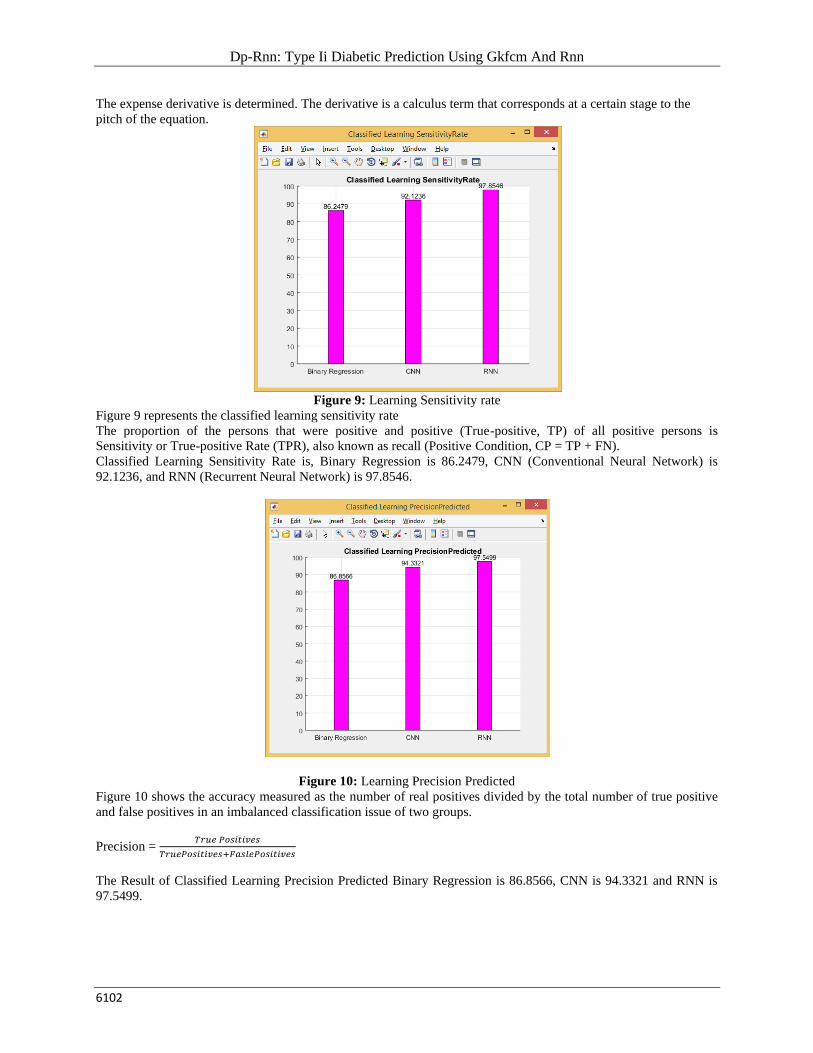
Figure 9: Learning Sensitivity rate
Figure 9 represents the classified learning sensitivity rate
The proportion of the persons that were positive and positive (True-positive, TP) of all positive persons is
Sensitivity or True-positive Rate (TPR), also known as recall (Positive Condition, CP = TP + FN).
Classified Learning Sensitivity Rate is, Binary Regression is 86.2479, CNN (Conventional Neural Network) is
92.1236, and RNN (Recurrent Neural Network) is 97.8546.
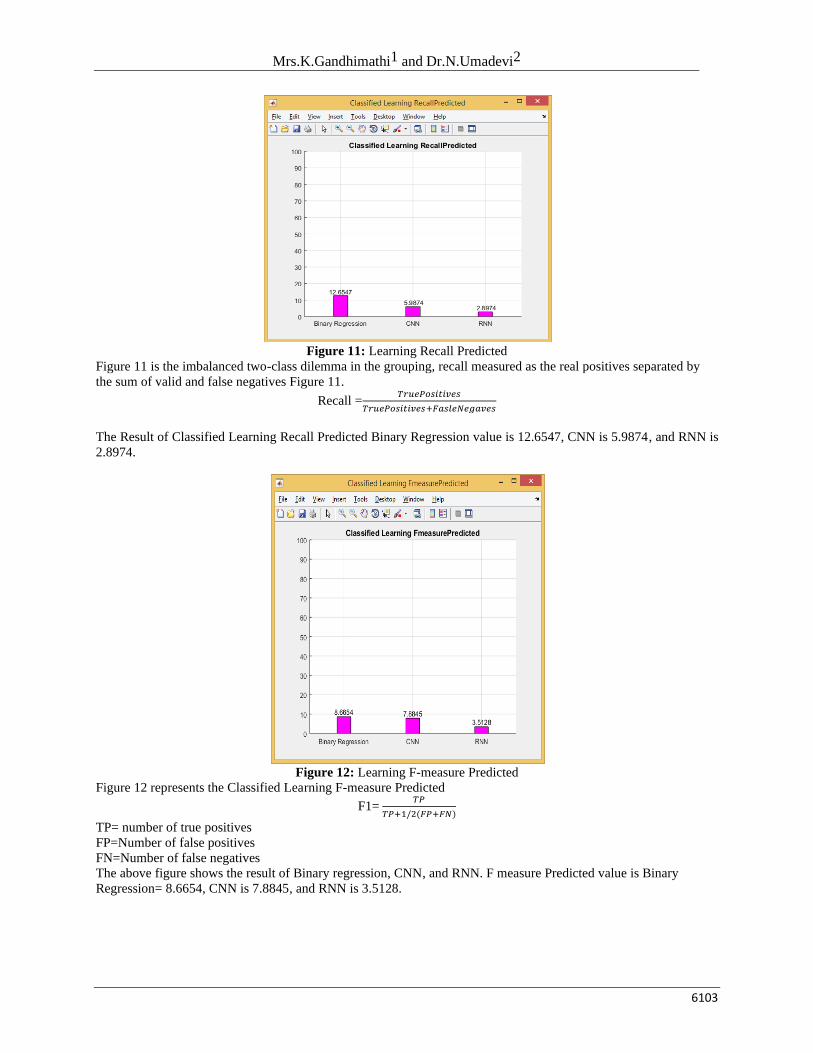
Figure 10: Learning Precision Predicted
Figure 10 shows the accuracy measured as the number of real positives divided by the total number of true positive
and false positives in an imbalanced classification issue of two groups.
Precision = 𝑇𝑟𝑢𝑒 𝑃𝑜𝑠𝑖𝑡𝑖𝑣𝑒𝑠
𝑇𝑟𝑢𝑒𝑃𝑜𝑠𝑖𝑡𝑖𝑣𝑒𝑠+𝐹𝑎𝑠𝑙𝑒𝑃𝑜𝑠𝑖𝑡𝑖𝑣𝑒𝑠
The Result of Classified Learning Precision Predicted Binary Regression is 86.8566, CNN is 94.3321 and RNN is
97.5499.
Mrs.K.Gandhimathi1 and Dr.N.Umadevi2
6103
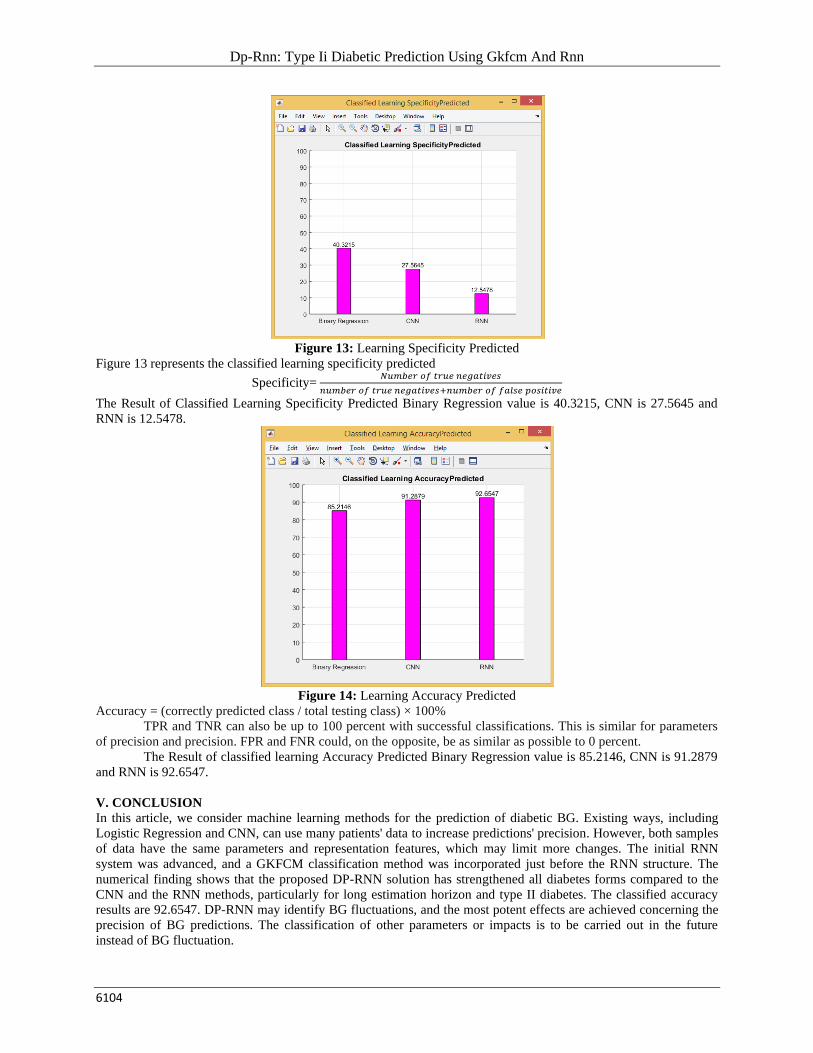
Figure 11: Learning Recall Predicted
Figure 11 is the imbalanced two-class dilemma in the grouping, recall measured as the real positives separated by
the sum of valid and false negatives Figure 11.
Recall =𝑇𝑟𝑢𝑒𝑃𝑜𝑠𝑖𝑡𝑖𝑣𝑒𝑠
𝑇𝑟𝑢𝑒𝑃𝑜𝑠𝑖𝑡𝑖𝑣𝑒𝑠+𝐹𝑎𝑠𝑙𝑒𝑁𝑒𝑔𝑎𝑣𝑒𝑠
The Result of Classified Learning Recall Predicted Binary Regression value is 12.6547, CNN is 5.9874, and RNN is
2.8974.
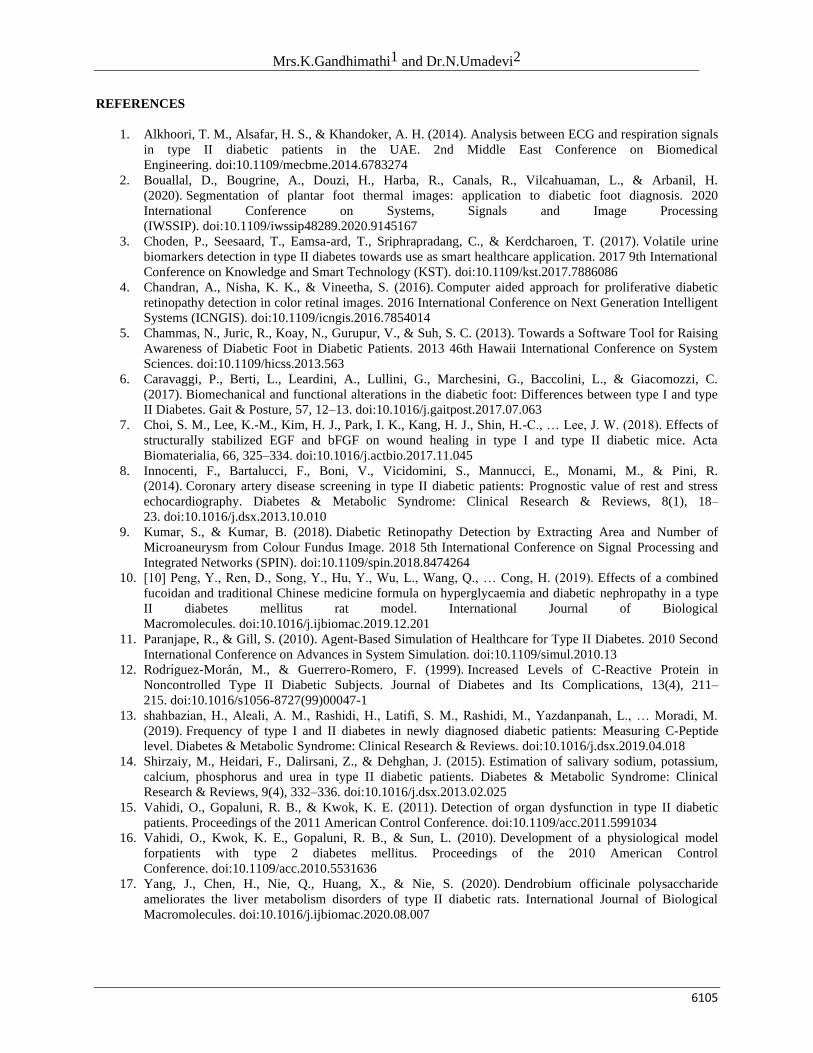
Figure 12: Learning F-measure Predicted
Figure 12 represents the Classified Learning F-measure Predicted
F1= 𝑇𝑃
𝑇𝑃+1/2(𝐹𝑃+𝐹𝑁)
TP= number of true positives
FP=Number of false positives
FN=Number of false negatives
The above figure shows the result of Binary regression, CNN, and RNN. F measure Predicted value is Binary
Regression= 8.6654, CNN is 7.8845, and RNN is 3.5128.
Dp-Rnn: Type Ii Diabetic Prediction Using Gkfcm And Rnn
6104
Figure 13: Learning Specificity Predicted
Figure 13 represents the classified learning specificity predicted
Specificity= 𝑁𝑢𝑚𝑏𝑒𝑟 𝑜𝑓 𝑡𝑟𝑢𝑒 𝑛𝑒𝑔𝑎𝑡𝑖𝑣𝑒𝑠
𝑛𝑢𝑚𝑏𝑒𝑟 𝑜𝑓 𝑡𝑟𝑢𝑒 𝑛𝑒𝑔𝑎𝑡𝑖𝑣𝑒𝑠+𝑛𝑢𝑚𝑏𝑒𝑟 𝑜𝑓 𝑓𝑎𝑙𝑠𝑒 𝑝𝑜𝑠𝑖𝑡𝑖𝑣𝑒
The Result of Classified Learning Specificity Predicted Binary Regression value is 40.3215, CNN is 27.5645 and
RNN is 12.5478.
Figure 14: Learning Accuracy Predicted
Accuracy = (correctly predicted class / total testing class) × 100%
TPR and TNR can also be up to 100 percent with successful classifications. This is similar for parameters
of precision and precision. FPR and FNR could, on the opposite, be as similar as possible to 0 percent.
The Result of classified learning Accuracy Predicted Binary Regression value is 85.2146, CNN is 91.2879
and RNN is 92.6547.
V. CONCLUSION
In this article, we consider machine learning methods for the prediction of diabetic BG. Existing ways, including
Logistic Regression and CNN, can use many patients' data to increase predictions' precision. However, both samples
of data have the same parameters and representation features, which may limit more changes. The initial RNN
system was advanced, and a GKFCM classification method was incorporated just before the RNN structure. The
numerical finding shows that the proposed DP-RNN solution has strengthened all diabetes forms compared to the
CNN and the RNN methods, particularly for long estimation horizon and type II diabetes. The classified accuracy
results are 92.6547. DP-RNN may identify BG fluctuations, and the most potent effects are achieved concerning the
precision of BG predictions. The classification of other parameters or impacts is to be carried out in the future
instead of BG fluctuation.
Mrs.K.Gandhimathi1 and Dr.N.Umadevi2
6105
REFERENCES
1. Alkhoori, T. M., Alsafar, H. S., & Khandoker, A. H. (2014). Analysis between ECG and respiration signals
in type II diabetic patients in the UAE. 2nd Middle East Conference on Biomedical
Engineering. doi:10.1109/mecbme.2014.6783274
2. Bouallal, D., Bougrine, A., Douzi, H., Harba, R., Canals, R., Vilcahuaman, L., & Arbanil, H.
(2020). Segmentation of plantar foot thermal images: application to diabetic foot diagnosis. 2020
International Conference on Systems, Signals and Image Processing
(IWSSIP). doi:10.1109/iwssip48289.2020.9145167
3. Choden, P., Seesaard, T., Eamsa-ard, T., Sriphrapradang, C., & Kerdcharoen, T. (2017). Volatile urine
biomarkers detection in type II diabetes towards use as smart healthcare application. 2017 9th International
Conference on Knowledge and Smart Technology (KST). doi:10.1109/kst.2017.7886086
4. Chandran, A., Nisha, K. K., & Vineetha, S. (2016). Computer aided approach for proliferative diabetic
retinopathy detection in color retinal images. 2016 International Conference on Next Generation Intelligent
Systems (ICNGIS). doi:10.1109/icngis.2016.7854014
5. Chammas, N., Juric, R., Koay, N., Gurupur, V., & Suh, S. C. (2013). Towards a Software Tool for Raising
Awareness of Diabetic Foot in Diabetic Patients. 2013 46th Hawaii International Conference on System
Sciences. doi:10.1109/hicss.2013.563
6. Caravaggi, P., Berti, L., Leardini, A., Lullini, G., Marchesini, G., Baccolini, L., & Giacomozzi, C.
(2017). Biomechanical and functional alterations in the diabetic foot: Differences between type I and type
II Diabetes. Gait & Posture, 57, 12–13. doi:10.1016/j.gaitpost.2017.07.063
7. Choi, S. M., Lee, K.-M., Kim, H. J., Park, I. K., Kang, H. J., Shin, H.-C., … Lee, J. W. (2018). Effects of
structurally stabilized EGF and bFGF on wound healing in type I and type II diabetic mice. Acta
Biomaterialia, 66, 325–334. doi:10.1016/j.actbio.2017.11.045
8. Innocenti, F., Bartalucci, F., Boni, V., Vicidomini, S., Mannucci, E., Monami, M., & Pini, R.
(2014). Coronary artery disease screening in type II diabetic patients: Prognostic value of rest and stress
echocardiography. Diabetes & Metabolic Syndrome: Clinical Research & Reviews, 8(1), 18–
23. doi:10.1016/j.dsx.2013.10.010
9. Kumar, S., & Kumar, B. (2018). Diabetic Retinopathy Detection by Extracting Area and Number of
Microaneurysm from Colour Fundus Image. 2018 5th International Conference on Signal Processing and
Integrated Networks (SPIN). doi:10.1109/spin.2018.8474264
10. [10] Peng, Y., Ren, D., Song, Y., Hu, Y., Wu, L., Wang, Q., … Cong, H. (2019). Effects of a combined
fucoidan and traditional Chinese medicine formula on hyperglycaemia and diabetic nephropathy in a type
II diabetes mellitus rat model. International Journal of Biological
Macromolecules. doi:10.1016/j.ijbiomac.2019.12.201
11. Paranjape, R., & Gill, S. (2010). Agent-Based Simulation of Healthcare for Type II Diabetes. 2010 Second
International Conference on Advances in System Simulation. doi:10.1109/simul.2010.13
12. Rodrı́guez-Morán, M., & Guerrero-Romero, F. (1999). Increased Levels of C-Reactive Protein in
Noncontrolled Type II Diabetic Subjects. Journal of Diabetes and Its Complications, 13(4), 211–
215. doi:10.1016/s1056-8727(99)00047-1
13. shahbazian, H., Aleali, A. M., Rashidi, H., Latifi, S. M., Rashidi, M., Yazdanpanah, L., … Moradi, M.
(2019). Frequency of type I and II diabetes in newly diagnosed diabetic patients: Measuring C-Peptide
level. Diabetes & Metabolic Syndrome: Clinical Research & Reviews. doi:10.1016/j.dsx.2019.04.018
14. Shirzaiy, M., Heidari, F., Dalirsani, Z., & Dehghan, J. (2015). Estimation of salivary sodium, potassium,
calcium, phosphorus and urea in type II diabetic patients. Diabetes & Metabolic Syndrome: Clinical
Research & Reviews, 9(4), 332–336. doi:10.1016/j.dsx.2013.02.025
15. Vahidi, O., Gopaluni, R. B., & Kwok, K. E. (2011). Detection of organ dysfunction in type II diabetic
patients. Proceedings of the 2011 American Control Conference. doi:10.1109/acc.2011.5991034
16. Vahidi, O., Kwok, K. E., Gopaluni, R. B., & Sun, L. (2010). Development of a physiological model
forpatients with type 2 diabetes mellitus. Proceedings of the 2010 American Control
Conference. doi:10.1109/acc.2010.5531636
17. Yang, J., Chen, H., Nie, Q., Huang, X., & Nie, S. (2020). Dendrobium officinale polysaccharide
ameliorates the liver metabolism disorders of type II diabetic rats. International Journal of Biological
Macromolecules. doi:10.1016/j.ijbiomac.2020.08.007