Downloaded from on …vetrecordopen.bmj.com/content/vetreco/2/1/e000107.full.pdfA longitudinal study...
8
A longitudinal study of poor performance and subclinical respiratory viral activity in Standardbred trotters Helena Back, 1 Johanna Penell, 2 John Pringle, 3 Mats Isaksson, 1 Nils Ronéus, 4 Louise Treiberg Berndtsson, 1 Karl Ståhl 5 To cite: Back H, et al.A longitudinal study of poor performance and subclinical respiratory viral activity in Standardbred trotters. Vet Rec Open 2015;2:e000107. doi:10.1136/vetreco-2014- 000107 ▸ Prepublication history for this paper is available online. To view these files please visit the journal online (http://dx.doi.org/10.1136/ vetreco-2014-000107). Received 25 October 2014 Revised 5 March 2015 Accepted 23 April 2015 This final article is available for use under the terms of the Creative Commons Attribution Non-Commercial 3.0 Licence; see http://vetreco.bmj.com For numbered affiliations see end of article. Correspondence to Helena Back; [email protected] ABSTRACT Introduction: While clinical respiratory disease is considered a main cause of poor performance in horses, the role of subclinical respiratory virus infections is less clear and needs further investigation. Aims and objectives: In this descriptive longitudinal study the relationship of markers of subclinical respiratory viral activity to occurrence of poor performance in racing Standardbred trotters was investigated. Material and methods: 66 elite Standardbred trotters were followed for 13 months by nasal swabs analysed with qPCR for equine influenza virus, equine arteritis virus, equine rhinitis B virus (ERBV), equine herpesvirus type 1(EHV-1) and equine herpesvirus type 4 (EHV-4) and serology to equine rhinitis A virus (ERAV), ERBV, EHV-1 and EHV-4, as well as the acute phase protein serum amyloid A (SAA). Findings on lab analyses were subsequently assessed for possible correlations to workload performance and trainer opinion measures of poor performance. Results: Despite occurrence of poor performance and subclinical viral activity the authors were unable to detect association neither between subclinical viral activity and poor performance, nor between SAA elevations and either viral activity or poor performance. Conclusions: Consistent with earlier study results, antibody titres to ERBV remained high for at least a year and few horses two years or older were seronegative to either ERAV or ERBV. In absence of clinical signs, serology to common respiratory viruses appears to have little diagnostic benefit in evaluation of poor performance in young athletic horses. INTRODUCTION Viral respiratory infections are among the most common equine health issues world- wide (Traub-Dargatz and others 1991) and cause impaired health and performance of the horses as well as financial losses for the owners and the equine industry. In the early1980s outbreaks of equine respiratory disease often remained undiagnosed (Mumford and Rossdale 1980). Despite several decades of research since then, the authors’ understanding of equine respiratory infections remains incomplete. For the athletic horse, lack of participation in competitions is a clear indication of career impairment. However, when horses do compete, it is even more challenging to define true poor performance. Since there are no widely accepted standard definitions for poor performance with various studies having used different criteria, comparison of results between studies is seldom possible (Leleu and others 2005, Richard and others 2010). Compounding the difficulties in defin- ing poor performance, the challenge remains in identifying the underlying cause of poor performance, since it is often multifactorial (Morris and Seeherman 1991). For Thoroughbred horses, locomotor and respira- tory problems have been incriminated as the main causes for disruption of training and racing (Wilsher and others 2006). Specifically, viral infections may play a key role in the respiratory component of poor performance (Mumford and Rossdale 1980). While sub- clinical airway inflammation has been identi- fied in Standardbred trotters with impaired performance (Richard and others 2010) the contribution by possible viral infections was not investigated. Unfortunately, since viral infections are largely refractory to diagnosis using stall side testing, there is a need for alternative biomarkers that help avert training or racing of a horse with underlying viral infections. Changes in the major acute phase protein serum amyloid A (SAA) appear to correlate to clinical equine influenza infec- tion (Hulten and others 1999). However, it is unclear whether levels are altered in subclin- ical equine influenza or other respiratory viral infections, and hence its potential role as a diagnostic tool for viral associated equine poor performance remains unknown. Subclinical infections as causes of poor per- formance in the equine athlete have been Back H, et al. Vet Rec Open 2015;2:e000107. doi:10.1136/vetreco-2014-000107 1 Research on 10 June 2018 by guest. Protected by copyright. http://vetrecordopen.bmj.com/ Vet Rec Open: first published as 10.1136/vetreco-2014-000107 on 17 June 2015. Downloaded from
Transcript of Downloaded from on …vetrecordopen.bmj.com/content/vetreco/2/1/e000107.full.pdfA longitudinal study...
A longitudinal study of poorperformance and subclinical respiratoryviral activity in Standardbred trotters
Helena Back,1 Johanna Penell,2 John Pringle,3 Mats Isaksson,1 Nils Ronéus,4
Louise Treiberg Berndtsson,1 Karl Ståhl5
To cite: Back H, et al. Alongitudinal study of poorperformance and subclinicalrespiratory viral activity inStandardbred trotters. VetRec Open 2015;2:e000107.doi:10.1136/vetreco-2014-000107
▸ Prepublication history forthis paper is available online.To view these files pleasevisit the journal online(http://dx.doi.org/10.1136/vetreco-2014-000107).
Received 25 October 2014Revised 5 March 2015Accepted 23 April 2015
This final article is availablefor use under the terms ofthe Creative CommonsAttribution Non-Commercial3.0 Licence; seehttp://vetreco.bmj.com
For numbered affiliations seeend of article.
Correspondence toHelena Back;[email protected]
ABSTRACTIntroduction: While clinical respiratory disease isconsidered a main cause of poor performance inhorses, the role of subclinical respiratory virusinfections is less clear and needs further investigation.Aims and objectives: In this descriptive longitudinalstudy the relationship of markers of subclinical respiratoryviral activity to occurrence of poor performance in racingStandardbred trotters was investigated.Material and methods: 66 elite Standardbred trotterswere followed for 13 months by nasal swabs analysedwith qPCR for equine influenza virus, equine arteritisvirus, equine rhinitis B virus (ERBV), equineherpesvirus type 1(EHV-1) and equine herpesvirus type4 (EHV-4) and serology to equine rhinitis A virus(ERAV), ERBV, EHV-1 and EHV-4, as well as the acutephase protein serum amyloid A (SAA). Findings on labanalyses were subsequently assessed for possiblecorrelations to workload performance and traineropinion measures of poor performance.Results: Despite occurrence of poor performance andsubclinical viral activity the authors were unable todetect association neither between subclinical viralactivity and poor performance, nor between SAAelevations and either viral activity or poor performance.Conclusions: Consistent with earlier study results,antibody titres to ERBV remained high for at least a yearand few horses two years or older were seronegative toeither ERAV or ERBV. In absence of clinical signs,serology to common respiratory viruses appears to havelittle diagnostic benefit in evaluation of poorperformance in young athletic horses.
INTRODUCTIONViral respiratory infections are among themost common equine health issues world-wide (Traub-Dargatz and others 1991) andcause impaired health and performance ofthe horses as well as financial losses for theowners and the equine industry. In theearly1980s outbreaks of equine respiratorydisease often remained undiagnosed(Mumford and Rossdale 1980). Despiteseveral decades of research since then, the
authors’ understanding of equine respiratoryinfections remains incomplete.For the athletic horse, lack of participation
in competitions is a clear indication of careerimpairment. However, when horses docompete, it is even more challenging todefine true poor performance. Since thereare no widely accepted standard definitionsfor poor performance with various studieshaving used different criteria, comparison ofresults between studies is seldom possible(Leleu and others 2005, Richard and others2010). Compounding the difficulties in defin-ing poor performance, the challenge remainsin identifying the underlying cause of poorperformance, since it is often multifactorial(Morris and Seeherman 1991). ForThoroughbred horses, locomotor and respira-tory problems have been incriminated as themain causes for disruption of training andracing (Wilsher and others 2006). Specifically,viral infections may play a key role in therespiratory component of poor performance(Mumford and Rossdale 1980). While sub-clinical airway inflammation has been identi-fied in Standardbred trotters with impairedperformance (Richard and others 2010) thecontribution by possible viral infections wasnot investigated. Unfortunately, since viralinfections are largely refractory to diagnosisusing stall side testing, there is a need foralternative biomarkers that help avert trainingor racing of a horse with underlying viralinfections. Changes in the major acute phaseprotein serum amyloid A (SAA) appear tocorrelate to clinical equine influenza infec-tion (Hulten and others 1999). However, it isunclear whether levels are altered in subclin-ical equine influenza or other respiratoryviral infections, and hence its potential role asa diagnostic tool for viral associated equinepoor performance remains unknown.Subclinical infections as causes of poor per-
formance in the equine athlete have been
Back H, et al. Vet Rec Open 2015;2:e000107. doi:10.1136/vetreco-2014-000107 1
Research
on 10 June 2018 by guest. Protected by copyright.
http://vetrecordopen.bmj.com
/V
et Rec O
pen: first published as 10.1136/vetreco-2014-000107 on 17 June 2015. Dow
nloaded from
described earlier (Leleu and others 2005, Richard andothers 2010, Fraipont and others 2011). However, whileviral activity (Powell and others 1978, Carman and others1997, Pusterla and others 2011) and antibodies to rhinitisviruses (Black and others 2007) in competition horseshas been studied before there is a lack of studies investi-gating the relationship between viral infection status andathletic performance in horses. The aim of this longitu-dinal study was to investigate the relationship of subclin-ical respiratory viral activity on the athletic performancein Standardbred trotters. In addition, the authors alsoevaluated whether changes in SAA could be related tosubclinical viral activity in the horse or to episodes ofpoor performance.
MATERIALS AND METHODSDescription of the cohortA cohort of 66 trotters from four different training yards(TYs) with geographical proximity to the NationalVeterinary Institute (SVA) in Uppsala, Sweden was fol-lowed over 13 consecutive months between August 2010and August 2011. Horses were selected based on follow-ing inclusions criteria: more than two years of age, inactive racing and training, healthy on clinical examin-ation and expected to remain with the same trainer forthe duration of the study. The clinical examinationincluded assessing rectal temperature, and presence ofnasal discharge or cough, palpation of submandibularlymph nodes and a lameness examination. The numbersof horses included from each trainer was predeterminedto reflect the distribution across the age groups at eachtrainer (i.e. proportional sample). The health status ofall horses was monitored by the same veterinarianweekly throughout the study period. As long as horsesremained with the same trainer, all horses trained andraced according to their normal schedule. However,unexpected injury could interrupt their schedule.
SamplingHorses were sampled at monthly intervals. Each samplingoccasion took place immediately following a standardisedfield exercise test (SFE, see below), with nasal secretionsobtained using an Eswab (Eswab, Copan, Murrieta, USA)(Daley and others 2006) and serum samples collected bydirect venepuncture into Vacutainer tubes (Becton,Dickinson and Company, Franklin Lakes, USA). Theresting body temperature and clinical signs of respiratorydisease such as fever, nasal discharge or cough wererecorded. Similar sampling was also conducted in anyhorse showing poor performance and/or having clinicalsigns of respiratory disease outside the planned samplingschedule. Nasal swabs and blood samples were trans-ported at 20°C temperature to the laboratory, serum cen-trifuged within one day from arrival and stored with nasalswabs at 4°C for one to three days until analysis. Analiquot of serum was stored at −20°C for subsequent ana-lysis for concentration of SAA.
Standardised field exercise testThe SFE was used as an objective measurement offitness of the horses. All SFEs were conducted on theracetracks at respective TYs and were standardisedwithin each TY. After a standardised warm-up, everyhorse had its running time recorded over a set distanceof 500–2000 m (depending on TY), where the driverused a heart rate (HR) monitor (Polar Equine CS600X,Polar Electro Sverige AB, Bromma, Sweden) to keep thehorse working at 210 bpm. This procedure was to ensurethat blood lactate accumulation would exceed 4 mmol/lbased on earlier studies showing lactate accumulation of4 mmol/l at a HR of 200 bpm (Persson 1983). While theset HR of SFE likely demanded differing workload fromindividual horses, every horse was its own control forcomparing running times as measures of its fitness.
Poor performancePerformance of the horses was defined in a three-stepprocedure. First, trainers’ subjective opinions were usedto classify performance based on the SFE or the trainingor race on the same or the previous day. Secondly, per-formance was defined mathematically where one SFEdeviating more than one sd from the individual horse’smean running time of all SFEs, was defined as poor per-formance. This classification step was only made if thehorse had carried out at least four SFEs during the studyperiod. All SFE recordings were then analysed graphic-ally per horse focusing on time trends considering ageand experience. A poor performance event based onmathematical criteria could be redefined as normal per-formance, if an SFE with a slow running time occurredearly in the study period, when the horse was young andinexperienced and the graphical evaluation showed aclear trend with improvement during the study period.Three horses were reclassified from poor to normal per-formance based on this adjustment criterion. The thirdstep combined trainer and SFE data to define poor per-formance on any criteria.
Laboratory analysisAll laboratory analyses were carried out at SVA. Serumantibodies to equine herpesvirus type 1 (EHV-1) andequine herpesvirus type 4 (EHV-4), equine rhinitis Avirus (ERAV) and equine rhinitis B virus (ERBV) wereanalysed within one to three days after arrival to thelaboratory whereas SAA was analysed within two weeks.Remaining serum was kept at −20°C and the swabs werestored at −70°C. Nasal swabs were analysed for thenucleic acid of equine influenza virus (EIV), EHV-1 andEHV-4, ERBV and equine arteritis virus (EAV) usingqPCR.
qPCRPrimer and probe sequences for the in-house developedassays targeting EHV-1, EHV-4, ERBV and EIV weredesigned using the software Beacon Designer (PremierBiosoft), GenBank number for sequences used for the
2 Back H, et al. Vet Rec Open 2015;2:e000107. doi:10.1136/vetreco-2014-000107
Open Access
on 10 June 2018 by guest. Protected by copyright.
http://vetrecordopen.bmj.com
/V
et Rec O
pen: first published as 10.1136/vetreco-2014-000107 on 17 June 2015. Dow
nloaded from
design of oligos: EHV-1: M29234, M19966, L07272;EHV-4: AF030027; ERVB: X96871, EIV: AF001662,AF001664, AF001665, AF001666, AF001667, AF0011668,AF001669, AF001671, AF001672, AF001673. For thedetection of EAV, primer and probe sequences as earlierdescribed (Balasuriya and others 2002, Lu and others2008) were used.All qPCR assays were performed as follows: 10 µl
proteinase k (Sigma, P4850,Sigma Aldrich, St Louis,USA) was added to 90 µl of the Eswab buffer beforenucleic acid extraction in a Magnatrix 8000+ robot(NorDiag AB, Hägersten, Sweden) using the extractionkit NorDiag Vet Viral NA (NorDiag AB, Hägersten,Sweden) extraction kit according to the manufacturer’sinstructions. The nucleic acid was eluted in 70 µl elutionbuffer of which 2 µl were added to 13 µl of PCR-mix(AgPath-ID One-Step QPCR, Applied Biosystems) foreach assay. TaqMan PCR assays targeting the genesdescribed in Table 1 were used. The thermal profileused was: 45°C for 10 minutes, 95°C for 10 minutes fol-lowed by (95°C for 15 seconds; 60°C for 45 seconds)×48. The tests were run in parallel on a 96-well plate.The results from the qPCR were measured as Cq (quan-tification cycle) values, previously referred to as Ctvalues, where Cq<40 was considered as a positive result.This table shows the names, mastermix concentrations,
sequences and targets for primes and probes used forequine arthritis virus (EAV), EHV-1, EHV-4, ERBV andEIV included within the multiplex qPCR assay that wasused in a cohort of Standardbred trotters. (T)i indicatesthe use of an internal quencher DABCYL.
Virus neutralisation testPresence of ERAV and ERBV antibodies was demon-strated by virus neutralisation (VN) test (Kriegshauserand others 2005) using ERAV strain 1722/Switzerlandand ERBV 5/15/95 Newmarket strain in the assay.Dilutions tested ranged from 1:2 to 1:156250 for ERAVand from 1:2 to 1:256 for ERBV.
Complement fixation testThe presence of antibodies for EHV-1 and EHV-4 wasexamined by complement fixation (CF) test as earlierdescribed (Thomson and others 1976) with guinea pigcomplement and erythrocytes from sheep (Rockbornand others 1990). Dilutions tested in this assay rangedfrom 1:4 to 1:64.
Serum amyloid AThe SAA analyses were performed as earlier described(Hillstrom and others 2010), where a serum concentra-tion of ≤20 mg/l was classified as normal (Jacobsen andAndersen 2007).
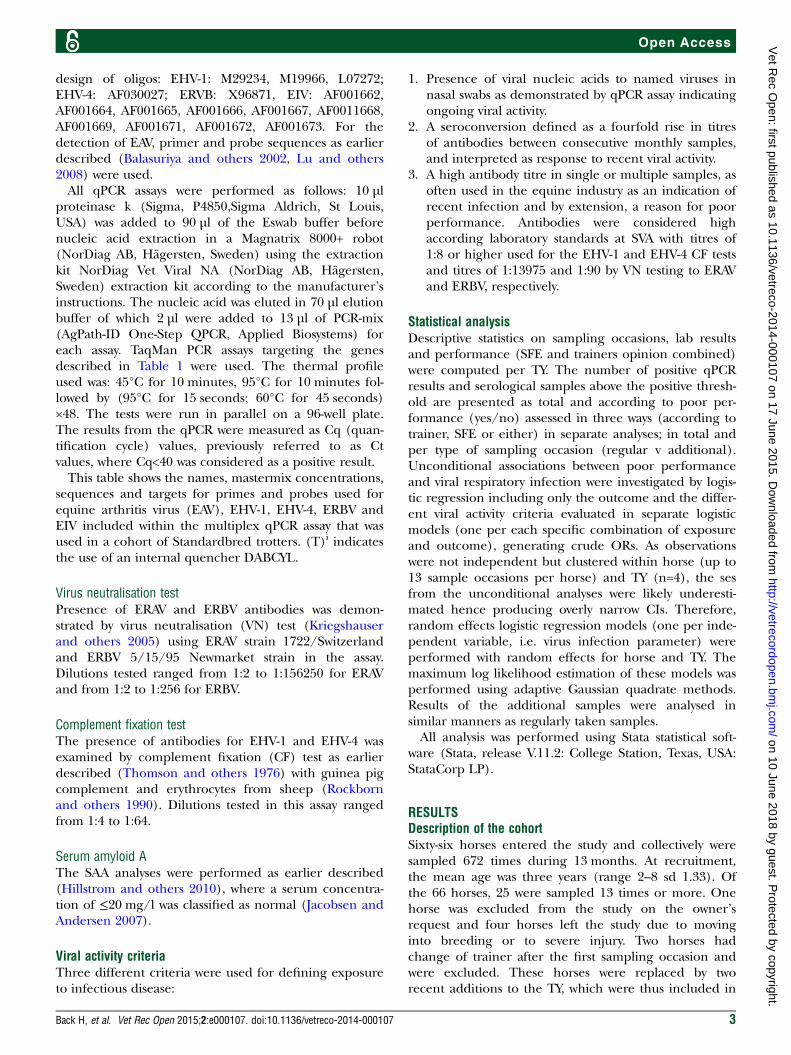
Viral activity criteriaThree different criteria were used for defining exposureto infectious disease:
1. Presence of viral nucleic acids to named viruses innasal swabs as demonstrated by qPCR assay indicatingongoing viral activity.
2. A seroconversion defined as a fourfold rise in titresof antibodies between consecutive monthly samples,and interpreted as response to recent viral activity.
3. A high antibody titre in single or multiple samples, asoften used in the equine industry as an indication ofrecent infection and by extension, a reason for poorperformance. Antibodies were considered highaccording laboratory standards at SVA with titres of1:8 or higher used for the EHV-1 and EHV-4 CF testsand titres of 1:13975 and 1:90 by VN testing to ERAVand ERBV, respectively.
Statistical analysisDescriptive statistics on sampling occasions, lab resultsand performance (SFE and trainers opinion combined)were computed per TY. The number of positive qPCRresults and serological samples above the positive thresh-old are presented as total and according to poor per-formance (yes/no) assessed in three ways (according totrainer, SFE or either) in separate analyses; in total andper type of sampling occasion (regular v additional).Unconditional associations between poor performanceand viral respiratory infection were investigated by logis-tic regression including only the outcome and the differ-ent viral activity criteria evaluated in separate logisticmodels (one per each specific combination of exposureand outcome), generating crude ORs. As observationswere not independent but clustered within horse (up to13 sample occasions per horse) and TY (n=4), the sesfrom the unconditional analyses were likely underesti-mated hence producing overly narrow CIs. Therefore,random effects logistic regression models (one per inde-pendent variable, i.e. virus infection parameter) wereperformed with random effects for horse and TY. Themaximum log likelihood estimation of these models wasperformed using adaptive Gaussian quadrate methods.Results of the additional samples were analysed insimilar manners as regularly taken samples.All analysis was performed using Stata statistical soft-
ware (Stata, release V.11.2: College Station, Texas, USA:StataCorp LP).
RESULTSDescription of the cohortSixty-six horses entered the study and collectively weresampled 672 times during 13 months. At recruitment,the mean age was three years (range 2–8 sd 1.33). Ofthe 66 horses, 25 were sampled 13 times or more. Onehorse was excluded from the study on the owner’srequest and four horses left the study due to movinginto breeding or to severe injury. Two horses hadchange of trainer after the first sampling occasion andwere excluded. These horses were replaced by tworecent additions to the TY, which were thus included in
Back H, et al. Vet Rec Open 2015;2:e000107. doi:10.1136/vetreco-2014-000107 3
Open Access
on 10 June 2018 by guest. Protected by copyright.
http://vetrecordopen.bmj.com
/V
et Rec O
pen: first published as 10.1136/vetreco-2014-000107 on 17 June 2015. Dow
nloaded from

the study from months 2 and 3, respectively. Another 15horses left the study prematurely at various time pointsdue to change of trainers after contributing 2–10 occa-sions. As well, one to three sample occasions werelacking from19 horses due to racing on the samplingday. From the 672 sample occasions, 88 were excludedfrom further analysis because of injury or disease unre-lated to the respiratory tract, and data were thereforemissing for those occasions. The results of the authors’analyses are based on the remaining 584 sampling occa-sions in 63 horses, of which 560 were regular and 24were additional sampling occasions. The additional sam-pling occasions were mostly clustered within one trainer.
Poor performanceThe trainers’ opinion was registered on all 584 occasionsand results from SFE were available in 327 occasions.The SFE was not performed on 257 occasions due to:altered training schedule due to racing (n=160), poorrace track conditions (n=62) or signs of mild respiratorydisease (n=35). In total there were 96 (16 per cent)events of poor performance identified at the 584 sam-pling occasions. Of these 52 events were based on trai-ners’ opinion and 45 of them on SFE. Of the 52trainers’ opinion-based events of poor performance 9also had a SFE conducted, but only one of the SFEs wasclassified as poor performance.
Laboratory analysisResults from the laboratory analysis and the perform-ance were subdivided by trainer and listed in Table 2.This table describes the different outcomes and expo-
sures of the horses in a prospective longitudinal study,divided into the four participating TYs.
qPCRNone of the horses were positive for EIV, EHV-1 or EAV onthe qPCR, and thus these viruses are not included in
Table 2. Five samples from four horses tested positive forERBV with Cq-values within the range of 33.6–35.9 (onehorse was positive twice with one month with negativeresults in between). None of the qPCR-positive ERBV sam-pling occasions coincided with seroconversion, and sero-conversion did not occur in association with the singleqPCR positive sampling occasion for EHV-4 (Cq=28.9).
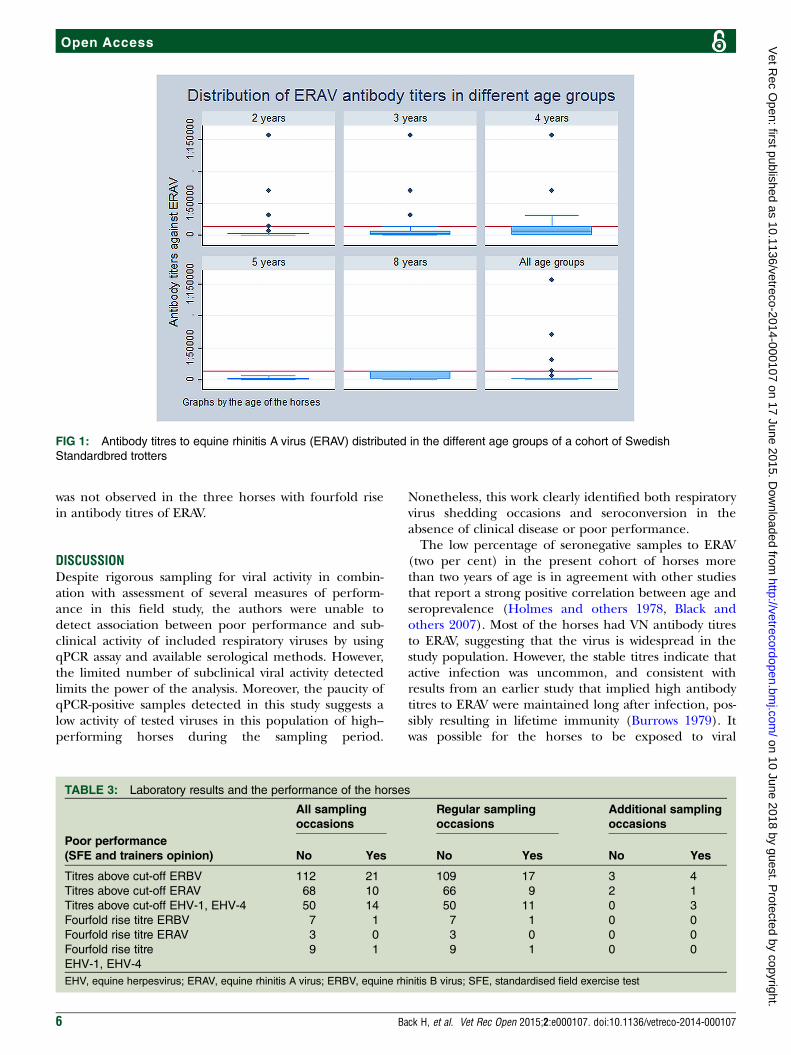
VN testFig 1 shows the age distribution of the ERAV antibodytitres, with measurable but low and stable titres for themajority of individuals, and only two per cent truly sero-negative sampling occasions. Thirty-eight of the horseshad ERAV antibody titres, that remained under thecut-off during the entire study and the remaining 25horses had 78 sampling occasions with titres above thecut-off. Three horses from one TY had a fourfold rise intitres between monthly sampling occasions.Regarding ERBV 29 horses had titres consistently
under the cut-off, and 34 horses had 133 sampling occa-sions with titres above the cut-off. Eight horses hadsingle events of fourfold rise in titres between monthlysampling occasions. One horse was completely seronega-tive on a single sampling occasion and had very lowtitres (1:8–1:16) in remaining samples.
CF testFor the CF analysis of EHV-1 and EHV-4, 64 samples were atthe threshold of 1:8 or higher. Of these, 14 had been vacci-nated against equine herpesvirus four to eight weeks earlier.There were 10 horses that had paired samples with a four-fold rise in titres of antibodies, eight of which had been vac-cinated against EHV-1 and EHV-4 four weeks earlier.
SAAOf the 584 sample occasions SAA was classified as posi-tive in 10 animals (i.e. SAA >20 mg/l) (4<100 mg/l, 4130–650 mg/l, 2<900 mg/l).
TABLE 1: Primers and probes used in the multiplex qPCR assay
Virus Primers and probes
Conc.
(nM) Sequence 50-30 Reference Gene size
EAV EAV 7.53 F
EAV 7.256R
EAV 7.92R
400
400
134
GGCGACAGCCTACAAGCTACA
CGGCATCTGCAGTGAGTGA
6-FAM-TTGCGGACCCGCA(T)iCTGACCAA
[14;15] ORF6-ORF-7
204 bp
EHV-1 EHV-1 Forward
EHV-1 Reverse
EHV-1 TaqMan
400
400
134
GCGATATTAACTTATGCCTCTGGA
GTAGATTCTGTACCGTTTGCGTTA
6-FAM-TAGCTCCAGCCAGAG(T)iACGCCCGC
This publication Glycoprotein C
143 bp
EHV-4 EHV-4 Forward
EHV-4 Reverse
EHV-4 TaqMan
100
100
134
AGCCTACAGCGTGGAACACA
CATGTCACCGAGTAGGTAGCG
6-FAM-ACCCTTG(T)iGTTTGACCGCCACCCG
This publication ORF2, TK
105 bp
ERBV ERBV Forward
ERBV Reverse
Rhi TaqMan
400
400
134
GAGGAACCTGACAGTTTTGAGTTG
ATCTGTGCAAACAATGAGGAAGC
6-FAM-AAGCC(T)iCAACAGCAGCCTCCAGGT
This publication RNA Pol
128 bp
EIV Influenza Forward
Influenza Reverse
Influenza TaqMan
100
100
134
ATGGACCAGGCAATCATGGATAA
GGAAGAGAAGGCAATGGTGAAATT
6-FAM-CGCCAACGAC(T)iGCTCCTTCTTCGG
This publication NS1
146 bp
EAV, equine arteritis virus; EHV, equine herpesvirus; EIV, equine influenza virus; ERBV, equine rhinitis B virus
4 Back H, et al. Vet Rec Open 2015;2:e000107. doi:10.1136/vetreco-2014-000107
Open Access
on 10 June 2018 by guest. Protected by copyright.
http://vetrecordopen.bmj.com
/V
et Rec O
pen: first published as 10.1136/vetreco-2014-000107 on 17 June 2015. Dow
nloaded from

SAA was elevated in 6 of 96 events of poor perform-ance whereas no elevations were found in samplingoccasions when qPCR for virus was positive. SAA wasalso normal in all samples with high antibody titre forERAV, and all but one each of the occasions with hightitres to ERBV and EHV-1 and EHV-4.
Statistical analysisRandom effects logistic regression did not identify anysignificant association between poor performances andthe activity or presence of different viruses investigatedin this study.
Clinical signs versus laboratory analysisNo clinical respiratory signs were observed inqPCR-positive horses (five for ERBV and one for EHV-4)nor in horses with high antibody titres to ERAV, ERBVand EHV-1 and EHV-4. Moreover, none of these horseshad changes in concentration of SAA indicative of sys-temic inflammation.
Poor performance versus laboratory analysisIn Table 3, positive lab results are combined with per-formance of the horses and divided into three groups:all sampling occasions, regular sampling occasions andadditional sampling occasions.Estimates of poor performance were based on trai-
ners’ opinion and SFE test, and results from laboratoryanalysis for viral infections of equine herpesvirus (EHV),ERAV and ERBV, in 63 Standardbred trotters from fourhigh-performing TYs in Sweden. The number of sampleoccasions in each category is divided into three groups:all samples, the samples taken on regular basis once amonth and the extra samples, during which presence ofpoor performance (Yes/No) was recorded.The five ERBV sampling occasions positive in qPCR
were all from horses from the same trainer. Two of thesewere from the same horse and detected with twoqPCR-negative intervening months. Poor performance(based on SFE) was observed on the second positiveoccasion. None of the other qPCR-positive samples,including the EHV-4 positive, were associated with epi-sodes of poor performance. Similarly, poor performance
TABLE 2: Laboratory results and performance divided on training yards
TY 1 TY 2 TY 3 TY 4 Sum
Horses (n) 36 10 14 3 63
Horses excluded (n) 1 0 2 0 3
Horses added (n) 0 0 2 0 2
Sampling occasions* (n) 314 110 126 34 584
Additional sampling occasions† (n) 20 3 0 1 24
Horses with additional sampling occasions (n) 16 3 0 1 20
Sampling occasions (%)
max: horse×13
67 83 69 100 –
Horses without missing sampling occasions (%) 0 20 0 100 –
Positive PCR
ERBV (n)
5 0 0 0 5
Positive PCR
EHV-4 (n)
0 1 1 0 2
Titres above cut-off ERBV (n) 67 23 17 26 133
Titres above cut-off ERAV (n) 32 12 27 7 79
Titres above cut-off EHV-1, EHV-4 (n) 44 18 2 0 64
Fourfold rise titre
ERBV (n)
3 3 2 0 8
Fourfold rise titre
ERAV (n)
3 0 0 0 3
Fourfold rise titre
EHV-1, EHV-4 (n)
1 8 1 0 10
Poor performance, total (n) 54 23 15 4 96‡
Poor performance, SFE (n) 21 8 14 2 45
Poor performance,
according to trainer (n)
33 16 1 2 52
SAA above threshold (n) 7 0 3 0 10
*The number of sampling occasions that were based on the regular monthly visits†Additional sampling occasions due to events of poor performance and/or clinical respiratory signs, occurring outside regular samplingoccasions‡The 96 sampling occasions with poor performance included 52 which were based on trainers’ reports and 45 based on SFEs and 1 horse inwhich trainers’ report and SFE coincidedEHV, equine herpesvirus; ERAV, equine rhinitis A virus; ERBV, equine rhinitis B virus; n, number; SAA, serum amyloid A; SFE, standardisedfield exercise test; TY, training yard
Back H, et al. Vet Rec Open 2015;2:e000107. doi:10.1136/vetreco-2014-000107 5
Open Access
on 10 June 2018 by guest. Protected by copyright.
http://vetrecordopen.bmj.com
/V
et Rec O
pen: first published as 10.1136/vetreco-2014-000107 on 17 June 2015. Dow
nloaded from
was not observed in the three horses with fourfold risein antibody titres of ERAV.
DISCUSSIONDespite rigorous sampling for viral activity in combin-ation with assessment of several measures of perform-ance in this field study, the authors were unable todetect association between poor performance and sub-clinical activity of included respiratory viruses by usingqPCR assay and available serological methods. However,the limited number of subclinical viral activity detectedlimits the power of the analysis. Moreover, the paucity ofqPCR-positive samples detected in this study suggests alow activity of tested viruses in this population of high--performing horses during the sampling period.
Nonetheless, this work clearly identified both respiratoryvirus shedding occasions and seroconversion in theabsence of clinical disease or poor performance.The low percentage of seronegative samples to ERAV
(two per cent) in the present cohort of horses morethan two years of age is in agreement with other studiesthat report a strong positive correlation between age andseroprevalence (Holmes and others 1978, Black andothers 2007). Most of the horses had VN antibody titresto ERAV, suggesting that the virus is widespread in thestudy population. However, the stable titres indicate thatactive infection was uncommon, and consistent withresults from an earlier study that implied high antibodytitres to ERAV were maintained long after infection, pos-sibly resulting in lifetime immunity (Burrows 1979). Itwas possible for the horses to be exposed to viral
FIG 1: Antibody titres to equine rhinitis A virus (ERAV) distributed in the different age groups of a cohort of Swedish
Standardbred trotters
TABLE 3: Laboratory results and the performance of the horses
All sampling
occasions
Regular sampling
occasions
Additional sampling
occasions
Poor performance
(SFE and trainers opinion) No Yes No Yes No Yes
Titres above cut-off ERBV 112 21 109 17 3 4
Titres above cut-off ERAV 68 10 66 9 2 1
Titres above cut-off EHV-1, EHV-4 50 14 50 11 0 3
Fourfold rise titre ERBV 7 1 7 1 0 0
Fourfold rise titre ERAV 3 0 3 0 0 0
Fourfold rise titre
EHV-1, EHV-4
9 1 9 1 0 0
EHV, equine herpesvirus; ERAV, equine rhinitis A virus; ERBV, equine rhinitis B virus; SFE, standardised field exercise test
6 Back H, et al. Vet Rec Open 2015;2:e000107. doi:10.1136/vetreco-2014-000107
Open Access
on 10 June 2018 by guest. Protected by copyright.
http://vetrecordopen.bmj.com
/V
et Rec O
pen: first published as 10.1136/vetreco-2014-000107 on 17 June 2015. Dow
nloaded from

infections at races or at introduction of new horses atthe TYs, however, a rise in titres of antibodies would beexpected if a clinical infection would have occurred. Inorder to evaluate the diagnostic value of single high anti-body titre samples when investigating poor performance,the authors analysed all horses individually using theviral activity criteria. However, since one high titre couldremain stable without signs of ongoing infection, thediagnostic value of a single serum sample appears to beminimal. In the present study three seroconversions toERAV at one occasion at one TY without accompanyingclinical respiratory signs or poor performance, indicatedan active subclinical infection by this virus. Furthermore,the seroconversions without clinical signs observedin already seropositive horses, support other work sug-gesting that persistent antibodies to ERAV have a pre-ventive effect against clinical disease with re-infection(Diaz-Mendez and others 2014).For ERBV all but 0.2 per cent of the sampling occa-
sions had VN antibodies, indicating that the virus iswidespread. Moreover, the eight seroconversions toERBV at different occasions occurred without clinicalsigns and with normal performance indicating subclin-ical infection. This suggests antibodies to ERBV mighthave a protective effect against clinical disease afterre-infection. Similar to the authors’ findings for ERAV,single high titres to ERBV appear to be of little clinicalvalue to predict recent or ongoing infection.Despite identifying 10 occasions of SAA elevations that
have been shown to occur in EIV (Hulten and others1999) and other conditions with systemic inflammation(Jacobsen and Andersen 2007), none were associated witheither subclinical viral activity or poor performance as itwas defined in this study. Furthermore, no correlationbetween the levels of SAA and the performance could bedetected in the serially sampled horses in this study. Thiscontrasts a previous cross-sectional study including 38endurance horses, where mean values of SAA were higherafter workload in the group of 9 horses with poor perform-ance compared with the group of 11 with intermediatelyperformance (Fraipont and others 2011). The differenceobserved between the studies may be because the meanvalue of SAA was evaluated and compared, whereas thepresent study evaluated SAA individually. However, theworkloads differed substantially between the endurancehorses where exhaustion and metabolic problems can beexpected and provide a far stronger inflammatory stimulusfor SAA elevation compared with intensive but compara-tively short-lived workload of the trotters.This study used two ways to determine the perform-
ance of the horses; one subjective method (trainersopinion) and one objective method (SFE) based onwell-established methods using HR and speed to ensureblood lactate exceeded 4 mmol/ml (V4, V200)(Courouce and others 1997; Leleu and others 2005)and then combining them to maximise the cases ofpoor performance identified. Despite this approach, thepoor performance events in this study were few.
Unfortunately, it was not possible in this study to identifywhether the trainers and the SFE were defining poorperformance in a different way, since only nine SFEswere performed of the 52 occasions when poor perform-ance was registered according to the trainer. Out of the52 occasions when trainers reported poor performance,15 were taken as additional occasions due to poor per-formance according to the trainer and therefore SFEswere lacking. Although SFEs and trainers only agreed onpoor performance in one of the nine occasions, six ofthe remaining eight SFEs had among the slowest individ-ual running times (but not slow enough to be classifiedas poor performance in the SFE). This suggests that therelationship between SFEs and the opinion of the pro-fessional trainer deserves further scrutiny. This resultalso shows the usefulness with complimentary definitionsof poor performance in a longitudinal study in TYs.This study followed high-performing Standardbred
trotters in their own environment over a year. Theauthors were therefore able to study how natural viralinfections can appear in the same elite horse over time.The long study period was also a limitation, since theauthors could not control if a horse suddenly left thestudy due to change of trainer, injury or disease. Sincethe laboratory result, performance and health statuswere evaluated individually before statistical analysis, lossof observations would not lead to biased results. Thereare obvious limitations with using trainers’ opinion as away of determining poor performance since it is verysubjective. However, trainers do contact veterinarianswhen they have the impression of poor performanceand the parameter can therefore be of interest to theequine clinician. By sampling horses monthly, there isalways a risk of unnoticed infections. In this study thehorses were weekly monitored by the same veterinarian,making detection of clinical respiratory disease and theopportunity of extra samples possible. Due its rareoccurrence in horses with clinical disease in Sweden,qPCR assay for ERAV was not prioritised in this study.Furthermore, serological analysis against other knownviruses such as EIV and EAV was not included, since allhorses were vaccinated twice per year against EIV andclinical disease due to EAV is rare in Sweden.
CONCLUSIONSIn this study, subclinical viral activity, as indicated by ser-oconversions, single high antibody titres and/or qPCRpositivity to ERAV, ERBV, EHV-1 and EHV-4 were notassociated with either quantitative or qualitative epi-sodes of poor performance. Additionally, changes inthe acute phase protein SAA were not predictive ofeither subclinical viral activity or poor performance inthese horses. Finally, few to no horses two years orolder were completely seronegative to ERAV and ERBVand VN antibody titres to ERBV can remain high for atleast one year in the absence of viral shedding orseroconversion.
Back H, et al. Vet Rec Open 2015;2:e000107. doi:10.1136/vetreco-2014-000107 7
Open Access
on 10 June 2018 by guest. Protected by copyright.
http://vetrecordopen.bmj.com
/V
et Rec O
pen: first published as 10.1136/vetreco-2014-000107 on 17 June 2015. Dow
nloaded from

Author affiliations1Department of Virology, Immunobiology and Parasitology, NationalVeterinary Institute, Uppsala, Sweden2Department of Veterinary Epidemiology and Public Health, University ofSurrey, Guildford, UK3Department of Clinical Sciences, Swedish University of Agricultural Sciences,Uppsala, Sweden4Equine Hospital Solvalla, Stockholm, Sweden5Department of Disease Control and Epidemiology, National VeterinaryInstitute, Uppsala, Sweden
Acknowledgements The authors thank Dr Jean-Francois Valarcher at theNational Veterinary Institute, Uppsala, Sweden for critical review of themanuscript. The authors also thank Karin Thulin and Anna Lindhe for technicalassistance during sampling and are grateful to the trainers who participatedwith their horses in this study.
Contributors HB contributed to study execution, data analysis andinterpretation and writing of the manuscript. JPe contributed to data analysisand interpretation and writing of the manuscript. JPr contributed to writing ofthe manuscript and interpretation of data. MI contributed to developing theqPCR technique and preparation of the manuscript. NR was involved in thestudy design, sample collection and provided contact with the horses andtrainers. LTB contributed to study design and sample collection. KScontributed to study design, data analysis and interpretation and writhing ofthe manuscript. All authors have approved the final version of the manuscript.
Funding The study was funded by the Swedish-Norwegian Foundation forEquine Research (Grant number H0947319).
Competing interests None declared.
Patient consent Obtained.
Ethics approval This study was approved by the Swedish Animal Ethicalcommittee. Informed consent was obtained from the trainers.
Provenance and peer review Not commissioned; externally peer reviewed.
Data sharing statement No additional data are available.
Open Access This is an Open Access article distributed in accordance withthe Creative Commons Attribution Non Commercial (CC BY-NC 4.0) license,which permits others to distribute, remix, adapt, build upon this work non-commercially, and license their derivative works on different terms, providedthe original work is properly cited and the use is non-commercial. See: http://creativecommons.org/licenses/by-nc/4.0/
REFERENCESBalasuriya U. B. R., Leutenegger C. M., Topol J. B., Mccollum W. H.,Timoney P. J., Maclachlan N. J. (2002) Detection of equine arteritis virusby real-time TaqMan (R) reverse transcription-PCR assay. Journal ofVirological Methods 101, 21–28
Black W. D., Wilcox R. S., Stevenson R. A., Hartley C. A., Ficorilli N. P.,Gilkerson J. R., Studdert M. J. (2007) Prevalence of serum neutralisingantibody to equine rhinitis A virus (ERAV), equine rhinitis B virus 1(ERBV1) and ERBV2. Veterinary Microbiology 119, 65–71
Burrows R. (1979) Equine rhinovirus and adenovirus infections.Proceedings of the 24th Annual Convention of the American Associationof Equine Practitioners 1978 299–306
Carman S., Rosendal S., Huber L., Gyles C., Mckee S., Willoughby R. A.,Dubovi E., Thorsen J., Lein D. (1997) Infectious agents in acuterespiratory disease in horses in Ontario. Journal of Veterinary DiagnosticInvestigation 9, 17–23
Courouce A., Chatard J. C., Auvinet B. (1997) Estimation ofperformance potential of Standardbred trotters from blood lactate
concentrations measured in field conditions. Equine Veterinary Journal29, 365–369
Daley P., Castriciano S., Chernesky M., Smieja M. (2006) Comparison offlocked and rayon swabs for collection of respiratory epithelial cells fromuninfected volunteers and symptomatic patients. Journal of ClinicalMicrobiology 44, 2265–2267
Diaz-Mendez A., Hewson J., Shewen P., Nagy E., Viel L. (2014)Characteristics of respiratory tract disease in horses inoculated withequine rhinitis A virus. American Journal of Veterinary Research 75,169–178
Fraipont A., Van Erck E., Ramery E., Richard E., Denoix J. M., Lekeux P.,Art T. (2011) Subclinical diseases underlying poor performance inendurance horses: diagnostic methods and predictive tests. VeterinaryRecord 169, 154
Hillstrom A., Tvedten H., Lilliehook I. (2010) Evaluation of an in-clinicSerum Amyloid A (SAA) assay and assessment of the effects of storageon SAA samples. Acta Veterinaria Scandinavica 52, 8
Holmes D. F., Kemen M. J., Coggins L. (1978) Equine rhinovirus infection—serologic evidence of infection in selected United States horsepopulations. Equine Infectious Diseases IV 315–319
Hulten C., Sandgren B., Skioldebrand E., Klingeborn B., Marhaug G.,Forsberg M. (1999) The acute phase protein serum amyloid A (SAA) asan inflammatory marker in equine influenza virus infection. ActaVeterinaria Scandinavica 40, 323–333
Jacobsen S., Andersen P. H. (2007) The acute phase protein serumamyloid A (SAA) as a marker of inflammation in horses. EquineVeterinary Education 19, 38–46
Kriegshauser G., Deutz A., Kuechler E., Skern T., Lussy H., Nowotny N.(2005) Prevalence of neutralizing antibodies to Equine rhinitis A and Bvirus in horses and man. Veterinary Microbiology 106, 293–296
Leleu C., Cotrel C., Courouce-Malblanc A. (2005) Relationships betweenphysiological variables and race performance in French standardbredtrotters. Veterinary Record 156, 339–342
Lu Z., Branscum A. J., Shuck K. M., Zhang J., Dubovi E. J.,Timoney P. J., Balasuriya U. B. R. (2008) Comparison of two real-timereverse transcription polymerase chain reaction assays for the detectionof Equine arteritis virus nucleic acid in equine semen and tissue culturefluid. Journal of Veterinary Diagnostic Investigation 20, 147–155
Morris E. A., Seeherman H. J. (1991) Clinical evaluation of poorperformance in the race horse-the results of 275 evaluations. EquineVeterinary Journal 23, 169–174
Mumford J. A., Rossdale P. D. (1980) Virus and its relationshipto the poor performance syndrome. Equine Veterinary Journal 12, 3–9
Persson S. G. B. (1983) Evaluation of exercise tolerance and fitness in theperformance horse. Equine exercise physiology. Proceedings of the FirstInternational Conference 441–457
Powell D. G., Burrows R., Spooner P. R., Goodridge D., Thomson G. R.,Mumford J. (1978) A study of infectious respiratory disease amonghorses in Great Britain, 1971–1976. Equine Infectious Diseases IV451–459
Pusterla N., Kass P. H., Mapes S., Johnson C., Barnett D. C., Vaala W.,Gutierrez C., Mcdaniel R., Whitehead B., Manning J. (2011) Surveillanceprogramme for important equine infectious respiratory pathogens in theUSA. Veterinary Record 169, 12
Richard E. A., Fortier G. D., Pitel P.-H., Dupuis M.-C., Valette J.-P., Art T.,Denoix J.-M., Lekeux P. M., Van Erck E. (2010) Sub-clinical diseasesaffecting performance in Standardbred trotters: Diagnostic methods andpredictive parameters. Veterinary Journal 184, 282–289
Rockborn G., Klingeborg B., Junitii N. eds (1990) Diagnostic Virology.Second Part: Guidebook to Procedures. Uppsala, Sweden: SwedishUniversity of Agricultural Sciences. National Veterinary Institute. SwedishInternational Development Authority
Thomson G. R., Mumford J. A., Campbell J., Griffiths L., Clapham P.(1976) Serological detection of equid herpesvirus 1 infections of therespiratory tract. Equine Veterinary Journal 8, 58–65
Traub-Dargatz J. L., Salman M. D., Voss J. L. (1991) Medical problems ofadult horses, as ranked by equine practitioners. Journal of the AmericanVeterinary Medical Association 198, 1745–1747
Wilsher S., Allen W. R., Wood J. L. N. (2006) Factors associated withfailure of Thoroughbred horses to train and race. Equine VeterinaryJournal 38, 113–118
8 Back H, et al. Vet Rec Open 2015;2:e000107. doi:10.1136/vetreco-2014-000107
Open Access
on 10 June 2018 by guest. Protected by copyright.
http://vetrecordopen.bmj.com
/V
et Rec O
pen: first published as 10.1136/vetreco-2014-000107 on 17 June 2015. Dow
nloaded from