Download - SIES - College of Management Studies
142
The best of times and the worst of times….. The second half of the year brought with it both glory and pain. Despite serious odds, India put on a great show at the Commonwealth Games with our sportsmen improving the medals tally to an all time great. On the other hand, the CWG organizers were plagued with charges of corruption and the blame game still continues. The economic recovery had barely begun when Greece’s economic crisis affected the whole of Europe. Nation after nation declared bankruptcy and the world economic order looks poised for a change. India faces its own economic hardships with galloping inflation - double digits in over forty years. The industrial growth is however picking up so there is a silver lining to the darkening clouds. It was a year of triumphs and a year of scams and scandals. A largely illiterate and religious populace showed remarkable restraint in accepting the Babri Masjid verdict. It was a victory of democracy and secularism over communal forces. The judiciary on the other hand became mired in controversies and even the highest courts and the senior most judges did not escape unscathed. The end of the year showed our Sports men and women bringing laurels at the Asian Games while the nation reeled under one scam or the other. The Czars of the corporate world showed tremendous magnanimity by endowing educational institutes with large sums of money to further the cause of education and research. Yet, corruption appears to have become institutionalized and neither the armed forces, bureaucracy, politicians, corporate nor judges appear to be above it. It was the best of times and maybe also not the very best of times. May the New Year bring in better times. Sharmila Mohapatra Editor
Transcript of Download - SIES - College of Management Studies
1SIES Journal of Management, April - August 2010, Vol.7(1)
The best of times and the worst of times…..
The second half of the year brought with it both glory and pain. Despite serious odds, India put on a great show at the Commonwealth Games with our sportsmen improving the medals tally to an all time great. On the other hand, the CWG organizers were plagued with charges of corruption and the blame game still continues.
The economic recovery had barely begun when Greece’s economic crisis affected the whole of Europe. Nation after nation declared bankruptcy and the world economic order looks poised for a change. India faces its own economic hardships with galloping inflation - double digits in over forty years. The industrial growth is however picking up so there is a silver lining to the darkening clouds.
It was a year of triumphs and a year of scams and scandals. A largely illiterate and religious populace showed remarkable restraint in accepting the Babri Masjid verdict. It was a victory of democracy and secularism over communal forces. The judiciary on the other hand became mired in controversies and even the highest courts and the senior most judges did not escape unscathed.
The end of the year showed our Sports men and women bringing laurels at the Asian Games while the nation reeled under one scam or the other. The Czars of the corporate world showed tremendous magnanimity by endowing educational institutes with large sums of money to further the cause of education and research. Yet, corruption appears to have become institutionalized and neither the armed forces, bureaucracy, politicians, corporate nor judges appear to be above it. It was the best of times and maybe also not the very best of times.
May the New Year bring in better times.
Sharmila MohapatraEditor

2
ISSN 0974-2956
Published BySouth Indian Education Society College of Management Studies,Sri Chandrasekharendra Saraswathy Vidyapuram,Plot no. 1-E, Sector V, Nerul, Navi Mumbai,India. Pin Code - 400 706.
Printed At Ennel Vision, Mumbai
DisclaimerThe editorial team has taken utmost care to provide quality editorial articles in the journal. However, the publisher is not responsible for the representation of facts, adaptation of material, interviews with persons and personal views of the authors with respect to their articles.
SIES Journal of Management
Volume 7, Issue 1, April - August 2010 ArticlesSudhir K. Chawla, Dan Khanna & Jin Chen
Are Small Business Critical Success Factors Same in Different Countries?
Matthew Stark and Raj Devasagayam
Developing Empirical Measures of Intraperson Games Constructs
Riteshkumar Dalwadi , Harishchandra Singh Rathod & Atul Patel
Key Retail Store Attributes Determining Consumers’ Perceptions: An Empirical Study of Consumers of Retail Stores Located in Ahmedabad (Gujarat)
Rajesh Nair, Ranjith P V, Sumana Bose and Charu Shri
A Study of Service Quality on Banks with Servqual Model
M.G.Parameshwaran and R.K.Srivastava
A Conceptual PaperShould Marketers Consider Religiosity in Understanding Consumer Purchase Behavior?
Sindhu Singh, Vivek Srivastava & R.K.Srivastava
Customer Acceptance of Mobile Banking: A Conceptual Framework
Aarti T. More and R.K.Srivastava Aesthetics in Pharmaceutical OTC MarketingSujata Chincholkar Review Paper “Analysis of Impact of Promoters’ Stake on the
Firm Value in the Indian Corporate Sector”Pallavi Sachin Jadhav Review Paper
Electronic Media and Reading HabitsKoel RoyChoudhury Review Paper
Special Economic Zones in China Nitin Vazirani Review Paper
Competencies and Competency Model-A Brief overview of its Development and Application
Sharmila Mohapatra and Vatsala Bose
Impact of Electronic Media on the Language Used for Communication- An Exploratory Study
Editor Sharmila Mohapatra
Members of Editorial CommitteeBeverlee Anderson Prof. of Business & MarketingCalifornia State University, USA
Michael DorschProf. Marketing - Clemson University, USA
Vipin GuptaDirector & Prof of ManagementSimmons Management College, USA
SIESCOMSR.K. Srivastava – Jt. Director Meera Vijay – Principal, SIES College of Arts, Science and CommerceSuhas Tambe – Chairperson PGDBMDurga Surekha – Sr. Lecturer

1SIES Journal of Management, April - August 2010, Vol.7(1)
SIES Journal of Management, April - August 2010, Vol.7(1): 1-12
Are Small Business Critical Success Factors Same in Different Countries?
Sudhir K. Chawla, Dan Khanna & Jin ChenSudhir K. Chawla, Angelo State [email protected] Khanna, Angelo State [email protected] Chen, Zhejiang University
Abstract
This paper considers critical success factors exhibited by small businesses in China. Comparisons are made to similar prior studies performed in the US and Mexico. The information from China is further examined for changes in critical success factors through firm life cycle. Critical success factors have more similarities than differences. Critical Success Factors found in common with Mexican Small Business are Marketing Effort and Competitive Forces. The study finds that there are differences in the factor structure of the critical success factors and that the key difference is concerning meeting the financial needs and location of the small firm in China. Also a lack of support is found for a life cycle effect on the importance of the critical success factors. This new critical success factor is unique to small business in China, without counterpart in North American prior work. There is an absence of persuasive support for a variation in critical success factors with business age in China. Findings and anomalies are discussed.
Introduction
The economy of the United States of America is dependent on the health of small business and entrepreneurial firms. During 1998-2004 small business produced half of the private, non-farm (US) GDP (Kobe, 2007). The number of US small firms rises every year, energetically moving past 25 million in 2005(US SBA 2006). Small business employ 52% all US workers (Conte, 2001). Other compelling figures include that 44 percent of all sales dollars are created by small firms. The crucial role that US small business plays in the US has parallels in other national economies. Estimates gathered by National Bureau of Statistics of China (NBS)(2006), indicate that there 1,373,128 small enterprises exist. To put this into proportion, in 1995, small enterprises accounted for 62.5% of China’s total industrial output and 73.6 % of its industrial employment (Wang and Yao, 2002).
Complicating attempts at comparison between East and West, China classifies business not by employees but by output. Another way of stating this is that; when the National Bureau of Statistics of

2
Sudhir K. Chawla, Dan Khanna & Jin Chen
China speaks of a small business they are discussing a firm with small output, not small employment. The method of classification of businesses by output is comparatively more robust than a system based on employee count when measuring companies undergoing automation.
Engaging in small business, whether in China or the US is an uncertain course. In the year 2005, an estimated 584,000 or 9.7% of all US small businesses failed (Kobe 2007). So far, no research has been undertaken in China to review the factors affecting the survival of small and medium-sized enterprises and the existing data are both confused and contradictory (Li, 2002). One representative measure of business survival in general is a 1989 statistic revealing the failure rate of rural enterprises was about 16.1 per cent, or 3 million enterprises (Li, Zhang, Matlay, 2003). Previous literature explores the existence of critical business factors applicable to small business in the US (Chawla, Pullig and Alexander 1997a) and Mexico (Chawla and Pullig, Unpublished 2007). These items and factors will be enumerated and analyzed in the context of the Chinese market before they are compared with similar research conducted in the US and Mexico. These factors will then be examined with respect to the self reported business age life cycle.
Although distance, culture and economic system separates the Chinese and North American small business, seeking, discovering shared critical success factors and common strengths in these different market systems is a worthy goal.
Review of Literature
Critical Success Factors
Critical Success Factors (CSF) are: “those few things that must go well to insure the success of an organization” (Boynton and Zmund 1984). If these necessary attributes can be identified in a general population of businesses then their informed application to embryonic businesses might reduce the (high) probability that these endeavors will fail. These same factors applied to thriving businesses may enable high organizational performance (Drucker 1973). Previous literature addressed individual crucial attributes as individual strengths or weaknesses. Examples include: problems in unmanaged growth and expansion, inadequate planning, ineffective working capital management, unforgiving competitive environment, (Gaskill, Van Auken, and Manning 1993), deficiencies in management (Haswell and Holmes 1989), insufficient consultation of business professionals along with the failure to employ effective human resource solutions (Lussier 1995).
There is support in the literature to regard success and failure in small business as a duality. Elements present in success have been shown to be absent in failure. These discrete factors include personal attributes of the leadership, people skills, strategic planning, the skill level of management, and the market environment, (Ibrahim and Goodwin 1986; Hofer and Sandberg 1987; Lumpkin and Ireland 1988; Lussier 1995; Susbauer and Baker 1989).
The search for a unifying theory of critical factors for small business led Keats and

3SIES Journal of Management, April - August 2010, Vol.7(1)
Are Small Business Critical Success Factors Same in Different Countries?
Bracker (1988) to propose a six factor small business performance model. These six factors are arrayed in three groupings: (One) General Environment, (Two) Task Environment and (Three) Personal Characteristics (of the small business entrepreneur).
Into each group two factors are placed. The first grouping, Task Environment, includes “Task Environment Factors” (The firm’s relationship to customers, competitors, suppliers and regulatory agencies). The second group, General Environment, encompasses “Behavioral Strategic Sophistication” (Employment of strategic management practices) and “Cognitive Strategic Sophistication” (Comprehension of strategic management practices). The third group (Personal Characteristics) is comprised of “Entrepreneurial Intensity” (Those behaviors that distinguish entrepreneurs from others), and “Task Motivation” (Goal directed intensity). Keats and Bracker (1988) further suggested the existence of a success predictor defined as “Perceived Strength of Environmental Influences” (market environment pressure)
The attempt to identify pan-market small business success traits has been productive. Chawla et al (1997a) proposed that there are eleven critical success factors subordinate to three categories. The first category, named “Task Environment” was comprised of seven factors: Supplier/Vendor Relations, Human Resources, Industry Trend, Location Issues, Competitor Analysis and Purchasing Inventory Control. A second category called “General Environment” had Economic Environment assigned to it. A third category identified as “Personal
Characteristics” contained the factors Owner Experience and Goal Orientation.
In discussing the broad categories of Task Environment, General Environment and Personal Characteristics, it is suggested that the relative importance of these concepts will vary with business environment. Mintzberg (1994) holds that a firm is innately formed by and is an expression of its environment. Mintzberg further suggests that when the environment varies, as in nation, industrial sector or with time then the nature of firms in that environment vary as well.
This concept can be illustrated by proposing two small businesses, owned by the same entrepreneur, at the same time (Controlled for Personal Characteristics and General Environment (Economic Environment)). These two hypothetical firms could still have widely divergent experiences in the remaining critical success factors of Supplier/Vendor Relations, Human Resources, Industry Trend, Location, Competition and Purchasing/Inventory Control. It is now easy to recognize that these different ambient conditions could well affect how the two firms rank the importance of these remaining critical success factors without affecting the positive argument for the general applicability of these factors.
There is prior work suggesting that that there are common problem areas for small firms ( Chawla, Pullig and Alexander, 1997b) and critical success factors that are generally applicable ( Chawla, Pullig and Alexander, 1997b) that vary in relative importance but not in definition with respect to environment.
This leads to the question (if we assume

4
the universality of the three groupings Task Environment, General Environment and Personal Characteristics): When the Task Environment and General Environment are very different, do the ratios of importance, of the previously enumerated success factors, change or do the factor definitions change. In other word, does environmental change result in CSF fine tuning or in redefinition?
An examination of large firms in Asia have shown a pattern of employee behaviors in successful enterprises very different to the employee behaviors associated with successful firms in the United States (Cunningham 1995). Does this dissimilarity in nature extend to a possible contrast between North American and Asian small businesses? Can Western critical success factors be generalized to apply to the East?
Critical Success Factors may also be examined with reference to time. Life cycle stages in Asian small firms may show very different priorities given a firms position with reference to important milestones. To address time, a reference scale must be marked out so that the businesses can be unambiguously classified. The authors are aware of several systems of partitioning the current state of a firm into a discrete number of life stages or cycles. Systems range in the number of compartments from three (Quinn and Camaron, 1983) to, with more than three times that, at ten (Gupta and Chinn, 1994). Small firms have evolutionary stages that they pass through if they are lucky enough to grow. Greiner (1972) speaks of problems and their bearing on a firm’s position in an organizational life cycle. Other research
centers on small business growing pains in terms of strategies that may be employed to successfully avoid the rocky shallows of small business growth (Quinn and Cameron, 1983; Gupta and Chin 1994; Thietart and Vivas 1984; Kazanijan 1988, Dodge and Robins 1992, Dodge et al 1994).
Pullig and Chawla (unpublished 2007) chose Quinn and Cameron (1983) identification of organizational life cycle for prior research on a small business in Mexico. The four major stages proposed therein are equally useful for this study. Quinn and Cameron found four major stages: (One) entrepreneurial; (Two) collectivity; (Three) formalization and control; (Four) structure elaboration and adaptation. These stages may also be described as startup, rapid growth, equilibrium, and evolve or die. The gathered information did not seek out entrepreneurs in the act of creation so only the remaining three stages are dealt with here. In order to gather quantifiable data, the three remaining stages were interpreted as Collectivity: one to three years in business, Formalization: 4 to 10 years and Structure elaboration and adaptation: Over 10 years. These choices are informed by Lippitt and Schmidt (1967) but they do not comply with a rigorous application of organizational life cycle interpretation. The pragmatic reason for using these arguably arbitrary delineations is in order to increase the usefulness of the data when used in comparison with similar studies performed in the past noted above. However, even with this difficulty in method, the ability to quantify small business life cycle stages with respect to critical success factors yields an interesting, supportable result.
Sudhir K. Chawla, Dan Khanna & Jin Chen

5SIES Journal of Management, April - August 2010, Vol.7(1)
Research Methodology
A descriptive research design based on the format developed by Pullig and Chawla( 1997b) was used. Because the sample size was significantly smaller than the one used in that study, no stratification by business size was collected, so the study differs in its structure in this aspect. The data in this study was collected through personal interviews conducted with active small business owners in China. 73 small business owners in and around Hangzhou were the subjects of the personal interviews. The selected businesses were gathered from a list provided by the local equivalent of a US Chamber of Commerce.
Instrument
The survey instrument used in the Hangzhou personal interviews employed items that have been previously used in a U.S. and a subsequent Mexico survey by Chawla et al(1997a,b,2007). These items were translated into Manderin to create the instrument. Additional items proposed by a panel of experts, convened at Zhejiang University by Dr. Chen, were included after translation, to capture and control for cultural subtleties and then reverse translated independently. As with the previous small business critical success factor studies, the interview was partitioned into two sections. The questions in the first section collect demographic information on the participants. Instructions on the instrument prompted the administrator to reassure the interviewee that the questions were for classification purposes only. The questions cover age, education, work week, broad classification of business, number of jobs previously held, years in business, and legal structure of the firm. In
the second section, the interviewer asks the owner questions dealing with the owner’s perception of factors critical to success of small business. 41 randomly arranged items used in previous studies of critical success factors were supplemented with 19 localized questions developed by Dr. Chen. These questions were presented as a Likert-type scale. This scale used a scale of five where the five degrees were (1) Not a problem, (2) Somewhat of a problem, (3) Don’t Know, (4) Major Problem, and (5) Critical Problem. This method of questioning differed from previous small business critical success factor studies (Chawla et al 1997a,b) where a Likert-type scale that ranged form 1(Not Critical) to 5(Very Critical) was used. This difference was introduced by Dr. Chen for cultural reasons.
Sample Demographics
All 73 respondents are classified as small businesses. They were selected with fewer than 250 employees thus meeting the criteria established in prior studies (Chawla et al 1997a,b, 2007) the work wishes to draw contrasts with. The majority of the respondents were young when they founded their business, 58.9% under 25 years old, 35.6% aged 25 through 35, for a total of 94.52% under 35. This high percentage of younger entrepreneurs reflects a generation taking advantage of new opportunities provided by policy changes and a new business climate. Education percentage is very high, only 13.7% percent of respondents did not posses at least one college or university degree. Manufacturing dominates the other business categories with 41.67% although the category of “Other” enigmatically represented 34.7%
Are Small Business Critical Success Factors Same in Different Countries?

6
of surveyed businesses. A variety of reason could be responsible for this ambiguity, such as a desire for anonymity, business of an “unofficial” nature or undiscovered cultural factors. The firm structure shows high level of sophistication reflecting the high education level. 50% of the firms are corporations and partnerships while another 38.9% are Limited Liability Companies and Limited Liability Partnerships. Only 11.1% were found to be sole proprietorships. Frequency analysis by age of the business revealed very few firms (5.5%) older than ten years. Businesses in the 1 to 3 year range accounted for 52% with those 4 to 10 years old represented 31.5% of the firms. Slightly fewer than 11% were less than a year old.
Factor Analysis Results
When Crombach alpha analysis was applied to the items grouped into factors proposed in a prior study (Chawla et al, 1997b), only two of the six factors had Crombach’s coefficient Alpha values of over .60. These factors were marketing with a Crombach’s Alpha of .81 and Competitive Forces (Task) with a Crombach’s coefficient Alpha of .66. Table 1 below lists the items in these two factors:
Table 1 Critical Success Factors developed in China study
Factor / Survey Items: Crombach’s Alpha
Mean
Marketing Effort (Task):Customer View of Product / Service Demand for Product / Service Advertising Assessment of Customer Needs Quality of Product / Service .81 3.21Location of Business Distribution of Product / Service
Changes in Consumer Preference Motivation of EmployeesTraining of Employees Competitive Forces (Task):Analysis of Competitors Customer’s View of Competitors Product / Service Quality of Competitors Product / Service Changing DemographicChanging Community Demographics .66 3.32Cash Flow Projections Inventory Management
Results indicate lack of generalizability of the USA study factor structure, hence necessitating a new factor. Factor analysis was used in an exploratory manner to analyze the interrelations among the 41 critical success factor items from our survey. Specifically the factor analysis was used to identify the critical success factors as perceived by small business owners in the China study. In addition we assessed of the China factors for similarity to those factors found in the U. S. study. Principal component analysis with Varimax rotation was chosen to identify which of these items would cluster together distinctively and serve as one-dimensional measures of critical success factors of small business (Hair et al 1995). In performing the factor analysis the entire data set of China small businesses sampled was utilized so as to (1) provide a sufficient sample for appropriate identification of dimensions (Kim and Mueller 1985) and (2) identify factors which would be applicable across different small business environments.
Because the factor analysis results are used in subsequent testing, we formed a composite
Sudhir K. Chawla, Dan Khanna & Jin Chen

7SIES Journal of Management, April - August 2010, Vol.7(1)
Factor Analysis of Critical Success Factors for Chinese Businesses
(Varimax Rotated Factor Loadings)
Factor / Survey Items: Factor 1 Factor 2 Factor 3Marketing Effort (Task):Market Characteristics .56Customer Acceptance of Product/Service
.63
Demand for your Product/Service
.67
Quality of Your Service .72Assessment of Customer’s Needs
.65
Quality of Your Products .67Employee Training .54Ability of the Owner to Think Strategically
.74
Vision of The Owner .56Planning For Growth .67Market Forces (Task):Demographic Changes .47Change in Consumer Preference
.46
Advertising your Business .41Financial Needs (Task);Financial Needs .57Getting a Bank Loan .63Government Support .58Level of Initial Investment .53Access to Finance .76Eigenvalue 12.63 3.56 3.05Proportion Variance Explained
23.8 6.71 5.8
Cumulative Variance Explained
23.8 30.6 36.3
value by calculating the mean of the items loading on each respective factor and performed reliability analysis of the items representing each factor as suggested by Churchill (1979). This process resulted in the final factor makeup reported in Table 2.
Factor Analysis Results
Factor Analysis of Critical Success Factors for Chinese Businesses (Contd.)
(Varimax Rotated Factor Loadings)
Factor / Survey Items: Factor 4 Factor 5 Factor 6Location Issues (Task Environment)Location of Your Business .66Distributing Your Product of Service
.50
Number of Professional Advisors
.66
Competitors Analysis (Task Environment)Analysis of Competitor’s Position
.55
Customer’s Acceptance of Competitors’ Product/Service
.73
Competitors’ Quality of Product/Service
.57
Location of Suppliers .55Owner Experience Knowledge (Personal Characteristics)Your Prior Experience in Business
.80
Your Prior Knowledge of Business
.72
Technical Skills you Have .60Record Keeping .57Eigenvalue 2.62 2.44 2.20Proportion Variance Explained
5.0 4.61 4.10
Cumulative Variance Explained
41.3 45.9 50.0
Utilizing the same iterative process and rules of thumb as used in the U.S. analysis, the factor analysis of the China sample extracted six factors with Eigen values in excess of 1.0 which accounted for 50.0% of the variance in the data. For each item a loading cutoff of .50 was utilized resulting in
Are Small Business Critical Success Factors Same in Different Countries?

8
30 of the 41 items loading with significance on one of the six factors. The factor contents, rotated factor loadings, Eigen values, variance explained, reliability, and mean factor values may be seen in Table 2.
The first factor extracted contains ten items with loadings from .54 to .74 and a coefficient alpha of .82. Factor 1 explains 23.8% of the variance in the data and contains items related to both customer and employee concerns. The label given this factor is Marketing Effort and it is identified as being a part of the small firm’s task environment. This factor combines two areas found as distinct factors in the U. S. study, Marketing/Image and Human Resource/Personnel. The reason for the difference in factor structure may be due to our current sample being dominated by manufacturing and other firms. It may be a function of size and lack of emphasis yet on the HR due to the nascent stage of the business.
Factor 2 is labeled Market Forces and explains 6.7% of the variance and has an coefficient alpha of .76 which is a part of the US factor of Marketing Effort.
Factor 3 is assigned the label of Financing Needs and explains 5.0% of the variance with a reliability of .61. This was not a factor discovered in the U.S. study. This factor represents a potentially significant difference between the two nations small business sectors. In the U.S. the ability of a credit worthy firm to obtain capital is really never questioned while in China three related and significant small business problems are the inability to obtain credit, extremely high interest rates, and a heavy tax burden (Rodriguez 1994).
Factor 4, Location Issues, explains 5.0%
of the variance and has a reliability of .71. This factor is unique to the China study due to intensive regulation of the movement of population.
Factor 5 is Competitor Analysis explains 4.6 % of the variance and this is similar to the US study. In addition, this factor encompasses the U.S. factor of Purchasing and Inventory Control.
Factor 6 contains four items describing Owner Experience/Knowledge. This factor explains 4.1% of the variance with a reliability coefficient of .77. Owner Experience/Knowledge is a success factor belonging to the personal characteristics of the small business owner domain of small firm performance as described by Keats and Bracker (1988). The same factor was discovered in the U.S. study and past research indicates that small firm success is closely linked to management skills, interpersonal skills, and education (Ibrahim and Goodwin, 1986; Lussier, 1995). A comparison of US and China critical success factors is presented in Table 3.
Table 3China Study: U.S. Study:Marketing Effort Marketing/Image;
Human ResourcesCompetitive Forces Competitor analysis;
Purchasing/Inventory Control
Industry Issues/Trends Industry Issues/TrendsFinancial Needs Not a Factor in U.S. StudyOwner Experience and Knowledge
Owner Experience and Knowledge
Location Issues Goal Orientation
Differences between Stages of the Organizational Life Cycle
A composite value was created for each
Sudhir K. Chawla, Dan Khanna & Jin Chen
GLM for Small Firms in China Critical Success Factor F-Value Pro > F
1 -3 Yrs vs.4 - 10 Yrs
Marketing Effort .25 .62Market Forces .28 .59Financial Needs .84 .36Location Issues .19 .66Competitors’ Analysis 1.49 .23Owner Experience Knowledge 1.5 .22

9SIES Journal of Management, April - August 2010, Vol.7(1)
factor by calculating the mean of the items loading in excess of .50 on each respective factor. Using this composite value a separate analysis of variance with contrasts were done for each factor to determine if significant differences existed as a small firm moved through its life cycle as defined by the number of years in business. Firms were categorized as belonging to one of three life cycle stages (1) One to Three Years in Business, (2) Four to Ten Years in Business, and (3) Over Ten Years in Business. The resulting F-values for the ANOVA’S and the univariate T-values for contrasts between the three groups of small firms are shown in Table 3.
Examination of the results from the analysis of variance demonstrates a lack of support for the proposition that critical success factors are perceived as more or less important depending upon a China small firm’s position in their life cycle. This is true for all factors in examining the F-Values given in the analysis of variance.
Conclusion
GLM for Small Firms in China Critical Success Factor F-Value Pro > F
1-3 Yrs vs.
4-10 YrsMarketing Effort .25 .62Market Forces .28 .59Financial Needs .84 .36Location Issues .19 .66Competitors’ Analysis 1.49 .23Owner Experience Knowledge 1.5 .22
Undoubtedly, entrepreneurs or small business owners are important to society and commerce in both the United States and China. Our findings indicate that the small
firm owner in China is a key participant among a complex set of interrelated success factors including marketing concerns, location, competitive forces, industry issues and trends, the availability of capital, as well as the motivation and ability of the owners themselves. One implication of this study is that success factors may be different given the very distinct task environments produced by the variation in cultural, political and economic characteristics found in the two nations. Specifically, the finding of a financial needs factor may be due to these differences.
While the China small business owner’s perception of success factors is somewhat different from their counterparts in USA, there are many similarities. The similarities provides evidence that Keats and Bracker’s (1983) conceptual model of small firm performance is a useful tool for categorization of the factors critical to the success of a small firm in a variety of environments.
The absence of a life cycle effect on the importance of the critical success factors to the small firm owner indicates that these factors may operate continuously throughout the life cycle. This may be due the fact that the small firm sector in China is dominated by micro enterprises that do not change in size significantly as they progress through their life cycle. Thus, these firms may not have the attached implications that are expected with growth. Future studies attempting to compare small firms across nations should take this into consideration.
A significant difference between the critical success factor structure as perceived by the entrepreneurs of China and the U.S.
Are Small Business Critical Success Factors Same in Different Countries?

10
concerns the meeting of financial needs or the availability and affordability of capital. Obviously economic opportunity is critical to the employment of entrepreneurial skills (DiConti 1992) and throughout the world what small businesses in less developed economies have most in common is a lack of access to adequate resources (Kane 1996).
Understanding that there are significant differences between critical success factors as perceived by entrepreneurs of distinct environments is important to anyone dealing with small firms in an international setting. By understanding the nature of these differences small firms and those working in this area can assist each other to overcome obstacles and better cooperate to be competitive in the global marketplace.
ReferencesBarnhart, K. (1994). Micro Business Hits The Big Time: The Future of Small Business in a Globalizing Mexico. Business Mexico Vol. 4 Issue 1,2, pp. 62-65.Boynton, Andrew.C, Zmund, Robert.W: An Assessment of Critical Success Factors. Sloan Management Review, Summer 1984, 24,4. 3.Chawla, S.K., Pullig C. and Alexander, D. (1997a). Critical Success Factors from an Organizational Life Cycle Perspective: Perceptions of Small Business Owners from Different Business Environments. Journal of Business and Entrepreneurship Vol. 9, No. 1, pp. 47-58. Chawla, S.K., Pullig, C. and Alexander, D. (1997b). Key Problem Areas From An Organizational Life Cycle Perspective: Perceptions of Small Business Owners. Working Paper, Angelo State University,
San Angelo, Texas.Chawla, S.K.and Pullig, C.(Unpublished 2007) A Multinational Comparison of Critical Success Factors and Perceptions of Small Business Owners: Analysis over the Organizational Life Cycle.Churchill, G.A. Jr. (1979). A Paradigm for Developing Better Measures of Marketing Constructs. Journal of Marketing Research Vol. 16, pp. 64-73.Conte, Christopher, An Outline of the U.S. Economy (2001) usinfo.state.gov/products/pubs/oecon reference May 7, 2007Cunningham, J.B. (1995). Success in Corporate and Entrepreneurial Organizations in Singapore. Journal of Small Business Management Oct. pp. 81-86. DiConti, M.A. (1992). Entrepreneurship in Training: The Multinational Corporation in Mexico and Canada. University of South Carolina Press, Columbia. Dodge, H.R., Fullerton, S. and Robbins, J.E. (1994). Stage of the Organizational Life Cycle and Competition as Mediators of Problem Perception for Small Business.Strategic Management Journal Vol. 15, pp. 121-134. Dodge, H.R. and Robbins, J.E. (1992). An Empirical Investigation of the Organizational Life Cycle Model for Small Business Development and Survival. Journal of Small Business Management Vol. 30, No. 1, pp. 27-37. Drucker, Peter Ferdinand, (1973) Management: Tasks, Responsibilities and Practices, Transaction PublishersDutton, J.E. and Dukerich, J.M. (1991).
Sudhir K. Chawla, Dan Khanna & Jin Chen

11SIES Journal of Management, April - August 2010, Vol.7(1)
Keeping an Eye on the Mirror: Image and Identity in Organizational Adaptation. Academy of Management Journal Vol. 34, pp. 517-554. Gaskill, L.R., Van Auken, H.E. and Manning, R.A. (1993). A Factor Analytic Study of the Perceived Causes of Small Business Failure. Journal of Small Business Management Vol. 31, pp. 18-31. Greiner, L. (1972). Evolution and Revolution as Organizations Grow. Harvard Business Review. (July - August): pp. 37-46. Gupta, Y.P. and Chin, D.C. (1994). Organizational Life Cycle: A Review and Proposed Directions for Research. Mid-Atlantic Journal of Business Vol. 30, No. 3, pp. 269-294. Hair, J.F., Anderson, R.E., Tatham, R.L. and Black, W.C. (1995). Multivariate Data Analysis, 4th Ed. Prentice Hall, Englewood Cliffs. Haswell, S. and Holmes, S. (1989). Estimating the Small Business Failure Rate: A Reappraisal. Journal of Small Business Management Vol. 27, pp. 68-74.Hofer, C., Sandberg, W. (1987), “Improving new venture performance: some guidelines for success”, American Journal of Small Business, Vol. 12 No.1,Ibrahim, A.B., Goodwin, J.R. (1986), “Perceived causes of success in small business”, American Journal of Small Business, Vol. 11 No.2, pp.41-50. Kane, H. (1996). Micro-Enterprises: Importance of Small Businesses to the Global Economy.World Watch Vol. 9, No. 2, pp. 10-19. Kazanijan, R.K. (1988). Relation of Dominant Problems to Stages of Growth in
Technology Based New Ventures. Academy of Management Journal Vol. 31, pp. 257-279. Keats, B.W. and J. S. Bracker. 1988. Toward a theory of small firm performance: A conceptual model. American Journal of Small Business 12:41-58.Kim, J. and Mueller, C.W. (1985). An Introduction to Factor Analysis: What It Is and How To Do It. Sage University Paper Series, 07-013, Beverly Hills.Kobe, Katherine, The Small Business Share of GDP, 1998-2004,(2007) Small Business Administration Office of Advocacy. Lewis, S. (1996). Ripe for Investment. Business Mexico Vol. 6, No. 5, pp. 30-32.Lee, Jean, (1996) Culture and Management-a study of Small Chinese Family Business in Singapore. Journal of Small Business Management July 1996, pp 63-67 Li, J. (2002), Financing China’s Rural Enterprises, RoutledgeCurzon, London and New York, NY, Li, Jun and Zhang, Yuli and Matlay, Harry, Entrepreneurship education in China, Education + Training, Vol 45, Number8/9 pp. 495-505.Lippitt, G.L. and Schmidt, W.H. (1967). Crises in a Developing Organization. Harvard Business Review Vol 45, pp. 102-112. Lumpkin, J.R. and R.D. Ireland, 1988 Screening Practices of New Business Incubators: The Evolution of Critical Success Factors, American Journal of Small Business, 12, 4,59-81.Lussier, R. N. (1995). A Nonfinancial Business Success Versus Failure Prediction Model for Young Firms. Journal of Small Business
Are Small Business Critical Success Factors Same in Different Countries?

12
Management Vol. 33, No. 1, pp. 8-18. Mintzberg, H. (1994). That’s Not Turbulence, It’s Really Opportunity. Planning Review Vol. 22, No. 6, pp.7-9. National Bureau of Statistics of China(NBS), 2006, Beijing, Xicheng, China.Quinn, R.E. and Cameron, K.(1983).Organizational Life Cycles and Shifting Criteria of Effectiveness. Management Science Vol. 29, No. 1, pp.33-51. Rodriguez, L. (1994). Financing to Secure the Future. Business Mexico Vol. 4, No. 9. pp. 6-7. Shafer, R. J. (1973). Mexican Business Organizations: History and Analysis. Syracuse University Press, Syracuse.Sheng, R. (1979) Outsiders’ Perception of the Chinese, Columbia Journal of World Business 14(2) 16-22.Susbauer,J., and Baker, R.(1989). Strategies for Successful Entrepreneurial ventures. Journal of Business Entrepreneurship, I(October), 56-66.Thietart, R.A. and Vivas, R. (1984). An Empirical Investigation of Success Strategies for Business Along the Product Life Cycle. Management Science Vol. 30, No. 12, pp. 1405-1423. US. SBA (2006). The Small Business Economy for the Data Year 2005, A Report to the President. SBA Publication, Washington D.C. Warnock, J. (1995). The Other Mexico: The North American Triangle Completed. Blackrose Books, Montreal. Wichmann, H. (1983). Accounting and marketing - Key Small Business Problems.
American Journal of Small Business Vol. 7, pp.19-26.Wang, Yueping and Yao, Yang (2002). Market Reforms, Technological Capabilities and the Performance of Small enterprises in China. Small Business Economics, Kluwer Academic Publishers, Netherlands
Send all correspondence regarding this paper to Sudhir K. Chawla, P.O. Box 10891 Angelo State University, San Angelo, Texas 76909
Sudhir K. Chawla, Dan Khanna & Jin Chen

13SIES Journal of Management, April - August 2010, Vol.7(1)
Developing Empirical Measures of Intraperson Games Constructs
Matthew Stark and Raj Devasagayam*Matthew Stark and Raj Devasagayam are Professors of Marketing and Management, Siena College, Loudonville, NY [email protected]
AbstractThe theory of intraperson games propounded by Ding (2007) proposes internal constructs of consumer decision making that are labeled as efficiency agents and equity agents. The next important step in theory development is the creation of empirically validated scales, so that managers may be able to use the theory in a strategic and meaningful manner while examining consumer decision making processes. We operationalize the theoretical constructs of efficiency and equity agents and proceed to develop multi-item measures of the constructs. We empirically validate the scales using a national random sample of three hundred respondents and arrive at validated scales that may be used for future studies. Our results will be of interest to academic scholars and marketing practitioners that would like to use the theory of intraperson games in their strategy formulations.
Keywords : Variety Seeking, Intraperson Games, Efficiency Agent, Equity Agent, Intrapersonal Profile
Introduction
In an attempt to define the predominant marketing thought and theory, Sheth, Gardner, and Garrett (1988) in their seminal work underscore two basic flaws in the development of marketing theory. One, the inability of marketers to pursue knowledge from other disciplines. And, two, upon receiving theories from other disciplines a failure to subject them to rigorous empirical scrutiny. It is generally agreed that a good theory is only rich if it is sound in structure and specification and open to empirical testability thus lending itself to parsimonious richness. Some important steps on the way to appropriate theory development are often incrementally miniscule yet significantly vital to future contributions to the discipline.
The theory of intraperson games proposed by Min Ding (2007) in the Journal of Marketing promises to be a major breakthrough in consumer decision making. Ding (2007) presents a predictive quantitative model based on his theoretical constructs. Most relevant to our research, the theory of intraperson games draws attention to competing internal factors that impact consumer decisions.
SIES Journal of Management, April - August 2010, Vol.7(1): 13-19

14
Matthew Stark and Raj Devasagayam*
In light of Sheth, Gardner, and Garretts’ observations above, Ding relies heavily on knowledge from other disciplines including psychology, game theory, economics, and social psychology. The insights gained from this multidisciplinary perspective render the intraperson games theory well structured and precisiely specified. The next logical step in theory development would then be empirical testabilility, before marketers can apply and use this theory. Our research provides the first necessary step to ensure empirical testability which is the development of a valid empirical scale for the constructs proposed in the theory of intraperson games.
We proceed by reviewing relevant literature in consumer decision making and subsequently highlighting major constructs of intraperson game (IPG) theory. We subsequently develop and test the validity of operationalized scales. Our research contributes to the extant theory of consumer decision making through the use of intraperson constructs of IPG.
Literature Review
In order to build upon the constructs included in the theory of intraperson games (Ding 2007), it is first important to understand the academic disciplines from which Ding has drawn in his theory development. We then look to variety seeking behavior as an area of the marketing literature that could be impacted by the exploration of intraperson games.
Min Ding (2007) has proposed a theoretical model that combines game theory with several famous theories of the human mind. Freud’s structural theory (Freud 1923) is the basis for Ding’s understanding
of the conflicts that take place within one’s mind. Freud believed that there are three interacting components of the mind. The Id is a self-centered, primitive drive guided by a constant pursuit of pleasure. Another drive, the Superego, counteracts the Id, acting as a cautious voice of reason that has been shaped by the morals of an individual’s society. The Ego is an equity drive that attempts to give each drive a chance to show through at different times.
Ding’s research is also shaped by an Artificial Intelligence theory originally published by Marvin Minsky. Minsky’s “Society of Minds” theory (Minsky 1986) proposes that the human mind is comprised of thousands of agents that each executes a different task. These agents are arranged in a hierarchy where the higher agents choose a lower agent to utilize in a given situation.
Ding took these concepts and integrated them into a model normally used for multi-person game theory. The model uses two higher level agents, efficiency and equity agents. The Theory of Intraperson Games successfully quantified the idea that individuals’ decisions are a result of a battle between competing agents. An empirical study conducted by Ding verified the model’s aptitude for predicting buying outcomes. The empirical study provided evidence that effectively measuring an individual’s personality could better predict future buying behavior than by simply analyzing past purchases. However, Ding’s study did not provide a comprehensive scale for measuring an individual’s intrapersonal characteristics. The mathematical model simply shows how each agent would interact in the context of game theory.

15SIES Journal of Management, April - August 2010, Vol.7(1)
Developing Empirical Measures of Intraperson Games Constructs
Intraperson game (IPG) theory can provide useful insights into areas of marketing that are often misunderstood. A good example of such an area is variety seeking behavior. Variety seeking behavior is a phenomenon that has been widely studied in the field of marketing. The study of variety seeking and brand switching has produced various theories and constructs that attempt to capture this concept in a way that is beneficial to marketers (Bass 1973, 1974; Kahn 1995; van Trijp 1996; Ding 2007). A large emphasis has been placed on external variables that cause such behavior. Matters of demographics, branding, pricing, etc. have been shown to influence such behavior (Chen 2004, Raju 1980). However, very few studies have analyzed possible internal constructs and processes that could have an influence on variety seeking behavior and consumer decisions. A study conducted by Hans van Trijp (Van Trijp, Hoyer, and Inman 1996) is the first to differentiate between internal and external motivations for variety seeking. The study blends internal factors such as need for variety with external factors such as product category. The study is successful in identifying some key variables that contribute to a variety seeking decision. However, once again, these variables are mostly driven by external factors. The unpredictability of consumer variety seeking behavior is what calls for further investigation. With most external factors already explored by marketers, intrapersonal factors provide a logical area to search for new insights.
The Theory of Intraperson Games fits theories of marketing and psychology together effectively into a mathematical context. However, the current study would
like to make this connection more accessible to marketers. This research aims to develop empirical scales for measuring two IPG constructs theorized by Ding (2007): Efficiency and Equity Agents. The efficiency agent strives for instant gratification while the equity agent considers long term benefits. We develop multi-item scales to measure these constructs of intraperson game theory. A survey based methodology with a sample of three hundred respondents is used to examine the relevance, validity, and reliability of the empirical scales.
Scale Development
Building on the successful inclusion of multiple agents of the mind in a previous marketing application (Ding 2007), this study proposes that measuring two distinct and opposite agents is possible. In accordance with recommended procedures (Sheth, Gardner, Garrett 1988) we have taken multidisciplinary theorized constructs and subjected them to empirical study. By measuring a respondent’s agreement with statements of equity and efficiency, effective scales will be used to classify consumers as “equity-strong” or “efficiency-strong”.
The scale (see Table 1 below) contains nine items in which respondents indicated their level of agreement on a five point scale from strongly disagree to strongly agree. The items are designed to bring forth the respondents beliefs concerning various hypothetical situations. The hypothetical scenario of decisions involving a restaurant visit is chosen with the student sample in mind. It is a challenge to find a product that demands involvement, experience, and considered decisions that also applies to a

16
large cross-section of the target population. Items are either statements that involve instant gratification, lack of compromise, swift action or statements that involve trade-offs, long-term consideration, and restraint.
Table 1.
During a typical visit to a restaurant…After eating a high calorie entrée, I order dessert.If I am hungry, I order appetizers before the entrée arrives.I order as much alcohol as I desire with the meal.After eating a high calorie entrée, I order a low calorie dessert.I order what I desire the most, regardless of the calorie content.If I am hungry, I do not order appetizers but wait for the entrée.I order items I know I have enjoyed in the past.After eating a high calorie entrée, I skip dessert.I worry about the price of my meal. If I have a working day the next morning, I do not drink at all.
The second scale (see Table 2 below) for measuring the efficiency and equity agent constructs included five hypothetical items in which the respondent would rate their level of agreement on a five point scale.
Table 2.
I would prefer to receive low yearly installments of $10,000 over 15 years rather than a onetime payment of $100,000.
I wait for movies to be released on DVD or pay per view rather than pay more to see them in the theater.
I put my music on shuffle rather than listen to my current favorites until I grow tired of them.
I wait until I have enough cash or money in my account rather than purchasing on a payment plan or credit.
If a gift for me was hidden in a closet, I would keep it a surprise and not look at it.
MethodologyThe scales were introduced in a survey that was distributed to the students, faculty, and friends of a college in the Northeast USA. The survey was approved by the Institutional Review Board and then administered nationally via the web through an online survey service. The online survey format provided ease of use for the respondents and more convenient and accurate data collection for the researchers.
Prior to the launch date a pretest survey was conducted with 10 respondents. The pretest survey was performed using the online survey tool to establish face validity of the scales and also to gain insight into the user experience each respondent would have with the survey. With the researchers in the room, the respondents provided immediate feedback which was then recorded and considered during final revisions. In an effort to increase the face validity, reduce ambiguity in questions and enhance the ease of response and, redundant scale items were combined or deleted. Phrasing was corrected and revised to facilitate more accurate statements. Once the survey passed another brief test round, it
Matthew Stark and Raj Devasagayam*

17SIES Journal of Management, April - August 2010, Vol.7(1)
was distributed throughout the course of the following weeks. The subsequent analysis is based on a convenience based random sample of 300 individuals.
Sample Profile
As is expected in studies utilizing a survey, respondents did not disclose certain demographic information. A full disclosure of the data set (including the percentage of missing answers) is included below. Adjusting for the missing data, the following discussion refers to percentages and proportions of respondents who actually responded to each individual item.
Keeping with trends in college-based samples in past studies, our sample was two-thirds female (66% female, 34% male). This provides a large enough number of male respondents to be considered representative of all males. Being mostly distributed to students, over 80% of the sample fell between the ages of eighteen and twenty-two. Almost one-tenth of the respondents were forty-six years of age or older. Level of education was spread amongst several choices. “Some high school/ high school graduate” made up 38% of the sample. This segment was likely made up of incoming freshman as this study was sent during a summer before the college was in session. Respondents who were “Currently in college” represented 46% of the sample. The rest of the respondents who answered this question held an undergraduate degree or higher. Household income levels were surprisingly diverse. Respondents from households making $75,000 or less made up 30% of the sample. Forty three percent of respondents indicated a household income of over $101,000. About one-fourth of our
sample (27%) reported between $76,000 and $100,000 annual household income. Table 3 provides a more detailed view of the sample profile for this study.
Table 3. Sample Profile (N=300)
Gender N %Male 81 27%Female 156 52%Missing 63 21%
Age N %18-22 years old 195 65%23-29 years old 8 3%30-45 years old 10 3%46 years and over 23 8%Missing 64 21%
Level of Education N %Some high school/ High School Graduate
90 30%
Currently in College 110 37%Undergraduate degree 18 6%Currently in graduate school 2 1%Postgraduate degree 17 6%Missing 63 21%
Household Income N %$30,000 or less 12 4%$31,000-$75,000 55 18%$76,000-$100,000 61 20%$101,000-$200,000 84 28%$201,000-$300,000 12 4%$301,000 or more 1 0%Missing 75 25%
Developing Empirical Measures of Intraperson Games Constructs

18
Findings and Discussion
We began by testing the simpler five-item alternative scale of Intraperson Games (IPG). This scale yielded a Cronbach’s Alpha value of 0.221, which led us to discard this scale from future analysis. We then tested the nine-item IPG scale which yielded a Cronbach’s Alpha of 0.300. Once again, we believed this scale to be inadequate in measuring the overall IPG construct.
Based on Ding’s (2007) conceptualization of the IPG being a two dimensional construct, we then proceeded to subject the nine-item scale to a confirmatory factor analysis. A principles component analysis based factor solution revealed patterns of both efficiency and equity agent measurement scales. The total variance explained by the factor analytic model was 68.726%, which is excellent for a first time use scale. We restricted the principle extraction to Eigen values of 1 or higher and used item loadings of 0.6 or higher only. The model was further refined using a Varimax rotation which yielded three-item efficiency agent scale and a five-item equity agent scale. One of our scale items “I worry about the price of my meal,” did not load significantly on any of the components and was therefore dropped from further analysis.
The scale items that emerged from the factor analysis were further analyzed for validity and reliability using a Cronbach’s Alpha. The three-item efficiency agent scale reported an Alpha value of .672, which is excellent for a first time used scale (Nunnaly 1978). The equity agent scale was a five-item scale that also provided a good
Alpha value of .505, which is acceptable for a newly developed theoretical scale being used for the first time.
Table 4 provides a breakdown of which items comprised each scale.
Table 4.
Validated ScalesEfficiency Agent Scale (Three-Item) α = .672 After eating a high calorie entrée, I order dessert.After eating a high calorie entrée, I skip dessert. (Reverse Coded)I order what I desire the most, regardless of the calorie content.Equity Agent Scale (Five-Item) α = .505After eating a high calorie entrée, I order a low calorie dessert.If I am hungry, I do not order appetizers but wait for the entrée.I order as much alcohol as I desire with the meal. (Reverse Coded)If I am hungry, I order appetizers before the entrée arrives. (Reverse Coded)If I have a working day the next morning, I do not drink at all.
Conclusions and Scope for Future Research
The creation of the intrapersonal agent scales allows marketers to measure and classify consumers based on their internal decision making agents. Further development of this concept should lead to useful marketing tools. The research has shown empirical evidence of two distinct intrapersonal
Matthew Stark and Raj Devasagayam*

19SIES Journal of Management, April - August 2010, Vol.7(1)
agents, efficiency and equity. An individual’s decision is ultimately swayed by one of the two agents. The stronger agent is more likely to “win” the argument more often. Marketers should be aware of the predictive powers that may arise from future research of this topic. The scales created in this study are an important first step in drawing value from a deeper understanding of consumer decision making.
Recognizing the independence of the internal decision making process is critical to understanding the nature of intrapersonal agents. As competition intensifies, product offerings and price points become seemingly homogeneous, and traditional advertising loses effectiveness, companies should consider appealing more to a consumer’s agents. Considering that all decisions are the result of an individual’s perception of external information, it would be useful to know which agent is on your side.
Future research is needed to explore the impact of these intrapersonal agents on consumer behaviors. Another correlation to be considered is the type of brand switching behavior relative to an individual’s intrapersonal make-up. Will an efficiency-strong consumer be less likely to switch for extrinsic reasons?
References
Bass, Frank and William L. Wilkie “A Comparative Analysis of Attitudinal Predictions of Brand Preference.” Journal of Marketing Research (1973): 262-269.
Bass, Frank M. “The Theory of Stochastic Preference and Brand Switching.” Journal of Marketing Research (February 1974):1-20.
Chen, Junsong. “The Influence of Company Name in Variety Seeking.” Journal of Brand Management (2004): 219-232.
Ding, Min. “A Theory of Intraperson Games.” Journal of Marketing (April 2007): 1-11.
Freud, Sigmund. “The Ego and the Id.” Complete Psychological Works of Sigmund Freud (1923): 1-66.
Kahn, Barbara E. “Consumer Variety-Seeking Among Goods and Services.” Journal of Retailing and Consumer Services (1995): 139-148.
Minsky, Marvin. Society of Minds. New York: Simon & Schuster, 1986.
Ratner, Rebecca K., Barbara E. Kahn and Daniel Kahneman. “Choosing Less-Preferred Experiences for the Sake of Variety.” Journal of Consumer Research (June 1999): 1-15.
Raju, P.S. “Optimum Stimulation Level: Its Relationship to Personality, Demographics, and Expoloratory Behavior.” Journal of Consumer Research (December 1980): 272-282.
Sheth, Jagdish, Gardner, David, Garrett, Dennis, Marketing Theory: Evolution and Evaluation,
New York: John Wiley & Sons, 1988.
van Trijp, Hans. “Why switch? Product category-level explanations for true variety seeking behavior.” Journal of Marketing Research (1996): 281-293.
* Corresponding Author
Developing Empirical Measures of Intraperson Games Constructs

20
Key Retail Store Attributes Determining Consumers’ Perceptions: An Empirical Study of Consumers of Retail Stores Located in Ahmedabad (Gujarat)
AbstractIn the recent times, India has witnessed transformation in the shopping habits of the consumers. Modern retail outlets have provided Indian consumers with new shopping exposure and constantly evolving choice for shopping with embracing on wide range of products. Modern retail formats are operating in different sizes and shapes. They are quite different in terms of the ownership, the kind of premises (format) used, and the orientation of the product range. This study examines empirically how consumers’ perceptions towards stores get affected by demographic, situational and store variables when they make purchase decision.
The study emphasizes that product range, store layout, shopping convenience; promotional schemes, product pricing, customer service, employee behavior, and store ambience significantly influence the customers. Moreover, the paper provides crucial insights to people in organized
retail business by identifying important variable like 1) Courteous Staff Members, 2) Customer Attention, 3) Offers and Discounts, 4) Comfort and Elegance, 5) Proximity, 6) Variety, 7) Speedy Service, 8) Assurance that must be considered while designing their operations.
Keywords: Retailing, Consumers, Perceptions, Store Attributes
Introduction
The recent time has been observed as growth of Indian organized retail market with many folds. Numerous business groups are attracted in the past few years, including some renowned business groups like Bharti, Future, Reliance, and Aditya Birla to establish hold, showing the future growth in times to come. It is predicted by the Industry estimates that the retail sector in India is expected to touch US$637 billion by 2015 with the organized segment expected to account for 22 per cent, up
SIES Journal of Management, April - August 2010, Vol.7(1): 20-34
Riteshkumar Dalwadi , Harishchandra Singh Rathod & Atul PatelDr.Riteshkumar Dalwadi is Asst.Professor, Dalia Institute of Management (DIM), Kanera, Gujarat. [email protected], [email protected]
Dr. Harishchandra Singh Rathod is Asst.Professor, Shri Jairambhai Patel Institute of Business Management and Computer Applications (SJPI), NICM Campus, Gandhinagar, Gujarat. [email protected], [email protected]
Atul Patel is Faculty,Smt. S.B.Patel Institute of Business Management, Visnagar , Mehsana. [email protected]
21SIES Journal of Management, April - August 2010, Vol.7(1)
Key Retail Store Attributes Determining Consumers’ Perceptions
from the present four per cent. In addition, organized retail sector has also grabbed the attention of foreign companies, showing their interest to enter India. In India, the organized retail market will touch roughly US$30 billion by the year end of 2010. In India, the modern retail formats are operating in different sizes and shapes. They are quite different in terms of the ownership of the retail business, the kind of premises (format) used, and the orientation of the product range. Modern retail outlets have provided consumers with new shopping exposure and constantly evolving choice for shopping with embracing on wide range of portfolio.
It is known that retailing is a process of selling goods and services to the final consumers for their personal, or their family’s consumption. Hence, it is very essential for the retailers to acquire as much as information and understanding about the consumers. This make them well-informed and familiar about consumers on diverse fronts like their demographics, psychographics and socio-economic status, identifying the right consumer base that will prove to be significant for retailers.
There are many past studies that focus on the consumer behavior and have helped in understanding about the consumers. As it is known that consumer behavior is ever evolving field of study, this is an attempt to understand consumers’ perceptions, attitudes and buying behavior. On the basis of literature reviewed on consumers in retailing, it was identified that knowing ever changing consumers is very significant for the retailers. Hence this research could be beneficial to researchers, retailers,
management consultants, business people, academicians, trainers, and shoppers.
Review of Literature
The consumers are always found with distinct needs and wants which may be because of their consumption pattern, demographics (like age profile, working patterns, income and expenditure, occupation), lifestyle changes, buying process, shopping behavior, shopping motivations and objectives, and changing consumer etc. In the same regard Abercrombie et. al., (1994) mentioned that the happening consumption culture is contemporary therefore the evolving scenario of the consumption pattern over a period of time propels retailers to spotlight on consumers’ perceptions, attitudes, and buying behavior.
The consumers’ profile apprehension explains consumers’ transformations over time and constructs predictions about how the consumption pattern will evolve in the coming time. For instance, the predictions given by India’s National Council for Applied Economic Research reveals about 17 million households – 90 million people – with annual earnings ranging between $4,500 and $22,000 comprise middle class population currently in India. Moreover, 287 million were identified as ‘aspirers’ or in the near future these consumers are expected to join the middle class. Further it is expected that these groups will spend more on advancing and varying their lifestyles and eating habits like, using processed and convenience items.
It was realized that there are other reasons than the need to buy the simple physical goods by Tauber (1972) in his research

22
Riteshkumar Dalwadi , Harishchandra Singh Rathod & Atul Patel
‘why do people shop? He further stressed that, there are various motivations for shopping influenced by several factors, many of them are related to personal and social motivations of consumers and a few of them are associated to the buying of products. It is therefore necessary for retailers to research and understand what makes shoppers highly satisfied. In addition to this, several consumer researches have revealed other psychological motivations for shopping.
Understanding consumer behavior is incomplete until describing how consumers make choices, as clarified by Foxall & Goldsmith (1994) in their book on Consumer Psychology for Marketing. Consumers come to know and learn about brands through various communication vehicles like, packages, promotions, advertisements, business talks and word of mouth. After consumers become aware about the brands, their buying decisions are guided by the perceptions or impressions of the brands that they have formed from the information. Therefore, the study of consumer perception is an element of largely unconscious processes of consumer behavior.
Because consumers make decisions and take actions based on what they perceive as reality, it is essential to describe the term perception and the related concepts that influence the consumers to buy. Schiffman & Kanuk (2007) described perception as, “the process by which an individual selects, organizes, and interprets stimuli into a meaningful and coherent picture of the world.” In the simplest term Young (1961) defined “to perceive is to observe
through the senses.” It is right that some of the writers have presented perception in terms of five senses. As Foxall & Goldsmith (1994) mentioned in their book that consumers become aware about the environment through the five senses and therefore sensation is the process with which perception begins. But perception is not synonymous with sensation despite their clear interconnectedness.
To Perceive = {to see, to hear, to touch, to taste, to smell, to sense - internally} {some} {thing, event, relation}
Consumer perception is an approximation of reality. Consumer mind tries to make sense out of the stimuli to which they are exposed. Perception is the way in which an individual interprets stimuli received by the senses. Perception is defined as, “A process through which consumers make sense out of the world” by Runyon (1977). In a broad sense, Wilkie W. L., (1986) mentioned that the topic of perception is concerned with the translation from the external, physical world to the internal, mental world that each of us actually experiences.
The study carried out by Sinha & Banerjee (2004) attempted to know the determinants of retail store selection based on the perception of consumers on visiting various types of stores, their observations on the levels of various service and physical parameters related to the store visited. There are three basic functions that are contained in the definition of perception: sensing a stimulus in the external world; selecting and attending to certain stimuli and not others; and interpreting the stimuli and giving them meaning.

23SIES Journal of Management, April - August 2010, Vol.7(1)
Joyce & Lambert (1996) have expressed that evaluation done by individuals of store image could be affected by self-views developed by them (e.g. type of store shopped, personnel employed, music and videos played, other aesthetic store dimensions). It lies at the heart of the manner in which he responds to his world. Foxall & Goldsmith (1994) support that the effective management of marketing activities of an organization rest on the following two fundaments:
• First, consumers act on their perceptions which basically come from the information that they receive.
• Second, mangers need to understand the nature of perceptions of their consumers and potential consumers have of themselves, their social world, and products available to them.
The study carried out by Joyce & Lambert (1996) has depicted that consumers’ perceptions regarding the store image are likely to be affected by the types of stores consumers repeated visited in the past and the attributes associated with those stores (e.g. color, lighting, signage, clientele, salespeople).
According to O’Connor (1990), the primary factual elements or attributes determining a retailer’s image by forming consumers perceptions, include price, variety, assortment within product categories, quality, products, service (or lack thereof) and location. Type of customer, shop location, price levels, service offered, merchandise mix, advertising and the characteristics of the physical facilities are listed by Terblanche (1998) as some
of the factors determining store related perceptions. Similarly, Peter and Olson (1990) observed that the most commonly studied store image dimensions are merchandise, service, clientele, physical facilities, promotion, convenience and store atmosphere, which closely resemble Lindquist’s proposed dimensions. Sheth and Mittal (2004) stated that: “Store image, the sum total of perceptions customers have about a store, is determined by these merchandise, service, and price factors; it is also determined by atmospherics, advertising, and store personnel.” However, as with the definition of store image, no consensus has been reached on a set of universal store image dimensions.
For the purpose of this study, Lindquist’s framework of store image was selected as a viable point of departure for identifying store image dimensions and descriptions (incorporating the relevant attributes for each dimension), since it proves to be the most comprehensive in store image literature. Cognitive, affective and physical components of store image are included in the proposed store image attribute dimensions. Therefore, in building on the foundation established by Lindquist (1974,1975), as well as taking into account what other researchers have identified, the following store image dimensions that are mostly forming and influencing consumers’ perceptions are also considered for the study (Refer Table 1). Thus modern retailers need to examine perceptions of consumers about important aspects of organized retail stores.
Key Retail Store Attributes Determining Consumers’ Perceptions

24
Table: 1 Consumers’ Perception Dimension of the Retail Store Perception Dimension
Description of Dimension (Attributes)
References
Merchandise Quality, selection or assortment, styling or fashion, guarantees, pricing.
James et al..1976 O’connor,1990 Terblanche, 1998 Peter & olson,1990
Service Service general, sales clerk service, Self service, ease of merchandise return, delivery service, credit policies of store.
James et al..1976 O’connor,1990 Terblanche,1998 Peter & olson,1990
Clientele Social class appeal, self image congruency, store personnel.
Martineau, 1958 James et al..1976 Terblanche,1998 Peter & olson,1990
Physical facilities Elevators, lighting, air conditioning, washroom, store layout, aisle placement and width carpeting, architecture.
Martineau,1958 Terblanche,1998 Peter & olson,1990
Convenience Convenience general, location Convenience, parking.
O’connor,1990 Peter & olson,1990
Promotion Sales - Promotions, advertising, displays, trading stamps, symbols, colours.
Martineau,1958 Terblanche,1998 Peter & olson,1990
Store atmosphere Atmosphere congeniality James et al..1976 Peter & olson,1990
Objectives of the Research Study
The main objective of the research was to study and understand consumers’ perceptions towards organized retail stores and the relationship between the demographic variables and consumers’ perceptions. Now, in the land of shopkeepers, shopping experience is changing rapidly. The retail landscape is not only significantly developing in metros but also in the small cities. The increasing number of organized retail stores in India has offered new shopping experience to consumers. This study was an effort to examine the magnitude of perception towards retail stores. The main objectives covered under this research were as follows:1. To measure the relationship between the demographic variables and consumers’ perceptions
towards organized retail stores. 2. To identify the popular factors contributing in framing consumers’ perceptions.3. To suggest how consumers’ perceptions affect their shopping.4. To bring out the areas of improvements in retail stores and to suggest competent and
innovative strategies for retail stores.
Riteshkumar Dalwadi , Harishchandra Singh Rathod & Atul Patel

25SIES Journal of Management, April - August 2010, Vol.7(1)
Research Methodology
For this study, an exploratory research design was considered appropriate. The information was collected through a sample survey. Data were collected from the consumers visiting Big Bazaar, D-Mart, Reliance Mart, and Vishal Mega Mart in Ahmedabad (Gujarat state). Researchers have drawn the samples applying convenience sampling procedure. The sample size was determined applying proportions (determining the sample size when estimating proportions). Considering confidence level of 95 per cent, a margin of sampling error (or precision) of ± 5 per cent, and proportion of a sample for the survey is shown in the following table. Thus, the final sample size was calculated to be 196. Thus, the study attempted to attain sample reliability within ± 5 per cent margin of error at the 95 per cent confidence level.
Table: 2 Determination of Sample Size
City pa qb p*q SSEc Std. Value p*q/SSE Sample Size (n)Ahmedabad 0.85 0.15 0.128 0.0025 3.8416 0.000650771 196a. Probability , b. 1 - Probability, c. Square of Sampling Error
The secondary data was collected from journals, magazines, reports, research studies, government publications, professional publications, research organizations and websites.
A survey approach was chosen in order to collect data directly from consumers visiting the identified organized retail stores operating in the city of Ahmedabad. A survey methodology permits the use of questions to measure constructs exclusively internal to respondents, e.g. perceptions, attitudes, opinions, intentions, etc., (Cooper and Schindler, 1998), and the answers can be collected and combined to represent the answers of an entire population (Reaves, 1992). At an exit door (store intercept manner) was conducted at storefront with consumers who were asked to fill the questionnaire, used by Rani and Velayudhan (2008) in their study.
For the purpose of computing statistical accuracy researchers applied one sample T-test, Chi-square test, Binomial test, Factor Analysis, Cross-tabulation, and Percentage & Frequency Analysis. From the calculated outcomes meaningful interpretations were drawn for the organized retail sector in Ahmedabad city
Data Analysis and Results
Here given table (Table: 3) shows the summary of the demographics of the samples selected for the study. From the summary, it is clear that 78% of the respondents fall in the age group of 18 to 34 years and around 73% of the respondents surveyed were graduates. Almost half of the consumers’ monthly family income was less than Rs. 50,000 The below given table (Table: 4) summaries that consumers prefer Sunday and Saturday to be the most convenient day. Survey also suggests that most convenient shopping time is evening (4:00 p.m. to 8:00 p.m.) and consumers normally spent 1 to 2 hours while visiting the organized retail stores.
Key Retail Store Attributes Determining Consumers’ Perceptions

26
Table 3 : Demographic Characteristics of SamplesVariable Level frequency Percent
Age 18-24 79 4025-3435-4445-54
743112
38166
Latest Education 12th Standard 33 17IIT/ Diploma Bachelors DegreePG Diploma CourseMasters DegreePh. D.
13867
555
7444
281
Monthly Family Income Under Rs. 50000 104 53Rs. 50,001 to Rs. 1,50,000Rs. 1,50,001 to Rs. 2,50,000Rs. 2,50,001 to Rs. 3,50,000Rs. 3,50,001 to Rs. 4,50,000Rs. 4,50,001 and above
6218723
329412
Marital Status Single 99 54Married 97 50
Family Structure Nuclear 102 52Joint 94 48
No. of Family Members One 4 2TwoThreeFourFiveSix and more than Six
515554374
38
282238
No. of Children in Family Not any 46 24OneTwoThreeFour or more than Four
647772
333941
Vehicles in Family Four-Wheeler 15 8Two-WheelerBoth Two & Four Wheeler Not any
86905
44463
Current Employment Full Time 140 71Part TimeRetiredUnemployed
121
43
61
22Present Occupation Business 39 20
ServiceBoth Business & Service Study Housewife
1037
434
534
222
Gender Male 171 87Female 25 13
Total 196 100
Riteshkumar Dalwadi , Harishchandra Singh Rathod & Atul Patel

27SIES Journal of Management, April - August 2010, Vol.7(1)
Table: 4 Convenient Shopping Day, Time and Normal Time Spent in StoreMost Convenient
DayMost Convenient Time Normal Time Spent
in the StoreSunday & Saturday - 87%
Evening Time (4:00 p.m. to 8:00 p.m.) - 51.5%
Afternoon Time (12:00 noon to 4:00 p.m.) - 30.1%
1 to 2 hours - 59.2%
Researchers also tried to find out whether customers would be interested in new (modern) retail stores or not. The results as per Chart-1 show that 69.4% of the respondents opined for opening the new (modern) organized retail stores. So, we conclude that there is an optimistic future for organized retailers. The survey result also reflects that 69% of the male respondents and 72% of the female respondents wanted new organized retail stores to be established in Ahmedabad. Moreover, it was also found that 78% of the young respondents (18 – 34 yrs) were in favour of organized retail stores.
Survey also revealed that 40.82% and 48.47% of the respondents’ usual shopping place is organized retail store and both (organized and traditional) respectively as given in the Chart - 2. While traditional store is opted by only 10.71% of the respondents as their usual shopping place which suggests that consumers are diverting towards the organized retail stores. The survey result also pointed out that there are only 5% respondents who visits this store daily and almost 65.3% people preferred a cash payment mode.
1) Relationship between Preference of Shopping Place and Demographic Variables:
Based on the literature reviewed the following hypotheses was framed and tested by the researchers.
Chart : 1
Chart : 2
Favor to opening oforganized retail stores
Usual Shopping Place
Don’t Know Yes No
60.0%
40.0%
20.0%
0.0%
16.8%
Both 48.47%
Organized Retail Store
40.82%
Traditional
Store 10.71%
69.4%
13.8%
Key Retail Store Attributes Determining Consumers’ Perceptions

28
H1: There is no significant association between the usual shopping place and the Demographic variables (Age, Family Income, Marital Status, Gender and Present Occupation).
Table: 5 Usual Shopping Place vs. Demographic VariablesDemographic Variables Chi-Square Value Asymp. ValueAge 11.571 0.072Family Income 8.727 0.602Marital Status 0.332 0.857Gender 3.177 0.204Present Occupation 15.487 0.050
From the result it is evident that for all the demographic variables (Age, Family Income, Marital Status, Gender, Present Occupation,), the chi-square test value (Asymp. Value) is greater than 0.05. Therefore, usual shopping place and demographic variables have no significant or considerable association.
H2. There is no significant association between demographics variables and respondents opinion about requirement for new organized retail stores.
Table: 6 Favoring Organized Retail Store vs. Demographic VariablesDemographics Variables Chi-Square Sig. ValueAge 6.867 0.333Family Income 17.24 0.069Marital Status 1.616 0.445Gender 0.892 0.640Present Occupation 6.345 0.609Family Structure 0.248 0.883
Here, chi- square significant value for all demographic variables is very high. Hence , it could be stated that all the demographics variables are not significantly associated with the respondents opinions regarding opening of the new (modern) organized retail store.
2) Influence of In-Store Salesperson on Purchase Decisions:
H3: Consumers’ purchase decision is influenced by salesperson while shopping at organized retail store.
Here, sample size is large enough, hence according to the central limit theorem the given set of data follows normality so, one sample t- Test is used to test the hypothesis.
Riteshkumar Dalwadi , Harishchandra Singh Rathod & Atul Patel

29SIES Journal of Management, April - August 2010, Vol.7(1)
Table: 7 Influence of Salesperson on Consumers’ Purchase DecisionTest Value = 2 (Salesperson)
Generally Purchase Decision Influenced By Whom
t Df Sig. (2-tailed)
Mean Difference
95% Confidence Interval of the Difference
Lower Upper-5.124 195 0.000 -0.342 -0.47 -.021
Here, sig. (2- tailed) value is 0.000, stating that consumers’ purchase decision is not influenced by salespersons while shopping at organized retail store.
3) Importance of the Store attributes:
A seven point rating scale was applied (where 1= extremely poor to 7= excellent) to collect the opinions of the respondents. Based on the personal discussion with the industry experts it was hypothesized that more than 60% of the respondents would rate the store attributes to be good ( more than 5 on the rating scale).To test the above hypothesis, non parametric Binomial test was applied as binomial test is used for dichotomous type of questions. The statistical accuracy was checked in the following manner.
H4: More than 60% Consumers perceive Product range, Store layout, Shopping convenient, Promotional schemes, Product pricing, customer service, Employee behavior, Store ambience as good (more than 5) at the organized retail store.
Table: 8 Perception of Consumers towards Organized Retail Store
Category N ObservedProp.
Test Prop.
Asymp. Sig. (1-tailed)
Product Range Group 1 <= 5 64 0.32 0.6 0.000
Group 2 > 5 132 0.68
Store Layout Group 1 <= 5 107 0.54 0.6 0.071
Group 2 > 5 89 0.46
Convenient Shopping Group 1 <= 5 114 0.58 0.6 0.324
Group 2 > 5 82 0.42
Promotional Schemes Group 1 <= 5 118 0.60 0.6 0.508
Group 2 > 5 78 0.40
Product Pricing Group 1 <= 5 122 0.62 0.6 0.286
Group 2 > 5 74 0.38
Key Retail Store Attributes Determining Consumers’ Perceptions

30
Customer Service Group 1 <= 5 117 0.59 0.6 0.492
Group 2 > 5 79 0.41
Employee Behavior Group 1 <= 5 133 0.67 0.6 0.014
Group 2 > 5 63 0.33
Store Ambience Group 1 <= 5 120 0.61 0.6 0.393
Group 2 > 5 76 0.39
The test result shows that asymp.sig. value for product range is less than .01 which implies that less than 60 % of the consumer perceive product range is not good while for others Store layout, Shopping convenience, Promotional schemes, Product pricing, customer service, Employee behavior, Store ambience asymp.sig value is more than .01 which indicate that more than 60% Consumers perceive Store layout, Shopping convenience, Promotional schemes, Product pricing, customer service, Employee behavior, Store ambience as good at the organized retail store.
4) Factor Analysis: Identifying Key Store Attributes Influencing Consumers’ Perceptions
The determinant of correlation matrix calculated for this analysis was 1.14E-004 > 0.00001, which implies no case of multicollinearity among the selected variables. Moreover Kaiser-Meyer-Olkin measure of sampling adequacy was 0.824 stating the applicability of factor analysis. Bartlett’s test of sphericity indicates that the correlation matrix of the selected variables is not identity matrix.
Table: 9 KMO and Bartlett’s Test
Kaiser-Meyer-Olkin Measure of Sampling Adequacy. 0.824
Bartlett’s Test of Sphericity Approx. Chi-Square 2923.685
df 561
Sig. 0.000
Before undertaking the factor analysis, variables having less (0.5) commanalities were removed from the list. When analyzing a covariance matrix, the initial Eigen values were the same across the raw and rescaled solution and Principal Component Analysis method was employed for the Extraction of the variables. Here three variables were removed from the list of 34 variables. Interpretability of the factors was improved through rotating the factors and rotation maximizes the loading of each factor, so varimax rotation method was employed in this analysis. Here all 34 factors have been extracted in the 8 components which are mentioned below.
Riteshkumar Dalwadi , Harishchandra Singh Rathod & Atul Patel

31SIES Journal of Management, April - August 2010, Vol.7(1)
Table: 10 Key Retail Store Attributes Framing Consumers’ PerceptionsFactor – 1 (courteous staff members) Factor – 2 (customers’attention)At this store employees are prompt serving
0.815 At this store customers get individual attention
0.819
At this store employees are courteous 0.736 At this store customers get better facilities to deposit personal belongings
0.672
At this store employees are knowledgeable
0.707 This retail store has Spotless and bright lightings
0.652
At this store employees are helpful 0.664 At this store it has convenient operating hours
0.615
At this store employees are enthusiastic
0.603
Factor – 3 (Offers and Discounts) Factor – 4 (comfort and elegance)At this store prices are with beneficial discount offers
0.758 This retail store has visually appealing shopping materials (like shopping bags, catalogs, or statements)
0.668
At this store prices are reasonable compared to the quality of products
0.653 This retail store has modern-looking equipments and fixtures
0.631
This store offers regular promotional schemes
0.617 At this store it is convenient to see price tags
0.565
At this store prices are attractive 0.615 This retail store has clean and attractive (restrooms, fitting rooms, toilets)
0.552
This store offers appealing or attractive advertisements
0.589
Factor – 5 ( proximity) Factor – 6 ( Variety)Location of this store is convenient 0.690 This store keeps merchandise in
sufficient stock0.720
Location of this store is proximate 0.651 This store keeps merchandise of High quality
0.670
This store keeps merchandise of wide range (e.g. different brands, models, versions, and varieties)
0.530
Factor – 7 ( speedy service) Factor – 8 ( assurance)This store keeps merchandise fresh and latest
0.732 At this store customers get promised services
0.979
At this store customers get fast services
0.561
Key Retail Store Attributes Determining Consumers’ Perceptions

32
Hence, the research suggests that the following important factors could be further explored for future research.
1) Courteous Staff Members 2) Customer Attention 3) Offers and Discounts 4) Comfort and Elegance 5) Proximity 6) Variety 7) Speedy Service 8) Assurance
The above mentioned factors also state the importance of each. One could interpret that customers visiting shopping malls give utmost importance to the above mentioned parameters. Though the study was carried out in Ahmedabad city, the same could be extended to other cities and States as well to get an exact idea about consumer perceptions.
Major Implications from the Study
Given below are some of the key implications which are useful in understanding consumers by the retailers.
Many past researchers have revealed the demographics of consumers have a vital role to play in shaping consumers’ perceptions. However, from the research it is inferred that usual shopping place and demographic variables have no significant or considerable association. At the same time, the findings also showed that the demographics variables are insignificantly associated with the favoring to opening of the new (modern) organized retail store.
It is also found that the most convenient shopping day is Sunday and Saturday, most convenient shopping time is evening (4:00 p.m. to 8:00 p.m.). Moreover, consumers normally spent 1 to 2 hours while visiting the organized retail stores. Hence, the
retailers must focus during these days and time of the days.
The majority (nearly 70%) of the respondents opined for opening new (modern) organized retail stores. So, there is an optimistic future for organized retailers. Moreover, it was also found that most (approximately 80%) of the young respondents (18 – 34 yrs) are in favour of organized retail stores. Therefore, to form the ‘Young Shoppers’ Club’ is a good business strategy and the members can be offered special offers, discounts, organizing contents etc. Thus, it would help in attracting the young shoppers to visit the retails store.
Less than half (40%) of the respondents’ usual shopping place is organized retail store. However, most of the consumers have visited the organized retail stores, indicating that there is great future business opportunity. Moreover, majority of people preferred a cash payment mode.
Normally, the salesperson is the one who interacts much with the shoppers in the store leading to more chances of influencing their shopping decision. However, the analysis suggested that consumers’ purchase decision is not influenced by salespersons while shopping at organized retail store. Thus, the role of salesperson is important and therefore well trained and skilled sales staff is a must.
More than one sixth of the consumers perceive product range, store layout, shopping convenience, promotional schemes, product pricing, customer service, employee behavior, and store ambience as good at the organized retail store. Moreover, the research suggests that the
Riteshkumar Dalwadi , Harishchandra Singh Rathod & Atul Patel

33SIES Journal of Management, April - August 2010, Vol.7(1)
following important factors that one could consider that customers visiting retail store give utmost importance to the hereunder mentioned parameters. 1) Courteous Staff Members, 2) Customer Attention, 3) Offers and Discounts, 4) Comfort and Elegance, 5) Proximity, 6) Variety, 7) Speedy Service, 8) Assurance. Thus, retailers must focus on and improve on these store attributes.
Limitation of the Study and Conclusion
Along with the merits, the study also has some limitations. The data collected is from Ahmedabad and sample size is restricted to 196 only. The value of any research findings depends critically on the accuracy of the data collected. Data quality might be compromised because of number of potential errors, e.g., understanding of questions, length of questionnaire, biased samples, biased responses etc. The biasness in the findings might appear because the survey was conducted all the retail stores during the day time only. Moreover, as the survey was conducted at the exit door of the store, the samples may be biased towards the organized retail stores. In addition to this the sampling procedure is non-probability convenience sampling and thus it inherently brings all the limitations of it.
This study has shown the consumers’ perceptions towards the organized retail stores which broadly helps to understand the shopper behavior. The study has revealed eight store attributes (1. Courteous Staff Members, 2. Customer Attention, 3. Offers and Discounts, 4. Comfort and Elegance, 5. Proximity, 6. Variety, 7. Speedy Service, 8. Assurance.) that mostly consumers use
to frame the store image in the retailing business. Such framed perception of certain strong attributes increases the ability of the store to attract consumers. We assume that the study would be very useful to retailers and researchers as it provides a realistic replication of the situation consumers typically encounter when they are exposed to attributes of the stores, form a perception towards the store attributes and subsequently it affects buying behavior.
References:
Abercrombie N., Hill S., & Turner B. S. (1994). Dictionary of. London: Penguin.
Cooper, D.R. and Schindler, P.S. (1998), Business Research Methods, 6th ed., McGraw-Hill, New York, NY.
Engel, James F., Kollat D. T., & Blackwell R. D. (1973). Consumer Behavior. New York: Holt, Rinehart & Winston.
Foxall G. R. & Goldsmith R. E. (1994). Consumer Psychology for Marketing. New York: Routledge.
Joyce M. L & Lambert D. R. (1996). Memories of the way stores were and retail store image. International Journal of Retail & Distribution Management, 24 (1), 24–33
Lindquist, J.D., (1974-75). Meaning of image: survey of empirical and hypothetical evidence. Journal of Retailing 50 (4), 29–38.
Martineau, P. (1958). The personality of the retail store. Harvard Business Review, (36) pp. 47-55.
Minshall, B.C. (1994). Apparel Preferences: Underlying Dimensions and Measurement. In M.R. De Long & A.M.
Key Retail Store Attributes Determining Consumers’ Perceptions

34
Fiore (eds). Aesthetics of Textiles and Clothing: Advancing Multidisciplinary Perspective. International Textile and Apparel Association Special Publication #7. Monument, Colorado: International Textiles and Apparel Association.
O’Connor, M.J. (1990). On the subject of image. Supermarket Business, 47 (1), 35-40.
Peter, J.P. & Olson, J.C. (1990). Consumer Behavior and Marketing Strategy (2nd ed.). Boston: Irwin.
Rani L. and Velayudhan S. K. (2008). Understanding consumer’s attitude towards retail store in stockout situations, Asia Pacific Journal of Marketing and Logistics Vol. 20 No. 3, pp. 259-275.
Reaves, C.C. (1992), Quantitative Research for the Behavioral Sciences, John Wiley and Sons Inc, New York, NY.
Runyon K. E. (1977), Consumer Behavior and Practice of Marketing, OH: Charles E. Merrill Publishing Co. Retrieved on September 16, 2008 from http://www.ciadvertising.org/studies/student/97_fall/theory/selective/deperce.htm
Schiffman L. G. & Kanuk L. L. (2007). Consumer Behavior. New Delhi: Dorling Kindersley (India) Pvt. Ltd.
Sheth, & Mittal, (2004). Consumer Behaviour: A Managerial Perspective. (2nd ed.). Ohio: Thomson.
Sinha P. K. & Banerjee A. (2004). Store choice behavior in an evolving market. International Journal of Retail & Distribution Management, 32 (10), 482–494.
Tauber E. M. (1972). Why do people shop? Journal of Marketing, 36 (4), 46-49
Treblanche, N.S. (1999), “The perceived benefit derived from visits to a super regional shopping centre”, South African Journal of business, Vol. 30 No. 4, pp. 141-156.
Endnotes:
Analysis: India’s Organized Retail Sector Strengthens into 2008, February 06, 2008; (http://www.tradingmarkets.com/.site/news/Stock%20News/1069201/)
Estimation made by International consulting firm Ernst & Young.
Abercrombie N., Hill S., & Turner B. S. (1994). Dictionary of. London: Penguin.
Hasan M., Issar A., Ojha G., and Singh B. P., ‘The Indian retail bazaar’, published their work in Brand strategy, November 2006, pp. 36-39
Tauber E. M. (1972). Why do people shop? Journal of Marketing, 36 (4), 46-49
Adopted from Visser E. M., Preez R. D., and Noordwyk H. V. (2006). Importance of apparel store image attributes: perceptions of female consumers, SA Journal of Industrial Psychology, 32 (3), 49-62
The researchers assumed the “P” value for Ahmedabad after conducting an pilot survey of the consumers in Ahmedabad.
Riteshkumar Dalwadi , Harishchandra Singh Rathod & Atul Patel

35SIES Journal of Management, April - August 2010, Vol.7(1)
A Study of Service Quality on Banks with Servqual Model
Rajesh Nair, Ranjith P V, Sumana Bose and Charu ShriProf. Rajesh Nair is Faculty-Marketing-SIESCOMS. Prof. Ranjith P V is Faculty-Gen Management- SIESCOMS. Prof. Sumana Bose is Faculty-Marketing SIESCOMS. Dr. Charu Shri, is Faculty OB & QT- ITM Business School, Kharghar
AbstractThe study attempts to find out the Service quality of Banks in Navi Mumbai. It tries to look whether there is gap between customer expectations and perceptions of service offered. One of the most popular models, SERVQUAL, used in Service marketing is used in the study. SERVQUAL is based on the perception gap between the received service quality and the expected service quality, and has been widely adopted for explaining consumer perception of service quality. An undisguised structured questionnaire, SERVQUAL by (Parasuraman, et al 1985), was used for the research. The sample size used was 101 respondents. The study was conducted in Navi Mumbai (Maharashtra), India. It was observed that there were five important factors for service quality analysis which are Tangibles, Reliability, Responsiveness, Assurance and Empathy. The fact is evident that there is a gap between customer expectations and service perception and it can be reduced only by employing effective training methods by banks. The limitations of the study are that the sample size is limited and it is restricted to Navi Mumbai Area in Maharashtra.
KeyWords : Service Quality, Banks, SERVQUAL
Introduction
In the current socioeconomic context, the service sector has become increasingly more vital, revealing the need to know and study the particularities of its operations and to set up specific management methodologies that fit its context and specificity. It is necessary to understand that service processes are different from manufacturing processes, especially due to their intangible nature and the direct participation of clients.
Aiming to make clients loyal, companies have made every effort to meet their needs and exceed their expectations. The SERVQUAL scale is one of the tools that can help in this sense.
According to Oliver (2005), SERVQUAL is the method that assesses client satisfaction as a result of the difference between expectation and the performance obtained. According to Zeithaml, Parasuraman and Berry (1990), SERVQUAL is universal and can be applied to any service organization to assess the quality of services provided.
Today, banks have diversified their activities and are getting into new products and services that include opportunities
SIES Journal of Management, April - August 2010, Vol.7(1): 35-45

36
Rajesh Nair, Ranjith P V, Sumana Bose and Charu Shri
in credit cards, consumer finance, wealth management, life and general insurance, investment banking, mutual funds, pension fund regulation, stock broking services, custodian services, private equity, etc. At the same time due to severe competition banks nowadays have to excel in their service and that demands commitment from all.
Banking industry is experiencing the service gaps concerned to perception and expectation parameters of the customer. This void generates opportunities for the banks to improve and develop systems which are more customers friendly, so that the users can be turned into happy customers of today and tomorrow.
Banking industry is also in search of improvements in service quality to satisfy the expectations of their customers and the market. However, since banking services have very particular characteristics, the SERVQUAL model must be adapted according to the most important determining factors: reliability, tangibility, responsibility, security and empathy, as proposed by Parasuraman, Zeithaml and Berry (1985).
This paper endeavors to fill the gap in the service quality which determines customer satisfaction by exploring the dimensions of customer perceived service quality with that of the expected service quality in the context of the banking services in Navi Mumbai using the multidimensional, generic, internationally used market research instrument called SERVQUAL. The philosophy of the servqual model developed by Parasuraman, Zeithaml and Berry is universally accepted and applied for measuring service quality in different sectors including banking.
Literature Review
According to Lovelock (2001), services are economic activities that create value and provide benefits to the client at specific times and in specific places as a result of a desired change in, or on behalf of, the one that receives the service. According to Meirelles (2006), a service is essentially intangible and only assessed when combined with other functions, that is, with other tangible productive processes and products. This intangible nature is associated with this process, which à priori cannot be touched. Services have some specific characteristics that differentiate them from the manufactured goods. Gianesi and Corrêa (2004) say the following special characteristics of service operations are the main ones: intangibility, client participation and simultaneous production and consumption. According to Coelho (2004, p. 36), “in service management it is important to understand how clients assess the quality of the service provided, that is, how quality is perceived by the client”.Many scholars and service marketers have explored consumers’ cognitive and affective responses to the perception of service attributes in order to benefit by providing what consumers need in an effective and efficient manner. Consumer satisfaction (e.g. Cadott et al, 1987; Churchill & Surprenant, 1982; Fornell,1992; Oliver, 1997) and PSQ (e.g. Parasuraman et al, 1985, 1988; Rust & Oliver, 1994; Zeithaml et al, 1996) have been considered the primary intervening constructs in the area of service marketing because ultimately they lead to the development of consumer loyalty or re-patronization of a product or service.

37SIES Journal of Management, April - August 2010, Vol.7(1)
A Study of Service Quality on Banks with Servqual Model
Consumer perception of service quality is a complex process. Therefore, multiple dimensions of service quality have been suggested (Brady & Cronin, 2001). One of the most popular models, SERVQUAL, used in service marketing, was developed by Parasuraman et al (1985, 1988). SERVQUAL is based on the perception gap between the received service quality and the expected service quality, and has been widely adopted for explaining consumer perception of service quality. Originally 10 dimensions of service quality were proposed (reliability, responsiveness, competence, access, courtesy, communication, credibility, security, understanding the consumer, and tangibles). Later these were reduced to five (reliability, responsiveness, empathy, assurances and tangibles).
SERVQUALAccording to Parasuraman, Zeithaml and Berry (1985), regardless of the type of service, consumers basically use the same criteria to assess quality. Service quality is a general opinion the client forms regarding its delivery, which is constituted by a series of successful or unsuccessful experiences. Managing gaps in service will help the company improve its quality. But gaps are not the only means clients use to judge a service. They can also use five broad-based dimensions as judgment criteria: reliability, tangibility, responsibility, security and empathy (LOVELOCK, 2001).
These dimensions are briefly commented below (BATESON and HOFFMAN, 2001; LOVELOCK, 2001):
- Reliability: is the company reliable in providing the service? Does it provide
as promised? Reliability reflects a company’s consistency and certainty in terms of performance. Reliability is the most important dimension for the consumer of services;
- Tangibility: how are the service provider’s physical installations, equipment, people and communication material? Since there is no physical element to be assessed in services, clients often trust the tangible evidence that surrounds it when making their assessment;
- Responsibility: are company employees helpful and capable of providing fast service? It is responsible for measuring company and employee receptiveness towards clients;
- Security: are employees well-informed, educated, competent and trustworthy?
This dimension encompasses the company’s competence, courtesy and precision; and
- Empathy: this is the capacity a person has to experience another’s feelings. Does the service company provide careful and personalized attention?
These elements clearly have a highly subjective factor linked to the person who perceives the service. In reality, according to Kilbourne et al. (2004), every type of service can have determining factors that are considered more important than others, which will depend on environment characteristics or type of activity.It is difficult to measure the quality of service operations because they have the characteristic intangibility. Aimed at solving this problem, Parasuraman, Zeithaml and Berry (1985) developed a methodology in

38
which there is a comparison between several orders of expectations and perceptions of service quality by the consumer. These differences between perceptions and expectations are addressed in the quality in service model shown in Figure 1.This model seeks to help managers understand the sources of problems in quality and how they can improve them (COELHO, 2004).SERVQUAL is an instrument to measure quality that stems from this model and works with the difference in scores (gaps) in the form of a questionnaire. The SERVQUAL scale (questionnaire) has two sections: one to map client expectations in relation to a service segment and the other to map perception in relation to a certain service company (FITZSIMMONS and FITZSIMMONS, 2000).
The original SERVQUAL scale uses 22 questions to measure the five dimensions of service quality: reliability, tangibility, security, empathy and responsibility. These questions should be scored on a Likert scale from 1 to 7. The extremes are marked as agree completely (excellent) and disagree completely (mediocre).The results of the two sections (perceptions and expectations) are compared to reach a parameter (gap) for each of the questions, that is, the final score is generated by the difference between them (Parameter = Perception – Expectation).
A negative result indicates the perceptions are below expectations, revealing the service failures that generate an unsatisfactory result for the client. A positive score indicates the service provider is offering a better than expected service (COELHO, 2004).
ObjectivesThe objectives of this research paper are:
• To ascertain any actual or perceived gaps between customer expectations and perceptions of the service offered.
• To study service quality in the banks particularly in Navi Mumbai.
• To provide a small contribution towards improving banking service by adapting and using an instrument that, if well used, can generate interesting results for the improvement of banks.
• To identify the three most important parameters (gaps) of Service Quality for both expectations and perceptions of the service offered in banking sector.
• To find out impact of Gender on the three most important identified parameters of Service Quality for both Expectations and Perceptions
• To find out impact of Occupation on the three most important parameters of Service Quality for both Expectations and Perceptions
MethodologyA descriptive research was used to gain an insight into consumer’s perceived service quality offered by banks with respect to five dimensions of SERVQUAL scale. Primary data were collected for the research. An undisguised structured questionnaire, SERVQUAL by (Parasuraman, et al 1985), was used for the research. The sample size used was 101 respondents. The study was conducted in Navi Mumbai, India. The respondents were selected on the basis of
Rajesh Nair, Ranjith P V, Sumana Bose and Charu Shri
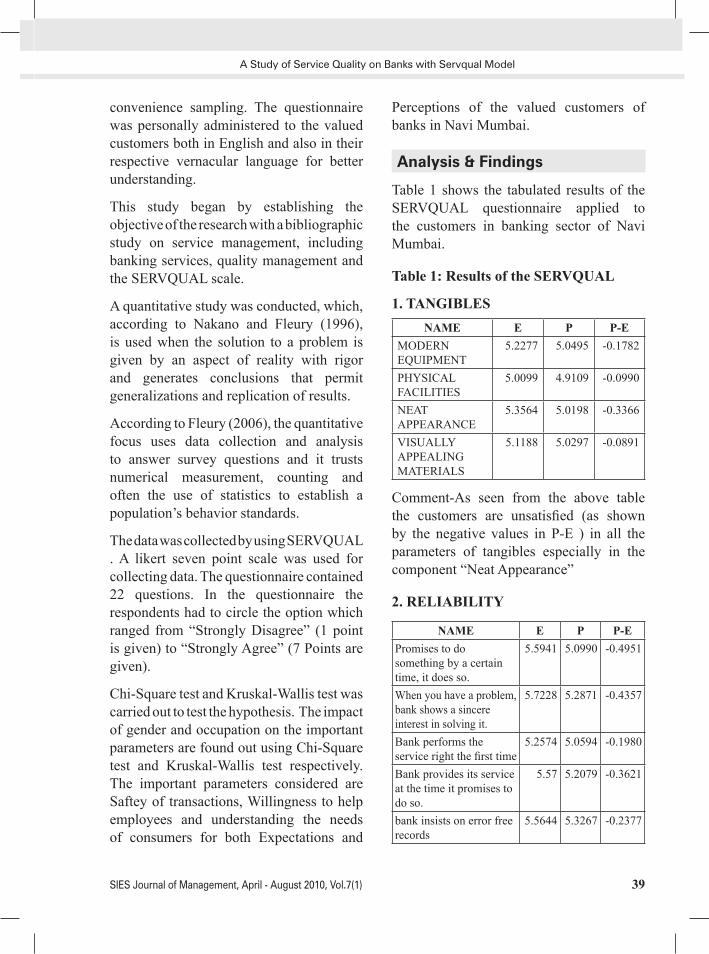
39SIES Journal of Management, April - August 2010, Vol.7(1)
convenience sampling. The questionnaire was personally administered to the valued customers both in English and also in their respective vernacular language for better understanding.
This study began by establishing the objective of the research with a bibliographic study on service management, including banking services, quality management and the SERVQUAL scale.
A quantitative study was conducted, which, according to Nakano and Fleury (1996), is used when the solution to a problem is given by an aspect of reality with rigor and generates conclusions that permit generalizations and replication of results.
According to Fleury (2006), the quantitative focus uses data collection and analysis to answer survey questions and it trusts numerical measurement, counting and often the use of statistics to establish a population’s behavior standards.
The data was collected by using SERVQUAL . A likert seven point scale was used for collecting data. The questionnaire contained 22 questions. In the questionnaire the respondents had to circle the option which ranged from “Strongly Disagree” (1 point is given) to “Strongly Agree” (7 Points are given).
Chi-Square test and Kruskal-Wallis test was carried out to test the hypothesis. The impact of gender and occupation on the important parameters are found out using Chi-Square test and Kruskal-Wallis test respectively. The important parameters considered are Saftey of transactions, Willingness to help employees and understanding the needs of consumers for both Expectations and
Perceptions of the valued customers of banks in Navi Mumbai.
Analysis & Findings
Table 1 shows the tabulated results of the SERVQUAL questionnaire applied to the customers in banking sector of Navi Mumbai.
Table 1: Results of the SERVQUAL
1. TANGIBLESNAME E P P-E
MODERN EQUIPMENT
5.2277 5.0495 -0.1782
PHYSICAL FACILITIES
5.0099 4.9109 -0.0990
NEAT APPEARANCE
5.3564 5.0198 -0.3366
VISUALLY APPEALING MATERIALS
5.1188 5.0297 -0.0891
Comment-As seen from the above table the customers are unsatisfied (as shown by the negative values in P-E ) in all the parameters of tangibles especially in the component “Neat Appearance”
2. RELIABILITY
NAME E P P-EPromises to do something by a certain time, it does so.
5.5941 5.0990 -0.4951
When you have a problem, bank shows a sincere interest in solving it.
5.7228 5.2871 -0.4357
Bank performs the service right the first time
5.2574 5.0594 -0.1980
Bank provides its service at the time it promises to do so.
5.57 5.2079 -0.3621
bank insists on error free records
5.5644 5.3267 -0.2377
A Study of Service Quality on Banks with Servqual Model

40
Comment-In the case of parameters in reliability also the customers are not happy as shown by the negative values of (P-E). The unsatisfaction is highest in the case of the first parameter, ie, “Promises to do something by a certain time, it does so”
3. RESPONSIVENESS
NAME E P P-EEmployees in bank tell you exactly when services will be performed.
5.5941 4.8614 -0.7327
Employees in bank give you prompt service.
5.5941 5.0693 -0.5248
Employees in bank are always willing to help you.
5.7327 5.1782 -0.5545
Employees in bank are never too busy torespond to your request
4.9905 4.7327 -0.2578
Comment-In the case of parameters in reliability also the customers are not happy as shown by the negative values of (P-E). The dissatisfaction is highest in the case of the first parameter, ie, “Employees in the bank tell you exactly when the services have to be performed”
4. ASSURANCENAME E P P-E
The behavior of employees in bank instillsconfidence in you 5.45 4.9604 -0.4896You feel safe in your transactions with bank.
5.9208 5.6238 -0.2970
Employees in bank area consistently courteous with you.
5.396 5.0891 -0.3069
Employees in bank have the knowledge to answer your questions.
5.6634 5.2673 -0.3961
Comment-In the case of parameters in reliability also the customers are not happy as shown by the negative values of (P-E). The un satisfaction is highest in the case of the first parameter, ie, “The behavior of the employees in bank instills confidence in you”
5. EMPATHYNAME E P P-E
Bank gives you individual attention
5.2673 5.0396 -0.2277
Bank has operating hours convenient to all its customers.
5.1683 4.9208 -0.2475
Bank has employees who give you personal attention.
4.9703 4.9109 -0.0594
Bank has your best interest at heart.
5.297 4.9604 -0.3366
The employees of bank understand your specific needs.
5.5149 5.3465 -0.1684
Comment-In the case of parameters in reliability also the customers are not happy as shown by the negative values of (P-E). The un satisfaction is highest in the case of the first parameter, ie, “Bank has your best interests at heart”
TABLE 2: Calculations to Obtain Unweighted Servqual ScoreAverage Tangible SERVQUAL score - 0.1757Average Reliability SERVQUAL score
- 0.3457
Average Responsiveness SERVQUAL score
-0.5175
Average Assurance SERVQUAL score
-0.3720
Average Empathy SERVQUAL score - 0.2080AVERAGE (= Total / 5) UNWEIGHTED SERVQUAL SCORE
- 0.3234
The results of the two sections are compared to arrive at a parameter for each of the questions and also for each of the
Rajesh Nair, Ranjith P V, Sumana Bose and Charu Shri

41SIES Journal of Management, April - August 2010, Vol.7(1)
five dimensions, that is, the final score is generated by the difference between the respondent’s perceptions and expectations. We underscore that a negative result must be viewed as an opportunity for improvement and not as a simple problem.Questions 1 to 4 refer to the tangibility dimension, which obtained an overall average of -0.1757. The expectation of customers in relation to this dimension is high in questions 1 and 3, whereas the corresponding perceptions are the lowest among the entire table of perceptions.The reliability dimension is analyzed in questions 5 to 7, which obtained an overall average of -0.3457.Questions 8 to 11 of the questionnaire refer to the responsiveness dimension and its overall average was -0.5175.Questions 12 to 15 in the adapted SERVQUAL scale refer to the assurance dimension, which obtained an overall average of -0.372.The final four questions, 16 to 19, refer to the empathy dimension, which obtained an overall average of -0.208.The difference between perceptions and expectations (P-E) for all questions in this dimension was negative, revealing there are considerable faults in the service, which are jeopardizing the quality of the service being offered.The overall average for the five dimensions was -0.3234. This indicates a great opportunity for improvement in the entire service providing cycle. However, for that to happen, great effort must be made. There is a gap between what is expected and perceived. The gap is highest in the
factor “Responsiveness” which means that employees have to improve their willingness to help the customers.According to the respondent’s expectations safety of transactions, willingness of employees and interest in solving the problems of consumers are the most important parameters in deciding service quality. According to consumer’s perception, safety of transactions, understanding the need of consumers and maintaining error free records got good feedback.
Impact of Gender and Occupation on Expectations and PerceptionsTo test the impact of gender on importance given to the parameters Chi Square test is applied (Table 3, 4, 5, 6, 7, 8).
Hypothesis 1:H1O: There is no significant impact of gender and the expectation of valued customers on the parameter, ie, interest of employees in solving the problem.
H1A: There is significant impact of gender and the expectation of valued customers on the parameter, ie, interest of employees in solving the problem.
Table 3: EXPECTATION ON INTEREST * GENDER
Chi-Square TestValue df Asymp. Sig.
(2 sides)Pearson Chi-Square 6.466a 6 .373Continuty CorrectionLikelihood Ratio 7.123 6 .310Linear-by-Linear Association
2.9.3 1 .088
N of Valid Cases 101a. 7 cells(50.0%) have expected countless than 5. The minimum expected count is .32.
A Study of Service Quality on Banks with Servqual Model

42
Hypothesis 2:H2O: There is no significant impact of gender and the expectation of valued customers on the parameter ie, Willingness to help.H2A: There is significant impact of gender and the expectation of valued customers on the parameter ie, Willingness to help.
Table 4: EXPECTATION ON WILLINGNESS * GENDER
Chi-Square TestValue df Asymp. Sig.
(2 sides)Pearson Chi-Square 5.859a 5 .320Continuty CorrectionLikelihood Ratio 6.345 5 ..724Linear-by-Linear Association
009 1 .924
N of Valid Cases 101a. 6 cells (50.0%) have expected count less than 5. The minmum expected count is . 32.
Hypothesis 3: H3O: There is no significant impact of gender and the expectation of valued customers on the parameter, ie, Safety of transactions.H3A: There is significant impact of gender and the expectation of valued customers on the parameter, ie, Safety of transactions.Table 5: EXPECTATION ON SAFTEY * GENDER
Chi-Square TestValue df Asymp. Sig.
(2 sides)Pearson Chi-Square 9.906a 6 .129Continuty CorrectionLikelihood Ratio 12.676 6 .048Linear-by-Linear Association
3.445 1 .063
N of Valid Cases 101a. 8 cells(57.1%) have expected countless than 5. The minimum expected count is .32.
The chi-square values are above 0.05 and so in all the above cases HO is accepted. In all cases Gender do not have any impact on the 3 most important parameters considered, ie, Safety of transactions, Willingness to help and Interest in solving consumer problems according to the expectation of respondents.
Hypothesis 4:H4O: There is no significant impact of gender and the perception of valued customers on the parameter, ie, interest of employees in solving the problem.H4A: There is significant impact of gender and the perception of valued customers on the parameter, ie, interest of employees in solving the problem.
Table 6: PERCEPTION ON INTEREST * GENDER
Chi-Square Test
Value df Asymp. Sig. (2 sides)
Pearson Chi-Square 4.472a 6 ..613
Continuty Correction
Likelihood Ratio 4.717 6 .581
Linear-by-Linear Association
.540 1 .463
N of Valid Cases 101
a. 8 cells(57.1%) have expected countless than 5. The minimum expected count is .32.
Hypothesis 5:H5O: There is no significant impact of gender and the perception of valued customers on the parameter, ie Willingness to help.H5A: There is significant impact of gender and the perception of valued customers on the parameter, ie, Willingness to help.
Rajesh Nair, Ranjith P V, Sumana Bose and Charu Shri

43SIES Journal of Management, April - August 2010, Vol.7(1)
Table 7: PERCEPTION ON WILLINGNESS * GENDER
Chi-Square TestValue df Asymp. Sig.
(2 sides)Pearson Chi-Square 3.220a 6 .781Continuty CorrectionLikelihood Ratio 3.096 6 .797Linear-by-Linear Association
.1855 1 .173
N of Valid Cases 101a. 7 cells(57.0%) have expected countless than 5. The minimum expected count is .32.
Hypothesis 6:H6O: There is no significant impact of gender and the perception of valued customers on the parameter, ie Safety of transactions.H6A: There is significant impact of gender and the perception of valued customers on the parameter, ie, Safety of transactions.
Table 8: PERCEPTION ON SAFETY * GENDER
Chi-Square TestValue df Asymp. Sig.
(2 sides)Pearson Chi-Square 8.539a 6 .201Continuty CorrectionLikelihood Ratio 9.775 6 .134Linear-by-Linear Association
.233 1 .629
N of Valid Cases 101a. 8 cells(57.1%) have expected countless than 5. The minimum expected count is .32.
The chi-square values are above 0.05 and so in all the above cases HO is accepted. In all cases Gender do not have any impact on the 3 most important parameters considered, ie, Safety of transactions, Willingness to help and Interest in solving consumer problems according to the perception of respondents.
To test the impact of occupation on importance given to the parameters Kruskal-Wallis test is applied (Table 9, 10).
Hypothesis 7:H7O: There is no significant impact of occupation and the expectation of the valued customer on the parameters, ie, interest of employees in solving the problem, willingness to help the customers and safety of transactions.H7A: There is significant impact of occupation and the expectation of the valued customer on the parameters, ie, interest of employees in solving the problem, willingness to help the customers and safety of transactions.
Table 9: Occupation* Expectation on Interest, Willingness, Safety
Test Statistics a,bINTERST WILLINGN SAFTEY
Chi-Square 5.821 2.420 .201df 2 2 2Asymp. Sig. .054 .298 .053a. Kruskal Wallis Test b. Grouping Variable: OCCUPA
The chi-square values are above 0.05, so in all the above cases HO is accepted.
Hypothesis 8:H8O: There is no significant impact of occupation and the perception of valued customers on the parameters, i.e, interest of employees in solving the problem, willingness to help the customers and safety of transaction.H8A: There is significant impact of occupation and the perception of valued customers on the parameters, i.e, interest of employees in solving the problem, willingness to help the customers and safety of transactions.
A Study of Service Quality on Banks with Servqual Model

44
Table 10: Occupation * Perception on Interest, Willingness, Safety
Test Statistics a,bINTERST WILLINGN SAFTEY
Chi-Square 1.341 4.830 1.878df 2 2 2Asymp. Sig. .512 .089 .391a. Kruskal Wallis Test b. Grouping Variable: OCCUPA
The Chi-Square values are above 0.05, so in all the above cases HO is accepted.In all cases we can see that Gender and Occupation do not have any impact on both Expectations and Perceptions of the valued customers on most important parameters considered, ie, Safety of transactions, Willingness to help and Interest in solving consumer problems in bank in Navi Mumbai.
Conclusion
Service Quality plays an important role in assessing a bank in today’s world of cut-throat competition. In this regard the banks in Navi Mumbai have to improve in a lot of areas before they can compete with other International banks. This is very evident from the fact that there is a gap between what is expected and perceived for most or all of the parameters and so the banks have to take adequate training methods for employees so that they will be able to reduce the gaps
Recommendations
Employees have to be trained on the skills required to give adequate help to customers. Most of the banks do not have the facilities to inform the consumers when the services will be performed. This is one area where
the banks have to concentrate and make sure they inform the customers about the time taken for each service. Banks have to take service given to the consumers as a “P” for their marketing and invest time, resources and money on improving the efficiency in this frontier. One strategy is to dedicate one or two people in each branch to inform the customers about the services to be provided and also solve the queries of them.
Limitations of the StudyThe sample size is only 101 respondents and so the results may not be accurate. The study measures the gap between expectations and a perception of customers which is only one part of the service quality gaps. The reliability of the data is not verified. Also the questionnaire does not have the questions for understanding the weightage of the 5 factors in SERVQUAL and so weighted index cannot be found out. A better tool could be SERVPERF but here we are using the traditional SERVQUAL model. The geographic scope is limited to Navi Mumbai only.
ReferencesBadri, M. A.; Abdulla, M.; Al-Madani, A. Information technology center service quality. International Journal of Quality & Reliability Management, vol. 22 n. 8, 2005, p. 819-848.Cetina I., Odobescu E.(2007) – “Strategii de marketing bancar”, Ed. Economica, Bucuresti.Chirita, N.(2004) –“ Politici si strategii ale tranzitiei, Analiza modelelor”. Ed. Economica, BucurestiDr. Arash Shahin SERVQUAL and Model of Service Quality Gaps:A Framework
Rajesh Nair, Ranjith P V, Sumana Bose and Charu Shri

45SIES Journal of Management, April - August 2010, Vol.7(1)
for Determining and Prioritizing Critical Factors in Delivering Quality Services Gupta Ambuj and Rawat Brijesh, Banking Sector Needs Overhauling-Professional Banker-Icfai University Press(Page Nos-25-28,November 2009)Harrison Tina(2000) – “ Financial Services Marketing”, Prentice HallKaul.Subhashini. Measuring Retail Service Quality-Examining applicability of International Research Perspectives in India-Vikalpa (Page no 15-27, January-March 2007).Oliveira, O. J. Gestão da qualidade: introdução à história e fundamentos. In: Oliveira, O. J. (org.). Gestão da qualidade: tópicos avançados. São Paulo: Thonsom Learning, 2004.Parasuraman, A., Zeithaml, V. A., & Berry, L. L. (1985). A conceptual model of service quality and its implications for future research. Journal of Marketing, 49, 41-50.Parasuraman, A., Zeithaml, V. A., & Berry, L. L. (1988).SERVQUAL: A multiple-item scale for measuring con- sumer perceptions of service quality. Journal of Retailing, 64, 12-40.Parasuraman, A., Zeithaml, V. A., & Berry, L. L. (1994). Re- assessment of expectations as a comparison standard in measuring service quality: Implications for further re- search. Journal of Marketing, 58, 111-124.Sachdev B., Sheetal, Verma V. Harsh- Relative Importance of Service Quality Dimensions: A Multi Sectoral StudySERVPERF Analysis In Retail Banking Dr. T. Vanniarajan*B. AnbazhaganSpreng, R.A., & MacKoy, R. D. (1996). An empirical examination of a model of perceived
service quality and satisfaction. Journal of Retailing, Vol. 72 No. 2, pp. 201-14.Sureshchandar, G., Rajendran,C., & Anantharaman,R. (2002). The relationship between service quality and consumer satisfaction – a factor specific approach. Journal of Services Marketing, Vol. 16, No. 4, pp. 363-79.Teas,R. (1993). Expectations, performance evaluation, and consumers’ perceptions of quality. Journal of Marketing, Vol. 57 October, pp. 18Woodside, A.G., Frey,L.L., & Daly,R.T. (1989). Linking service quality, customer satisfaction and behavioural intention. Journal of Health Care Marketing, Vol. 9 No. 4, pp. 5-17Zeithaml V., Parasuraman A., Berry (1990) – “Delivering Quality Services”, The Free PressZeithaml, V.A., & Bitner,M.J. (2003). Services Marketing, Integrating Customer Focus across the Firm. New York: McGraw-Hill.Zeithaml, V. A. (1988). Consumer perceptions of price, quality, and value: a means-end model and synthesis of evidence. Journal of Marketing, Vol. 52 No. 3, pp. 2-22.Zeithaml, V.A. (2000). Service quality, profitability, and the economic worth of customers: what we know and what we need to learn. Journal of the Academy of Marketing Science, Vol. 28 No. 1, pp. 67-85.Zeithaml, V. A., Berry, L. L., & Parasuraman, A. (1996). The behavioral consequences of Service quality. Journal of Marketing, Vol. 60 April, pp. 31-46.Zeithaml, V., Parasuraman, A., & Berry,L. (1990). Delivering Quality Service. Free Press, New York, NY.
A Study of Service Quality on Banks with Servqual Model

46
A Conceptual PaperShould Marketers Consider Religiosity in Understanding Consumer Purchase Behavior?
M.G.Parameshwaran and R.K.SrivastavaM.G.Parameshwaran is CEO of Draft FcbUlka andDr. R.K Srivastava is Director SIESCOMS
1. IntroductionReligion has been an area of study of sociologists for several decades (Durkheim 1951) and consumer behavior experts have started studying religion and religiosity only in the last three decades (Hirshman 1982). It is commonly known that eating habits differ across different religious groups (Durkheim 1976, Appadurai 1996, Srinivas 1996, Scott et al 2005). Religion could play a role in some cultural landscapes and behaviors. Will there be different behavior between devout and not so devout consumer? Engel et al (1993) points out that individual values that a consumer internalizes are actually transmitted to him through three key media: family, religious institutions and school. On a macro level, religion could influence group’s value. Infact, Sheth et al (1999), points out that like family, religion is a reference group that exercises substantial influence on customers, their values, customer and habits. Religious institutions influence customer values, both with respect to importance and value of material possessions and the goals. Jain (2000) points out that religion shapes several aspects such as our belief of cleanliness, Puritanism etc. Western culture can trace its set of value and belief to the Judeo-Christian heritage
SIES Journal of Management, April - August 2010, Vol.7(1): 46-54
AbstractPurpose: Study was confined to measure purchase criteria and purchase process in consumer durable especially in emerging market like India keeping religiosity as a factor. Religion has not been very important area of consumer study
Design/ Methodology/ Approach: It was based on secondary data .It was to develop a model which can explain the purchase process of consumer durables keeping religion in the back ground.
Findings: This study is an attempt to link religion and its belief with consumer durable purchase criteria. Religiosity and its intensity could influence the purchase behavior. This needs to be measured and main factor analysis will throw better information.
Originality: This study has been done for the first time where religiosity in understanding consumer purchase behavior has been studied
Key Words: Religiosity, purchase behavior, Consumer behavior

47SIES Journal of Management, April - August 2010, Vol.7(1)
A Conceptual Paper, Should Marketers Consider Religiosity in Understanding Consumer Purchase Behavior?
(Bennet and Kassarjian 1976). Religion plays a vital role in shaping the consumer behavior, Schiffman and Kaunk (1997) point out religious institution provides and perpetuates religious consciousness, spiritual guidance and moral training. Religion has not been very important area of consumer study in the US since the information of religious background was not easy to obtain well, and Prensky (1996) points out that religious background was not asked for in the US census studies or most marketing research projects. However, it has been reported that American are possibly one of the most religious set of people and 90% of American claim a religious affiliation (Hawkins et al 1998). De Mooij (2004) points out that religious affiliation may by then be less culturally relevant than it is assumed. She acknowledges that in India family and religion remains solid block of society. 1.2 Role of religion on consumer behavior Consumer behavior as a distinct area of study in marketing was born in mid sixties with the development of buyer behavior models. Howards and Sheth (1999) and Engel et al (1993) for the first time acknowledged the various influences on consumer buying process. Religion that formed a part of the environment does influence the buying process. Hirschman (1982) points out that it is possible religion has been seeing as taboo topic among consumers. One of the earliest reports that found a relationship between buyer behavior and religion was a study on stove location (Thomson and Raine 1976). This study claims that religious affiliation was useful basis for market segmentation in furniture sales. However, researcher did not find the religious classification
to be significant. Hirschman studied the effect of the Jewish ethnicity on consumer behavior with respect to specific areas such as innovativeness and information transfer. Jewish customers displayed higher level of innovativeness to adoption as compared to non Jewish customers. Religious affiliation could influence consumer’s personality belief, values and behavior.However, according to Burnett religious affiliation has no role in store evaluative criteria. However, church attendance was related to shopping significantly Adeleeb (1993) pointed out that there exists a significant relationship between religious affiliations to a hospital choice. 1.3. Impact of Religion on shopping behavior According to Bailey and Sood (1993) there are twenty dimension on shopping variables and found that Catholic, Hindu, and Islamic consumer behavior to wards shopping was different from that of Buddhist, Jewish and Protestant consumer. Delener (1990) attempted to understand the consumer perceived risk associated with the purchase of product such as automobile and microwave oven. Study showed that Catholic consumers, as compared to Jewish, were more likely to be sensitive to negative consequences. Across both the religions, it was found that religious individuals tend to perceive higher risk in their purchase decisions. This could be because highly religious individuals tend to be less secure and self confident than less religious individuals. This part needs to be studied. Degree of religiosity could affect consumer shopping behavior. Delener’s (1994) later study showed significant differences between pro religious Catholic and Jewish households in terms

48
M.G.Parameshwaran and R.K.Srivastava
of family decision making with Jewish households giving a more dominant role to the husband. However, it is not studied. In fact, Mokhlis (2006) points toward the fact those more religious consumers tend to be different in their purchase behavior as compared to less devout consumers. Is it due to intensity of religiosity? Therefore, it is necessary to understand the importance of several purchase criteria and other influencing factors (Esso and Dibb 2004)
2. Problems and Issues Study of Mokhlis (2006) based on Worthington et al (2003) showed that quality consciousness, impulsive shopping, price consciousness were consistently related to religiosity. However, impact of culture and intensity of religiosity requires a fresh study as intensity of religiosity could affect the purchase behavior. Religiosity as pointed out by earlier by Delener’s study (1994), Mokhlis (2006), Gur (2005) could affect the behavior.
Consumer behavior as a science is only forty years old with oldest buying behavior model unveiled in the late 60’s. Internal variables like personality attitude, belief and opinions have been studied across the globe. Among the external variables culture and religion have emerged as key external variables.
The real challenge is to ascertain the level of religiousness and religiosity. Studies have shown that there can be six dimensions of religiousness: belief, experience religious practice religious knowledge, individual moral consciousness and social consciousness (Dejong et al 1976, Wikes et al 1986). Allport and Ross (1967) took 20 statements to measure religiosity. This was subsequently used by Delener (1990)
and Esso and Dibb (2004). The recent one was by Worthington (2003) on religious commitment. However, a study which could measure purchase criteria and purchase process in consumer durable especially in emerging market like India needs to be carried out.
3. Literature Review:
Buyer behavior models have postulated the many influences on a consumer ranging from external influence, internal influence and marketing related influences (Howard and Sheth 1969, Kollat and Blackwell 1986). However, consumer behavior is shaped by consumer psychology and consumer characteristics too (Kotler and Keller 2006). When it comes to purchase of durable experts point out that it is often a high involvement decision (Assael 1995). Purchase of durable is determined by several socioeconomic factors. According to Slowikoski and Jarrat (1996) adoption of high technology product in consumer durable could be influenced by traditionalism, fatality and religion.Cross-neutral brands adaptation:Emergence of culture – neutral brands and their positioning strategies have been studied across the world (Erden et al 2006, Alden et al 1999, Aakar and Maheshwaran 1997) Acceptance of such brand is greater in culture with high degree of collectivism and uncertainty avoidance as it signals lower risk information. How religiosity could affect acceptance in consumer durables needs to be studied for cross neutral brand adaptation. Alden et al (1999) mentioned that Global consumer culture positioning (GCCP) needs to be examined in context of country specific cultural issue. This could be affected by religiosity as culture does get affected by religion adaptation and

49SIES Journal of Management, April - August 2010, Vol.7(1)
intensity. Cayle and Arnold (2008) point out that international branding will have to be culturally relative and contextually sensitive. Individual values are transmitted through key media like family religious institutions and school. These along with early lifetime experience shape air values Sheth et al (1999) point out that religious institutions influence customer value both with respect to importance and value of material possessions and goal benefits of the products. Jain (2000) also point out on how religion shapes several aspect of belief in cleanliness, Puritanism etc. Religion in Indian study (Dholakia et al 1978, Saxena 1997, Parameshwran and Srivastava 2008) could affect acceptance of cross-neutral brands and also purchase behavior. However, religiosity with respect to intensity and belief were not studied on consumer purchase behavior.Effect of Religious factor on consumer behavior:Assael (1995) refers to how culture and sacred or secular consumption could affect consumer behavior towards purchase decision. According to Schiffman and Kaunk (1994), consumer behavior does get influenced by family values and religious system. Religion was identified as a composite subculture that formed a part of environmental influence on buying decision. Not much research has been done on religion and consumer behavior (Hirschman 1982). According to same author (1982), consumption process is affected by religion and its affiliation.Effect of religious affiliation on consumer behavior were reported later by Esso and Dibb (2004) Mokhlis (2006), Kalliny and Hansman (2007) but no similar study was
reported in emerging market especially in India. At the same time religious intensity and its impact on consumer behavior towards purchase decision could the missing link. Religious belief could be another area of research which could affect the purchase decision and is not studied in detail. India is going to become one of the biggest markets for consumer durable as the country becomes one of the top five economics in the world. (Nagraj 2000, Sengupta et al 2008) The market for durables will significantly increase for studying this market and how religiosity could affect the consumer purchase behavior in this segment is important. India is a multi religious country. It could be interesting to find out if there are any differences in buyer behavior with respect to durable.
4. Theoretical construct
Consumer durable purchase is a high involved decision making process due to higher investment. It is also influenced by income level of household. We could also see the difference due to consumer religious orientation (Hindu, Muslim, Christian etc.) and intensity (Blind believer rational believer) and also religious belief highly religious and not so religious. Will consumer evaluate durable differently if they belong to different religious faith? For example, will Hindu consumer give more importance to price as compared to Muslim consumer in the same income group? Similarly, to what extent of religious belief or consumer religiosity (intensity) have an influence on consumer’s behavior to wards consumer durable products. For instance, will a more religious consumer give more importance to price compared to a less religious consumer?
A Conceptual Paper, Should Marketers Consider Religiosity in Understanding Consumer Purchase Behavior?

50
Purchase of consumer durable such as automobile or television could consist of many stages of evaluation. Consumer’s decision could be influenced by wife (Srivastava 2010) Price (Assael 1995), Religion (Bijapurkar 2007, Baily and Sood 1993, Delener 1990) Country of origion (Gopal and Srinivasan, 2006), Family Decision (Delener 1994) Brand name and advertising (Esso and Dibb 2004), Technology after sales service, Finance scheme etc, using Religious dimension and Religiousness as one of the key factor in decision the following can be constructed
A • Religious orientation and belief (Hindu, Muslim, Christian) = ro Strong belief in religion orientation = sro Week belief in religion orientation = wro
• Religiousness or Intensity = ri Blind Religiousness = bri Rational Religiousness = rri
Determined by his visit to places of worship, following rituals, religious reading, prayer and belief in god.
B • Purchase criteria affecting the purchase decision = pd Brand name = b Country origin = co Education = c Quality = q Novelty = n Price = p Techn ology = t After sales service = s Finance scheme = fs
C• Purchase Process = Pp Friends = f Role of dealer = rd Advertising = a World of mouth = wm Seasonality = s Income level = i
Religious dimension Purchase criteria Purchase process Comment1. a) Sro < p Price could Play a role Role of Friend Could
influence Purchase decision
High religion person may not be impulsive buyer and price could be important but friend could influence him
Sro < p < f =
Wro # p < f =
Purchase decision- weak religiousness may not be price sensitive but friend could in influence purchase
M.G.Parameshwaran and R.K.Srivastava
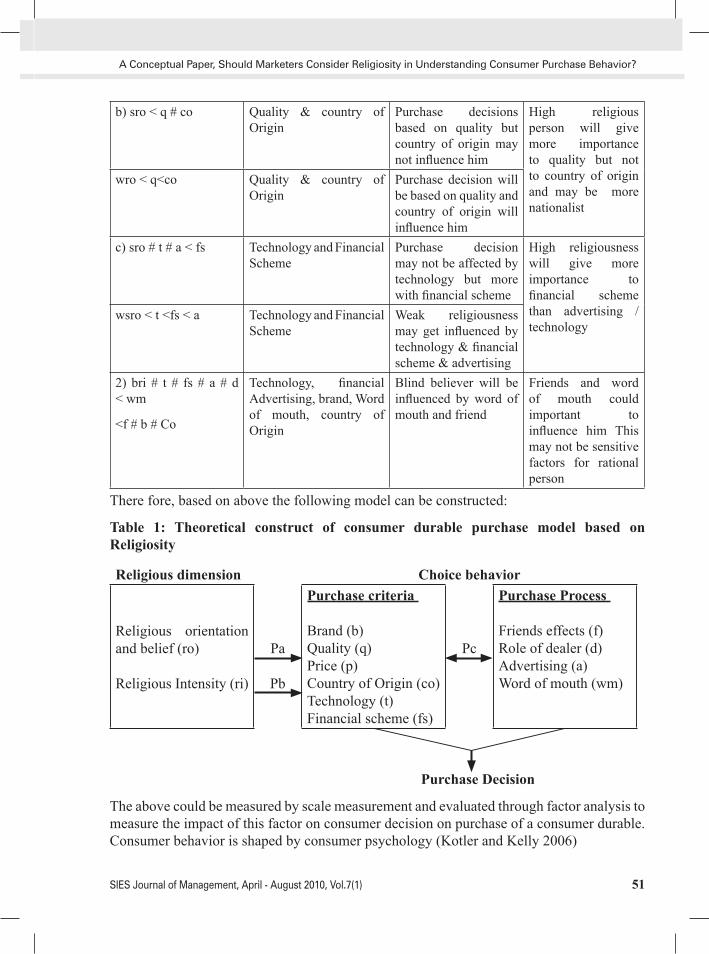
51SIES Journal of Management, April - August 2010, Vol.7(1)
b) sro < q # co Quality & country of Origin
Purchase decisions based on quality but country of origin may not influence him
High religious person will give more importance to quality but not to country of origin and may be more nationalist
wro < q<co Quality & country of Origin
Purchase decision will be based on quality and country of origin will influence him
c) sro # t # a < fs Technology and Financial Scheme
Purchase decision may not be affected by technology but more with financial scheme
High religiousness will give more importance to financial scheme than advertising /technology
wsro < t <fs < a Technology and Financial Scheme
Weak religiousness may get influenced by technology & financial scheme & advertising
2) bri # t # fs # a # d < wm
<f # b # Co
Technology, financial Advertising, brand, Word of mouth, country of Origin
Blind believer will be influenced by word of mouth and friend
Friends and word of mouth could important to influence him This may not be sensitive factors for rational person
There fore, based on above the following model can be constructed:
Table 1: Theoretical construct of consumer durable purchase model based on Religiosity
Religious dimension Choice behavior
Religious orientation and belief (ro)
Religious Intensity (ri)
Pa
Pb
Purchase criteria
Brand (b)Quality (q)Price (p)Country of Origin (co)Technology (t)Financial scheme (fs)
Pc
Purchase Process
Friends effects (f)Role of dealer (d) Advertising (a)Word of mouth (wm)
Purchase Decision
The above could be measured by scale measurement and evaluated through factor analysis to measure the impact of this factor on consumer decision on purchase of a consumer durable. Consumer behavior is shaped by consumer psychology (Kotler and Kelly 2006)
A Conceptual Paper, Should Marketers Consider Religiosity in Understanding Consumer Purchase Behavior?

52
Discussion
Purchase of consumer durable is a high involvement decision (Assael 1995). Therefore, it is a complex decision making process. Given the cost involved, the process of buying a new television set or automobile could take several weeks. It may have several stages with fair amount of dedicated time for evaluation. While external influences like PESTEL and marketing will work on all stage of buying process, their effect on alternative evaluation will be vital. Similarly, internal factors like religious orientation or intensity coupled with brand name, quality, country of origin, technology financial scheme and price could be important variables affecting purchase decision. This could be influenced by extraneous variables like advertisement, friends, world of mouth and dealer. Gerand Wilk (2005) observes that while materialism and concentration of wealth is condemned by all religions some culture do not consider them to be opposite side. They indicate that in eastern culture such as India and China, material and spiritual world are less divided. Gur (2005) at the same time also pointed out that to day, religion is marketed actively though religions are often anti-consumerist in nature. Therefore, impact of religiosity on the consumer purchase behavior can not be ignored, especially with respect to consumer durable. Earlier studies (Sood and Nasu 1995, Mokhlis 2006) did mention the role of religion but not the intensity on purchase behavior.
6. Conclusion
This study is an attempt to link religion and its belief with consumer durable purchase criteria. Religiosity and its intensity could influence the purchase behavior. This needs
to be measured and main factor analysis will throw better information. Similarly, it will be interesting to study consumer purchase behavior in FMCG and service sector and compare the same with consumer durable.
7. Future Research
It is possible to extend this study using scale measurement to measure religious factors. There is no overwhelming opinion on how to measure religiousness (Wilkes et al 1986, De Jong et al 1976) According to De Jong, religiousness can have six dimensions like belief, experience, religious practice, religious knowledge, individual moral consciousness and social consciousness. Allport and Ross (1967) scale measurement study followed by Delener (1990) adoption of the same scale could help to do further research. Other popular measures of religiosity by Worthington could be also useful.
References
Aaker Jennifer L. and Maheshwaran Durairaj (1997), The effect of Cultural Orientation of Persuasion Journal of Consumer Research, vol. 24, Dec, 1997, pp 315-328.
Alden Dana L., Steenkamp Jan-Benedict E. M., and Batra Rajeev (1999), Brand Positioning Through Advertising in Asia< North America and Europe: The Role of Global Consumer culture, Journal of Marketing, vol. 21, 1994, pp. 75-87
Allport G. W. and Ross J. M. (1967), Personal Religious Orientation and Prejudice”, Journal of Personality and Social Psychology, vol. 5
Appadorai Arjun, Modernity at Large; Cultural Dimension of Globalization, Minneapolis, vol.1, University of Minnesota Press, 1996.
M.G.Parameshwaran and R.K.Srivastava

53SIES Journal of Management, April - August 2010, Vol.7(1)
Assael Henry (1995), Consumer Behavior and Marketing Action, 4th edn, Ohio: South Western college Publishing.
Bailey, J. M. and Sood J (1993) “The Effects of Religious Affiliation on consumer Behavior A Preliminary Investigation”, Journal of Managerial Issues, vol.5, no.3, pp.328-352
Bennett Peter D. and Kassarjian Harold H. (1976), Consumer Behavior, N. J.: Prentice-Hall
Bijapurkar Rama (2007), We are like that Only-Understanding the Logic of Consumer India, New Delhi: Penguin Portfolio.
Cayala Julien and Arnould Eric J., (2008), A Cultural Approach to Branding in the Global Marketplace Journal of International Marketing, vol. 16, no.4, pp.88-114
De Jong F. G., Faulkner J. E., Warland R.H. (1976), “Dimension of Religiosity Reconsidered Evidence from a Cross – Cultural Study“, Social Forces, vol. 54, no.4, pp.866-888
de Mooij Marieke (2004), Consumer Behavior and Culture, California: Sage Publications
Delener Nejdet, (1990), “The Effects of Religious Factors on Perceived Risk in Durable Goods Purchase Decisions”, Journal of Consumer Marketing, vol. 7, no.3, pp27-38
Delner. Nejdet (1994), “Religious Contrasts in Consumer Decision Behavior Patterns: Their Dimensions and Marketing Implications”, European Journal of Marketing, vol.28, no.5, pp.36-53
Dholakia Nikhilesh and Firat A. Fuat (2006), Global Business beyond modernity, Critical
Perceptiveness on International Business, vol.2, no.2, pp.147-162
Dholakia Nikhilesh, Khurana Rakesh, Bhandari Labdhi and Jain Abhinandan K., (1978), Marketing Management-Cases and Concepts, New Delhi: Macmillan
Durkheim E. (1976) The Elementary forms of the Religious Life, London: Aleen and Unwin,
Durkheim, Emile (1951): ‘Suicide: ‘A Study in Sociology’, translated by George
Engle J. F., Blackwell R D., Miniard P. W (1993), Consumer Behavior, (Seventh Edition), Florida: The Dryden Press, pp.81.
Erden T, Swait J, Valenzuela A (2006) Brands as Signals: A Cross-country Validation Study, Journal of Marketing, vol70, pp.34-49.
Esso N. and Dibb S. (2004). “Religious Contrasts in consumer Decision Behavior Patterns: Their Dimensions and Marketing Implications”, European Journal of Marketing, vol. 28, no.5, pp.36-53
Gur G (2005), “Religious Material culture: Modernity and Aesthetics”, Special Session Summary, Advances in Consumer Research, vol32, pp.79-81
Hawkins Del I., Best Roger J. and Coney Kenneth A (1998), Consumer Behavior, 7th edn, New York: McGraw Hill.
Hirschman E.C. (1982), “Religious differences in Cognitions Regarding Novelty Seeking and Information Transfer”, Proceedings, Association of Consumer Research, vol10, pp.228-233
Howard John, The Nature of Consumer Behavior, In Readings on Market-Driving Strategies, Gregory S. Carpenter, Rashi
A Conceptual Paper, Should Marketers Consider Religiosity in Understanding Consumer Purchase Behavior?

54
Glazer and Kent Nakaoroto, Massachusettes Reading: Addison-Wesley 1997
Jain Subhash C (2000), Marketing Planning & Strategy, Ohio: Cincinati: South Western College Publishing.
Kotler Philip and Keller Kevin Lane (2006), Marketing Management , 12th edn, New York: Person
Mohkils S. C. (2006), “The Effect of Religiosity on Shopping Orientation-An Exploratory Study in Malaysia”, - The Journal of American Academy of Business, Cambridge, vol.6, no.1, March 2006, pp.64-74.
Nagaraj R., (2000), Indian Economy Since 1990-Virtuous Growth or Polarization, Economic and Political Weekly August 5, 2000, pp.2831-2839
Parameswaran M.G. and Srivastava R. K. (2006), Influence of Religious Factor on Investment Behavior-An Exploratory Study, Synergy-SIMSR Journal January 2008
Saxena Rajan (1997) Marketing Management, New Delhi: Tata McGraw Hill, 1997
Schiffman L.G., Kanuk L.L. (1997), consumer Behavior 5th edn Prentice-Hall of India, pp.646-8
Scott. J. Vitell, Paolillo J.G.P. Singh J.J. (2005), “Religiosity and Consumer Ethics”, Journal of Business Ethics, vol.57, pp.175-181.
Sengupta Arjun, Kannan K. P. and Raveendran G (2008), India’s Common People: Who are they, how many are they and how do they live, Economic and Political Weekly, March 15, 2008
Sheth Jagdish N., Mittal Banwari and
Newman Bruce I. (1999), Customer Behavior –consumer Behavior and Beyond, Florida: The Dryden Press.
Slowikowski Sue and Jarratt Denise G., (1996), The Impact of Culture on Adoption of High Technology Products, Asia Pacific Journal of Marketing and Logistics, 1996, vol.8, no.3, pp.14-31.
Sood James and Yukio Nasu (1995), Religiosity and Nationality-An Explanatory Study of their Effects on consumer Behavior in Japan and United States”, Journal of Business Research, vol.34, pp.1-9
Srinivas M. N., Indian Society through Personal Writings, New Delhi: Oxford University Press, 1998.
Wilkes, Robert E., Burnett John J., Howell Roy D., (1986), Meaning and Measurement of Religiosity in Consumer Research, Academy of Marketing Science, Journal, Green Vale, spring, vol.14, 1551, pp.47-57.
Worthington E.L. Jr. Wade N.G., Plight T.L., McCullough, M.E., Berry J.T., Ripley J.S., Berry J.W. Schimitt M.M. and Bursley K.M., (2003), The Religious Commitment Inventory -10: Development Refinement and Validation of a Brief-scale for Research and counseling, Journal of counseling Psychology, vol. 50, no.1, pp.84-96
M.G.Parameshwaran and R.K.Srivastava

55SIES Journal of Management, April - August 2010, Vol.7(1)
Customer Acceptance of Mobile Banking: A Conceptual Framework
Sindhu Singh, Vivek Srivastava & R.K.SrivastavaSindhu Singh is MCA Professor, SIMSR,University of [email protected] Srivastava is a Senior Software Engineer, Scalable Network Technologies, Los AngelesDr.R.K.Srivastava is Director, SIESCOMS. [email protected]
AbstractThe wireless technology and the large penetration of mobile devices have created tremendous business opportunities via the wireless infrastructure. These opportunities are in terms of communications, transactions, purchasing, trading etc. Mobile commerce involves the delivery of products and services via wireless technologies that enables internet commerce activities, without the restrictions of time and space. Mobile banking is a channel whereby the customer interacts with a bank via a mobile device, such as a mobile phone or personal digital assistant (PDA). There is vast market potential for mobile banking due to its always-on functionality and the option to virtually bank at anytime and anywhere. The market for mobile phones and handheld devices is exploding given the low costs, increasing computational power and ease of use. Even though technology and applications for these services are available, the usage international rates have been low. What factors drive customers to accept new payment solutions or inhibit them from doing so, or how should solution providers manage the penetration of their payment solutions among customers have
Introduction
Advance in wireless technology increases the number of mobile phone users and give pace to the rapid development of commerce transactions conducted with these devices. The wireless technology and the large penetration of mobile devices have created tremendous business opportunities via the wireless infrastructure in terms of communications, transactions, purchasing, trading etc. Introduction of higher data speed and ‘always on’ technology will enable mobile devices to be used to receive, send and access a huge range of information and services in real time.
Mobile phone as a channel provides enormous potential in banking. Today, a mobile phone is an integral part of customers’ lives and a growing number of these devices are also equipped with internet
SIES Journal of Management, April - August 2010, Vol.7(1): 55-64
received surprisingly little attention. The objective of this paper is to explore the major factors which influence the intention to use mobile banking.
Key words: mobile commerce, mobile banking, customer, wireless technology.

56
Sindhu Singh, Vivek Srivastava & R.K.Srivastava
connection (Laukkanen and Lauronen, 2005). Technological development has reshaped the financial services delivery and consumption. Wireless technology and mobile phones have transformed the banking services to mobile devices.
The market for mobile phones and hand-held devices is exploding given to the low costs, increasing computational power, and ease of use. The mobile cellular subscriptions are expected to reach 5 billion worldwide in 2010(ITU, 2010). In India, the mobile penetration is very high and according to the report of International Telecommunication Union, India has 500 million telecom subscribers (ITU, 2009) by the end of December 2009 and the number continues to increase. The mobile banking services are still in its infancy. Even though technology and applications for these services are available, the international rate of usage has been low. The objective of this study is to understand the various factors that drive customers to accept mobile banking services or inhibit them from doing so.
Literature Review
Several definitions of mobile commerce are found in academic literature. MIS, management, and marketing all have various approaches to define as to what exactly constitutes mobile commerce. The mobile-commerce can be defined as delivery of products and services via wireless technologies to enable e-commerce activities at any time or location (Mennecke and Strader, 2001). It can also be defined as the new type of e-commerce transactions, conducted through mobile devices using wireless telecommunications networks
and other wired e-commerce technologies (Siau et al., 2001). Current mobile Internet applications enable customers to gain access a variety of services: Web information search, SMS (short message services), MMS (multimedia message service), banking, payment, gaming, emailing, chat, weather forecast, GPS (Global Positioning Service), etc. Collectively, this wide array of services will be called as mobile commerce( m-commerce) (Okazaki, 2005).Mobile commerce is about buying and selling products and services through wireless handheld telecom devices such as mobile phones and PDAs. The main success factors of mobile commerce are its convenience, ease of use, ubiquity and trust (Xu and Gutiérrez, 2006).
The mobile commerce application is location sensitive, time critical and the application is controlled by the user or network service provider (Balasubramanian et al, 2002).These services can be accessed at anytime and anywhere. The mobile commerce is enabled through different technologies such as networking, embedded systems, database and security (Varshney and Veter, 2002). Mobile hardware, software and wireless technology enable mobile commerce application which can transmit data quickly, locate a user position or conduct business anytime anywhere. Security and privacy are essential elements for the success of mobile commerce and its applications.
Mobile banking is considered to be one of the most value-added and important mobile commerce applications currently available (Lee et al., 2003; Varshney and Veter, 2002). Mobile banking services allow customers to check account balances, transfer funds

57SIES Journal of Management, April - August 2010, Vol.7(1)
Customer Acceptance of Mobile Banking: A Conceptual Framework
between accounts and order for electronic bill payments. The mobile phone especially supports the provision of time-critical information, for example, for trading in stocks or if of acute need for money transfer or request of account balance. The device manufacturers for both mobile devices and handheld devices like PDA and software vendors to enable services are required to create the infrastructure. The key players for mobile financial applications include banks and other financial institutions such as credit card companies, mobile operators and retailers (Mallat et al, 2004). The customer considers banks as outstanding trustful service providers compare to other financial institutions (Mallat and Tuunainen, 2008).
Cost, usability, convenience, security and privacy are the main factors for the success of mobile banking (Herzberg, 2003). Success will ultimately rely on how secure the payment transactions are. The end users must be confident in the financial institution carrying out the transaction, the network operator transmitting the data, the technology used for transaction, and in the retailer itself (Song, 2001).
Mobile Commerce Adoption
Mobile commerce users are not just technology users, they are a part of social network consisting of friends and family members. Their decision to adopt a particular technology will be influenced by an individual’s perceptions, opinions and actions in regard to different objects including service offers. People generally recommend good services and discourage the unfavorable ones.
The adoption research describes and
explains the adoption decision of individual end users applying cognitive and social theories of decision making. Most of the adoption studies are based on these three models which are Theory of Reasoned Action (Ajzen,1980),Theory of Planned Behavior(Ajzen,1991) and Technology Acceptance Model.(Davis,1989).These models are used to explain end users’ adoption and acceptance of different kinds of ICT systems and applications(Venkatesh and Davis,2000).
Most of the information systems (IS) usage and adoption relied on models derived from Theory of Reasoned Action (Ajzen, 1980) and its extensions. This theory specifies that human behavior is preceded by intentions, which are formed based on the individual’s attitude towards the behavior and on perceived subjective norms. In TRA it explains more about behavior rather than about adoption of technology. Attitude refers to an individual’s positive or a negative evaluative effect about performing a particular behavior .Attitude reflects the individual’s feelings of favorableness or un-favorableness towards performing a behavior.
Another model is Theory of planned behavior (Ajzen, 1991), derived from TRA, which also studies the human behavior. This model has also been used to study the adoption pattern of mobile commerce services (Khalifa and Shen, 2008).
The Technology Acceptance Model (TAM) model (Davis, 1989) describes the consumer’s willingness to use technology. The TAM model has five constructs which are perceived ease of use, perceived usefulness, attitude toward use, intention to use and actual use. The traditional

58
adoption models can be used to study the adoption of mobile commerce (Pederson, 2005, Khalifa and Shen, 2008). The factors contributing to the adoption of mobile services in the context of wireless finance are perceived ease of use, perceived usefulness, cost, system quality and social influence (Kleijnen at al, 2004). The user intention to adopt wireless technology has different determinants for different types of tasks like general tasks, gaming tasks and transactional tasks (Fang et al, 2005). In the study of understanding the acceptance of mobile service by individuals it is identified that perceived usefulness, ease of use, credibility, self-efficacy and financial resources have positive influences on behavioral intentions (Wang et al, 2006).
All adoption studies are so far related with technology and service characteristics and its use. The technological characteristics of mobile devices are limited memory, limited user interface and low computing power (Misra and Wickamasinghe, 2004). The service characteristics include limited bandwidth, network connectivity, transactional cost, privacy etc. (Tarasewich and Nickerson, 2002).
Mobile service users are normally customers of a business and pay fees to receive services, in order to continue as customers of the business. There is therefore, a continual interaction between the mobile customer and his/her service provider(s). Such interaction opens the door to a wide range of adoption causes that might not be as crucial for traditional technology adoption. Existing studies found the need to extend the TAM model with behavioral control and it also found the decomposed
TPB to be further modified while explaining the adoption of mobile commerce services (Pederson, 2005).
Construction of Theoretical Model
The theoretical model of all constructs in this study and their proposed relationships is shown in Figure 1.
Figure1: Conceptual model
Perceived Usefulness
Perceived Ease of Use
Subjective norms
Intention to use
Self-Efficacy
Perceived Cost
Security Trust
Existing literature shows Technology Acceptance Model (Davis, 1989) is the predominant model used in information systems to study the adoption pattern. According to TAM model, perceived usefulness and perceived ease of use are the primary drivers of new technology acceptance.
Perceived usefulness is defined by Davis (1989) as “the degree to which a person believes that using a particular system
Sindhu Singh, Vivek Srivastava & R.K.Srivastava

59SIES Journal of Management, April - August 2010, Vol.7(1)
would enhance his or her performance”. In mobile service context perceived usefulness can be how well mobile services can be integrated in to their daily activities. When this belief increases the intention to use these services would increase (Kleijnen et al., 2004).With the help of mobile banking service, a customer can perform the banking operation at anytime and anywhere. If a customer feels this service is beneficial to his personal and business life, it will positively influence him to use this service. The following proposition is formulated based on this construct.
P1: Perceived usefulness will have a positive effect on the intention to use mobile banking.
Perceived ease of use is defined by Davis (1989) as “the degree to which a person believes that using a particular system would be free of effort”. Perceived ease of use is the extent to which a customer believes a system is easy to learn or to use. If the mobile banking service is easy to learn and use, it will positively influence the customer to use the service. In mobile services many factors can increase the complexity such as navigation problems, small screen size, transactional issues etc. The construct perceived ease of use is adapted in this model since it will be valid in the study of customer acceptance of mobile banking. The following proposition is formulated based on this construct.
P2: Perceived ease of use will have a positive effect on the intention to use mobile banking.
The always-on functionality of the mobile phone and the option to bank at anytime
and anywhere makes mobile banking very attractive to the customer. If the service is complex and difficult to learn, the customer will fail to recognize the usefulness of the service. Therefore, it is necessary that mobile banking technology should be simple and easy to understand by the customer. If the service is easier to use and operate, it would enhance the usefulness of the service. The following proposition can be formulated based on the relation between the constructs perceived ease of use and perceived usefulness.
P3: Perceived ease of use will have a positive effect on perceived usefulness.
Most information systems (IS) usage and adoption relies on models derived from Theory of Reasoned Action (TRA) and its extensions (Ajzen, 1980). This theory specifies that human behavior is preceded by intentions, which are formed based on the individual’s attitude towards the behavior and perceived subjective norms. Subjective norms refer to an individual’s perceptions of other people’s opinions on if he or she should perform a particular behavior. Subjective norms capture the individual’s perceptions of the influence of significant others (e.g., family, peers, authority figures, and media). An individual’s decisions and behaviors are not made solely by him/her, but influenced by the opinions, recommendations and suggestions of other important people (friends, colleagues’ family and society). Therefore, this construct is relevant in the study of customer acceptance of mobile banking.
P4: Subjective norms will have a positive effect on the individual’s intention to use mobile banking.
Customer Acceptance of Mobile Banking: A Conceptual Framework

60
According to TPB (Ajzen, 1991) an individual’s behavior can be explained by his/her behavioral intentions that are jointly influenced by attitude, subjective norms and perceived behavioral control. The perceived behavioral control refers to an individual’s perceptions of the presence or absence of required resources, or opportunities necessary for performing behavior. The behavioral control in TPB has two components. The first component specifies the resources required to use a specific system. The second component is self efficacy that is defined as an individual’s self confidence to perform a behavior. In the context of mobile banking, the customer segments that are technology innovative have higher chances to attempt the new service.
P5: The higher self-efficacy will positively influence an individual’s intention to use the mobile banking.
In addition to the traditional constructs taken from TAM, TRA and TPB, it is also essential to consider the effects of financial cost which is incurred during mobile banking transactions. In mobile commerce context the cost has been found to be an important factor for the adoption of m-commerce (Khalifa and Shen, 2008; Wang et al, 2006). The cost incurred includes equipment cost, subscription charges and transactional cost that make mobile commerce costlier than e-commerce.
P6: The financial cost incurred has a negative effect on the intention to use mobile banking.
TAM’s fundamental constructs do not fully reflect the influence of technology and usage factors especially in the context of
mobile services. Prior studies have extended this model by adding the constructs such as trust (Gefen et al, 2003; Pavlou, 2003) and perceived consequence (Khalifa and Shen, 2008).Trust is an important factor in the adoption of mobile services (Lee, 2005). This type of application has to solve problems like hostility, information security, and vulnerability. Since we cannot assume that all participants in mobile commerce are honest, the mobile commerce system should provide enough mediated and stored information so that dishonest merchants, customers or other players can be found later. In financial transactions, each party involved needs to authenticate its counterparts. There are chances of losing data during the transaction due to mobile device malfunctions, connectivity problems (Siau et al., 2001). The success of mobile commerce application depends on customers trust, for this technology trust and vendor trust is equally important in securing customer trust (Siau and Shen, 2002).Hence, the following proposition can be formulated by this construct.
P7: Customers trust will positively influence the intention to use mobile banking.
Security is an important element which is to be considered while carrying out mobile commerce applications. The major security factors which are required for the successful mobile financial transaction are identified as confidentiality, authentication, integrity, authorization and non-repudiation (Pousttchi and Wiedemann, 2003; Varshney, 2003). Two broad types of security challenges the mobile device can account are content and channel security (Misra and Wickamasinghe, 2004). The wireless (mobile) security can
Sindhu Singh, Vivek Srivastava & R.K.Srivastava

61SIES Journal of Management, April - August 2010, Vol.7(1)
be categorized as mobile payment enabling application security, network Security and device security (Song, 2001).User privacy has to be protected in mobile commerce applications because these applications are able to identify the user locations(Tarasewich et al,2002). Existing literature shows the importance of security required in mobile services, so the following proposition can be derived.
P8: Secured transactions have a positive effect on the intention to use mobile banking.
Linking more mobile communication networks together into a global meta-network will make security and trust relationships a key issue for the success of mobile commerce (Hampe and Swatman, 2000). Trust is enhanced by the security mechanisms provided in the mobile banking services. Customers are more likely to trust the new service if adequate security is provided to their transactional data.
P9: Secured mobile transactions enhance customer trust.
Secure mobile transaction could lead to improvement in customers trust. Customer value perceptions in banking actions differ between internet and mobile channels. It is possible that efficiency, convenience and safety could improve customer value perceptions between internet and mobile banking
Conclusion
The mobile penetration is very high and it is having the advantage of always on and anytime functionality. In mobile banking, the customer requires only the mobile
device to perform the banking operations. Even though the technology and service is available for mobile banking, it has not captured the general public’s attention. Technological development in the mobile sector and improved displays of the devices are likely to change the situation and improve mobile service usage. This research enables banks to know the key drivers influencing mobile banking usage intention and, therefore, what aspects to highlight to increase the usage. The model presented in this paper will be useful to understand the customer perspective of mobile banking. There is a vast potential for mobile banking growth in India’s urban and rural markets. The current low adoption of mobile banking among the urban population is due to the alternative modes of banking options available like ATM, online banking etc. The security challenges are the biggest concern in the current scenario about mobile banking. The availability of alternate channels is fewer in rural India compare to the urban India. The mobile phone usage is good in rural India so banks can easily reach to rural population with the help of mobile banking.
Scope for Further Research
Mobile Commerce and its services are in its emerging stage. Further theoretical and empirical development is required to understand the usage intentions. Searching for additional variables is also important because they may have an impact on customers’ usage intentions. The variables may vary for different mobile services such as content download that do not involve any monetary transactions. Future research can also investigate the characteristics between
Customer Acceptance of Mobile Banking: A Conceptual Framework

62
adopters and non-adopters of mobile services. Further studies are also required to understand the barriers that prevent customers from using mobile services.
References:
Ajzen I.(1991),The theory of Planned Behaviour, Organization Behaviour and Human Decision Processes, 50(2), pp.79-211.
Ajzen I, Fishbein, M. (1980), Understanding attitudes and predicting social behavior, Englewood Cliffs, NJ: Prentice-Hall.
AlHinai Salim Yousuf, Kurnia Sherah, Johnston B.Robert(2007), A Literature analysis on the Adoption of Mobile Commerce Services by Individuals, Proceedings of the 13th Asia Pacific Management Conference, Melbourne, Australia, pp.222-230.
Balasubramanian Sridhar, Robert A Peterson, Sirkka L Jarvenpaa (2002), Exploring the implications of m-commerce for markets and marketing, Academy of Marketing Science. Journal; ABI/INFORM Global pg. 348.
Coursaris, Hassanein (2002), Understanding M-Commerce, Quarterly Journal of Electronic Commerce, Vol.3/No.3 pp. 247-271 ISSN 1528-3526.
Constantiou D. Ionna, Damsgaard Jan, and Knutsen Lars (2007), The four incremental Steps toward Advanced Mobile Service Adoption, Communications of the ACM, Vol.50.
Davis Fred D (1989), Perceived Usefulness, perceived ease of use and user acceptance of information technology, MIS Quarterly, pp 318-339.
Fang Xiaowen, Susy Chan, Jacek Brezezinsky, Shuang Xu (2006), Moderating Effects of Task Type on Wireless Technology Acceptance, Journal of Management Information Systems, Vol.22, No.3, pp.123-157.
Gefen David, Elena Karahana, Detmar W. Straub (2003), Trust and TAM in Online Shopping: An integrated Model, MIS Quarterly, Vol.27 No.1. pp. 51-90.
Hampe J. Felix, Swatman Paula M.C. (2000), Mobile Electronic Commerce: Reinter mediation in the Payment System, Electronic Commerce: The End of the Beginning 13th International Bled Electronic Commerce Conference Bled, Slovenia, June 19th-21st.
Herzberg Amir (2003), Payments and banking with Mobile Personal Devices, Communications of The ACM Vol. 46. No. 5.
ITU (2009), International Telecommunication Union Report, online at: http://www.businessmonitor.com/telecommunications/india.html (accessed 16 Feb 2010).
I T U ( 2 0 1 0 ) , I n t e r n a t i o n a l Telecommunication Union Press Release , online at:
http://www.itu.int/net/pressoffice/press_releases/2010/06.aspx (accessed 23 Feb 2010).
Khalifa Mohamed, Shen Ning Kathy (2008), Drivers for Transactional B2C M-Commerce Adoption: Extended Theory of Planned Behavior, Journal of Computer Information Systems.
Sindhu Singh, Vivek Srivastava & R.K.Srivastava

63SIES Journal of Management, April - August 2010, Vol.7(1)
Kleijnen Mirella, Wetzels Martin, Ko de Ruyter (2004), Consumer acceptance of wireless finance, Journal of Financial Services Marketing; 8, 3; ABI/INFORM Global pp. 206.
Laukkanen T., Lauronen J. (2005), Consumer value creation in mobile banking services, International Journal of Mobile Communications, Vol.3 N0.4, pp. 325-38
Lee, M.S.Y., McGoldrick, P.F., Keeling, K.A., Doherty, J. (2003), Using ZMET to explore barriers to the adoption of 3G mobile banking services, International Journal of Retail & Distribution Management 31 (6), pp.340-348.
Lee ThaeMin (2005), The Impact of Perceptions of Interactivity on Customer Trust and Transaction Intentions in Mobile Commerce, Journal of Electronic Commerce Research, VOL. 6, NO.3.
Mallat, Rossi, Kristina (2004), Mobile Banking Services, Communications of The ACM, Vol. 47. No. 5.
Mallat, Tuunainen (2008), Exploring Merchant Adoption of Mobile Payment Systems, e-Service Journal Volume 6 Issue 2.
Mennecke B. E, T. Strader (2001), “Where in the World does Location Matter? A Framework for Location Based Services in M-Commerce,” In Proceedings of the 7th Annual America’s Conference on Information Systems.
Misra K. Santosh, Wickamasinghe Nilmini (2004), Security of a Mobile Transaction: A Trust Model, Electronic Commerce Research; 4, 4; ABI/INFORM Global. pp. 359.
Okazaki Shintaro (2005), New Perspectives on M-Commerce Research, Journal of Electronic Commerce Research, VOL. 6, NO.3.
Paul A. Pavlou (2003), Consumer Acceptance of Electronic Commerce: Integrating Trust and Risk with the Technology Acceptance Model, International Journal of Electronic Commerce, Vol. 7, No. 3, pp. l0l-134.
Pederson (2005), An Exploratory study of mobile commerce service adoption, Journal of Organizational Computing and Electronic Commerce, 15(2), 203-222.
Pousttchi K., Wiedemann D.G(2003),Acceptance of Mobile Payment Procedures in Germany, Proceedings of the 3rd workshop Mobile Commerce, Augsburg, Germany.
Pederson Per E (2005), Adoption of Mobile Internet Services: An Exploratory Study of Mobile Commerce Early Adopters, Journal of Organizational Computing and Electronic Commerce 15(2), pp.203-222.
Sadeh N. (2002), M-commerce: Technologies, services, and business models, New York: John Wiley & Sons.
Siau Keng, Lim Ee-Peng, Shen Zixing (2001), Mobile commerce: Promises, challenges, and research agenda, Journal of Database Management; 12, 3; ABI/INFORM Global pg. 4.
Siau K., Shen Z (2002) Mobile commerce applications in supply chain management, Journal of Internet Commerce, 1(3), pp.3-14.
Song Jiang Xing (2001), Mobile Payment and Security, Article in T-110.501, Seminar
Customer Acceptance of Mobile Banking: A Conceptual Framework

64
on Network Security, ISBN 951-22-5807¬, Publications in Telecommunications Software and Multimedia, TML-C7 ISSN 1455-9749.
Tarasewich P, Nickerson R.C., Warkentin M. (2002), Issues in Mobile E- Commerce, Communications of the Association for Information Systems (Volume 8) pp.41-64.
Varshney U. Vetter R. (2002), Mobile commerce: Framework, Applications and networking support, Mobile Networks and Applications, 7(3), pp.185–198.
Varshney Upkar (2003), Mobile and Wireless Information Systems: Applications, Networks, and Research Problems, Communications of the Association for Information Systems: Vol. 12, Article 11.
Viswanath Venkatesh, Fred D.Davis (2000), A Theoretical Extension of the Technology Acceptance Model: Four Longitudinal Field Studies, Management Science/ Vol.46, No.2, pp.186-204.
Vyas Amit, Grady O’ Peter (2001), A Review of Mobile Commerce Technologies, Department of Industrial Engineering, University of Iowa.
Wang Yi-Shun, Hsin-Hui Lin, Pin Luarn (2006), Predicting consumer intention to use mobile service. Information Systems Journal, 16, 157–179.
Xu Gordon, Gutierrez A. Jairo (2006), An Exploratory Study of Killer Applications and Critical Success Factors in M-Commerce, Journal of Electronic Commerce in Organizations, 4(3), pp.63-79.
Sindhu Singh, Vivek Srivastava & R.K.Srivastava

65SIES Journal of Management, April - August 2010, Vol.7(1)
SIES Journal of Management, April - August 2010, Vol.7(1): 65-96
Aesthetics in Pharmaceutical OTC Marketing
Aarti T. More and R.K.SrivastavaAarti T. More is a Lecturer at M.E.T.Institute of [email protected] is Director SIESCOMS.
1. Introduction
OTC Medicines means medicines legally allowed to be sold “Over the Counter”, i.e. without the prescription of a Registered Medical Practitioner. In India, though the phrase has no legal recognition, all the medicines that are not included in the list of ‘prescription only medicines’ are considered as non-prescription medicines (or OTC Medicines).Pharmaceutical over the counter products (OTC) are the medicines which can be sold without prescription of the physician. They are also termed as “Non Prescription Medicines”. Over the counter medicines are primarily used to treat the conditions that do not require the direct supervision of a doctor and proves to be reasonably safe and well tolerated. To simplify, any medicine that can be sold over the counter for symptomatic relief of minor or self limiting ailments without the prescription of a registered medical practioner is an OTC Medicine.OTC Medicines differ from Prescription Medicines in terms of Margin of Safety, Advertising and Distribution.Electronic Banking Definition
AbstractOver the counter medicines are primarily used to treat the conditions that do not require the direct supervision of a doctor and proves to be reasonably safe and well tolerated. The consumers are changing world over. Today they are more informed. Consumers undergo a sensory experience every time; they self-administer a drug, whether it’s swallowing a tablet or a capsule, chewing a tablet, swallowing a liquid, or applying a cream or ointment. This paper studies the aspects of aesthetics and its effect on OTC marketing.

66
Aarti T. More and R.K.Srivastava
1.2 The OTC Market
Currently the Indian OTC market (i.e. advertised non-prescription medicines) is estimated to represent approximately USD 1,793 million (euro 1 310 million).
The market for OTC (over-the-counter) pharmaceuticals showed modest growth in 2008 and 2009, and taking into account the effects of inflation, the value of the market actually declined at some points during the past 5 years. Key Note estimates that the total market was worth £2.35bn at retail selling prices in 2009, having increased in value by 10.2% since 2005. The market is robust and although intrinsic growth remains low year-on-year, it is bolstered by consistent consumer demand, as well as strong brand loyalty for popular OTC remedies.
Table No. 1 Main self-medication product groups
In USD Millions at Manufacturer Price level 2005 2006 2007 2008 2009 CAGR%OTC Sales - India 1243.4 1371.4 1491.0 1638.9 1813.4 9.9%Analgesics 178.8 192.9 201.7 223.4 258.6 9.7%Cough, Cold & Allergy 227.2 250.7 269.7 295.1 318.1 8.8%Gastrointestinal 231.4 256.7 281.0 301.2 332.6 9.5%Vitamins, Minerals & Supplements 447.1 494.3 538.6 583.0 634.5 9.1%Dermatological 144.1 160.3 181.9 212.4 236.5 13.2%Lifestyle OTC’s 14.8 16.4 18.1 23.9 33.1 22.3%
Source: Nicholas Hall & Company, India, DB6 2009 – 1US$=INR 46.54
In fact, consumer enthusiasm for well-known, time-honored brands, such as Nurofen, Panadol and Strepsils, among others, has strengthened over the review period (2005 to 2009). Despite low value growth in the market as a whole, the pharmaceutical companies that manufacture these powerful brands reaped the rewards of innovation in 2008, achieving strong sales for products that have extended existing ranges. Moreover, globally, companies such as Johnson & Johnson and GlaxoSmithKline are seeking to extend the reach of their brands to developing markets in areas such as India, the People’s Republic of China (PRC) and Central America.
The OTC companies profiled in Asia Pacific’s Leading OTC Medicine Markets are, Australia (Novartis, Roche, Sigma Pharmaceuticals, Herron Pharmaceuticals),China (GlaxoSmithKline, Merck & Co, Bayer, Hubei Biocause Heilen Pharmaceutical, Shijiazhuang Pharmaceutical), Hong Kong (Visa Laboratories, GlaxoSmithKline), India (Pfizer, GlaxoSmithKline, Novartis, Sanofi-Aventis), Indonesia (Novartis, GlaxoSmithKline, Bayer, PT Kalbe Pharma), Japan Novartis, GlaxoSmithKline, Eisai), Malaysia (GlaxoSmithKline, Novartis, Bumimedic, Chemical Company of Malaysia, Kotra Pharma, YSP Southeast Holding), Pakistan (Novartis, Wyeth), Philippines (GlaxoSmithKline, Pfizer, Novartis, Bristol-Myers Squibb, Wyeth, Unilab, Pascual Laboratories), Singapore (GlaxoSmithKline, Haw Par Corporation Ltd) , South Korea (Dong-A, Yuhan Corporation, Daewoong Pharmaceutical, Bukwang Pharmaceutical Company),

67SIES Journal of Management, April - August 2010, Vol.7(1)
Aesthetics in Pharmaceutical OTC Marketing
Taiwan (GlaxoSmithKline, Novartis), Thailand (Pfizer, GlaxoSmithKline, Novartis, Government Pharmaceuticals Organisation) , Vietnam (Vietnam OPV Pharmaceutical Co).
OTC Healthcare Sales Boosted by Growing Indian Economy:Sales of OTC healthcare products remained buoyant in 2008, driven by a growing Indian economy that led to rising disposable incomes. While growth was led mainly by urban consumers, those in rural areas were not too far behind. Rural consumers increased consumption of analgesics, cough, cold and allergy remedies, while urban consumers purchased more digestive remedies and medicated skin care products. The expansion of distribution networks also led to increased penetration of OTC healthcare products.
Changing lifestyles key to growth of OTC Products:Due to rapid urbanization and more hectic lifestyles there is rise in stress levels and unhealthy eating. Headaches, body aches and digestive ailments, such as constipation and diarrhea increased. Increased pollution in urban areas also gave rise to allergy attacks and skin care problems, such as fungal infections and rashes. This led to rising sales of medicated skin care products and cough, cold and allergy remedies.
Strong growth Expected over Forecast Period:The forecast period is expected to witness strong growth rates in constant value terms. The rising disposable incomes of consumers in rural and urban India is set to increase demand for OTC healthcare
products. While all sectors are expected to perform well, more mature sectors, such as analgesics and digestive remedies, will grow more slowly than medicated skin care, eye care and adult mouth care. Growth in cough, cold and allergy remedies is likely to be strong, due to the effects of pollution and colder winters.
1.3 Advertising of OTC Products
The Drug & Magic Remedies (Objectionable Advertisement) Act mentions a list of ailments for which no advertising is permitted. It also prohibits misleading advertisements which, directly or indirectly, gives false impressions regarding the true character of the drug, make false claims, or are otherwise false or misleading in any particular respect. The DCGI’s office -in collaboration with the Organization of Pharmaceutical Producers of India (OPPI) - has released a Voluntary Code on OTC Advertising which is being followed by all OPPI member companies. There is also an OPPI Code of Pharmaceutical Marketing Practices, January 2007, based on the IFPMA code.Currently, there is no specific law which prohibits the advertising of prescription drugs although industry practice is not to advertise prescription-only drugs. The DCGI’s office is considering coming out with a notification prohibiting the advertising of any drug which legally requires a doctor’s prescription for its supply.The following OTC medicines advertising can be seen on TV in India:Digestives, Antacids, Antiflatulents, Cold rubs and analgesic balms/creams, Vitamins/tonics/health supplements (especially herbals

68
and Ayurvedic-registered), medicated skin treatment, Analgesic /cold tablets, Antiseptic creams/liquids, Glucose powders, Cough liquids, Throat lozenges, Medicated dressings (band-aids), Baby gripe water.
1.4 Promotion and Positioning of pharmaceutical OTC Products in India
The consumers are changing world over. Today they are more informed. Changing lifestyle, less exercise, consuming Junk Food and Addictive Products to stay awake on the job for longer hours and eating on the Run put more stress on the body which get expressed in the form of psychomatic disorders like frequent headache, allergy, common cold, constipation, backache, acidity, chronic fatigue etc which they are trying to manage with these over the counter medicines. Customers request these OTC Medicines or Pharmacists recommend them- This goes for purchase of medicines at the Drug Store. These preparations are often located on the shelves of drug store like any other packaged product. Thus, customers have choice of selecting the OTC medicines from the counter of drug store or from shelves of supermarket. In many countries, number of OTC medicines are available in establishments without a pharmacy, such as general stores, supermarkets etc. Historically, the “positioning” of a pharmaceutical product was a fairly simple one-shot deal. Approximately 12 to 18 months before the introduction of a new product, a team involving product management, the advertising agency, and the marketing research specialists would decide what aspects of a product were most likely to be perceived positively by
the consumers. They framed these claims as a concept statements and used as the integrating theme for the product launch and subsequent communications. Traditionally, product attributes like medical claims of better efficacy, longer lasting effects, milder side effects or faster onset of action were used to position the OTC product in the market. But, today markets are becoming competitive and it has become important to provide “a reason for being” to each brand. No doubt, the traditional positioning worked for years but it focused only on what the medicine did and didn’t took in to consideration the emotional relationship of product with the consumers.Blending facts and feelings is one of the most challenging, creative, and rewarding aspects of product positioning. However, positioning now needs to be changed it has become important to produce an aesthetically elegant as well as pharmaceutical effective product. Positioning has more to do with consumer’s attitudes towards a product than with the product itself. How target customers think and feel about a product will determine their behavior-what they buy and consume, and ultimately the kind of market share the brand wins. Because positioning drives strategy and helps determine what communications materials are created, it is central to the success of the brand. Positioning couples the understanding of the market place (including customers and customer segments) with the appreciation of the product (including its competitors) and guides the development of the marketing message. Pharmaceutical marketers need to focus on product positioning earlier in the clinical development stages. For OTC products facing established competitors, early research might suggest
Aarti T. More and R.K.Srivastava

69SIES Journal of Management, April - August 2010, Vol.7(1)
a non intrinsic product enhancement as a competitive advantage.Now, as there are more educated, mature, better informed and more health conscious consumers who take interest in health promoting products, the manufacturer or supplier can no longer rely solely on the promised effectiveness and usefulness of a product. Better trade-off can be ensured between therapeutic benefits and possibly unpleasant sensory experiences. Understanding the attitudes, feelings and behaviors of the consumers may help the marketers to create a new positioning story. Another key consideration in a pharmaceutical OTC product’s positioning strategy is its potential to create buzz in the market place. Pharmaceutical Marketers are now grasping these opportunities for creating brand for their products as far as over the counter products are concerned. This research study investigates consumer’s perception for product color, shape & packaging while buying an OTC product. It also evaluates these factors for studying its role in positioning of an OTC product.
1.5 Importance of Aesthetics in Pharmaceutical OTC products
The original word “aesthetika” meant “that which is perceptible through the senses”. The aesthetic experience involves attending to, perceiving and appreciating an object with regard to whatever utilitarian function it might perform.There is a Myth that “as long as the patient trusts the doctor and the pharmacist, he or she can swallow even the bitterest and ugliest pill”. But it is often a misconception.Consumers undergo a sensory experience
every time; they self-administer a drug, whether it’s swallowing a tablet or a capsule, chewing a tablet, swallowing a liquid, or applying a cream or ointment. It is a ritual involving perceptions and can powerfully affect a patient’s view of treatment effectiveness (Worthington, 2007) It is possible to ensure that all the sensory elements of this therapy regimen, work together to create positive perceptions that complement the medical attributes. The aesthetic aspects of a product are a potential source of pleasure for the consumer (Holbrook & Zirlin, 1985). As a result, the influence of aesthetics is increasingly being acknowledged as an important part of new product development (Whitney, 1988), marketing strategy (Kotler & Rath, 1984). Aesthetic attribute can be defined as, the outward appearance of the product, feeling of comfort (ergonomics), utility, style, and the like (Yashimura et al, 2001) as well as factors such as shape, dimensions, propositions, color and finish of the product. The products’ aesthetic appeal can be built on emotional connection with the product. This can have a dramatic effect on patients’ compliance and can increase brand loyalty. Thus, color, shape, taste are involved in the positioning of pharmaceutical OTC products and enhancing its aesthetic appeal. When one has a headache, one is not going to choke on a big thick capsule or a tablet if there is a sweet good-looking pill that melts on the tongue and one that works just as well (Goldman, 2005). Apart from the visual sense, aesthetics is also linked to other sensory perceptions, which needs to be considered. Aesthetics of a product is an indicator of the product quality, and a customer perceives the quality of the product
Aesthetics in Pharmaceutical OTC Marketing

70
as good based on the external appearance of the product. When all other variables are similar, aesthetic elements can make a difference to a product’s performance in the market place and, therefore, can provide that competitive edge. Aesthetics provides opportunities to appeal to customers through a variety of sensory experiences and thereby creating customer satisfaction and loyalty.Yet, surprisingly little attention is paid to the sensory attributes of a vast majority of dosage forms in pharmaceutical industry.Unfortunately, drug product’s aesthetic characteristics are not fully considered and utilized by many companies.This often leads to the launch of medicines unacceptable to many patients/consumers, despite their medical benefits. When medication compliance is compromised, health outcomes suffer and medicines fail to realize their sales potential.When all other variables are similar, aesthetic elements can make a difference to a products performance in the market place and, therefore, can provide the competitive edge. Therefore products have to stand out in the crowd. The response to drug treatment is not simply a reflection of its chemical compounds. Extraneous factors may considerably influence the size of a treatment effect (Kleijnen J, 1994). External appearance has become a key selling concept.This study aims to understand the influence of Aesthetic attributes like Color, Shape, Packaging and taste on promotion and positioning of pharmaceutical OTC product. It attempts to understand the aesthetics in terms from the point of view
of consumers and the role it plays or can play in the purchase behavior of the OTC products selected.
1.6 The OTC Product’s Sensory Experience
In the pharmaceutical industry, formulations are usually characterized by three major features: Physical characteristics, such as size, hardness, friability; chemical aspects, such as content and stability of drugs; and sensory attributes, including color, taste and odor. Among these three, the sensory characteristics are the ones consumers initially recognize. Consumers have little difficulty telling whether they like or dislike a product, or which product they prefer. However, their ability to reliably describe the reason for their likes, dislikes and preferences and more importantly to offer meaningful suggestions for improvement is notoriously poor. In the Pharma industry where sensory analysis is not a core competency, it’s not surprising to find formulators using a “trial and error” approach to develop palatable formulations. Medicine does not have to taste good to work! Doctors and pharmacists have long held on to this belief. A large percentage of the medicine that doctors prescribe is never taken - and this is not just because of the medicine’s unwanted side effects. Patients have been refusing to take essential medicines because they tasted bad, were hard to swallow, or packaging was hard to open. As long as the doctors continued to prescribe the drugs, this was a problem that did not affect the producers of prescription medicines. It could often be some time before the doctor might notice the drug’s lack of effect on the patient and begin to
Aarti T. More and R.K.Srivastava

71SIES Journal of Management, April - August 2010, Vol.7(1)
doubt the usefulness of the medicament. After all, the patient seldom admits to not having taken the medicine as prescribed. With over-the-counter medicine, it is a different situation altogether. Just as with supermarket food-stuffs, a consumer will not repeatedly buy cough lozenges or water-soluble calcium-carbonate tablets that taste bad. In this case the pharmacist’s most sincere recommendations will often be ignored. In the case of over the counter preparations and food supplements sold in the supermarket, where consumer choice is no longer influenced by the advice of an authority in the field, the product with the most acceptable sensory properties will usually win out.The unique selling proposition of prescription products can be - “effective,” “mild side effects,” “fast acting” and “long lasting.” Contrast to this for OTC products it comes down to “great taste,” “refreshing,” “satisfying,” and “convenient.”Consumer packaged goods companies have developed scientific processes, methods, and tools for creating products that can be differentiated based on customer-perceived sensory quality. This sensory-directed approach will represent a potential “best practice” for pharmaceutical companies faced with overcoming the challenge of reducing the bitterness of medicine. Thus, it is suggested that, following the product introduction in the market, companies should use sensory analysis to ensure product consistency. As a part of the quality management program, such analysis may include monitoring the sensory quality of each batch of finished product before release
in the market to ensure that, the product meets the established specifications of sensory elements. Companies should also conduct periodic sensory benchmarking of marketed products to identify competitive threats. A product’s appearance and physical characteristics while it is masticated are important to the overall sensory experience. The textural attributes of the dosage form can have a dramatic effect on patient acceptability. In order to develop patient acceptable drug products, all aspects of the sensory experience need to be considered. Get any one of them wrong and palatability suffers- along with patient dosing compliance, health outcomes and product sales. Thus, optimizing the sensory experience of OTC products needs to be top priority for Pharmaceutical OTC companies. Sensory-directed formulation development can drastically improve a product’s acceptance.
1.7 Influence of Color in the over-the-counter (OTC) Medicine Market:
Historically, Color has always been used to fulfill Symbolic & Aesthetic functions. Color fulfills a role in representing cosmic, ethical, & religious symbols (Birren 1978) – The symbolism of color influences color preference. It is proven fact that physical changes take place when individuals are exposed to certain colors. Because colors have the power to stimulate, excite, or even depress. A number of variables affect color preferences, including gender, age, religion, mood etc. In addition, numerous personality traits have been associated with color, -for example, it has been suggested that extroverts prefer warm colors while introverts are
Aesthetics in Pharmaceutical OTC Marketing

72
more attracted to cold colors. Color knows no bounds- it is fluid, not static, it intermingles in unexpected combinations, and it explores many paths to achieve its goal. The color actually influences mood. Based on the colors selected, it either comes across as vibrant, relaxing, or depressing. The feelings are evoked when seeing a particular color. Color studies are eclectic and wide ranging in character. Having a good understanding of color and the way it affects the mood of the person seeing it can definitely influence business (Marie-Christine Lichtle 2007), Colors exercise powerful effects and induce reactions based on both instincts and associations. It induces moods and emotions, influences consumer’s perceptions and behavior and helps companies position or differentiate from the competition. Inappropriate choice of products color or package colors may lead to strategic failure (Ricks, 1983). Color is a vital part of products, services, packages, logos and displays. It is a potent cue for product and brand differentiation (Schmitt and Pan, 1994) and for creating and sustaining corporate identities (Garber et al., 2000; Madden et al.,) and consumer perceptions (Grossman and Wisenblit, 1999). Colors alter the meanings of the objects or situations with which they are associated and color preferences can predict consumer’s behavior. (Aslam, 2006). Cultural values, marketing objectives and desired customer relationship levels influence the choice of color in corporate and marketing communications. OTC products are identified by the product attributes that “position” the product in the market and distinguish competing products from each other.
Color can be influential factor for purchase. Thus, color is involved in positioning.
Table –4: The cross-cultural spectrum of meanings and associations of color in
Country-Culture clusterColor A n g l o -
SaxonGermanic Latin Nordic Slavic Chinese Japanese Korean ASEAN
White PurityHappiness
- - - - DeathMourning
DeathMourning
DeathMourning
DeathMourning
Blue H i g h quality CorporateMasculine
WarmFeminine-
---
ColdMasculine-
---
High qualityTrustworthy-
High qualityTrustworthy-
High qualityTrustworthy-
ColdEvil(Malaysia)
Green EnvyGood taste-
---
Envy--
---
---
PureReliable
LoveHappy-
PureAdventure-
DangerDisease(Malaysia)
Yellow HappyJealousy--
EnvyJealousy--
Envy Infidelity --
----
Envy---
PureGood tasteRoyalAuthority
EnvyGood taste--
HappinessGood taste--
----
Red MasculineLoveLustFearAnger
FearAngerJealousy--
Masculine----
-Positive---
-FearAngerJealousy-
LoveHappinessLucky--
LoveAngerJealousy--
LoveAdventureGoods taste--
LoveAdventure---
Aarti T. More and R.K.Srivastava

73SIES Journal of Management, April - August 2010, Vol.7(1)
Purple AuthorityPower-
---
---
---
AngerEnvyJealousy
ExpensiveLove-
ExpensiveSinFear
ExpensiveLove-
---
Black ExpensiveFearGrief
FearAngerGrief
FearAngerGrief
---
FearAnger-
ExpensivePowerful-
ExpensivePowerful-
ExpensivePowerful-
Mourning Powerful-
(Hupka8 et al., 1997), Grossman and Wisenblit, 1999), Ricks (1998), Jacobs et al. (1991), Schmitt (1995), Schiffman et al. (2001) and Neal et al. (2002) and More and Srivastava (2006). The absence of any concrete reported research findings for particular cultural clusters is denoted by dashes. According Mapelli and Behrmann (1977) color may play a greater role in implicit recognition. Choungourin (1968) showed that color preferences are not identical across countries. He found that red was the most preferred color by Americans, green by the Lebanese and blue-green by Iranians and Kuwaitis. Jacobs et al. (1991) found red to be most strongly related to China, purple to France, green to both France and Italy and, while the American subjects associated the USA with blue, other Asian subjects related her with red. Similarly, orange is the favorite color in The Netherlands, since her monarchy is the House of Orange.Color combinations or specifically colored packaging are often used in highlighting the country of origin of products in foreign markets. Madden et al. (2000) found that colors are paired with other colors of consistent or complementary meanings. Green was paired with yellow in Canada and China, with blue in Colombia, with white in Austria and also with red in China. Cultures differ in their aesthetic expressions as colors represent different meanings and aesthetic appeals in different cultures. There are color associations with festivals, holidays and consumer rituals. The marketing data support the premise that color is related in purchasing decision. This study discusses the power of color in the over-the-counter (OTC) drug market by introducing the concept of using color as a vital tool in creating a memorable product brand. Color can have a powerful impact on the purchase decisions of consumers and can positively affect sales and establish long-term customer loyalty. By communicating a product’s most believable and desirable attributes through color, customers are likely to purchase the product. A smart color can give a product a better visual impact and separate itself from the competition. There are three reasons companies should consider color as an option: contemporary appeal, greater visual impact, & brand reinforcement or upgrade. : Charlene Rashkow (2004). Color is useful in creating a different value from the environment or the competition. According to Lichte (2007) color component may affect the emotions felt by an individual. Therefore, color is an integral part of product, service, packaging, and logo and can be an effective means of creating and sustaining brand image in the customer’s mind (Madden et. al. 2000) Color, is one of the many marketing tools that global managers use to create brand images in the customer’s mind. Colors are known to posses’ emotional and psychological properties (Madden et al 2000). Color ranks among the top three consideration along with price and quality
Aesthetics in Pharmaceutical OTC Marketing

74
( Cooper, 1994) According to Madden et al (2000) Red color means excitement, Orange signifies disturbed mind, Blue indicates tender and smooth, Purple means dignified mood and Yellow is a cheerful color, with Black being used for powerful symbolism. Same author says that Yellow and Blue are happy color Thus the role of color helps in memory performance in implicit or explicit ways (Vernon and Lloyd-Jones 2003) Color red is perceived as implying a high level of hazard followed by colors such as orange and yellow rather than blue and green; with white implying the least hazard (Chapan 1994, Adam and Edworth 1995, Costello et al. 2002) Color has obvious potential to aid the discriminate ability and categorization of label and package (Vernon and Lloyd-Jones, 2003) In medical domain, use of color as an identification and classification aid, to reduce medication error has been in practice. (Stuth 2002, Frush et al. 2004, McCoy 2005).Color, therefore, helps in categorization of label and package (Hellier et al 2006). Color also has significant influence on perceived drug potency (Routcet and Droulers 2005). Color is also a powerful cue assisting brand recall (Tavassoli and Han, 2002) Red is associated with coke, Blue with IBM, Pink with Barbie dolls, Green with 7 up and Unienyme with black color tablet color also communicates corporate position. At the same time Blue color stands for solid responsible financial service, green for innovative, caring organization. (Cheskin and Masten, 1987). The same holds true for color of pharmaceutical OTC products. However, cross-cultural differences in color perception do exist29 (Jameson and Alvarado 2003). Therefore, color is an
integral part of product and packaging (Madden et.al 2000) Color can influence and build emotion in advertising according to Lichtle (2007). Gender, age, extrovert or introvert behavior could influence the packaging? Color preference can predict consumer behavior (Aslam, 2006). The same author also mentions that it can help companies to influence the consumer’s perception and differentiate a product from competition. Inappropriate choice of package color may lead to failure. Packaging is a silent salesman in OTC segment (Srivastava, 2007). Color definitely can enhance the effectiveness of packaging. However, cultures may differ in their aesthetic expression as colors represent different meanings and aesthetic appeals in different cultures (Aslam 2006). Until the middle of the 20th century pills were round and white. The color transformation started in the 60’s and accelerated in 1975. Yet, many colors and their role remain to be studied and documented. This is more important if one relates to pharmaceutical products. Consumers taking more than one drug might recognize different drugs better if they are in various colors. (Hurdle, 1956). This probably reduces accidental poisonings. Accidental poisoning has been reported often, from as early as 1956. (Hurdle, 1956). After this report in 1956 Jolly and Forrest suggested that drugs should be different from each other and should not resemble sweets to prevent accidental poisoning in children. (Jolly H, 1958)This study examines the impact of product color on consumer’s expectancies towards the
Aarti T. More and R.K.Srivastava

75SIES Journal of Management, April - August 2010, Vol.7(1)
drug and seeks to determine if color code exist for drug categories. Palatability is influenced by a combination of sensory perceptions including sight, taste, and smell and to a lesser extent the texture of the products.The main objective of this study was also to assess the presumed effect of the color of a drug on subjective evaluation. It also examines the impact of sensory attributes like color (aesthetic appeal and mood influencer), shape (aesthetic appeal and appeal as object of desire) and perception of taste (appealing to basic drives like hunger, thirst etc.) looking at the color in consumption experience of pharmaceutical OTC products.
1.8 Influence of Shape in the over-the-counter (OTC) Medicine Market:
Swallowing Tablets is discomfort for many people and both Physical as well as psychological factors may cause this discomfort. If a patient has once experienced a Tablet sticking in the esophagus, the patient may get Unpleasant associations by swallowing tablets hereafter. A rugged surface makes the tablet scratch the Esophagus during passage, and some tablets might have a bad taste or smell. These factors make the Intake of tablets a discomforting experience to the Patient, and this might consequently lead to noncompliance. (Andersen, Zweidorff, Hjelde T, Rødland EA. Problemer 1995). The ability of tablets to pass the esophagus is assigned to size, surface area, shape and coating, and it is generally agreed that the most important factor is size and shape which should be as small as possible. Patients’ acceptance of tablets and their compliance are related to,
the visual appearance of the tablet. Thus, the importance of both shape and color has been investigated.The shape of a tablet is restricted only by the imagination of the designer. Apart from the more popular round or caplet shapes, all other standard geometric shapes can be used such as oval, elliptical, square, diamond, rectangular, polygons and so on. Also special shapes can be employed to add to the products brand identity such as animal shapes, fruit shapes or even shapes representative of the ailment. The shape is very important for functional as well as aesthetic reasons such as alignment for tablet printing, packaging and for ease of swallowing by the consumer. (Trevor Higgins 2000). The pharmaceutical OTC industry is now relying on product appearance to differentiate its products from the competition. Many companies have started using tablet size, shape, and color as a competitive tool. This is key, because tablet size and geometry are known to affect consumer’s ability to swallow a dose.
1.9 Influence of packaging in the over-the-counter (OTC) Medicine Market
For the purchase of over the counter (OTC) products, the consumer goes to the Chemist/pharmacy. Brand strength and packaging design play the deciding role. A decade ago, packaging was often an afterthought, viewed as merely the final step in manufacturing. Since long, pharma packaging in India remained functional rather than aesthetic. The only function of packaging was to carry the product and keep it stable; till it is consumed. However, manufacturers realized that, they can build credibility and
Aesthetics in Pharmaceutical OTC Marketing
76
the user-product bond if consumers could ‘see’ the product. Patients love to see the product that they are consuming. Thus transparent capsules with colorful beads inside are not only attractive but are also more trustworthy. A syrup in a transparent glass bottle is preferred a lot more than the amber color bottle. Transparent blister packs are liked more than the aluminum strips,” (Gauri Chaudhari), Pharma OTC companies are responding to this need. They are no longer hiding the medicines behind opaque covers. OTC packaging generates “absolute trust”, including a strong brand bond through emotionally appealing design. Those packages that through the visual appearance create a direct connection to the product achieve the highest brand and product recognition. The importance of emotionality in OTC packaging is surprisingly high. A succinct and attractive packaging design presents a central role in communicating high value and optimum effectiveness of the medication. A consistently designed packaging will charge the drug with sympathy and elicit the deciding purchase impulse. (Claus Kreuzer, 2008). Packaging is accepted emotionally because it is inventive, and has a very elegant appearance and above all looks very “modern and progressive”. Pharmaceutical companies that make and market OTC products needs to consider how they stack up against many competitors on the store shelf, where consumers make their own purchase decisions. A well-designed package can make a product easier to find on crowded store shelves. Great design also cements the sale on an emotional level, where most pharmaceutical OTC brands
don’t operate. It can boost a shopper’s confidence in selecting the right product. With the increasing scale of the self-service areas in pharmacies, attention- getting packaging design becomes a sales relevant necessity. Packaging by means of a profound communication concept, optimally convey the key brand values and product features. OTC marketing needs to head great value on good packaging design. There are three sound conceptual platforms for OTC packaging. These are positioning for effectiveness, positioning for innovation and positioning for naturalness. Effectiveness is communicated by strong shimmering colors, through symbols that associate power, dynamics and movement, and name affixes such as Forte, Acute or Effect. Innovation is conveyed through new packaging shapes and opening mechanisms, luster effects, verbal cues for the added value, and the visual presentation of the innovation through images or symbols. Naturalness is communicated through natural appearing colors, smooth typography and images and symbols referring to nature. The paperboard packages, with their colorful inks, holograms, embossed faces, and unusual shapes, help to catch consumer attention. Thus, pharmaceutical companies are eager to enhance the appearance of their products, especially those firms marketing OTC products.Unfortunately, the packaging for OTCs is very similar to what for prescription products. The marketing value of packaging is a largely untapped frontier in OTC pharmaceuticals.“Many pharmaceutical OTC companies are so focused on equipment stability and regulatory requirements that they haven’t
Aarti T. More and R.K.Srivastava

77SIES Journal of Management, April - August 2010, Vol.7(1)
even begun to think beyond that and about such things as package design,”If one sees an OTC product, for instance Gelusil, although it is an OTC product, it doesn’t convey that it is one. It looks like a normal, typical prescription medicinal pack. There needs to be a strong branding and an OTC appeal that reflects what it is meant for. Color branding needs to be very important in case of OTCs because in India people still remember and connect with the color of the pack. However, package should also play a role in explaining the harmful effects of over-dosing. Internationally, OTC packaging mimics the FMCG industry. This could be due to that fact that the modern retail format is still in its infancy in India. The minute OTC brands come on the health aisles; they will have to sell themselves. They will not be able to hitch a free ride on the chemist’s push. There are different age groups, different patient conditions or lifestyle requirements that need different packaging solutions. Acidity can strike at any time; hence chronic sufferers tend to carry antacid tablets in their pockets. Digene’s blister pack is a great help for such patients. A simple and square shaped Digene pack can be easily carried along. This is a good example of lifestyle driven packaging. Designing is significant tool in packaging. The color of the packaging can play a role in limiting counterfeiting. If there is a product which has a material with a unique color that can’t be copied, and it becomes registered in the mind of the consumer, then it becomes a very strong feature with which a consumer can associate and recognize the product when he goes to buy it. Today’s healthcare product aisles are stocked with more products than ever, and OTC companies
will need to leverage the marketing power of packaging. Brands share the approach of leveraging packaging to tap the human senses and create brand perceptions. From a marketing perspective, opportunities then emerge for connecting with consumers on a much deeper cognitive level. Consumer confidence improves, and packaging goes beyond serving merely as a container.
1.10 Branding through Aesthetics
Aesthetics has a number of important implications for branding. This could be referred to as the marketing of sensory experiences which contributes to the brand’s identity. It has a focus on the aesthetic gratification of consumers. There is also a possibility that consumers associate positive aspects of aesthetics with the organization marketing a brand. Aesthetics not only enhances visual appeal, but could also create a sensory experience. There are two aspects of aesthetics one is style and the other is theme. Style refers to quality, form, color, shape, pattern, taste, smell and touch (texture & material). A marketer should know (in a given product category) how the style elements could be combined and when to adopt a particular style. The second aspect of aesthetics, namely theme, refers to brand names, symbols, slogans and jingles used in advertisement. Branding is more conspicuous at the corporate level than at the product level, and building a strong brand identity is still in its nascent stage in Pharma OTC industry. Pharmaceutical OTC branding is vital as it not only creates public awareness about potential benefits of the product but also distinguishes a company and its products from other competitors.
Aesthetics in Pharmaceutical OTC Marketing

78
Branding is directly proportional to the sales revenue of a company. The higher the brand perception and the stronger the brand value, the greater will be the sales revenue and profits for the company that owns the brand.” The value of brand is huge compared to physical assets” (Lindsay, 2004). For pharmaceutical OTC brands, positioning must, be based on effectiveness and emotions associated with the product. Beliefs about pharmaceutical OTC brands and their effectiveness occupy a different corner of brain from that of cola drinks. Relief from illness, pain or discomfort is a far greater need than the recreation alleviation of thirst. Trust in pharmaceutical OTC brands, therefore, is a more vital and hard-won commodity once gained, it can be leveraged most successfully in the brand building process. Brand personality builds on the emotional appeal of brands and is the medium through which these are expressed in advertising and through visual brand identity. Brand personality is therefore an important differentiating factor in positioning brands. When a consumer starts using a branded product, he starts associating the attributes of the product with the brand, for example, the size, color, texture, feel, odor, and so on, indicating different characteristics of the brand. Hence, size represents role, while color indicates whether the brand exerts positive or negative influence on the customer’s buying decision (Lederer, 2001). Thus, aesthetics of a product can be made to represent a brand.If companies fail to differentiate themselves at a level beyond functional benefits (product based), they will be unable to sustain brand loyalty.
Aesthetic attributes and qualities thus can be frame of reference for associating with a brand. Many a time the focus is primarily on the price rather than on other points of difference (Clancy and Trout, 2002). Focusing on the aesthetic aspects of the product can be good option to differentiate position and build brands. Aesthetics is one of the physical attributes, which can be used to have a positive consumer influence on the brand.
1.11 Need for Study
Consumers have little difficulty telling whether they like or dislike a product, or which product they prefer. However, their ability to reliably describe the reason for their likes, dislikes and preferences and more importantly to offer meaningful suggestions for improvement is notoriously poor. In Pharmaceutical Industry where sensory analysis is not a core competency, it’s not surprising to find formulators using a “trial and error” approach to develop palatable formulations. Medicine does not have to taste good to work! Doctors and pharmacists have long held on to this belief. A large percentage of the medicine that doctors prescribe is never taken - and this is not just because of the medicine’s unwanted side effects. Patients have been refusing to take medicines because they tasted bad, were hard to swallow, or packaging was hard to open. Less attention is given to the aesthetic aspects of the product, its function and the brand strength. As long as the doctors and pharmacist continued to recommend the medicines, this was a problem that did not affect the producers of prescription medicines.
Aarti T. More and R.K.Srivastava

79SIES Journal of Management, April - August 2010, Vol.7(1)
The traditional pharmaceutical branding model was developed around product features and related directly to the product’s positioning rather than any consistent brand essence. However, the problem is that markets are now becoming so competitive that one may have to change positioning statement if required. The traditional model worked very well but was very functional and focused only on what the drug did. It is therefore important to know what are the attributes of aesthetics as perceived by the marketers and consumers, what role it plays at different stages of purchase and how aesthetics is related to various aspects of marketing like brand identity, brand image, brand equity, corporate image, and so on.
2. Research Objectives
One of the factors which ensure customer satisfaction is the “look” and “feel of the product. This is particularly true for a Pharmaceutical OTC like product, which supports various dimensions of social and emotional requirements other than only functional. One of the important aspects of the product is the “Look” – acceptance of shape or color of the product, and its ‘user friendly’ nature. These aspects have always posed a challenge for companies to arrive at the right aesthetics, determining success or failure in the market. The study on how aesthetics play a role in marketing and how these elements can be captured in the product and eventually in the mind of customer is the basic objective of this study. An attempt is made to understand aesthetics from the point of view of the consumers and role it plays or can play in the purchase behavior of the products selected.
The specific objectives of this study are:
1. To investigate the consumers Perception for Aesthetic attributes like Color, Shape, and Packaging while buying a Pharmaceutical OTC Product.
2. To evaluate the impact of these factors in promotion and positioning of an Pharmaceutical OTC product.
3. To study the influence of demographic factors in context of aesthetic attributes and its influence on purchasing behavior of pharmaceutical OTC products.
Understanding the above objectives and factors associated with it would certainly help pharmaceutical companies to a large extent in designing a product before launching it in the market
2.1 Hypothesis
In today’s world where the customers are bombarded with communications with more and more products and where tradition based differentiation becomes less and less useful, aesthetics is perhaps one of the most important elements of the product.Products physical properties can play an important role in perception and can have an effect on product’s acceptability. Therefore, the following hypotheses can be formulated: H-1: Influence of Aesthetic attributes play a significant role on consumer’s compliance for pharmaceutical OTC products.H-2: Preferences for Pharmaceutical OTC products shows Demographic based differences viz-a-viz for aesthetic attributes.
Aesthetics in Pharmaceutical OTC Marketing

80
3. Research Methodology
Theoretical Frame Work
Various sensory attributes like Color, Taste, Shape, Texture and Packaging either in isolation or in combination with each other cause array of sensory experiences which range from repugnant to extremely elating. Also, human beings, belonging to different age groups, different religions and socio-cultural backgrounds and different genders, perceive and respond to these experiences in different ways. The above phenomenon, assuming economic factors unchanged when compared with traditional looks of medicines, does contribute in building brand image of the OTC products and also does influence decision to buy certain medicines.
Consumers remember the most when they see the product i.e. sight is most important i.e. 58% followed by smell-45%, taste-31% and touch 25%.
The above framework suggests that products sensory attributes moderate the effects on perceived aesthetic qualities of the product on consumer’s decision process. Color choice can influence perception as color signals individual’s personality too (Aslam 2006) Berg-Weitzed et.al (2001) found that packages for deodorants for women should be attractive. A bright colored package is likely to draw more attention than a dull package (Neal et. al 2002)
3.1 Preliminary Research
The research was both primary and secondary in nature. The primary research was conducted through survey which helped in analyzing the consumer’s beliefs, perceptions, and behavior towards aesthetic attributes like color, shape, packaging and taste of OTC Products. The analysis of secondary data helped in understanding the prior work on the same or related
Aarti T. More and R.K.Srivastava
Conceptual ModelSensory
Attributes
Consumer perception
Consumer decisionmaking process
Color Packaging Taste SmellTexture
GestationSight
NegativePositive
NoYes

81SIES Journal of Management, April - August 2010, Vol.7(1)
topic and also provided insights about the sensory attributes that can be leveraged for positioning of OTC drug products. It provided an impetus to further narrow down the research and test the hypothesis. Study of sensory attributes helped to understand the consumer’s acceptability and brand recall for pharmaceutical OTC products. The primary research was conducted through survey. Supportive data was also taken from Chemists and Medical Representatives.
3.2 Questionnaire Development Instrument
The well structured Questionnaire was designed to identify general perception of OTC medicines and the preference for color, shape, packaging and perception of taste of OTC drugs. The questionnaire focused on identifying the perception for aesthetic attributes like color, shape and packaging and to a little extent for taste while looking at the OTC products. Supportive data was also derived from Chemists through questionnaire. It focused on reveling weather consumers demand pharmaceutical OTC products keeping in mind their aesthetic attributes like Color, Shape, Packaging and taste.
3.3 Pre- test
Initially, pilot study involving 100 consumers of different Gender and Age groups with well-designed questionnaire was conducted for phase I and phase II study. The study gave the data of preferences of product color of pharmaceutical OTC products. It was then realized that the other aesthetic attributes like shape, taste and packaging are also important as far as positioning and promotion of Pharmaceutical OTC Products are concerned.
3.4 Population and Sample
Consumer sample was 1000. Sample was taken from 3 cities i.e. A-Class city Mumbai, B-Class City Nasik, and C-Class city Igatpuri of different Age Groups, Gender and Religions.
Table No 5: Distribution of Age and Gender Wise Respondents
Age Group Gender TotalMale Female
18-34 259 191 450 (45%)
35-54 205 171 376 (33%)
55-65 86 88 174 (22%)
Total 550 (55%)
450(45%) 1000 (100%)
Table No 6: Distribution of A Class, B Class, and C Class City Wise Respondents
A Class City B Class City C Class CityMumbai Nasik Igatpuri300 400 300
Table No 7: Distribution of Religion Wise Respondents
Hindu Muslim600 400
Data analysis was done using SPSS, Microsoft Excel sheets, etc
3.5 Data Collection Procedures
The data collection method was direct structured questionnaire to consumers. This was done in two phases. Respondents were exposed to face to face interview. The Questionnaire was designed to identify
Aesthetics in Pharmaceutical OTC Marketing

82
general perception of OTC drugs and the preference for color, shape, packaging and perception of taste of OTC drugs.
Under Phase I: The respondents were asked to reply to the questions in the questionnaire which were related to general perception for sensory attributes like Color, Shape and Taste by looking at the color of pharmaceutical OTC products.
Under phase-II: Same respondents then were directed to a simulated display of products at the chemist and his/her perception was sought again. Display at the chemist counters and a mock room was specially created for this study. OTC Products of different Colors, Shapes, Texture and packaging were displayed in different dosages.
The consumers were asked to imagine that they were interested in purchasing a single product and were asked to answer the questions in the questionnaire; which were similar to the questions in the previous questionnaire. Purchasing scenarios were developed in the questionnaire to identify the sensory factors, which influence the purchase intentions of OTC products. Thus, it gave the direction to measure the perception of a product, consumer’s purchase intention, which was not done previously in India.
3.5 Data Analysis:
Color, Shape and Packaging do enhance the brand recall Mapelli and Behrmann (1997) did mention in their study, the role of color in recognition. Color perception can play a role in the treatment effectiveness (Worthington, 2007). It may be due to color which creates an image in the customers’
mind (Madden et al, 2000). This study reveals that Color, Shape and Packaging can help in improving brand recall and increase compliance for medicine uptake. It is important especially when medicine consumption is an unwilling act. .This becomes more important where education level is low. This is given in table –9
Consumer’s perception for Attributes of Aesthetics like Color, Shape and Packaging as a memory tag for compliance (Obedient to take the Medicine on time)
Table No 8 Attributes of Aesthetics which forms a Memory Tag for Compliance
Sr.No Attributes Total Scored
Percentage of Grand Total
Ranking
1 Color 750 75 12 Shape 134 13.4 23 Packaging 116 11.6 3
The research found out that, for 75% of consumers, color is a memory tag for compliance.
Color of the product, a visual attribute is ranked 1st and external visible parts like Shape and Packaging are ranked 2nd and 3rd. Consumers remember color for consuming medicines, if medicines are to be taken at specific intervals. This was also reported earlier by Goldman study (2005) which says that headache pill has to have aesthetic appeals. This study can aid OTC marketers on this aspect.
The aim of the second part of the questionnaire was to study the general perception of taste and color i.e. How color is perceived with respect to taste? No doubt a medicine can be ingested irrespective of taste (Madrid, 2005). However, if all the sensory elements are taken in to account,
Aarti T. More and R.K.Srivastava

83SIES Journal of Management, April - August 2010, Vol.7(1)
compliance of the medicine intake can go up multifold. The general perception of taste in relation to color is given in table –10
Table No 9 Consumer’s perception of taste looking at color of OTC medicine
Color/Taste perception
Red Blue Green Orange Pink Yellow White Total
Bitter 17 98 8 9 42 12 38 224Sweeter 101 17 13 7 152 10 5 305Sour 27 13 7 81 37 42 10 217Salty 22 9 9 12 17 21 8 98Neutral 12 30 19 6 33 4 52 156Total
179 167 56 115 281 89 113 1000
Table was analyzed using chi square test, using SPSS tool which determined the Association of two variables (Color and Taste).
Chi Square Value Degrees of Freedom Table Value Interpretationat 0.1% Significance Level
639.86 24 37.566 Significant association between Color and Taste
The table 8 and 9 can be interpreted as; attributes like color, shape, packaging and taste play a significant role on consumer’s compliance for OTC Product’s uptake.
Therefore Hypothesis H-:1 Influence of Aesthetic attributes (Color, Shape and Packaging) play a significant role on consumer’s compliance for pharmaceutical OTC products is accepted.
Pink is considered to be sweeter compared to Red. Similarly, Orange has emerged as a symbol of sour taste. White and Blue are associated with bitter taste. Yellow is considered to be salty as per this study. This research data can be extremely useful to marketers. As per Aslam (2007) yellow is considered to reflect good taste in china, Japan, Korea. There was no such study in SARC countries on color and taste. Color and drug potency was studied early by Routcet and Droulers (2005). However, on taste and color this study can be useful to pharmaceutical marketing personnel.
3.5.1 Effect of Demographic Variables on Aesthetic Attributes of Pharmaceutical OTC Products
Demographic variables play a role in consumer behavior and it affects aesthetic consideration in the buyer. In this section the effect of demographic variable is seen on aesthetic attributes with respect to survey conducted.The second phase of study under simulation revealed interesting data. After simulation exposure, there is a considerable incremental difference in color preference for Pink followed by red among both sexes. This is given in table –10 This was analyzed using Sign Test
Aesthetics in Pharmaceutical OTC Marketing

84
Table No. 10: Gender Male
Phase/ Color Red Blue Green Orange Pink Yellow White Combination
Phase I 98 121 20 31 52 19 201 8Phase II 82 135 25 37 75 17 152 27Difference -16 14 5 6 23 -2 -49 19Sign of Difference - + + + + _ _ +
(k>5 /8, 0.5) = 0.363 (Obtained from Table)
K= The Number of plus signs
Since the calculated probability value is 0.363 which is much higher than 0.05, Hence under simulation there is impact on color preference.
Table No. 11: Gender Female
Phase/ Color Red Blue Green Orange Pink Yellow White CombinationPhase I 101 69 18 39 88 17 111 7Phase II 107 58 19 71 114 10 61 10Difference 6 -11 1 32 26 -7 -50 3Sign of Difference + _ + + + _ _ +
(k>5 /8, 0.5) = 0.363 (Obtained from Table)K= The Number of plus signs Since the calculated probability value is 0.363 which is much higher than 0.05, Hence under simulation there is impact on color preference. Therefore, there is an influence of Gender on product color while preferring a Pharmaceutical OTC Product.
This study was further considered in for three age groups 18-34, 35-54 and 55-65.
Table 12: Color Preference for OTC Medicine based on AgeAge Group 18-34
Phase/ Color Red Blue Green Orange Pink Yellow White CombinationPhase I 77 62 19 42 98 19 112 21Phase II 89 71 10 54 115 13 88 10Difference 12 9 -9 12 17 -6 -24 -11Sign of Difference + + - + + - - +
(k>5 /8, 0.5) = 0.363 (Obtained from Table)
K= The Number of plus signs
Since the calculated probability value is 0.363 which is much higher than 0.05, Hence under simulation there is impact on color preference.
Aarti T. More and R.K.Srivastava

85SIES Journal of Management, April - August 2010, Vol.7(1)
Table No. 14: Age Group 34-54
Phase/ Color Red Blue Green Orange Pink Yellow White Combination
Phase I 61 73 18 24 89 22 71 18Phase II 78 87 17 29 94 11 55 5Difference 17 14 -1 5 5 -11 -16 -13Sign of Difference + + _ + + _ _ _
(k>4 /8, 0.5) = 0.637 (Obtained from Table)
K= The Number of plus signs
Since the calculated probability value is 0.637 which is much higher than 0.05, Hence under simulation there is impact on color preference.
Table No. 15: Age Group 55-65
Phase/ Color Red Blue Green Orange Pink Yellow White CombinationPhase I 19 22 27 9 17 4 74 2Phase II 15 29 38 11 30 7 39 5Difference -4 7 11 2 13 3 -33 3Sign of Difference _ + + + + + _ +
(k >6 / 8, 0.5) =0.145 (Obtained from Table)K= The Number of plus signs
Since the calculated probability value i.e. 0.145 is more than 0.05, Hence under simulation there is impact on color preference. Therefore, there is an influence of Age on product color while preferring a Pharmaceutical OTC Product
Table 16: Color Preference for OTC Medicine based on Religion
This was also analyzed using Sign Test
Religion Hindu
Phase/ Color Red Blue Green Orange Pink Yellow White CombinationPhase I 61 108 22 20 102 11 152 8Phase II 72 102 25 21 142 9 109 4Difference 11 -6 3 1 40 -2 -43 -1Sign of Difference + _ + + + _ _ _
(k >4 / 8, 0.5) = 0.637 K= The Number of plus signs Since the calculated probability value is 0.637 which is more than 0.05Hence under simulation there is impact on color preference.
Aesthetics in Pharmaceutical OTC Marketing

86
Table No. 17: Religion Muslim
Phase/ Color Red Blue Green Orange Pink Yellow White CombinationPhase I 18 11 29 7 12 9 26 4Phase II 15 9 34 9 16 6 24 3Difference -3 -2 5 2 4 -3 -2 -1Sign of Difference - - + + + - - -
(k>3 /8, 0.5) = 0.773Since the calculated probability value is 0.363 which is much higher than 0.05, Hence under simulation there is impact on color preference. Therefore, there is influence of Religion on product color while buying a Pharmaceutical OTC Product. The study was further carried out for Color Preference for OTC Medicine based on Class of City This was analyzed using Sign Test
Table No. 18: A Class City - MumbaiPhase/ Color Red Blue Green Orange Pink Yellow White CombinationPhase I 46 31 22 21 63 15 91 11Phase II 51 39 28 32 88 17 38 07Difference 5 8 6 11 25 2 -53 -4Sign of Difference + + + + + + - -
(k>6 /8, 0.5) = 0.145Since the calculated probability value is 0.145 which is much higher than 0.05, Hence under simulation there is impact on color preference.
Table No. 19: B – Class City NashikPhase/ Color Red Blue Green Orange Pink Yellow White CombinationPhase I 42 46 28 38 97 14 110 25Phase II 50 54 34 44 109 21 74 14Difference 8 8 6 6 12 7 -36 -11Sign of Difference + + + + + + - -
(k>6 /8, 0.5) = 0.145Since the calculated probability value is 0.145 which is much higher than 0.05, Hence under simulation there is impact on color preference. Table No. 20: C – Class City IgatpuriPhase/ Color Red Blue Green Orange Pink Yellow White CombinationPhase I 28 25 51 18 48 20 98 12Phase II 32 29 58 19 69 21 54 18
Difference 4 4 7 1 21 1 -44 6Sign of Difference + + + + + + _ +
(k>7 /8, 0.5) = 0.035
Aarti T. More and R.K.Srivastava

87SIES Journal of Management, April - August 2010, Vol.7(1)
Since the calculated probability value is 0.035 which is less than 0.05, Hence, there is no impact on color preference. Therefore, there is no influence of class of city on product color while preferring a Pharmaceutical OTC Product.
The study was also further carried out to reveal the shape preference for Pharmaceutical OTC Products. Shape is considered to be one of the important attribute while consuming the OTC Medicine.
Table 21: Shape Preference for OTC Medicines based on Gender (Phase –II)
Shape Male(f) Female(f) TotalRound 192 209 401Oval 217 162 379Square 96 67 163Rectangular 45 12 57Total 550 450 1000
The table was analyzed using Phi – Correlation Coefficient. The Chi Square(X2) value is 23.199 for 3 degrees of freedom. The table value for the same is 7.815 at 0.05 level of significance. Since the calculated chi – square value is greater than the table value, it can be interpreted that, there is significant association between the Gender and the preference for the shape of OTC Medicine.
Further it was computed for phi – correlation coefficient for assessing the degree or strength of association between Preference for shape and gender. Ф (Phi) = √ X2 = √23.199 N 100Ф (Phi) = √ 0.231Ф (Phi) = 0.48
The phi value of 0.48 indicates that there is a strong association between gender and preference for shape of OTC medicine, and this correlation is statistically significant. Therefore, there is influence of Gender on Product Shape while preferring a pharmaceutical OTC Product.
Table 22: Shape Preference for OTC Medicines based on Age
Shape Age Group18-34 (f)
Age Group35-54(f)
Age Group55-65(f)
Total
Round 198 187 101 486Oval 108 105 51 264Square 79 52 13 144Rectangular 65 32 09 106Total 450 376 174 1000
The table was analyzed using Phi – Correlation Coefficient. The Chi Square(X2) value is 28.781 for 6 degrees of freedom. The table value for the same is 12.592 at 0.05 level of significance. Since the calculated chi – square value is greater than the table value, it can be interpreted that, there is significant association between the Age and the preference for the shape of OTC Medicine.
Further it was computed for phi – correlation coefficient for assessing the degree or strength of association between Preference for shape and age.
Ф (Phi) = √ X2 = √28.781 N 100Ф (Phi) = √ 0.287Ф (Phi) = 0.53
The phi value of 0.53 indicates that there is a strong association between age and preference for shape of OTC medicine, and this correlation is statistically significant.
Aesthetics in Pharmaceutical OTC Marketing

88
Therefore, there is influence of Age on Product Shape while preferring a pharmaceutical OTC Product.
Table 23: Shape Preference for OTC Medicines based on Religion
Shape Hindu(f) Muslim(f) Total
Round 212 158 370
Oval 185 98 283
Square 152 86 238
Rectangular 51 58 109
Total 600 400 1000
The table was analyzed using Phi – Correlation Coefficient. The Chi Square(X2) value is 13.936 for 3 degrees of freedom. The table value for the same is 7.815 at 0.05 level of significance. Since the calculated chi – square value is greater than the table value, it can be interpreted that, there is significant association between the Religion and the preference for the shape of OTC Medicine.
Further it was computed for phi – correlation coefficient for assessing the degree or strength of association between Preference for shape and Religion.
Ф (Phi) = √ X2 = √13.936 N 100Ф (Phi) = √ 0.139Ф (Phi) = 0.37
The phi value of 0.37 indicates that there is a strong association between Religion and preference for shape of OTC medicine, and this correlation is statistically significant. Therefore, there is influence of Religion on Product Shape while preferring a pharmaceutical OTC Product.
Table 24: Shape Preference for OTC Medicines based on Class of City
Shape A- Mumbai
B-Nashik C- Igatpuri
Total
Round 105 135 79 319Oval 92 98 67 257Square 71 110 85 266Rectangular 32 57 69 158Total 300 400 300 1000
The table was analyzed using Phi – Correlation Coefficient. The Chi Square(X2) value is 25.560 for 6 degrees of freedom. The table value for the same is 12.592 at 0.05 level of significance. Since the calculated chi – square value is greater than the table value, it can be interpreted that, there is significant association between the class of city and the preference for the shape of OTC Medicine.
Further it was computed for phi – correlation coefficient for assessing the degree or strength of association between Preference for shape and class of city.
Ф (Phi) = √ X2 = √25.560 N 100Ф (Phi) = √ 0.255Ф (Phi) = 0.50
The phi value of 0.50 indicates that there is a strong association between class of city and preference for shape of OTC medicine, and this correlation is statistically significant. Therefore, there is influence of class of city on Product Shape while preferring a pharmaceutical OTC Product.
Further it was tried to understand whether the robust looking and multicolored packaging of OTC medicines depicted the promise of cure by the concerned medicines (Question No 15), majority of the responses to same
Aarti T. More and R.K.Srivastava

89SIES Journal of Management, April - August 2010, Vol.7(1)
(see Table No) is in affirmative.
Table No 25:
Robust looking and multicolored packaging of OTC medicines depicted the promise of cure by the concerned medicinesFrequencyYes, it does 552Yes, sometimes 448
Looking at the Product’s packaging and importance the consumer’s attaches to it confirms that non functional aspect in a product is important.
Hence, the hypothesis H-2.3.1- There is influence of customers/consumers on Product Packaging while preferring a Pharmaceutical OTC Product is accepted.
Therefore Hypothesis, H2 – Consumption of OTC products shows demographic based differences viz-a-viz for aesthetic attributes like Color, Shape and packaging is accepted.
3.6 Detailed Findings
This study reveals that color and shape can help in improving brand recall and increase compliance for medicine uptake. It is important especially when medicine consumption is an unwilling act. Pink is considered to be sweeter compared to Red. Similarly, Orange had emerged as a symbol of sour taste. White and Blue are associated with bitter taste. Yellow is considered to be salty as per this study. This research data can be extremely useful to marketers. As per Aslam (2007) yellow is considered to reflect good taste in china, Japan, Korea. There was no such study in
SARC countries on color and taste. Color and drug potency was studied early by Routcet and Droulers26 (2005). However, on taste and color this study can be useful to pharmaceutical marketing personnel. In terms of percentage there was 100% positive shift in females as compared to 44% in males for Red color. Similarly for Pink color positive shift was 43% and 20% for male & female respondents respectively. White color saw a sharp fall under simulation in both sexes. Both male & female showed difference between simulation & non simulation cases on color influencing their purchase intention.
This finding could help in packaging and color of Tablets of OTC products. After exposure to simulation it shows highest decrement in color preference for white. Therefore, attractive colors like Red, Pink, Blue and White can influence purchase intentions.
Given a choice, Males will prefer Oval Shape while Females will prefer Round Shape for the OTC Medicines. Older consumers were more inclined towards small rounded tablets due to their swallowing discomfort. Apart from preference for color of the medicine, the study also revealed the motive for preferring the particular color. It was found that, for young age group pink was most preferred color due to its soothing effect impression. While blue was most preferred color for middle age and old age group due to its impression of cooling down. Educational level does matter for preferences and consumption of OTC medicines was also one of the important findings of this research. The supportive data from chemists was also
Aesthetics in Pharmaceutical OTC Marketing

90
sought which exposed few interesting information. They stated that, consumers remember and demand the OTC products due to their aesthetic attributes. They were of the opinion that, if pharmaceutical OTC companies take interest in these sensory elements, the sales can definitely increase.
3.7 Ethical Considerations
The research took one and half years to complete. Care was taken to ensure that mobile numbers were noted down for further follow up and verification from consumers. Questionnaires were filled up on one to one basis. After selecting the brands of pharmaceutical OTC medicines of different dosage forms and of different color, shape, texture and packaging, each participant was asked about their perception of products aesthetic attributes like color, shape, taste, looking at color and their purchase intentions. The general perception of consumers about OTC Medicines was researched in the I Phase of study. The second set of questionnaire focused on purchase intention for OTC medicines due to product attributes like color, shape, packaging, etc. as four purchasing scenarios (color, shape, texture, and packaging) were administered to them through questionnaire. Data was analyzed using SPSS and Microsoft excels stat. data. Care was taken to ensure the same set of respondent was administered questionnaire in phase II study.
3.8 Literature Review
Pharma companies grapple with strict legislation and there is a need for greater brand promotion in pharmaceutical marketing. (Biradar et. al (2007). The product’s aesthetics – appearance i.e.
aroma, flavor, texture, feel, and its impact on emotional connection with the product can have a dramatic effect on patient compliance and can subsequently increase brand loyalty. Aesthetics is one of the physical attributes, which can be used to have a positive consumer influence on the brand. (Baisya and Ganesh Das, 2008). When a consumer starts using a branded product, he/she starts associating the attributes of the product with the brand, for example, the size, color, texture, feel, odor, and so on, indicating different characteristics of the brand. Hence, size represents role, while color indicates whether the brand exerts positive or negative influence on the customers buying decision (Lederer, 2001). According to Lichte (2007) color component may affect the emotions felt by an individual. Therefore, color is an integral part of product, service, packaging, and logo and can be an effective means of creating and sustaining brand image in the customer’s mind (Madden et. al. 2000) Color, is one of the many marketing tools that global managers use to create brand images in the customer’s mind. Colors are known to posses’ emotional and psychological properties (Madden et al 2000). Color ranks among the top three consideration along with price and quality ( Cooper, 1994) According to Madden et al (2000) Red color means excitement, Orange signifies disturbed mind, Blue indicates tender and smooth, Purple means dignified mood and Yellow is a cheerful color, with Black being used for powerful symbolism. Same author says that Yellow and Blue are happy color Thus the role of color helps in memory performance in implicit or explicit ways (Vernon and Lloyd-Jones 2003) Color red is perceived as implying a high
Aarti T. More and R.K.Srivastava

91SIES Journal of Management, April - August 2010, Vol.7(1)
level of hazard followed by colors such as orange and yellow rather than blue and green; with white implying the least hazard (Chapan 1994, Adam and Edworth 1995, Costello et al. 2002) Color has obvious potential to aid the discriminate ability and categorization of label and package (Vernon and Lloyd-Jones, 2003) In medical domain, use of color as an identification and classification aid, to reduce medication error has been in practice. (Stuth 2002, Frush et al. 2004, and McCoy 2005).Color, therefore, helps in categorization of label and package (Hellier et al 2006). Color also has significant influence on perceived drug potency (Routcet and Droulers 2005). Color is also a powerful cue assisting brand recall (Tavassoli and Han, 2002) Red is associated with coke, Blue with IBM, Pink with Barbie dolls, Green with 7 up and Unienyme with black color tablet color also communicates corporate position. At the same time Blue color stands for solid responsible financial service, green for innovative, caring organization. (Cheskin and Masten, 1987). The same holds true for color of pharmaceutical OTC products. However, cross-cultural differences in color perception do exist29 (Jameson and Alvarado 2003). Therefore, color is an integral part of product and packaging (Madden et.al 2000) Color can influence and build emotion in advertising according to Lichtle (2007). Gender, age, extrovert or introvert behavior could influence the packaging? Color preference can predict consumer behavior (Aslam, 2006). The same author also mentions that it can help companies to influence the consumer’s perception and differentiate a product from competition. Inappropriate choice
of package color may lead to failure. Packaging is a silent salesman in OTC segment (Srivastava, 2007). Color definitely can enhance the effectiveness of packaging. However, cultures may differ in their aesthetic expression as colors represent different meanings and aesthetic appeals in different cultures (Aslam 2006).
A rugged surface makes the tablet scratch the esophagus during passage, and some tablets might have a bad taste or smell. These factors make the intake of tablets a discomforting experience to the patient and this might consequently lead to non-compliance (Overgaard, J.Hojsted, R.Hansen, L.L.Christrup 2001). The ability of tablets to pass the oesophagus is assigned to size, surface area, shape and coating and it is generally agreed that the most important factor is size, which should be as small as possible (Overgaard, J.Hojsted, R.Hansen, L.L.Christrup 2001). Despite the fact that difficulties in swallowing tablets seem to be a well known problem among patients, only few and desultory investigations have been made on the subject (Overgaard, J.Hojsted, R.Hansen, L.L.Christrup 2001). In addition, the aging population and growing number of new treatments available have led to an ever-increasing number of medicines being prescribed, compounding the risk of mistaken tablet identification and subsequent noncompliance. As a result, pharmacists have had to become increasingly skilled at trying to identify those (E Graham-Clarke and N Langford 2004). Factors related to ease of swallowing (dosage form, shape, size and number of units per dose) were the most important attributes in the selection of an antacid, laxative, vitamin or product of headache, chronic pain, cold,
Aesthetics in Pharmaceutical OTC Marketing

92
flu, or allergy (William J. Jones III, John J. Francis 2000). A picture of the soft gel on the package for over the counter products may enhance consumer’s recognition of this dosage form and its advantages over conventional forms (William J. Jones III, John J. Francis 2000). Sensory directed formulation development can drastically improve a product’s flavor quality and thereby, its sales (Jeff Worthington 2001). Aesthetics and perceived overall value are critical to sales success in competitive commercial range market models. (Remich and Norman, 1997). The design of a product inherently involves aesthetics. Moreover, the aesthetic aspects of a product are a potential source of pleasure for the consumer (Holbrook and Zirlin, 1985). As a result, the influence of aesthetics is increasingly being acknowledged as an important part of new product development (Whitney, 1988), marketing strategy (Kotler and Rath, 1984), product quality (Garvin, 1984; Zeithaml, 1988), product differentiation (Dickson and Ginter, 1987) and competitive advantage (Holt, 1985; Kotler and Rath, 1984). Shusterman (1998) says if aesthetic value cannot be separated from understanding, and understanding requires interpretation, and interpretation cannot be separated from experience, then it follows that aesthetic value cannot be separated from experience either. Aesthetic factors in a product have started gaining importance and are mentioned as an important factor in product designing (Cushman and Rosenberg, 1991; Lee, 1993). Product design, particularly aesthetic attributes, can be used to influence consumer behavior in a big way (Veryer, 1993). Aesthetics is a dynamic discipline. When the product design is static, the importance of aesthetics
increases (Hollins and Pugh, 1990). It is seen that an aesthetically likeable product can excite all our sensory perceptions and give pleasure, while at the same time, an aesthetically inferior product can evoke distaste (Lawson,1983). Understanding the perception of the consumer related to various aspects of consumer aesthetics is important (Holbrook and Huber, 1979). It is also seen in advertising that by using substance with aesthetic value can affect the perception of the consumer, even to the promotional message to a great extent (Holbrook and Schindler, 1994). Design, which refers to the organization of elements of an object, and aesthetics are inherently linked since the design or physical form of a product encompasses the aesthetic aspects of the product (e.g., shape, color, texture, and so on) (Veryzer, 1995). Product aesthetics influences the judgment on product quality and brand strengths (Page and Hen, 2002). In a survey of product designs in five developed countries of Europe and North America, aesthetics was declared as a key aspect of design by more than 75 percent of the respondents (Walker, 1995). The visual appearance of a product is considered as a key factor in initiating consumer attention and interest (Berkowitz, 1987; Bloch, 1995; Dumaine, 1991), and subsequently generating positive response from the consumer towards a product (Veryzer, 1993, 1995; Holbrook and Zirlin, 1985). Color influences perceptions of size (Bevan & Dukes 1953), weight (Warden & Flynn 1926), warmth (Tinker 1938) and taste (Ough & Amerine 1970; Tom et al. 1987). The color of a product’s packaging influences brand choice (Gordon et al. 1994) and blue produces a stronger buying intention than red (Bellizzi & Hite 1992). A large section
Aarti T. More and R.K.Srivastava

93SIES Journal of Management, April - August 2010, Vol.7(1)
of the color research on products, packages and advertisements remains unpublished because of competitive concerns (Bellizzi et al., 1983). Inappropriate choice of product or package colors may also lead to strategic failure (Ricks, 1983). Assuming a narrow Western perspective of colors as ‘universal’ and applying it to alien markets has often led to cultural faux pas and there is need for a systematic color theory in marketing (Mubeen M. Aslam 2006). Cultures differ in their aesthetic expressions as colors represent different meanings and aesthetic appeals in different cultures (Mubeen M. Aslam 2006With prescription products, there are no visuals, such as color or shape. The product itself lacks organoleptics or an appeal to the senses, such as taste, touch, or smell. These sensory appeals are essential to develop a brand because they help to build brand personality (Mark Seveini, 2002). Sensory analysis provides an objective way to identify the taste challenge; benchmark a product against its competitor’s and identifies a reasonable flavor target to lead the formulator (Iman Alashkar, 2006). Pharmaceutical OTC companies can save themselves by addressing the taste factor early in clinical development. In so doing, they can get their medications to market more quickly, ensure patient compliance, gain market leadership – and reap generous economic rewards (Jeff Worthington 2003). Sensory directed formulation development can drastically improve a product’s favor quality and, thereby, its sales (Jeff Worthington 2003). The product’s aesthetics – appearance, aroma, flavor, texture, skin feel, sound, and more can build an emotional connection with the product. This can have a dramatic
effect on patient compliance and increase brand loyalty (Jeff Worthington 2003). A product’s physical properties can play an important role in flavor perception and have a dramatic effect on product acceptability (Jeff Worthington 2003).
3.9 Conclusion
The study showed that there is an influence of products aesthetic attributes on pharmaceutical OTC products and the consumption desire of consumers. The greater the number of senses a product appeals to, the greater will be the potential for creating an emotional attachment to the product. This can translate in to brand loyalty and ultimately to sales. Red and Pink emerged as the most preferred colors. Blue and White are other two preferred colors. Color and Shape affects the perceived action of pharmaceutical OTC Product and seems to influence the effectiveness of a drug. With large number of OTC drugs currently circulating in the market, products can easily get lost in cluttered OTC aisles of supermarkets. Through proper study of a product aesthetic attributes, a memorable brand can be initiated to separate from the competitors in an attempt to gain a bigger market share in the OTC drug industry. Thus, pharmaceutical branding today is about expressing brand value that is valuable to the consumers.
4.0 Managerial Implications:
The information from study can be used to help marketers for launching, positioning and promoting OTC products effectively. Research of this type is relevant, as marketers’ need information about possible factors that may influence product selection decisions.
Aesthetics in Pharmaceutical OTC Marketing

94
The study can be helpful for investigating influence of product’s aesthetic attributes on consumers cutting across diverse sectors of society for its positioning and promotion of pharmaceutical OTC products. Also, the findings of this study will provide insights concerning sensory attributes of the product and attitude of consumers towards it in terms of buying preference.
This type of study presents insights that might help organizations to develop effective marketing strategies leading to better sales. The study can also be helpful to Marketers in understanding the attitudes and consumer behavior by investigating attributes and preferences as they form a prominent factor affecting actual buying behavior.
4.1 Suggestions & Recommendations
The conclusions of the study can be used to help marketers for launching, positioning and promoting OTC products effectively. Research of this type is relevant, as marketers’ need information about possible factors that may influence product selection decisions. The study can be helpful for investigating the influence of a product’s aesthetic attributes on consumers, cutting across diverse sections of society for the positioning and promotion of pharmaceutical OTC products. Also, the findings of this study will provide insights concerning sensory attributes of the product and attitude of consumers towards them in terms of buying preference.
This type of study presents insights that might help organizations to develop effective marketing strategies leading to better sales. The study can also be helpful
to Marketers in understanding the attitudes and consumer behavior by investigating attributes and preferences as they form a prominent factor affecting actual buying behavior. There is the larger opportunity to discover the sensory attributes that can be leveraged for the many drug products differentiated solely by price (generics) or those that offer little by the way of an emotional connection to the patient.
4.2 Limitations of the Study
The research was limited in scope to examine the buyer behavior of the targeted population only in 3 cities from western Maharashtra, which limited the results from being generalized to other population. More studies including larger demographic group/s should have been conducted to help validate the findings. This study did not cover the human randomness of choices made by customers. Also it does not delved in to the influences of complex processes at work in the human mind and intellect while making everyday myriad decisions such as buying the OTC medicines. This study reflects and is strictly limited to the consumer response-as reported by consumers-to diverse sensory attributes of OTC medicines.
4.3 Future Scope of the Study
More studies including larger demographic group/s should be conducted to help validate the findings. There is the larger opportunity to discover the sensory attributes that can be leveraged for the many drug products differentiated solely by price (generics) or those that offer little by the way of an emotional connection to the patient. In the OTC pharmaceutical sector, the sensory
Aarti T. More and R.K.Srivastava

95SIES Journal of Management, April - August 2010, Vol.7(1)
optimization of products is on the march. The advantages for both manufacturer and customer can no longer be ignored. Powerful insights can be explored from true understanding of consumer beliefs, perceptions, and behaviors’. Many consumer research techniques, ranging from traditional surveys and focus groups to ethnographic studies, can be used to support this exploration. The study exhibits that demographics have to be looked into with more seriousness and product attributes like aesthetic features should be used as a unique selling proposition for various segments as it is also seen that ‘conventional demographic variables, such as occupation, income and education and to less extent consumer modernism can be used to classify groups of consumers in to potentially profitable market segments’.
References:
Madrid A, (2005), Sensory Evaluation- More than just food, ESN Seminar, May 25-26,Worthington J. (2007), Let’s Talk about Sense Appeal, Available at:http// www. Pharmaquality.com(Accessed on26th September,2009)Goldman,R(2005) ,Advances in Consumer Research,Vol.32,PP.165-170.Mapelli D and Bergmann M (1997), The role of color in object recognition, Nero case, vol. 3, pp 237-247.Choungourin A(1968),Color preference and cultural variation, Perceptual and Motor skills,Vol.6,No.3,1205-1206.Jacobs L ,Keown,C, Worthey,R, and Ghymn K, (1991),Cross cultural color comparison, International Marketing Review,Vol.18,No.3,pp.21-30
Madden T J., Hewett K and Roth M S., (2000) Managing images in different culture: Across national study of color, Journal of International Marketing, Vol. 8, No. 4, 90-107.Hupka R. B., Zaleski Z., Otto J., Reidl L., & Tarabrina N. V., (1997) The colors of anger, envy, fear, and jealousy: a cross-cultural study, Journal of Cross-cultural Psychology, Vol. 28, No. 2, pp. 156-171. Grossman, R. P. and Wisenblit J. Z., (1999) what we know about consumers colour choices, Journal of Marketing Practice: Applied Marketing Science, Vol. 5, No. 3, pp. 78-88.Ricks,D.A, (1983),Big business blunders, Mistake, Multinational Marketing ,(Homewood, H Dow Jones-Irwin)Schmitt,B.H, (1995),Language and visual imagery, Journal of of business world Business, Vol.9,pp12-18.Schiffman ,L.G,Bednell, D, Cowley, E, and Kanuk,L(2001) ,Consumer Behaviour,2nd Edition,(French Forest, NSW, Prentice Hall)Neal C M, Quester P. G. and Hawkins D I (2002), consumer behavior: Implication for Marketing strategy 3rd Ed. Roseville NSW, McGraw-Hill More A, Srivastava R. K. (2007), Role of colour in packaging, 3rd SIMSAR-Asia Marketing conference, 6-7th Jan, 2007, Mumbai Birader S S., Bhagvati S T., Shegunshi B., Hunshyal R D., (2007), Emotional branding in Pharmaceutical Industry, The Internet Journal of pharmacology Vol. 1, pp. 30-37
Lichtle M C. (2007), the effect of an advertisements color an emotions evoked
Aesthetics in Pharmaceutical OTC Marketing

96
by an advertisement and attitude toward the advertisement International Journal of advertising, Vol. 26, No. 1, pp. 37-62.
Cooper M C. (1994), The color of money, Direct Marketing, Vol. 34 pp. 66-67
Vernon D and Lloyd Jones T J (2003), the role of color in implicit and explicit money formance, Journal of Experimental Psychology, Vol. 56 , No. 5, pp. 779-802.
Chapans A (1994), Hazards associated with three signal words and four colors an warning sign, Ergonomics, Vol. 37, pp. 265-276
Adam A S. and Edworth J, (1995) Qualifying and predicting the effect of basic text display parameters on perceived urgency, Ergonomics Vol. 38, pp. 228-237
Costello A, Hellier E, Edworth J and Coulson N (2002), Can food label design characteristics affect perception of genetically modified foods? Ergonomics, Vol. 41, pp. 442-446
Stuth E (2002), Color coded label of urgent care medication , BMJ, Vol. 324, pp. 170-188
Aarti T. More and R.K.Srivastava

97SIES Journal of Management, April - August 2010, Vol.7(1)
SIES Journal of Management, April - August 2010, Vol.7(1): 97-108
Review Paper“Analysis of Impact of Promoters’ Stake on the Firm Value in the Indian Corporate Sector”
Sujata ChincholkarSujataChincholkar,is Finance faculty at Fr.C. Rodrigues Institute of Management.
1. Introduction:
The proposed research will try to study the relationship between the changes in the promoters’ stake and the performance of the company in the Indian corporate sector. It will try to compare the performance of those companies who witnessed changes in promoter’s stake against those who did not witness any. It will also examine whether presence of foreign promoters brings any change in the performance of the company against those which are completely owned by Indian promoters only. The proposed study will fill the gap in our knowledge about what is the effect of changes in promoter’s stake on the performance of the company.
1.1 Promoters’ Contribution to the Business
A Corporation, in theory is owned by its shareholders. The shareholders contribute some of their money – often a paltry amount – to the equity capital of the corporation. They are presumed to bear the greater portion of the risk of running a firm (as compared to the lenders, bondholders etc.) and hence expect to be rewarded for this risk. They are supposed to own the corporation, (Balasubramanium et al, 2006).
AbstractThe proposed research will try to study the relationship between the changes in the promoters’ stake and the performance of the company in the Indian corporate sector. It will try to compare the performance of those companies who witnessed changes in promoters’ stake against those who did not witness any. It will also examine whether presence of foreign promoters brings any change in the performance of the company against those which are completely owned by Indian promoters only. The proposed study will fill the gap in our knowledge about what is the effect of changes in promoters’ stake on the performance of the company.

98
Sujata Chincholkar
Promoter of the business is an entity that plans a project or formation of a new company and then sells or promotes the plan or idea to others. They conceive the company and invest the initial funds. The promoters play an important role in any business organization. Promoter when decides to create a firm, needs to establish contractual relations with other investors, employees, suppliers, creditors, customers, and so on. Furthermore he needs to decide whether to sustain the firm’s control or to hire a professional manager. Maintaining the firm’s control has private benefits, with the production of value to the shareholder, but it also generates costs because the shareholder has to acquire information about manager’s effort to produce output [(Dyck and Zingales, 2004) in Ines Lisboa, and Jose Paulo Esperanca (2008)]. Likewise, some shareholders prefer to contract a manager, establishing with him a contract, which Jensen and Meckling (1976) define as “agency relationship”; The shareholder who acts as principal hires a person (the agent) to control the firm and, to increase his performance, while the agent receives a pecuniary salary and some other amenities for doing that job [(Demsetz, 1983) in Ines Lisboa, and Jose Paulo Esperanca (2008)]. With this contract, in which the parties define each other’s rights and obligations, their protection and the accomplishment of their goals are guaranteed.
1.2 Promoters’ Role in the performance of the company
Insider ownership reflects the governance problem arising due to variance in the cash flow and the control rights such ownership entails. Insider ownership as defined in the
governance literature has two dimensions. In the first case, insider ownership can be defined as managerial ownership (manager-owner), where managers are assigned ownership as an incentive mechanism by owners. In the second case the insider ownership is defined as ownership rights held by an insider who promotes and also manages (owner- manager). The behaviour of the insider due to a discrepancy in cash flow and control rights in both the cases need not be similar due to a divergence in both motivation and expectations. (Phani et al, 2004). The Indian governance mechanism particularly the insider ownership of firms follows the latter pattern where owners are promoters as well as managers. (Phani et al, 2004)
Company’s performance may be affected by manager’s decisions as he can use its resources to maximize his wealth at the expense of the firm. If for one side, the manager receives a salary to do this function in ways consistent with the maximization of the performance, for another side, he may feel not fully compensated for the risk he faces and so he can take decisions that satisfy his self-interests, rather than the firm’ ones . To avoid a decline of the performance, the shareholder needs to use internal and external mechanisms to control managers. One way to align managers’ interests with those of shareholders is to lure them to acquire the firm’ shares. In that case, as managers are at the same time shareholders, they may want to maximize the performance. Moreover, there are other mechanisms, external mechanisms, which depend on the market force to control manager, namely the importance of takeovers, the facility to replace managers, the enforcement of the legal law, and others

99SIES Journal of Management, April - August 2010, Vol.7(1)
Review Paper “Analysis of Impact of Promoters’ Stake on the Firm Value in the Indian Corporate Sector”
[Fama and Jensen, 1983, Jensen and Ruback, 1983, Jensen, 1986, Morck et al., 1989, and Agrawal and Knoeber, 1996 in Ines Lisboa, and Jose Paulo Esperanca (2008)].
1.3 Role of Controlling Shareholders
The existence of controlling shareholder can have deleterious effect for a company due to the possibility of the interests of the controlling shareholders not being lined up with the interest of the other shareholders, (Shleifer and Vishny, 1997 in Pablo et la (2007)). The controlling shareholders can expropriate the wealth of the other shareholders in several ways.
They may reward themselves by payment of wages in excess for itself. They may nominate themselves for privileged executive positions and positions on the board. They might pay or receive high transfer prices for their own companies. They may transfer the shares to their beneficiaries at a good discount or may indulge in the acts of insider trading. They may use company’s assets as a pledge to personal transactions or to borrow fund from the company with commercial advantage. They may also follow the practice of underinvestment, because if the investments are not recovered, the costs will be divided in equal parts with all the shareholders (Jensen and Meckling (1976) in Pablo et al (2007)).They may allocate the resources in investment projects that reduces its risk and do not maximize the company’s wealth.
Claessens et al (2002) [in Pablo et al (2007)] summarize the costs of the stock concentration as an entrenchment
effect, when the company’s ownership and voter’s concentration takes place. In the entrenchment effect, the increase of the share of votes and of the company’s ownership withheld by the controller, lets the same to be less dependent and subject to the decisions of the board of directors and of the mergers and acquisitions market, allowing the expropriation of the wealth for the private benefit, while the cost would be shared among all the shareholders.
The most important advantage related to the stock concentration is linked to the possibility of the owner to monitor the management with the probable reduction of conflict and the cost of agency. Classens et al (2002) in Pablo (2007) summarized the benefits of stock concentration as an alignment effect, in which as the amount of shares withheld by the controller increases, it increases incentive for monitoring, at the same time the expropriation cost also increases. At this point, the ownership of a great amount of shares brings the controller commitment of not devaluing the company’s shares
1.4 Importance of Ownership issue and Firm value in the Indian Corporate Sector
The issue of ownership, control rights and firm value has been widely researched in advanced countries. In India, ownership structure is highly concentrated in the hand of family members and their acquaintances (Phani et al, (2004)). Post- liberalization, capital market in India is showing a steady progress with large number of small shareholders participating in the equity market. When so much fortune is
100
concentrated in the hand of so few people (promoter group), it draws researcher’s attention. Typically majority shareholders are managers. Monitoring implies an external constraint. This is not to say that their block ownership provides no incentives. Clearly it does. But we should not expect large shareholders to constrain themselves on behalf of small shareholders (Holderness and Sheehan, 1998) thus the lack of relationship between ownership concentration and legal protection for shareholder is not surprising. The East Asian crisis reminds people how a poor governance structure can ruin an economy within no time. The family based governance model failed the Economy of East Asian countries and created chaos around the world, (Claessens, (2000) in Manoranjan, (2008)). Therefore it is imperative to study the performance of firms in India where family and kinship ties still dominate business decisions. The altercation between the Reliance and Reliance ADAG is the best example of how family feuds can harm the larger interests of the companies.
The relationship between ownership structure and corporate performance is one that has received considerable attention in the finance literature. However, a notable feature of this body of literature is its failure to reach a consensus regarding the nature of the relationship. Joshua (2002) in Korea, Manoranjan (2008) observed significant non monotonic relationship between the insider ownership and corporate value. Sabri (2003) findings did not support the contention that the ownership types influence the firm’s valuations. Jayesh (2004), found that foreign ownership does not influence the firm performance
significantly which was in sharp contrast with the other existing studies with respect to India and other developing countries. Saikat and Chakrapani (2003) observed that increase in holdings of the institutional investors in the firm increases value but increase in individual investors holding in a firm is found to be negatively related to the firm value implying that dispersion of ownership affects firm value negatively. It confirms the evidence of “convergence of interest” and “entrenchment effects” supporting Morck, et al (1988). However the evidence for “entrenchment effect” is in contrast with that of Sarkar and Sarkar (2000). Karl V. Lins (2002) observed that when managers have control rights that exceed their proportional ownership, firm values are significantly lower in countries with low shareholder protection.
Indian economy, being an emerging economy with the stock markets scaling new heights is attracting a steady flow of money into it and reporting stronger volumes of transaction and reaching newer heights of market capitalizations. Keeping in mind, the speed with which the markets are expanding, the market regulators need to be more watchful towards the happenings in the market.
2. Need for the study
Recent ups and downs in the market have witnessed many promoters enhancing their stake in the market or cashing their stake in the market. It becomes important from the regulator’s point of view to watch these movements carefully to be alert for the outcome of these movements. In Satyam Computers, the promoter’s stake in the year 2001 was 25.6% and on 3rd Jan 2009(when
Sujata Chincholkar

101SIES Journal of Management, April - August 2010, Vol.7(1)
the promoter wrote to SEBI regarding the scam) it was 5.13%. The proposed study will try to find out whether actions taken by the companies in the past actually helped the company and meant for the purpose disclosed by them if any. The results might be useful for lawmakers in the protection of small shareholders, in the implementation of corporate governance best practices and in safeguarding trust in financial markets, especially in gloomy periods.
As the outcome of the earlier studies show no uniformity in the results, the proposed study will fill the gap in our knowledge about what is the effect of changes in promoter’s stake on the performance of the company in the Indian corporate sector.
The project may also find its utility among the corporate as any decision of the company should be in the interest of the shareholder. The results of the research may help in answering whether the decisions in the past actually helped the company to add value to the shareholders and learn few lessons for the future.This project will be useful to the investing community at large as every change in the stake of the promoter brings many questions to their mind. The outcome of this research may help to answer some of their questions.
3 Review of the related Literature:
3.1 Research done by Foreign Researchers
Joshua (2002) conducted a study in Korea, a country with corporate governance characteristics markedly different from those of more developed western economies.
He investigated whether the effect of the amount of insider ownership on corporate value is non –monotonic by using data from Korean firms. He used switching regression in its empirical process, with price to book value ratios as its corporate value measure. When the functional forms of insider share ownership on company value were considered, no evidence could be found of their influence on corporate value in any linear, quadratic, or cubic forms, countering claims in the incentive alignment, entrenchment, and combined theories. The study examined the issue of the Integrated Theory and Combined Hypothesis. They could not confirm the existence of theory using Korean data.
In another study, Sabri (2007) discussed the issue of the divergence between ownership and control as one of the major cause of minority expropriation in France. He showed that the large controlling shareholders maintaining grips on control while holding only a small fraction of a cash flow rights are inclined to expropriate minority shareholders, which in turn detrimentally affects the firm’s valuation. His findings did not support the contention that the ownership types influence the firm’s valuations. The evidence also indicated that pyramiding is the main device set to unduly entrench the large controlling shareholder. Additional analysis revealed that irrespective of its type, sharing control with a family constrains the largest controlling shareholder to steer clear of self serving behavior whereas a widely held firm or a financial institution, as a second largest controlling shareholder tend to collude.
In similar spirit, Harold Demsetz and Belén
Review Paper “Analysis of Impact of Promoters’ Stake on the Firm Value in the Indian Corporate Sector”

102
Villalonga (2001) examined the roles played by two aspects of ownership structure, the fraction of shares owned by the five largest shareholding interests and the fraction of shares owned by management. An adequate study of the corporate control problem may call for more than is provided there, but the estimates of the two equation model they used give no evidence to support the notion that variations across firms in observed ownership structures result in systematic variations in observed firm performances.
John J, et al (2005), examined stock price responses to announcements of share purchases by corporate insiders for a sample of U.S. firms over the interval 1994 through 1999. They investigate whether the stock price reaction is consistent with the curvilinear relationship between insider ownership and firm value documented by McConnell and Servaes (1990, 1995) in John J, et al (2005). Their interpretation of the relationship estimated by McConnell and Servaes (1990, 1995) in John J, et al (2005), and others is that insider ownership can be used to increase firm value up to a point, after which additional ownership actually reduces firm value. Such an interpretation has been criticized because it ignores the endogeneity that might arise when other factors cause both value and ownership to evolve optimally and in harmony one with one another. They asked whether the changes in firm value that occur when share purchases by insiders are announced are consistent with the model of the non-linear relationship between share ownership and firm value documented by many prior studies. Consistent with the curvilinear relation between insider ownership and firm value, they found that
the coefficient on the change in ownership is positive, the coefficient on the change in insider ownership squared is negative, and the coefficient on the interaction is negative. These results are consistent with the causal interpretation of the relation between insider ownership and firm value.
Karl V. Lins (2003) investigated the relation between ownership structure and firm value across 1433 firms from 18 emerging markets. He examined management and family ownership across all of the sample firms and whether large non-management block holders provide monitoring. He also investigated whether the relation between ownership and value depends upon the level of external shareholder protection in a country. First, he found that management group control in excess of its proportional ownership is negatively related to Tobin’s Q in emerging markets. Managerial control in the 5% to 20% range is also negatively related to Q. He also provided evidence that large non-management block holders can mitigate the valuation discount associated with these expected agency problems. Managerial control in the 5% to 20% range is only associated with lower firm values when the management group is also the largest block holder. When a larger non-management block holder is present, managerial control in the 5% to 20% range does not affect firm value. Regressions also showed that large non-management block holdings are positively related to Tobin’s Q values.
Omar et al (2007) studied the corporate ownership and performance relationship in Bangladesh listed firms using a simultaneous equation approach. Despite the differences in the governance system
Sujata Chincholkar

103SIES Journal of Management, April - August 2010, Vol.7(1)
and institutional settings when compared against developed economies, the empirical results of this paper confirmed that there is reverse- causality between board ownership and financial performance. They reported that having an inverse relationship between board ownership and institutional ownership and U- shaped non-linear relationship between institutional shareholding and firm performance suggested that the monitoring role of institutional investor has value in enhancing performance upon acquiring a substantial proportion of firm equity.
Chilin et al (2007) examined the interrelationship between ownership structure information and corporate value. The evidence presented in the paper shows that endogeneity significantly affects that inferences one can draw regarding the relation among ownership structure, information disclosure and corporate value. They found that ownership structure has a non- monotonic influence on corporate value. In addition, they have observed that ownership structure affects firm value but the opposite dose hold; corporate value has a negative significant effect on ownership structure. They also observed that information disclosure has influence on ownership structure and corporate value.
3.2 Research done by Indian Researchers
Monitoring hypothesis as suggested by Shleifer and Vishny (1986) and Sarkar and Sarkar (2000) is supported by Saikat Sovan Deb and Chakrapani Chaturvedula (2003) in their study. The finding from combined impact of large institutional investors and small individual investor also re-emphasize
their findings on monitoring hypothesis. Showing that increase in holding of institutional investors in the firm increases value, which is in line with the findings of Agrawal and Mandelker (1990) in Saikat(2003). At the same time an increase in individual investor holding in a firm is found to be negatively related to firm value implying that dispersion of ownership affects firm value negatively. Their results also confirm the evidence of “convergence of interest” and “entrenchment effects” supporting Morck, et al (1988). However the evidence for “entrenchment effect” is in contrast with that of Sarkar and Sarkar (2000) in Saikat (2003). Their study suggests that alignment of interest occurs when insider ownership is below 30% and above 60%. Indian managers get entrenched between 30% to 60%, which is quite higher than that of UK, and the US managers reported by Short and Keasey (1999), Faccio and Lasfer (1999) and Morck et al (1988) in Saikat(2003). Overall, the findings of this study put forward evidences in support of ownership structure as an effective corporate governance mechanism for Indian firms.
Manoranjan (2008) examined the effect of insider ownership on corporate value on the BSE listed firms. He particularly looked into the nature of relationship between insiders’ equity holding and firm value. He observed a significant non-monotonic relationship between insider shareholding and firm value. The other findings state that foreign promoters or collaborators shareholding is having a positive impact on firm value. This study confirmed that with increase in insider ownership stake, firm value initially increases. At the initial level of ownership either insider do not have substantial stake
Review Paper “Analysis of Impact of Promoters’ Stake on the Firm Value in the Indian Corporate Sector”

104
to entrench or they have incentives to perform more to acquire more ownership stakes. The market discipline may force the insiders to pursue value maximization despite their lack of personal incentives to do so at this low level of stake in the firm.
Phani et al (2004) examined the relationship between insider ownership and the overall efficiencies of the firm, operational efficiencies of the firm in the Indian corporate sector. They classified the firms under 26 industry classification using NIC code of 1970 for the manufacturing sector. Their results indicate that Insider ownership in the Indian context has no influence on the performance of the firm in a majority of industries. They also find that higher insider ownership is associated with higher employee productivity and lower human resource expenditure. Asset utilization was found to be positively associated with insider ownership. However, they also believe that it is difficult to understand the results of the study considering the unique nature of informal Indian ownership and governance structure.
Jayesh (2003) examined the effect of interaction between corporate foreign, institutional and managerial ownership on firm performance. His results show that unobserved firm heterogeneity explains a large fraction of cross sectional variation in firm performance that exists among Indian corporate firms. Firm performance showed substantial cross-sectional and inter-temporal variation. He concluded that foreign ownership does not influence the firm performance significantly which was in sharp contrast with the other existing studies with respect to India and other developing countries. He documented
that institutional investors especially the development financial institutions affect firm performance positively once their ownership crosses a threshold level.
4. Gap Analysis
Most of the earlier studies relied on the past data of shareholding pattern and the corresponding value of the firm in the same year to study the relationship, but no attempts were made to follow the changes in ownership and their impact on the performance of the company after a gap of certain period. Time lag plays a key role as any changes are not expected to deliver instant results. Hence it would be interesting to study if the companies deliver consistent performance post such changes.
The role played by the block holders is not adequately studied. Most block holders are managers and this makes an obvious case of owner- manager. A considerable smaller group of block holders are monitors in the sense of being directors but not officers. But some block holders are neither directors nor officers. What role do these block holders play? Are they simply holding what they perceive to be undervalued securities, or do they have other motives? If so, what are the benefits to the block holders from holding an under diversified position and what are the effects for the firm has not received any attention of the researchers.
Analyzing the behaviour of ownership variables with other governance mechanism, such as board structure, CEO Remuneration, Capital Structure is not studied to throw more light on the interaction of the different components of the corporate governance and firm performance.
Sujata Chincholkar
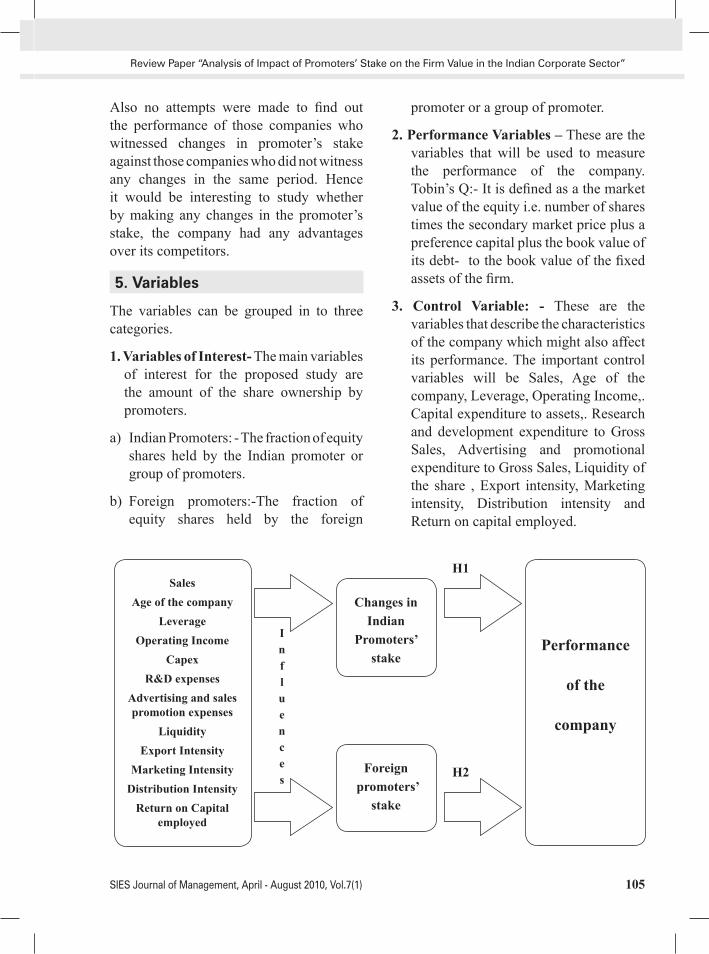
105SIES Journal of Management, April - August 2010, Vol.7(1)
Also no attempts were made to find out the performance of those companies who witnessed changes in promoter’s stake against those companies who did not witness any changes in the same period. Hence it would be interesting to study whether by making any changes in the promoter’s stake, the company had any advantages over its competitors.
5. Variables
The variables can be grouped in to three categories.
1. Variables of Interest- The main variables of interest for the proposed study are the amount of the share ownership by promoters.
a) Indian Promoters: - The fraction of equity shares held by the Indian promoter or group of promoters.
b) Foreign promoters:-The fraction of equity shares held by the foreign
promoter or a group of promoter.
2. Performance Variables – These are the variables that will be used to measure the performance of the company. Tobin’s Q:- It is defined as a the market value of the equity i.e. number of shares times the secondary market price plus a preference capital plus the book value of its debt- to the book value of the fixed assets of the firm.
3. Control Variable: - These are the variables that describe the characteristics of the company which might also affect its performance. The important control variables will be Sales, Age of the company, Leverage, Operating Income,. Capital expenditure to assets,. Research and development expenditure to Gross Sales, Advertising and promotional expenditure to Gross Sales, Liquidity of the share , Export intensity, Marketing intensity, Distribution intensity and Return on capital employed.
SalesAge of the company
LeverageOperating Income
CapexR&D expenses
Advertising and sales promotion expenses
LiquidityExport Intensity
Marketing IntensityDistribution Intensity
Return on Capital employed
Performance
of the
company
Changes in Indian
Promoters’ stake
Foreign promoters’
stake
Influences
H1
H2
Review Paper “Analysis of Impact of Promoters’ Stake on the Firm Value in the Indian Corporate Sector”

106
The above model will study the effect of changes in promoters’ stake on the performance of the company. It will also study whether the presence of foreign promoters in the company helps to add more value to the company than those companies where foreign promoters’ are absent. Performance of the company will be measured using Tobin’s Q. Other variables mentioned in the model will be controlled to study the relationship between the performance variables and the variables of interest.
7. Conclusion
The proposed study will try to find out whether there is any relationship between the changes in promoter’s stake on the performance of the company. It will try to see whether the Indian corporate actions yield similar results as observed in some of the overseas studies. Which theory best suits the Indian scenario, convergence of interest or entrenchment? India, a developing economy has yet to come up with high corporate governance standards compared to the western economies. Hence understanding the effects of the actions of the corporate on the firm value will bring out some issues like whether we need to have a business model like western economies where the promoter’s stake are quiet low, and acquisition and takeover markets are very active.
The proposed study will try to find out the performance of the companies where promoter’s stake changed against those who did not change the promoter’s stake. It will bring out whether changing promoter’s stake helps them in any way or not.
The proposed study will also try to find out whether foreign promoters bring in better value to the firm and if it is so, policymakers can try to attract more and more foreign capital.
The outcome of the study will fill the gap in our knowledge about the effect of changes in promoter’s stake on the performance of the company. In case it is observed that promoters are misusing the markets for their personal gains then, it may try to highlight the situations which will act as a whistle blower for the entire system.
References
Agrawal and Mandelker (1990). “Large Shareholders and the Monitoring of Managers: The Case of Ant takeover Charter Amendments,” Journal of Financial and Quantitative Analysis, 25, 2, 143-161.
Balsubramanium N, Seddil Ethiraj, Romie Litrell, Sebastian Morris, DVR Sheshadri, Jayanth Verma,Srilata Zaheer(2006),”Corporation and its Shareholders: What should B-School Teach?, Vikalp the journal for Decision Makers,Volume 31 April-June 2006Number 2, pp99-130.
Brigham and Ehrhardt (2002), Financial Management, 10th edition, pp 646-647.
Chilin Lu, Grace M. Liao, Yung-Cheng Yang (2007), proceedings of the 13th Asia Pacific Management Conference, Melbourne, Austraia, 2007, pp 698-704
Chuan-San Wang, Norman strong, Samuel Tung and Steve Lin(2009) “Share Repurchases , the Clustering Problem, and the Free Cash Flow Hypothesis” Journal of Financial Management Volume 38 ,Issue 3
Sujata Chincholkar

107SIES Journal of Management, April - August 2010, Vol.7(1)
,Autumn2009, pp 487-505.
Classessens,Stijn,Simeon Djankov, and larry H P Lang.2000” The Separation of Ownership and Control in East Asian Corporation” Journal of Financial Economics,58,pp.81-112
Demsetz and Villalonga(2001), “Ownership Structure and Corporate Performance” http://ssrn.com/abstract=266101
Dyck A, Luingi Zingale(2004), “Private benefits of control :An International Comparison”,The journal of Finance, Vol. LIX No. 2 April 2004,pp 537-600
Faccio and Lasfer (1999) Managerial Ownership, Board Structure and Firm Value: The UK Evidence Cass Business School Research Paper. Available at SSRN: http://ssrn.com/abstract=179008
Harold Demsetz and Belén Villalonga(2001). “Ownership Structure and Corporate Performance”Journal of Corporate Finance 7, pp.209-33
Holderness and Sheehan (1998), “Constrains on Large Block holders”, working paper No.6765, National bureau of Ecomonic Research, pp. 139-160.
Ines Lisboa,Jose Paulo Esperanca (2008), “Understanding the relationship between insider ownership and the performance in Europe” FMA European C o n f e r e n c e 2 0 0 8 , P r e g u e , C z e c h Republic,pp1-18
Jayesh Kumar (2003), “Does Ownership Structure influence Firm Value? Evidence from India” SSRN working paper 464521
Jensen Michael and Meckling William (1976), “Theory of the Firm: Managerial
Behavior, Agency Costs and Ownership Structure”, Journal of Financial Economics, October 1976, V.3 No.4 , pp305-360
John J. McConnell, Henri Servaes and Karl V. Lins (2005), “Changes in Equity Ownership and Changes in the Market Value of the Firm” SSRN Paper No.470927
Joshua Seungwook Bahng (2002) ‘Nonlinear Effects of Insider Ownership on CorporateValue: Korean Evidence” http:// papers.ssrn.com/sol3/papers.cfm.
Karl V. Lins (2003) ,Equity Ownership and Firm Value in Emerging Markets, Journal of Financial and Quantitative Analysis, Volume 38, Issue 01, March 2003,pp 159-184
Mahesh Vyas,’Beyond the Power’ The Financial Express, Feb02, 2009
Manoranjan Pattnayak (2008) “Insider Ownership and Firm Value: Evidence from Indian Corporate Sector “http://mpra.ub.uni.
McConnell and Servaes [1990], “What do we know about Corporate Performance and Ownership Structure.”, Journal of Financial Economics Pacific Basin Capital Markets Research: Volume II, 1991, 633-658.
McConnell and Servaes [1995], “Equity Ownership and the Two Faces of --Debt”, Journal of Financial Economics 39, 1995
Morck, Shleifer and Vishny (1988). “Value Maximization and the Acquisition Process” The Journal of Economic perspective, Vol2 No. 1 , Winter 88,pp 7-20
Omar Al Farooque, Tony van Zijl, Keitha Dunstan and AKM waresul Karim (2007), Ownership structure and corporate
Review Paper “Analysis of Impact of Promoters’ Stake on the Firm Value in the Indian Corporate Sector”

108
performance: Evidence from Bangladesh; Asia –Pacific Journal of Accounting and Economics14(2007) ,pp 127-150
Pablo Rogers,Dami A.T, Rebairo K.C.S, SousaA.F.,(2007), “ Corporate Governance and Ownership structure in Brazil: Causes and Consequences”, Journal of Corporate Ownership and control, Vol.5, No. 2, 2007
Phani, Reddy, Ramachandran, Bhattacharyya, (2004) “Insider Ownership, Corporate Governance and Corporate performance” NSE Research initiative proposal SSRN No. 696462
Sabri Boubaker (2007),”Ownership Control discrepancy and Firm Value: Evidence from France” Multinational Financial Journal 2007, Vol 11 No 3 /4,pp.211-252.
Saikat Sovan Deb and Chakrapani Chaturvedula (2003) “Ownership Structure and Firm Value: Empirical Study on Corporate Governance System of Indian Firms” SSRN working paper No594221.
Sarkar and Sarkar(2000). “Large Shareholder Activism in Corporate Governance in Developing Countries: Evidence from India,” International review of Finance,13, 161-194
Shleifer and Vishny (1986). “Large Shareholders and Corporate Control”. Journal of political economy, 94(3 part1) pp.461-88
Short and Keasey (1999)”Managerial Ownership and the Performance of the Firm: Evidence from the U.K.” Journal of corporate Finance ,5 pp.79-101
W. K. Adrian Cheung and K. C. John Wei (2005) “Insider Ownership and
Corporate Performance: Evidence from the Adjustment Cost Approach” Journal of Corporate Finance Volume 12 Issue 5 December 2006, pp 906-925.
Welch Emma (2003) “The Relationship between Ownership Structure and Performance in listed Australian Companies”, Australian Journal of Management, Vol.28No.3, Dec2003, pp.287-306
Sujata Chincholkar
109SIES Journal of Management, April - August 2010, Vol.7(1)
SIES Journal of Management, April - August 2010, Vol.7(1): 109-113
Review PaperElectronic Media and Reading Habits
Pallavi Sachin JadhavPallavi Sachin Jadhav is the Librarian at S.I.E.S. College of Management [email protected]
AbstractThis article deals with Electronic Media and its impact on Higher Education. It describes different kinds of Electronic Media. It also briefly describes the Reading Habits in Digital media.
Introduction
Reading is an integral part of human life. As food is necessary for our body so is reading for the mind. “An idle mind is a devil’s workshop” says a proverb. To keep our mind full of positive ideas, we must develop a habit of reading quality books. The practice of reading good books will develop our personality in a constructive way. To, read in common parlance means, going through a book or paper, printed or otherwise, for deep understanding or just for pleasure. A person who is not able to read and write may be compared to a blind person. But today, the technology has enabled even a blind person to learn how to read and understand the subject in the book. Now the literacy rate in the country is increasing gradually and the day is not far away when we can achieve the dream of being a completely literate nation.
With an increasing amount of time spent on reading electronic documents, a screen-based reading behavior is emerging. The screen – based reading behavior is characterized by the long duration of time spent on browsing and scanning, keyword spotting, one – time reading, non-linear reading, and reading

110
Pallavi Sachin Jadhav
more selectively, while less time is spent on in – depth and concentrated reading. Decreasing sustained attention is also noted. Annotating and highlighting, while reading, is a common activity in the printed environment. However, this “traditional” pattern has not yet migrated to the digital environment where people read electronic documents.
The advent of electronic media and the growing collection of electronic documents have had a profound impact on reading. It was argued that the development of digital libraries”is participating in a general societal trend towards shallower, more fragmented and less concentrated reading”.
Impact of Electronic Media on Higher Education
Electronic media (E-Media) is changing the way faculties teach and students learn. As technological advances are introduced into the academy, campuses are more and more attracted by the promise and potential E-media for enhancing access and learning. Faculty, Staff and Administrators need to understand what technology can and cannot do. E-media is seen by some as the panacea for budgets cuts: some see visions of hundreds of students sitting in front of monitors, with talking heads providing cheap, mass education. Others see technology as a critical complement to the educational experience, opening more opportunities for the learner than can be encompassed by one campus. Both visions are possible, but the first not particularly desirable. The internet is changing the way universities teach and do research. India has been a major seat of learning for thousands
of years. Some of the country’s universities are coming at par with the world’s well-renowned top universities. The advent of UGC – INFONET has given a momentum to accessing the e-resources by faculty, students and researchers. Most of the University Libraries are well equipped with modern gadgets like computers, e-resources, etc.
Internet-World Internet User Statistics
Internet is perhaps the most important development in the field of information technology that has been described as arguably the most complex structure yet discovered in the world. Internet is an open computer communication infrastructure and a network of networks. It is also known as Cyberspace, Information Superhighway, and the Net etc. Internet has enabled global level inter-connectivity of computers and computer networks. It is a traditional avenue for sharing research data and information. Internet has brought in a new era in global communications. Internet usage in India is growing in steady pace. The following table shows the number of internet users in India:
Internet Usage and Population Statistics
YEAR Users Population % Pen.
1998 1,400,000 1,094,870,677 0.1 %1999 2,800,000 1,094,870,677 0.3 %2000 5,500,000 1,094,870,677 0.5 %2001 7,000,000 1,094,870,677 0.7 %2002 16,500,000 1,094,870,677 1.6 %2003 22,500,000 1,094,870,677 2.1 %2004 39,200,000 1,094,870,677 3.6 %2005 50,600,000 1,112,225,812 4.5 %
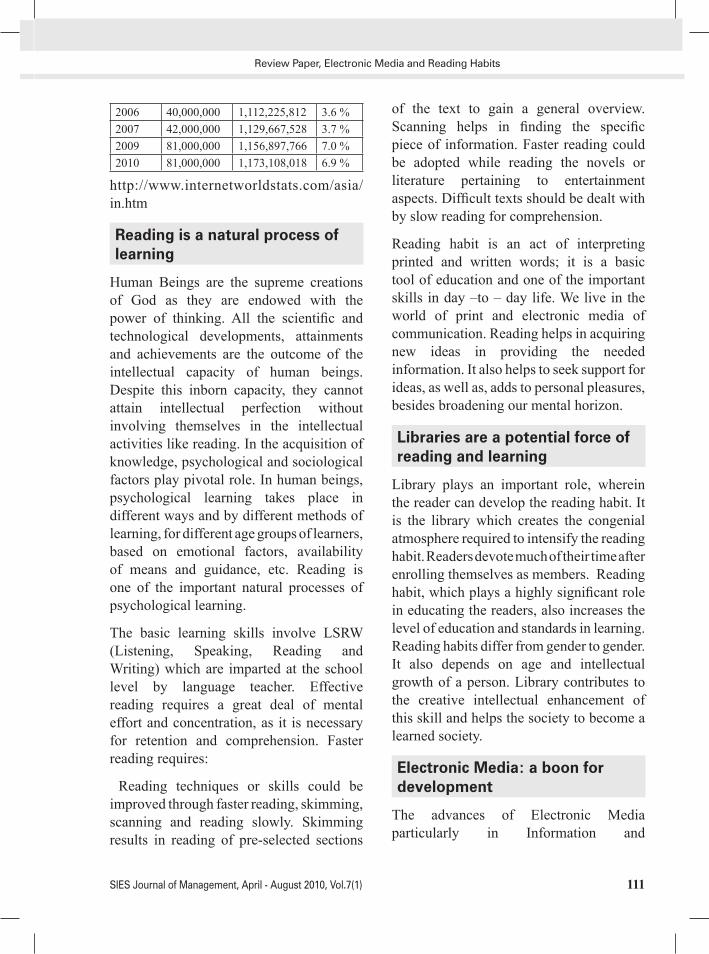
111SIES Journal of Management, April - August 2010, Vol.7(1)
Review Paper, Electronic Media and Reading Habits
2006 40,000,000 1,112,225,812 3.6 %2007 42,000,000 1,129,667,528 3.7 %2009 81,000,000 1,156,897,766 7.0 %2010 81,000,000 1,173,108,018 6.9 %
http://www.internetworldstats.com/asia/in.htm
Reading is a natural process of learning
Human Beings are the supreme creations of God as they are endowed with the power of thinking. All the scientific and technological developments, attainments and achievements are the outcome of the intellectual capacity of human beings. Despite this inborn capacity, they cannot attain intellectual perfection without involving themselves in the intellectual activities like reading. In the acquisition of knowledge, psychological and sociological factors play pivotal role. In human beings, psychological learning takes place in different ways and by different methods of learning, for different age groups of learners, based on emotional factors, availability of means and guidance, etc. Reading is one of the important natural processes of psychological learning.
The basic learning skills involve LSRW (Listening, Speaking, Reading and Writing) which are imparted at the school level by language teacher. Effective reading requires a great deal of mental effort and concentration, as it is necessary for retention and comprehension. Faster reading requires:
Reading techniques or skills could be improved through faster reading, skimming, scanning and reading slowly. Skimming results in reading of pre-selected sections
of the text to gain a general overview. Scanning helps in finding the specific piece of information. Faster reading could be adopted while reading the novels or literature pertaining to entertainment aspects. Difficult texts should be dealt with by slow reading for comprehension.
Reading habit is an act of interpreting printed and written words; it is a basic tool of education and one of the important skills in day –to – day life. We live in the world of print and electronic media of communication. Reading helps in acquiring new ideas in providing the needed information. It also helps to seek support for ideas, as well as, adds to personal pleasures, besides broadening our mental horizon.
Libraries are a potential force of reading and learning
Library plays an important role, wherein the reader can develop the reading habit. It is the library which creates the congenial atmosphere required to intensify the reading habit. Readers devote much of their time after enrolling themselves as members. Reading habit, which plays a highly significant role in educating the readers, also increases the level of education and standards in learning. Reading habits differ from gender to gender. It also depends on age and intellectual growth of a person. Library contributes to the creative intellectual enhancement of this skill and helps the society to become a learned society.
Electronic Media: a boon for development
The advances of Electronic Media particularly in Information and

112
Communication Technologies (ICT) have entered every sphere of human life and brought about a great transformation in society. The Radio, T.V., Microforms, Computers, Internet, Video Text, Fun text, etc., have greatly influenced the living of even a common man. From the young to the old everyone is fond of these and such other gadgets in whatever way it is possible for them to have. While these technologies were found to be luxuries a few decades ago, today they have become necessary means for the progress of the urban and the rural. The so-called global village, product of communication and information technologies, not only brought together people globally but enforced them a share in the ICT facilities for their survival. This boon of information technology, that helped people to access information from any corner of the world within a few seconds, has certainly brought about changes in the way people look for information, read them or use them. It is intended that the so-called ICT or Electronic media will help people to progress, but at the same time it is feared that it would reduce the reading habits of the young and the old who need to be assessed further.
The meaning of the term Electronic Media popularly called E- Media, is not available in any language or technical dictionary or encyclopedia. Different dictionaries and reference sources have defined differently.
By analyzing the definition a working definition of the term Electronic medium can be formed for the purpose of the study. With application to Library and Information Science, the term is defined as a material or configuration or device such
as magnetic tape, floppy disc or electronic paper, including both storable and removable media, on which the data and instructions are recorded. The term is used for information storage, processing, access and dissemination. The term “impact” can be defined as an influence caused by a new concept of idea or technology.
Full text / Online Journals Over Internet
Electronic Journals and Online Journals are the most important scholarly publications available on the Net. An e-journal is defined as any serial produced, published and published nationally or internationally via electronic networks. An e-journal is a full – text delivery system and differs from online journal and conventional bibliographic database available on online. It can be thought as full text e- publication which many include graphics and images. Many printed e-journal are available on electronic form over the internet.
Reading and Reading Habits
The Concepts of “Reading and Reading Habits” as perceived from literature are given below. According to Ranganathan (1968), Reading habit stands for “releasing and exercising the creative ability of each member of the community in his own field and in his own measure”. It is needed to extract creative abilities and skills from among the youngsters. It is necessary to indulge students in skillful and critical reading.
Dhupkar (1994) explains that reading reflects the society’s life style, the ideals, beliefs, curiosities and seeking soul of the people. Reading culture leads us to a
Pallavi Sachin Jadhav

113SIES Journal of Management, April - August 2010, Vol.7(1)
revolution which springs from a sensitivity to surroundings, resulting in transformation with reference to ideals, progress and civilization apprehended by imagination and sensibility nurtured by the best of books enshrined in the greatest literature. The oxford Dictionary (2003) defines Reading as a “Way of Interpreting Something”.
Reading Habit in Digital Media
The Impact of Digital media on reading has increasingly been the object of empirical and theoretical exploration by researchers from a wide range of disciplines, notably psychology, computer science, education, literacy studies, and library and information science. Each discipline has developed its unique research focus and methodology. It is not the purpose of this study to review all the different approaches and studies. Nevertheless, an examination of the related literature reveals that there are some essential studies that deserve closer attention.
With the growing amount of digital information available and the increasing amount of time that people spend reading electronic media, the digital environment has begun to affect people’s reading behavior.
Conclusion
In an increasingly digital environment, readers (especially younger readers) are likely to gradually develop the screen – based reading behavior, and to increasingly use a variety of strategies (e.g. browsing and keyword spotting) to cope with the information –abundant environment. At the same time, readers will continue to use printed media for much of their reading activities, especially in-depth reading. In-
depth reading usually involves annotating and highlighting. People’s preference of paper as a medium for reading (especially in–depth reading) also implies that paper is unlikely to disappear in the digital age. In the digital age, printing for reading remains one of the major driving forces for the increasing consumption of paper. A number of digital reading devices have been designed to support reading electronic documents efficiently.Since, an entire generation that has grown up with new technology is likely to have different behavior towards the use of digital media; studies on the demographic variables are needed to fully validate the findings.Thus, today’s world provides the easiest and fastest access to knowledge overcoming time and distance constraints through the electronic media. An analysis of relevant indicators would provide a sensitive yardstick for anticipating reading behavior in the digital environment.
References:
Ali, Amjad. 2001. Internet and University libraries, University News, 39 (17), p.6.Elisabeth, Anderson. 2004. Reading and Libraries, Guest editorial. Quarterly Bulletin o f the National Library of South Africa, 58 (1), p. 2-4. ILA- TISS 2008, International Conference.http:// Google.comhttp://www.urch.com/forums/gre-analysis-issue/47225-electronic-media-vs-reading-habits.html
http://www.internetworldstats.com/asia/in.htm
Review Paper, Electronic Media and Reading Habits

114
Review PaperSpecial Economic Zones in China
Koel RoyChoudhuryKoel RoyChoudhury is Faculty for Economics, S.I.E.S (Nerul) College of Arts, Science and Commerce, Navi Mumbai.
AbstractIn this globalised world, China has become the factory of the world. Before 1970s, China was an underdeveloped and predominantly agrarian economy. The economic reforms initiated by the Communist government in the year 1979 have helped China to emerge has one of the largest economies in the world. The Special Economic Zones were created as part of the process of industrialisation of the Chinese economy. Since then, these SEZs have played a significant role in China’s success. Encouraged by this, a number of countries including India have adopted the SEZ model for improving their export potential. While evaluating the role of these SEZs, we need to examine the working conditions in the factories located inside the SEZs. The intense competition among the factory owners to export at low cost at short deadlines has led to inhuman working conditions in these factories. In spite of adequate labour laws, workers continue to get exploited.
China – the world factory
The pace and scale of China’s economic development since the launch of its reform program in 1978 is one of the most significant economic stories of our times. The real GDP of china has averaged 10 per cent annually with the GDP doubling every 7-8 years. Several hundred million people have risen out of poverty and the living conditions have improved over a period of time. China‘s share in the World GDP has increased from 2 per cent (PPP basis) in 1980 to nearly 12 percent in 2008. China’s linkage with the rest of the world has increased. In 1980, China accounted for just 1 percent of the world trade flows, while by 2008 it accounted for over 8%. FDI inflows into China accounted for 7% of gross world FDI in flows in 2009 compared to only 1% in 1980.
The increase in China’s share of world trade is particularly striking in the markets for certain products. Its share in world exports of medium and high technology manufactured goods rose from low levels in 1980’s to 12% by 2008.. During this period, China moved from being an exporter of apparel and oil products to becoming a major exporter of electronic and information technology
SIES Journal of Management, April - August 2010, Vol.7(1): 114-120

115SIES Journal of Management, April - August 2010, Vol.7(1)
products such as consumer electronics and office and communications equipment. Since 2002, for example, China has been the largest supplier of U.S consumer products like DVD players, notebooks, computers, mobile phones and information technology hardware.
The phenomenal growth witnessed by China has been the result of ‘reforms and opening-up’ strategy adopted by China in the 1970s.
Prior to 1979, China had a centrally planned economy. A large share of the country’s output was directed and controlled by the state. The state set production goals, controlled prices and allocated resources in the economy. Private enterprises and foreign firms were totally nonexistent. Chinese living standards were substantially lower than those of other developing countries. The inward looking strategy adopted by China kept her stagnant and underutilized.
In 1979, several reforms were introduced to expand the Chinese economy by infusing foreign capital and technology. One of the important measures adopted was the establishment of four Special Economic Zones along the coast for the purpose of boosting exports, attracting foreign investments and importing high technology products into China. The open door policy was put into practice in order to attain socialist modernisation.
Four Special Economic Zones were established in Shenzhen, Zuhai and Shantou in the province of Guangdong and Xiamen in the region of Fujian. The main objective of setting up the zones were to delimit special areas to serve as a bridge or “windows” for
introducing foreign capital, technology, and knowledge and management knowhow. These SEZs were located along the coasts to gain easy access to markets like Hong Kong, Macao and Taiwan. As part of the open door policy package announced in 1984, SEZs were extended to large areas inside the country and fourteen coastal open port cities. In 1985, three coastal areas (Pearl River Delta, Southern Fujian Delta, and Yangtze River Delta) were designed as Open Economic Zones (OEZs) with special incentives to promote exports and attract foreign capital. The SEZs were created with the objective of attracting foreign investment in various industries with preferential measures and incentives such as lower tariffs, tax incentives to foreign investors, better infrastructure, more flexible labour markets and less bureaucratic control. Variety of industries including manufacturing industries, service industries like hotels, retails, housing constructions and infrastructural development were encouraged and open to foreign investment.
In the words of Deng Xiaoping, the objectives of creating the SEZs can be summarised as follows,
“SEZ is a window, a window of technology, a window of management, a window of knowledge, as well as a window of international policy.”
Growth of SEZs
The Special Economic Zones are considered as engine of growth for the Chinese economy. These SEZs have played an important role in transforming China from a stagnant and inward looking economy to
Review Paper Special Economic Zones in China

116
the world’s fastest growing economy in the world. According to a World Bank Report on SEZs published in April 2008, there were 157 zones in China employing 50,000 thousand people and generating exports worth $145,000 million.
The following data show the growth of the five SEZs established in China.
China’s Five SEZs (2007)
Shenzhen Zhuhai Shantou Xiamen Hainan
Area (sq km)
396 121 234 131 33900
Permanent population
(10 thousand people) 862 145 501 233 845
Local GDP
(100 Million RMB) 6765 887 850 1375 1230
Financial income
(100 Million RMB) 658 71 43 187 152
Import & export volume
(100 Million USD) 2875 399 61 398 74
Source: World Bank
Shenzhen
Shenzhen, a Special Economic Zone located in South China’s Guangdong province has turned out to be the most successful among the SEZs established in China. The city’s annual growth rate has averaged 28% since 1980. Shenzhen has developed into an important high-tech R&D and manufacturing base in China, the world’s fourth largest container port, the fourth largest airport and the fourth largest tourism city of China. Some of the important reasons cited for Shenzhen’s success are as follows1) Special privileges: In 1980, the central government of China granted special privileges to Shenzhen as a Special Economic Zone placing it literally in a class of its own.2) Foreign Direct investment: Initially Shenzhen lacked capital and other resources. In 1979 Shenzhen attracted foreign investment worth 0.005 billion dollars. But in 2008 Shenzhen actually used foreign investment worth 4.03 billion dollars. 113 of the top global multinationals maintain offices in the city. Buying foreign brands have become part of the daily life for Shenzhen residents. The major shopping districts are packed with foreign retailers like Wal-mart, Carrefour, H&Q. Countless global brands like P&G, Unilever, Mars, Coke, Nestle, Sony, LG, Nokia, SIEMENS and Phillips can be found in these stores. The city is connected to the outside world by a number of ways. Tens of thousands of foreign nationals now live and work in Shenzhen.3) Entrepreneurship: The city’s greatest strength is its entrepreneurship, which have flocked to the cities from all over China. Out of 170,000 registered companies in the Sez in 2005,
Koel RoyChoudhury

117SIES Journal of Management, April - August 2010, Vol.7(1)
more than 135,000 were private companies. The private sector employs about half of the city’s workforce and contributes about half of its economic output. It is the city’s high tech sector which has made a huge progress, growing at an annual rate of 46.5% over the past two decades. Shenzhen also has a large pool of small business owners who are engaged in a variety of industry all over the city.4) The middle class: Large numbers of people have migrated to the city from the adjoining areas leading to the emergence of a new middle class. Tens of millions of Chinese have tried their luck in this city and some 12 million now call it home. This middle class is the key consumption force in the city.
Chinese Success Story Chokes on Its Own Growth
The New York Times, December19, 2006
This article published in the New York Times highlights the deplorable conditions in which workers live in Shenzhen. SEZs like Shenzhen have created tremendous economic prosperity. Yet there are some winners and losers. If on one side these SEZs are dotted with huge factories and commercial complexes, there are also millions of workers who live in small dormitories working long hours in the factories.
Migrant workers: Majority of the workers working in the SEZs in China are migrant workers who receive as little as $100 per month. The migrant workers come from some of the poorer regions in China and are driven to the cities by lack of opportunities in the villages and the increasing gap between
the urban and rural areas. According to the National Bureau of Statistics, Majority of the migrant workers are forced to work overtime. In 2009, migrants worked on an average 26 days a month or 58.4 hours a week, 14.4 hours a week more than the legal limit of 44 hours a week according to the country’s new labour law. It is also reported that the average monthly salary of migrant workers grew by 77 Yuan ($11.28) in 2009 from the year before. According to the NBS report, only 42.8% of the migrant workers have a formal contract with their employees and in the construction industry, the figures are as low as 26%. The situation for migrant workers social insurance is even worse. Only 21.8% have employment injury insurance while 12.2% have medical insurance and 7.6% have pension insurance.
Rural stagnation: According to the National Bureau of Statistics, during the first half of 2010, the per capita total incomes of urban households was 10,699 Yuan, while the per capita cash income of rural population was 3,078 Yuan. China‘s economic growth has been rather uneven with the agricultural sector languishing and the rural population suffering from lack of job opportunities. Lack of agricultural development has forced millions of people from the rural areas to migrate to the cities. They are a cheap source of labour for the various factories in China. They are forced to love in the most deplorable conditions.
Growing level of unemployment: It is estimated by the China Labour Bulletin that between 2003 and 2020, 15 million new people will enter the Chinese labour market each year, while only 8 million new jobs
Review Paper Special Economic Zones in China

118
will be created at the current growth of 9%. China has virtually inexhaustible supply of migrant labourers who are willing to work under any conditions without protest.
Child labour: There is increasing evidence of usage of child labour in factories in China. School children are increasing becoming part of the required workforce. In some coastal and particular economic zones, such as Fujian and Guangdong, there are reported to be approximately four to five million child labourer under the age of 16. In Shenzhen, children between the ages of 10 to 16 work for up to 14 hours a day in factories. It is recorded that girls work in awful conditions for 13 to 14 hours a day from 7 am to 10 p.m with two one-hour breaks. According to the International Labour Organization, education is compulsory up to the age of 16, yet children are reported to be dropping out of school at increasing rates. An article in the Telegraph in February 2010 revealed that child labour was used in factories for manufacturing Apple computers, iPods and mobile phones.
Feminisation: SEZs have played an important role in creating employment opportunities for Chinese women. Today 60% of the workers engaged in the SEZs are females. According the China Labour Statistical year book (2005), manufacturing is the largest sector to employ women. Discrimation against women is a common feature in the Chinese factories. Most of the female workers are employed in unskilled, low paying and labour intensive factories. Young, single women are preferred as they can be easily controlled and are ignorant about their rights. Sexual harassment and
personal abuse often occur at the working place. Women are often made to work for long hours lasting up to 12 hours in a day. Despite provision in the Chinese labour laws regarding maternity leave, many factories refuse to abide by the law.
Hukou system: Hukou is a system of residency permits adopted by the Communist government used to minimize the movement of people between rural and urban areas. Under the Hukou system, Chinese citizens were classified as urban and rural based. While urban residents received state allocated jobs, the rural residents were to be self reliant. The hukou system operated as an internal passport system. The industrial growth witnessed by China has led to a huge migration of rural people to the factories. However, the rural-Hukou Chinese who migrate to the cities are not eligible for basic urban welfare and social service program including public education. Though the government has introduced a number of reforms in recent years, the basic structure has remained intact. The migrant worker continues to face discrimination in the job market and remain as second class citizens in the cities. During the recent global crisis, when Chinese exports fell and factories closed, the migrant workers became jobless with little protection.
Labour unrest: In recent times, China has seen a number of labour unrest, with workers demanding higher wages and better working conditions. In June, 2010, Honda, a Japanese automaker saw a series of strikes at its Chinese factories demanding higher wages. On June10, 2010, Time reported that in Kushan, a city near
Koel RoyChoudhury

119SIES Journal of Management, April - August 2010, Vol.7(1)
Shanghai, 50 workers were injured in a clash with security guards, after 2,000 people went on strike at KOK industries, a Taiwanese –owned factory that produces rubber products. According to Geoffrey Crothall of the China Labour Bulletin, a Hong Kong based NGO, “the economy is booming again and the same workers are forced to work longer hours, but pay is same. Obviously they are angry & frustrated”. Today labour disputes have become a common feature with more and more workers fighting for better wages. According to the Ministry of Human resources and Social security, nearly 700,000 labour disputes went into arbitration in 2008.
Conclusion:
On January 1, 2008 New Labour Contract law came into effect in China. The objective is it protects the rights and interest of workers in China. The new law include the provision of written labour contracts and contractual terms such as minimum wages, safety regulation, and probation period and severance payment. The new labour law is expected to improve the working conditions of workers. However the law is expected to increase labour costs. While the new labour law gives workers better protection of rights , the bottom line is the law will not empower workers to defend their rights through organised challenges and will not be strictly enforced if it disrupts the labour markets in a way that leads to large scale unemployment.
ReferencesAradhha Agarwal (2007). Impact of SEZs on Employment, Poverty, Human Development, Indian Council for Research on International Economic Relations,
Working Paper No. 194.
Austin Ramzy, As China Economy grows, so does labor unrest, Time, June10, 2010
China: Economic slowdown le to job losses and real wage declines. G20 Statistical Update, International Labour Office
Ching-Tong Wu (1987). China’s Special Economic Zones, Five years after: Asian Journal of Public Administration.
Dorothy Guenero (2006). ‘China: Beyond the growth figures’, The Globalist, February 21, 2006. www.theglobalist.com
Edward Wong (2010). ‘As China aids labour, unrest is still rising.’ New York Times, New York Times Co, June 20, 2010.
French (2006): ‘Chinese success story chokes on its own growth’, NewYork Times, New York Times Co, December 19, 2006
George Zhibin Gu, Shenzhen at 25, Asia times online, September27, 2005. www.atimes.com
Goswani, Bhasker(2007): ‘Special Economic Zones-Lessons from China’, In motion magazine,NPC Productions, New York, February14, 2007
Judith Banister, Manufacturing employment in China, Monthly Labor Review, July 2005
King Kai-Sing, James. The Origins and Performance of China’s Special Economic Zones. Asian Journal of Public Administration
Megan Murray. A survey of Special Economic Zones, The University of Iowa Centre for International Finance and Development February 9, 2010 www.uiowa.edu/ifdebook/faq/faq-docs/sez.shtml
Review Paper Special Economic Zones in China

120
Michael Engman, Osamu Onodera and Enrico pinali.23 May 2007 Export processing zones. Past and future roles in Trade and Development OECD Trade policy working paper no 53
Prof Yiming Yuan. A miracle of Development: The evidence from Shenzhen SEZ. China’s Centre for Special Economic Zone Research. Shenzhen University
PUN, N.2005.Made in China: Women Factory workers in a global workplace. Durham: Duke University press; Hong Kong: Hong Kong University Press
Robert J. Rosoff. Beyond codes of conduct, Addressing labor rights problems in China. The China Business Review 03/01/2004
Shanker Gopalakrishnan. Negative Aspects of Special Economic Zones in China. Economic and political weekly, April 28, 2007.
Sherry Tao Kong, ANU. China’s migrant problems: the need for hukou reform East Asia Forum .January 29, 2010
Special Economic Zones. Performance, lessons learned, and implications for zone development. April 2008. FIAS. www.fias.net
Sylview De Murger, Jeffrey Sachs, Wing Thye Woo, Shuming Bao, Gene Chang, Andrew Mellinger (2002). Geography, economic policy and Regional development in China, National Bureau of Economic Research, Working paper 8897, http:// www.nber.org/papers/w8897
Tatsuyuki OTA (2003). The Role of Special Economic Zones in China’s economic development as compared with Asian Export processing zone: 1979-1995, Asia in Extenso. March 2003
Tseun Kweum Yu (2009).An empowerment Approach to female migration: A case study of China’s manufacturing Industry. Development Studies Institute. London School of Economics and Political Working paper series No.06-07 September 2009\
Vivek Arora & Athanasios Vamuakidis, China’s Economic growth; International Spillovers. IMF working paper July 2010 WP/10/165
Wayne M.Morrison. China’s economic conditions, CRS issue Brief for Congress (Congressional Research Service, March17, 2006)
Wong, K Y (1987). China’s Special Economic Zone Experiment: An Appraisal; Geografiska Annaler, Series B, Human Geography, Swedish Society for Anthropology & Geography Stockholm, Vol 69, No1.
Xiaolan Fu (University of Oxford) and Yuning Gao (University of Cambridge). (31/10/2007). Export processing zones in China; A survey. A report submitted to ILO
Xu Dixin. (May-26-2009).China’s Special Economic Zone .BEIJING REVIEW.com.cn www.bjreview.com.cn
Zhang Yansheng, China’s SEZs and Cluster development. Government strategies and policies. Institute for international economic Research. National Development and reform Commission
Zhang Ye. Migrant women workers and the emerging civil society in China. The Asia Foundation www.asiafoundation.org
Koel RoyChoudhury
121SIES Journal of Management, April - August 2010, Vol.7(1)
Review PaperCompetencies and Competency Model-A Brief overview of its Development and Application
Nitin VaziraniNitin Vazirani is Dean-HR,SIES College of Management Studies,[email protected]
AbstractCompetencies and Competency models are today commonly practiced in most of the organizations. There is a strong business case for competencies at work as they lead to significant human resource development that provides organizations with a competitive edge. The case for competency management has grown strong since David Mc Clelland wrote his seminal paper in the year 1973: “Testing for Competence Rather than Intelligence”, which created a stir in the field of industrial psychology. Competencies by themselves are insufficient for performance unless defined in behavioral terms. There is ample evidence that competencies form the base for effective and superior performance. While organizations have used the idea of competencies for over 50 years, the expansion of competency models within the private and now, in public sector has resulted into proliferation of definition, tools, models and application. This paper is a review of the competency literature and an attempt to shed some additional light on the field of competencies and competency models in addition to the advantages and challenges using a competency model in an organization.
Introduction of Competency
Furnham states that though the term competence is new and fashionable, the concept is old. Psychologists interested in personality, individual differences, organizational Behavior and Psychometric have long debated these questions of personality traits, intelligence and other abilities.
In 1973, David C. McClelland, Professor of Psychology at Harvard University and founder of McBer and Company (now part of the Hay Group), wrote a seminal paper: Testing for Competence Rather than Intelligence, which created a stir in the field of industrial psychology. McClelland’s research indicated that although traditional academic aptitude and knowledge content tests were good predictors of academic performance, they seldom predicted outstanding on-the-job performance. McClelland went on to argue that the best predictors of outstanding on-the-job performance were underlying, enduring personal characteristics that he called competencies. Since then, McClelland’s findings have been cross-culturally validated by 30 years of global competency research carried out by McBer and later
SIES Journal of Management, April - August 2010, Vol.7(1): 121-131

122
by the Hay Group. Although different sets of competencies predict success in different roles, there are certain consistent patterns as well. According to McClelland, competencies are best described as an iceberg (as shown in the diagram below) with a person’s knowledge and skills
representing the visible tip of the iceberg, while the underlying and enduring personal characteristics or self concepts, traits and motives (for example, self-confidence, initiative, empathy, achievement orientation, etc.) which represent the larger portion of the iceberg, hidden below the waterline.
Knowledge
Skills
Self-Concepts
Traits
Motives
Recurrent thoughtsthat drive behavior
Attitudes, Values, Self Image
Behavioral demonstration of expertiseInformation that a person
has in a particular area
A general disposition to behave in a certain Way
COMPETENCIES
With the ‘shelf-life’ of knowledge and skills becoming shorter and shorter in today’s ever-changing world, the long enduring, ‘below the water-line’ competencies have a more substantive impact on how effectively an individual performs on the job.
David C. McClelland’s 1973 article deeply influenced both professional and public opinion in which he presented five major themes.(a) Grades in school did not predict
occupational success.(b) Intelligence tests and aptitude tests did
not predict occupational success or other important life outcomes.
(c) Tests and academic performance only predicted job performance because of an underlying relationship with social status.
(d) Such tests were unfair to minorities, and (e) ”Competencies” would be better able to
predict important behaviors than would more traditional tests.
After 18 years Gerald V Bareeett and Robert L Depinet in the year 1973 came out with their paper “A Reconsideration for Testing for competence Rather than for Intelligence,” in which, they argued that though Mc Clelland and his associates believed that Intelligence testing should
Nitin Vazirani

123SIES Journal of Management, April - August 2010, Vol.7(1)
be replaced by competency based training since 18 years, they haven’t been able to produce any professionally acceptable empirical evidence for the same.
The team showed that cognitive ability tests do predict job performance in a wide variety of occupations. Use of cognitive ability tests as part of an assessment center or in combination with standardized personality tests has been shown to provide increased validity in predicting job performance. Similarly they proved that grades do predict occupational success. Intellectual ability and aptitude test predicted occupational success and test results were not an artifact of social status, nor were they unfair to minorities.
Confusion:
Despite the generally accepted distinction in meaning of competence and competency, the terms are still interchangeably used by causing them to mean different things to different people. There are many who wonder if there is a difference between these two terms. The two terms arise from different streams of thought on the concept of fitness at work .They are:-
A Competency which is a description of behaviour and
B Competence which is a description of work tasks or job outputs
In studying the competency area, one is immediately struck by the lack of uniform definitions. There are very few lines of distinction with terms such as competency and competence. People using these terms shape their meaning to fit their own convenience. Zemke interviewed several experts in the field to determine “precisely
what makes a competency” and he captured his findings which remain valid even today
“Competence, competencies, competency models, and competency-based training are all Humpty Dumpty words meaning only what the definer want them to mean. The problem comes not from malice, stupidity or marketing avarice, but instead from some basic procedural and philosophical differences among those racing to define the concept and to set the model for the way the rest of us will use competencies.”
Definition of CompetenciesThe term competencies, competence and competent refer to a state or quality of being able and fit. The English dictionary defines the word competence as the state of being suitably sufficient or fit. The workplace definition of Competency refers to a person’s fitness with reference to his or her job. In the work context competence has two variations that differ in their meaning depending on organsational frame of reference.The definition of competency is one of the most fraught tasks in business research, with little agreement among researchers .After reviewing 337 citations regarding competency studies of managers, Page and Wilson(1994) defined competencies as ‘the skills, abilities, and personal characteristics required by an “effective” or “good” manager’ (1994: 12). The point to note about this definition is the inclusion of directly observable and testable competencies, such as knowledge and skills, and the less assessable competencies related to personal characteristics or personal competencies.The use of the term competency and its meteoric rise to ‘business speak’ is credited
Competencies and Competency Model-A Brief overview of its Development and Application

124
to Richard E. Boyatzis (1982) and his book The Competent Manager. Boyatzis defines competency as ‘an underlying characteristic of a person which results in effective and/ or superior performance in a job’. An underlying characteristic, it is suggested, could include a motive, trait, skill, an aspect of one’s self image or social role, or a body of knowledge. Spencer and Spencer, who furthered Boyatzis’ original work define competency as an ‘underlying characteristic of an individual that is causally related to criterion referenced effective and/or superior performance in a job or situation’ (1993: 9).Competencies are thus underlying characteristics of people that indicate ways of behaving or thinking, which generalizes across a wide range of situations and endure for long periods of time.
There are at least five terms in this definition which require understanding:-1 Knowledge-This refers to information
and learning resting in a person, such as surgeon’s knowledge of Human Anatomy.
2 Skill-This refers to a person’s ability to perform a certain task, such as surgeon’s skill to perform a surgery.
3 Self Concepts and Values-This refers to a persons attitudes ,values and self image .An example is self confidence ,a persons belief that he or she can be successful in a given situation ,such as a surgeons self confidence in carrying out a complex surgery.
4. Traits-Traits refers to physical characteristics and consistent responses to situations or information .Good eyesight is a necessary trait for surgeon,
as is self control is an ability to remain calm under stress.
5. Motives-Motives are emotions, desires, physiological needs or similar impulses that prompt action. For example surgeons with high interpersonal orientation take personal responsibility for working well with other members of the operating team.
Motives and Traits may be termed as initiators what people will do on the job without close supervision.
Competencies and Workplace
Spencer and Spencer (1993) emphasize the point that competencies must be related to performance in the workplace and not what would be desirable to have. The simplest example they provide of relating competencies to performance is the studies they conducted with salespersons where they were able to relate competencies to sales performance.
Unfortunately most jobs do not allow for such accessible criterion measures. This type of competency Spencer and Spencer (1993) argue has practical implications for human resource planning. Knowledge and skill competencies are seen as relatively easy to develop compared to self-concept, traits and motives (personal competencies). They suggest it is more cost effective to select for these competencies while training for knowledge and skills. Many organizations, they argue, hire on the basis of skills and knowledge and assume that good management can instill traits and motives. The converse, they argue, is more cost effective: organizations should select for core motive and trait competencies and
Nitin Vazirani

125SIES Journal of Management, April - August 2010, Vol.7(1)
teach the knowledge and skills required to do specific jobs.
To quote Spencer and Spencer: “In complex jobs, competencies are relatively more important in predicting superior performance than are task-related skills, intelligence, or credentials. This is due to a ‘restricted range effect’. In higher level technical, marketing professional and managerial jobs, almost everyone has an I.Q of 120 or above and an advanced degree from a good University. What distinguish superior performers in these jobs are motivation, interpersonal skills, and political skills, all of which are competencies”
An example of selecting for key personal competencies is provided by Seligman (1991).Seligman established that the competency that differentiated superior insurance salespersons from poor salespersons was the personal characteristic of optimism. Optimistic insurance salespersons explained or rationalized ‘rebuffs’ in ways that meant they would continue making calls to sell insurance. Traditionally, insurance salespersons were selected on the basis of technical insurance knowledge. With turnover at approximately 50 per cent per year recruitment, selection and training were costing Metropolitan Life 75 million dollars a year.The results of Seligman’s intervention proved startling, with turnover cut by half and sales increased by as much as 20 per cent in the first year. Metropolitan Life still includes a test of industry knowledge on the basis that a minimum level of knowledge is still important for any salesperson, the difference being that, in differentiating between two applicants with similar industry-knowledge test scores, the applicant
with the higher score on optimism will have a greater chance of obtaining a position.Competencies at work is however not simply about developing readiness or having the skills, knowledge and attribute to perform. Competence also involves the willingness and desire to perform. These factors are influenced by daily experience at work and the perceived nature of the organization team. Competence thus requires developing skills and knowledge and designing appropriate Competency Models that tie to current roles and anticipate future skill requirement.
Competency Based HRM Models
Typically a model is defined as an imitation or an abstraction from reality that is intended in order to understand and simplify our view of that reality while still capturing its essential characteristics.
A competency model is a descriptive tool that identifies the competencies needed to operate in a specific role within a(n) job, occupation, organization, or industry. Simply stated, a competency model is a behavioral job description that must be defined by each occupational function and each job (Fogg, 1999). Depending on the work and organizational environment, a group of 7 to 9 total competencies are usually required of a particular job and depicted in a competency model (Shippman, 2000).
Dubois in defining competency models states that they provide the adhesion or “glue” that is necessary among the elements of an organizations human resource management system. It means that competency models help organizations take a unified and coordinated approach to designing the human resource management
Competencies and Competency Model-A Brief overview of its Development and Application

126
system, including job designs, hiring, performance management, employee development, career planning or succession planning and compensation system. Therefore, any investment an organization makes in competency model development work has benefits beyond the usefulness of the results for the HRD purposes.
Competency behaviors can bring a common vocabulary and perspective to those operating within an organization or system. A consistency of expectations is understood by each player on an organizational team or within a professional network. This systematic framework is used to convey the desirable behaviors and thinking as one develops individually and professionally, within an organization or across industries
Industry Applications to competency Models
In 2005, Hewitt Associates studied leadership development among 373 U.S. companies, 20 of which were labeled “Top 20 Companies for Leaders.” The standout companies for leaders not only all have leadership competencies in place, but successfully integrate the competencies into succession planning, pay formulas, and performance management. The table below presents the results collected in the study, How the Top 20 Grow Great Leaders.
Table One: Leadership Copmpetency TrendsCompentency - Related Characteristic Top 20
CompaniesOther
Respondents
Companies with Competencies* 100 % 73%
Companies that Integrate Competencices into Succession Planning Process 100% 78%
Companies that Mesaure Leader Performancce Against Competenccice 95 % 69%
Companies that Have Follow-Up Measures to Gauge Progress in Meeting Competencies
90% 65%
Companies that Use Competencies to Determine Long-Term Incentive Pay 65 % 23%
Companies that Use Competencies to Determine Base Pay 60% 30%
Companies that Use Competencies to Determine Annual Incentive Pay 60% 31%
Competency Models thus have the following Advantages:-
1. Enhancement of Recruiting Process-Research reveals that competency models create a more robust hiring process by facilitating the placement of candidates to appropriate opportunities. Companies report improved consistency in their recruiting and talent selection processes when leveraging competencies models.
2. Enhancement of employee Development-A 2004 study profiling best in class competency models notes that the majority of large North American Companies use or are developing competency based HR processes to augment employee and leadership development which gives the following benefits:-
Nitin Vazirani

127SIES Journal of Management, April - August 2010, Vol.7(1)
A Links the development activities to corporate goals.
B Organize areas of talent strengths and weakness.
C Serve as development targets for those who aspire to senior Leadership position {succession planning}
3. Performance Management Enhancement - Literature suggests that competency models bring structure and coherence to the performance management function by standardizing development criteria.
4. Identifying Training needs and Employee Development - Using competency models to target training needs leverages a powerful asset to promote a workforce that is equipped and prepared to succeed. Once the training needs have been identified, it is imperative to address these through a comprehensive learning plan, encompassing a broad perspective that includes multiple learning platforms beyond traditional training.
5 Unification of corporate Culture across Business units-Research reveals that a number of organizations that leverages Leadership Competency models cite the creation of a unified corporate culture as one of the primary drivers for the iniative. The creation of a common culture especially unifies employee in a decentralized corporate environment.
6 Establishment of connectivity through Integration of HR Processes - A competency model can serve as an integrative framework for organizations entire HR system. It can help to align
the HR system vertically with the other HR functions to ensure harmony and consistency across many facets of HR activities that impact human performance.
7. Establishment of clear Expectations for Success-A key driver of leadership competency model implementation is the organizations desire to standards, expectations for success in the leadership role, enabling employees to self manage their standardize performance.
Developing and utilizing competency models has been equated with running a profitable and successful organization through strategic management of the professional talent within the organization. Thus, several private industry organizations have evolved to assist companies and businesses with developing organizational competency models. For example, ITG designs the Right Competency Model that will align jobs, competencies, and learning resources. Batrushollweg International competency model aligns talent with business goals or the strategic focus of an organization. In a sense, an individual’s technical, as well as their personal characteristics and attributes must be a fit with the corporate culture in order to be hired by a particular organization and be successful on the job. Without certain attributes or competencies, the individual is not considered qualified. In other words, possession of these traits is assumed to lead to expected or desired performance.Competency models thus not only help the organizations in providing a “Road map” for the range of behaviour that produce excellent performance but can also provide an important and useful tool to guide
Competencies and Competency Model-A Brief overview of its Development and Application

128
individual development. It describes what it takes for an individual to be a contributor at workplace learning and perform as per desired competency to achieve career success. It is a foundation on which an individual can build career plans and choose to develop a path for himself. It thus gives an answer to the following questions:-A What competencies are likely to be
most important to my current job?B Which competencies will become more
important in the future?C How do I improve upon my competencies
in terms of my performance?
Challenges with Using Competency Models
Competency models have their place in human resources practices and their use can be a method of speaking a similar language among various audiences when discussing work requirements. However, competency models are not the sole solution for every hiring and selection decision or other managerial functions. Cockerill, Hunt, & Schroder, (1995), nor should they be the only tool utilized in meeting education and training needs.Ashworth and Saxton (1990) explain that framing competencies as an outcome can ignore the mental and personal processes that are utilized in developing and exhibiting skills and utilizing knowledge. Some idiosyncratic competencies that can assist a person in being successful in their job or contributing to the competitiveness of an organization may be overlooked if the competency model solely is used to strategically select only staff that fit this model and do not rely on developmental
resources to facilitate acquisition of competencies where a gap exists. Several authors also caution against using competency models for measuring or appraising certain areas of performance and providing developmental feedback based on these assessments. Despite the efforts to assess the competencies associated with personal characteristics, traits and motivation, such competencies are difficult to define and therefore difficult to assess. Such competencies cannot be directly measured in behavioral terms, but more accurately there are behaviors associated with these competencies. Thus, assessments of such competencies are not objective; rather they are based on faulty or interpretable assumptions about behaviors that constitute maturity, flexibility, cooperation, autonomy, and independence, among others. For these competencies, measurements that meet professional standards are needed.
If an organization chooses to integrate competency models throughout their human resources practices (i.e., training and development, selection, and performance and assessment activities), the competency model frameworks developed to describe jobs or occupations and promotional opportunities should be shared with all managers and staff; employee participation in development of a competency model can assist with providing awareness of the model as well as create acceptance (Lucia & Lepsinger, 1999). Resistance to change may be lessened with buy-in from staff and managers. By having the entire organization involved in the development of competency models and defining what certain competencies mean
Nitin Vazirani
129SIES Journal of Management, April - August 2010, Vol.7(1)
for that particular organization, there will be an organizational expectation of what makes the company succeed. For the gaps in competency acquisition, further training and development can be offered and provided to aid in acquisition of the desired skill, knowledge, behavior, trait, etc. Allowance for some less needed or desired competencies should be considered as well to perhaps enrich the talent pool. For occasions when these competencies are not developed, it is likely that inaction or an ineffective behavior may prevent the worker from accomplishing job tasks and organizational goals. While not usually the most cost-effective option for businesses after investing in an employee, it may be most appropriate for the company to re-evaluate the current competencies of an individual and his or her acquisition for learning new and desired competencies based on those competencies required of the organization. With the results of this analysis, the organization and individual can determine the individual’s future within that organization. The employee might benefit far greater in the long run knowing that other organizations within that industry or across industries would be a better career fit.
Conclusion
As noted above, with certain exceptions considered, Competencies and competency models are a viable tool that can be utilized to prepare the current and future workforce and retain skilled incumbent workers to meet the job requirements and other needs of employers. Furthermore, for career exploration and development purposes and during times of job change, whether
by choice or due to market changes, competencies and Competency models are an assistive device for individuals to focus on their current competencies and refocus or enhance their competencies as necessary. With the knowledge and use of the information contained within a competency model and awareness of their individual competency strengths and weaknesses, individuals may manage their future job or career success, navigate their current chosen career pathway, or apply the information to examine new career opportunities.
References:
Ashworth, P.D., & Saxton, J. (1990). On ‘competence.’ Journal of Further and Higher Education, - 27
Batrushollweg International’s model: http://www.batrushollweg.com/ - 23
Boyatzis. R– (1982) The Competent Manager. A model for effective Performance. New York Wiley - 6
Cascio. W.F. (1998) Applied Psychology in Human Resource Management. Englefield Cliffs; N.J. Prentice Hall - 9
Cockerill, T., Hunt, J., & Schroder, H. (1995). Managerial competencies: Fact or fiction? Business Strategy Review. - 26
David C Mc Clelland (1973) Testing for Competence Rather than for Intelligence. American Psychologist - 2
Dubois (1993) Competency Based performance improvement: a strategy for organizational Change .Amherst: HRD- 12
Fogg, CD (1994) .Implementing your strategic plan: How to turn intent into effective action
Competencies and Competency Model-A Brief overview of its Development and Application

130
for sustainable change. New York. American Management Association - 10
Furnham (1970) A question of time Competency, Personnel Management. P. 37 -1
Gerald V Barrett. (1982) A Reconsideration of Testing for competence Rather than for Intelligence. - 3
Hewitt associates. {2005} .Research Highlights: How the top 20 companies Grow Leaders” http:\\was4.hewitt.com\hewitt\resource\rptspubs\subrptspubs\pdf\top-companies-2005.pdf - 14
Karen Tabet, (Feb 2004) .Benchmarking Best Practice Competency Models. HR.com - 18
King. S.B King, M & Rothwell, WJ. (2001) .The complete guide to training delivery: A complete – based approach .New York: American Management Association - 24
Lucia, A. D., & Lepsinger, R. (1999). The art and science of competency models: Pinpointing critical success factors in organizations New York: Pfeiffer - 28
M ontier. R. Alai D. & Kramer. D (2006). Measuring and Evaluating: Competency Models develop top performance. Training and Development. - 17
Marjorie D (2008) Lessons Learned – Using Competency Models to Target Training Needs. Training and Development. - 19
Michelle R Ennis (2008) Competency Models: A review of literature and Role of the employment and Training Administration (ETA) Division of Research and Evaluation. - 21
Page .C and Wilson (1994) Management
Competencies in New Zealand. On the inside looking in. Wellington. Ministry of Commerce. - 5
Patty Grigorgev (2006) Hiring b Competency Models. (2006) The Journal for Quality and Participation. - 16
Richard Montier, David Alai. (2008) “Competency Models: Develops Top Performers.ASTD - 20
Robert M Fulmera and Jay A Conger (April 2004). Identifying Talent. Executive Excellence - 15
Scott Cooper, Eton Lawrence. (1998) Competencies – A Brief overview of Development and Application to Public and Private Sectors. Research directorate Policy, Research and Communications Branch, Public Service Commission of Canada - 13
Seligman. (1991) M, Learned Optimism. New York: Knoff - 8
Shipman, J S Ash; R A (2000) The practice of competency modeling. Personnel Psychology. - 11
Spencer, L.M and Spencer, S.G (1993). Competence at work: Models for superior performance. New York: Wiley - 7
TG’s model: http://competencymodels.net/products/ - 22
William Rothwell (2004) .Mapping the future: Shaping new workplace learning and Performance Competition. ASTD - 25
Zemke (1982) Job Competencies: Can they help you design better training? American Psychologist Training. - 4
Analysis: India’s Organized Retail Sector
Nitin Vazirani

131SIES Journal of Management, April - August 2010, Vol.7(1)
Strengthens into 2008, February 06, 2008; (http://www.tradingmarkets.com/.site/news/Stock%20News/1069201/)
Estimation made by International consulting firm Ernst & Young.
Abercrombie N., Hill S., & Turner B. S. (1994). Dictionary of. London: Penguin.
Hasan M., Issar A., Ojha G., and Singh B. P., ‘The Indian retail bazaar’, published their work in Brand strategy, November 2006, pp. 36-39
Tauber E. M. (1972). Why do people shop? Journal of Marketing, 36 (4), 46-49
Adopted from Visser E. M., Preez R. D., and Noordwyk H. V. (2006). Importance of apparel store image attributes: perceptions of female consumers, SA Journal of Industrial Psychology, 32 (3), 49-62
The researchers assumed the “P” value for Ahmedabad after conducting an pilot survey of the consumers in Ahmedabad.
Competencies and Competency Model-A Brief overview of its Development and Application

132
Impact of Electronic Media on the Language Used for Communication- An Exploratory Study
Sharmila Mohapatra and Vatsala BoseSharmila Mohapatra, is Faculty Business Communication at SIES College of Management Studies.Vatsala Bose is Faculty Marketing at SIES College of Management Studies.
AbstractThe primary difference between human beings and other forms of living beings is the ability to communicate. As mankind has evolved, the way humans communicate has also undergone a change. This change has been phenomenal in the last two decades due primarily to the advents made by the electronic media, more specifically the internet.
It is observed that the language changes, usually slowly, sometimes very rapidly, but in this century, language has shown a transformation. To a large extent this change has been due to the immense impact of the internet and e-mail used for communication.
Keeping the above in the frame of reference, a primary research was conducted on a sample size of 100 students, 20 senior citizens and 30 people from the workforce in Nerul, a satellite township situated east of Mumbai.
Key words: Communication, e-learning, language,
Introduction
Communication is an essential part of human interaction. The benefits of effective communication are many and obvious as they enhance all aspects of our personal and professional lives. So what is communication? If it is so important, how do we ensure that when one person talks to another, that the other person listens and understands? How do we know if the message (or sign) has not only been heard (or read) but also understood? What can be done to limit the opportunities for mistakes and to enhance the effectiveness of communications?
It is a self-evident fact that people speaking different languages can generally not converse at all and even people speaking their own language can misinterpret spoken messages. Many will recall playing games where a message passed through a series of people can become quite unrecognizable from the original message after being re-worded or abbreviated by individuals passing a message one to the other. And the reason these messages become garbled is probably because we probably have too many ways of passing ideas one to another.
SIES Journal of Management, April - August 2010, Vol.7(1): 132-140
133SIES Journal of Management, April - August 2010, Vol.7(1)
For effective communications, when the sender of a message communicates with the intended
recipient, there has to be a correlation between what the sender is thinking about and what the receiver is thinking about. Text or words must therefore be used in a consistent way, and the first requirement for communication is a set of messages that are used consistently.
The essence of communication is sharing, providing data, information, insights in an exchange that benefits both you and the people with whom you are communicating
Effective communication strengthens the connection between the sender and the receiver. Conversely, when communication breaks down, the results can be any thing from wastage of time to catastrophic. The most obvious case in point is the tragic case of the Titanic.
Human communication has several key characteristics.• The process of communication is
continuous, ongoing, and dynamic. • Communication begins with the self. • Communication is irreversible, • Communication is reciprocal. • Communication is unrepeatable. • Communication is transactional. • Communication exists in some kind of
context, or setting.
Human language is unique because it is a symbolic communication system that is learned instead of biologically inherited. Symbols are sounds or things which have meaning given to them by the users. The meaning is arbitrarily assigned. For example, the word “book” does not in any
way physically resemble the object it stands for. An advantage of human language is that it is a learned symbolic communication system that is infinitely flexible.
Meanings can be changed and new symbols can be created. New words are invented daily and the meaning of old ones can change. When people learn new words they do not remember the unique voice qualities when they heard the new words. This allows people to respond linguistically to major environmental, historical, and social changes and able to understand the world better as the years go by.
A language is a systematic means of communication by the use of sounds or conventional symbols. It is the code we all use to express ourselves and communicate to others. It is a communication by word of mouth. It is the mental faculty or power of vocal communication. It is a system for communicating ideas and feelings using sounds, gestures, signs or marks. Any means of communicating ideas, specifically, human speech, the expression of ideas by the voice and sounds articulated by the organs of the throat and mouth is a language. This is a system for communication. A language is the written and spoken methods of combining words to create meaning used by a particular group of people.
Language, so far as we know, is something specific to humans, that is to say it is the basic capacity that distinguishes humans from all other living beings. Language therefore remains potentially a communicative medium capable of expressing ideas and concepts as well as moods, feelings and attitudes.
A set of linguists who based their assumptions of language on psychology made claims that
Impact of Electronic Media on the Language Used for Communication- An Exploratory Study

134
language is nothing but ‘habit formation’. According to them, language is learnt through use, through practice. In their view, ‘the more one is exposed to the use of language, the better one learns’.
Written languages use symbols (characters) to build words. The entire set of words is the language’s vocabulary. The ways in which the words can be meaningfully combined is defined by the language’s syntax and grammar. The actual meaning of words and combinations of words is defined by the language’s semantics.
The Internet and electronic communications (also called computer mediated communications, or CMC) doesn’t just mean new tools for communication; it means new ways to communicate. Today an organization interacts with its various constituents differently - employees, board members, customers, partners and others - depending upon the nature of the message, the goals it is trying to achieve and the strengths (and weaknesses) of the available media - telephones, voice mail, fax machines, print, etc.
The world today has become highly competitive and complex, and the ability to communicate with clarity, confidence and credibility is essential for success. Still, this ability is overlooked rather frequently, and people tend to forget that any logical conclusions, sound reasoning, innovative solutions are rendered meaningless if they’re not communicated in a persuasive, motivational way that inspires the receiver.
Email is now the favourite way of communication all over the world - irrespective of gender, age or color. Many people see the internet as the reason the
email use has boomed all across the globe as a way of communication, but maybe they should look at other factors like the accessibility and availability as well as the practicality of using email service for communication. The latter sounds weightier. The internet gives individuals as well as companies addresses which they can use.
Review of Literature
The electronic media has had far reaching effects on multiple aspects of our lives including the way we use language for communication. Although language has always been changing ( Biesenbach-Lucas and Wiesenforth 2001), due to developments in communication technology, its change has recently accelerated and led to interesting variations in written language use. (Danet 2001) found a tendency toward playfulness in email greetings and concluded that email
communication is more informal in comparison to traditional norms governing the form of official letters. (Trupe 2002) also found an emergent diversity in written communication in terms of word choice and syntax.
In one of the first studies done of non-native speakers communicating in their second language, (Hartford and Bardvi-Harglig 2006) compared the email communications of native and non native speakers in various graduate programs. They discovered that in non-native speaker’s emails there was an overall lack of socio-culturally accepted guidelines. This is most likely due to the fact that online communication requires more than simply language proficiency. It requires users to have an intimate sense of not only how language is used but also to have a
Sharmila Mohapatra and Vatsala Bose

135SIES Journal of Management, April - August 2010, Vol.7(1)
sense of the culturally accepted standards of that language that many native speakers are still not aware of. A circumstance all of us in India are familiar with.
More and more teachers in India are beginning to see creeping abbreviations as part of a continuing assault of technology on formal written English (Lee, 2002). According to Lee, “teachers say that papers are being written with shortened words, improper capitalization and punctuation, and characters like &, $ and @”. However, something that is not always considered is that these mistakes are often unintentional – when students use IM frequently, they reach a saturation point where they no longer notice the IM lingo because they are so used to seeing it say Brown-Owens, Eason, & Lader (2003).
Crystal (2001) says that the impact of the worldwide web on language remains minimal - “When we look at the specific effect of the Internet on language, languages asking the question, has English become a different language as a result of the Internet, the answer has to be no,”. Crystal says linguistic changes caused by the Internet run parallel to changes in the existing lexicon. What we are not seeing is an alteration, but additions to the language.
Statement of the Problem
The standard of the language used in organization, as well as, schools, colleges, work place has steadily declined as a result of the increased effect of the electronic media on our lives. On the other hand the programs and the impact of electronic media have generally received a great deal of appreciation and applause. The
Electronic medium has not only affected the way we read and write English but also has enhanced the increased usage of the indigenous languages.
Objectives
The objective of this study is to ascertain (a) the impact of electronic communication on the written language of students, people in the workforce and senior citizens (b) the perceptions of the target groups about the effect of electronic communication on written language.
Methodology
Secondary ResearchThis includes research articles, journals, answer books of students, emails of workforce and letters received by the researchers.
Primary Research The target population for the student e-mail data collection was the post graduate students of SIES College of Management Studies, Nerul, Navi Mumbai. More than 150 e-mails were sent to the researcher but for the purpose of the study only 100 random e-mails were considered. All 100 students received a reply to their e-mail with the corrections marked in red, along with the teacher’s comments.
The target population of senior citizens for data collection was selected from the family members of faculty at SIES Nerul campus as well as the senior citizens home at Nerul. A total number of 20 senior citizens were interviewed using a questionnaire with a blend of open ended and close ended questions.
Impact of Electronic Media on the Language Used for Communication- An Exploratory Study
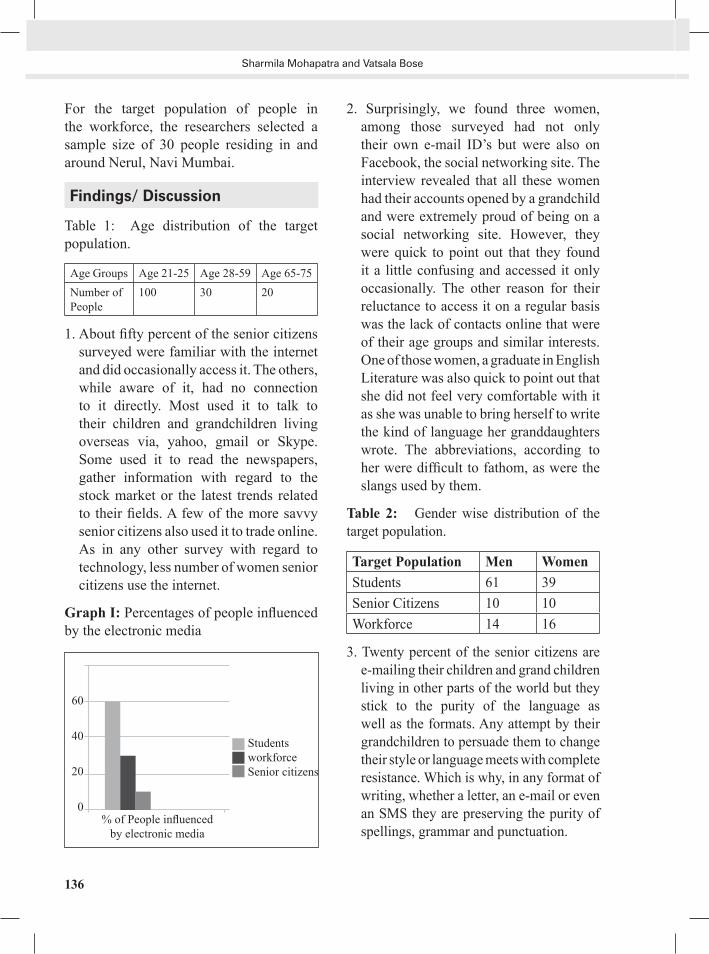
136
For the target population of people in the workforce, the researchers selected a sample size of 30 people residing in and around Nerul, Navi Mumbai.
Findings/ Discussion
Table 1: Age distribution of the target population.
Age Groups Age 21-25 Age 28-59 Age 65-75Number of People
100 30 20
1. About fifty percent of the senior citizens surveyed were familiar with the internet and did occasionally access it. The others, while aware of it, had no connection to it directly. Most used it to talk to their children and grandchildren living overseas via, yahoo, gmail or Skype. Some used it to read the newspapers, gather information with regard to the stock market or the latest trends related to their fields. A few of the more savvy senior citizens also used it to trade online. As in any other survey with regard to technology, less number of women senior citizens use the internet.
Graph I: Percentages of people influenced by the electronic media
2. Surprisingly, we found three women, among those surveyed had not only their own e-mail ID’s but were also on Facebook, the social networking site. The interview revealed that all these women had their accounts opened by a grandchild and were extremely proud of being on a social networking site. However, they were quick to point out that they found it a little confusing and accessed it only occasionally. The other reason for their reluctance to access it on a regular basis was the lack of contacts online that were of their age groups and similar interests. One of those women, a graduate in English Literature was also quick to point out that she did not feel very comfortable with it as she was unable to bring herself to write the kind of language her granddaughters wrote. The abbreviations, according to her were difficult to fathom, as were the slangs used by them.
Table 2: Gender wise distribution of the target population.
Target Population Men WomenStudents 61 39Senior Citizens 10 10Workforce 14 16
3. Twenty percent of the senior citizens are e-mailing their children and grand children living in other parts of the world but they stick to the purity of the language as well as the formats. Any attempt by their grandchildren to persuade them to change their style or language meets with complete resistance. Which is why, in any format of writing, whether a letter, an e-mail or even an SMS they are preserving the purity of spellings, grammar and punctuation.
% of People influenced by electronic media
StudentsworkforceSenior citizens
60
40
20
0
Sharmila Mohapatra and Vatsala Bose

137SIES Journal of Management, April - August 2010, Vol.7(1)
4. Seventy percent of the senior citizens interviewed were of the opinion that correctness of language matters significantly in communication. According to them, not only was it important to get the message across, it was also important how it was achieved. Form mattered significantly. “Butchering” the language was unacceptable to them. Most of the senior citizens were unified in their opinion with regard to the effect these modern media of communication was having on the language of the younger generations. They felt that since achieving perfect understanding is the aim of communication, it ought to be attempted in the perfect manner – keeping the spellings, grammar and punctuation as per the norms established by tradition. Not a single one of them was willing to write using abbreviations such as “asap” for “as soon as possible” or “FYI” for “for your information” as is popular with people in the workforce today.
Graph II: Importance of language in communication for the target population in percentages.
5. Hundred percent of the students surveyed had an e-mail ID and were on at least two
social networking sites, if not more. All of them were of the opinion that written communication should only happen through the electronic medium in view of its speed and ease of use. Instant Messaging (IM) and SMS appear to be the preferred modes of communication. Most of the students seem to be highly influenced by IM and SMS. Less is more. Hundred percent of them preferred to send an e-mail to the researcher in lieu of writing a letter.
6. Approximately fifty percent of the students were unable to recognize a spelling mistake when shown an e-mail with incorrect spellings, even after promptings. Similarly, incorrect forms of address and grammatical structures were also not noted by about fifty percent of the students. An “ i “ in the middle of a sentence appeared to be the norm not only in e-mails but also in all forms of written communication, including answer booklets of examinations.
Table 3: Distribution of types of errors in the e-mails (N= 100)Types FrequencySpelling errors 49Incorrect grammar 51Inappropriate punctuation 35Incorrect capitalization 33
Incorrect salutation 12Use of abbreviations and acronyms 53Lack of paragraphing 24SMS/ IM language 57No signature 03All capitals 03All small letters 02Garbled messages 13Emoticons 14
Senior workforce Students citizens
80706050403020100
YesNo
Impact of Electronic Media on the Language Used for Communication- An Exploratory Study

138
Graph III: Representation of the errors by students in percentages.
7. Eighty percent of the students were of the opinion that the internet and e-mail makes communicating easier as they don’t really have to watch the spellings, grammar or punctuation while writing an e-mail. The language they feel is much more lively and communicative today as compared to the pre-internet era.
8. Sixty percent of the people surveyed amongst the workforce category, felt that correctness of language was important in communication. They however segregated the language used in communication based on context, format and recipient.
9. Most people among working professionals admitted that terms like “FYI”, “PFA”, “BTW”, “FWIW” and “TIA” have made life easier for them by reducing the effort required to type the full forms of these abbreviations in e-mails.
10. About eighty percent of the people surveyed among the workforce were quite aware that they were using abbreviations, incorrect grammar and punctuation while writing an e-mail
but were of the view that this was quite acceptable in the e-mail/ IM format. However, they were extra careful with abbreviations when writing the hard copy of a letter and refrained from using such terminology in letters.
Conclusion
Language and writing always change generationally. The English of Shakespeare’s day was completely different from our everyday speech. Language which is dynamic and alive is prone to change. The internet has brought profound changes not only to the way we speak, write, and spell, but to everything we do....even the way we think. At this point in time, it is not possible to determine the complete extent of the effects of electronic media on formal writing. However, we need to realize that the e-mail and instant messaging are the new and the most popular media of communication and as teachers recognize its impact and significance.
Probably the most important thing that teachers can do is to emphasize to students
SMS/IM
Lack of Paragraphing
Use of abbreviation and
incorrect capitalization
inappropriate punctuation
incorrect grammar
spelling errors
errors
0 10 20 30 40 50 60
Sharmila Mohapatra and Vatsala Bose

139SIES Journal of Management, April - August 2010, Vol.7(1)
the concept of audience. Students need to understand the importance of using the appropriate language in the appropriate setting, and that who one is writing to affects the way in which one writes. For example, IM language is perfectly acceptable when instant messaging with someone. On the other hand it is completely unacceptable when writing a formal letter. The same thing is true of formal writing – it is appropriate in an official document, such as a letter to the Principal of the college, but would be inappropriate in an online chat room. Students have trouble seeing the distinction between formal and informal writing, and consequently use informal IM abbreviations and lingo in more formal writing situations (Brown-Owens, Eason, & Lader, 2003). Our research has also corroborated that. In this scenario, the responsibility of the teachers to emphasize the appropriateness of language and context becomes much more significant.
While this is a study of a small sample size, the researchers having been in the field of teaching for quite a few years are of the opinion that the effect of the electronic medium has had a great impact on the language of communication. Whether this will lead to a new kind of language altogether in a hundred years time remains to be seen. As Derek Walcott said “The English language is nobody’s special property. It is the property of the imagination: it is the property of the language itself”. The language of Shakespeare and Milton’s time changed and so will the language of this century. Maybe it is time for us to follow the Czech proverb - Learn a new language and get a new soul.
References:
Bardovi-Harlig K & Hartford B.S. (2005) Interlanguage Pragmatics: Exploring Institutional Talk,ErlbaumBiesenbach-Lucas, S. & Wiesenforth, D. (2001). “Language Learning and Technology”.Boone Louis, Kurtz David, Block Judy (1994) Contemporary Business Communication, Second EditionBovee Courtland L , Thill John V and Chaturvedi Mukesh (2009) “ Business Communication Today” . Ninth edition . Brown-Owens, A., Eason , M., & Lader, A. (2003). What effect does Computer-Mediated Communication, specifically Instant Messaging, have on 8th grade writing competencies?Crystal David, (2001) “Language and the Internet”, Cambridge University Press.Danet, B. (2001). Cyberplay: Communicating online. Oxford: Berg Publishing.Friess, S. (2003, April 1). ‘Yo, can u plz help me write English?’: Parents fear online chatting ruins kids’ language skills. USA Today, p.D.08.Lesikar Raymond V and Flatley Marie E Rentz Kathryn , Pande Neerja(2008) “Business Communication, Making connections in a Digital World” Eleventh editionSherfiels Robert, Montgomery Rhonda, Moody Patricia (2005) Developing Soft Skills, Fourth edition.
Trupe, A. (2002). “Academic Literacy in a Wired World: Redefining Genres for College Writing Courses”.
Impact of Electronic Media on the Language Used for Communication- An Exploratory Study

140
Dear Contributors...SIES College of Management Studies invites articles for the journal of the institute published since the year 2004. There are so far 7volumes called SIES Journal of Management. This serial publication has an ISSN to its recognition from the 5th Volume onwards.
The Journal is bi-annual in nature. For the Volume 7, Issue 2, April 2011 -August 2011 publication, we call for manuscripts to reach us before 28th Feb 2011.
Manuscripts relevant to general management, marketing, finance, HR, systems, knowledge management, and management strategies are accepted. Issues pertinent to emerging changes in management are most welcome.
The manuscripts should be the original work and not published elsewhere. It could be either conceptual or application oriented. The papers will be initially reviewed by the editorial team, and if accepted would be blind refereed by an external reviewer. After the author’s acceptance and corrections of blind reviewer’s comments, the editorial will accept the paper for publication. The manuscripts could range from 3000 to 5000 words excluding tables, figures and references.
Guidelines for submitting manuscripts:
1. Title page: Title, Author(s)’s name, Designation and Institute of affiliation, contact address, email of first author for correspondence (on page1).
2. Abstract: An abstract of the manuscript in 150 words, followed by key words (on page2).
3. Main page: The manuscript begins from page 3 onwards.
4. References: All references should be in American Psychological Association (APA) style. For more information on the APA format, see http://www.apastyle.org
5. All figures, graphs and tables if they are extracted from excel, a copy of the excel sheet with data sheet should also be attached along wit the word document.
6. Format: Times New Roman font, Font size 12, Paragraph spacing0, Double line spacing, Label: 9 –point, Times New Roman, notes at the end of the manuscript/text, before the references. Any acknowledgements should be enclosed in the notes and must be numbered 1, 2, 3…
7. If there are any graphs, graphic images, it should be in black and white with highest resolution and ownership of the same should be acknowledged in the source.
8. Please enclose a letter stating the below mentioned information
Signature of each author below certifies compliance with the conflict of interest disclosure:
All institutional or corporate affiliations of mine and all funding sources supporting the study are acknowledged. I certify that I have no commercial association that might represent a conflict of interest in connection with the submitted manuscript.
Title of article:Signature of the corresponding author:Name of the corresponding author:Mailing address:Phone:Email:
A brief write up about the authors’ interest areas/expertise/experience.
Suggested Reviewers: National/International reviewers
E-mail your manuscripts to: The Editorial, SIES Journal of Management, SIESCOMS at: journal @siescoms.edu.
Manuscripts submission: A covering letter accompanying the manuscript consisting of the above details should be sent by e-mail attachment or posted at: SIESCOMS, Sri Chandrasekarendra Saraswati Vidyapuram, Plot 1 E, Sector V, Nerul, Navi Mumbai, India, PIN-400 706.


![Corporate Etiquette Sies[1]](https://static.fdocuments.in/doc/165x107/55a557f41a28ab04258b46a5/corporate-etiquette-sies1.jpg)