Download (219Kb) - Open Research Online - The Open University
Open Research OnlineThe Open University’s repository of research publicationsand other research outputs
Same but different, but is it fair? An analysis of the useof variants of interactive computer-marked questionsJournal ItemHow to cite:
Jordan, Sally; Jordan, Helen and Jordan, Richard (2012). Same but different, but is it fair? An analysis ofthe use of variants of interactive computer-marked questions. International Journal of e-Assessment, 2(1)
For guidance on citations see FAQs.
c© 2012 International Journal of eAssessment
Version: Version of Record
Link(s) to article on publisher’s website:http://journals.sfu.ca/ijea/index.php/journal/article/view/28
Copyright and Moral Rights for the articles on this site are retained by the individual authors and/or other copyrightowners. For more information on Open Research Online’s data policy on reuse of materials please consult the policiespage.
oro.open.ac.uk

Authors
S E Jordan, H E Jordan, R S Jordan
Address for correspondence
The Open University (Cambridge Office)
Cintra House
12 Hills Road
Cambridge
CB2 1PF
Email: [email protected]

Same but different, but is it fair? An analysis of the use of variants of interactive computer-marked questions.
Abstract
Different variants of interactive computer-marked questions are used to reduce opportunities for plagiarism, and tools have been developed to indicate when variants are of significantly different difficulty. The tools include the facility index for each variant, a plot of the different scoring patterns for the variants and a probability that any difference could have occurred by chance The paper includes an example of the tools in use and identifies factors that have been found to lead to variants of different difficulty. An investigation into the impact on students’ overall scores is then described, with the conclusion that, for most modules, the effect is very small (typically ±0.5%). Factors leading to a larger effect include: a larger number of individual questions with significantly different variant difficulty; a smaller number of interactive computer-marked questions; and a higher weighting of the e-assessment component. Monitoring the behaviour of variants can lead to improvements in the quality of individual questions, better assessment design and enhanced insight into students’ misunderstandings.
Keywords
Interactive computer-marked questions; variants; question difficulty.
Introduction In addition to enabling instantaneous feedback, scaffolding learning, and providing a cost-effective means for assessing large numbers of students, e-assessment has much to offer in creating assignments that are reliable and free from bias. Computers have been shown to be more reliable and accurate than human markers (Butcher and Jordan 2010), at very least offering offering greater consistency of marking than humans (Read, Francis and Robson 2005) who may be influenced by prior knowledge of students’ capabilities or may subconsciously favour certain students (Black 1998; Orrell 2008).
However it is important to check for any negative impact of the assessment medium itself on reliability, validity and fairness and there have been calls for greater use of statistical measures of reliability and validity in summative e-assessment (Gilbert et al. 2009). Reliability refers to the notion that the outcome of a test should be the same irrespective of when a student takes it, irrespective of who marks it and, if different questions are used to assess the same learning outcome, irrespective of which set of questions the student receives (Black 1998). Validity refers to the notion that an assignment or question tests what its author intended it to assess. Notions of reliability and validity can overlap (Black and Wiliam 2006) and the situation is further complicated by the possibility that questions might be unfair in their impact on different students, thus introducing bias within the questions themselves (Gipps and Murphy 1994). For example, a student from one cultural group may fail to understand a question that is completely clear to a student from another group. These issues are particularly challenging for e-assessment, since ‘with traditional assessment if a question is badly worded the human marker and moderator can ensure that students are treated fairly. But with e-assessment you need to foresee

all the problems up front’ (Gilbert et al. 2009, 31). Some students may be advantaged or disadvantaged simply by the use of e-assessment (Beevers et al. 2010).
Dermo (2010) described an investigation into fairness and reliability when objectively marked questions were randomly selected from an item bank. The advantage of random question selection is that different students receive different tests, reducing opportunities for plagiarism. The challenge is to ensure that the different tests are equivalent (Mackenzie 2003); this is achieved by taking care over the quality and consistency of the items in the bank, and selecting them on the basis of both topic and difficulty. But is this approach fair? Are the different tests really equivalent? Dermo used Rasch analysis (Bond and Fox 2007) to calculate the difficulty rating for each item and thus calculated individual students’ test difficulty indices. He concluded that whilst the actual differences in difficulty of the whole test might be small, the impact on some students in borderline situations could be significant, and he went on to recalculate student scores to account for the level of difficulty of the questions received.
In earlier work, Dermo (2009) highlighted a perception amongst students that e-assessments that select random questions from item banks are unfair. Thus, not only do we need to do everything that we can to make our assessments reliable, valid and fair, we need to convince our students of this fact. Student perception is important in assessment of all types (Holmes and Smith 2003) and a single question that is perceived to be unfair can undermine an otherwise confident and enthusiastic user of e-assessment (Jordan 2011).
Use of question variants at the UK Open University At the UK Open University (OU), tutor-marked assignments (usually submitted and returned electronically) are frequently complemented by interactive computer-marked assignments (iCMAs), written using either the Moodle quiz engine or the ‘OpenMark’ system (Butcher 2008; Jordan 2011). Question types include multiple-choice, multiple-response, drag and drop, hotspot and those requiring free-text entry of numbers, letters, words and sentences. Students are usually allowed multiple attempts at each question, with increasing feedback provided at each attempt and a corresponding decrease in the available mark. In some modules iCMAs have a purely formative role, in others they carry (usually light) summative weighting. This weighting is designed to encourage engagement. However, the mere fact that the ‘mark counts’ means that it becomes necessary both to discourage plagiarism and to ensure that each student receives an assignment of sufficiently equivalent difficulty.
Rather than selecting questions from a data bank, normal practice is to produce at least five, hopefully equivalent, variants of each question. Different students therefore receive different variants of the iCMA, reducing opportunities for plagiarism, particularly important since the assignments are completed on the student’s own computer at home, with only a statement from the student that the submitted work is their own. In formative-only use, the different variants of the questions provide students with extra opportunities to practise.
The provision of a number of pre-determined variants of each question rather than allowing the random generation of numbers and letters at run-time is intended to ensure that the variants are of sufficiently similar difficulty (e.g. by designing all the

correct answers to round up not down to an appropriate number of significant figures). Given the large number of students taking each iCMA (hundreds or thousands per presentation) this approach has the added advantage of enabling robust statistical analysis of each variant. Given that Cizek (1991) found that simply offering identical options in a different order led to significantly different outcomes, it was recognised from the start that exact equivalence would be impossible. However, when questions are being written, efforts are made to ensure that different variants are as similar as possible. Question authors are also encouraged to monitor the use of their questions, to check for any unexpected behaviour.
In training new authors of iCMA questions, the following suggestions are made for ways in which different variants might be created:
• Provide several different data sets. Note that words as well as numbers and symbols can be different, so a runway can become a floorboard or a piece of carpet (Figure 1).
Figure 1. Two variants of the same question.
• Replace letters in algebraic expressions. In the font used for OpenMark, italic ‘z’ looks like a 2 and italic ‘r’ look like ‘v’, so take care if students are required to enter these variables. Similarly, avoid ‘c’ and ‘k’ as they look similar on screen in upper and lower case.

• For multiple-choice and multiple-response questions, provide the options in a different order (to ensure that the variants are of similar difficulty you may like to specify, for example, that the correct option should never be given first).
• For multiple-choice and multiple-response questions, select options from longer lists. You may choose to always show, for example, two statements from a list of correct statements and four incorrect ones.1
Investigating the equivalence of different variants of individual questions Computer-marked assignments (CMAs) have been used throughout the OU’s 40-year history. The original multiple-choice CMA questions were delivered to students on paper; responses were entered on OMR forms and submitted by post. A range of statistical tools has been in operation for many years, enabling module team members to satisfy themselves of the validity of individual questions and whole CMAs; these tools were also designed to improve the quality of future CMAs by enabling question-setters to observe student performance on their previous efforts.
As part of a project2 funded by the Centre for Open Learning of Mathematics, Computer, Science and Technology, the second-named author was employed as a consultant to investigate whether the statistical tools developed for CMAs were also valid for iCMAs, different because of their range of question type, provision of multiple attempts (with relatively complex grading) and inclusion of multiple variants. No reason was found to doubt the validity of any of the existing tools, though the usefulness of some of them was subject to question and the different scoring mechanism for iCMA questions (linked to the provision of multiple attempts) led to changes in the recommended ranges for some of the test statistics.
The project resulted in a range of measures to be used in determining whether different variants of a question are of equivalent difficulty, including:
• The various question-level statistics (facility index, standard deviation, intended and effective weight, discrimination index and discrimination efficiency) are available separately for each variant. These statistics can be useful in indicating, for example, when one variant is more highly scoring than another. However, without further calculation, these statistics do not indicate whether any differences are of statistical significance.
• Plots showing the proportions of students with each score (usually 0, 1, 2 or 3) for each variant (e.g. Figure 2)
• A single figure (a probability p) that allows us to say whether or not there is sufficient evidence to be reasonably sure that there is a real difference between variants. The figure tests the null hypothesis that the chance of scoring 0, 1, 2 or 3 is fixed across the variants. p is the probability that, under this null hypothesis, the number of students achieving each score would be at least as extreme as the actual data. If p is less than some set value, conventionally 0.05, the null hypothesis can be rejected i.e. there is a
1 Authors are warned that this approach might lead to variants of significantly different difficulty. 2 The project is described in more detail at http://www.open.ac.uk/blogs/SallyJordan/?p=426.
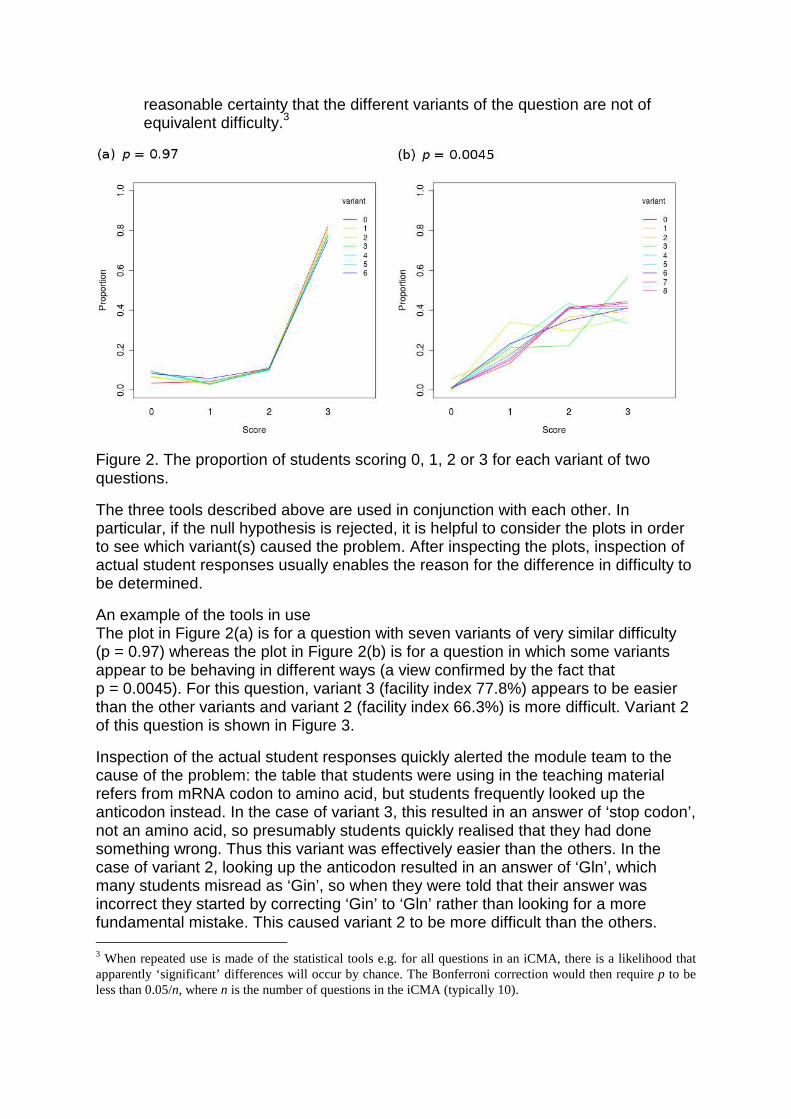
reasonable certainty that the different variants of the question are not of equivalent difficulty.3
Figure 2. The proportion of students scoring 0, 1, 2 or 3 for each variant of two questions.
The three tools described above are used in conjunction with each other. In particular, if the null hypothesis is rejected, it is helpful to consider the plots in order to see which variant(s) caused the problem. After inspecting the plots, inspection of actual student responses usually enables the reason for the difference in difficulty to be determined.
An example of the tools in use The plot in Figure 2(a) is for a question with seven variants of very similar difficulty (p = 0.97) whereas the plot in Figure 2(b) is for a question in which some variants appear to be behaving in different ways (a view confirmed by the fact that p = 0.0045). For this question, variant 3 (facility index 77.8%) appears to be easier than the other variants and variant 2 (facility index 66.3%) is more difficult. Variant 2 of this question is shown in Figure 3.
Inspection of the actual student responses quickly alerted the module team to the cause of the problem: the table that students were using in the teaching material refers from mRNA codon to amino acid, but students frequently looked up the anticodon instead. In the case of variant 3, this resulted in an answer of ‘stop codon’, not an amino acid, so presumably students quickly realised that they had done something wrong. Thus this variant was effectively easier than the others. In the case of variant 2, looking up the anticodon resulted in an answer of ‘Gln’, which many students misread as ‘Gin’, so when they were told that their answer was incorrect they started by correcting ‘Gin’ to ‘Gln’ rather than looking for a more fundamental mistake. This caused variant 2 to be more difficult than the others. 3 When repeated use is made of the statistical tools e.g. for all questions in an iCMA, there is a likelihood that apparently ‘significant’ differences will occur by chance. The Bonferroni correction would then require p to be less than 0.05/n, where n is the number of questions in the iCMA (typically 10).

For subsequent presentations, variants 2 & 3 were removed and, for the remaining variants, targeted feedback was added for answers that give amino acids found by looking up the anticodon rather than the codon.
Figure 3. Variant 2 of the question whose behaviour is shown in Figure 2(b).
Factors leading to variants of non-equivalent difficulty Other factors that can lead to variants having different difficulty include the following:
Numerical questions. In Figure 4, the variant on the left requires students to understand the rules of precedence whilst the variant on the right does not.
Figure 4. Two variants of a simple question. The variant on the left is lower scoring.
Also in numerical questions, when asked to quote an answer to two significant figures, students are much more likely to do this correctly for an answer such as 2.7 than an answer such as 2.0, and variants that require values to be rounded up are more difficult than those that require values to be rounded down.
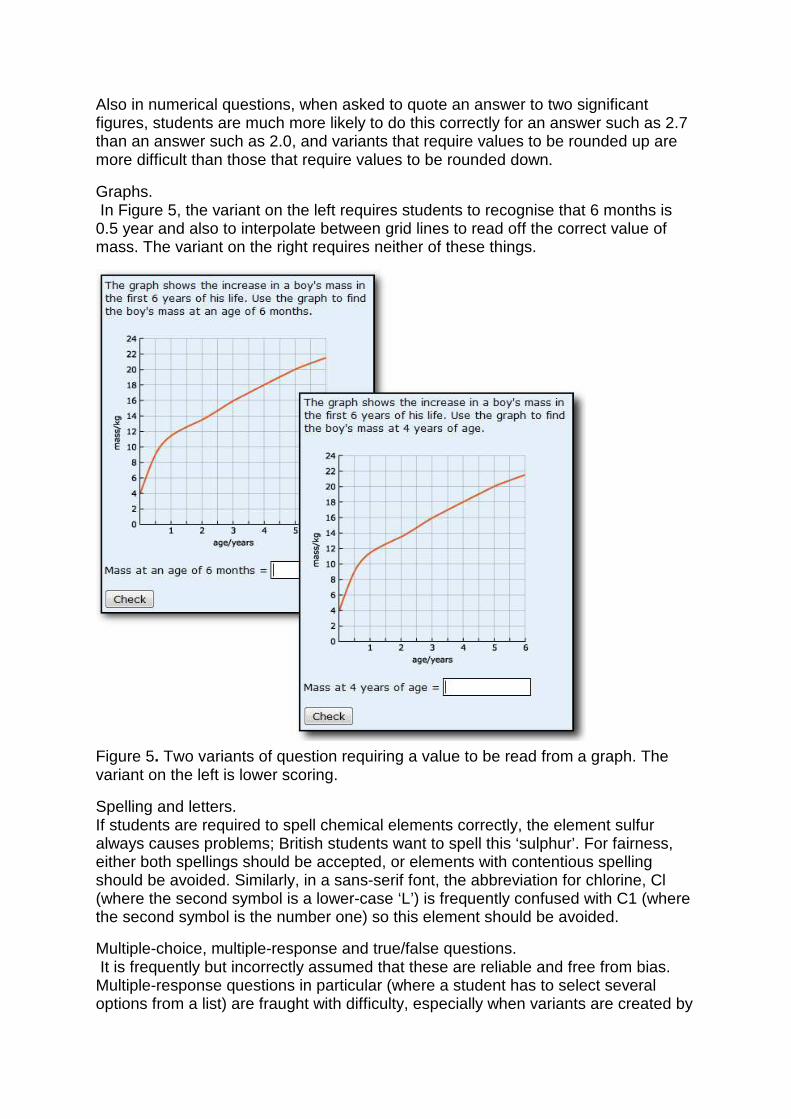
Graphs. In Figure 5, the variant on the left requires students to recognise that 6 months is 0.5 year and also to interpolate between grid lines to read off the correct value of mass. The variant on the right requires neither of these things.
Figure 5. Two variants of question requiring a value to be read from a graph. The variant on the left is lower scoring.
Spelling and letters. If students are required to spell chemical elements correctly, the element sulfur always causes problems; British students want to spell this ‘sulphur’. For fairness, either both spellings should be accepted, or elements with contentious spelling should be avoided. Similarly, in a sans-serif font, the abbreviation for chlorine, Cl (where the second symbol is a lower-case ‘L’) is frequently confused with C1 (where the second symbol is the number one) so this element should be avoided.
Multiple-choice, multiple-response and true/false questions. It is frequently but incorrectly assumed that these are reliable and free from bias. Multiple-response questions in particular (where a student has to select several options from a list) are fraught with difficulty, especially when variants are created by

selecting a specified number of correct and incorrect options from a larger set. It may be that one option has two clear-cut correct options and the others are clearly wrong, whilst another variant has some ‘greyer’ options. It may be that there is one obviously correct option and another two that are ‘grey’; in this instance a student may get the question wrong at the first attempt, but then at second attempt the fully correct answer will be very obvious. It may be that some of the options are effectively opposites, so that if one statement is correct it follows from simple logic that another cannot be. If one variant includes both of these statements then it will be easier than a variant that only includes one of them.
Investigating the impact on individual students’ ov erall scores Although certain variants of an individual question may be easier or more difficult than other variants, when averaged over a whole iCMA, the effect on a student’s score for that iCMA should be small. Similarly, in most modules that use iCMAs, they are used alongside other assessment components and lightly weighted. So even if an iCMA received by a particular student has an overall difficulty that is different from that received by other students, the effect on the student’s overall score should be tiny. But is the effect small enough to ignore, especially for students sitting close to a grade boundary? (Dermo 2010)
Method A preliminary investigation revealed that Rasch analysis is not a valid method to use for estimates of difficulty of iCMA questions. The multiple attempts and feedback (from which – hopefully – students are learning) mean that we cannot assume that student ability is constant, characterised by a single number.
A decision was taken to start by using a simpler approach. We can calculate the mean score for the variant of a question that a particular student answered and compare it with the mean score for the entire question. If, for example, a student answered a variant with a mean score of 2.1, but the mean score for the whole question was 2.4, then we might conjecture that the student who answered that variant had, on average, been disadvantaged by 2.4 − 2.1 = 0.3 marks. This process was repeated for all the questions answered by an individual student and the amounts by which the student had been advantaged or disadvantaged were summed and weighted appropriately to give a total advantage or disadvantage for the overall continuous assessment score. Histograms were plotted to show the total advantage/disadvantage for all the students on the module.
Results For most of the modules considered, the calculated variation in overall score as a result of different variant difficulty was very small. For example, as shown in Figure 6(a), for 1508 students on one presentation of Module A, the calculated variation in overall score was less than ±0.5%. Given that the work of students in a borderline status is reviewed by the Examination and Assessment Board, it is reasonable to conclude that this variation is acceptable, especially if information about the difficulty of variants received is available to the Examination and Assessment Board. However, very occasionally, a more worrying effect was observed. Figure 6(b) shows the worst case; for 362 students on one presentation of Module B, the calculated variation in overall score was about ±5%.

Figure 6. The variation in overall score (for two modules) that could be attributed to differences between variants of iCMA questions.
A range of factors contributed to the overall difference in the results for Module A and Module B:
• The proportion of questions with significantly different variant difficulty was higher for Module B than for Module A. Note that Module B’s iCMAs contain many multiple response and true/false questions; Module A’s iCMAs include more questions requiring free-text entry.
• Each iCMA for Module A contains more questions than each iCMA in Module B, leading to substantially more iCMA questions throughout the module. (Module A is a 60-credit module whilst Module B is only a 15-credit module.) The effect of differences in difficulty between variants of individual questions can be minimised by including a large number of questions. Module A uses a total of 105 questions per presentation.
• The overall weighting of the iCMA component towards total module score is greater for Module B than for Module A.
Discussion and overall conclusions ‘By now it should be clear that there is no such thing as a fair test, nor could there be: the situation is too complex and the notion simplistic. However … we can begin to work towards tests that are more fair…’ (Gipps & Murphy 1994, 273-274)
The above quotation does not refer to e-assessment specifically, but is a more general plea to improve the equity of the assessment process for all students. It must be remembered that the variation in grading between human markers is typically at least as great as that found by this investigation, even in the worst-case example of Module B. However there is a philosophical difference between a variation in the grading of a student’s answer to the same question and students receiving fundamentally different questions in the first place. We have a duty of care to consider and seek to improve the quality and fairness of all aspects of the assessment process. Considering the different behaviour of variants of an iCMA

question can lead to improvements in all variants e.g. when a particular student misunderstanding is revealed and targeted feedback added. In addition, improved understanding of what students do wrong can lead to improvements in the quality of teaching.
What action, if any, should we be taking to compensate students who receive a combination of iCMA questions that are calculated to be lower scoring than the average? A concern in taking any action is that not all students are equally disadvantaged by ‘difficult’ questions nor equally advantaged by ‘easy’ questions. In addition to the fact that some students will find an ‘easy’ variant difficult and vice versa, there is the problem that is best explained by considering the case of a student who has scored full marks even though they received a ‘difficult’ variant. Clearly this student was not disadvantaged at all. Similarly, a student who scored zero despite receiving an ‘easy’ variant was not advantaged by this. Now consider the case of a student who received an ‘easy’ variant and got full marks. Is it reasonable to penalise them just because the variant was ‘easy’? This particular student may (or may not) have scored full marks even if they received a ‘difficult’ variant.
Appropriate action is perhaps best limited to informing examination boards when a borderline student has received a batch of questions of greater than average difficulty and, perhaps more importantly, amending individual variants of individual questions for the future – and in the process learning more about the design of effective and equitable questions and assignments. Thus we end up improving the quality of our assessment (Dermo 2010).
Wider applicability The use of variants of individual e-assessment questions provides a method for creating assignments that test the same learning outcomes and have similar difficulty, whilst being sufficiently different in detail to discourage collusion. This is important even when e-assessment is used in invigilated conditions, since not all students may be able to take the test at the same time (for example, there may be too many students to fit into a computer suite). When used formatively, variants of questions also provide opportunities for additional practice.
In summative use, supposedly equivalent questions must indeed be of similar difficulty. This paper has suggested some factors to take into account when writing e-assessment questions, to increase the likelihood of questions behaving in a similar way. However there is no substitute for monitoring the use of your own questions. This will pay rich dividends, since not only will you be able to make your assessment fairer to all, and to be able to reassure all stakeholders of this fact, but you will also be able to improve the quality of existing questions and to improve question authors’ question-writing skills for the future.
This paper has also suggested a number of tools that can be used for checking the comparability of different variants. Three separate indicators (the facility index for each variant, a plot of the different scoring patterns for the variants and a probability that any difference could have occurred by chance) have been shown to work extremely efficiently in combination with each other. However, for such tools to be useful, there must be a relatively small number of fixed variants of each question, each received by a relatively large number of students.

It is increasingly recognised that the authoring of high-quality e-assessment questions requires both skill and time (Boyle and Hutchison 2009) and front-loads the assessment cycle (Bull and Danson 2004). However, the front-loading is not complete; time needs to be allowed to monitor the behaviour of e-assessment questions once they are in use and resource needs to be set aside to make changes when problems are identified. The outcome can be a high-quality product that will assess and support students, and be confidently received by them, for years to come.
Acknowledgements The work described in this paper was partially funded by the Centre for Open, Learning of Mathematics, Science, Computing and Technology and this funding is gratefully acknowledged, as is the invaluable assistance of a number of colleagues, especially Phil Butcher, Spencer Harben and Michael Isherwood.
References Beevers, C. et al. 2010. What can e-assessment do for learning and teaching. Part 1 of a draft of current and emerging practice : review by the E-Assessment Association Expert Panel (presented by John Winkley of AlphaPlus on behalf of the panel). In Proceedings of the International Computer Assisted Assessment (CAA) Conference, 20th-21st July 2010. Southampton: University of Southampton.
Black, P. 1998. Testing : Friend or foe? Theory and practice of assessment and testing. London: Falmer Press.
Black, P. and D. Wiliam. 2006. The reliability of assessments. In Assessment and Learning ed. J. Gardner, 119−31. London: Sage.
Bond, T. and C. Fox. 2007. Applying the Rasch Model : Fundamental measurement in the human sciences. 2nd ed. Mahweh, NJ : Lawrence Erlbaum Associates.
Boyle, A. and D. Hutchison. 2009. Sophisticated tasks in e-assessment: what are they and what are their benefits? Assessment & Evaluation in Higher Education 34 (3): 305−19.
Bull, J. and M. Danson. 2004. Computer-aided assessment (CAA). York: LTSN Generic Centre.
Butcher, P.G. 2008. Online assessment at the Open University using open source software: Moodle, OpenMark and more. In Proceedings of the 12th International Computer Assisted Assessment (CAA) Conference, 8th-9th July 2008. Loughborough: Loughborough University.
Butcher, P.G. and S.E. Jordan. 2010. A comparison of human and computer marking of short free-text student responses. Computers and Education 55: 489−99
Cizek, G.J. 1991. The effect of altering the position of options in a multiple-choice examination. A paper presented at the Annual Meeting of the National Council on Measurement in Education, Chicago, Il, April 4-6 1991. Educational Resources Document Reproduction Service (ERIC) #ED333024.
Dermo, J. 2009. e-Assessment and the student learning experience: a survey of student perceptions of e-assessment. British Journal of Educational Technology 40 (2): 203−14.

Dermo, J. 2010. In search of OSIRIS : random item selection, fairness and defensibility in high-stakes e-assessment. In Proceedings of the International Computer Assisted Assessment (CAA) Conference, 20th-21st July 2010. Southampton: University of Southampton.
Gilbert, L., V. Gale, B. Warburton and G. Wills. 2009. Report on summative e-assessment quality (REAQ). Southampton: University of Southampton.
Gipps, C. and P. Murphy, P. 1994. A fair test? Assessment, achievement and equity. Buckingham: Open University Press.
Holmes, L. and L. Smith. 2003. Student evaluation of faculty grading methods. Journal of Education for Business 79 (6): 318−23.
Jordan, S. 2011. Using interactive computer-based assessment to support beginning distance learners of science. Open Learning 26 (2): 151−68.
Mackenzie, D. 2003. Assessment for e-learning: what are the features of an ideal e-assessment system? In Proceedings of the 7th International Computer Assisted Assessment (CAA) Conference, 8th-9th July 2003. Loughborough: Loughborough University.
Orrell, J. 2008. Assessment beyond belief : the cognitive process of grading. In Balancing dilemmas in assessment and learning in contemporary education ed. A. Havnes and L. McDowell, 251−63. London: Routledge.
Read, B., B. Francis and J. Robson, J. 2005. Gender, bias, assessment and feedback: analyzing the written assessment of undergraduate history essays. Assessment & Evaluation in Higher Education 30 (3): 241−60.