
DOTA: A Large-scale Dataset for Object Detection in Aerial ... · DOTA: A Large-scale Dataset for...
10
DOTA: A Large-scale Dataset for Object Detection in Aerial Images * Gui-Song Xia 1† , Xiang Bai 2† , Jian Ding 1 , Zhen Zhu 2 , Serge Belongie 3 , Jiebo Luo 4 , Mihai Datcu 5 , Marcello Pelillo 6 , Liangpei Zhang 1 1 Wuhan University, 2 Huazhong Univ. Sci. and Tech. 3 Cornell University, 4 Rochester University, 5 German Aerospace Center (DLR), 6 University of Venice {guisong.xia, jian.ding, zlp62}@whu.edu.cn, {xbai, zzhu}@hust.edu.cn [email protected], [email protected], [email protected], [email protected] Abstract Object detection is an important and challenging prob- lem in computer vision. Although the past decade has witnessed major advances in object detection in natural scenes, such successes have been slow to aerial imagery, not only because of the huge variation in the scale, orien- tation and shape of the object instances on the earth’s sur- face, but also due to the scarcity of well-annotated datasets of objects in aerial scenes. To advance object detection re- search in Earth Vision, also known as Earth Observation and Remote Sensing, we introduce a large-scale Dataset for Object deTection in Aerial images (DOTA). To this end, we collect 2806 aerial images from different sensors and plat- forms. Each image is of the size about 4000 × 4000 pix- els and contains objects exhibiting a wide variety of scales, orientations, and shapes. These DOTA images are then an- notated by experts in aerial image interpretation using 15 common object categories. The fully annotated DOTA im- ages contains 188, 282 instances, each of which is labeled by an arbitrary (8 d.o.f.) quadrilateral. To build a baseline for object detection in Earth Vision, we evaluate state-of- the-art object detection algorithms on DOTA. Experiments demonstrate that DOTA well represents real Earth Vision applications and are quite challenging. 1. Introduction Object detection in Earth Vision refers to localizing ob- jects of interest (e.g., vehicles, airplanes) on the earth’s sur- face and predicting their categories. In contrast to conven- tional object detection datasets, where objects are gener- ally oriented upward due to gravity, the object instances in aerial images often appear with arbitrary orientations, as il- lustrated in Fig. 1, depending on the perspective of the Earth Vision platforms. * DOTA website is https://captain-whu.github.io/DOTA. † Equal contribution (b) (d) (c) (a) ship harbor car roundabout #Instances #Instances (e) (f) #pixels radians Figure 1: An example taken from DOTA. (a) Typical im- age in DOTA consisting of many instances across multiple categories. (b) Illustration of the variety in instance orien- tation and size. (c),(d) Illustration of sparse instances and crowded instances, respectively. Here we show four out of fifteen of the possible categories in DOTA. Examples shown in (b),(c),(d) are cropped from source image (a). The his- tograms (e),(f) exhibit the distribution of instances with re- spect to size and orientation in DOTA. Extensive studies have been devoted to object detection in aerial images [24, 15, 18, 3, 20, 39, 19, 32, 31, 22], drawing upon recent advances in Computer Vision and ac- counting for the high demands of Earth Vision applications. Most of these methods [39, 19, 32, 3] attempt to transfer ob- ject detection algorithms developed for natural scenes to the aerial image domain. Recently, driven by the successes of deep learning-based algorithms for object detection, Earth
Transcript of DOTA: A Large-scale Dataset for Object Detection in Aerial ... · DOTA: A Large-scale Dataset for...

DOTA: A Large-scale Dataset for Object Detection in Aerial Images∗
Gui-Song Xia1†, Xiang Bai2†, Jian Ding1, Zhen Zhu2, Serge Belongie3,
Jiebo Luo4, Mihai Datcu5, Marcello Pelillo6, Liangpei Zhang1
1Wuhan University, 2Huazhong Univ. Sci. and Tech. 3Cornell University,4Rochester University, 5German Aerospace Center (DLR), 6University of Venice
{guisong.xia, jian.ding, zlp62}@whu.edu.cn, {xbai, zzhu}@hust.edu.cn
[email protected], [email protected], [email protected], [email protected]
Abstract
Object detection is an important and challenging prob-
lem in computer vision. Although the past decade has
witnessed major advances in object detection in natural
scenes, such successes have been slow to aerial imagery,
not only because of the huge variation in the scale, orien-
tation and shape of the object instances on the earth’s sur-
face, but also due to the scarcity of well-annotated datasets
of objects in aerial scenes. To advance object detection re-
search in Earth Vision, also known as Earth Observation
and Remote Sensing, we introduce a large-scale Dataset for
Object deTection in Aerial images (DOTA). To this end, we
collect 2806 aerial images from different sensors and plat-
forms. Each image is of the size about 4000 × 4000 pix-
els and contains objects exhibiting a wide variety of scales,
orientations, and shapes. These DOTA images are then an-
notated by experts in aerial image interpretation using 15common object categories. The fully annotated DOTA im-
ages contains 188, 282 instances, each of which is labeled
by an arbitrary (8 d.o.f.) quadrilateral. To build a baseline
for object detection in Earth Vision, we evaluate state-of-
the-art object detection algorithms on DOTA. Experiments
demonstrate that DOTA well represents real Earth Vision
applications and are quite challenging.
1. Introduction
Object detection in Earth Vision refers to localizing ob-
jects of interest (e.g., vehicles, airplanes) on the earth’s sur-
face and predicting their categories. In contrast to conven-
tional object detection datasets, where objects are gener-
ally oriented upward due to gravity, the object instances in
aerial images often appear with arbitrary orientations, as il-
lustrated in Fig. 1, depending on the perspective of the Earth
Vision platforms.
∗DOTA website is https://captain-whu.github.io/DOTA.†Equal contribution
(b) (d)(c)
(a)
ship harborcar roundabout
#In
sta
nce
s#
Inst
ance
s (e)
(f)#pixels
radians
Figure 1: An example taken from DOTA. (a) Typical im-
age in DOTA consisting of many instances across multiple
categories. (b) Illustration of the variety in instance orien-
tation and size. (c),(d) Illustration of sparse instances and
crowded instances, respectively. Here we show four out of
fifteen of the possible categories in DOTA. Examples shown
in (b),(c),(d) are cropped from source image (a). The his-
tograms (e),(f) exhibit the distribution of instances with re-
spect to size and orientation in DOTA.
Extensive studies have been devoted to object detection
in aerial images [24, 15, 18, 3, 20, 39, 19, 32, 31, 22],
drawing upon recent advances in Computer Vision and ac-
counting for the high demands of Earth Vision applications.
Most of these methods [39, 19, 32, 3] attempt to transfer ob-
ject detection algorithms developed for natural scenes to the
aerial image domain. Recently, driven by the successes of
deep learning-based algorithms for object detection, Earth
Vision researchers have pursued approaches based on fine-
tuning networks pre-trained on large-scale image datasets
(e.g., ImageNet [6] and MSCOCO [14]) for detection in the
aerial domain, see e.g. [19, 30, 2, 3].
While such fine-tuning based approaches are a reason-
able avenue to explore, images such as Fig. 1 reveals that
the task of object detection in aerial images is distinguished
from the conventional object detection task:
- The scale variations of object instances in aerial im-
ages are huge. This is not only because of the spatial
resolutions of sensors, but also due to the size varia-
tions inside the same object category.
- Many small object instances are crowded in aerial im-
ages, for example, the ships in a harbor and the vehi-
cles in a parking lot, as illustrated in Fig. 1. Moreover,
the frequencies of instances in aerial images are un-
balanced, for instance, some small-size (e.g. 1k × 1k)
images contain 1900 instances, while some large-size
images (e.g. 4k × 4k) may contain only a handful of
small instances.
- Objects in aerial images often appear in arbitrary ori-
entations. There are also some instances with an ex-
tremely large aspect ratio, such as a bridge.
Besides these difficulties, the studies of object detection
in Earth Vision are also challenged by the dataset bias prob-
lem [29], i.e. the degree of generalizability across datasets
is often low. To alleviate such biases, the dataset should be
annotated to reflect the demands of real world applications.
Therefore, it is not surprising that the object detectors
learned from natural images are not suitable for aerial im-
ages. However, existing annotated datasets for object detec-
tion in aerial images, such as UCAS-AOD [41] and NWPU
VHR-10 [2], tend to use images in ideal conditions (clear
backgrounds and without densely distributed instances),
which cannot adequately reflect the problem complexity.
To advance the object detection research in Earth Vision,
this paper introduces a large-scale Dataset for Object de-
Tection in Aerial images (DOTA). We collect 2806 aerial
images from different sensors and platforms with crowd-
sourcing. Each image is of the size about 4k × 4k pix-
els and contains objects of different scales, orientations and
shapes. These DOTA images are annotated by experts in
aerial image interpretation, with respect to 15 common ob-
ject categories. The fully annotated DOTA dataset contains
188,282 instances, each of which is labeled by an arbitrary
quadrilateral, instead of an axis-aligned bounding box, as is
typically used for object annotation in natural scenes. The
main contributions of this work are:
- To our knowledge, DOTA is the largest annotated ob-
ject dataset with a wide variety of categories in Earth
Vision.1 It can be used to develop and evaluate object
1The DIUx xView Detection Challenge with more categories and in-
stances opened in Feb. 2018: http://xviewdataset.org
detectors in aerial images. We will continue to update
DOTA, to grow in size and scope and to reflect evolv-
ing real world conditions.
- We also benchmark state-of-the-art object detection al-
gorithms on DOTA, which can be used as the baseline
for future algorithm development.
In addition to advancing object detection studies in Earth
Vision, DOTA will also pose interesting algorithmic ques-
tions to conventional object detection in computer vision.
2. Motivations
Datasets have played an important role in data-driven re-
search in recent years [36, 6, 14, 40, 38, 33]. Large datasets
like MSCOCO [14] are instrumental in promoting object
detection and image captioning research. When it comes to
the classification task and scene recognition task, the same
is true for ImageNet [6] and Places [40], respectively.
However, in aerial object detection, a dataset resembling
MSCOCO and ImageNet both in terms of image number
and detailed annotations has been missing, which becomes
one of the main obstacles to the research in Earth Vision,
especially for developing deep learning-based algorithms.
Aerial object detection is extremely helpful for remote ob-
ject tracking and unmanned driving. Therefore, a large-
scale and challenging aerial object detection benchmark,
being as close as possible to real-world applications, is im-
perative for promoting research in this field.
We argue that a good aerial image dataset should possess
four properties, namely, 1) a large number of images, 2)
many instances per categories, 3) properly oriented object
annotation, and 4) many different classes of objects, which
make it approach to real-world applications. However, ex-
isting aerial image datasets [41, 18, 16, 25] share in com-
mon several shortcomings: insufficient data and classes,
lack of detailed annotations, as well as low image resolu-
tion. Moreover, their complexity is inadequate to be con-
sidered as a reflection of the real world.
Datasets like TAS [9], VEDAI [25], COWC [21]
and DLR 3K Munich Vehicle [16] only focus on vehi-
cles. UCAS-AOD [41] contains vehicles and planes while
HRSC2016 [18] only contains ships even though fine-
grained category information are given. All these datasets
are short in the number of classes, which restricts their
applicabilities to complicated scenes. In contrast, NWPU
VHR-10 [2] is composed of ten different classes of objects
while its total number of instances is only around 3000. De-
tailed comparisons of these existing datasets are shown in
Tab. 1. Compared to these aerial datasets, as we shall see
in Section 4, DOTA is challenging for its tremendous object
instances, arbitrary but well-distributed orientations, vari-
ous categories and complicated aerial scenes. Moreover,
scenes in DOTA is in coincidence with natural scenes, so
DOTA is more helpful for real-world applications.

Dataset Annotation way #main categories #Instances #Images Image width
NWPU VHR-10 [2] horizontal BB 10 3651 800 ∼1000
SZTAKI-INRIA [1] oriented BB 1 665 9 ∼800
TAS [9] horizontal BB 1 1319 30 792
COWC [21] one dot 1 32716 53 2000∼19,000
VEDAI [25] oriented BB 3 2950 1268 512, 1024
UCAS-AOD [41] oriented BB 2 14,596 1510 ∼1000
HRSC2016 [18] oriented BB 1 2976 1061 ∼1100
3K Vehicle Detection [16] oriented BB 2 14,235 20 5616
DOTA oriented BB 14 188,282 2806 800∼4000
Table 1: Comparison among DOTA and object detection datasets in aerial images. BB is short for bounding box. One-dot
refers to annotations with only the center coordinates of an instance provided. Fine-grained categories are not taken into
account. For example, DOTA consists of 15 different categories but only 14 main categories, because small vehicle and large
vehicle are both sub-categories of vehicle.
When it comes to general objects datasets, ImageNet and
MSCOCO are favored due to the large number of images,
many categories and detailed annotations. ImageNet has
the largest number of images among all object detection
datasets. However, the average number of instances per im-
age is far smaller than MSCOCO and our DOTA, plus the
limitations of its clean backgrounds and carefully selected
scenes. Images in DOTA contain an extremely large number
of object instances, some of which have more than 1,000 in-
stances. PASCAL VOC Dataset [7] is similar to ImageNet
in instances per image and scenes but the inadequate num-
ber of images makes it unsuitable to handle most detection
needs. Our DOTA resembles MSCOCO in terms of the in-
stance numbers and scene types, but DOTA’s categories are
not as many as MSCOCO because objects which can be
seen clearly in aerial images are quite limited.
Besides, what makes DOTA unique among the above
mentioned large-scale general object detection benchmarks
is that the objects in DOTA are annotated with properly ori-
ented bounding boxes (OBB for short). OBB can better
enclose the objects and differentiate crowded objects from
each other. The benefits of annotating objects in aerial im-
ages with OBB are further described in Section 3. We draw
a comparison among DOTA, PASCAL VOC, ImageNet and
MSCOCO to show the differences in Tab. 2.
Dataset CategoryImage
quantity
BBox
quantity
Avg. BBox
quantity
PASCAL VOC
(07++12)20 21,503 62,199 2.89
MSCOCO
(2014 trainval)80 123,287 886,266 7.19
ImageNet
(2017train)200 349,319 478,806 1.37
DOTA 15 2,806 188,282 67.10
Table 2: Comparison among DOTA and other general ob-
ject detection datasets. BBox is short for bounding boxes,
Avg. BBox quantity indicates average bounding box quan-
tity per image. Note that for the average number of in-
stances per image, DOTA surpasses other datasets hugely.
3. Annotation of DOTA
3.1. Images collection
In aerial images, the resolution and variety of sensors be-
ing used are factors to produce dataset biases [5]. To elim-
inate the biases, images in our dataset are collected from
multiple sensors and platforms (e.g. Google Earth) with
multiple resolutions. To increase the diversity of data, we
collect images shot in multiple cities carefully chosen by
experts in aerial image interpretation. We record the exact
geographical coordinates of the location and capture time of
each image to ensure there are no duplicate images.
3.2. Category selection
Fifteen categories are chosen and annotated in our DOTA
dataset, including plane, ship, storage tank, baseball dia-
mond, tennis court, swimming pool, ground track field, har-
bor, bridge, large vehicle, small vehicle, helicopter, round-
about, soccer ball field and basketball court.
The categories are selected by experts in aerial image in-
terpretation according to whether a kind of objects is com-
mon and its value for real-world applications. The first
10 categories are common in the existing datasets, e.g.,
[16, 2, 41, 21], We keep them all except that we further
split vehicle into large ones and small ones because there
is obvious difference between these two sub-categories in
aerial images. Others are added mainly from the values in
real applications. For example, we select helicopter con-
sidering that moving objects are of significant importance
in aerial images. Roundabout is chosen because it plays an
important role in roadway analysis.
It is worth discussing whether to take “stuff” categories
into account. There are usually no clear definitions for the
”stuff” categories (e.g. harbor, airport, parking lot), as is
shown in the SUN dataset [34]. However, the context in-
formation provided by them may be helpful for detection.
We only adopt the harbor category because its border is rela-
tively easy to define and there are abundant harbor instances
in our image sources. Soccer field is another new category
in DOTA.
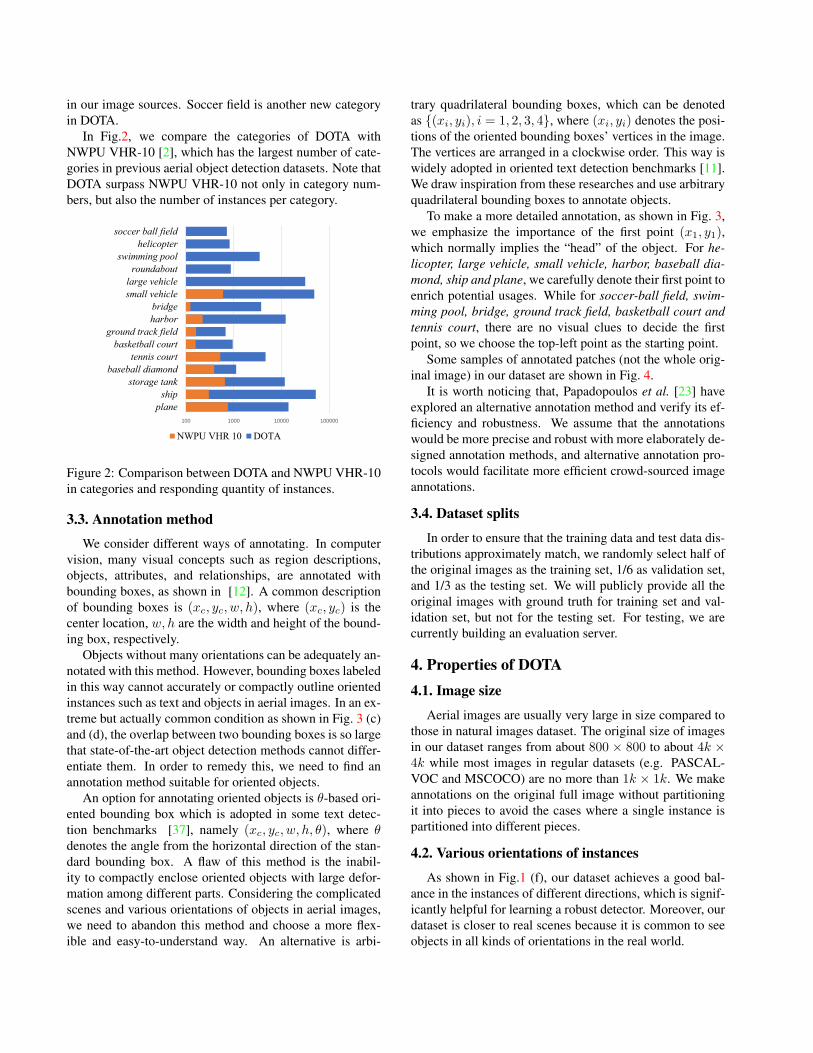
In Fig.2, we compare the categories of DOTA with
NWPU VHR-10 [2], which has the largest number of cate-
gories in previous aerial object detection datasets. Note that
DOTA surpass NWPU VHR-10 not only in category num-
bers, but also the number of instances per category.
100 1000 10000 100000
plane
ship
storage tank
baseball diamond
tennis court
basketball court
ground track field
harbor
bridge
small vehicle
large vehicle
roundabout
swimming pool
helicopter
soccer ball field
NWPU VHR 10 DOTA
Figure 2: Comparison between DOTA and NWPU VHR-10
in categories and responding quantity of instances.
3.3. Annotation method
We consider different ways of annotating. In computer
vision, many visual concepts such as region descriptions,
objects, attributes, and relationships, are annotated with
bounding boxes, as shown in [12]. A common description
of bounding boxes is (xc, yc, w, h), where (xc, yc) is the
center location, w, h are the width and height of the bound-
ing box, respectively.
Objects without many orientations can be adequately an-
notated with this method. However, bounding boxes labeled
in this way cannot accurately or compactly outline oriented
instances such as text and objects in aerial images. In an ex-
treme but actually common condition as shown in Fig. 3 (c)
and (d), the overlap between two bounding boxes is so large
that state-of-the-art object detection methods cannot differ-
entiate them. In order to remedy this, we need to find an
annotation method suitable for oriented objects.
An option for annotating oriented objects is θ-based ori-
ented bounding box which is adopted in some text detec-
tion benchmarks [37], namely (xc, yc, w, h, θ), where θdenotes the angle from the horizontal direction of the stan-
dard bounding box. A flaw of this method is the inabil-
ity to compactly enclose oriented objects with large defor-
mation among different parts. Considering the complicated
scenes and various orientations of objects in aerial images,
we need to abandon this method and choose a more flex-
ible and easy-to-understand way. An alternative is arbi-
trary quadrilateral bounding boxes, which can be denoted
as {(xi, yi), i = 1, 2, 3, 4}, where (xi, yi) denotes the posi-
tions of the oriented bounding boxes’ vertices in the image.
The vertices are arranged in a clockwise order. This way is
widely adopted in oriented text detection benchmarks [11].
We draw inspiration from these researches and use arbitrary
quadrilateral bounding boxes to annotate objects.
To make a more detailed annotation, as shown in Fig. 3,
we emphasize the importance of the first point (x1, y1),which normally implies the “head” of the object. For he-
licopter, large vehicle, small vehicle, harbor, baseball dia-
mond, ship and plane, we carefully denote their first point to
enrich potential usages. While for soccer-ball field, swim-
ming pool, bridge, ground track field, basketball court and
tennis court, there are no visual clues to decide the first
point, so we choose the top-left point as the starting point.
Some samples of annotated patches (not the whole orig-
inal image) in our dataset are shown in Fig. 4.
It is worth noticing that, Papadopoulos et al. [23] have
explored an alternative annotation method and verify its ef-
ficiency and robustness. We assume that the annotations
would be more precise and robust with more elaborately de-
signed annotation methods, and alternative annotation pro-
tocols would facilitate more efficient crowd-sourced image
annotations.
3.4. Dataset splits
In order to ensure that the training data and test data dis-
tributions approximately match, we randomly select half of
the original images as the training set, 1/6 as validation set,
and 1/3 as the testing set. We will publicly provide all the
original images with ground truth for training set and val-
idation set, but not for the testing set. For testing, we are
currently building an evaluation server.
4. Properties of DOTA
4.1. Image size
Aerial images are usually very large in size compared to
those in natural images dataset. The original size of images
in our dataset ranges from about 800 × 800 to about 4k ×4k while most images in regular datasets (e.g. PASCAL-
VOC and MSCOCO) are no more than 1k × 1k. We make
annotations on the original full image without partitioning
it into pieces to avoid the cases where a single instance is
partitioned into different pieces.
4.2. Various orientations of instances
As shown in Fig.1 (f), our dataset achieves a good bal-
ance in the instances of different directions, which is signif-
icantly helpful for learning a robust detector. Moreover, our
dataset is closer to real scenes because it is common to see
objects in all kinds of orientations in the real world.

(a) (b) (c) (d)
Figure 3: Visualization of adopted annotation method. The yellow point represents the starting point, which refers to: (a) top
left corner of a plane, (b) the center of sector-shaped baseball diamond, (c) top left corner of a large vehicle. (d) is a failure
case of the horizontal rectangle annotation, which brings high overlap compared to (c).
Figure 4: Samples of annotated images in DOTA. We show three samples per each category, except six for large-vehicle.
(a) (b) (c)
Figure 5: Statistics of instances in DOTA. AR denotes the aspect ratio. (a) The AR of horizontal bounding box. (b) The AR
of oriented bounding box. (c) Histogram of number of annotated instances per image.
4.3. Spatial resolution information
We also provide the spatial resolution for each image in
our dataset, which implies the actual size of an instance and
plays a significant role in aerial object detection. The impor-
tance of spatial resolution for detection task are two folds.
First, it allows the model to be more adaptive and robust for
varieties of objects of the same category. It’s known that ob-
jects appear smaller when seen from a distance. The same
object with different sizes will trouble the model and hurt
classification. However, a model can pay more attention to
the shape with resolution information provided instead of
objects’ size. Second, it’s better for fine-grained classifica-
tion. For example, it will be simple to distinguish a small
boat from a large warship.
Spatial resolution can also be used to filter mislabeled
outliers in our dataset, as intra-class varieties of actual sizes
for most categories are limited. Outliers can be found by
selecting the objects whose size is far different from those
of the same category in a small range of spatial resolution.
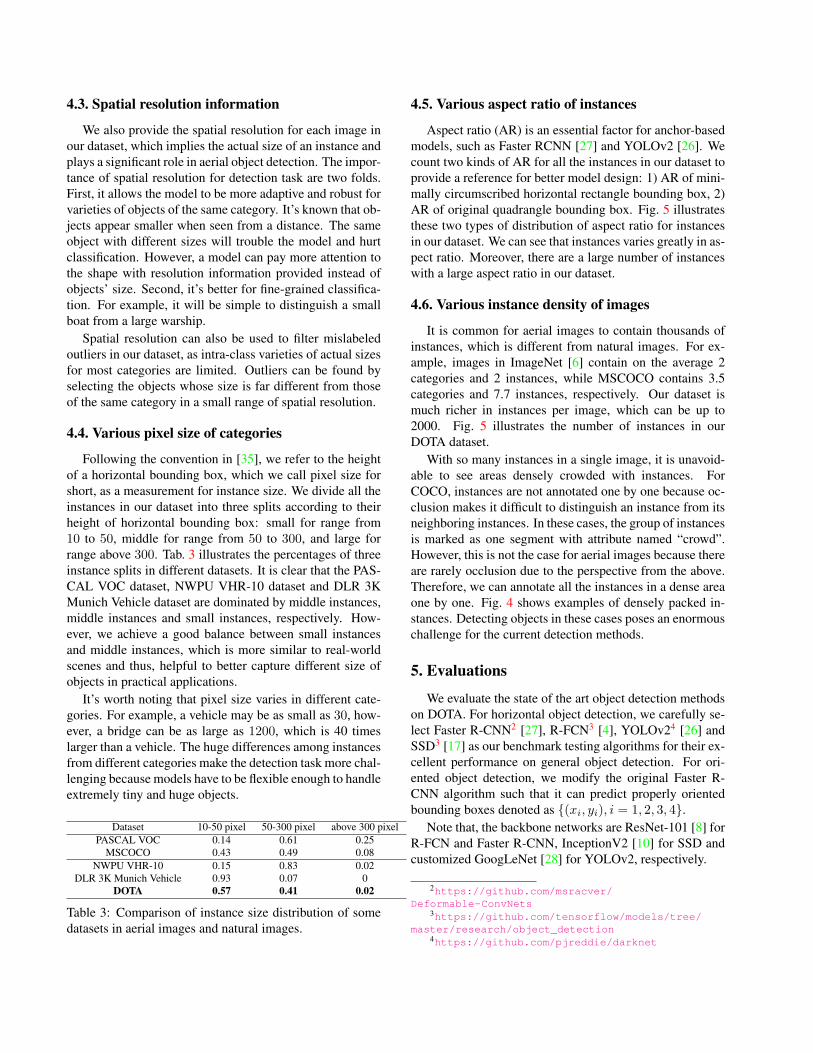
4.4. Various pixel size of categories
Following the convention in [35], we refer to the height
of a horizontal bounding box, which we call pixel size for
short, as a measurement for instance size. We divide all the
instances in our dataset into three splits according to their
height of horizontal bounding box: small for range from
10 to 50, middle for range from 50 to 300, and large for
range above 300. Tab. 3 illustrates the percentages of three
instance splits in different datasets. It is clear that the PAS-
CAL VOC dataset, NWPU VHR-10 dataset and DLR 3K
Munich Vehicle dataset are dominated by middle instances,
middle instances and small instances, respectively. How-
ever, we achieve a good balance between small instances
and middle instances, which is more similar to real-world
scenes and thus, helpful to better capture different size of
objects in practical applications.
It’s worth noting that pixel size varies in different cate-
gories. For example, a vehicle may be as small as 30, how-
ever, a bridge can be as large as 1200, which is 40 times
larger than a vehicle. The huge differences among instances
from different categories make the detection task more chal-
lenging because models have to be flexible enough to handle
extremely tiny and huge objects.
Dataset 10-50 pixel 50-300 pixel above 300 pixel
PASCAL VOC 0.14 0.61 0.25
MSCOCO 0.43 0.49 0.08
NWPU VHR-10 0.15 0.83 0.02
DLR 3K Munich Vehicle 0.93 0.07 0
DOTA 0.57 0.41 0.02
Table 3: Comparison of instance size distribution of some
datasets in aerial images and natural images.
4.5. Various aspect ratio of instances
Aspect ratio (AR) is an essential factor for anchor-based
models, such as Faster RCNN [27] and YOLOv2 [26]. We
count two kinds of AR for all the instances in our dataset to
provide a reference for better model design: 1) AR of mini-
mally circumscribed horizontal rectangle bounding box, 2)
AR of original quadrangle bounding box. Fig. 5 illustrates
these two types of distribution of aspect ratio for instances
in our dataset. We can see that instances varies greatly in as-
pect ratio. Moreover, there are a large number of instances
with a large aspect ratio in our dataset.
4.6. Various instance density of images
It is common for aerial images to contain thousands of
instances, which is different from natural images. For ex-
ample, images in ImageNet [6] contain on the average 2
categories and 2 instances, while MSCOCO contains 3.5
categories and 7.7 instances, respectively. Our dataset is
much richer in instances per image, which can be up to
2000. Fig. 5 illustrates the number of instances in our
DOTA dataset.
With so many instances in a single image, it is unavoid-
able to see areas densely crowded with instances. For
COCO, instances are not annotated one by one because oc-
clusion makes it difficult to distinguish an instance from its
neighboring instances. In these cases, the group of instances
is marked as one segment with attribute named “crowd”.
However, this is not the case for aerial images because there
are rarely occlusion due to the perspective from the above.
Therefore, we can annotate all the instances in a dense area
one by one. Fig. 4 shows examples of densely packed in-
stances. Detecting objects in these cases poses an enormous
challenge for the current detection methods.
5. Evaluations
We evaluate the state of the art object detection methods
on DOTA. For horizontal object detection, we carefully se-
lect Faster R-CNN2 [27], R-FCN3 [4], YOLOv24 [26] and
SSD3 [17] as our benchmark testing algorithms for their ex-
cellent performance on general object detection. For ori-
ented object detection, we modify the original Faster R-
CNN algorithm such that it can predict properly oriented
bounding boxes denoted as {(xi, yi), i = 1, 2, 3, 4}.
Note that, the backbone networks are ResNet-101 [8] for
R-FCN and Faster R-CNN, InceptionV2 [10] for SSD and
customized GoogLeNet [28] for YOLOv2, respectively.
2https://github.com/msracver/
Deformable-ConvNets3https://github.com/tensorflow/models/tree/
master/research/object_detection4https://github.com/pjreddie/darknet
5.1. Evaluation tasks
To evaluate the state-of-the-art deep learning based de-
tection methods on DOTA, we propose two tasks, namely
detection with horizontal bounding boxes (HBB for short)
and detection with oriented bounding boxes (OBB for
short). To be more specific, we evaluate those methods on
two different kinds of ground truths, HBB or OBB, no mat-
ter how those methods were trained.
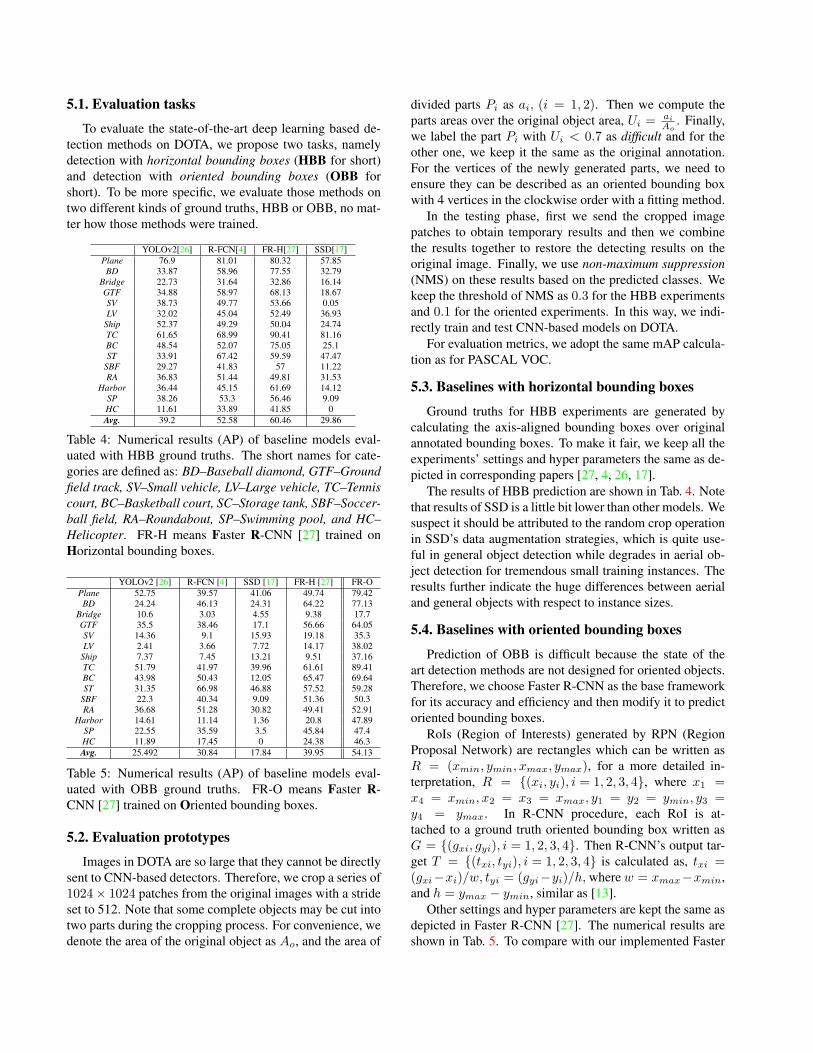
YOLOv2[26] R-FCN[4] FR-H[27] SSD[17]
Plane 76.9 81.01 80.32 57.85
BD 33.87 58.96 77.55 32.79
Bridge 22.73 31.64 32.86 16.14
GTF 34.88 58.97 68.13 18.67
SV 38.73 49.77 53.66 0.05
LV 32.02 45.04 52.49 36.93
Ship 52.37 49.29 50.04 24.74
TC 61.65 68.99 90.41 81.16
BC 48.54 52.07 75.05 25.1
ST 33.91 67.42 59.59 47.47
SBF 29.27 41.83 57 11.22
RA 36.83 51.44 49.81 31.53
Harbor 36.44 45.15 61.69 14.12
SP 38.26 53.3 56.46 9.09
HC 11.61 33.89 41.85 0
Avg. 39.2 52.58 60.46 29.86
Table 4: Numerical results (AP) of baseline models eval-
uated with HBB ground truths. The short names for cate-
gories are defined as: BD–Baseball diamond, GTF–Ground
field track, SV–Small vehicle, LV–Large vehicle, TC–Tennis
court, BC–Basketball court, SC–Storage tank, SBF–Soccer-
ball field, RA–Roundabout, SP–Swimming pool, and HC–
Helicopter. FR-H means Faster R-CNN [27] trained on
Horizontal bounding boxes.
YOLOv2 [26] R-FCN [4] SSD [17] FR-H [27] FR-O
Plane 52.75 39.57 41.06 49.74 79.42
BD 24.24 46.13 24.31 64.22 77.13
Bridge 10.6 3.03 4.55 9.38 17.7
GTF 35.5 38.46 17.1 56.66 64.05
SV 14.36 9.1 15.93 19.18 35.3
LV 2.41 3.66 7.72 14.17 38.02
Ship 7.37 7.45 13.21 9.51 37.16
TC 51.79 41.97 39.96 61.61 89.41
BC 43.98 50.43 12.05 65.47 69.64
ST 31.35 66.98 46.88 57.52 59.28
SBF 22.3 40.34 9.09 51.36 50.3
RA 36.68 51.28 30.82 49.41 52.91
Harbor 14.61 11.14 1.36 20.8 47.89
SP 22.55 35.59 3.5 45.84 47.4
HC 11.89 17.45 0 24.38 46.3
Avg. 25.492 30.84 17.84 39.95 54.13
Table 5: Numerical results (AP) of baseline models eval-
uated with OBB ground truths. FR-O means Faster R-
CNN [27] trained on Oriented bounding boxes.
5.2. Evaluation prototypes
Images in DOTA are so large that they cannot be directly
sent to CNN-based detectors. Therefore, we crop a series of
1024× 1024 patches from the original images with a stride
set to 512. Note that some complete objects may be cut into
two parts during the cropping process. For convenience, we
denote the area of the original object as Ao, and the area of
divided parts Pi as ai, (i = 1, 2). Then we compute the
parts areas over the original object area, Ui =ai
Ao
. Finally,
we label the part Pi with Ui < 0.7 as difficult and for the
other one, we keep it the same as the original annotation.
For the vertices of the newly generated parts, we need to
ensure they can be described as an oriented bounding box
with 4 vertices in the clockwise order with a fitting method.
In the testing phase, first we send the cropped image
patches to obtain temporary results and then we combine
the results together to restore the detecting results on the
original image. Finally, we use non-maximum suppression
(NMS) on these results based on the predicted classes. We
keep the threshold of NMS as 0.3 for the HBB experiments
and 0.1 for the oriented experiments. In this way, we indi-
rectly train and test CNN-based models on DOTA.
For evaluation metrics, we adopt the same mAP calcula-
tion as for PASCAL VOC.
5.3. Baselines with horizontal bounding boxes
Ground truths for HBB experiments are generated by
calculating the axis-aligned bounding boxes over original
annotated bounding boxes. To make it fair, we keep all the
experiments’ settings and hyper parameters the same as de-
picted in corresponding papers [27, 4, 26, 17].
The results of HBB prediction are shown in Tab. 4. Note
that results of SSD is a little bit lower than other models. We
suspect it should be attributed to the random crop operation
in SSD’s data augmentation strategies, which is quite use-
ful in general object detection while degrades in aerial ob-
ject detection for tremendous small training instances. The
results further indicate the huge differences between aerial
and general objects with respect to instance sizes.
5.4. Baselines with oriented bounding boxes
Prediction of OBB is difficult because the state of the
art detection methods are not designed for oriented objects.
Therefore, we choose Faster R-CNN as the base framework
for its accuracy and efficiency and then modify it to predict
oriented bounding boxes.
RoIs (Region of Interests) generated by RPN (Region
Proposal Network) are rectangles which can be written as
R = (xmin, ymin, xmax, ymax), for a more detailed in-
terpretation, R = {(xi, yi), i = 1, 2, 3, 4}, where x1 =x4 = xmin, x2 = x3 = xmax, y1 = y2 = ymin, y3 =y4 = ymax. In R-CNN procedure, each RoI is at-
tached to a ground truth oriented bounding box written as
G = {(gxi, gyi), i = 1, 2, 3, 4}. Then R-CNN’s output tar-
get T = {(txi, tyi), i = 1, 2, 3, 4} is calculated as, txi =(gxi−xi)/w, tyi = (gyi−yi)/h, where w = xmax−xmin,
and h = ymax − ymin, similar as [13].
Other settings and hyper parameters are kept the same as
depicted in Faster R-CNN [27]. The numerical results are
shown in Tab. 5. To compare with our implemented Faster

R-CNN for OBB, we evaluate YOLOv2, R-FCN, SSD and
Faster R-CNN trained on HBB with the OBB ground truth.
As shown in Tab.5, the results of those methods trained on
HBB are much lower than Faster R-CNN trained on OBB,
indicating that for oriented object detection in aerial scenes,
those methods should be adjusted accordingly.
5.5. Experimental analysis
When analyzing the results exhibited in Table. 4, perfor-
mances in categories like small vehicle, large vehicle and
ship are far from satisfactory, which attributes to their small
size and densely crowded locations in aerial images. As a
contrast, large and discrete objects, like planes, swimming
pools and tennis courts, the performances are rather fair.
In Fig. 6, we compare the results between object detec-
tion experiments of HBB and OBB. For densely packed and
oriented objects shown in Fig. 6 (a) and (b), location preci-
sion of objects in HBB experiments are much lower than
OBB experiments and many results are suppressed through
post-progress operations. So OBB regression is the correct
way for oriented object detection that can be really inte-
grated to real applications. In Fig. 6 (c), large aspect ratio
objects annotated in OBB style like (harbor, bridge) are hard
for current detectors to regress. But in HBB style, those
objects usually have normal aspect ratios and as a conse-
quence, results seem to be fairly good as shown in Fig. 6 (d).
However in extremely dense scenes, e.g in Fig. 6 (e) and (f),
results of HBB and OBB are all not satisfying which implies
the defects of current detectors.
(a)
(b) (f)
(e)
(d)
(c)
Figure 6: Visualization results of testing on DOTA using
well-trained Faster R-CNN. TOP and Bottom respectively
illustrate the results for HBB and OBB in cases of orienta-
tion, large aspect ratio, and density.
6. Cross-dataset validations
The cross dataset generalization [29] is an evaluation
for the generalization ability of a dataset. We choose the
UCAS-AOD dataset [41] to do cross-dataset generalization
for its comparatively large number of data comparing to
other aerial object detection datasets. For there are no of-
ficial data splits for UCAS-AOD, we randomly select 1110
for training and 400 for testing. We choose YOLOv2 as
the testing detector for all experiments described below and
HBB-style annotations for all ground truths. Input image
size is changed to 960×544 around the original image sizes
in UCAS-AOD while other setting kept unchanged.
Results are shown in Tab. 6. The performance differ-
ence across two datasets is 35.8 for YOLOv2-A and 15.6
for YOLOv2-D models, respectively. It suggests that DOTA
hugely covers UCAS-AOD and furthermore has more pat-
terns and properties that are not shared in UCAS-AOD. And
both models get a low results on DOTA which reflects that
DOTA is much more challenging.
Testing set Detector Plane Small-vehicle Avg.
UCAS-AODYOLOv2-A 90.66 88.17 89.41
YOLOv2-D 87.18 65.13 76.15
DOTAYOLOv2-A 62.92 44.17 53.55
YOLOv2-D 74.83 46.18 60.51
Table 6: Results of cross-dataset generalization. Top: De-
tection performance evaluated on UCAS-AOD. Bottom:
Detection performance evaluated on DOTA. YOLOv2-A
and YOLOv2-D are trained with UCAS-AOD and DOTA,
respectively.
7. Conclusion
We build a large-scale dataset for oriented objects de-
tection in aerial images which is much larger than any ex-
isting datasets in this field. In contrast to general object
detection benchmarks, we annotate a huge number of well-
distributed oriented objects with oriented bounding boxes.
We assume this dataset is challenging but similar to natu-
ral aerial scenes, which are more appropriate for practical
applications. We also establish a benchmark for object de-
tection in aerial images and show the feasibility to produce
oriented bounding boxes by modifying a mainstream detec-
tion algorithm.
Detecting densely packed small instances and extremely
large instances with arbitrary orientations in a large picture
would be particularly meaningful and challenging. We be-
lieve DOTA will not only promote the development of ob-
ject detection algorithms in Earth Vision, but also pose in-
teresting algorithmic questions to general object detection
in computer vision.
Acknowledgement
This research is supported by NSFC projects under the
contracts No.61771350 and No.41501462. Dr. Xiang Bai
is supported by the National Program for Support of Top-
notch Young Professionals. We thank Fan Hu, Pu Jin,
Xinyi Tong, Xuan Hu, Zhipeng Dong, Liang Wu, Jun Tang,
Linyan Cui, Duoyou Zhou, Tengteng Huang, and all the
others who involved in the annotations of DOTA.
References
[1] C. Benedek, X. Descombes, and J. Zerubia. Building devel-
opment monitoring in multitemporal remotely sensed image
pairs with stochastic birth-death dynamics. IEEE TPAMI,
34(1):33–50, 2012.
[2] G. Cheng, P. Zhou, and J. Han. Learning rotation-invariant
convolutional neural networks for object detection in VHR
optical remote sensing images. IEEE Trans. Geosci. Remote
Sens., 54(12):7405–7415, 2016.
[3] G. Cheng, P. Zhou, and J. Han. Rifd-cnn: Rotation-invariant
and fisher discriminative convolutional neural networks for
object detection. In CVPR, pages 2884–2893, 2016.
[4] J. Dai, Y. Li, K. He, and J. Sun. R-FCN: object detection via
region-based fully convolutional networks. In NIPS, pages
379–387, 2016.
[5] A.-M. de Oca, R. Bahmanyar, N. Nistor, and M. Datcu. Earth
observation image semantic bias: A collaborative user anno-
tation approach. IEEE J. of Selected Topics in Applied Earth
Observations and Remote Sensing, 2017.
[6] J. Deng, W. Dong, R. Socher, L. Li, K. Li, and F. Li. Ima-
genet: A large-scale hierarchical image database. In CVPR,
pages 248–255, 2009.
[7] M. Everingham, L. V. Gool, C. Williams, J. Winn, and
A. Zisserman. The pascal visual object classes (VOC) chal-
lenge. IJCV, 88(2):303–338, 2010.
[8] K. He, X. Zhang, S. Ren, and J. Sun. Deep residual learning
for image recognition. In CVPR, June 2016.
[9] G. Heitz and D. Koller. Learning spatial context: Using stuff
to find things. In ECCV, pages 30–43, 2008.
[10] S. Ioffe and C. Szegedy. Batch normalization: Accelerating
deep network training by reducing internal covariate shift.
CoRR, abs/1502.03167, 2015.
[11] D. Karatzas, L. Gomez-Bigorda, A. Nicolaou, S. K. Ghosh,
A. D. Bagdanov, M. Iwamura, J. Matas, L. Neumann, V. R.
Chandrasekhar, S. Lu, F. Shafait, S. Uchida, and E. Valveny.
ICDAR 2015 competition on robust reading. In Proc. IC-
DAR, 2015.
[12] R. Krishna, Y. Zhu, O. Groth, J. Johnson, K. Hata, J. Kravitz,
S. Chen, Y. Kalantidis, L.-J. Li, D. A. Shamma, et al. Vi-
sual genome: Connecting language and vision using crowd-
sourced dense image annotations. IJCV, 123(1):32–73,
2017.
[13] M. Liao, B. Shi, and X. Bai. Textboxes++: A single-shot
oriented scene text detector. CoRR, abs/1801.02765, 2018.
[14] T. Lin, M. Maire, S. Belongie, J. Hays, P. Perona, D. Ra-
manan, P. Dollar, and C. L. Zitnick. Microsoft COCO: com-
mon objects in context. In ECCV, pages 740–755, 2014.
[15] Y. Lin, H. He, Z. Yin, and F. Chen. Rotation-invariant object
detection in remote sensing images based on radial-gradient
angle. IEEE Geosci.Remote Sensing Lett., 12(4):746–750,
2015.
[16] K. Liu and G. Mattyus. Fast multiclass vehicle detec-
tion on aerial images. IEEE Geosci. Remote Sensing Lett.,
12(9):1938–1942, 2015.
[17] W. Liu, D. Anguelov, D. Erhan, C. Szegedy, S. E. Reed,
C. Fu, and A. C. Berg. SSD: single shot multibox detector.
In ECCV, pages 21–37, 2016.
[18] Z. Liu, H. Wang, L. Weng, and Y. Yang. Ship rotated bound-
ing box space for ship extraction from high-resolution optical
satellite images with complex backgrounds. IEEE Geosci.
Remote Sensing Lett., 13(8):1074–1078, 2016.
[19] Y. Long, Y. Gong, Z. Xiao, and Q. Liu. Accurate object
localization in remote sensing images based on convolu-
tional neural networks. IEEE Trans. Geosci. Remote Sens.,
55(5):2486–2498, 2017.
[20] T. Moranduzzo and F. Melgani. Detecting cars in uav images
with a catalog-based approach. IEEE Trans. Geosci. Remote
Sens., 52(10):6356–6367, 2014.
[21] T. N. Mundhenk, G. Konjevod, W. A. Sakla, and K. Boakye.
A large contextual dataset for classification, detection and
counting of cars with deep learning. In ECCV, pages 785–
800, 2016.
[22] A. O. Ok, C. Senaras, and B. Yuksel. Automated detec-
tion of arbitrarily shaped buildings in complex environments
from monocular VHR optical satellite imagery. IEEE Trans.
Geosci. and Remote Sens., 51(3-2):1701–1717, 2013.
[23] D. P. Papadopoulos, J. R. R. Uijlings, F. Keller, and V. Fer-
rari. Extreme clicking for efficient object annotation. CoRR,
abs/1708.02750, 2017.
[24] J. Porway, Q. Wang, and S. C. Zhu. A hierarchical and con-
textual model for aerial image parsing. IJCV, 88(2):254–283,
2010.
[25] S. Razakarivony and F. Jurie. Vehicle detection in aerial im-
agery: A small target detection benchmark. J Vis. Commun.
Image R., 34:187–203, 2016.
[26] J. Redmon and A. Farhadi. YOLO9000: better, faster,
stronger. CoRR, abs/1612.08242, 2016.
[27] S. Ren, K. He, R. B. Girshick, and J. Sun. Faster R-CNN:
towards real-time object detection with region proposal net-
works. IEEE TPAMI, 39(6):1137–1149, 2017.
[28] C. Szegedy, W. Liu, Y. Jia, P. Sermanet, S. Reed,
D. Anguelov, D. Erhan, V. Vanhoucke, and A. Rabinovich.
Going deeper with convolutions. In CVPR, pages 1–9, 2015.
[29] A. Torralba and A. A. Efros. Unbiased look at dataset bias.
In CVPR, pages 1521–1528, 2011.
[30] M. Vakalopoulou, K. Karantzalos, N. Komodakis, and
N. Paragios. Building detection in very high resolution mul-
tispectral data with deep learning features. In IGARSS, pages
1873–1876, 2015.
[31] L. Wan, L. Zheng, H. Huo, and T. Fang. Affine invariant de-
scription and large-margin dimensionality reduction for tar-
get detection in optical remote sensing images. IEEE Geosci.
Remote Sensing Lett., 2017.
[32] G. Wang, X. Wang, B. Fan, and C. Pan. Feature extraction by
rotation-invariant matrix representation for object detection
in aerial image. IEEE Geosci.Remote Sensing Lett., 2017.
[33] G. Xia, J. Hu, F. Hu, B. Shi, X. Bai, Y. Zhong, L. Zhang, and
X. Lu. AID: A benchmark data set for performance evalu-
ation of aerial scene classification. IEEE Trans. Geoscience
and Remote Sensing, 55(7):3965–3981, 2017.
[34] J. Xiao, J. Hays, K. Ehinger, A. Oliva, and A. Torralba. SUN
database: Large-scale scene recognition from abbey to zoo.
In CVPR, pages 3485–3492, 2010.
[35] S. Yang, P. Luo, C. C. Loy, and X. Tang. WIDER FACE:
A face detection benchmark. In CVPR, pages 5525–5533,
2016.
[36] B. Yao, X. Yang, and S.-C. Zhu. Introduction to a large-
scale general purpose ground truth database: Methodology,
annotation tool and benchmarks. In EMMCVPR 2007, pages
169–183, 2007.
[37] C. Yao, X. Bai, W. Liu, Y. Ma, and Z. Tu. Detecting texts of
arbitrary orientations in natural images. In CVPR, 2012.
[38] Q. You, J. Luo, H. Jin, and J. Yang. Building a large scale
dataset for image emotion recognition: The fine print and the
benchmark. In AAAI, pages 308–314, 2016.
[39] F. Zhang, B. Du, L. Zhang, and M. Xu. Weakly super-
vised learning based on coupled convolutional neural net-
works for aircraft detection. IEEE Trans. Geosci. Remote
Sens., 54(9):5553–5563, 2016.
[40] B. Zhou, A. Lapedriza, J. Xiao, A. Torralba, and A. Oliva.
Learning deep features for scene recognition using places
database. In NIPS, pages 487–495, 2014.
[41] H. Zhu, X. Chen, W. Dai, K. Fu, Q. Ye, and J. Jiao. Ori-
entation robust object detection in aerial images using deep
convolutional neural network. In ICIP, pages 3735–3739,
2015.


![Aerial GANeration: Towards Realistic Data Augmentation Using …openaccess.thecvf.com/content_ECCVW_2018/papers/11130/... · 2019-02-10 · perception (see the DOTA leader board [2])](https://static.fdocuments.in/doc/165x107/5e2a19f98dfd0d0ad557d887/aerial-ganeration-towards-realistic-data-augmentation-using-2019-02-10-perception.jpg)