Dore Road Drainage Scheme (1606) Swale … and Environmental Engineering . Dore Road Drainage Scheme...
60
Hydrological and Environmental Engineering Dore Road Drainage Scheme (1606) Swale Functional Design 15 June 2017 Report by: Stormy Water Solutions [email protected] M 0412 436 021, M 0401 861 301
-
Upload
phungkhanh -
Category
Documents
-
view
214 -
download
1
Transcript of Dore Road Drainage Scheme (1606) Swale … and Environmental Engineering . Dore Road Drainage Scheme...

Hydrological and Environmental Engineering
Dore Road Drainage Scheme (1606)
Swale Functional Design
15 June 2017
Report by: Stormy Water Solutions [email protected] M 0412 436 021, M 0401 861 301

i
Contents 1 INTRODUCTION ......................................................................................................................................... 1
2 DESIGN CONSIDERATIONS ..................................................................................................................... 3
2.1 DEEP CREEK FLOODPLAIN ..................................................................................................................... 3 2.2 BYPASS OF LOCAL FLOWS FROM W3 ..................................................................................................... 4 2.3 GAS LINE CONSIDERATIONS .................................................................................................................. 4 2.4 WATER QUALITY REQUIREMENTS ......................................................................................................... 5 2.5 DEVELOPMENT REQUIREMENTS OF THE LAND WEST OF THE NORTH-SOUTH GAS LINE .......................... 6
3 PROPOSED FUNCTIONAL DESIGN ......................................................................................................... 7
3.1 SWALE ................................................................................................................................................... 7 3.1.1 Section 1 – Station 190 to 642 .......................................................................................................... 7 3.1.2 Section 2 – Station 642 to 750 .......................................................................................................... 7 3.1.3 Section 3 – Station 773 to 1106 ........................................................................................................ 9 3.1.4 Section 4 – Station 1106 to 1369 ...................................................................................................... 9
3.2 OUTLET TO DEEP CREEK........................................................................................................................ 9 3.3 DS INLET CONCEPT SIZING .................................................................................................................... 9
4 STORMWATER POLLUTANT MODELLING......................................................................................... 11
5 FURTHER WORK REQUIRED ................................................................................................................. 14
6 FILE CONTROL ......................................................................................................................................... 15
7 ABBREVIATIONS, DESCRIPTIONS AND DEFINITIONS .................................................................... 17
APPENDIX A – FUNCTIONAL DESIGN DRAWINGS ................................................................................... 18
APPENDIX B – HYDRAULIC MODELLING OF THE SWALE PROPOSAL ................................................ 24
APPENDIX C – LOCAL CONNECTION TO DEEP CREEK SIZING.............................................................. 26
APPENDIX D – MWC DS PIPELINE CONCEPT DESIGN .............................................................................. 27

1
1 Introduction In 2013, Stormy Water Solutions (SWS) produced a report entitled “Pakenham East Precinct
Structure Plan, Proposed Drainage Strategy, Draft Report, 25 March 2013” (2013 PSP Report) for
Cardinia Shire Council (Council).
This 2013 work detailed the overall requirements of the major drainage and the water sensitive urban
design (WSUD) infrastructure required if the precinct structure plan (PSP) was developed for urban
purposes. Figure 1 details the preliminary drainage proposals. It should be noted that the 50 metre
offset to Deep Creek was ultimately increased to 100 metres by Council and Melbourne Water
Corporation (MWC) to allow for:
• Placement of all (or most) required frog ponds in this reserve area,
• Containment of the 100 Year ARI flood in the flood plain without significant increasing existing
flood levels (due to filling of developable land) as per Pakenham East Precinct Structure Plan,
Deep Creek Corridor Proposals, “Stormy Water Solutions”, 5 October 2014 (2014 Floodplain
Report).
Figure 1 2013 Preliminary PSP Drainage Strategy
2
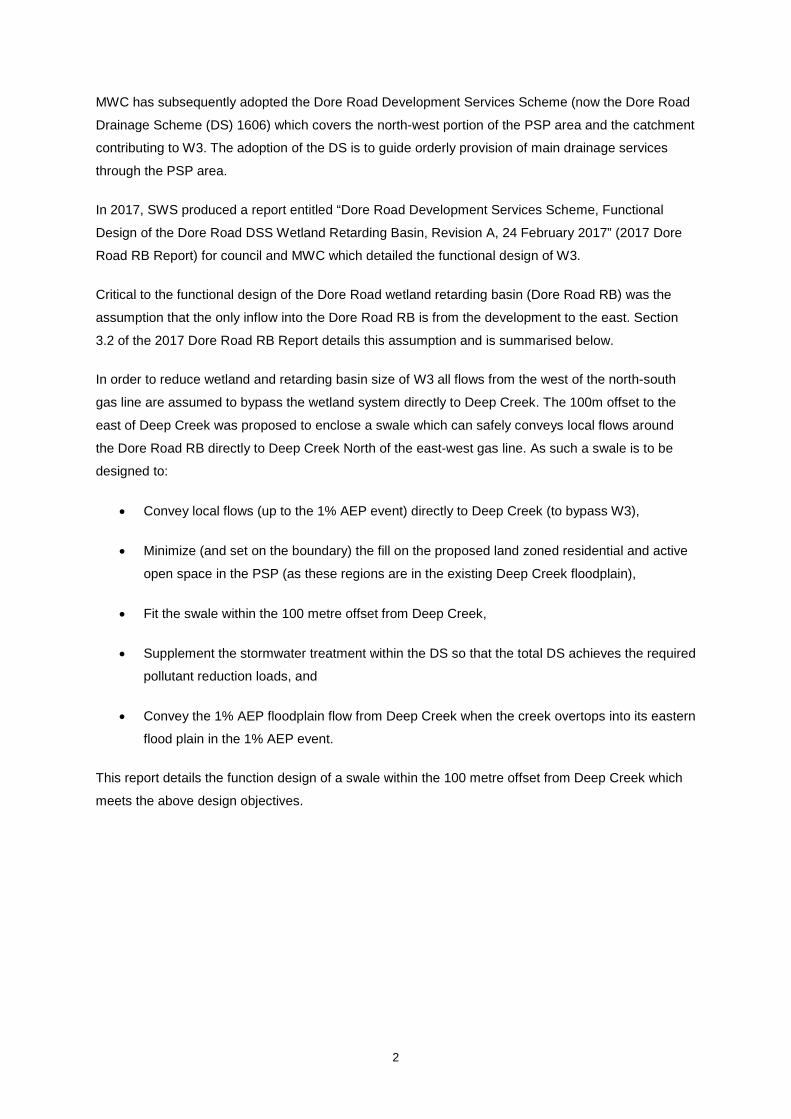
MWC has subsequently adopted the Dore Road Development Services Scheme (now the Dore Road
Drainage Scheme (DS) 1606) which covers the north-west portion of the PSP area and the catchment
contributing to W3. The adoption of the DS is to guide orderly provision of main drainage services
through the PSP area.
In 2017, SWS produced a report entitled “Dore Road Development Services Scheme, Functional
Design of the Dore Road DSS Wetland Retarding Basin, Revision A, 24 February 2017” (2017 Dore
Road RB Report) for council and MWC which detailed the functional design of W3.
Critical to the functional design of the Dore Road wetland retarding basin (Dore Road RB) was the
assumption that the only inflow into the Dore Road RB is from the development to the east. Section
3.2 of the 2017 Dore Road RB Report details this assumption and is summarised below.
In order to reduce wetland and retarding basin size of W3 all flows from the west of the north-south
gas line are assumed to bypass the wetland system directly to Deep Creek. The 100m offset to the
east of Deep Creek was proposed to enclose a swale which can safely conveys local flows around
the Dore Road RB directly to Deep Creek North of the east-west gas line. As such a swale is to be
designed to:
• Convey local flows (up to the 1% AEP event) directly to Deep Creek (to bypass W3),
• Minimize (and set on the boundary) the fill on the proposed land zoned residential and active
open space in the PSP (as these regions are in the existing Deep Creek floodplain),
• Fit the swale within the 100 metre offset from Deep Creek,
• Supplement the stormwater treatment within the DS so that the total DS achieves the required
pollutant reduction loads, and
• Convey the 1% AEP floodplain flow from Deep Creek when the creek overtops into its eastern
flood plain in the 1% AEP event.
This report details the function design of a swale within the 100 metre offset from Deep Creek which
meets the above design objectives.

3
2 Design Considerations 2.1 Deep Creek Floodplain Attached as Addendum 1 is the report, “Pakenham East Precinct Structure Plan, Deep Creek Corridor
Proposals, 5 October 2014”. This report details the behaviour of Deep Creek in the 1% AEP event
and investigates it’s overtopping into the eastern and western floodplains both upstream and
downstream of Princess Highway with and without works. Figure 2 below is a reproduction of Figure 6
of the 2014 floodplain report which conceptually shows a typical 1% AEP cross section upstream of
Princess Highway.
Figure 2 Reproduction of Figure 6, 2014 floodplain report – Typical Deep Creek Cross Section Upstream of Princess Highway
As found in the 2014 floodplain report, flood level and extent in the eastern floodplain (the Dore Road
DS area) is much greater than the proposed 100 metres offset from Deep Creek. As such, the
proposed swale must account for the 1% floodplain flows from Deep Creek as detailed below in Table
1 (reproduced Table 9, 2014 floodplain report). The levels (assuming corridor works) and flows at the
locations shown in Table 1 have been used to design and assess the proposed swale.
Table 1 Reproduction of Table 9, 2014 floodplain report – Hec Ras Results with and without Deep Creek Corridor Works, Eastern Floodplain

4
2.2 Bypass of Local Flows from W3 As detailed in Section 3.2 of the 2017 Dore Road RB report, critical to the functional design of W3 is
that local flows from the Dore Road DS bypass W3 directly to Deep Creek upstream of the East-West
Gas Line. This then allows the total 1% AEP post-development flow from the DS to be less than the
total 1% AEP pre-development flow from the DS. In essence, the Dore Road RB over retards flows
from the eastern catchments to account for the limited attenuation the swale can provide for the
western catchment.
As such, the RORB model used in the Dore Road RB design has been used to produce local flows
(i.e. assuming no interaction with Deep Creek) at important locations along the swale alignment as
described below in Table 2.
Table 2 Local Flows along Swale Alignment
The flows from the local catchment are well below those expected in the swale due to overtopping of
Deep Creek. As such, the swale has been designed to convey Deep Creek floodplain flows as
detailed in Table 1.
The downstream 1% AEP starting water level (at W3) has also been set to the level of 42.50 m AHD
(W3 1% AEP level with Deep Creek high and outflow restricted) as this level is higher than the level of
42.35 m AHD detailed in Table 1 for the same location.
2.3 Gas Line Considerations The Dore Road DS is bisected by two major gas lines, the Pakenham - Wollert line and the Langford
– Dandendong line as shown in Figure 3. The current PSP zonings is also shown in Figure 3. As can
be seen, there are two separate residential areas which are separated by the gas easement running
North – South through the DS catchment.
External catchment inlet to swale at PSP boundary (Station 1106) 1 m3/s (9-hour) 0.3 m3/s (9-hour)
Inflow to swale From proposed residential development 4.5 m3/s (15-min) 1.4 m3/s (25-min)
Swale Flow at development merge (Station 773) 4.6 m3/s (15-min) 1.4 m3/s (25-min)
Swale flow at northern oval inlet (Station 450) 2.8 m3/s (1-hour) 0.9 m3/s (9-hour)
Swale flow into Deep Creek (Station 190) 2.8 m3/s (9-hour) 0.9 m3/s (9-hour)
Location 1% AEP 18.13% AEP

5
As crossing the gas mains is costly, SWS and MWC have aimed to minimize the number of crossings
within the DS catchment. As such, runoff from the residential area to the west (Deep Creek side) of
the North-South gas line is proposed to be treated and mitigated by a swale located within the 100
metre offset from deep creek.
Figure 3 Dore Road DS Concept
All remaining areas are proposed to be treated and retarded within the wetland located in the south
west portion of the DS. This results in only one crossing of the gas easement within the DS. Further
details on APA requirements about the gas lines can be found in Section 2.2 of the 2017 Dore Road
RB report.
2.4 Water Quality Requirements The Dore DS must ensure all stormwater is treated to at least current best practice prior to discharge
from the PSP area.
Therefore, the treatment systems must ensure 80% retention of Total Suspended Solids (TSS), 45%
retention of Total Phosphorus (TP) and 45% retention of Total Nitrogen (TN) for the entire DS.
The wetland characteristics detailed in the 2017 Dore Road RB report, together with the swale
characteristics have been used in the stormwater pollutant modelling within this report.

6
2.5 Development requirements of the land west of the North-South Gas Line The proposed development bound by the 100 metre offset from Deep Creek to the west, the gas
easement to the south and east and the power transmission lines to the north (as shown in Figure 3)
is currently within the Deep Creek floodplain (Figure 2) and as such will require filling to allow
development. The swale proposed has dual benefits to this land as:
• The swale is proposed to concentrate the entire 1% AEP flow within the 100 metre offset from
Deep Creek, thus maximising developable land, and
• The swale proposal allows the opportunity to have a low swale invert level at the DS outlet
from the residential zoned land (as the swale is to be cut into the existing floodplain). This is
expected to greatly reduce the fill required over the entire land zoning, via allowing relatively
deep DS pipes.

7
3 Proposed Functional Design This section details the functional design of the swale system which has been designed to meet the
objectives described in Section 2.
3.1 Swale The swale system has been designed as shown in the functional design drawing set DORE/SWALE
(Appendix A). An overview of the swale alignment is provided in Figure 4.
The swale generally consists of four main sections as detailed below. In all sections, the main channel
alignment has been iterated so that there is enough space to batter down from the proposed fill levels
at the zoning boundaries to the east of the swale.
Care has been taken to snake the swale (and cut line) around any existing trees. Survey of existing
ecological attributes is to occur and compared with the swale cutline as the design progresses. A
possible revision to the swale design may have to occur if a significant number of attributes are
proposed to be removed by the cutting of the swale as per this functional design.
The main channel for the entire swale length is assumed to be heavily vegetated (n = 0.09) so MWC
do not have to maintain the asset. Regions above the 1V:8H cutline are assumed to be grassed
vegetated (n = 0.05).
In all sections, the flood and fill levels have been set using the 1% AEP Deep Creek floodplain flows
(Table 1) not the local DS 1% AEP flows (Table 2). Generally, however, the main channel has enough
capacity to contain the 1% AEP local flows over all sections. Appendix B details the HecRas
modelling used in the design of the system.
3.1.1 Section 1 – Station 190 to 642 This section has a 20 metre base that is 0.45 metres deep (from the existing natural surface level) at
1V:8H batters.
The longitudinal slope of this section is the same as the existing natural surface level along the
alignment.
3.1.2 Section 2 – Station 642 to 750 This section has a 20 metre base main channel. The depth along this section is generally greater than
0.45 metres. The longitudinal slope of the swale has been set at 1V:300H. The purpose of the
longitudinal slope is to provide a lower swale invert for the MWC DS pipes to outfall too. At Station
750 (the assumed DS pipe outfall point) the swale invert level is proposed to be 1.25 metres lower
than the existing natural surface level (48.75 m AHD – 47.50 m AHD). This represents great value to
the developers of the proposed residential development as the fill required over the entire residential
zoned land is expected to be reduced by at least 1 metre which equates to a saving of roughly
$1,500,000 in fill costs (assuming fill rates as per MWC construction estimation rates).

8
Batters for the main channel edges in this section are at 1V:8H.
Figure 4 Overview of Swale Alignment (See drawing set DORE/SWS for full detail)
Note: Black sections (with blue text) correspond to sections from the 2014 Deep Creek Floodplain
Report (Table 1).

9
3.1.3 Section 3 – Station 773 to 1106 This section has a 10 metre main channel. The depth initially is set at by sloping from station 750’s
invert level up to 1.0 metre minus natural surface level at Station 882. The invert is then set using a
longitudinal slope of 1V:240H between Stations 904 and 1369 to minimize fill over the residential land
zoning.
Batters for the main channel edges in this section are at 1V:8H.
3.1.4 Section 4 – Station 1106 to 1369 This small section of the swale has a 1 metre pilot channel. This section has been primarily designed
to direct local flows from the north (1m3/s, Table 3) towards the main swale channel. However, flood
and fill levels in this section are set by floodplain tail water effects. As such, the depth of the channel
has been set assuming a longitudinal slope of 1V:240H between Stations 904 and 1369.
3.2 Outlet to Deep Creek As detailed above in Section 2, it is critical to the design of the Dore Road RB that the local 1% AEP
flows are directed to Deep Creek upstream of the east-west gas line. To achieve this requirement, a
1% AEP culvert system has been sized to connect the swale to Deep Creek upstream of the gas line
easement (Station 190).
The system has been designed assuming the culverts can outlet to a Deep Creek invert level of 43.00
m AHD. This level is to be confirmed at the detailed design phase of the project and the culvert
system altered if the current design is no longer feasible.
The system consists of triple flood gated 825mmØ culverts with an upstream invert level of 43.85 m
AHD.
Sizing calculations are detailed in Appendix C.
3.3 DS Inlet Concept Sizing As discussed above in Section 3.1.2, the swale has been designed to minimize the fill requirements
over the residential zoned land. Crucial to this the design of the DS pipes along the southern
boundary of this land. The DS pipes have been sized as twin 825mmØ 18.13% AEP culverts to take a
peak flow of 1.4 m3/s.
Sizing calculations are detailed in Appendix D.
It is crucial that MWC restrict the final size of the DS pipe(s) to less than (or equal to) a maximum
diameter of 825mm. Currently, rough estimates put the cover over the twin 825mmØ pipes at
approximately 700mm at the connection to the swale (Station 750) with the fill level at the boundary
set by the 1% AEP floodplain level within the swale (1% AEP level + 300mm). If the DS pipe size is
increased, the fill level at the boundary will be then set by the cover requirements on the DS pipe,

10
rather than the 1% AEP floodplain level. This will reduce the $1,500,000 saving on fill costs in the
development discussed above.

11
4 Stormwater Pollutant Modelling The performance in regard to stormwater pollutant retention of the Dore Road Swale (and DS) has
been analysed using the MUSIC model, Version 6. Subareas and fraction imperviousness are as
detailed in the RORB model (2017 Dore Road RB Report).
Sub Areas are subject to change given the final development layout, however, provided the criteria of
directing as much catchment as possible to (or close to) the defined inlet locations is adhered to, the
final MUSIC results are not expected to change significantly.
Bureau of Meteorology rainfall and evaporation data for Narre Warren North (1984 - 1993) at 6 minute
intervals was utilised. This is the reference gauge defined by MWC for this area of Melbourne. Figure
5 details the model layout developed.
The modelled element characteristics are as detailed in Section 3.1 and the previous report. As
required by MWC for similar systems (e.g. Deep Creek South Wetland, December 2015), all wetland
as sediment ponds have been modelled separately.

12
Figure 5 MUSIC Model Schematic Note: Catchment delineation based on 2016 PSP proposals and is subject to change.

13
Table 3 MUSIC Results at Wetland and DS Outlet (External Catchments Included)
The current best practice requirements of 80% TSS, 45% TP and 45% TN retention can be met by
the combined wetland system and swale system. As such, the functional design of the elements
meets the requirements of the current Dore Road DS. It should be noted that the results shown in
Table 3 include the pollutants generated by the external catchments to the north. Once the external
catchment is removed from the modelling, as shown in Table 4, it is clear that the total treatment train
is adequately sized to treat stormwater to well in excess of best practice.
Table 4 MUSIC Results at Wetland and DS Outlet (External Catchments Excluded)
Sources Residual Load % ReductionFlow (ML/yr) 306 284 7.4Total Suspended Solids (kg/yr) 46100 3470 92.5Total Phosphorus (kg/yr) 105 21.6 79.5Total Nitrogen (kg/yr) 821 353 56.9Gross Pollutants (kg/yr) 9640 0 100.0Flow (ML/yr) 235 235 0.0Total Suspended Solids (kg/yr) 20300 4000 80.3Total Phosphorus (kg/yr) 61.3 32 47.8Total Nitrogen (kg/yr) 573 353 38.5Gross Pollutants (kg/yr) 3460 151 95.6Flow (ML/yr) 541 518 4.2Total Suspended Solids (kg/yr) 66300 7480 88.7Total Phosphorus (kg/yr) 167 53.6 67.8Total Nitrogen (kg/yr) 1390 707 49.3Gross Pollutants (kg/yr) 13100 151 98.8
Wet
land
Out
let
Swal
e O
utle
tTo
tal F
low
to
Deep
Cre
ek
Sources Residual Load Pollutants TreatedFlow (ML/yr) 306 284 22.0 81.4 224.6 10%Total Suspended Solids (kg/yr) 46100 3470 42630.0 9710 36390 100%Total Phosphorus (kg/yr) 105 21.6 83.4 24.8 80.2 100%Total Nitrogen (kg/yr) 821 353 468.0 209 612 76%Gross Pollutants (kg/yr) 9640 0 9640.0 2190 7450 100%Flow (ML/yr) 235 235 0.0 110 125 0%Total Suspended Solids (kg/yr) 20300 4000 16300.0 4900 15400 100%Total Phosphorus (kg/yr) 61.3 32 29.3 22.7 38.6 76%Total Nitrogen (kg/yr) 573 353 220.0 251 322 68%Gross Pollutants (kg/yr) 3460 151 3309.0 469 2991 100%Flow (ML/yr) 541 518 23.0 191.4 349.6 7%Total Suspended Solids (kg/yr) 66300 7480 58820.0 14610 51690 100%Total Phosphorus (kg/yr) 167 53.6 113.4 47.5 119.5 95%Total Nitrogen (kg/yr) 1390 707 683.0 460 930 73%Gross Pollutants (kg/yr) 13100 151 12949.0 2659 10441 100%
Pollutants Generated from
External Catchments
Pollutants Generated from all
Internal Catchments% Reduction
Wet
land
Out
let
Swal
e O
utle
tTo
tal F
low
to
Deep
Cre
ek
Treatment Train Effectivness at Outlet

14
5 Further Work Required The following further work is required as part of the design process going forward:
• Finalisation of the PSP land zonings (if there are any major changes, the wetland functional
design may need to be reviewed),
• Ecological and archaeological studies are required to ensure no adverse impacts to existing
site values,
• Confirmation of the Deep Creek flood level within the proposed swale given detailed design of
the land to the east and subsequent setting of required adjacent development fill levels, and
• Detailed survey of Deep Creek at, and downstream of, the gas easement (to Princess
Highway) to confirm outfall assumptions. This should include survey of the Princess Highway
Culverts.

15
6 File Control
File Name File Type Last Modified
Description
Functional Design Drawings:
1717_DORE_SWALE_1_9JUN17 .dwg 9/6/17 Functional Design Drawing of the swale showing plan
and locality.
1717_DORE_SWALE_2_9JUN17 .dwg 9/6/17 Functional Design Drawing of the swale Longitudinal
section
1717_DORE_SWALE_3_9JUN17 .dwg 9/6/17 Functional Design Drawing of the swale example
cross sections
1717_DORE_SWALE_4_9JUN17 .dwg 9/6/17 Functional Design Drawing of the swale example
cross sections
1717_DORE_SWALE_5_9JUN17 .dwg 9/6/17 Functional Design Drawing of the swale local outlet to
Deep Creek
RORB Modelling:
1987 IFD Loc 38_05S 145_525E .map 27/2/17 1987 IFD File to be run in RORB
1603_Dore_Rd_DSS_PostDev_7Oct16 .dwg 7/10/16 AutoCAD File showing RORB catchment delineations
and model schematic.
1603_Dore_Rd_DSS_RORB_POST_V6_7Oct16 .xlsx 16/11/16
A control Excel File tabulating all the information
(Area’s, Fimp, Reach Length & Slope) from the
AutoCAD file
1603_Dore_Rd_DSS_Swale_PostDev_Outflow_V1_27Feb17 .cat 27/2/17
Catchment File containing all information for the
development simulation including wetland
characteristics

16
File Name File Type Last Modified
Description
Hydraulic Calculations
1717_Dore_Rd_Swale_Details_V4_8Jun17 .xlsx 8/6/17
Control Excel File detailing all pipe sizing
calculations, cross section determination, longitudinal
sections etc for HecRas Modelling.
1717_DSwale_V4_8Jun17 .prj (and other
associated file
types)
8/6/17 Georeferenced HecRas File of the proposed Swale
Design
1717_DSwale_V4_Centreline_8Jun17 .shp 8/6/17 Shapefile containing details on the river centreline
information used in HecRas
1717_DSwale_V4_XSCutLines_8Jun17 .shp 8/6/17 Shapefile containing details on the Cross-Section
information used in HecRas
MUSIC Modelling
1603_Dore_Rd_Swale_V4_6Mar17 .sqz 8/6/17 The base MUSIC model used to assess the treatment
effectiveness of the DS.
1717_Dore_Road_Swale_MUSIC_Results_8Jun17 .xlsx 8/6/17 Excel File to compile MUSIC results

17
7 Abbreviations, Descriptions and Definitions The following table lists some common abbreviations and drainage system descriptions and their
definitions which are referred to in this report.
Abbreviation Descriptions Definition AHD - Australian Height Datum
Common base for all survey levels in Australia. Height in metres above mean sea level.
AEP – Annual Exceedance Probability
The probability of an event being exceeded per year. i.e. 1% AEP = 100 Year ARI event.
ARI - Average Recurrence Interval.
The average length of time in years between two floods of at least a given size. A 100 Year ARI event has a 1% chance of occurring in any one year.
DSS
Development Services Scheme – catchment drainage strategies developed, implemented and run by MWC.
EY – Exceedances per Year
Magnitude of event that is expected to be exceeded X times per year. i.e. 4 EY = 3-month ARI event.
Grassed Swale
A small shallow grassed drainage line designed to convey stormwater discharge. A complementary function to the flood conveyance task is its WSUD role (where the vegetation in the base acts as a treatment swale).
Hectare (ha) 10,000 square metres Kilometre (km) 1000 metres m3/s -cubic metre/second
Unit of discharge usually referring to a design flood flow along a stormwater conveyance system
Megalitre (ML) (1000 cubic metres)
1,000,000 litres = 1000 cubic metres Often a unit of water body (e.g. pond) size
MUSIC Hydrologic computer program used to calculate stormwater pollutant generation in a catchment and the amount of treatment which can be attributed to the WSUD elements placed in that catchment
MWC Melbourne Water Corporation Retarding basin
A flood storage dam which is normally empty. May contain a lake or wetland in its base
Normal Water Level (NWL)
Water level of a wetland or pond defined by the lowest invert level of the outlet structure
RORB
Hydrologic computer program used to calculate the design flood flow (in m3/s) along a stormwater conveyance system (e.g. waterway)
Sedimentation basin (Sediment pond)
A pond that is used to remove coarse sediments from inflowing water mainly by Settlement processes.
Surface water All water stored or flowing above the ground surface level Total Catchment Management
A best practice catchment management convention which recognises that waterways and catchments do not stop at site boundaries and decisions relating to surface water management should consider the catchment as a whole
TSS Total Suspended Solids – a term for a particular stormwater pollutant parameter
TP Total Phosphorus – a term for a particular stormwater pollutant parameter TN Total Nitrogen – a term for a particular stormwater pollutant parameter Extended Detention Range of water level rise above normal water level where stormwater is
temporarily stored for treatment for a certain detention period (usually 48 – 72 hours in a wetland system)
WSUD - Water Sensitive Urban Design
Term used to describe the design of drainage systems used to o Convey stormwater safely o Retain stormwater pollutants o Enhance local ecology o Enhance the local landscape and social amenity of built areas
Wetland
WSUD elements which are used to collect TSS, TP and TN. Usually incorporated at normal water level (NWL) below which the system is designed as shallow marsh, marsh, deep marsh and open water areas.

18
Appendix A – Functional Design Drawings Note that the drawings detailed have been modified from the AutoCAD set. The AutoCAD drawings
should be referred to for the full design detail.

SWALE DESIGN IL
1% AEP LEVEL
EXSITING LEVEL AT 100m OFFSET
PROPOSED LEVEL AT 100m OFFSET
PROPOSED FREEBOARD ABOVE 1% AEP LEVEL
FILL REQUIRED AT 100m OFFSET
(m AHD) (m AHD) (m AHD) (m AHD) (m) (m)
0 40.15 42.50 43.00 43.00 0.50 0.00
47 40.15 42.50 43.00 43.00 0.50 0.00
139 43.75 44.09 44.25 44.40 0.31 0.15
165 44.25 44.67 44.50 45.01 0.34 0.51
190 43.85 44.86 44.75 44.88 0.02 0.13
221 44.05 45.01 44.75 44.99 -0.02 0.24
281 44.55 45.41 45.10 45.40 -0.01 0.30
309 44.75 45.62 45.30 45.62 0.00 0.32
345 45.15 45.94 45.50 45.95 0.01 0.45
400 45.35 46.29 45.80 46.31 0.02 0.51
450 45.55 46.53 46.20 46.53 0.00 0.33
527 46.20 47.07 46.60 47.03 -0.04 0.43
610 46.65 47.59 47.00 47.61 0.02 0.61
642 47.05 47.83 47.60 47.82 -0.01 0.22
699 47.33 48.26 48.20 48.27 0.01 0.07
750 47.50 48.57 48.60 48.87 0.30 0.27
773 48.00 48.88 48.75 49.05 0.17 0.30
822 48.90 49.78 49.15 50.16 0.38 1.01
904 49.45 50.50 50.00 50.81 0.31 0.81
966 49.71 50.91 50.50 51.20 0.29 0.70
1008 49.89 51.13 50.85 51.44 0.31 0.59
1054 50.08 51.35 51.20 51.65 0.30 0.45
1106 50.30 51.60 51.50 51.90 0.30 0.40
1161 50.53 51.63 51.90 52.03 0.40 0.13
1263 50.96 51.66 51.75 52.04 0.38 0.29
1369 51.40 51.83 51.50 52.10 0.27 0.60
CROSS SECTION


24
Appendix B – Hydraulic Modelling of the Swale Proposal Hydraulic modelling of the proposed swale system has been completed using HecRas. Cross section
locations have been taken as shown in Figure 4. Care has been taken to incorporate sections that
align with the 2014 floodplain sections so that accurate comparisons could be made between the two
models.
The HecRas cross sections have been georeferenced using the QGis plugin “RiverGIS”.
Four versions of the proposed swale (alignment and depth variable) have been iterated through in
Hec Ras to develop the proposed design. Initial sizing’s were completed using Mannings calculations.
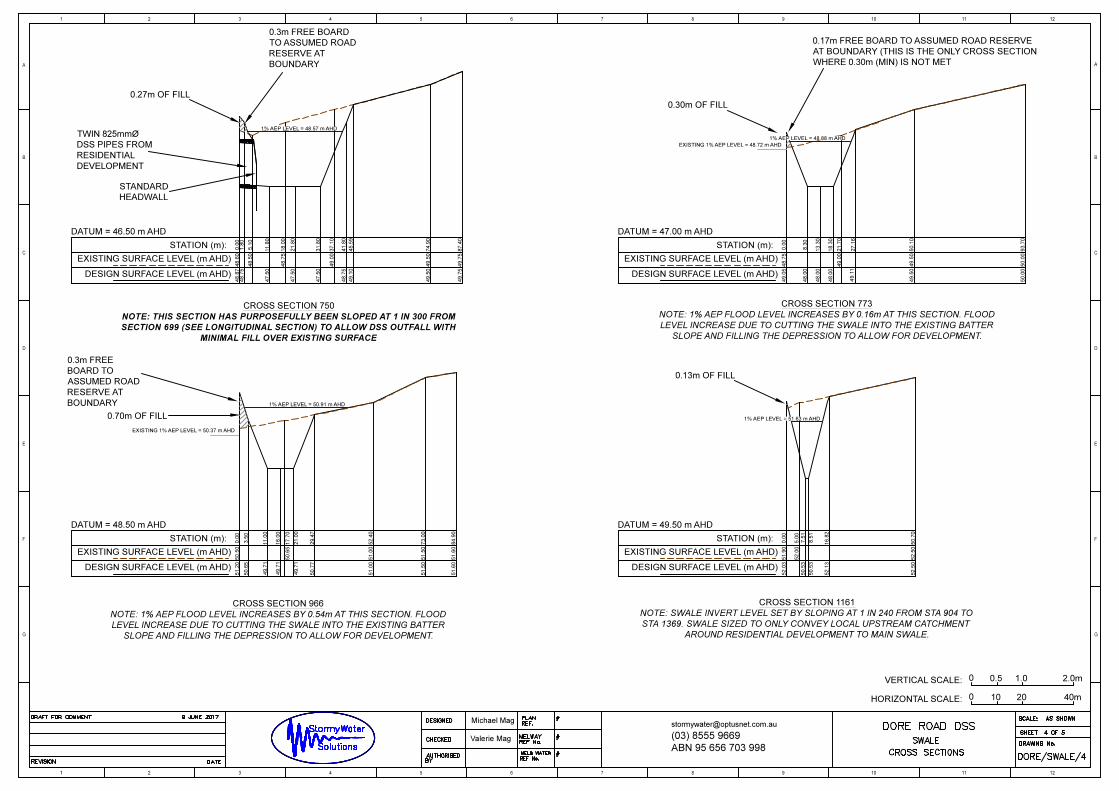
General cross sections are shown in the functional design drawings DORE/SWALE/3 & 4. Flows as
detailed in Table 1 have been used along the swale. A downstream starting water level boundary
condition has been used at 42.50 m AHD which represents the Dore Road RB at the 1% AEP level
assuming Deep Creek is also in flood.
The model has been run assuming interpolated cross sections at 5m intervals. Table B.1 below
summarises the results for all cross sections. As can be seen, all sections have a velocity less than
1.5 m/s thus meeting the MWC safety criteria. Table B.1 also details the calculations for the fill levels
at the 100m offset interface with the PSP land zonings.
Table B.1 HecRas results for all cross sections
SWALE DESIGN IL
1% AEP LEVEL
1% AEP CHANNEL VELOCITY
EXSITING LEVEL AT 100m OFFSET
PROPOSED LEVEL AT 100m OFFSET
PROPOSED FREEBOARD ABOVE 1% AEP LEVEL
FILL REQUIRED AT 100m OFFSET
(m AHD) (m AHD) (m/s) (m AHD) (m AHD) (m) (m)0 40.15 42.50 0.02 43.00 43.00 0.50 0.0047 40.15 42.50 0.03 43.00 43.00 0.50 0.00
139 43.75 44.09 1.44 44.25 44.40 0.31 0.15165 44.25 44.67 1.18 44.50 45.01 0.34 0.51190 43.85 44.86 0.57 44.75 44.88 0.02 0.13221 44.05 45.01 0.81 44.75 44.99 -0.02 0.24281 44.55 45.41 0.79 45.10 45.40 -0.01 0.30309 44.75 45.62 0.88 45.30 45.62 0.00 0.32345 45.15 45.94 0.93 45.50 45.95 0.01 0.45400 45.35 46.29 0.69 45.80 46.31 0.02 0.51450 45.55 46.53 0.72 46.20 46.53 0.00 0.33527 46.20 47.07 0.87 46.60 47.03 -0.04 0.43610 46.65 47.59 0.74 47.00 47.61 0.02 0.61642 47.05 47.83 0.86 47.60 47.82 -0.01 0.22699 47.33 48.26 0.81 48.20 48.27 0.01 0.07750 47.50 48.57 0.69 48.60 48.87 0.30 0.27773 48.00 48.88 1.40 48.75 49.18 0.30 0.43822 48.90 49.78 1.16 49.15 50.16 0.38 1.01904 49.45 50.50 0.82 50.00 50.81 0.31 0.81966 49.71 50.91 0.82 50.50 51.20 0.29 0.701008 49.89 51.13 0.71 50.85 51.44 0.31 0.591054 50.08 51.35 0.69 51.20 51.65 0.30 0.451106 50.30 51.60 0.67 51.50 51.90 0.30 0.401161 50.53 51.63 0.14 51.90 52.03 0.40 0.131263 50.96 51.66 0.26 51.75 52.04 0.38 0.291369 51.40 51.83 0.20 51.50 52.13 0.30 0.63
CROSS SECTION

25
Figure B.1 HecRas Longitudinal Section (Reproduced in drawing DORE/SWALE/2)
26
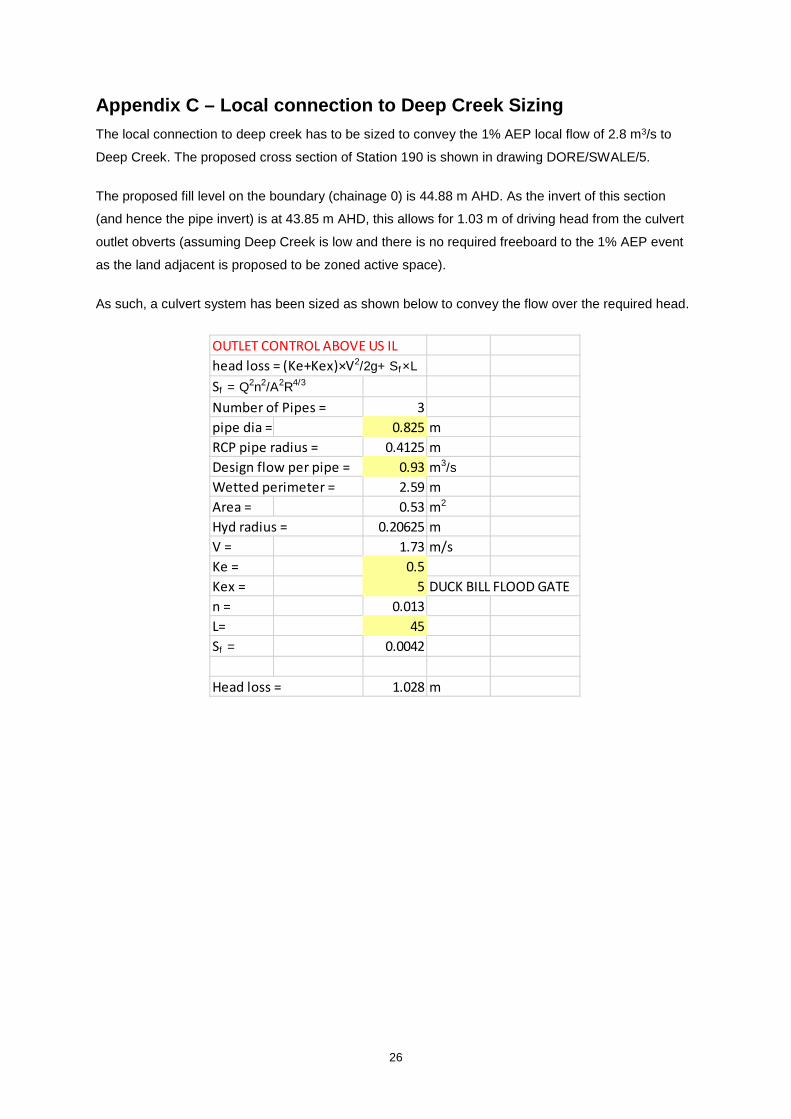
Appendix C – Local connection to Deep Creek Sizing The local connection to deep creek has to be sized to convey the 1% AEP local flow of 2.8 m3/s to
Deep Creek. The proposed cross section of Station 190 is shown in drawing DORE/SWALE/5.
The proposed fill level on the boundary (chainage 0) is 44.88 m AHD. As the invert of this section
(and hence the pipe invert) is at 43.85 m AHD, this allows for 1.03 m of driving head from the culvert
outlet obverts (assuming Deep Creek is low and there is no required freeboard to the 1% AEP event
as the land adjacent is proposed to be zoned active space).
As such, a culvert system has been sized as shown below to convey the flow over the required head.
OUTLET CONTROL ABOVE US ILhead loss = (Ke+Kex)×V2/2g+ Sf×LSf = Q2n2/A2R4/3
Number of Pipes = 3pipe dia = 0.825 mRCP pipe radius = 0.4125 mDesign flow per pipe = 0.93 m3/sWetted perimeter = 2.59 mArea = 0.53 m2
Hyd radius = 0.20625 mV = 1.73 m/sKe = 0.5Kex = 5 DUCK BILL FLOOD GATEn = 0.013L= 45Sf = 0.0042
Head loss = 1.028 m

27
Appendix D – MWC DS Pipeline Concept Design The concept design sizing of the MWC DS pipe from the residential zoned land is shown below. The
pipes have been sized as 18.13% AEP culverts that enter the swale at Station 750.
Note: Design Flow = 1.4 m3/s, so twin 825mmØ required.
It is crucial that MWC restrict the final size of the DS pipe(s) to less than (or equal to) a maximum
diameter of 825mm. Currently, rough estimates put the cover over 825mmØ pipes at approximately
700mm at the connection to the swale (Station 750) with the fill level at the boundary set by the 1%
AEP floodplain level within the swale (1% AEP level + 300mm). If the DS pipe size is increased, the
fill level at the boundary will be then set by the cover requirements on the DS pipe which will reduce
the $1,500,000 saving on fill SWS has provided to the developers of the residential land as extra
filling to cover the DS pipes will reduce the saving.
Capacity 18.13% AEP Pipes From Dev (RORB = 1.4 m 3 /s)
Diameter 0.825 mRadius 0.4125 m
Area 0.53 m2
WP 2.59 mHydraulic 0.20625 mHGL slope 0.003 m/mn 0.013 s/m1/3
Capacity 0.83 m3/sVelocity 1.55 m/s
Pipe Mannings

Hydrological and Environmental Engineering
Addendum 1: Pakenham East Precinct Structure Plan
Deep Creek Corridor Proposals
5 October 2014
Report by: Valerie Mag BE Civil (Hons), M Eng Sci
Stormy Water Solutions [email protected]
Ph 9511 5911, M 0412 436 021

Contents 1. INTRODUCTION ......................................................................................................................... 1
2. CURRENT PSP PROPOSALS IN RELATION TO DEEP CREEK ........................................ 2
3. HYDROLOGICAL MODELLING - DEEP CREEK ................................................................ 3
4. HEC RAS MODELLING - EXISTING CONDITIONS ............................................................ 5
4.1 DEEP CREEK RETARDING BASIN TO RYAN ROAD .................................................................... 5 4.2 EXISTING RYAN ROAD CULVERT SYSTEM ............................................................................... 8 4.3 RYAN ROAD TO PRINCES HIGHWAY ........................................................................................ 9 4.4 EXISTING PRINCES HIGHWAY CULVERT SYSTEM .................................................................. 11 4.5 UPSTREAM OF PRINCES HIGHWAY ......................................................................................... 11
5. DEEP CREEK CORRIDOR PSP IMPLICATIONS ............................................................... 16
6. HEC RAS MODELLING - INCORPORATING DEEP CREEK CORRIDOR WORKS .... 20
6.1 DEEP CREEK RETARDING BASIN TO RYAN ROAD .................................................................. 20 6.2 UPGRADED RYAN ROAD CULVERT SYSTEM .......................................................................... 20 6.3 RYAN ROAD TO PRINCES HIGHWAY ...................................................................................... 21 6.4 EXISTING PRINCES HIGHWAY CULVERT SYSTEM .................................................................. 22 6.5 UPSTREAM OF PRINCES HIGHWAY ......................................................................................... 22
7. CONCLUSIONS AND FURTHER WORK REQUIRED ........................................................ 23
APPENDIX A RORB MODEL CONTROL VECTOR .............................................................. 24
APPENDIX B - RYAN ROAD CULVERT ANALYSIS (EXISTING CONDITIONS) ................ 25
APPENDIX C – PRINCES HIGHWAY CULVERT ANALYSIS (EXISTING CONDITIONS) . 27
APPENDIX D - RYAN ROAD CULVERT ANALYSIS (FUTURE CONDITIONS) .................... 29

1
1. Introduction In March 2013, Stormy Water Solutions produced a report entitled “Pakenham East Precinct
Structure Plan, Proposed Drainage Strategy, Draft Report”. This 2013 report considered the
major drainage, flooding and water quality management issues within the Pakenham East
Precinct Structure Plan (PSP) area to define potential land take requirements required by
major drainage assets.
As part of the 2013 work Stormy Water Solutions developed various strategy options for
consideration. In this way, council could incorporate various scenarios in relation to drainage
requirements and ultimately adopt a PSP formulation which optimises all PSP objectives, not
just the drainage requirements. Melbourne Water Corporation (MWC) subsequently commented on the draft report and
options. Of particular concern was the corridor proposed for Deep Creek. The current PSP
Proposals generally show:
• a 50 metre reserve on the west of Deep Creek and a 100 m reserve of the east of
Deep Creek downstream of Princes Highway, and
• 100 m reserve of the east of Deep Creek upstream of Princes Highway
• An assumption that any future development west of Deep Creek upstream of Princes
Highway would require a 50 m reserve to be consistent with the above. However, in
the interim, the UFZ line (which is consistent with the declared flood plain line) could
be assumed.
The two major issues identified by MWC in relation to the Deep Creek Corridor were:
• By setting the development line on either side of Deep Creek, as per Councils 2013
proposal, flows will be restricted and future development will be required to be filled to
MWC standards to ensure adequate flood protection. This may result in a small
increase in flood levels, and
• The PSP plan did not appear to address the breakaway flow from Deep Creek
towards the south-east, where flows outfall at the Princes Freeway. Melbourne Water
suggested that this could be addressed by either:
a) Upgrading (/ increase the capacity of) Deep Creek downstream of Ryan
Road, including upgrading the bridge; or
b) Set aside land in the FUS plan to allow for breakaway flows to extend down
to the proposed retarding basin at the Princes Freeway.
This report addresses the above two issues to clearly show that the Deep Creek Corridor
proposals are sufficient to allow future works to address the above concerns. This report also
proposals some downstream works (in line with (a) above) to ensure current flood protection
provisions downstream of Ryan Road are not compromised.
2
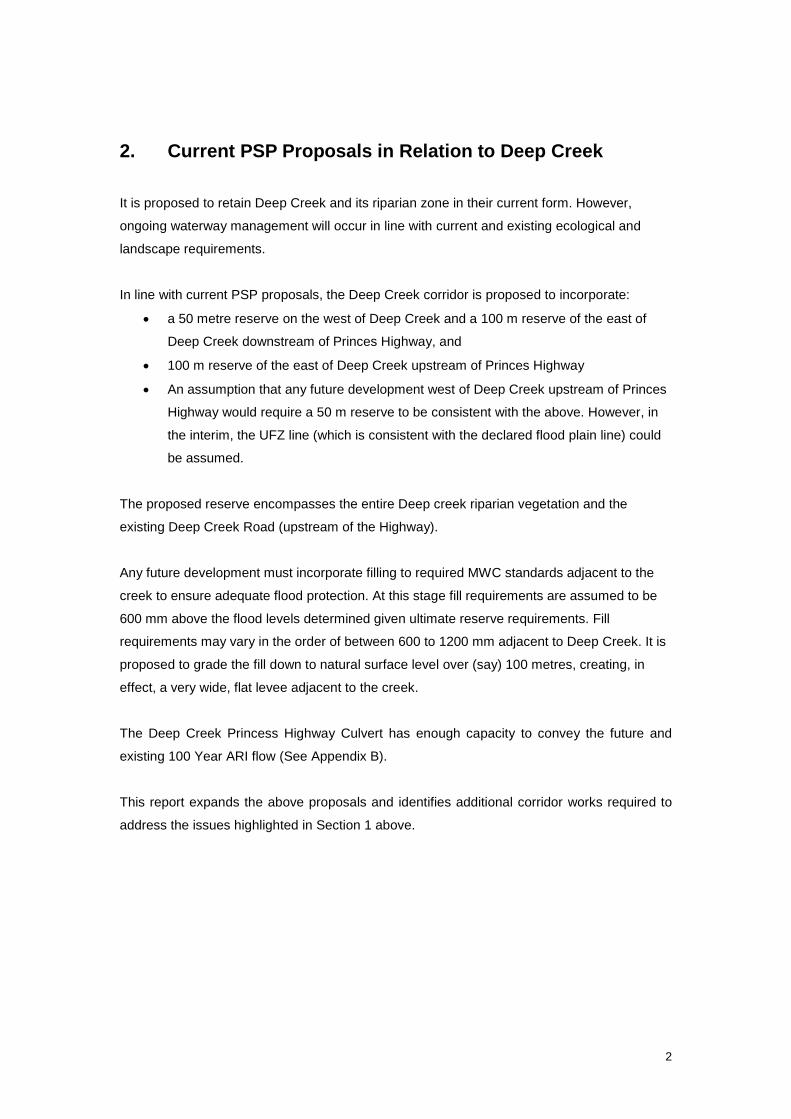
2. Current PSP Proposals in Relation to Deep Creek
It is proposed to retain Deep Creek and its riparian zone in their current form. However,
ongoing waterway management will occur in line with current and existing ecological and
landscape requirements.
In line with current PSP proposals, the Deep Creek corridor is proposed to incorporate:
• a 50 metre reserve on the west of Deep Creek and a 100 m reserve of the east of
Deep Creek downstream of Princes Highway, and
• 100 m reserve of the east of Deep Creek upstream of Princes Highway
• An assumption that any future development west of Deep Creek upstream of Princes
Highway would require a 50 m reserve to be consistent with the above. However, in
the interim, the UFZ line (which is consistent with the declared flood plain line) could
be assumed.
The proposed reserve encompasses the entire Deep creek riparian vegetation and the
existing Deep Creek Road (upstream of the Highway).
Any future development must incorporate filling to required MWC standards adjacent to the
creek to ensure adequate flood protection. At this stage fill requirements are assumed to be
600 mm above the flood levels determined given ultimate reserve requirements. Fill
requirements may vary in the order of between 600 to 1200 mm adjacent to Deep Creek. It is
proposed to grade the fill down to natural surface level over (say) 100 metres, creating, in
effect, a very wide, flat levee adjacent to the creek.
The Deep Creek Princess Highway Culvert has enough capacity to convey the future and
existing 100 Year ARI flow (See Appendix B).
This report expands the above proposals and identifies additional corridor works required to
address the issues highlighted in Section 1 above.

3
3. Hydrological Modelling - Deep Creek Hydrological Modelling using the RORB model was developed for this study by SWS to
estimate flood flows within Deep Creek. MWC have advised that the flood plain was declared
assuming a 100 Year ARI flow of 43 m3/s. The RORB model was developed to:
• Confirm this flow assumption,
• Account for flow reductions in upstream reaches, and
• Account for catchment development as per PSP proposals.
The analysis below only considers the 100 Year ARI storm events. Consideration of this event
will provide realistic site delineation of the Deep Creek Corridor extent. Appendix A details the
RORB model control vector. As detailed subareas H and I incorporate a fraction impervious of
0.6 to account for future development in these areas (accounting for future council reserves
and the existing UFZ north of Princes highway and west of Deep Creek.
The regional parameter set developed by Melbourne Water for the South East region of
Melbourne was utilised. This relationship is detailed below. Table 1 details the RORB results
for Deep Creek
Kc = 1.53A0.55 = 7.0 (area = 15.9 km2) m = 0.8
Initial loss = 10 mm
Pervious area runoff coefficient, 100 year = Cperv = 0.6 mm
Pakenham Upper rainfall intensities were utilised.
Table 1 RORB Results
Location
100 Year ARI Design Flow
(m3/s)
Critical Duration (hours)
End Reach 10 24.3 9Upstream Reach 12 27.2 9Reach 13 input 8.1 1 6.6 (9hr)Upstream Reach 14 33.8 9Reach 15 input 11.1 2 6.9 (9hr)Deep Creek at Princes Highway 40.7 9Deep Creek at Ryan Road 40.4 9Deep Creek into Deep Creek RB 42.8 9

4
Figure 1 Deep Creek RORB Model The rational method calculated a 100 Year ARI flow at the Deep Creek Retarding basin of
38.2 m3/s (C=0.4, time of concentration = 3 hours. The DSE regional flow estimate graphs for
rural catchment calculates a 100 Year ARI flow at the Deep Creek Retarding basin 38.5 m3/s.
The flow of 42.8 m3/s is consistent with previous MWC assumptions (43 m3/s as advised by
Mark Warren in September 2014).
Given the above the flows above are considered reasonable to adopt in regard to assessing
the flooding implications along the Depp Creek corridor upstream of the Deep Creek
Retarding Basin.

5
4. Hec Ras Modelling - Existing Conditions
4.1 Deep Creek Retarding Basin to Ryan Road
The Hec Ras model described below was used to assess existing flood levels downstream of
Ryan Road. This was done so that a “base” case could be determined to assess any potential
PSP implications downstream of Ryan Road.
This model was constructed utilising:
• The design flow detailed above 43 m3/s,
• A starting water level of 23.2 m AHD which is the declared flood level at Section 0),
• 0.5 metre Lidar information provided by Council,
• DVA drawing set 1606/1 which detailed flood mitigation works (1989) downstream of
Ryan Road,
• Manning n of 0.05 for flood plain areas associated with paddocks or the golf course,
• Mannings n values of 0.05 to 0.06 for cleared drainage lines, and
• Mannings n values of 0.09 for drainage paths incorporating in stream vegetation.
Examination of the Lidar information suggested that the northern levee bank works directly
downstream of Ryan Road were not included in the 1989 design plan set. The declared flood
plain plans suggest the levee works were actually completed about 1992. As noted on one of
the MWC declared flood plain plans, the aim of these works was to provide 100 year
protection to the low density properties located north of Deep Creek, directly downstream of
Ryan Road. However, other information suggests a capacity less than the 100 year flow (35
m3/s as per the levee design plans).
Given the above, the cross section in this area of the creek were derived using a combination
of the 1989 design plan information and the recent Lidar survey information.
The above is considered accurate enough to:
• Assess if existing flood levels are consistent with the declared flood levels, and
• To assess the impact of upstream PSP proposals along this section of creek.
However, actual flood levels should be determined at the functional design stage of the
project given detailed site survey information.
In addition to the above a flow of 18 m3/s was also run through the model. This was done to
clearly show that the declared flood levels were based, conservatively, assumed that the total

6
design flow of 43 m3/s and did not account for any breakaway flow to the south upstream of
Ryan Road. This is considered a reasonable assumption as:
• The email advice from Keith Boniface of Melbourne Water dated 1/2/13 stating “ the
breakaway flow at the south end adjacent to Ryan Road, I think, has been eliminated
or at least reduced in subsequent works”,
• hand written notes on the MWC declared flood level plan indicate some filling
upstream of Ryan Road and construction of a house on Canty Land may limit
breakaway flow south, and
• A large proportion of any breakaway south may actually be directed west to Ryan
Road due to the relatively hydraulic smoothness of Canty Lane as opposed to the
surrounding land types.
Figure 2 shows the calculated flood levels assuming a design flow of 43 m3/s. Table 2
details the calculated flood levels (43 m3/s) compared with the MWC declared flood
levels.
Figure 2 Deep Creek - Existing Flood Levels Downstream of Ryan Road Blue text – Hec Ras Chainage Red Text = 2014 Calculated flood level (existing situation)
Blue line – declared flood plain extent which gives an indication (only) of the extent of inundation in the 100 Year ARI event.

7
Table 2 Hec Ras Results (43 m3/s) compared with Declared Flood Plain Levels
Chainage (m) Declared Flood Level Assumed 100 year Flow 100 Year Level Change between Declared Level and 2014 Calculated
Level (mm)(m AHD)* (m3/s) (m AHD)
1285 33.7 43 34.04 3401240 33.26 43 33.83 5701150 33.19 43 33.19 01045 32.63 43 32.28 -350965 31.68 43 31.67 -10835 30.85 43 30.69 -160740 29.75 43 29.73 -20645 28.61 43 28.61 0545 27.62 43 27.51 -110445 26.71 43 26.59 -120345 25.6 43 25.64 40245 24.61 43 24.64 30125 23.5 43 23.59 90
0 23.2 43 23.2 0
The results indicate that the expected 100 Year ARI flood levels are generally at or below the
declared flood plain levels.
Flood levels are probably lower between chainages 835 and 1045 due to the declared flood
levels possibly not accounting for the constructed on line pond in this area (the pond was
constructed in 1989, and the survey used to define the flood plain for the flood plain
declaration was completed in 1978).
In addition, flood levels are higher just downstream of Ryan Road, possibly due to the flood
levels possibly not accounting for the constructed northern levee in the area (again this levee
was only constricted in 1992). As shown in Figure 3 below, it is estimated that the levee just
contains the 100 Year flow of 43 m3/s (as was inferred in the declared flood plain plan set).
Figure 3 Ch 1240 - Looking Downstream
Table 3 details the calculated flood levels (18 m3/s) compared with the MWC declared flood
levels. This analysis was undertaken to investigate if the declared flood levels accounted for
any breakaway flow to the south upstream of Ryan Road. As detailed, calculated flood levels

8
are generally much lower than the declared flood levels, indicating that MWC, conservatively,
assumed no breakaway flow when setting flood levels in this area in the past. This is
considered a prudent assumption the issues highlighted above.
Table 3 Hec Ras Results (18 m3/s) compared with Declared Flood Plain Levels
Chainage (m) Declared Flood Level Assumed 100 year Flow 100 Year Level Change between Declared Level and 2014 Calculated
Level (mm)(m AHD)* (m3/s) (m AHD)
1285 33.7 18 33.63 -701240 33.26 18 33.45 1901150 33.19 18 32.72 -4701045 32.63 18 31.73 -900965 31.68 18 31.5 -180835 30.85 18 30.46 -390740 29.75 18 29.63 -120645 28.61 18 28.48 -130545 27.62 18 27.38 -240445 26.71 18 26.47 -240345 25.6 18 25.55 -50245 24.61 18 24.53 -80125 23.5 18 23.51 10
0 23.2 18 23.2 0 The results do show that fill and flood levels downstream of Ryan Road do account for a
design flow in this area of 43 m3/s, not 18 m3/s. As such, the PSP proposals in regard to
assuming minimal breakaway flows to the south upstream of Ryan Road should not impact on
flood protection provisions in this area.
It is considered that enough work has been completed for Council to move forward in
confidence in regard to the PSP proposals in regard to reserve and overland flow path
provisions upstream of Ryan Road. However, detailed design of the Deep Creek Reserve
Corridor upstream of Ryan Road (see Section 5 below) should include detailed survey and
updated modelling of the channel and levee downstream of Ryan Road to confirm the above
results.
4.2 Existing Ryan Road Culvert System
The declared flood level directly upstream of Ryan Road is 34.2 m AHD.
A culvert and weir flow analysis (Appendix B) calculated a 100 Year flood level (assuming a
design flow of 43 m3/s) of 34.25 m AHD (15 m3/s in the culvert system and 28 m3/s over the
road). If 18 m3/s design flow is assumed a 100 Year ARI flood level of 34.1 m AHD (11 m3/s in
the culvert system and 7 m3/s over the road).

9
Again, the results do show that fill and flood levels directly upstream of Ryan Road do
account for a design flow in this area of 43 m3/s, not 18 m3/s.
However the results do indicate that there is an argument to upgrade the Ryan Road culvert
system given the development which has occurred in the area over the last 25 years and the
potential development in the PSP area. Flow over the road of 28m3/s may be justified in a
rural context, but possibly not when the population using the road drastically increases.
4.3 Ryan Road to Princes Highway
The Hec Ras model described below was used to assess existing flood levels between Ryan
Road and Princes Highway. Again, this was done so that a “base” case could determine to
assess any potential PSP implications between Ryan Road and Princes Highway.
This model was constructed utilising:
• The design flows detailed in Section 3,
• A starting water level of 34.25 m AHD which is the flood level calculate in Section 4.2
above at Section 1325),
• 0.5 metre Lidar information provided by Council, and
• Manning n of 0.05 for flood plain areas associated with paddocks,
• Mannings n values of 0.09 to 0.15 for to account for the vegetation in and adjacent to
Deep Creek in this section of waterway.
The above is considered accurate enough to:
• Assess if existing flood levels are consistent with the declared flood levels, and
• To assess the impact of upstream PSP proposals along this section of creek.
Actual flood levels should be determined at the functional design stage of the project given
detailed site survey information.
Figure 4 shows the calculated flood levels. Table 4 details the calculated flood levels
compared with the MWC declared flood levels. Examination of the cross sections indicated
that, although there are informal levees either side of Deep Creek, in this section of waterway,
in the 100 Year event the system acts as one united cross section.

10
Figure 4 Deep Creek - Ryan Road to Princes Highway
Blue text – Hec Ras Chainage Red Text = 2014 Calculated flood level (existing situation)
Blue line – declared flood plain extent which gives an indication (only) of the extent of inundation in the 100 Year ARI event

11
Table 4 Hec Ras Results compared with Declared Flood Plain Levels
Chainage (m) Declared Flood Level Assumed 100 year Flow 100 Year Level Change between Declared Level and 2014 Calculated
Level (mm)(m AHD)* (m3/s) (m AHD)
2330 41.8 41 41.74 -602200 40.76 41 40.71 -502055 39.2 41 39.18 -201990 38.72 41 38.67 -501860 37.52 41 37.37 -1501780 36.81 41 36.68 -1301695 36.27 41 36.08 -1901655 36.04 41 35.83 -2101435 34.61 41 34.74 1301385 34.4 41 34.51 1101325 34.2 41 34.25 50
As detailed, flood levels are generally close to, or less than, the declared flood levels. This
may be because the declared flood level plans (1978) may not have extended to include the
full with of the flood plain. Flood levels may be slightly higher immediately upstream of Ryan
Road, possibly due to a higher Manning n used than in the original flood plain declaration.
It is considered that the 2014 levels calculated above are reasonable to compare PSP
impacts against (See Section 6 below)
4.4 Existing Princes Highway Culvert System
The declared flood level directly upstream of Ryan Road is 42.33 m AHD.
A culvert analysis (Appendix C) calculated a 100 Year flood level (assuming a design flow of
40.7 m3/s) of 42.35 m AHD.
The culverts are not running under pressure in the 100 Year ARI event and do not need to be
upgraded due to PSP implications.
4.5 Upstream of Princes Highway
The Hec Ras model described below was used to assess existing flood levels upstream of
Princes Highway. Again, this was done so that a “base” case could determined to assess any
potential PSP implications in this area of the Deep Creek corridor.
This model was constructed utilising:
• The design flows detailed in below,
• A starting water level of 42.35 m AHD which is the flood level calculate in Section 4.4
above at Section 2430),

12
• 0.5 metre Lidar information provided by Council, and
• Manning n values as detailed in Figure 6 below.
Again, the above is considered accurate enough to assess if existing flood levels are
consistent with the declared flood levels and to assess the impact of upstream PSP proposals
along this section of creek. Figure 5 shows the calculated flood levels. Table 6 details the
calculated flood levels compared with the MWC declared flood levels.
Figure 5 Deep Creek - Upstream of Princes Highway
Blue text – Hec Ras Chainage Red Text = 2014 Calculated flood level in Deep Creek (existing situation)
Pink Text = 2014 Calculated flood level in Western Flood Plain (existing situation) Black Text = 2014 Calculated flood level in Eastern Flood Plain (existing situation) Blue line = declared flood plain extent (an indication only of the extent of inundation in the 100 Year ARI event)

13
Figure 6 Deep Creek - Typical Cross Section Upstream of Princes Highway (3110)
As detailed below, it is clear that upstream of Princes Highway, the flows in Deep Creek, the
eastern and Western floodplains act independently. That is, once flow enters the eastern or
western flood plain, it cannot re-enter Deep Creek. Also, once flow leaves Deep Creek (by
flowing over its adjacent levees or Deep Creek Road) it cannot re-enter the creek. The only
Cross Section where flows combine is directly upstream of Princes Highway due to the table
drain interaction.
Given this aspect of the flow process, three Hec Ras models were created as detailed for the
channel, eastern and western floodplains. An iterative process determined how much flow
could be contained within Deep Creek and where flow would be contained within the relevant
flood plain. Flow splits are detailed below. Largely flows were for the 9 hour duration storm.
However, higher flows than the 9 hour storm were used for the upper cross sections in the
western flood plain due flows from the local catchment being higher than the 9 hour deep
creek input at this location. This may explain the higher flood level produced at change 3320
in the western flood plain.

14
Table 5 Flow splits – Deep Creek upstream of Princes Highway Cross Section Total Deep Creek Contribution Western Flood Plain Eastern Flood Plain
Total Deep Creek
Contribution
Western Flood Plain Channel
Eastern Flood Plain
Assumed Flow from local catchment
Total in flood plain including
Deep Creek Breakaway
Assumed Flow from local catchment
Total in flood plain including
Deep Creek Breakaway
3790 27.2 0 13 14.2 0 03.5 (50% local
catchment) 17.7
3560 27.2 0 13 14.2 0 05 (75% local catchment) 19.2
3320 27.2 0 13 14.2 8 (2hr) 8 (2hr)6.9 (100 % local
catchment) 21.1
3110 27.2 0 13 14.2 8 (2hr) 8 (2hr)6.9 (100 % local
catchment) 21.1
2580 27.3 3 7.1 17.2 6.9 9.96.9 (100 % local
catchment) 24.1
2530 27.3 3 7.1 17.2 6.9 9.96.9 (100 % local
catchment) 24.1
2430 27.3 3 7.1 17.2 6.9 9.96.9 (100 % local
catchment) 24.1All Critical Durations 9 hours unless specified)Bold and italic - flows used in Hec Ras model
It should be noted, that in regard to flood protection under existing conditions, the relevant
flood level is the flood level calculated in the flood plains, not the higher flood level in Deep
Creek.

15
Table 6 Hec Ras Results compared with Declared Flood Plain Levels Deep Creek Channel and Riparian Zone
Chainage (m) Declared Flood Level Assumed 100 year Flow 100 Year Level Change between Declared Level and 2014 Calculated
Level (mm)(m AHD) (m3/s) (m AHD)
3790 52.64 13 52.97 3303560 50.28 13 51.48 12003320 48.73 13 49.62 8903110 47.62 13 48.39 7702850 45.39 7.1 46.02 6302530 43.47 7.1 43.83 3602430 42.33 7.1 42.42 90
Eastern Flood Plain
Chainage (m) Declared Flood Level Assumed 100 year Flow 100 Year Level Change between Declared Level and 2014 Calculated
Level (mm)(m AHD) (m3/s) (m AHD)
3790 52.64 17.7 52.67 303560 50.28 19.2 50.37 903320 48.73 21.1 48.72 -103110 47.62 21.1 47.46 -1602850 45.39 24.1 45.7 3102530 43.47 24.1 43.21 -2602430 42.33 24.1 42.35 20
Western Flood Plain
Chainage (m) Declared Flood Level Assumed 100 year Flow 100 Year Level Change between Declared Level and 2014 Calculated
Level (mm)(m AHD) (m3/s) (m AHD)
3790 N/A 03560 N/A 03320 48.73 8 49.52 7903110 47.62 8 47.77 1502850 45.39 9.9 45.07 -3202530 43.47 9.9 43.27 -2002430 42.33 9.9 42.35 20
As detailed, flood levels in both the eastern and western flood plains are generally close to or
less than the declared flood levels. Discrepancies would be due to the original analysis
assuming all three systems act as one and possibly, variances in Mannings n assumptions
It is considered that the 2014 levels calculated above are reasonable to compare PSP
impacts against (See Section 6 below)

16
5. Deep Creek Corridor PSP Implications The March 2013 report highlighted the reserve requirements adjacent to Deep Creek. This
previous work assumed that any flood mitigation or drainage augmentation works would be
able to be contained within the 150 m reserve specified.
MWC identified two major issues identified by MWC in relation to the Deep Creek Corridor.
These were:
• By setting the development line on either side of Deep Creek, as per Councils 2013
proposal, flows will be restricted and future development will be required to be filled to
MWC standards to ensure adequate flood protection. This may result in a small
increase in flood levels, and
• The PSP plan did not appear to address the breakaway flow from Deep Creek
towards the south-east, where flows outfall at the Princes Freeway. Melbourne Water
suggested that this could be addressed by either:
c) Upgrading (/ increase the capacity of) Deep Creek downstream of Ryan
Road, including upgrading the bridge; or
d) Set aside land in the FUS plan to allow for breakaway flows to extend down
to the proposed retarding basin at the Princes Freeway.
This report takes the PSP one step further than just setting a reserve requirement by
specifying works within the proposed corridor which will address the above two issues. The
aim is to show that works can be the proposed Deep Creek Reserve is wide enough to
contain future works which can address the issues. Ultimate works may differ from those
specified in this report.
Figures 7, 8 and 9 detail the concept design of the works proposed. Section 6 details the
estimated effect on flood levels if these works are adopted.

17
Figure 7 Possible Deep Creek Corridor Works Downstream of Ryan Road
Blue text – Hec Ras Chainage
18
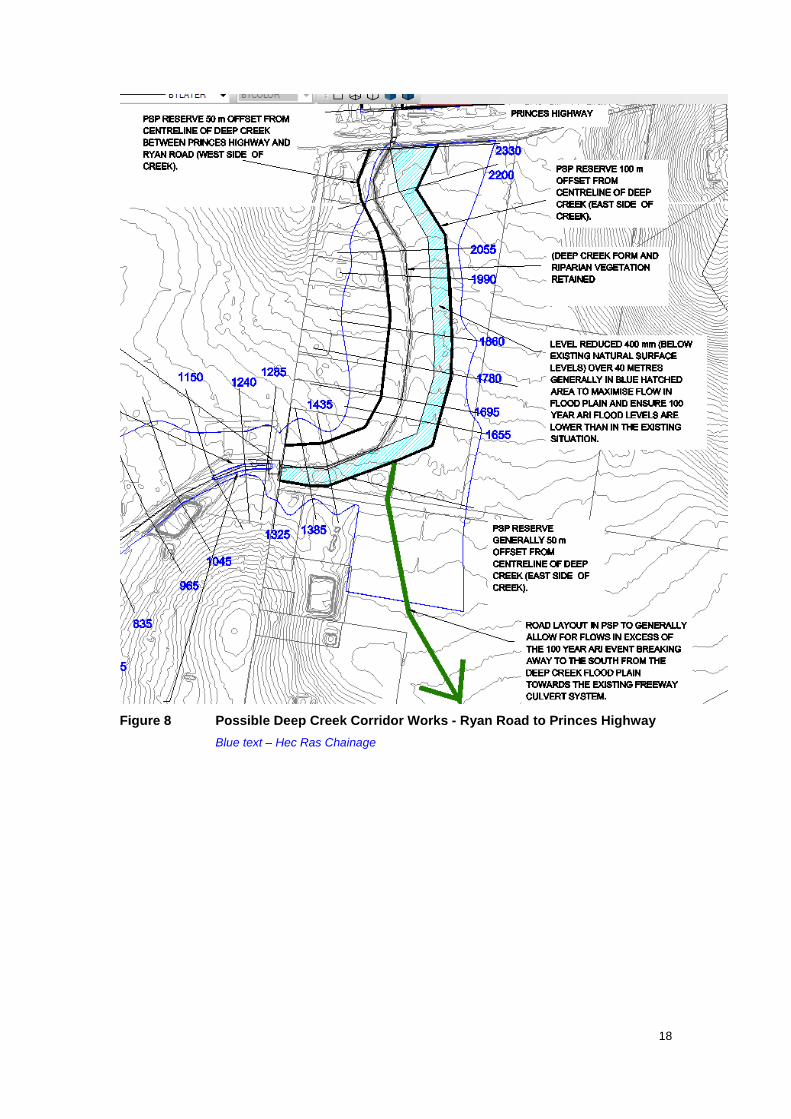
Figure 8 Possible Deep Creek Corridor Works - Ryan Road to Princes Highway
Blue text – Hec Ras Chainage

19
Figure 9 Possible Deep Creek Corridor Works – Upstream of Princes Highway
Blue text – Hec Ras Chainage

20
6. Hec Ras Modelling - Incorporating Deep Creek Corridor Works
6.1 Deep Creek Retarding Basin to Ryan Road
The Hec Ras model described in Section 4.1 was modified to include the on line pond as
detailed in Figure 7 above. All other model aspects of the “existing” situation remained the
same. Table 7 compares the “existing situation” against the situation incorporating possible
future Deep Creek Corridor works.
Table 7 Hec Ras Results - With and without Deep Creek Corridor Works
Chainage (m) Assumed 100 year Flow Existing 100 Year Level 100 Year Level
incorporating Deep Creek Corridor works
100 Year ARI Flood Level Incorporating Deep Creek
Corridor Works minus Existing 100 Yr Level (mm)
(m3/s) (m AHD) (m AHD)1285 43 34.04 33.82 -0.221240 43 33.83 33.69 -0.141150 43 33.19 33.18 -0.011045 43 32.28 32.28 0965 43 31.67 31.67 0835 43 30.69 30.69 0740 43 29.73 29.73 0645 43 28.61 28.61 0545 43 27.51 27.51 0445 43 26.59 26.59 0345 43 25.64 25.64 0245 43 24.64 24.64 0125 43 23.59 23.59 0
0 43 23.2 23.2 0
As detailed, the proposed works should result in a slight decrease in design flood levels
downstream of Deep Creek. However, the works are also required to ensure the culvert
augmentation detailed in Section 6.2 can occur with the desired outfall invert levels.
The results indicate that the expected 100 Year ARI flood levels are generally at or below the
declared flood plain levels.
6.2 Upgraded Ryan Road Culvert System
It is proposed to upgrade the Ryan Road culvert system to the size, amount, minimum road
level and invert levels detailed in appendix D and Figure 7 above. This is considered a
prudent proposal to ensure:
• No increase in upstream 100 year flood levels, and
21
• 100 Year ARI protection for the Ryan Road carriageway (to new minimum road
levels) given the increased population in the area using the road in the future.
6.3 Ryan Road to Princes Highway
The Hec Ras model described in Section 4.3 was modified to include:
• An assumed constriction of all flows to the reserve boundaries as detailed in Figure 8
above, and
• The flood plain augmentation works as detailed in figure 8 above.
Note this is a conservative analysis as the assumed reserve line west of Deep Creek may not
incorporate fill if the low density use of this land does not change in the future.
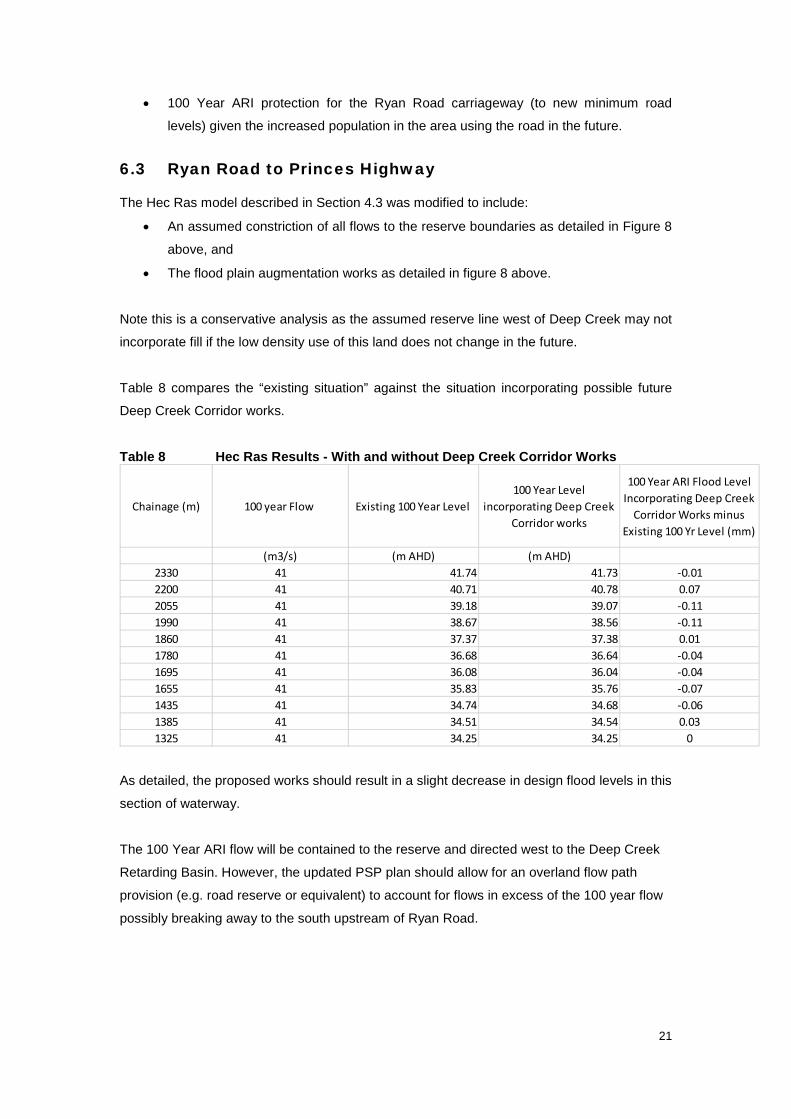
Table 8 compares the “existing situation” against the situation incorporating possible future
Deep Creek Corridor works.
Table 8 Hec Ras Results - With and without Deep Creek Corridor Works
Chainage (m) 100 year Flow Existing 100 Year Level 100 Year Level
incorporating Deep Creek Corridor works
100 Year ARI Flood Level Incorporating Deep Creek
Corridor Works minus Existing 100 Yr Level (mm)
(m3/s) (m AHD) (m AHD)2330 41 41.74 41.73 -0.012200 41 40.71 40.78 0.072055 41 39.18 39.07 -0.111990 41 38.67 38.56 -0.111860 41 37.37 37.38 0.011780 41 36.68 36.64 -0.041695 41 36.08 36.04 -0.041655 41 35.83 35.76 -0.071435 41 34.74 34.68 -0.061385 41 34.51 34.54 0.031325 41 34.25 34.25 0
As detailed, the proposed works should result in a slight decrease in design flood levels in this
section of waterway.
The 100 Year ARI flow will be contained to the reserve and directed west to the Deep Creek
Retarding Basin. However, the updated PSP plan should allow for an overland flow path
provision (e.g. road reserve or equivalent) to account for flows in excess of the 100 year flow
possibly breaking away to the south upstream of Ryan Road.

22
6.4 Existing Princes Highway Culvert System
The flood levels directly downstream of Princes Highway do not change in the future situation.
As such, the Princes Highway Culvert system is not required to be upgraded in the future.
6.5 Upstream of Princes Highway
The Hec Ras model described in Section 6.5 was modified to include:
• An assumed constriction of all flows to the reserve boundaries as detailed in Figure 9
above, and
• The eastern flood plain augmentation works as detailed in Figure 9 above.
It should be noted that this only required changing the Eastern Hec Ras model, as the PSP
will have no impact in flood levels expected in Deep Creek itself or the western flood plain.
Table 9 compares the “existing situation” against the situation incorporating possible future
Deep Creek Corridor works.
Table 9 Hec Ras Results - With and without Deep Creek Corridor Works Eastern flood Plain
Chainage (m)100 year Flow in East
Flood PlainExisting 100 Year Level
100 Year Level incorporating Deep Creek
Corridor works
100 Year ARI Flood Level Incorporating Deep Creek
Corridor Works minus Existing 100 Yr Level (mm)
(m3/s) (m AHD) (m AHD)3790 17.7 52.67 52.64 -0.033560 19.2 50.37 50.73 0.363320 21.1 48.72 49.31 0.593110 21.1 47.46 47.26 -0.22850 24.1 45.7 45.61 -0.092530 24.1 43.21 43.12 -0.092430 24.1 42.35 42.35 0
As detailed, the proposed works generally result in a slight decrease in design flood levels in
this section of waterway. The modelling suggest that there may be a rise in flood levels at
Chainage 3320 and 3560. However, as the three systems operate independently this does
not affect flood levels to the west of the creek (i.e. any existing subdivisions). In addition, the
proposed open space reserve (PSP plan) could be shaped to allow its western portion to be
flood prone, thus reducing flood levels to closer to existing levels. Whatever the case, the only
implication is on PSP land and, worse case, this results in more fill required in this area.

23
7. Conclusions and Further Work Required The above work concludes that the PSP reserve areas adjacent to Deep Creek are adequate
to address the MWC concerns highlighted in Section 1 above.
Further work required going forward in the design process includes, but is not limited to:
• Ensuring the design of any future subdivision relies on detailed flood plain survey
information, and updated flood levels at this time to set adequate fill levels adjacent to
the reserve and ensure the design of future reserve augmentation works meets the
intent of the design as detailed in this report,
• Update the PSP plan to allow for an overland flow path provision (e.g. road reserve or
equivalent) to account for flows in excess of the 100 year flow possibly breaking away
to the south upstream of Ryan Road (although the Deep Creek corridor will have a
100 Year Capacity),
• Confirming that the ecological and cultural heritage constraints and opportunities
have been fully captured by the proposals,
• Liaising with downstream affected landowners,
It is requested that MWC agree in principle to the PSP Deep Creek Reserve line given the
result presented in this report.

24
APPENDIX A RORB Model Control Vector C DEEP CREEK TO UPSTREAM OF PAKENHAM CREEK C STORMY WATER SOLUTIONS C SEPTEMBER 2014 C EXISTING CATCHMENT WITH ALLOWANCE C FOR DEVELOPMENT DSOUTH OF ELEC EASEMENT C CONSERVATIVLY NO RB'S C C DEEP_2014_oct 2014.CAT C 0 1,1,1.9,-99, A 3 1,1,1.1,-99, B 4 5,1,0.7,-99 3 1,1,0.7,-99, C 4 5,1,1.5,-99, 3 1,1,0.7,-99, D 4 5,1,0.5,-99, 3 1,1,1.3,-99, E 4 5,1,0.7,-99, 2,1,1,-99, F 7 End 10 3 1,2,1.3,2,-99, G 4 7 upstream end 12 5,2,1.2,1.5,-99, 3 1,2,0.75,0.3,-99, H 4 7 upstream end 14 5,2,0.4,1.3,-99, 3 1,2,1,0.3,-99, I 4 7 DEEP CK AT PRINCES HWY 5,1,0.5,-99, 2,2,1,2,-99, J 7 RYANS ROAD 2,2,0.8,2,-99, 7 DEEP CK UPSTREAM OF PAKENHAM CK 0 1.24,2.83,1.26,1.26,1.52,1.91,1.45,1.44,1.28,0.37,1.35,-99, 1,0.05,0.05,0.05,0.05,0.05,0.2,0.1,0.6,0.6,0.3,0.1,-99,

25
APPENDIX B - Ryan Road Culvert Analysis (Existing Conditions) B.1 Design Flow = 43 m3/s Ryan Road culvertsTWL = 33.85 m AHD
Downstream IL = 32.5 m AHDDownstream obvert level = 33.425 m AHD
Must be outlet control - downstream end drownedhead loss = (Ke+Kex)×V2/2g+ Sf×LSf = Q2n2/A2R4/3
culvert flowing fullW = 1.825D = 0.925 m
Design flow = 3.74 m3/sWetted perimeter = 5.50 mArea = 1.69 m2
Hyd radius = 0.306932 mV = 2.22 m/sKe = 0.5Kex = 1n = 0.013L= 5Sf = 0.0040
Head loss = 0.40 m
HWL = 34.25 m AHD
Total flow in four culverts = 14.96 m3/s Deep Creek - Ryan Road weir flowWeir Cross Section
Chainage (m) Level (m AHD)0 34.5
54 34.290 34
130 33.9170 34206 34.2260 34.5
Kw = 1.65 HWL = 34.25 m AHD
Water Level =
Chainage (m) Level (m AHD) Average Level (m) Length (m) H (m) Weir flow in segment (m3/s)0 34.5
54 34.2 34.35 54 -0.1 0.090 34 34.1 36 0.15 3.5
130 33.9 33.95 40 0.3 10.8170 34 33.95 40 0.3 10.8206 34.2 34.1 36 0.15 3.5260 34.5 34.35 54 -0.1 0.0
Total Weir Flow = 28.6 m3/s
total flow over road and in culverts = 43.6 m3/s
33.8
34
34.2
34.4
34.6
0 50 100 150 200 250 300
Level (m AHD)

26
B.2 Design Flow = 18 m3/s Ryan Road culvertsTWL = 33.85 m AHD
Downstream IL = 32.5 m AHDDownstream obvert level = 33.425 m AHD
Must be outlet control - downstream end drownedhead loss = (Ke+Kex)×V2/2g+ Sf×LSf = Q2n2/A2R4/3
culvert flowing fullW = 1.825D = 0.925 m
Design flow = 2.9 m3/sWetted perimeter = 5.50 mArea = 1.69 m2
Hyd radius = 0.306932 mV = 1.72 m/sKe = 0.5Kex = 1n = 0.013L= 5Sf = 0.0024
Head loss = 0.24 m
HWL = 34.09 m AHD
Total flow in four culverts = 11.6 m3/s Deep Creek - Ryan Road weir flowWeir Cross Section
Chainage (m) Level (m AHD)0 34.5
54 34.290 34
130 33.9170 34206 34.2260 34.5
Kw = 1.65 HWL = 34.09 m AHD
Water Level =
Chainage (m) Level (m AHD) Average Level (m) Length (m) H (m) Weir flow in segment (m3/s)0 34.5
54 34.2 34.35 54 -0.26 0.090 34 34.1 36 -0.01 0.0
130 33.9 33.95 40 0.14 3.5170 34 33.95 40 0.14 3.5206 34.2 34.1 36 -0.01 0.0260 34.5 34.35 54 -0.26 0.0
Total Weir Flow = 6.9 m3/s
total flow over road and in culverts = 18.5 m3/s
33.8
34
34.2
34.4
34.6
0 50 100 150 200 250 300
Level (m AHD)

27
APPENDIX C – Princes Highway Culvert Analysis (Existing Conditions)
Deep Creek at Princes Highway
Based on Vic Roads Drawings Assume all culverts flowing under outlet control
Melbourne Bound carriageway culvert system
Width = 3.7 mDepth = 3.7 mNumber of culverts = 2
Culvert Length = 18.3 m
Upstream IL = 38.7 m AHDUpstream obvert level = 42.4 m AHDDownstream IL = 38.65 m AHDDownstream obvert level = 42.35 m AHD
Upstream headwall = 43.3 m AHD
100 Year Flood Level Downstream = 41.9 m AHDNote : conservative, assumes tailwater level dominated by water level in Deep Creek ChannelCulverts not operating under pressure - as confirmed by Vic Roads design drawings
Water Depth in culvert = 3.4 mCulvert Base width 3.7 m Culvert slope = 0.001, Longitudinal Slope 0.00035 but backwater effects making HGL lessside slope of batters 1 in 0.01Flow Area (A) 12.6956 m2
ss length 3.40 mWetted Perimeter (P) 10.50 mHydraulic Radius (R) 1.21 mmannings n 0.013Capacity (Q) 41.5 m3/s - twin culverts - Ok approx 40.7 m3/s)Velocity (V) 1.63 m/s
Exit Loss coefficient = 1Exist loss = KexV
2/2g = 0.14 m
Depth in culvert = TWL + existing gloss = 3.39 OK, matches above
Inlet Loss coefficient = 0.5Inlet loss = KeV2/2g = 0.07 m
HWL = 42.15 .= tail water level of Warrigal bound culvert

28
Warrigal Bound carriageway culvert system
Width = 3.7 mDepth = 3.7 mNumber of culverts = 2
Culvert Length = 13.1 m
Upstream IL = 38.8 m AHDUpstream obvert level = 42.5 m AHDDownstream IL = 38.8 m AHDDownstream obvert level = 42.5 m AHD
Upstream headwall = 43.15 m AHD
100 Year Flood Level Downstream = 42.15 m AHD
Culverts not operating under pressure - as confirmed by Vic Roads design drawings
Water Depth in culvert = 3.45 mCulvert Base width 3.7 m Culvert slope = 0.001, Longitudinal Slope 0.00033 but backwater effects making HGL lessside slope of batters 1 in 0.01Flow Area (A) 12.884025 m2
ss length 3.45 mWetted Perimeter (P) 10.60 mHydraulic Radius (R) 1.22 mmannings n 0.013Capacity (Q) 41.0 m3/s - twin culverts - Ok approx 40.7 m3/s)Velocity (V) 1.59 m/s
Exit Loss coefficient = 1Exist loss = KexV
2/2g = 0.13 m
Depth in culvert = TWL + existing gloss = 3.48 OK, matches above
Inlet Loss coefficient = 0.5Inlet loss = KeV2/2g = 0.06 m
HWL = 42.35 .= tail water level of Warrigal bound culvertConfirmed , culverts not running under pressure.

29
APPENDIX D - Ryan Road Culvert Analysis (Future Conditions)
Width = 1.8 mDepth = 1.8 mNumber of culverts = 5
Culvert Length = 25 m
Upstream IL = 32.05 m AHDUpstream obvert level = 33.85 m AHDDownstream IL = 32 m AHDDownstream obvert level = 33.8 m AHD
Proposed minimum Road Level = 34.4 m AHD Raising Road 500 mm
Existing 100 Year ARI flood level upstream = 34.25 m AHD100 Year Flood Level Downstream = 33.8 m AHD
With Downstream wetland worksTo be confirmed at detailed design stage
Design Flow = 40.4 m3/s (RORB)
Maximum Head Loss = 0.45 m
head loss = (Ke+Kex)×V2/2g+ Sf×LSf = Q2n2/A2R4/3
culvert flowing fullW = 1.83 m (actual size)D = 1.85 m (actual size)
Design flow = 8.08 m3/s 5 culvertsWetted perimeter = 7.36 mArea = 3.38 m2
Hyd radius = 0.459860016 mV = 2.39 m/sKe = 0.5Kex = 1n = 0.013L= 10Sf = 0.0027
Head loss = 0.46 m OK