Dore Road Development Services Scheme Functional Design … · Hydrological and Environmental...
66
Hydrological and Environmental Engineering Dore Road Development Services Scheme Functional Design of the Dore Road DSS Wetland/Retarding Basin Revision A 24 February 2017 Report by: Stormy Water Solutions [email protected] Ph (03) 8555 9669, M 0412 436 021
-
Upload
hoanghuong -
Category
Documents
-
view
220 -
download
2
Transcript of Dore Road Development Services Scheme Functional Design … · Hydrological and Environmental...
Hydrological and Environmental Engineering
Dore Road Development Services Scheme
Functional Design of the Dore Road DSS Wetland/Retarding Basin
Revision A
24 February 2017
Report by: Stormy Water Solutions [email protected] Ph (03) 8555 9669, M 0412 436 021
i
Contents 1 BACKGROUND ........................................................................................................................................... 1
2 DESIGN CONSIDERATIONS ..................................................................................................................... 3 2.1 OUTFALL CONSIDERATIONS – DEEP CREEK ........................................................................................... 3 2.2 GAS LINE CONSIDERATIONS .................................................................................................................. 3 2.3 WATER QUALITY REQUIREMENTS ......................................................................................................... 4 2.4 FLOOD STORAGE REQUIREMENTS .......................................................................................................... 4 2.5 STANDARDS & GUIDELINES ................................................................................................................... 4
3 PROPOSED FUNCTIONAL DESIGN ......................................................................................................... 5 3.1 WETLAND .............................................................................................................................................. 5 3.2 SWALE (CONCEPT) ................................................................................................................................. 7
4 HYDROLOGIC MODELLING .................................................................................................................... 8 4.1 PRE-DEVELOPMENT HYDROLOGICAL MODEL ....................................................................................... 8
4.1.1 RORB Model Parameters ................................................................................................................. 8 4.1.2 Pre-development RORB Model Description ................................................................................... 10 4.1.3 Model Verification .......................................................................................................................... 12 4.1.4 Pre-development Results ................................................................................................................. 12
4.2 POST-DEVELOPMENT HYDROLOGICAL MODEL .................................................................................... 13 4.2.1 Post-development RORB Model Description .................................................................................. 13 4.2.2 Model Verification .......................................................................................................................... 17 4.2.3 Retarding Basin Stage/Storage/Discharge ..................................................................................... 17 4.2.4 Post-development Results ............................................................................................................... 19
5 SEDIMENT POND DESIGN ...................................................................................................................... 21 6 STORMWATER POLLUTANT MODELLING......................................................................................... 22
7 FURTHER WORK REQUIRED ................................................................................................................. 25
8 ABBREVIATIONS, DESCRIPTIONS AND DEFINITIONS .................................................................... 26
APPENDIX A – FUNCTIONAL DESIGN DRAWINGS ................................................................................... 27 APPENDIX B – WETLAND OUTLET CALCULATIONS ............................................................................... 32
B.1 CALCULATION OF TAIL WATER LEVELS IN DEEP CREEK AT RB OUTLET .............................................. 32 B.2 RETARDING BASIN OUTLET ARRANGEMENT ....................................................................................... 34 B.3 STAGE/STORAGE DISCHARGE TABLES ................................................................................................. 37
B.3.1 Condition 1 ..................................................................................................................................... 37 B.3.2 Condition 2 ..................................................................................................................................... 38
APPENDIX C – WETLAND INLET & GAS CROSSING CALCULATIONS .................................................. 39
APPENDIX D – WETLAND MAINTENANCE BYPASS CALCULATIONS ................................................. 44
APPENDIX E – SEDIMENT POND DESIGN CALCULATIONS .................................................................... 45
APPENDIX F – WETLAND VELOCITY CHECKS .......................................................................................... 48
APPENDIX G – WETLAND INUNDATION CHECK ...................................................................................... 49
APPENDIX H – WETLAND TURNOVER ANALYSIS .................................................................................... 52 APPENDIX I – LINER AND TOPSOIL ............................................................................................................. 53
APPENDIX J – SWALE CONCEPT DESIGN .................................................................................................... 54
APPENDIX K – CONSTRUCTED WETLANDS DESIGN MANUAL, PART A.2: CHECKLIST .................. 58
APPENDIX L - RORB .CAT FILES ................................................................................................................... 63 L.1 PRE-DEVELOPMENT .CAT FILE .............................................................................................................. 63 L.2 POST-DEVELOPMENT .CAT FILE ............................................................................................................ 63
1
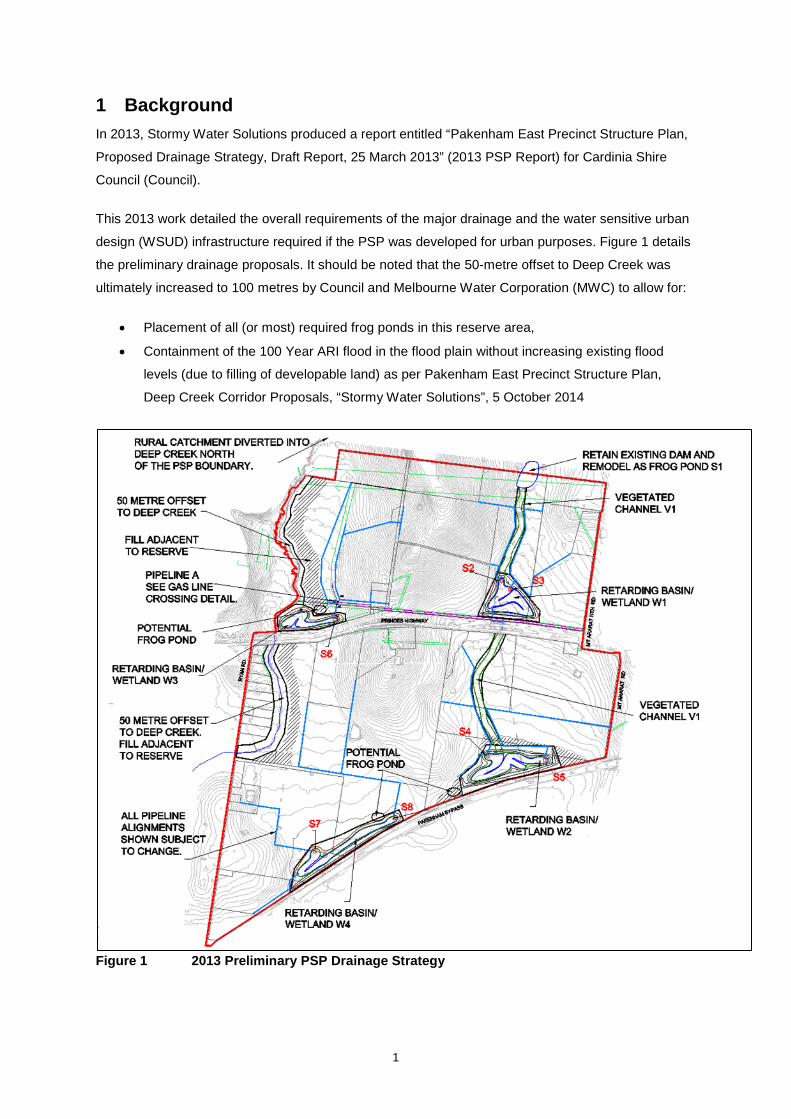
1 Background In 2013, Stormy Water Solutions produced a report entitled “Pakenham East Precinct Structure Plan,
Proposed Drainage Strategy, Draft Report, 25 March 2013” (2013 PSP Report) for Cardinia Shire
Council (Council).
This 2013 work detailed the overall requirements of the major drainage and the water sensitive urban
design (WSUD) infrastructure required if the PSP was developed for urban purposes. Figure 1 details
the preliminary drainage proposals. It should be noted that the 50-metre offset to Deep Creek was
ultimately increased to 100 metres by Council and Melbourne Water Corporation (MWC) to allow for:
• Placement of all (or most) required frog ponds in this reserve area,
• Containment of the 100 Year ARI flood in the flood plain without increasing existing flood
levels (due to filling of developable land) as per Pakenham East Precinct Structure Plan,
Deep Creek Corridor Proposals, “Stormy Water Solutions”, 5 October 2014
Figure 1 2013 Preliminary PSP Drainage Strategy

2
MWC has subsequently adopted the Dore Road Development Services Scheme (DSS) which covers
the north-west portion of the PSP area and the catchment contributing to W3. The adoption of the
DSS is to guide orderly provision of main drainage services through the PSP area.
At this time, Council and MWC require a functional design of Wetland/Retarding Basin W3. W3 is
referred to as the Dore Road Wetland/Retarding Basin in this report.
The remainder of this report considers the functional design requirements of the wetland systems in
line with MWC’s “2015 Constructed Wetland Design Manual” (2015 MWC Manual).
3
2 Design Considerations 2.1 Outfall Considerations – Deep Creek A major constraint in regard to the Dore Road retarding basin design is the possible backwater affects
Deep Creek may have on any outlet arrangement. Tail water levels in Deep Creek have been
calculated based on previous modelling described in “Pakenham East Precinct Structure Plan, Deep
Creek Corridor Proposals, SWS, 5 October 2014”. Appendix B details the adopted Deep Creek Flood
levels used for the design of the wetland/retarding basin system.
It is of important note that in extreme events, the Dore Road retarding basin forms part of the Deep
Creek floodplain.
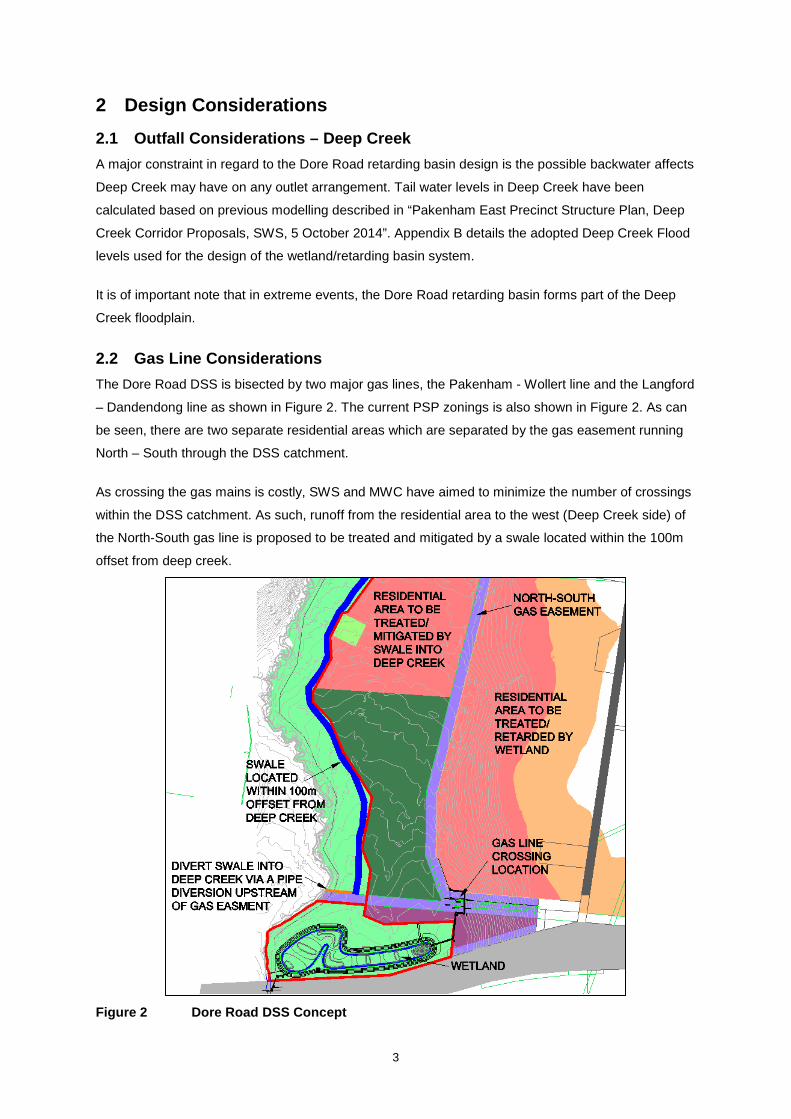
2.2 Gas Line Considerations The Dore Road DSS is bisected by two major gas lines, the Pakenham - Wollert line and the Langford
– Dandendong line as shown in Figure 2. The current PSP zonings is also shown in Figure 2. As can
be seen, there are two separate residential areas which are separated by the gas easement running
North – South through the DSS catchment.
As crossing the gas mains is costly, SWS and MWC have aimed to minimize the number of crossings
within the DSS catchment. As such, runoff from the residential area to the west (Deep Creek side) of
the North-South gas line is proposed to be treated and mitigated by a swale located within the 100m
offset from deep creek.
Figure 2 Dore Road DSS Concept
4
All remaining areas are proposed to be treated and retarded within the wetland at the south west of
the DSS. This results in only one crossing of the gas lines. Appendix C details the design of the
wetland inlet system which meets all of the Origin Energy gas line crossing requirements as detailed
below.
APA (who manage the assets on behalf of Origin Energy) have advised that in regards to the gas
crossing:
• APA would like all crossings to cross perpendicular to the gas mains,
• APA would prefer that no pipe connections were made between the two major gas mains, the
Pakenham – Wollert line and the Langford – Dandendong line,
• When going under the mains, APA requires 500mm-600mm clearance
• When going over the main:
o 1.2m of cover from the top of the pipe
o There may be some coating of existing mains required
o Possible velocity constraints of a channel may be proposed.
Detailed gas line proving has been provided by Melbourne Water at the crossing location. Cardno
competed a “Utility Investigation Summary Report, Dore Road, Pakenham, 8 September 2016” which
details the location and levels of the mains near the proposed crossing and should be referred to for
full detail on the gas line in the vicinity of the crossing. The Utility Investigation Summary Report, Dore
Road, Pakenham (8 September 2016) clearly showed that the DSS pipeline is required to go under
the gas line at the location shown in Figure 2.
2.3 Water Quality Requirements The Dore DSS must ensure all stormwater is treated to at least current best practice prior to
discharge from the PSP area.
Therefore, the wetland systems must ensure 80% retention of Total Suspended Solids (TSS), 45%
retention of Total Phosphorus (TP) and 45% retention of Total Nitrogen (TN).
2.4 Flood Storage Requirements The wetland/retarding basin is to be designed so that the total 1% AEP flow from the subject site post-
development is less than or equal to the 1% AEP flow from the subject site in pre-development
conditions.
2.5 Standards & Guidelines The Dore Road DSS wetland has been designed as close as possible to the current (2016) MWC
constructed Wetlands Design Guidelines. Appendix K shows how the wetland and sediment pond
meet the deemed to comply checklist for these guidelines.

5
3 Proposed Functional Design This section details the functional design of the wetland system which has been designed to meet the
objectives described in Section 2. It also details the concept design of the swale system which
discharges directly to Deep Creek before crossing the gas line.
3.1 Wetland Appendix A details the functional design proposal.
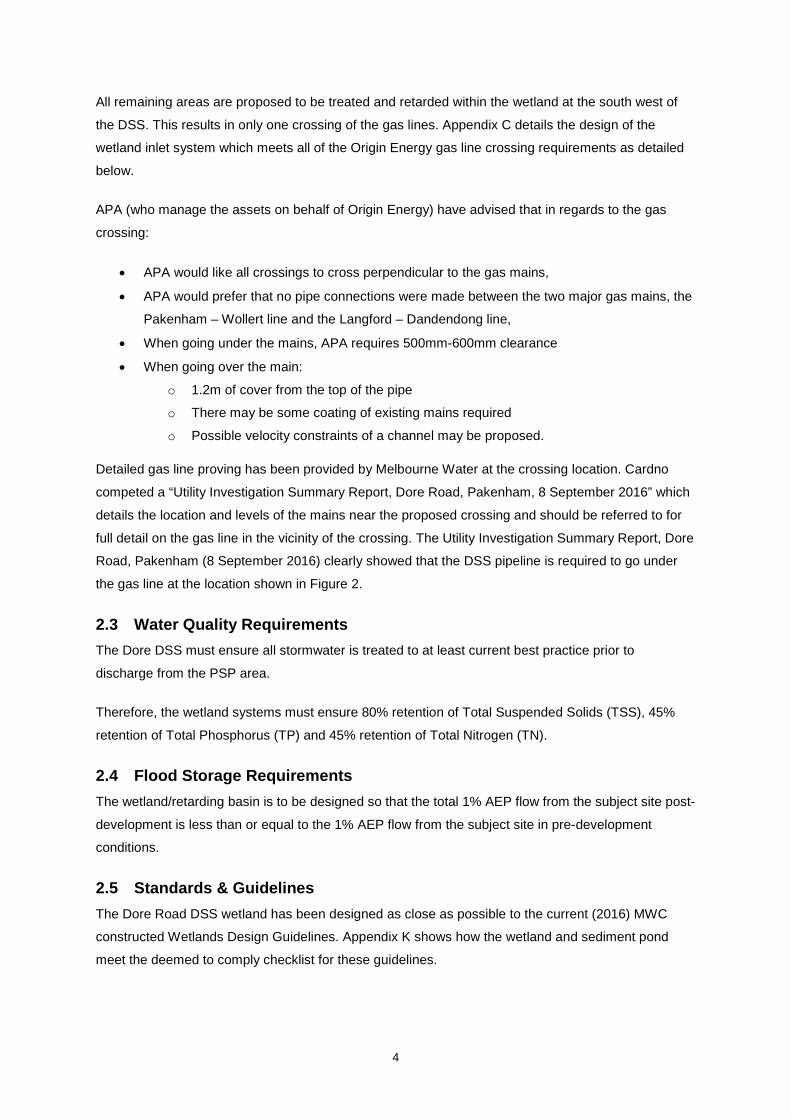
The Dore Road wetland has been set with the following characteristics shown in Table 1.
In summary, the NWL has been set to 40.15 m AHD and TED has been set to 40.50 m AHD. It should
be noted there is very little room to move in regard to changing the NWL as the design process
moves forward. This is due to the outlet being affected by backwater effects from Deep creek (See
Section 4.2.3 and Appendix B) and also due to the gas line crossing constraint upstream of the
wetland (See Appendix C).
The RORB modelling detailed in Section 4 predicts the design flows originating from the upstream
catchment and the retarding basin characteristics of the system.
Appendix K provides the full MWC constructed wetlands deemed to comply checklist.
6
Table 1 Dore Road Wetland Characteristics
Dore Road WETLANDWetland Parameters
Normal Water Level (NWL) = 40.15 m AHDTop of Extended Detention (TED) = 40.5 m AHDWetland Detention Time = 72 hours (total wetland and Sed Ponds)
Shallow Marsh 40 to 40.15 m AHDDeep Marsh 39.8 to 40 m AHDNot Planted - deeper than 39.8 m AHD
Treatment AreasTotal Wetland area including Sediment Ponds at NWL = 18600 m2
Total Wetland area including Sediment Ponds at TED = 20750 m2
EAST SED 1260 m2 915 m3 4.9 For Input Into MUSIC
Macrophyte Zone Area at NWL = 17340 m2
Macrophyte Zone Area at TED = 20750 m2
Volume of water stored for treatment over ED range = 0.35 m6666 m3
Over an average ED treatment area of 19045 m2
Detention time in macrophyte area = 67.1 hours(the rest of the time in sed pond areas)
Wetland Permanent Pool VolumeTotal wetland including sediment pondsLevel Area Ave. Area Delta H Volume Cumulative Volume(m AHD) (m2) (m2) (m) (m3) (m3)
39.15 2995 039.8 4390 3693 0.65 2400 240040 12990 8690 0.20 1738 4138
40.15 18600 15795 0.15 2369 6507
Total wetland including sediment ponds 6507 m3
Total Macrophyte Volume (exluding sediment ponds) 5592 m3
Average Macrophyte Zone Depth 0.32 m - OK(very shallow system)
Open Water Check (excluding S2)Area of Wetland below 350 mm deep = 3465 m2
Area of Wetland = 17340 m2
% Macrophyte Zone Area Vegetated (80% min)= 80% OK
Planting Check
Shallow Marsh 0.15 1 0.5 0.35 0.165 PASSDeep Marsh 0.35 1.5 0.75 0.4 0.165 PASS
Pass ?
Sediment Pond Areas
Sediment Pond Volumes
Detention time (hrs)
Zone:PP Depth
(m)
Minimum
Average Plant
50% Plant
Height
(Average plant
height/2)-PP Depth
WL exceeded 20% of the time (m)
7
3.2 Swale (Concept) Critical to the Dore Road wetland design is the design of the swale to convey and treat the small
residential development to the west of the north-south gas line so that the only inflow into the wetland
system is from the east and not from the north. MWC and Council approved this strategy in early
2016.
Currently, the land to the east of the 100m Deep Creek offset forms the low point and overland flow
path for the catchment. Development of land to the east of the swale is proposed to be filled to
appropriate levels. The swale will be designed to be the preferred overland flow path for all
catchments to the north west of the north-south gas line.
The swale has been sized to convey a peak 1% AEP flow (Section 4.2.4) of 4.6 m3/s originating from
the residential development. General dimensions of the swale are as described below:
• Base Width = 17 m
• Depth = 0.4 m
• Top Width = 23.4 m
• Side Batters = 1V:8H
• Mannings n = 0.055 (i.e. heavily vegetated with sedges and rushes)
The aim of designing a swale of this size is that to the untrained eye it will not look like a constructed
feature, mimicking a “natural” depression within the 100m offset to Deep Creek.
Preliminary modelling (Appendix J) indicates that a swale of this size is adequate in providing
treatment, flood mitigation and providing adequate outfall invert levels to the development to the west
of the north-south gas line. This swale size may be reduced at the functional design stage when more
detailed modelling (HecRas and MUSIC in iteration) is completed.
The main advantages of the swale concept are as follows:
• Fewer crossings of gas mains,
• Smaller wetland treatment area needed,
• Smaller wetland flood storage volume needed,
• Small flow retardation benefits,
• Re-aligns overland flow path away from developable land and into 100m offset from Deep
Creek, hence maximising developable land,
• Minimises fill requirements on developable land to the east of the swale as the pipes will be
aiming at an invert lower than natural surface level (NSL) (at least 400 mm less fill over all
land),
• Could be integrated as an effective community asset within the landscape master plan, and
• Supplements the 100 m offset required as part of the Deep Creek Flood plain requirements.

8
4 Hydrologic Modelling 4.1 Pre-Development Hydrological Model The RORB Runoff Routing Program – version 6.15, developed at Monash University by E. M.
Laurenson and R. G. Mein, was used to determine both the pre and post-development design flows
originating from the Dore Road DSS Catchment. RORB is a general runoff and stream flow routing
program used to calculate flood hydrographs from rainfall and other channel inputs. It subtracts losses
from rainfall to produce rainfall excess and routes this through catchment storage to produce the
hydrograph.
4.1.1 RORB Model Parameters RORB is based on the following equation relating storage (S) and discharge (Q) of a watercourse:
𝑆𝑆 = 𝑘𝑘×𝑄𝑄𝑚𝑚 where 𝑘𝑘 = 𝐾𝐾𝑐𝑐×𝐾𝐾𝑟𝑟
The values of KC and m are parameters that can be obtained by calibration of the model using
corresponding sets of data on rainfall for selected historical flows. If historical flows are unknown,
values can be estimated from regional analysis or by values suggested by Australian Rainfall &
Runoff (AR&R). The value of Kr is a physical parameter related to the reach type chosen by the
modeller which is automatically calculated by RORB.
In this case, flow gauging information was not available. As such the empirical equation
recommended by Melbourne Water for South Eastern Melbourne and the Westernport Catchment
was used as detailed below.
𝐾𝐾𝑐𝑐 = 1.53×𝐴𝐴0.55 = 1.53×1.2790.55 = 1.752
𝑚𝑚 = 0.8
Other parameters of RORB are the initial loss (IL) and the Pervious Area Runoff Coefficient (CPerv). IL
is the amount of rainfall needed before runoff occurs. Again, the Melbourne water regional parameter
set was used:
𝐼𝐼𝐼𝐼 = 10 𝑚𝑚𝑚𝑚
The pervious area runoff coefficient adopted for the all events is in line with the Melbourne Water
Corporations Guidelines as follows:
𝐶𝐶1%𝐴𝐴𝐴𝐴𝐴𝐴,𝑝𝑝𝑝𝑝𝑟𝑟𝑝𝑝 = 0.6,𝐶𝐶9.5%𝐴𝐴𝐴𝐴𝐴𝐴,𝑝𝑝𝑝𝑝𝑟𝑟𝑝𝑝 = 0.4,𝐶𝐶18.13%𝐴𝐴𝐴𝐴𝐴𝐴,𝑝𝑝𝑝𝑝𝑟𝑟𝑝𝑝 = 0.3,𝐶𝐶1 𝐴𝐴𝐸𝐸,𝑝𝑝𝑝𝑝𝑟𝑟𝑝𝑝 = 0.2
It should be noted that Cperv just relates to the pervious areas of the catchment. The important
Fraction impervious parameter, which dominates flow reactions, is detailed in Table 3 below.
9
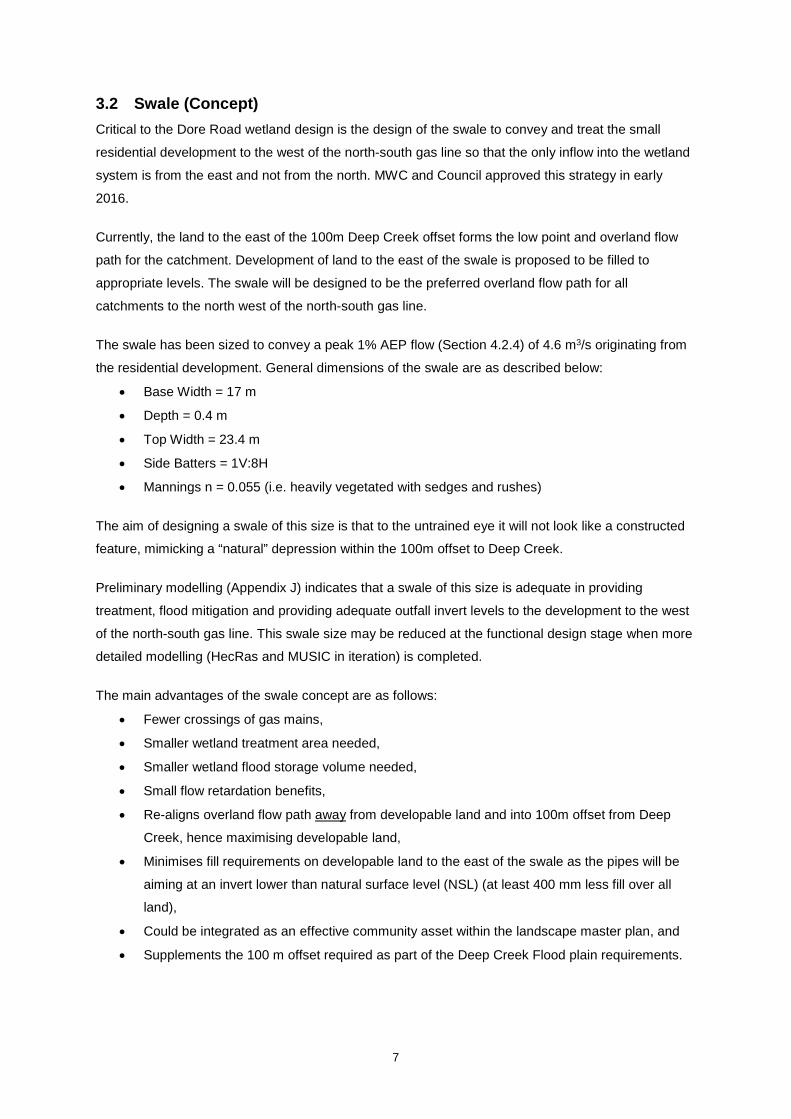
Other inputs into the model were that Siriwardena and Weinmann areal reduction factors (A = 0 km2)
were used and a filtered temporal pattern was used.
The 1987 rainfall intensities for the location 38.050 S, 145.525 E were utilised in the model. (Raw
Data: 17.91, 4.21, 1.32, 34.4, 8.02,2.45, Skew = 0.37, F2 = 4.26, F50 = 15.01). This location is just to
the North of the Dore Road Catchment. The intensities have been compared to the new Australian
Rainfall and Runoff (ARR) 2016 Rainfall Intensities (Issued 26 October 2016). Unfortunately, the new
intensities cannot currently be entered into RORB, as such a comparison has been completed to
show that the 1987 intensities are applicable for use for this design. Table 2 shows the comparison of
the two IFD methods. As can be seen, on average the 1987 IFD’s produce higher rainfall depths for a
given duration. As such the 1987 intensities are deemed appropriate for use in this design.
Table 2 1987 and 2016 IFD Comparison
Note: “Difference” relates to the 2016 intensities compared to the 1987 intensities.
1987 IFD 2016 IFD Difference 1987 IFD 2016 IFD Difference10m 20.9 20.8 -0.1 5.9 6.9 1.015m 25.3 25.5 0.2 7.4 8.4 1.020m 28.6 28.9 0.3 8.5 9.6 1.125m 31.2 31.5 0.3 9.5 10.6 1.130m 33.4 33.6 0.2 10.4 11.4 1.145m 38.5 38.3 -0.2 12.4 13.4 1.01h 42.2 41.7 -0.5 14.0 15.0 1.1
1.5h 50.2 46.9 -3.3 16.6 17.6 1.02h 56.6 51.2 -5.4 18.8 19.6 0.83h 66.8 58.6 -8.2 22.2 23.0 0.8
4.5h 78.8 68.0 -10.8 26.3 26.9 0.66h 88.7 76.4 -12.3 29.6 30.0 0.49h 104.7 91.2 -13.5 35.0 35.0 0.012h 117.8 104.2 -13.6 39.4 38.9 -0.518h 137.2 126.3 -10.9 46.2 44.9 -1.324h 152.4 144.5 -7.9 51.7 49.5 -2.230h 165.0 159.8 -5.1 56.2 53.1 -3.136h 175.5 172.8 -2.7 60.0 56.2 -3.848h 192.3 193.3 1.0 66.1 61.1 -5.072h 214.5 219.9 5.4 74.4 68.1 -6.3
-4.4 -0.6
1% AEP Depth (mm) 1 EY Depth (mm)Duration
Average: Average:
10
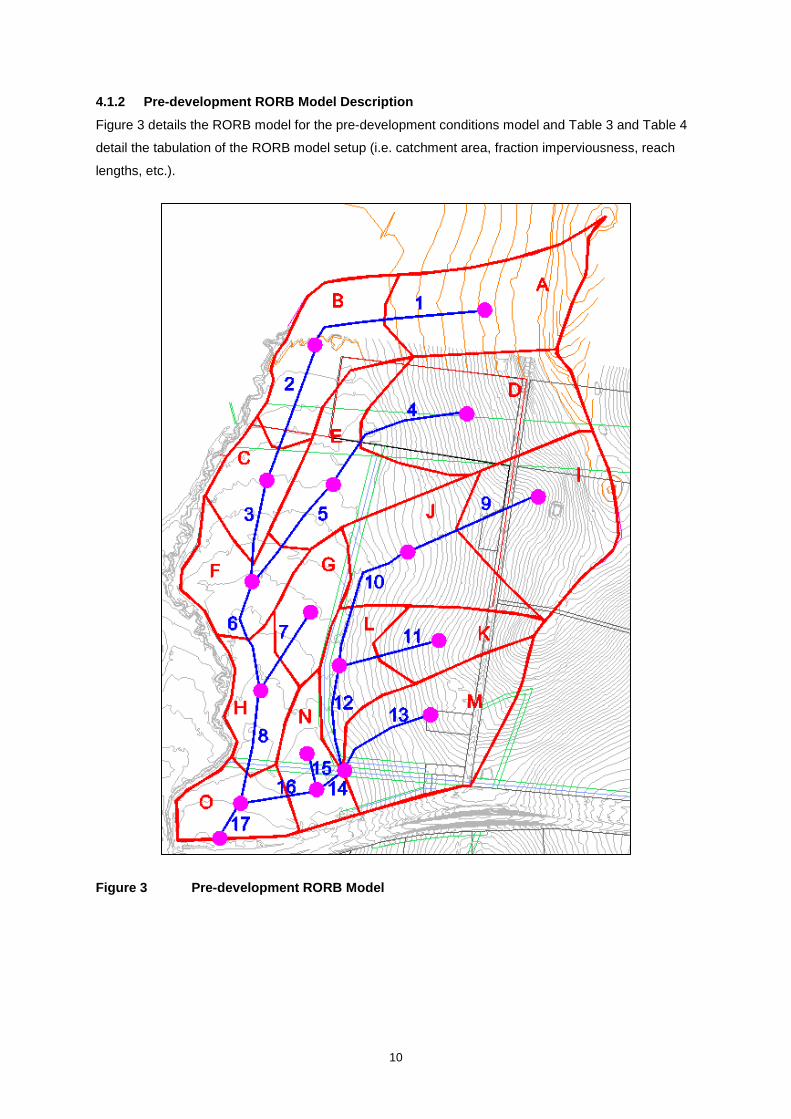
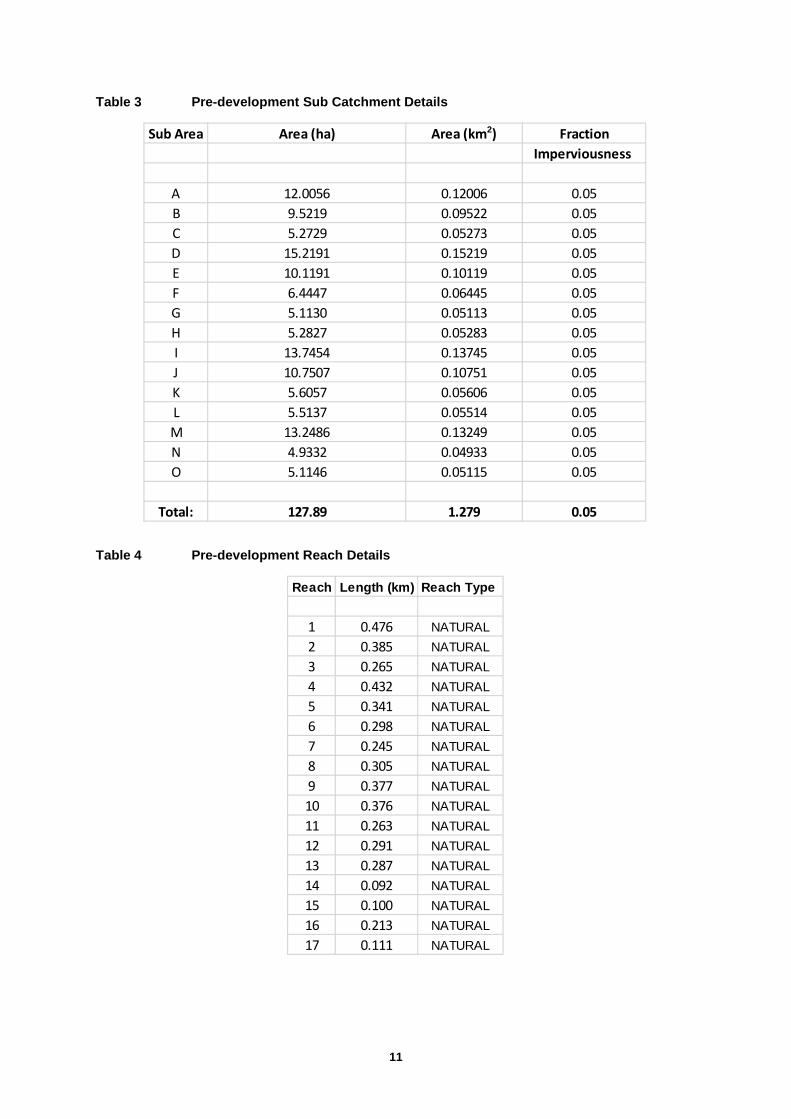
4.1.2 Pre-development RORB Model Description Figure 3 details the RORB model for the pre-development conditions model and Table 3 and Table 4
detail the tabulation of the RORB model setup (i.e. catchment area, fraction imperviousness, reach
lengths, etc.).
Figure 3 Pre-development RORB Model
11
Table 3 Pre-development Sub Catchment Details
Table 4 Pre-development Reach Details
Sub Area Area (ha) Area (km2) FractionImperviousness
A 12.0056 0.12006 0.05B 9.5219 0.09522 0.05C 5.2729 0.05273 0.05D 15.2191 0.15219 0.05E 10.1191 0.10119 0.05F 6.4447 0.06445 0.05G 5.1130 0.05113 0.05H 5.2827 0.05283 0.05I 13.7454 0.13745 0.05J 10.7507 0.10751 0.05K 5.6057 0.05606 0.05L 5.5137 0.05514 0.05M 13.2486 0.13249 0.05N 4.9332 0.04933 0.05O 5.1146 0.05115 0.05
Total: 127.89 1.279 0.05
Reach Length (km) Reach Type
1 0.476 NATURAL2 0.385 NATURAL3 0.265 NATURAL4 0.432 NATURAL5 0.341 NATURAL6 0.298 NATURAL7 0.245 NATURAL8 0.305 NATURAL9 0.377 NATURAL10 0.376 NATURAL11 0.263 NATURAL12 0.291 NATURAL13 0.287 NATURAL14 0.092 NATURAL15 0.100 NATURAL16 0.213 NATURAL17 0.111 NATURAL
12
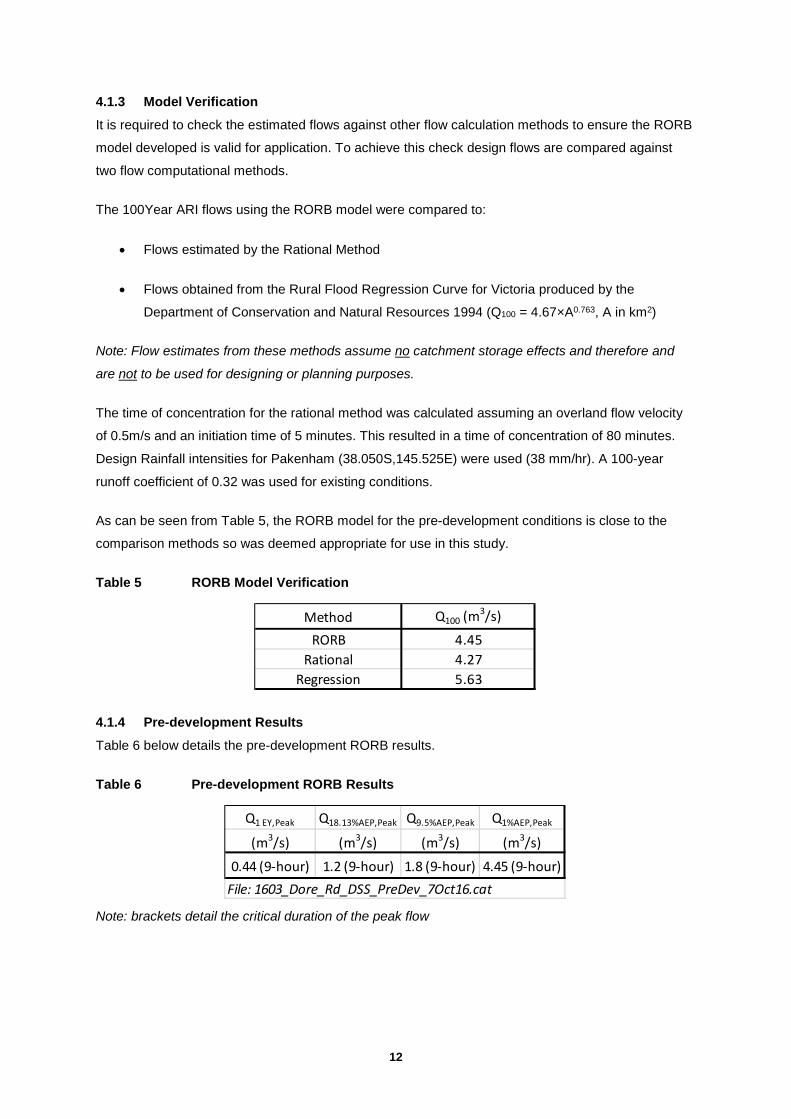
4.1.3 Model Verification It is required to check the estimated flows against other flow calculation methods to ensure the RORB
model developed is valid for application. To achieve this check design flows are compared against
two flow computational methods.
The 100Year ARI flows using the RORB model were compared to:
• Flows estimated by the Rational Method
• Flows obtained from the Rural Flood Regression Curve for Victoria produced by the
Department of Conservation and Natural Resources 1994 (Q100 = 4.67×A0.763, A in km2)
Note: Flow estimates from these methods assume no catchment storage effects and therefore and
are not to be used for designing or planning purposes.
The time of concentration for the rational method was calculated assuming an overland flow velocity
of 0.5m/s and an initiation time of 5 minutes. This resulted in a time of concentration of 80 minutes.
Design Rainfall intensities for Pakenham (38.050S,145.525E) were used (38 mm/hr). A 100-year
runoff coefficient of 0.32 was used for existing conditions.
As can be seen from Table 5, the RORB model for the pre-development conditions is close to the
comparison methods so was deemed appropriate for use in this study.
Table 5 RORB Model Verification
4.1.4 Pre-development Results Table 6 below details the pre-development RORB results.
Table 6 Pre-development RORB Results
Note: brackets detail the critical duration of the peak flow
Method Q100 (m3/s)
RORB 4.45Rational 4.27
Regression 5.63
Q1 EY,Peak Q18.13%AEP,Peak Q9.5%AEP,Peak Q1%AEP,Peak
(m3/s) (m3/s) (m3/s) (m3/s)
0.44 (9-hour) 1.2 (9-hour) 1.8 (9-hour) 4.45 (9-hour)File: 1603_Dore_Rd_DSS_PreDev_7Oct16.cat

13
4.2 Post-Development Hydrological Model The same RORB parameters as detailed in section 4.1.1 were used for the post-development RORB
model.
4.2.1 Post-development RORB Model Description RORB model catchment boundaries was estimated by 1m contour information and the proposed sub
divisional layout.
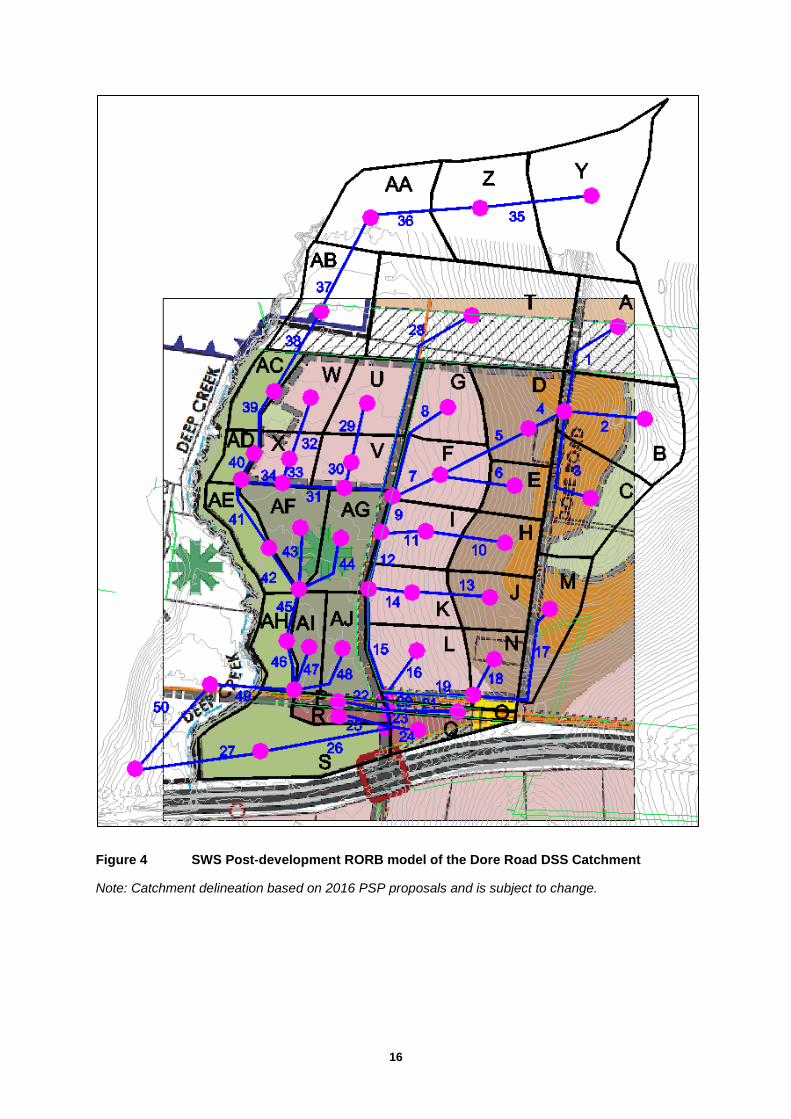
The RORB model shown Figure 4 was developed to model the post-development conditions at the
site.
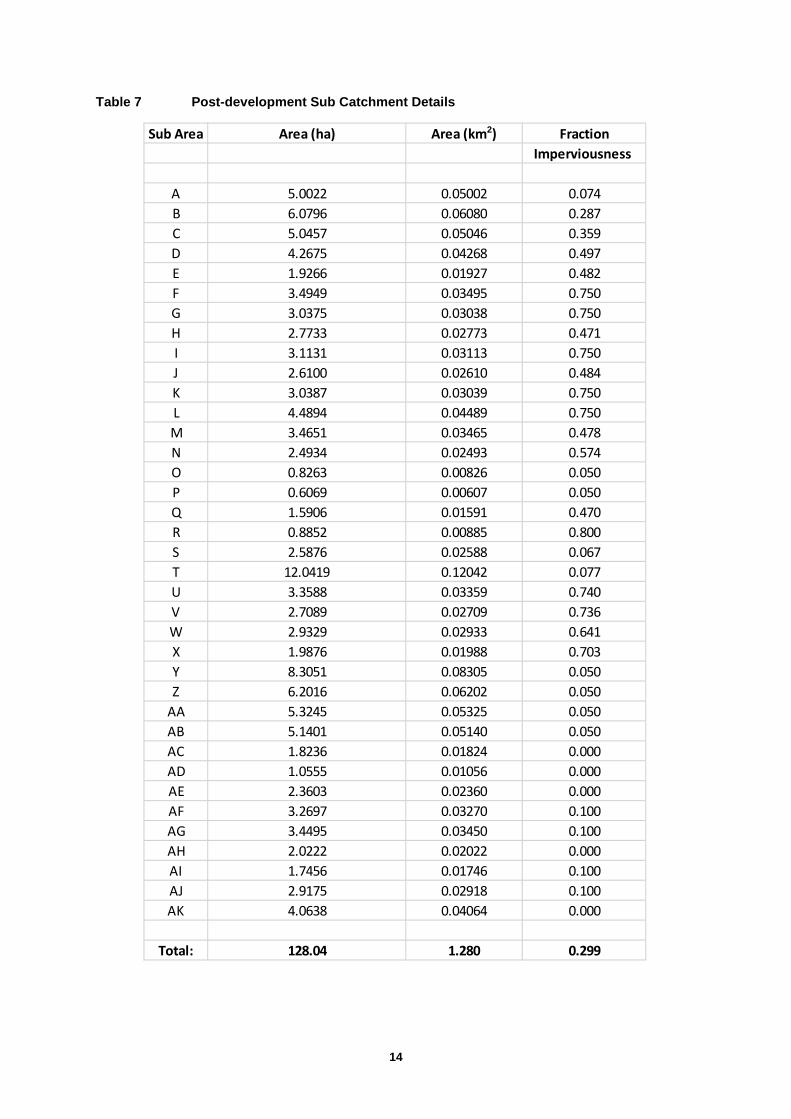
Table 7 and Table 8 detail the tabulation of the post-development RORB model setup (i.e. catchment
area, fraction imperviousness, reach lengths, etc.).
The fraction impervious of the subject site was changed depending on the proposed land use for each
sub area.
14
Table 7 Post-development Sub Catchment Details
Sub Area Area (ha) Area (km2) FractionImperviousness
A 5.0022 0.05002 0.074B 6.0796 0.06080 0.287C 5.0457 0.05046 0.359D 4.2675 0.04268 0.497E 1.9266 0.01927 0.482F 3.4949 0.03495 0.750G 3.0375 0.03038 0.750H 2.7733 0.02773 0.471I 3.1131 0.03113 0.750J 2.6100 0.02610 0.484K 3.0387 0.03039 0.750L 4.4894 0.04489 0.750M 3.4651 0.03465 0.478N 2.4934 0.02493 0.574O 0.8263 0.00826 0.050P 0.6069 0.00607 0.050Q 1.5906 0.01591 0.470R 0.8852 0.00885 0.800S 2.5876 0.02588 0.067T 12.0419 0.12042 0.077U 3.3588 0.03359 0.740V 2.7089 0.02709 0.736W 2.9329 0.02933 0.641X 1.9876 0.01988 0.703Y 8.3051 0.08305 0.050Z 6.2016 0.06202 0.050
AA 5.3245 0.05325 0.050AB 5.1401 0.05140 0.050AC 1.8236 0.01824 0.000AD 1.0555 0.01056 0.000AE 2.3603 0.02360 0.000AF 3.2697 0.03270 0.100AG 3.4495 0.03450 0.100AH 2.0222 0.02022 0.000AI 1.7456 0.01746 0.100AJ 2.9175 0.02918 0.100AK 4.0638 0.04064 0.000
Total: 128.04 1.280 0.299
15
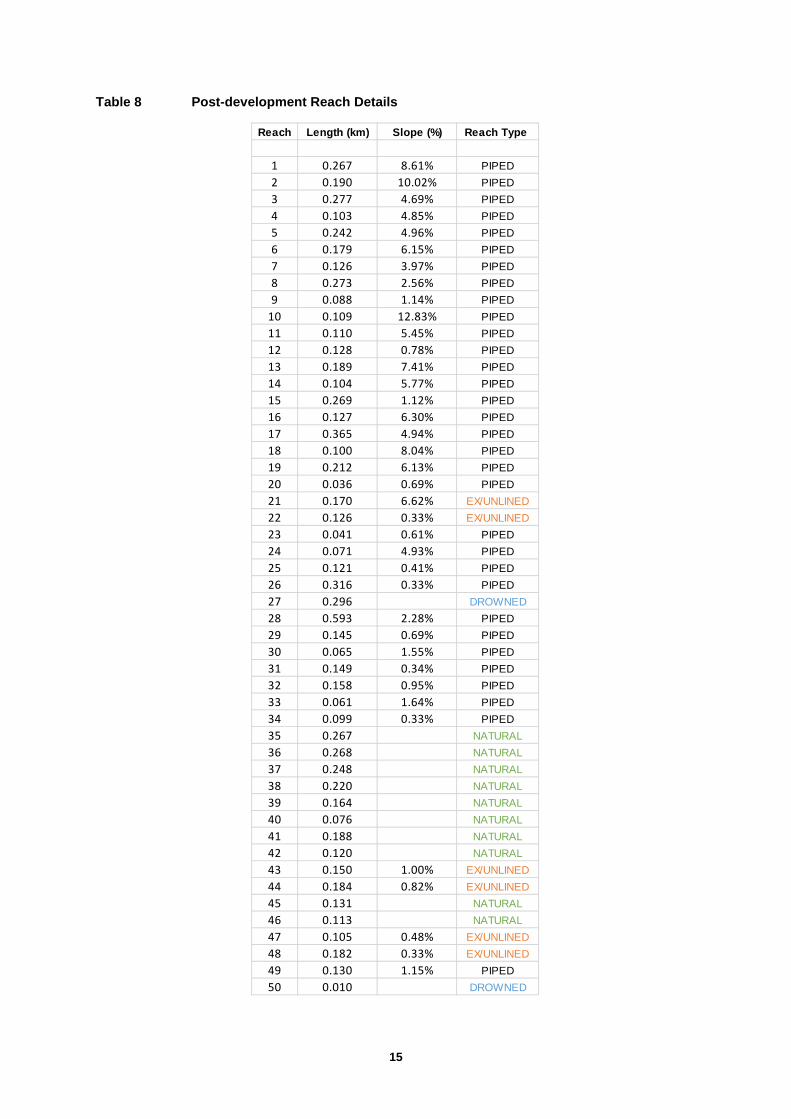
Table 8 Post-development Reach Details
Reach Length (km) Slope (%) Reach Type
1 0.267 8.61% PIPED2 0.190 10.02% PIPED3 0.277 4.69% PIPED4 0.103 4.85% PIPED5 0.242 4.96% PIPED6 0.179 6.15% PIPED7 0.126 3.97% PIPED8 0.273 2.56% PIPED9 0.088 1.14% PIPED
10 0.109 12.83% PIPED11 0.110 5.45% PIPED12 0.128 0.78% PIPED13 0.189 7.41% PIPED14 0.104 5.77% PIPED15 0.269 1.12% PIPED16 0.127 6.30% PIPED17 0.365 4.94% PIPED18 0.100 8.04% PIPED19 0.212 6.13% PIPED20 0.036 0.69% PIPED21 0.170 6.62% EX/UNLINED22 0.126 0.33% EX/UNLINED23 0.041 0.61% PIPED24 0.071 4.93% PIPED25 0.121 0.41% PIPED26 0.316 0.33% PIPED27 0.296 DROWNED28 0.593 2.28% PIPED29 0.145 0.69% PIPED30 0.065 1.55% PIPED31 0.149 0.34% PIPED32 0.158 0.95% PIPED33 0.061 1.64% PIPED34 0.099 0.33% PIPED35 0.267 NATURAL36 0.268 NATURAL37 0.248 NATURAL38 0.220 NATURAL39 0.164 NATURAL40 0.076 NATURAL41 0.188 NATURAL42 0.120 NATURAL43 0.150 1.00% EX/UNLINED44 0.184 0.82% EX/UNLINED45 0.131 NATURAL46 0.113 NATURAL47 0.105 0.48% EX/UNLINED48 0.182 0.33% EX/UNLINED49 0.130 1.15% PIPED50 0.010 DROWNED
16
Figure 4 SWS Post-development RORB model of the Dore Road DSS Catchment
Note: Catchment delineation based on 2016 PSP proposals and is subject to change.
17
4.2.2 Model Verification It is required to check the estimated flows against other flow calculation methods to ensure the RORB
model developed is valid for application. To achieve this check design flows are compared against
other flow computational methods.
The flows using the 100 Year ARI RORB model was compared to:
• Flows estimated by the Rational Method
• Flows obtained from the Urban Flood Regression Curve for Victoria produced by the
Department of Conservation and Natural Resources 1994 (Q100 = 10.29×A0.71, A in km2)
Note: Flow estimates from these methods assume no catchment storage effects and therefore and
are not to be used for designing or planning purposes. Also, for the purpose of the verification, the
model was altered so that the storage at the outlet was not present.
As can be seen from Table 9, the RORB model for the post-development conditions is close to the
comparison methods so was deemed appropriate for use in this study.
Table 9 RORB Model Verification
4.2.3 Retarding Basin Stage/Storage/Discharge The wetland has been designed to function as a retarding basin. As the retarding basin is located
within the declared Deep Creek flood plain, depending on the timing of any storm, the retarding basin
may be controlled by the effects of the downstream water level in Deep Creek. As such, two
conditions were modelled for each AEP simulation:
Condition 1: The retarding basin outlet can freely outflow into Deep Creek (i.e. the Deep
Creek water level is low). This has been modelled as:
• Deep Creek at the pipe outlet obvert (40.20 m AHD) for all events, and
Condition 2: The retarding basin outlet is drowned out by the backwater effects from Deep
Creek and can only operate under minimal head for each event.
4.2.3.1 Stage/Storage Relationship
For both conditions, the Stage/Storage relationship was the same. For both conditions, the
stage/storage relationship was derived using design contours as detailed in Appendix A. Calculations
are shown in Appendix B.
Method Q100 (m3/s)
RORB 12.1Rational 13.0
Regression 12.3
18
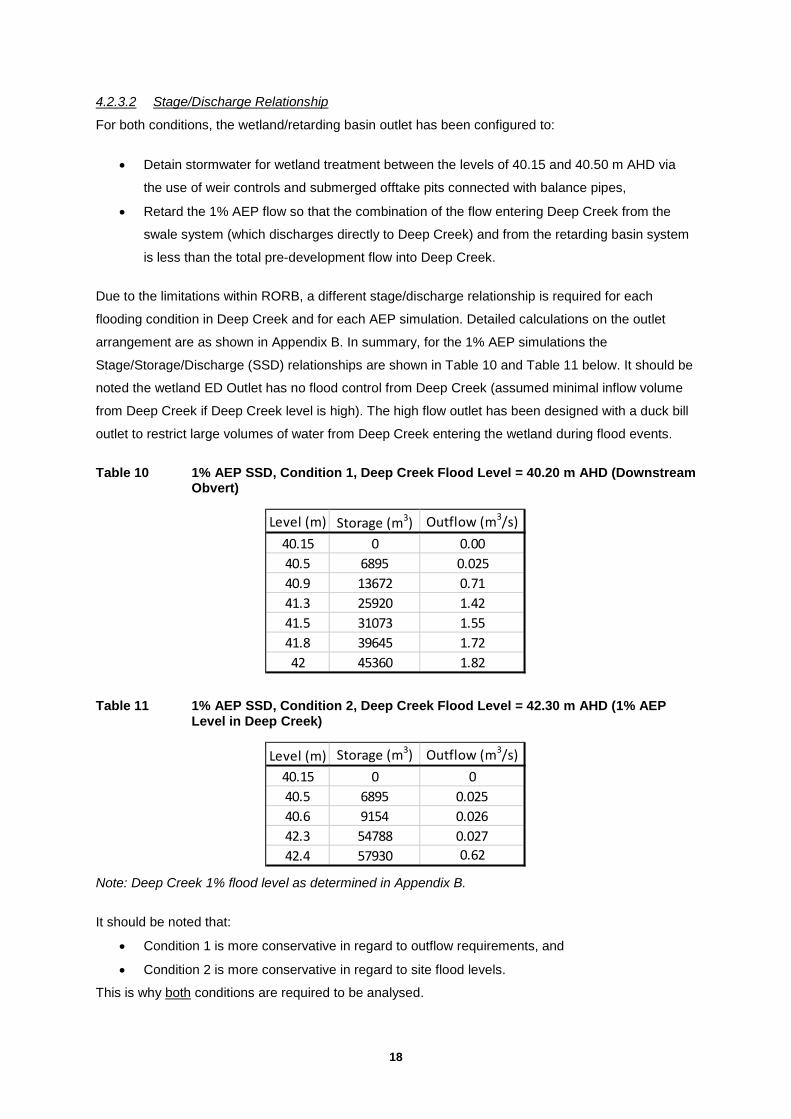
4.2.3.2 Stage/Discharge Relationship
For both conditions, the wetland/retarding basin outlet has been configured to:
• Detain stormwater for wetland treatment between the levels of 40.15 and 40.50 m AHD via
the use of weir controls and submerged offtake pits connected with balance pipes,
• Retard the 1% AEP flow so that the combination of the flow entering Deep Creek from the
swale system (which discharges directly to Deep Creek) and from the retarding basin system
is less than the total pre-development flow into Deep Creek.
Due to the limitations within RORB, a different stage/discharge relationship is required for each
flooding condition in Deep Creek and for each AEP simulation. Detailed calculations on the outlet
arrangement are as shown in Appendix B. In summary, for the 1% AEP simulations the
Stage/Storage/Discharge (SSD) relationships are shown in Table 10 and Table 11 below. It should be
noted the wetland ED Outlet has no flood control from Deep Creek (assumed minimal inflow volume
from Deep Creek if Deep Creek level is high). The high flow outlet has been designed with a duck bill
outlet to restrict large volumes of water from Deep Creek entering the wetland during flood events.
Table 10 1% AEP SSD, Condition 1, Deep Creek Flood Level = 40.20 m AHD (Downstream Obvert)
Table 11 1% AEP SSD, Condition 2, Deep Creek Flood Level = 42.30 m AHD (1% AEP Level in Deep Creek)
Note: Deep Creek 1% flood level as determined in Appendix B.
It should be noted that:
• Condition 1 is more conservative in regard to outflow requirements, and
• Condition 2 is more conservative in regard to site flood levels.
This is why both conditions are required to be analysed.
Level (m) Storage (m3) Outflow (m3/s)40.15 0 0.0040.5 6895 0.02540.9 13672 0.7141.3 25920 1.4241.5 31073 1.5541.8 39645 1.7242 45360 1.82
Level (m) Storage (m3) Outflow (m3/s)40.15 0 040.5 6895 0.02540.6 9154 0.02642.3 54788 0.02742.4 57930 0.62
19
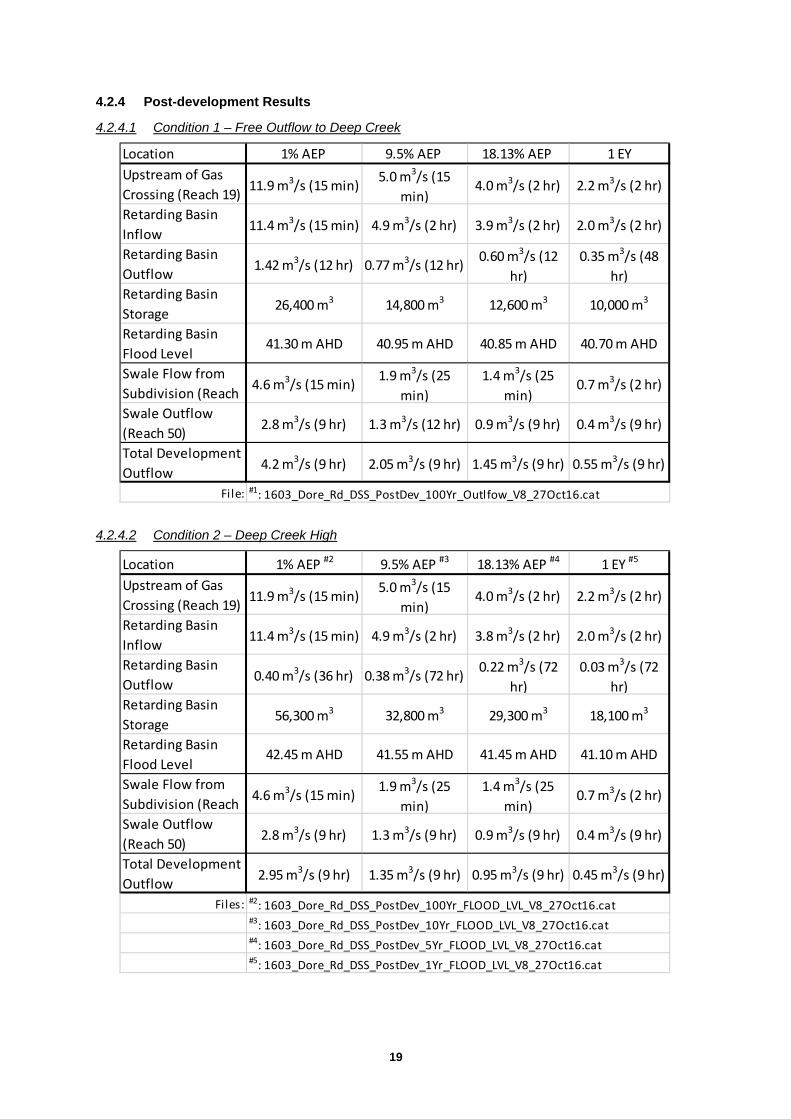
4.2.4 Post-development Results
4.2.4.1 Condition 1 – Free Outflow to Deep Creek
4.2.4.2 Condition 2 – Deep Creek High
Location 1% AEP 9.5% AEP 18.13% AEP 1 EYUpstream of Gas Crossing (Reach 19) 11.9 m3/s (15 min) 5.0 m3/s (15
min)4.0 m3/s (2 hr) 2.2 m3/s (2 hr)
Retarding Basin Inflow 11.4 m3/s (15 min) 4.9 m3/s (2 hr) 3.9 m3/s (2 hr) 2.0 m3/s (2 hr)
Retarding Basin Outflow 1.42 m3/s (12 hr) 0.77 m3/s (12 hr) 0.60 m3/s (12
hr)0.35 m3/s (48
hr)Retarding Basin Storage 26,400 m3 14,800 m3 12,600 m3 10,000 m3
Retarding Basin Flood Level
41.30 m AHD 40.95 m AHD 40.85 m AHD 40.70 m AHD
Swale Flow from Subdivision (Reach 4.6 m3/s (15 min) 1.9 m3/s (25
min)1.4 m3/s (25
min)0.7 m3/s (2 hr)
Swale Outflow (Reach 50) 2.8 m3/s (9 hr) 1.3 m3/s (12 hr) 0.9 m3/s (9 hr) 0.4 m3/s (9 hr)
Total Development Outflow 4.2 m3/s (9 hr) 2.05 m3/s (9 hr) 1.45 m3/s (9 hr) 0.55 m3/s (9 hr)
File: #1: 1603_Dore_Rd_DSS_PostDev_100Yr_Outlfow_V8_27Oct16.cat
Location 1% AEP #2 9.5% AEP #3 18.13% AEP #4 1 EY #5
Upstream of Gas Crossing (Reach 19) 11.9 m3/s (15 min) 5.0 m3/s (15
min)4.0 m3/s (2 hr) 2.2 m3/s (2 hr)
Retarding Basin Inflow 11.4 m3/s (15 min) 4.9 m3/s (2 hr) 3.8 m3/s (2 hr) 2.0 m3/s (2 hr)
Retarding Basin Outflow 0.40 m3/s (36 hr) 0.38 m3/s (72 hr) 0.22 m3/s (72
hr)0.03 m3/s (72
hr)Retarding Basin Storage 56,300 m3 32,800 m3 29,300 m3 18,100 m3
Retarding Basin Flood Level
42.45 m AHD 41.55 m AHD 41.45 m AHD 41.10 m AHD
Swale Flow from Subdivision (Reach 4.6 m3/s (15 min) 1.9 m3/s (25
min)1.4 m3/s (25
min)0.7 m3/s (2 hr)
Swale Outflow (Reach 50) 2.8 m3/s (9 hr) 1.3 m3/s (9 hr) 0.9 m3/s (9 hr) 0.4 m3/s (9 hr)
Total Development Outflow 2.95 m3/s (9 hr) 1.35 m3/s (9 hr) 0.95 m3/s (9 hr) 0.45 m3/s (9 hr)
Files: #2: 1603_Dore_Rd_DSS_PostDev_100Yr_FLOOD_LVL_V8_27Oct16.cat#3: 1603_Dore_Rd_DSS_PostDev_10Yr_FLOOD_LVL_V8_27Oct16.cat#4: 1603_Dore_Rd_DSS_PostDev_5Yr_FLOOD_LVL_V8_27Oct16.cat#5: 1603_Dore_Rd_DSS_PostDev_1Yr_FLOOD_LVL_V8_27Oct16.cat
20
As detailed:
• Condition 1 results in the higher discharge to Deep Creek (Q1%AEP POST = 4.2 m3/s), and this is
shown to be lower the pre-development flow in the 1% AEP event (Q1%AEP PRE = 4.45 m3/s).
• Condition 2 results in the higher flood level (42.45 m AHD) in the Dore Road RB. These
results should be used to set flood and floor level requirements for the future development of
the site.
It should be noted; this retarding basin design assumes flow generated from catchments T – AJ
discharges directly to Deep Creek and is not retarded in the retarding basin. Flow from catchments T-
AJ are proposed to be mitigated by the use of swales. These swales will convey flows to the Deep
Creek via a connection which is to be located to the north of the gas easement. Currently, the swale
design has only been completed conceptually and needs to be finalised at the next functional design
stage of the design process.
4.2.5 Extreme Flow Considerations As the retarding basin is located within the existing Deep Creek flood plain, in extreme events the
retarding basin is expected to be completely inundated by Deep Creek.
The retarding basin is an almost complete cut construction. Thus, the proposed retarding basin is
providing excess flood storage volume to the floodplain in extreme events.
The connection between the retarding basin and Deep Creek is the existing levee between the two
systems. It is expected the levee would be overtopped in an extreme event by the water in Deep
Creek spilling into the floodplain, not the water in the retarding basin spilling into Deep Creek.
As discussed in Section 4.2.3 above, high levels of Deep Creek have been assumed when setting
flood levels within the basin. The basin (if Deep Creek is low) can store events rarer than the 1% AEP
event within the volume of the basin.
In essence, in very rare events (1 in 1,000 to 1 in 1,000,000 AEP) the entire site is inundated by Deep
Creek flows.
Due to the above, no ANCOLD (or similar assessment) should be required as in an extreme event,
the retarding basin forms part of the Deep Creek floodplain.

21
5 Sediment Pond Design The wetland designs aim to provide primary treatment to flow conveyed in the incoming pipes via the
use of a large sediment ponds upstream of the wetland system.
Primary treatment is concerned with the collection of course sediment greater in size than 125
micrometres (0.125 mm). Particles smaller in size than this pass through the sediment ponds areas
and are treated downstream in the wetland system. Sediment ponds typically are required to be
cleaned out every 5 years. As such, an important part of the functional design process is ensuring
there is enough space for maintenance access and dewatering activities. This has been accounted for
as per the calculations in Appendix E.
In regard to the design of the sediment pond it should be noted that, as described in the functional
design drawings, it:
• Has been designed to ensure the sediment build up height in 5 years is lower than 350 mm
below the sediment pond NWL,
• Is located online to the DSS pipelines which they are treating water from,
• Captures greater than 95% of course particles ≥ 125 μm diameter for the peak three month
ARI (4 EY) flow,
• Provide adequate sediment storage volume to store 5 years of sediment (volume between the
base level and ‘NWL – 350 mm’),
• Ensures that the velocity through the sediment pond during the peak 100 Year ARI event is ≤
0.5 m/s. (The flow area has been calculated using the 100 Year ARI flood levels estimated in
the functional design calculations and the narrowest width of the sediment pond, at NWL,
between the inlet and overflow outlet as these basins do not form part of the ‘active’ flood
storage in the basin).
• Incorporates provision in regard to space allocation to ensure that the sediment ponds can
incorporate 4 m access tracks (1 in 15 battering (max) above NWL, 1 in 5 (max) below NWL),
• Incorporates concrete bases to MWC requirements, and
• Incorporate provision in regard to providing dedicated sediment dewatering areas which:
o Are accessible from the maintenance ramp,
o Are able to contain all sediment removed from the sediment pond accumulation zone
every 5 years, spread out at a depth of 500mm, and
o Are above the estimated peak 10 Year ARI water level.
Isolation of wetland and sediment ponds from the DSS pipeline is possible by blocking off inlet
headwalls and pits and sending water around the treatment system via the bypass pipeline. Drawing
DORE/SWS/1 (Appendix A) detail how this can occur.

22
6 Stormwater Pollutant Modelling The performance in regard to stormwater pollutant retention of the Dore Road wetland systems was
analysed using the MUSIC model, Version 6. Subareas and fraction imperviousness are as detailed in
the RORB model (Section 4.2).
Sub Areas are subject to change given the final development layout, however, provided the criteria of
directing as much catchment as possible to (or close to) the defined inlet locations is adhered to, the
final MUSIC results are not expected to change significantly.
Bureau of Meteorology rainfall and evaporation data for Narre Warren North (1984 - 1993) at 6 minute
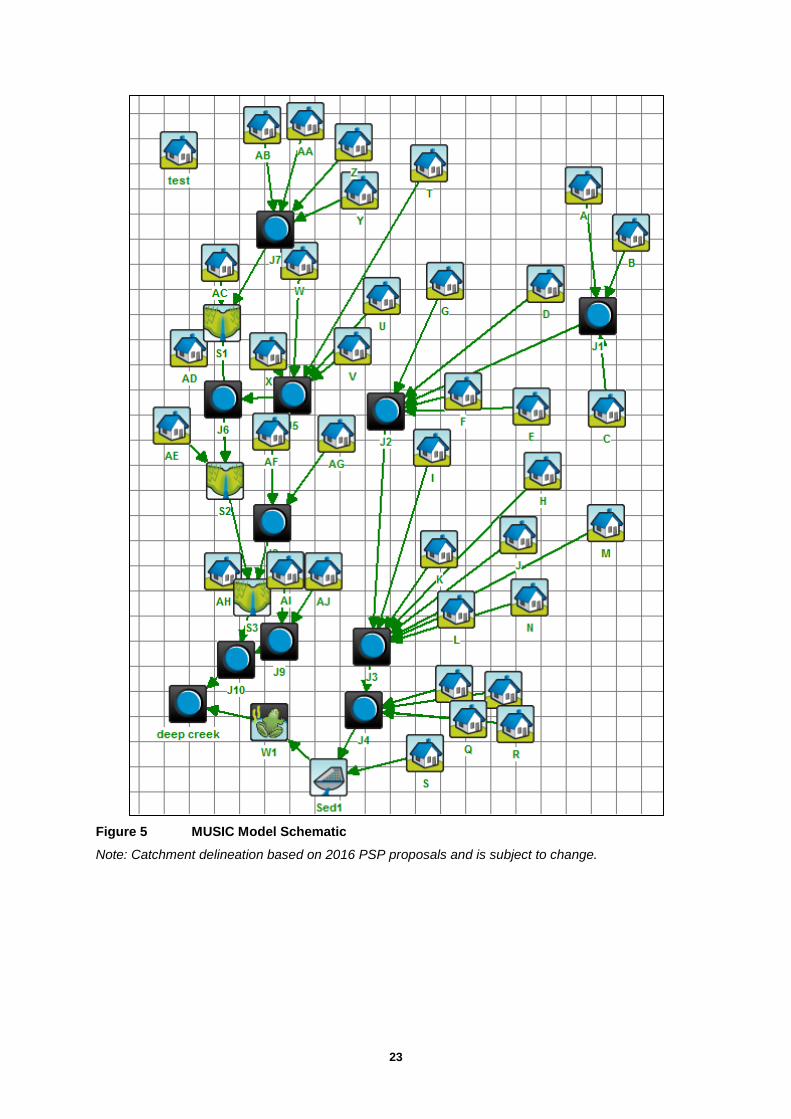
intervals was utilised. This is the reference gauge defined by MWC for this area of Melbourne. Figure
5 Figure 5details the model layout developed.
The modelled element characteristics are as detailed in Section 3 and Section 5. As required by MWC
for similar systems (e.g. Deep Creek South Wetland, December 2015), all wetland as sediment ponds
have been modelled separately with details as shown in Table 1. Furthermore, the proposed swale
treating the north-west catchment has been modelled to show that the total DSS treats to best
practice before discharging into Deep Creek.
23
Figure 5 MUSIC Model Schematic Note: Catchment delineation based on 2016 PSP proposals and is subject to change.
24
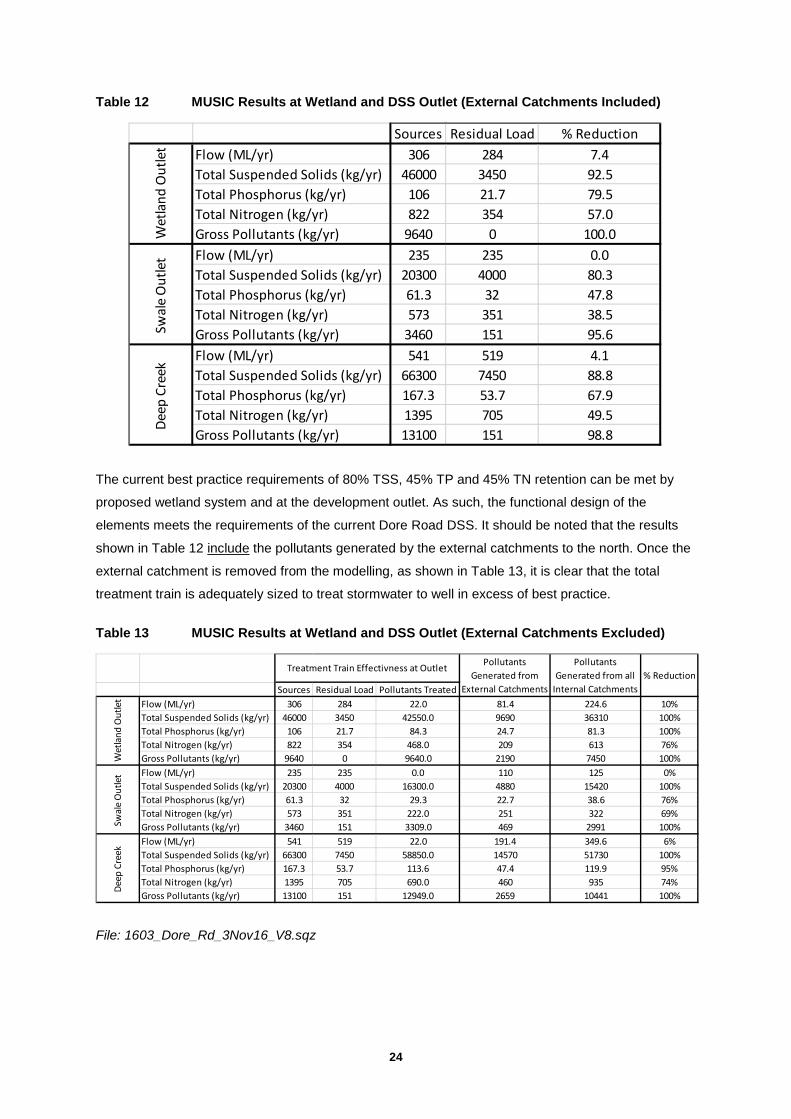
Table 12 MUSIC Results at Wetland and DSS Outlet (External Catchments Included)
The current best practice requirements of 80% TSS, 45% TP and 45% TN retention can be met by
proposed wetland system and at the development outlet. As such, the functional design of the
elements meets the requirements of the current Dore Road DSS. It should be noted that the results
shown in Table 12 include the pollutants generated by the external catchments to the north. Once the
external catchment is removed from the modelling, as shown in Table 13, it is clear that the total
treatment train is adequately sized to treat stormwater to well in excess of best practice.
Table 13 MUSIC Results at Wetland and DSS Outlet (External Catchments Excluded)
File: 1603_Dore_Rd_3Nov16_V8.sqz
Sources Residual Load % ReductionFlow (ML/yr) 306 284 7.4Total Suspended Solids (kg/yr) 46000 3450 92.5Total Phosphorus (kg/yr) 106 21.7 79.5Total Nitrogen (kg/yr) 822 354 57.0Gross Pollutants (kg/yr) 9640 0 100.0Flow (ML/yr) 235 235 0.0Total Suspended Solids (kg/yr) 20300 4000 80.3Total Phosphorus (kg/yr) 61.3 32 47.8Total Nitrogen (kg/yr) 573 351 38.5Gross Pollutants (kg/yr) 3460 151 95.6Flow (ML/yr) 541 519 4.1Total Suspended Solids (kg/yr) 66300 7450 88.8Total Phosphorus (kg/yr) 167.3 53.7 67.9Total Nitrogen (kg/yr) 1395 705 49.5Gross Pollutants (kg/yr) 13100 151 98.8
Wet
land
Out
let
Swal
e O
utle
tDe
ep C
reek
Sources Residual Load Pollutants TreatedFlow (ML/yr) 306 284 22.0 81.4 224.6 10%Total Suspended Solids (kg/yr) 46000 3450 42550.0 9690 36310 100%Total Phosphorus (kg/yr) 106 21.7 84.3 24.7 81.3 100%Total Nitrogen (kg/yr) 822 354 468.0 209 613 76%Gross Pollutants (kg/yr) 9640 0 9640.0 2190 7450 100%Flow (ML/yr) 235 235 0.0 110 125 0%Total Suspended Solids (kg/yr) 20300 4000 16300.0 4880 15420 100%Total Phosphorus (kg/yr) 61.3 32 29.3 22.7 38.6 76%Total Nitrogen (kg/yr) 573 351 222.0 251 322 69%Gross Pollutants (kg/yr) 3460 151 3309.0 469 2991 100%Flow (ML/yr) 541 519 22.0 191.4 349.6 6%Total Suspended Solids (kg/yr) 66300 7450 58850.0 14570 51730 100%Total Phosphorus (kg/yr) 167.3 53.7 113.6 47.4 119.9 95%Total Nitrogen (kg/yr) 1395 705 690.0 460 935 74%Gross Pollutants (kg/yr) 13100 151 12949.0 2659 10441 100%
Wet
land
Out
let
Swal
e O
utle
tDe
ep C
reek
Pollutants Generated from
External Catchments
Pollutants Generated from all
Internal Catchments% Reduction
Treatment Train Effectivness at Outlet

25
7 Further Work Required The following further work is required as part of the design process going forward:
• As part of the wetland detailed design;
o Detailed survey of Deep Creek where the wetland outlet is designed to ensure levels
are accurate,
o Confirmation of the design of the inlet system under the gas mains,
o Soil tests should be performed to confirm the assumption that the existing clayey soil
(once compacted) will be suitable for construction of a wetland system without and
additional liner,
• Finalisation of the PSP land zonings (if there are any major changes, the wetland functional
design may need to be reviewed),
• Ecological and archaeological studies are required to ensure no adverse impacts to existing
site values,
• Functional and detailed design of the swale system, including setting invert levels of pipes at
major DSS outfall points, and
• Confirmation of the Deep Creek flood level within the proposed swale and subsequent setting
of required adjacent development fill levels.
Council and MWC may wish to consider reducing the retarding basin site sight allocation slightly via
reducing the northern boundary as detailed in drawing DORE/SWS/1. Reducing the land allocation as
per drawing DORE/SWS/1 provides an approximate extra 1.4 ha of developable land.
APA group and Origin Energy should also be kept informed of all major updates relating to works in
the vicinity of their easements.
26
8 Abbreviations, Descriptions and Definitions The following table lists some common abbreviations and drainage system descriptions and their
definitions which are referred to in this report.
Abbreviation Descriptions Definition AHD - Australian Height Datum
Common base for all survey levels in Australia. Height in metres above mean sea level.
AEP – Annual Exceedance Probability
The probability of an event being exceeded per year. i.e. 1% AEP = 100 Year ARI event.
ARI - Average Recurrence Interval.
The average length of time in years between two floods of at least a given size. A 100 Year ARI event has a 1% chance of occurring in any one year.
DSS
Development Services Scheme – catchment drainage strategies developed, implemented and run by MWC.
EY – Exceedances per Year
Magnitude of event that is expected to be exceeded X times per year. i.e. 4 EY = 3-month ARI event.
Grassed Swale
A small shallow grassed drainage line designed to convey stormwater discharge. A complementary function to the flood conveyance task is its WSUD role (where the vegetation in the base acts as a treatment swale).
Hectare (ha) 10,000 square metres Kilometre (km) 1000 metres m3/s -cubic metre/second
Unit of discharge usually referring to a design flood flow along a stormwater conveyance system
Megalitre (ML) (1000 cubic metres)
1,000,000 litres = 1000 cubic metres Often a unit of water body (e.g. pond) size
MUSIC Hydrologic computer program used to calculate stormwater pollutant generation in a catchment and the amount of treatment which can be attributed to the WSUD elements placed in that catchment
MWC Melbourne Water Corporation Retarding basin
A flood storage dam which is normally empty. May contain a lake or wetland in its base
Normal Water Level (NWL)
Water level of a wetland or pond defined by the lowest invert level of the outlet structure
RORB
Hydrologic computer program used to calculate the design flood flow (in m3/s) along a stormwater conveyance system (e.g. waterway)
Sedimentation basin (Sediment pond)
A pond that is used to remove coarse sediments from inflowing water mainly by Settlement processes.
Surface water All water stored or flowing above the ground surface level Total Catchment Management
A best practice catchment management convention which recognises that waterways and catchments do not stop at site boundaries and decisions relating to surface water management should consider the catchment as a whole
TSS Total Suspended Solids – a term for a particular stormwater pollutant parameter
TP Total Phosphorus – a term for a particular stormwater pollutant parameter TN Total Nitrogen – a term for a particular stormwater pollutant parameter Extended Detention Range of water level rise above normal water level where stormwater is
temporarily stored for treatment for a certain detention period (usually 48 – 72 hours in a wetland system)
WSUD - Water Sensitive Urban Design
Term used to describe the design of drainage systems used to o Convey stormwater safely o Retain stormwater pollutants o Enhance local ecology o Enhance the local landscape and social amenity of built areas
Wetland
WSUD elements which are used to collect TSS, TP and TN. Usually incorporated at normal water level (NWL) below which the system is designed as shallow marsh, marsh, deep marsh and open water areas.

27
Appendix A – Functional Design Drawings Note that the drawings detailed have been modified from the AutoCAD set. The AutoCAD drawings
should be referred to for the full design detail.
28
DORE/SWS/1 Wetland/Retarding Basin Detail
29
DORE/SWS/2 Wetland/Retarding ED Outlet Detail
30
DORE/SWS/3 Wetland/Retarding High Flow Outlet Detail
31
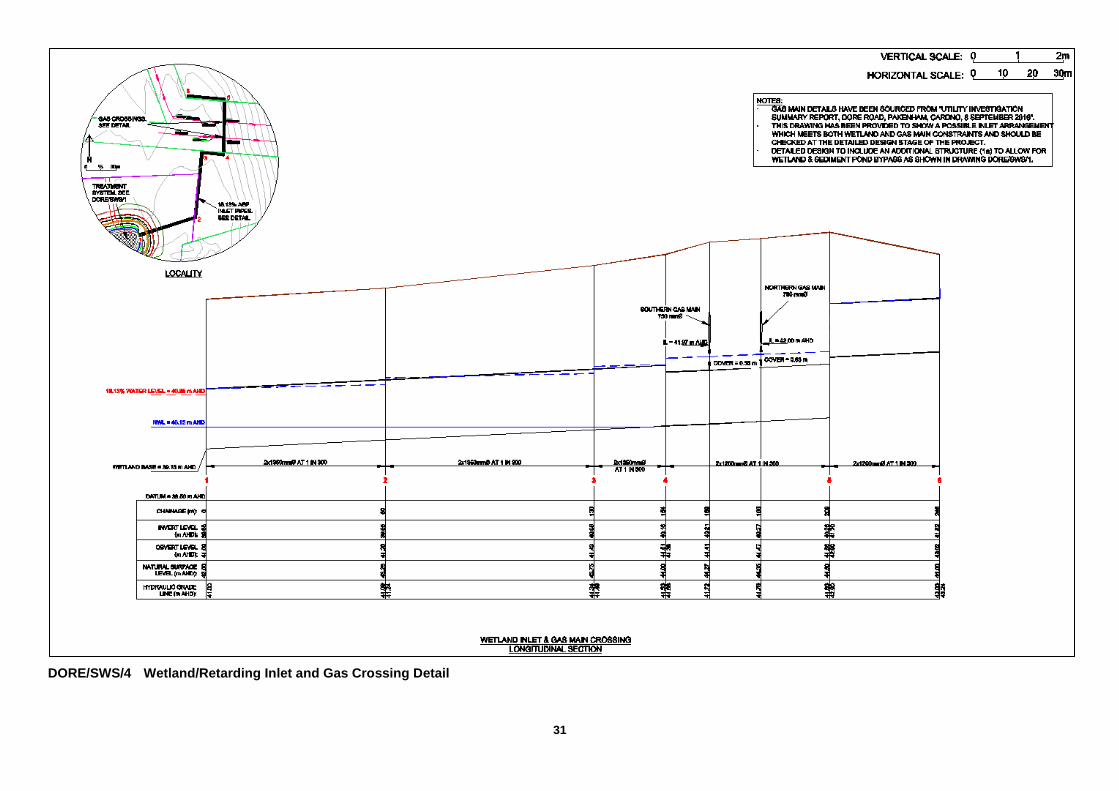
DORE/SWS/4 Wetland/Retarding Inlet and Gas Crossing Detail
32
Appendix B – Wetland Outlet Calculations
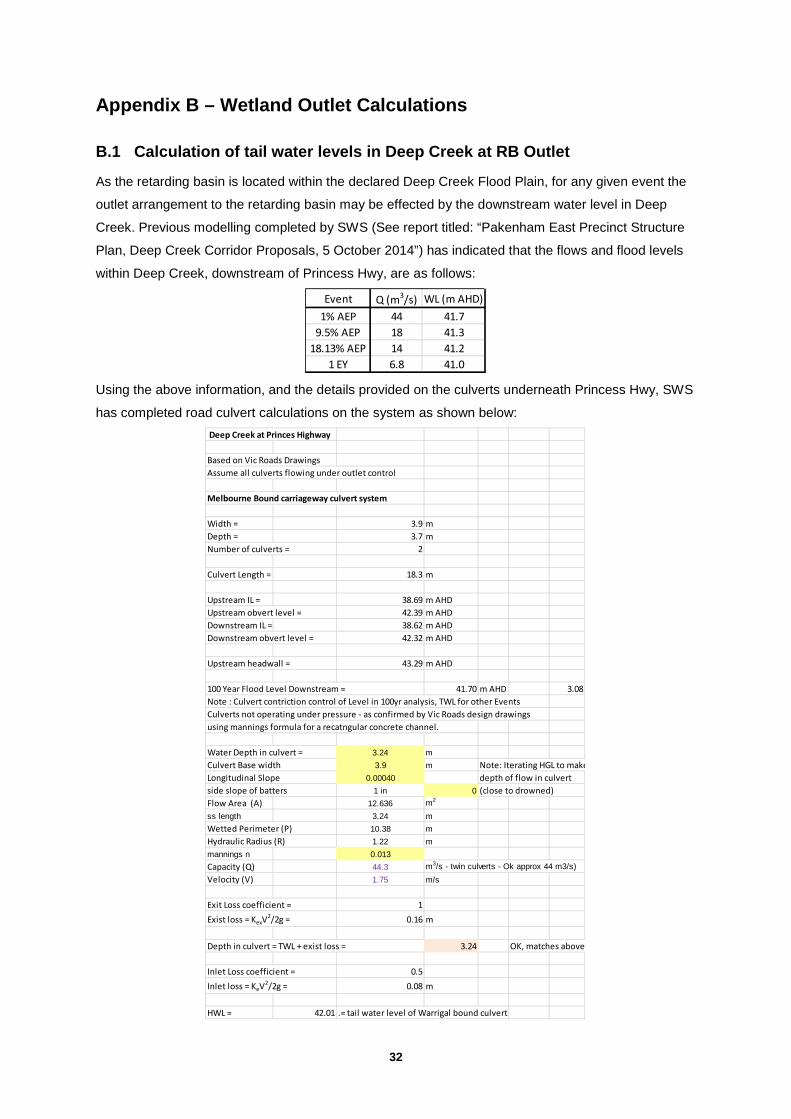
B.1 Calculation of tail water levels in Deep Creek at RB Outlet
As the retarding basin is located within the declared Deep Creek Flood Plain, for any given event the
outlet arrangement to the retarding basin may be effected by the downstream water level in Deep
Creek. Previous modelling completed by SWS (See report titled: “Pakenham East Precinct Structure
Plan, Deep Creek Corridor Proposals, 5 October 2014”) has indicated that the flows and flood levels
within Deep Creek, downstream of Princess Hwy, are as follows:
Using the above information, and the details provided on the culverts underneath Princess Hwy, SWS
has completed road culvert calculations on the system as shown below:
Event Q (m3/s) WL (m AHD)1% AEP 44 41.7
9.5% AEP 18 41.318.13% AEP 14 41.2
1 EY 6.8 41.0
Deep Creek at Princes Highway
Based on Vic Roads Drawings Assume all culverts flowing under outlet control
Melbourne Bound carriageway culvert system
Width = 3.9 mDepth = 3.7 mNumber of culverts = 2
Culvert Length = 18.3 m
Upstream IL = 38.69 m AHDUpstream obvert level = 42.39 m AHDDownstream IL = 38.62 m AHDDownstream obvert level = 42.32 m AHD
Upstream headwall = 43.29 m AHD
100 Year Flood Level Downstream = 41.70 m AHD 3.08Note : Culvert contriction control of Level in 100yr analysis, TWL for other EventsCulverts not operating under pressure - as confirmed by Vic Roads design drawingsusing mannings formula for a recatngular concrete channel.
Water Depth in culvert = 3.24 mCulvert Base width 3.9 m Note: Iterating HGL to makeLongitudinal Slope 0.00040 depth of flow in culvertside slope of batters 1 in 0 (close to drowned)Flow Area (A) 12.636 m2
ss length 3.24 mWetted Perimeter (P) 10.38 mHydraulic Radius (R) 1.22 mmannings n 0.013Capacity (Q) 44.3 m3/s - twin culverts - Ok approx 44 m3/s)Velocity (V) 1.75 m/s
Exit Loss coefficient = 1Exist loss = KexV
2/2g = 0.16 m
Depth in culvert = TWL + exist loss = 3.24 OK, matches above
Inlet Loss coefficient = 0.5Inlet loss = KeV2/2g = 0.08 m
HWL = 42.01 .= tail water level of Warrigal bound culvert
33
Calculations have only been shown for the 1% AEP Event. Full calculations are provided in the file:
Deep Creek at Princes Highway - culvert analysis_2Nov16.xlsx
The results from the analysis for the different events is shown below (at Point A):
As such, the results shown above have then formed the tail water level’s (TWL’s) used as part of the
design of the RB outlet system for both conditions as the Dore Road RB outlet system outfalls just
upstream of the princess highway culvert system.
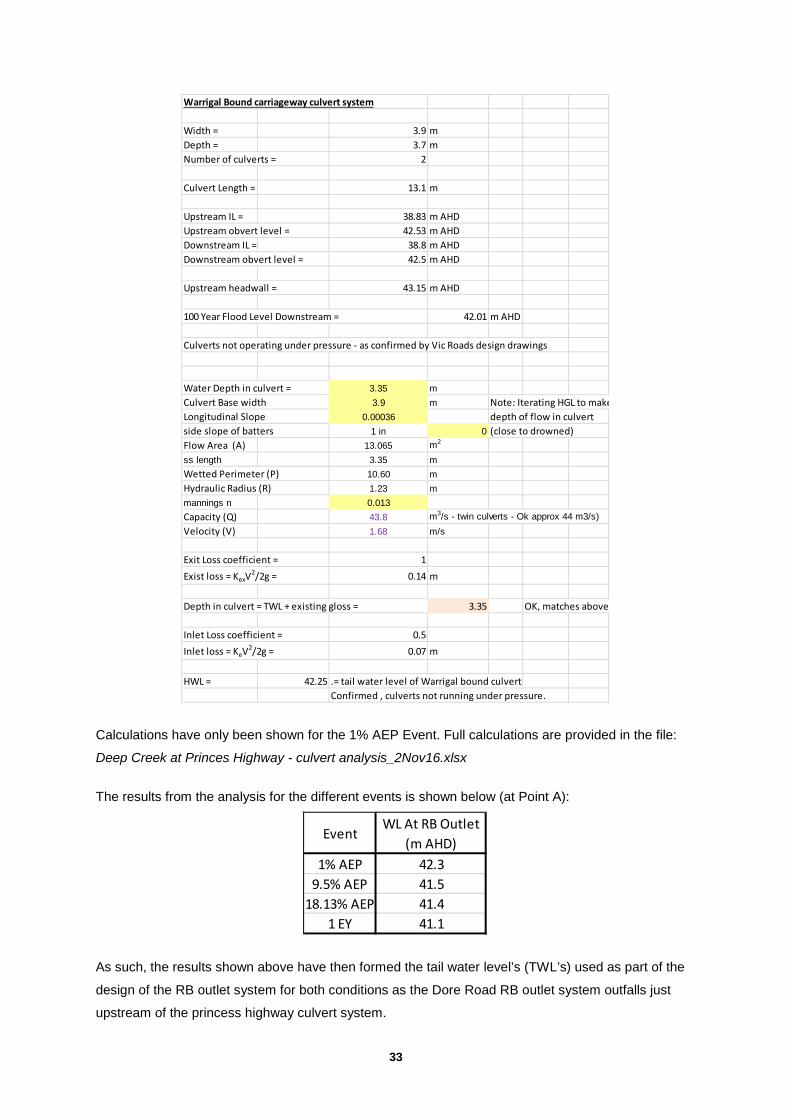
Warrigal Bound carriageway culvert system
Width = 3.9 mDepth = 3.7 mNumber of culverts = 2
Culvert Length = 13.1 m
Upstream IL = 38.83 m AHDUpstream obvert level = 42.53 m AHDDownstream IL = 38.8 m AHDDownstream obvert level = 42.5 m AHD
Upstream headwall = 43.15 m AHD
100 Year Flood Level Downstream = 42.01 m AHD
Culverts not operating under pressure - as confirmed by Vic Roads design drawings
Water Depth in culvert = 3.35 mCulvert Base width 3.9 m Note: Iterating HGL to makeLongitudinal Slope 0.00036 depth of flow in culvertside slope of batters 1 in 0 (close to drowned)Flow Area (A) 13.065 m2
ss length 3.35 mWetted Perimeter (P) 10.60 mHydraulic Radius (R) 1.23 mmannings n 0.013Capacity (Q) 43.8 m3/s - twin culverts - Ok approx 44 m3/s)Velocity (V) 1.68 m/s
Exit Loss coefficient = 1Exist loss = KexV
2/2g = 0.14 m
Depth in culvert = TWL + existing gloss = 3.35 OK, matches above
Inlet Loss coefficient = 0.5Inlet loss = KeV2/2g = 0.07 m
HWL = 42.25 .= tail water level of Warrigal bound culvertConfirmed , culverts not running under pressure.
EventWL At RB Outlet
(m AHD)1% AEP 42.3
9.5% AEP 41.518.13% AEP 41.4
1 EY 41.1
34
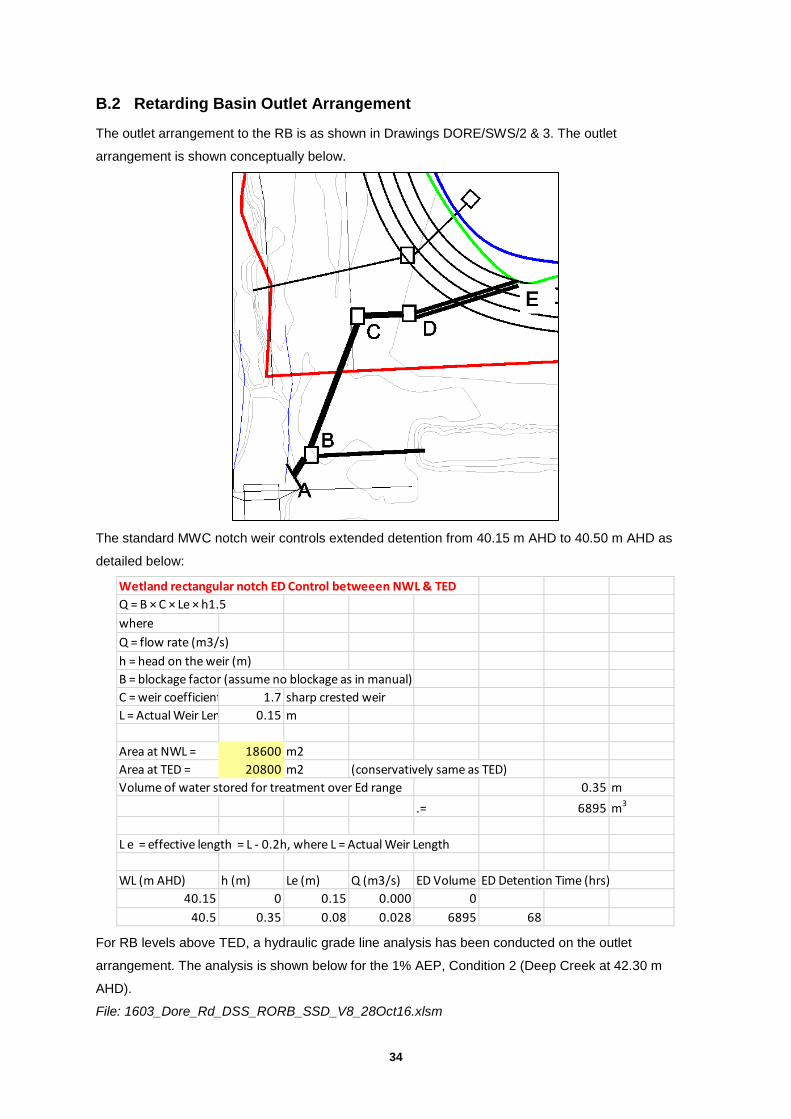
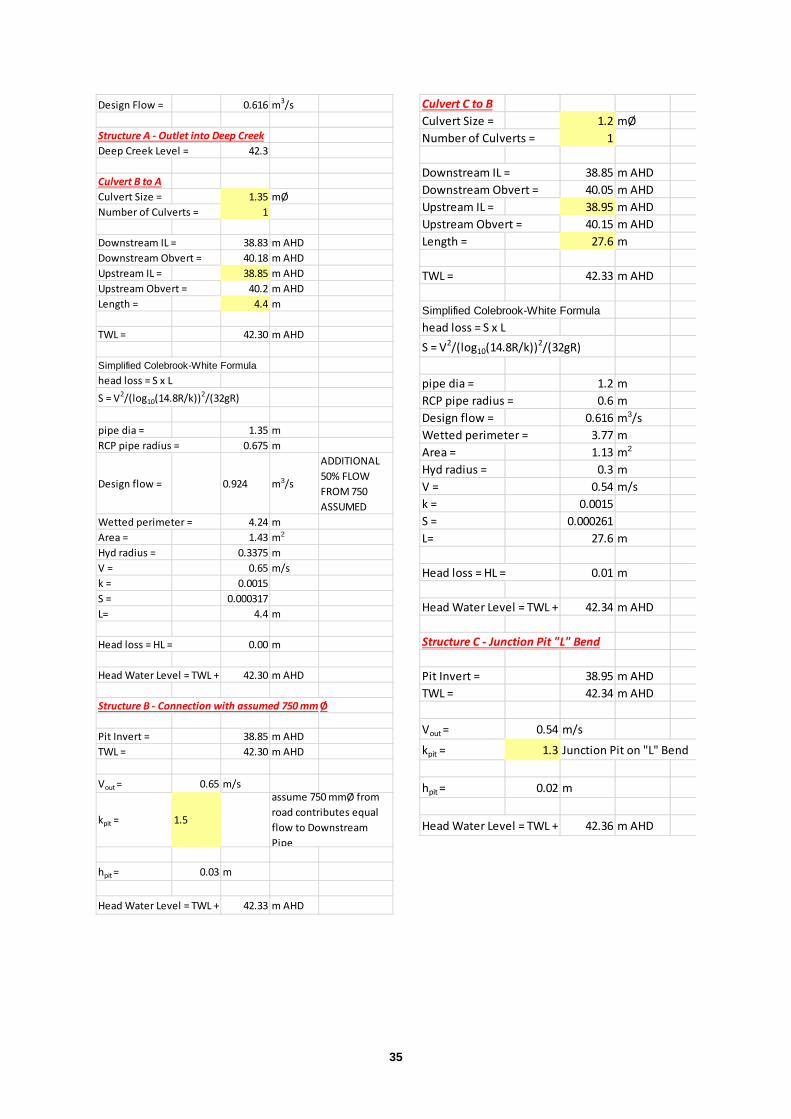
B.2 Retarding Basin Outlet Arrangement
The outlet arrangement to the RB is as shown in Drawings DORE/SWS/2 & 3. The outlet
arrangement is shown conceptually below.
The standard MWC notch weir controls extended detention from 40.15 m AHD to 40.50 m AHD as
detailed below:
For RB levels above TED, a hydraulic grade line analysis has been conducted on the outlet
arrangement. The analysis is shown below for the 1% AEP, Condition 2 (Deep Creek at 42.30 m
AHD).
File: 1603_Dore_Rd_DSS_RORB_SSD_V8_28Oct16.xlsm
Wetland rectangular notch ED Control betweeen NWL & TEDQ = B × C × Le × h1.5 whereQ = flow rate (m3/s)h = head on the weir (m)B = blockage factor (assume no blockage as in manual)C = weir coefficient 1.7 sharp crested weirL = Actual Weir Len 0.15 m
Area at NWL = 18600 m2Area at TED = 20800 m2 (conservatively same as TED)Volume of water stored for treatment over Ed range 0.35 m
.= 6895 m3
L e = effective length = L - 0.2h, where L = Actual Weir Length
WL (m AHD) h (m) Le (m) Q (m3/s) ED Volume (ED Detention Time (hrs)40.15 0 0.15 0.000 0
40.5 0.35 0.08 0.028 6895 68
35
Design Flow = 0.616 m3/s
Structure A - Outlet into Deep CreekDeep Creek Level = 42.3
Culvert B to ACulvert Size = 1.35 mØNumber of Culverts = 1
Downstream IL = 38.83 m AHDDownstream Obvert = 40.18 m AHDUpstream IL = 38.85 m AHDUpstream Obvert = 40.2 m AHDLength = 4.4 m
TWL = 42.30 m AHD
Simplified Colebrook-White Formulahead loss = S x LS = V2/(log10(14.8R/k))2/(32gR)
pipe dia = 1.35 mRCP pipe radius = 0.675 m
Design flow = 0.924 m3/s
ADDITIONAL 50% FLOW FROM 750 ASSUMED
Wetted perimeter = 4.24 mArea = 1.43 m2
Hyd radius = 0.3375 mV = 0.65 m/sk = 0.0015S = 0.000317L= 4.4 m
Head loss = HL = 0.00 m
Head Water Level = TWL + 42.30 m AHD
Structure B - Connection with assumed 750 mm Ø
Pit Invert = 38.85 m AHDTWL = 42.30 m AHD
Vout = 0.65 m/s
kpit = 1.5
hpit = 0.03 m
Head Water Level = TWL + 42.33 m AHD
assume 750 mmØ from road contributes equal flow to Downstream Pipe
Culvert C to BCulvert Size = 1.2 mØNumber of Culverts = 1
Downstream IL = 38.85 m AHDDownstream Obvert = 40.05 m AHDUpstream IL = 38.95 m AHDUpstream Obvert = 40.15 m AHDLength = 27.6 m
TWL = 42.33 m AHD
Simplified Colebrook-White Formulahead loss = S x LS = V2/(log10(14.8R/k))2/(32gR)
pipe dia = 1.2 mRCP pipe radius = 0.6 mDesign flow = 0.616 m3/sWetted perimeter = 3.77 mArea = 1.13 m2
Hyd radius = 0.3 mV = 0.54 m/sk = 0.0015S = 0.000261L= 27.6 m
Head loss = HL = 0.01 m
Head Water Level = TWL + 42.34 m AHD
Structure C - Junction Pit "L" Bend
Pit Invert = 38.95 m AHDTWL = 42.34 m AHD
Vout = 0.54 m/s
kpit = 1.3 Junction Pit on "L" Bend
hpit = 0.02 m
Head Water Level = TWL + 42.36 m AHD
36
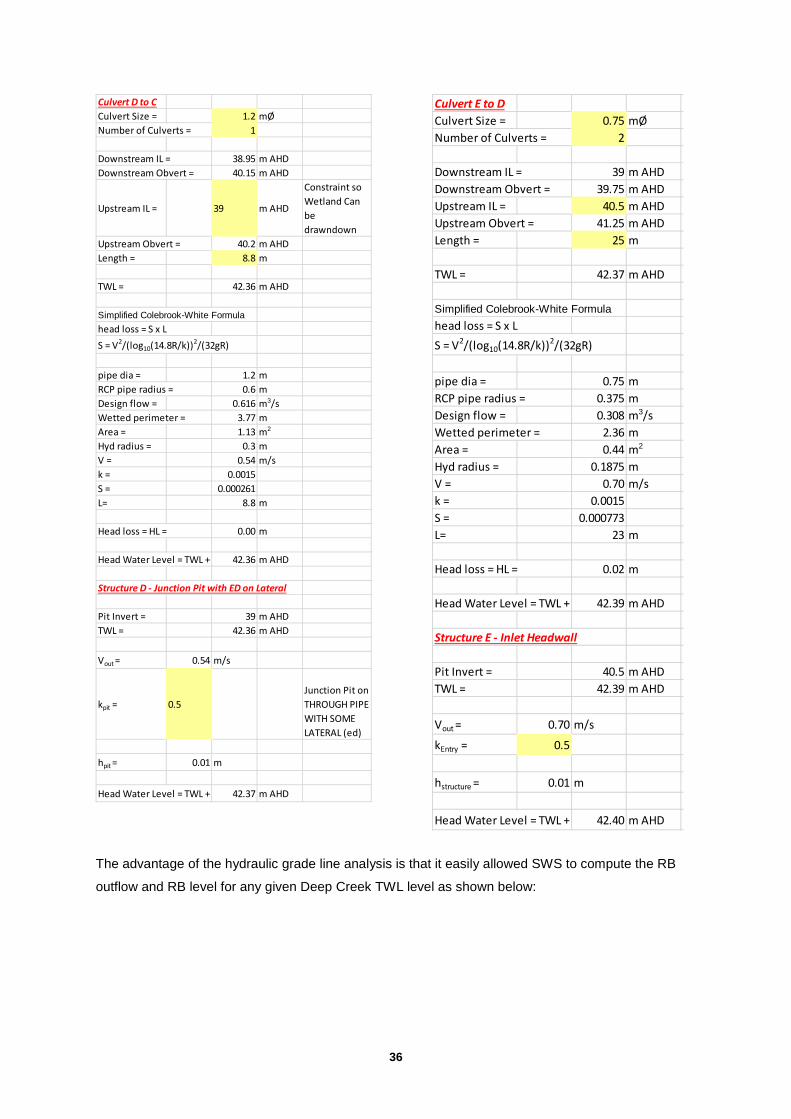
The advantage of the hydraulic grade line analysis is that it easily allowed SWS to compute the RB
outflow and RB level for any given Deep Creek TWL level as shown below:
Culvert D to CCulvert Size = 1.2 mØNumber of Culverts = 1
Downstream IL = 38.95 m AHDDownstream Obvert = 40.15 m AHD
Upstream IL = 39 m AHD
Constraint so Wetland Can be drawndown
Upstream Obvert = 40.2 m AHDLength = 8.8 m
TWL = 42.36 m AHD
Simplified Colebrook-White Formulahead loss = S x LS = V2/(log10(14.8R/k))2/(32gR)
pipe dia = 1.2 mRCP pipe radius = 0.6 mDesign flow = 0.616 m3/sWetted perimeter = 3.77 mArea = 1.13 m2
Hyd radius = 0.3 mV = 0.54 m/sk = 0.0015S = 0.000261L= 8.8 m
Head loss = HL = 0.00 m
Head Water Level = TWL + 42.36 m AHD
Structure D - Junction Pit with ED on Lateral
Pit Invert = 39 m AHDTWL = 42.36 m AHD
Vout = 0.54 m/s
kpit = 0.5Junction Pit on THROUGH PIPE WITH SOME LATERAL (ed)
hpit = 0.01 m
Head Water Level = TWL + 42.37 m AHD
Culvert E to DCulvert Size = 0.75 mØNumber of Culverts = 2
Downstream IL = 39 m AHDDownstream Obvert = 39.75 m AHDUpstream IL = 40.5 m AHDUpstream Obvert = 41.25 m AHDLength = 25 m
TWL = 42.37 m AHD
Simplified Colebrook-White Formulahead loss = S x LS = V2/(log10(14.8R/k))2/(32gR)
pipe dia = 0.75 mRCP pipe radius = 0.375 mDesign flow = 0.308 m3/sWetted perimeter = 2.36 mArea = 0.44 m2
Hyd radius = 0.1875 mV = 0.70 m/sk = 0.0015S = 0.000773L= 23 m
Head loss = HL = 0.02 m
Head Water Level = TWL + 42.39 m AHD
Structure E - Inlet Headwall
Pit Invert = 40.5 m AHDTWL = 42.39 m AHD
Vout = 0.70 m/s
kEntry = 0.5
hstructure = 0.01 m
Head Water Level = TWL + 42.40 m AHD
37
Using the above table, SWS was able to Formulate SSD’s for each event (1%, 9.5%, 18.13% AEP, 1 EY) and for each condition. It should be noted SWS has assumed that
the although the RB is affected by the TWL in Deep Creek, a small flow 0.026 to 0.027 m3/s, is able to be conveyed out into Deep Creek, even when the flood level in Deep
Creek is high.
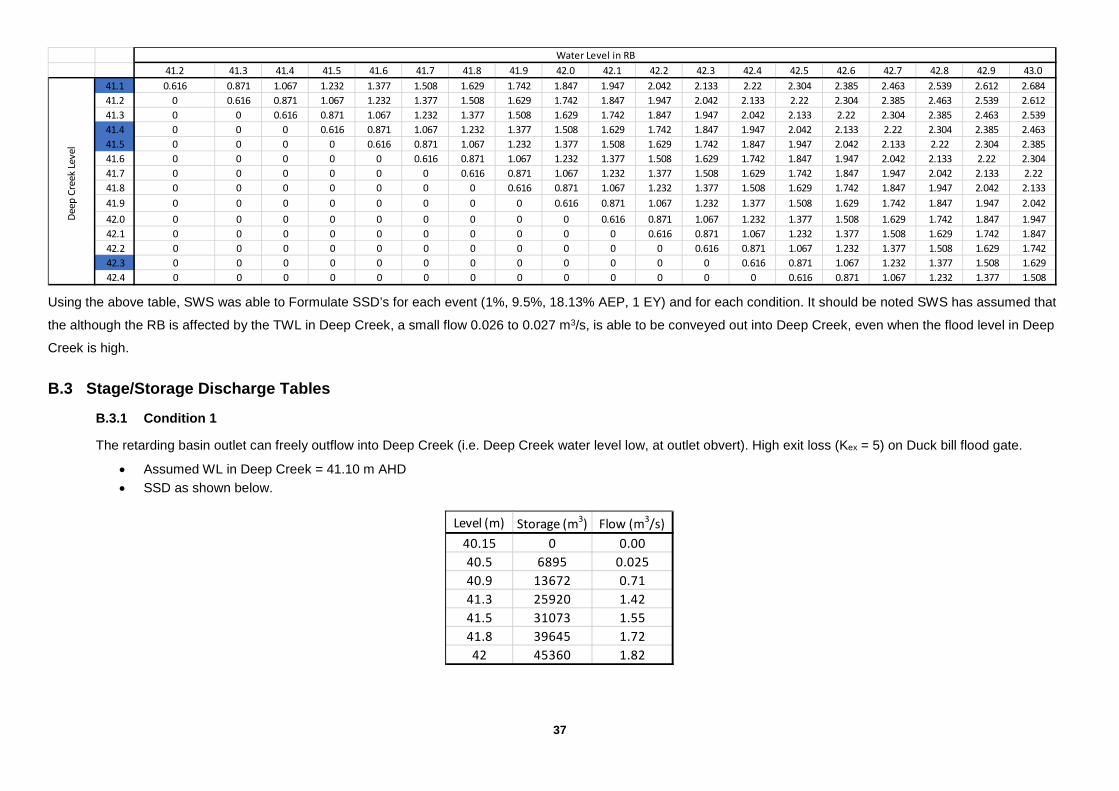
B.3 Stage/Storage Discharge Tables
B.3.1 Condition 1
The retarding basin outlet can freely outflow into Deep Creek (i.e. Deep Creek water level low, at outlet obvert). High exit loss (Kex = 5) on Duck bill flood gate.
• Assumed WL in Deep Creek = 41.10 m AHD • SSD as shown below.
41.2 41.3 41.4 41.5 41.6 41.7 41.8 41.9 42.0 42.1 42.2 42.3 42.4 42.5 42.6 42.7 42.8 42.9 43.041.1 0.616 0.871 1.067 1.232 1.377 1.508 1.629 1.742 1.847 1.947 2.042 2.133 2.22 2.304 2.385 2.463 2.539 2.612 2.68441.2 0 0.616 0.871 1.067 1.232 1.377 1.508 1.629 1.742 1.847 1.947 2.042 2.133 2.22 2.304 2.385 2.463 2.539 2.61241.3 0 0 0.616 0.871 1.067 1.232 1.377 1.508 1.629 1.742 1.847 1.947 2.042 2.133 2.22 2.304 2.385 2.463 2.53941.4 0 0 0 0.616 0.871 1.067 1.232 1.377 1.508 1.629 1.742 1.847 1.947 2.042 2.133 2.22 2.304 2.385 2.46341.5 0 0 0 0 0.616 0.871 1.067 1.232 1.377 1.508 1.629 1.742 1.847 1.947 2.042 2.133 2.22 2.304 2.38541.6 0 0 0 0 0 0.616 0.871 1.067 1.232 1.377 1.508 1.629 1.742 1.847 1.947 2.042 2.133 2.22 2.30441.7 0 0 0 0 0 0 0.616 0.871 1.067 1.232 1.377 1.508 1.629 1.742 1.847 1.947 2.042 2.133 2.2241.8 0 0 0 0 0 0 0 0.616 0.871 1.067 1.232 1.377 1.508 1.629 1.742 1.847 1.947 2.042 2.13341.9 0 0 0 0 0 0 0 0 0.616 0.871 1.067 1.232 1.377 1.508 1.629 1.742 1.847 1.947 2.04242.0 0 0 0 0 0 0 0 0 0 0.616 0.871 1.067 1.232 1.377 1.508 1.629 1.742 1.847 1.94742.1 0 0 0 0 0 0 0 0 0 0 0.616 0.871 1.067 1.232 1.377 1.508 1.629 1.742 1.84742.2 0 0 0 0 0 0 0 0 0 0 0 0.616 0.871 1.067 1.232 1.377 1.508 1.629 1.74242.3 0 0 0 0 0 0 0 0 0 0 0 0 0.616 0.871 1.067 1.232 1.377 1.508 1.62942.4 0 0 0 0 0 0 0 0 0 0 0 0 0 0.616 0.871 1.067 1.232 1.377 1.508
Deep
Cre
ek Le
vel
Water Level in RB
Level (m) Storage (m3) Flow (m3/s)40.15 0 0.0040.5 6895 0.02540.9 13672 0.7141.3 25920 1.4241.5 31073 1.5541.8 39645 1.7242 45360 1.82
38
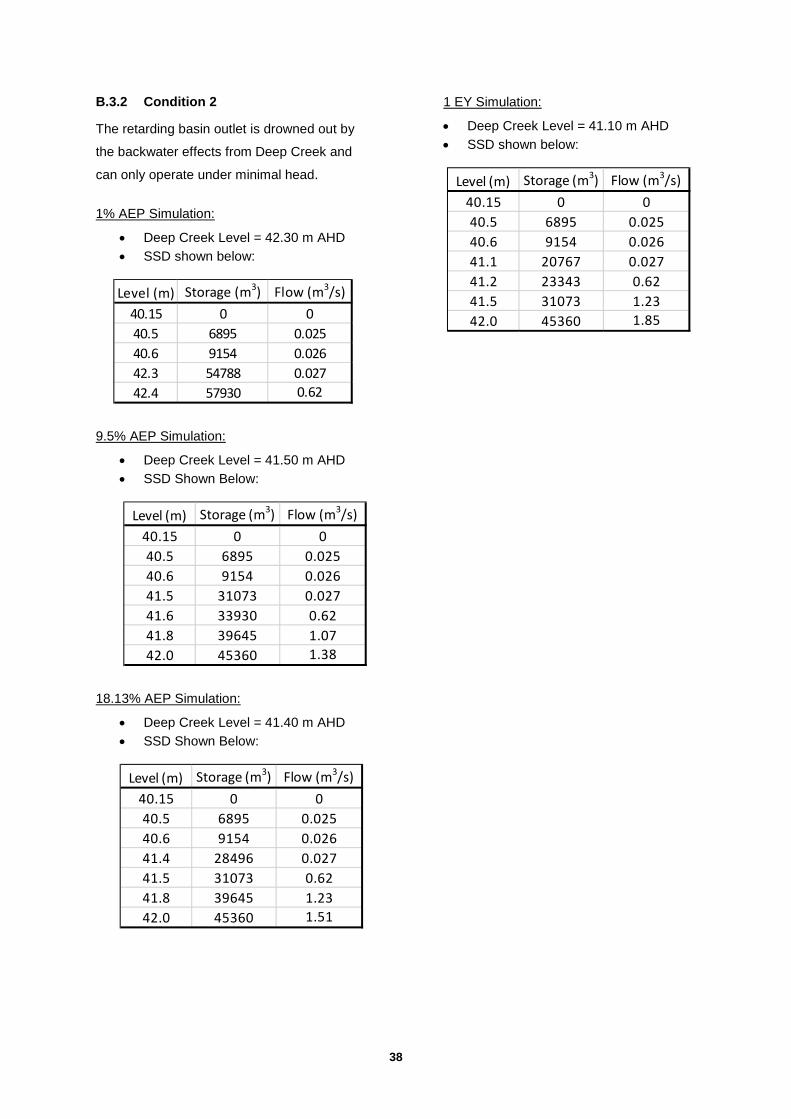
B.3.2 Condition 2
The retarding basin outlet is drowned out by
the backwater effects from Deep Creek and
can only operate under minimal head.
1% AEP Simulation:
• Deep Creek Level = 42.30 m AHD • SSD shown below:
9.5% AEP Simulation:
• Deep Creek Level = 41.50 m AHD • SSD Shown Below:
18.13% AEP Simulation:
• Deep Creek Level = 41.40 m AHD • SSD Shown Below:
1 EY Simulation:
• Deep Creek Level = 41.10 m AHD • SSD shown below:
Level (m) Storage (m3) Flow (m3/s)40.15 0 040.5 6895 0.02540.6 9154 0.02642.3 54788 0.02742.4 57930 0.62
Level (m) Storage (m3) Flow (m3/s)40.15 0 040.5 6895 0.02540.6 9154 0.02641.5 31073 0.02741.6 33930 0.6241.8 39645 1.0742.0 45360 1.38
Level (m) Storage (m3) Flow (m3/s)40.15 0 040.5 6895 0.02540.6 9154 0.02641.4 28496 0.02741.5 31073 0.6241.8 39645 1.2342.0 45360 1.51
Level (m) Storage (m3) Flow (m3/s)40.15 0 040.5 6895 0.02540.6 9154 0.02641.1 20767 0.02741.2 23343 0.6241.5 31073 1.2342.0 45360 1.85

39
Appendix C – Wetland Inlet & Gas Crossing Calculations 18.13% AEP flows into the Dore Road wetland/RB from the large residential zoning land to the north
east of the catchment are proposed to be conveyed within a 18.13% AEP pipe system. It is assumed
events larger than this will be conveyed into the wetland/retarding basin via appropriate overland flow
path provisions across the gas mains (to be designed once development layout is known).
Two 750 mmØ gas mains separate this large residential development from the wetland/retarding
basin. The design of the 18.13% AEP system to upstream of the gas mains has been completed to
accommodate this constraint. Sizing this system upfront ensures that the NWL of the wetland is set
correctly to allow for appropriate slope (1 in 300) on the 18.13% AEP inlet system while maintaining
Origin Energy’s conditions in regards to the crossing of the Gas Mains.
APA (who manage the assets on behalf of Origin Energy) have advised that in regards to the gas
crossing:
• APA would like all crossings to cross perpendicular to the gas mains,
• APA would prefer that no pipe connections were made between the two major gas mains, the
Pakenham – Wollert line and the Langford – Dandendong line,
• When going under the mains, APA requires 500mm-600mm clearance
• When going over the main:
o 1.2m of cover from the top of the pipe
o There may be some coating of existing mains required
o Possible velocity constraints of a channel may be proposed.
APA gas main contacts for design going forward should be:
• Peter Dawson (03) 9797 5149
• Daniel Tucci (03) 9797 5330 [email protected]
• Ken Adamson (03) 5976 0314 [email protected]
Note: Ken Adamson should be the first contact if available
As part of the functional design process, the gas mains have been surveyed in the vicinity of the
crossing. Cardno competed a “Utility Investigation Summary Report, Dore Road, Pakenham, 8
September 2016” which details the location and levels of the mains near the proposed crossing.
Analysis of the findings is that the gas main is approximately 1m higher at the eastern end of the
survey area compared to the western end. As such, SWS has designed the pipe alignment to cross
as far east as known, thus maximising the pipe size allowed in the design while keeping the system
under appropriate head.
Assuming the NWL of the wetland is 40.15 m AHD as detailed in this functional design, SWS has
completed a HGL analysis of the 18.13% AEP inlet system to ensure that all of the above Origin
requirements are met and that the pipes have appropriate slope.
40
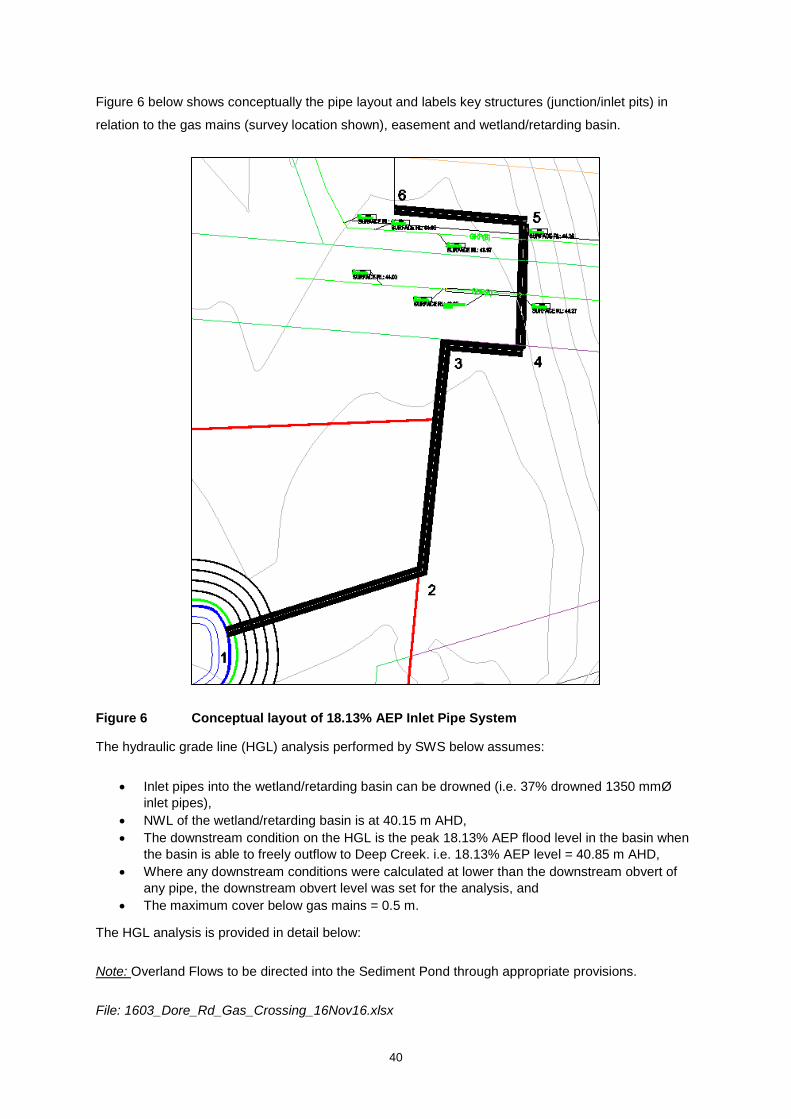
Figure 6 below shows conceptually the pipe layout and labels key structures (junction/inlet pits) in
relation to the gas mains (survey location shown), easement and wetland/retarding basin.
Figure 6 Conceptual layout of 18.13% AEP Inlet Pipe System
The hydraulic grade line (HGL) analysis performed by SWS below assumes:
• Inlet pipes into the wetland/retarding basin can be drowned (i.e. 37% drowned 1350 mmØ inlet pipes),
• NWL of the wetland/retarding basin is at 40.15 m AHD, • The downstream condition on the HGL is the peak 18.13% AEP flood level in the basin when
the basin is able to freely outflow to Deep Creek. i.e. 18.13% AEP level = 40.85 m AHD, • Where any downstream conditions were calculated at lower than the downstream obvert of
any pipe, the downstream obvert level was set for the analysis, and • The maximum cover below gas mains = 0.5 m.
The HGL analysis is provided in detail below:
Note: Overland Flows to be directed into the Sediment Pond through appropriate provisions.
File: 1603_Dore_Rd_Gas_Crossing_16Nov16.xlsx
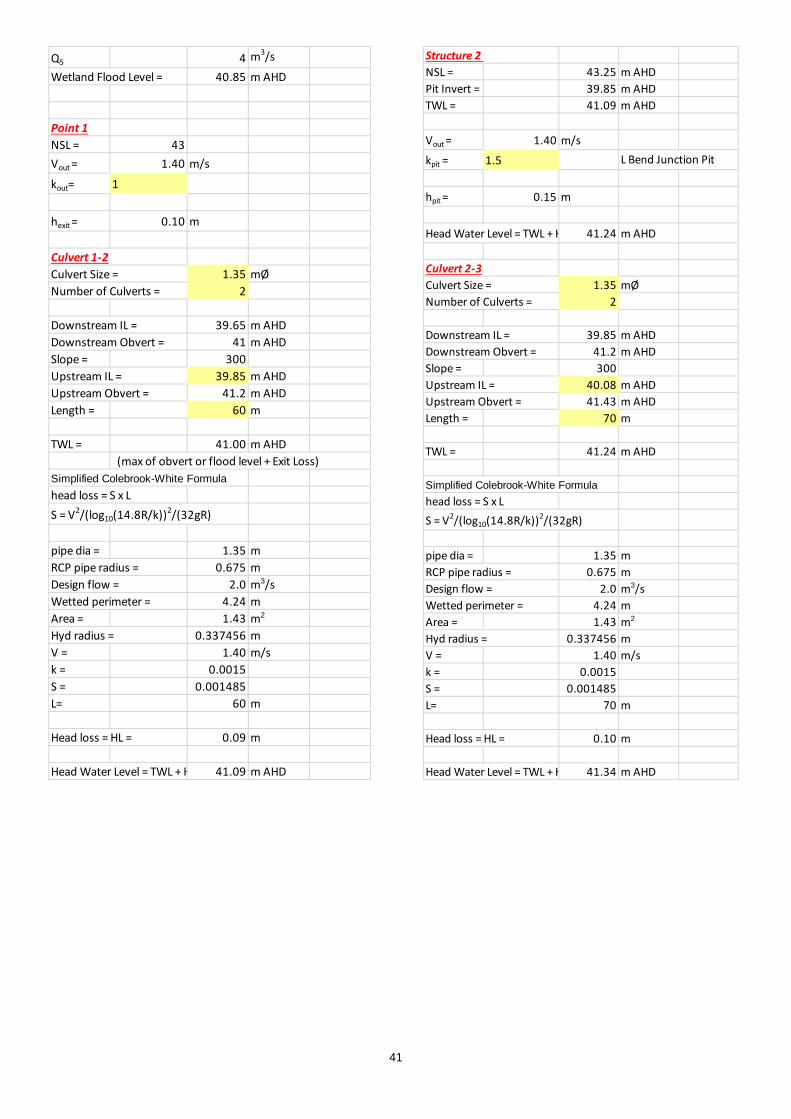
41
Q5 4 m3/s
Wetland Flood Level = 40.85 m AHD
Point 1NSL = 43Vout = 1.40 m/s
kout= 1
hexit = 0.10 m
Culvert 1-2Culvert Size = 1.35 mØNumber of Culverts = 2
Downstream IL = 39.65 m AHDDownstream Obvert = 41 m AHDSlope = 300Upstream IL = 39.85 m AHDUpstream Obvert = 41.2 m AHDLength = 60 m
TWL = 41.00 m AHD(max of obvert or flood level + Exit Loss)
Simplified Colebrook-White Formulahead loss = S x LS = V2/(log10(14.8R/k))2/(32gR)
pipe dia = 1.35 mRCP pipe radius = 0.675 mDesign flow = 2.0 m3/sWetted perimeter = 4.24 mArea = 1.43 m2
Hyd radius = 0.337456 mV = 1.40 m/sk = 0.0015S = 0.001485L= 60 m
Head loss = HL = 0.09 m
Head Water Level = TWL + H 41.09 m AHD
Structure 2 NSL = 43.25 m AHDPit Invert = 39.85 m AHDTWL = 41.09 m AHD
Vout = 1.40 m/s
kpit = 1.5
hpit = 0.15 m
Head Water Level = TWL + H 41.24 m AHD
Culvert 2-3Culvert Size = 1.35 mØNumber of Culverts = 2
Downstream IL = 39.85 m AHDDownstream Obvert = 41.2 m AHDSlope = 300Upstream IL = 40.08 m AHDUpstream Obvert = 41.43 m AHDLength = 70 m
TWL = 41.24 m AHD
Simplified Colebrook-White Formulahead loss = S x LS = V2/(log10(14.8R/k))2/(32gR)
pipe dia = 1.35 mRCP pipe radius = 0.675 mDesign flow = 2.0 m3/sWetted perimeter = 4.24 mArea = 1.43 m2
Hyd radius = 0.337456 mV = 1.40 m/sk = 0.0015S = 0.001485L= 70 m
Head loss = HL = 0.10 m
Head Water Level = TWL + H 41.34 m AHD
L Bend Junction Pit
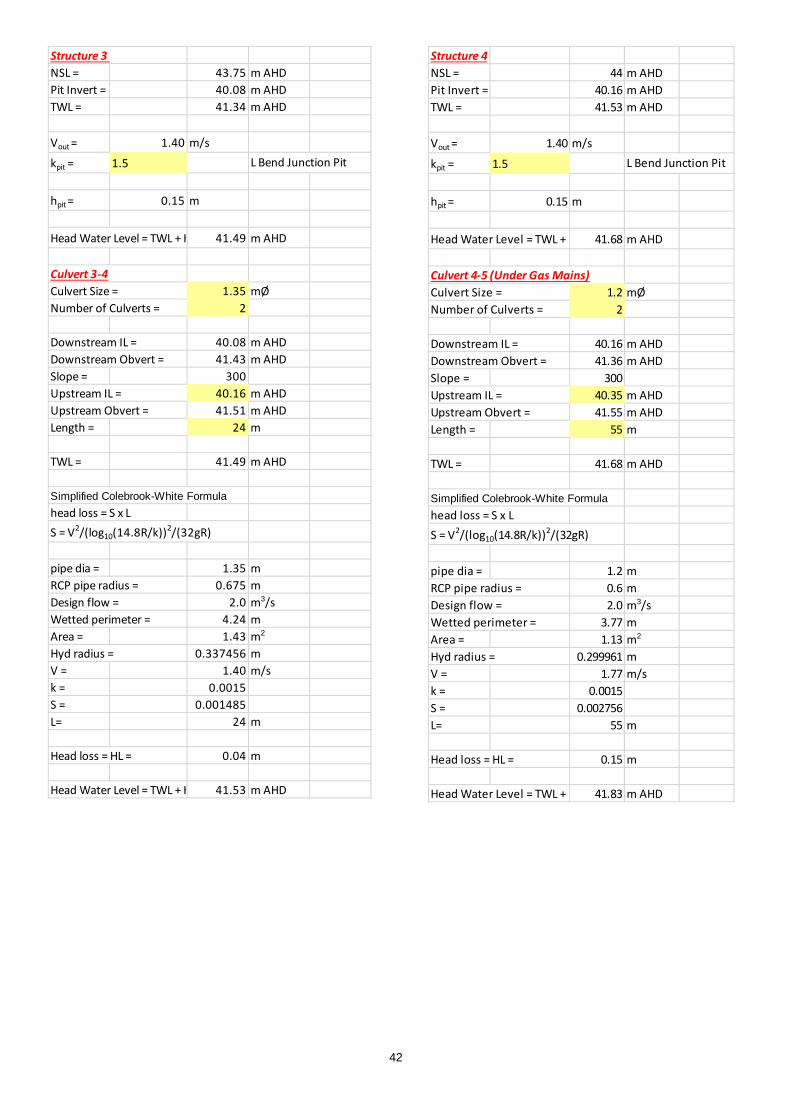
42
Structure 3 NSL = 43.75 m AHDPit Invert = 40.08 m AHDTWL = 41.34 m AHD
Vout = 1.40 m/s
kpit = 1.5
hpit = 0.15 m
Head Water Level = TWL + H 41.49 m AHD
Culvert 3-4Culvert Size = 1.35 mØNumber of Culverts = 2
Downstream IL = 40.08 m AHDDownstream Obvert = 41.43 m AHDSlope = 300Upstream IL = 40.16 m AHDUpstream Obvert = 41.51 m AHDLength = 24 m
TWL = 41.49 m AHD
Simplified Colebrook-White Formulahead loss = S x LS = V2/(log10(14.8R/k))2/(32gR)
pipe dia = 1.35 mRCP pipe radius = 0.675 mDesign flow = 2.0 m3/sWetted perimeter = 4.24 mArea = 1.43 m2
Hyd radius = 0.337456 mV = 1.40 m/sk = 0.0015S = 0.001485L= 24 m
Head loss = HL = 0.04 m
Head Water Level = TWL + H 41.53 m AHD
L Bend Junction Pit
Structure 4NSL = 44 m AHDPit Invert = 40.16 m AHDTWL = 41.53 m AHD
Vout = 1.40 m/s
kpit = 1.5
hpit = 0.15 m
Head Water Level = TWL + H 41.68 m AHD
Culvert 4-5 (Under Gas Mains)Culvert Size = 1.2 mØNumber of Culverts = 2
Downstream IL = 40.16 m AHDDownstream Obvert = 41.36 m AHDSlope = 300Upstream IL = 40.35 m AHDUpstream Obvert = 41.55 m AHDLength = 55 m
TWL = 41.68 m AHD
Simplified Colebrook-White Formulahead loss = S x LS = V2/(log10(14.8R/k))2/(32gR)
pipe dia = 1.2 mRCP pipe radius = 0.6 mDesign flow = 2.0 m3/sWetted perimeter = 3.77 mArea = 1.13 m2
Hyd radius = 0.299961 mV = 1.77 m/sk = 0.0015S = 0.002756L= 55 m
Head loss = HL = 0.15 m
Head Water Level = TWL + H 41.83 m AHD
L Bend Junction Pit
43
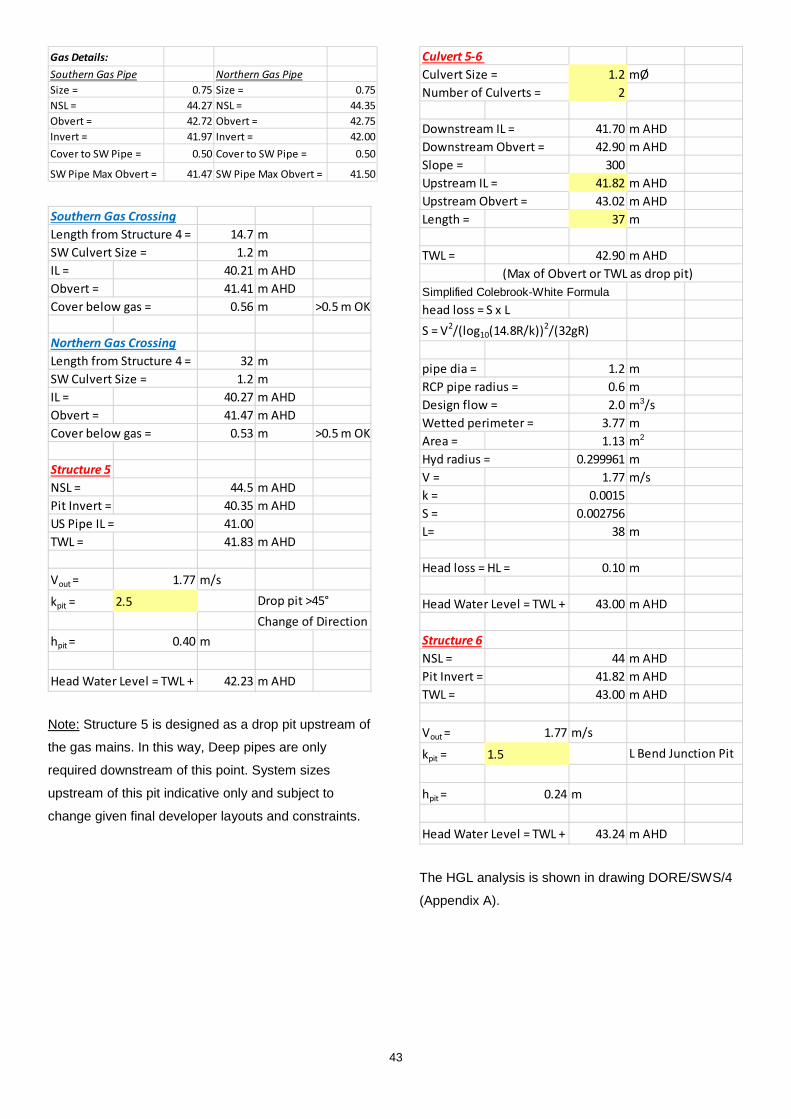
Note: Structure 5 is designed as a drop pit upstream of
the gas mains. In this way, Deep pipes are only
required downstream of this point. System sizes
upstream of this pit indicative only and subject to
change given final developer layouts and constraints.
The HGL analysis is shown in drawing DORE/SWS/4
(Appendix A).
Gas Details:Southern Gas Pipe Northern Gas PipeSize = 0.75 Size = 0.75NSL = 44.27 NSL = 44.35Obvert = 42.72 Obvert = 42.75Invert = 41.97 Invert = 42.00Cover to SW Pipe = 0.50 Cover to SW Pipe = 0.50
SW Pipe Max Obvert = 41.47 SW Pipe Max Obvert = 41.50
Southern Gas CrossingLength from Structure 4 = 14.7 mSW Culvert Size = 1.2 mIL = 40.21 m AHDObvert = 41.41 m AHDCover below gas = 0.56 m >0.5 m OK
Northern Gas CrossingLength from Structure 4 = 32 mSW Culvert Size = 1.2 mIL = 40.27 m AHDObvert = 41.47 m AHDCover below gas = 0.53 m >0.5 m OK
Structure 5NSL = 44.5 m AHDPit Invert = 40.35 m AHDUS Pipe IL = 41.00TWL = 41.83 m AHD
Vout = 1.77 m/s
kpit = 2.5Change of Direction
hpit = 0.40 m
Head Water Level = TWL + H 42.23 m AHD
Drop pit >45°
Culvert 5-6 Culvert Size = 1.2 mØNumber of Culverts = 2
Downstream IL = 41.70 m AHDDownstream Obvert = 42.90 m AHDSlope = 300Upstream IL = 41.82 m AHDUpstream Obvert = 43.02 m AHDLength = 37 m
TWL = 42.90 m AHD(Max of Obvert or TWL as drop pit)
Simplified Colebrook-White Formulahead loss = S x LS = V2/(log10(14.8R/k))2/(32gR)
pipe dia = 1.2 mRCP pipe radius = 0.6 mDesign flow = 2.0 m3/sWetted perimeter = 3.77 mArea = 1.13 m2
Hyd radius = 0.299961 mV = 1.77 m/sk = 0.0015S = 0.002756L= 38 m
Head loss = HL = 0.10 m
Head Water Level = TWL + H 43.00 m AHD
Structure 6NSL = 44 m AHDPit Invert = 41.82 m AHDTWL = 43.00 m AHD
Vout = 1.77 m/s
kpit = 1.5
hpit = 0.24 m
Head Water Level = TWL + H 43.24 m AHD
L Bend Junction Pit
44
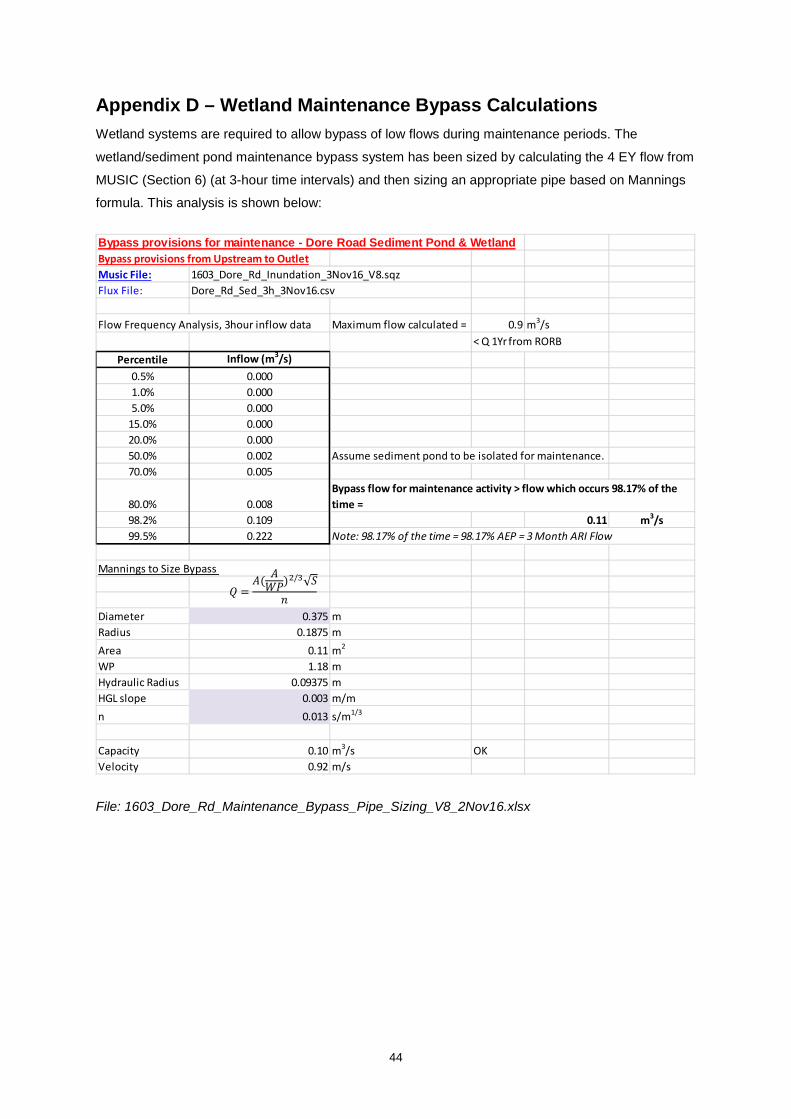
Appendix D – Wetland Maintenance Bypass Calculations Wetland systems are required to allow bypass of low flows during maintenance periods. The
wetland/sediment pond maintenance bypass system has been sized by calculating the 4 EY flow from
MUSIC (Section 6) (at 3-hour time intervals) and then sizing an appropriate pipe based on Mannings
formula. This analysis is shown below:
File: 1603_Dore_Rd_Maintenance_Bypass_Pipe_Sizing_V8_2Nov16.xlsx
Bypass provisions for maintenance - Dore Road Sediment Pond & WetlandBypass provisions from Upstream to OutletMusic File: 1603_Dore_Rd_Inundation_3Nov16_V8.sqzFlux File: Dore_Rd_Sed_3h_3Nov16.csv
Flow Frequency Analysis, 3hour inflow data Maximum flow calculated = 0.9 m3/s< Q 1Yr from RORB
Percentile Inflow (m3/s)0.5% 0.0001.0% 0.0005.0% 0.000
15.0% 0.00020.0% 0.00050.0% 0.002 Assume sediment pond to be isolated for maintenance.70.0% 0.005
80.0% 0.00898.2% 0.109 0.11 m3/s99.5% 0.222 Note: 98.17% of the time = 98.17% AEP = 3 Month ARI Flow
Mannings to Size Bypass
Diameter 0.375 mRadius 0.1875 mArea 0.11 m2
WP 1.18 mHydraulic Radius 0.09375 mHGL slope 0.003 m/mn 0.013 s/m1/3
Capacity 0.10 m3/s OKVelocity 0.92 m/s
Bypass flow for maintenance activity > flow which occurs 98.17% of the time =
𝑄𝑄 =𝐴𝐴( 𝐴𝐴𝑊𝑃)2/3 𝑆𝑆�
𝑛
45
Appendix E – Sediment Pond Design Calculations File: 1603_Dore_Rd_Sed_Pond_Sizing_V8_17Nov16.xlsx
General
Fill in the following given the concept/functional design drawing parameters
NWL = 40.15 m AHDTED = 40.5 m AHDSafety batters at 1 in 8 to 350 below NWBase level = 39.15 m AHD
Area at NWL = 1265.00 m2
Total Volume = 915 m3
Sump Volume (volume below350 mm depth) = 531 m3
Batters - GeneralBatters above NWL = 1 in 6Batters NWL to 350 below NWL= 1 in 8Batters 350 below NWL to base= 1 in 3
Batters - access trackBatters above NWL = 1 in 15Batters NWL to 500 below NWL= 1 in 8Batters 500 below NWL to base= 1 in 5Concrete base
Sediment Removal
Fill in the following given the concept/functional design drawing parameters
Fair and Geyer Equation
R = fraction of Initial Solids Removed = 80 - 90 % typ.
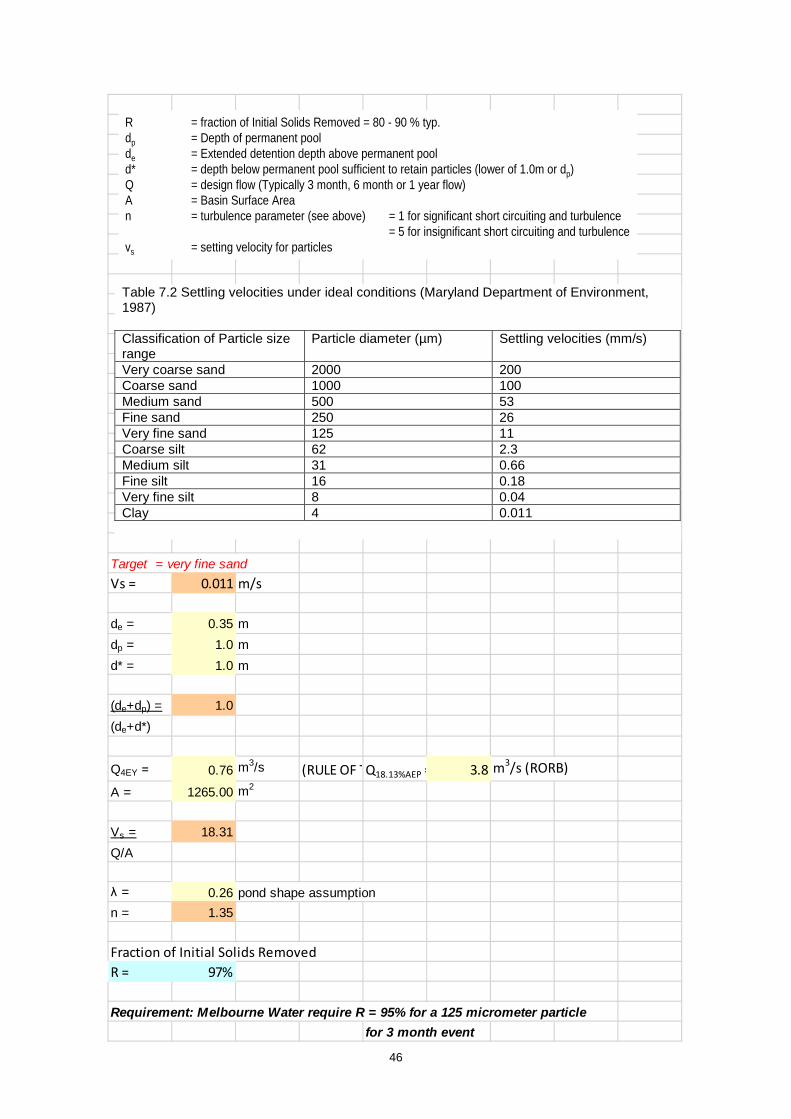
46
Target = very fine sandVs = 0.011 m/s
de = 0.35 mdp = 1.0 md* = 1.0 m
(de+dp) = 1.0(de+d*)
Q4EY = 0.76 m3/s (RULE OF T Q18.13%AEP = 3.8 m3/s (RORB)
A = 1265.00 m2
Vs = 18.31Q/A
λ = 0.26 pond shape assumptionn = 1.35
Fraction of Initial Solids Removed R = 97%
Requirement: Melbourne Water require R = 95% for a 125 micrometer particlefor 3 month event
Table 7.2 Settling velocities under ideal conditions (Maryland Department of Environment, 1987) Classification of Particle size range
Particle diameter (µm) Settling velocities (mm/s)
Very coarse sand 2000 200 Coarse sand 1000 100 Medium sand 500 53 Fine sand 250 26 Very fine sand 125 11 Coarse silt 62 2.3 Medium silt 31 0.66 Fine silt 16 0.18 Very fine silt 8 0.04 Clay 4 0.011
R = fraction of Initial Solids Removed = 80 - 90 % typ.dp = Depth of permanent poolde = Extended detention depth above permanent poold* = depth below permanent pool sufficient to retain particles (lower of 1.0m or dp)Q = design flow (Typically 3 month, 6 month or 1 year flow)A = Basin Surface Arean = turbulence parameter (see above) = 1 for significant short circuiting and turbulence. = 5 for insignificant short circuiting and turbulencevs = setting velocity for particles

47
Cleanout Frequency
Catchment Area = 54.75 ha Areas A-RSediment load = 1.6 m3/ha/yr ( Willing and Partners 1992 urban load)Gross Pollutant Load = 0.4 m3/ha/yr ( Alison et al 1998) Sump Volume = 531 m3 area between base and 0.35 m below NWL
Therefore, cleanout frequency required =R(1.6+0.4)Acatchment = 0.2 per year(sediment to 500 below NWL) sump volume
.= every 5 years OKAssumes cleanout when sump volume of basin is full (ie sediment 350 mm below NWL)
Sediment Dewatering Area
Dewatering depth = 0.5 mSediment volume collected every 5 years= 533 m3
Required Dewatering area = 1066 m2
Ensure this area is provided near the sediment pond and is accessib le with machinery/access tracks etc.
Dewatering Provision for Maintenance
Isolate shown in Drawing DORE/SWS/1 (Appendix A)
Sediment Pond Flood Flow Velocity Check
See Appendix F
48
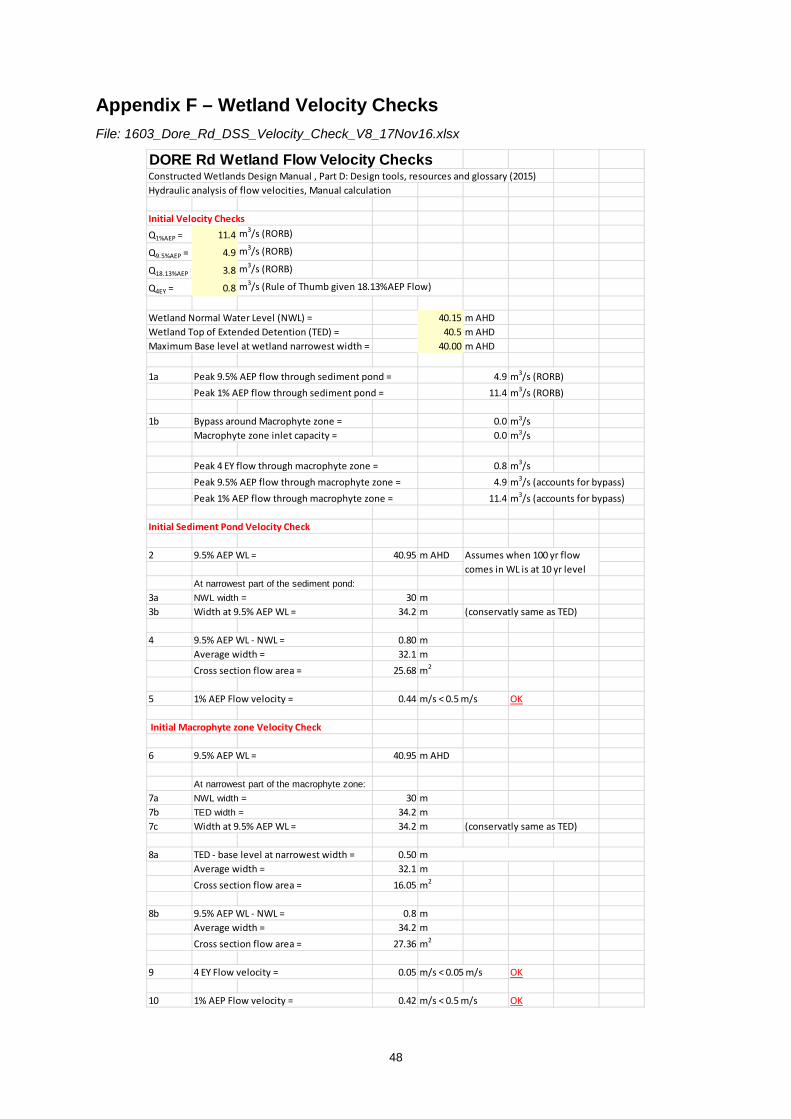
Appendix F – Wetland Velocity Checks File: 1603_Dore_Rd_DSS_Velocity_Check_V8_17Nov16.xlsx
DORE Rd Wetland Flow Velocity Checks Constructed Wetlands Design Manual , Part D: Design tools, resources and glossary (2015)Hydraulic analysis of flow velocities, Manual calculation
Initial Velocity ChecksQ1%AEP = 11.4 m3/s (RORB)
Q9.5%AEP = 4.9 m3/s (RORB)
Q18.13%AEP = 3.8 m3/s (RORB)
Q4EY = 0.8 m3/s (Rule of Thumb given 18.13%AEP Flow)
Wetland Normal Water Level (NWL) = 40.15 m AHDWetland Top of Extended Detention (TED) = 40.5 m AHDMaximum Base level at wetland narrowest width = 40.00 m AHD
1a Peak 9.5% AEP flow through sediment pond = 4.9 m3/s (RORB)Peak 1% AEP flow through sediment pond = 11.4 m3/s (RORB)
1b Bypass around Macrophyte zone = 0.0 m3/sMacrophyte zone inlet capacity = 0.0 m3/s
Peak 4 EY flow through macrophyte zone = 0.8 m3/s Peak 9.5% AEP flow through macrophyte zone = 4.9 m3/s (accounts for bypass)Peak 1% AEP flow through macrophyte zone = 11.4 m3/s (accounts for bypass)
Initial Sediment Pond Velocity Check
2 9.5% AEP WL = 40.95 m AHD
At narrowest part of the sediment pond:3a NWL width = 30 m3b Width at 9.5% AEP WL = 34.2 m (conservatly same as TED)
4 9.5% AEP WL - NWL = 0.80 mAverage width = 32.1 mCross section flow area = 25.68 m2
5 1% AEP Flow velocity = 0.44 m/s < 0.5 m/s OK
Initial Macrophyte zone Velocity Check
6 9.5% AEP WL = 40.95 m AHD
At narrowest part of the macrophyte zone:7a NWL width = 30 m7b TED width = 34.2 m7c Width at 9.5% AEP WL = 34.2 m (conservatly same as TED)
8a TED - base level at narrowest width = 0.50Average width = 32.1 mCross section flow area = 16.05 m2
8b 9.5% AEP WL - NWL = 0.8 mAverage width = 34.2 mCross section flow area = 27.36 m2
9 4 EY Flow velocity = 0.05 m/s < 0.05 m/s OK
10 1% AEP Flow velocity = 0.42 m/s < 0.5 m/s OK
Assumes when 100 yr flow comes in WL is at 10 yr level
m

49
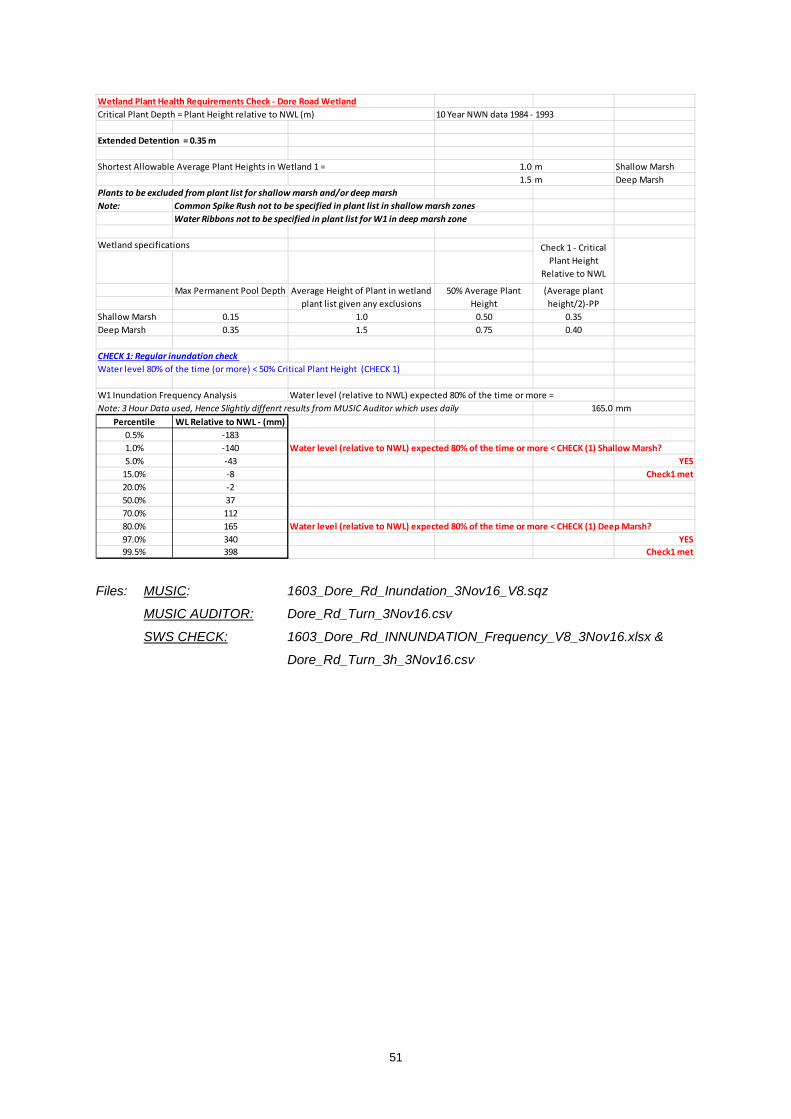
Appendix G – Wetland Inundation Check The analysis detailed below documents the regular inundation checks and excessive inundation
checks required by MWC to ensure the long-term wetland health of systems if this type. The check
required to be undertaken is:
Check 1: Regular inundation check
Water level 80% of the time (or more) < 50% Critical Plant Height
Critical plant height is defined as the plant height relative to NWL (m AHD). It is assumed that the
shortest allowable average plant heights are 1.5 meters in shallow marsh and 1.5 meters in deep
marsh zones.
The analysis assumes the MUSIC model detailed in Section 6 with Narre Warren North rainfall data at
6 minute increments (1984 – 1993).
The MUSIC model incorporates internally calculated outflow relationships pertaining to:
• 72 hours’ detention time in the ED zone, and
• Detention times calculated assuming weir widths as per the outlet pit as shown in drawing
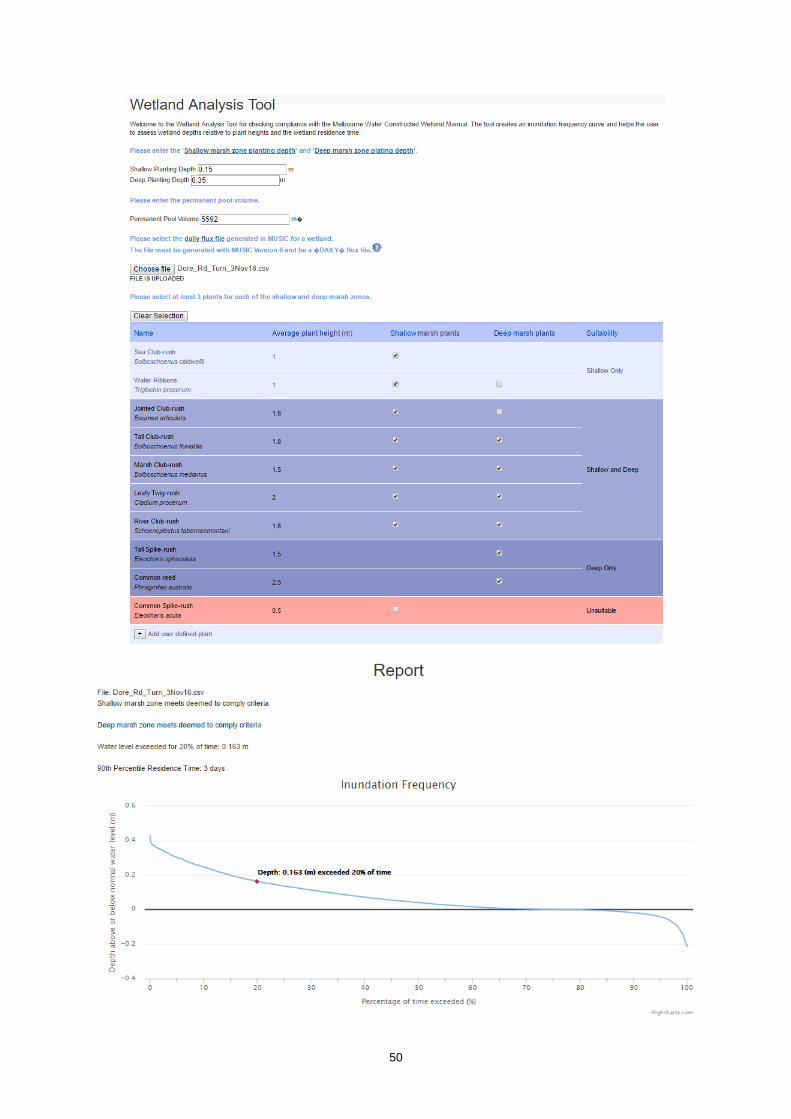
DORE/SWS/2 & 3 for water levels above the ED zone.
The analysis was completed using the MUSIC Auditor – Wetland Analysis Tool as shown below. This
analysis results in:
• Common Spike-rush being excluded from the specified plant list in shallow marsh zones, and
• Water Ribbons being excluded from the specified plant list in deep marsh zones.
50
51
Files: MUSIC: 1603_Dore_Rd_Inundation_3Nov16_V8.sqz
MUSIC AUDITOR: Dore_Rd_Turn_3Nov16.csv
SWS CHECK: 1603_Dore_Rd_INNUNDATION_Frequency_V8_3Nov16.xlsx &
Dore_Rd_Turn_3h_3Nov16.csv
Wetland Plant Health Requirements Check - Dore Road Wetland10 Year NWN data 1984 - 1993
Extended Detention = 0.35 m
Shortest Allowable Average Plant Heights in Wetland 1 = 1.0 m Shallow Marsh1.5 m Deep Marsh
Plants to be excluded from plant list for shallow marsh and/or deep marshNote: Common Spike Rush not to be specified in plant list in shallow marsh zones
Water Ribbons not to be specified in plant list for W1 in deep marsh zone
Wetland specifications
Max Permanent Pool Depth
Shallow Marsh 0.15 1.0 0.50 0.35Deep Marsh 0.35 1.5 0.75 0.40
CHECK 1: Regular inundation check Water level 80% of the time (or more) < 50% Critical Plant Height (CHECK 1)
W1 Inundation Frequency Analysis Water level (relative to NWL) expected 80% of the time or more =Note: 3 Hour Data used, Hence Slightly diffenrt results from MUSIC Auditor which uses daily 165.0 mm
Percentile WL Relative to NWL - (mm)0.5% -1831.0% -140 Water level (relative to NWL) expected 80% of the time or more < CHECK (1) Shallow Marsh?5.0% -43 YES
15.0% -8 Check1 met20.0% -250.0% 3770.0% 11280.0% 165 Water level (relative to NWL) expected 80% of the time or more < CHECK (1) Deep Marsh?97.0% 340 YES99.5% 398 Check1 met
Average Height of Plant in wetland plant list given any exclusions
50% Average Plant Height
(Average plant height/2)-PP
Critical Plant Depth = Plant Height relative to NWL (m)
Check 1 - Critical Plant Height
Relative to NWL
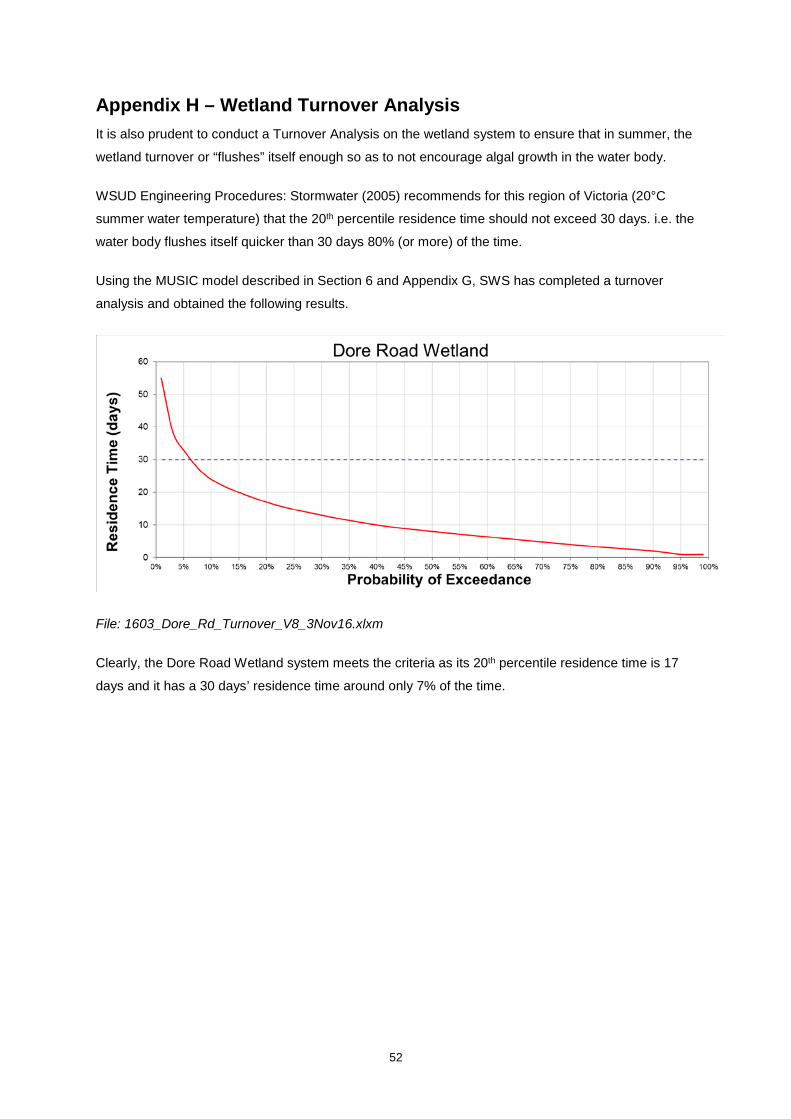
52
Appendix H – Wetland Turnover Analysis It is also prudent to conduct a Turnover Analysis on the wetland system to ensure that in summer, the
wetland turnover or “flushes” itself enough so as to not encourage algal growth in the water body.
WSUD Engineering Procedures: Stormwater (2005) recommends for this region of Victoria (20°C
summer water temperature) that the 20th percentile residence time should not exceed 30 days. i.e. the
water body flushes itself quicker than 30 days 80% (or more) of the time.
Using the MUSIC model described in Section 6 and Appendix G, SWS has completed a turnover
analysis and obtained the following results.
File: 1603_Dore_Rd_Turnover_V8_3Nov16.xlxm
Clearly, the Dore Road Wetland system meets the criteria as its 20th percentile residence time is 17
days and it has a 30 days’ residence time around only 7% of the time.

53
Appendix I – Liner and Topsoil The soil profile in the area is expected to be clayey in nature. The development of wetlands proposed
in the adjacent Cardinia Industrial DSS were formulated given a previous in-depth hydro geological
study performed by Sinclair Knight Merz “Cardinia Road Precinct Development, Installation of Shallow
Groundwater Bores, Final Report, 20 August 2008”.
One of the primary conclusions of the 2008 study was that the insitu clayey soil is ideal for formation
of wetland systems as the interaction between groundwater and surface water is extremely slow. As
such the surface water systems (i.e. wetlands) can essentially be considered separate from the
groundwater systems. SKM concluded that the NWL’s etc. proposed in the Cardinia Industrial DSS
can be achieved and should not adversely affect surface water/groundwater interaction in the area.
Given this finding clay lining was not required as part of the concept design proposals for the Cardinia
Industrial DSS systems.
As such, it is assumed at this stage that clay lining will not be required for the Dore Road DSS
wetland. Compaction of the existing clayey soil and placement of topsoil as required should be
specified at the detailed design stage of the project. Also, the detailed design stage of the project
should include compressive soil tests of the subject site to confirm the above assumption.
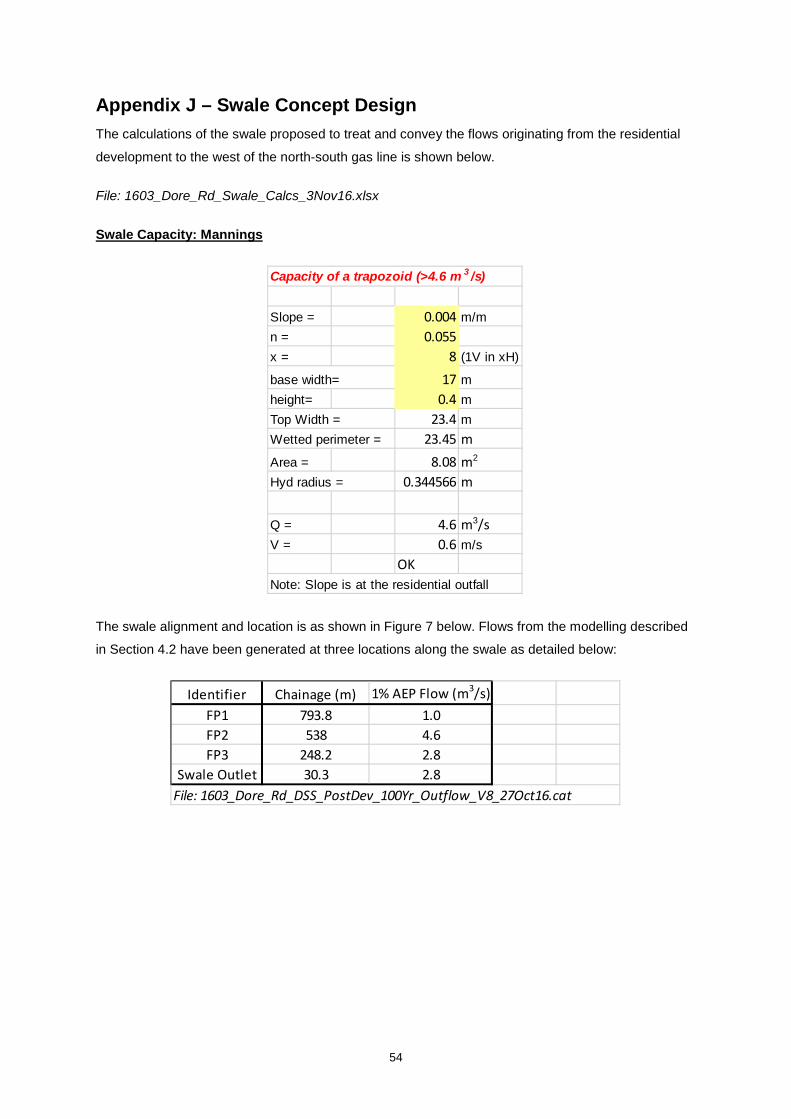
54
Appendix J – Swale Concept Design The calculations of the swale proposed to treat and convey the flows originating from the residential
development to the west of the north-south gas line is shown below.
File: 1603_Dore_Rd_Swale_Calcs_3Nov16.xlsx
Swale Capacity: Mannings
The swale alignment and location is as shown in Figure 7 below. Flows from the modelling described
in Section 4.2 have been generated at three locations along the swale as detailed below:
Capacity of a trapozoid (>4.6 m 3 /s)
Slope = 0.004 m/mn = 0.055x = 8 (1V in xH)
base width= 17 mheight= 0.4 mTop Width = 23.4 mWetted perimeter = 23.45 mArea = 8.08 m2
Hyd radius = 0.344566 m
Q = 4.6 m3/sV = 0.6 m/s
OKNote: Slope is at the residential outfall
Identifier Chainage (m) 1% AEP Flow (m3/s)FP1 793.8 1.0FP2 538 4.6FP3 248.2 2.8
Swale Outlet 30.3 2.8File: 1603_Dore_Rd_DSS_PostDev_100Yr_Outflow_V8_27Oct16.cat
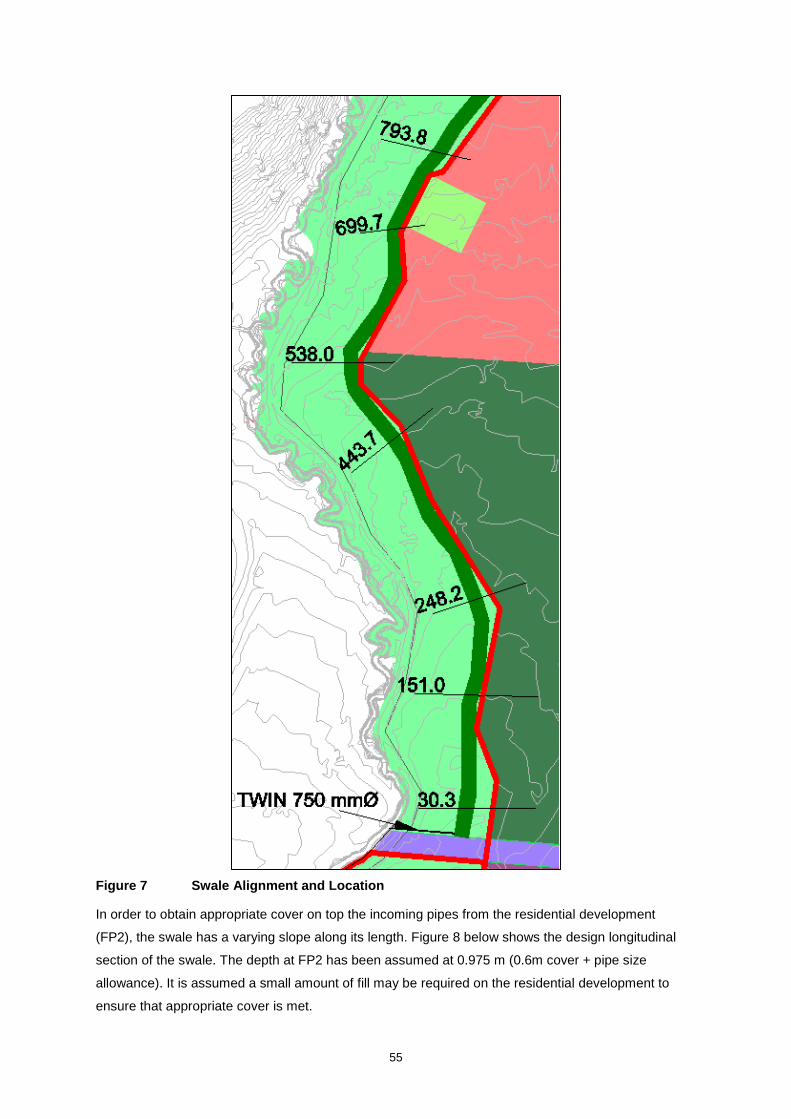
55
Figure 7 Swale Alignment and Location
In order to obtain appropriate cover on top the incoming pipes from the residential development
(FP2), the swale has a varying slope along its length. Figure 8 below shows the design longitudinal
section of the swale. The depth at FP2 has been assumed at 0.975 m (0.6m cover + pipe size
allowance). It is assumed a small amount of fill may be required on the residential development to
ensure that appropriate cover is met.
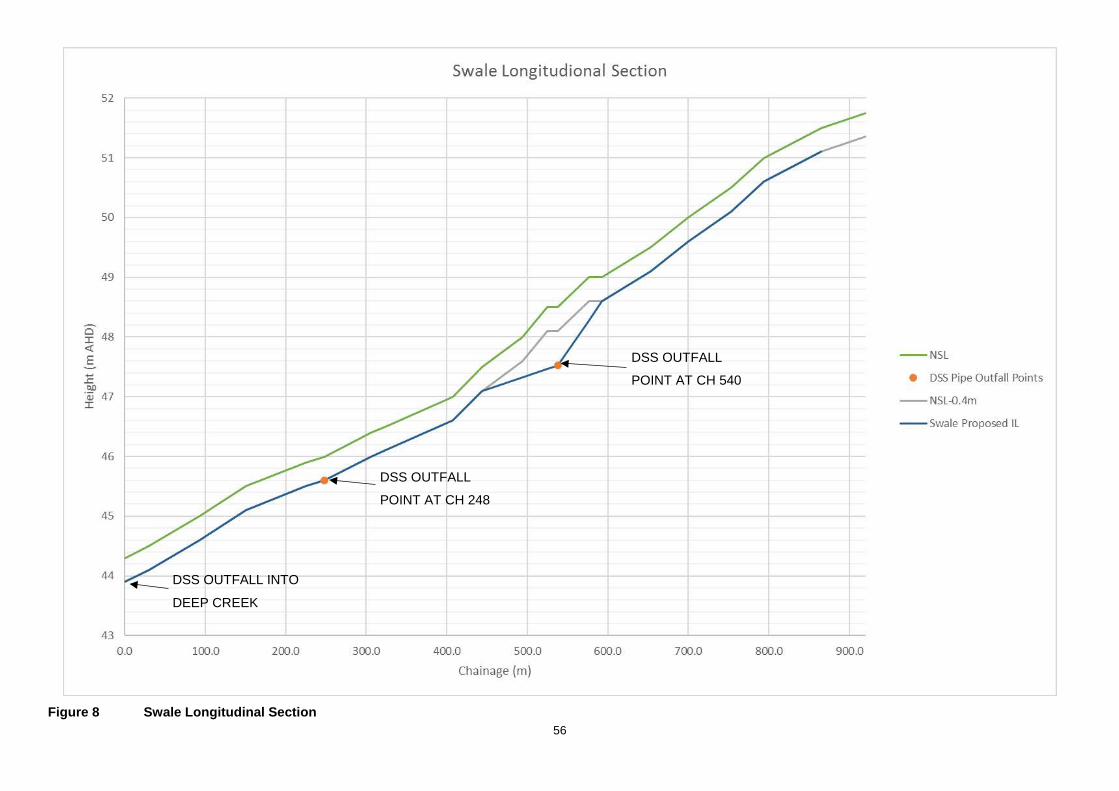
56
Figure 8 Swale Longitudinal Section
DSS OUTFALL
POINT AT CH 540
DSS OUTFALL
POINT AT CH 248
DSS OUTFALL INTO
DEEP CREEK
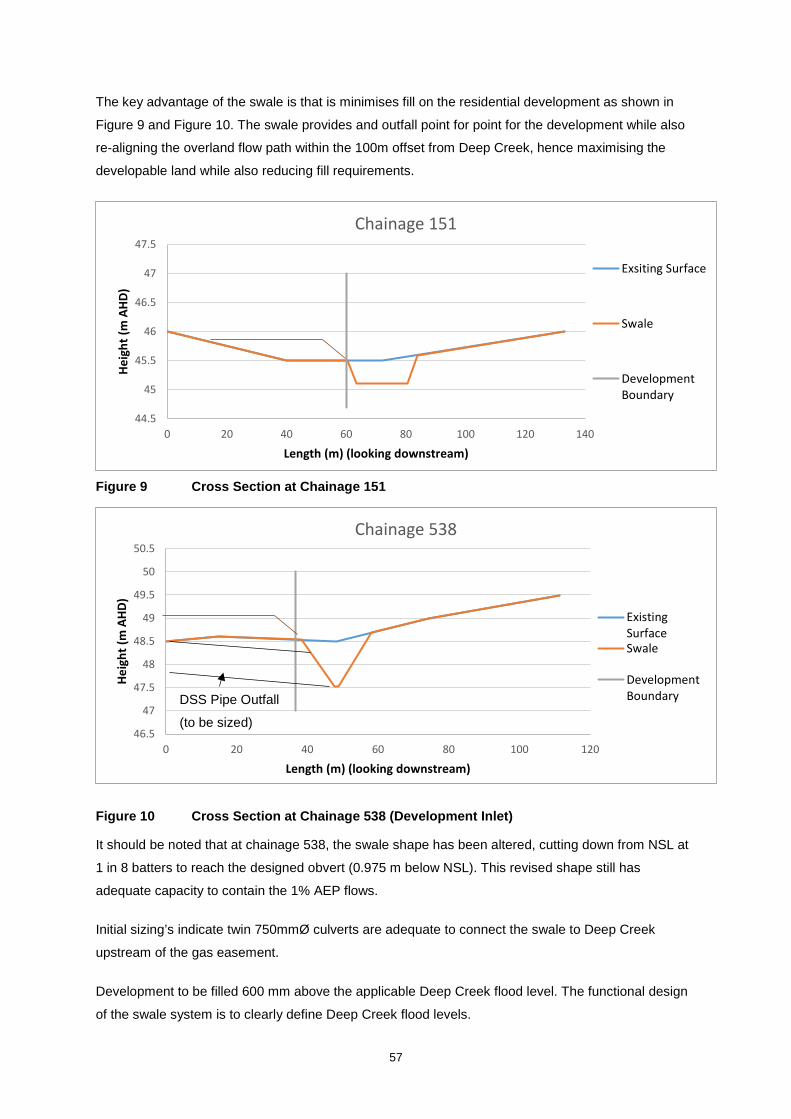
57
The key advantage of the swale is that is minimises fill on the residential development as shown in
Figure 9 and Figure 10. The swale provides and outfall point for point for the development while also
re-aligning the overland flow path within the 100m offset from Deep Creek, hence maximising the
developable land while also reducing fill requirements.
Figure 9 Cross Section at Chainage 151
Figure 10 Cross Section at Chainage 538 (Development Inlet)
It should be noted that at chainage 538, the swale shape has been altered, cutting down from NSL at
1 in 8 batters to reach the designed obvert (0.975 m below NSL). This revised shape still has
adequate capacity to contain the 1% AEP flows.
Initial sizing’s indicate twin 750mmØ culverts are adequate to connect the swale to Deep Creek
upstream of the gas easement.
Development to be filled 600 mm above the applicable Deep Creek flood level. The functional design
of the swale system is to clearly define Deep Creek flood levels.
44.5
45
45.5
46
46.5
47
47.5
0 20 40 60 80 100 120 140
Heig
ht (m
AHD
)
Length (m) (looking downstream)
Chainage 151
Exsiting Surface
Swale
DevelopmentBoundary
46.5
47
47.5
48
48.5
49
49.5
50
50.5
0 20 40 60 80 100 120
Heig
ht (m
AHD
)
Length (m) (looking downstream)
Chainage 538
ExistingSurfaceSwale
DevelopmentBoundaryDSS Pipe Outfall
(to be sized)
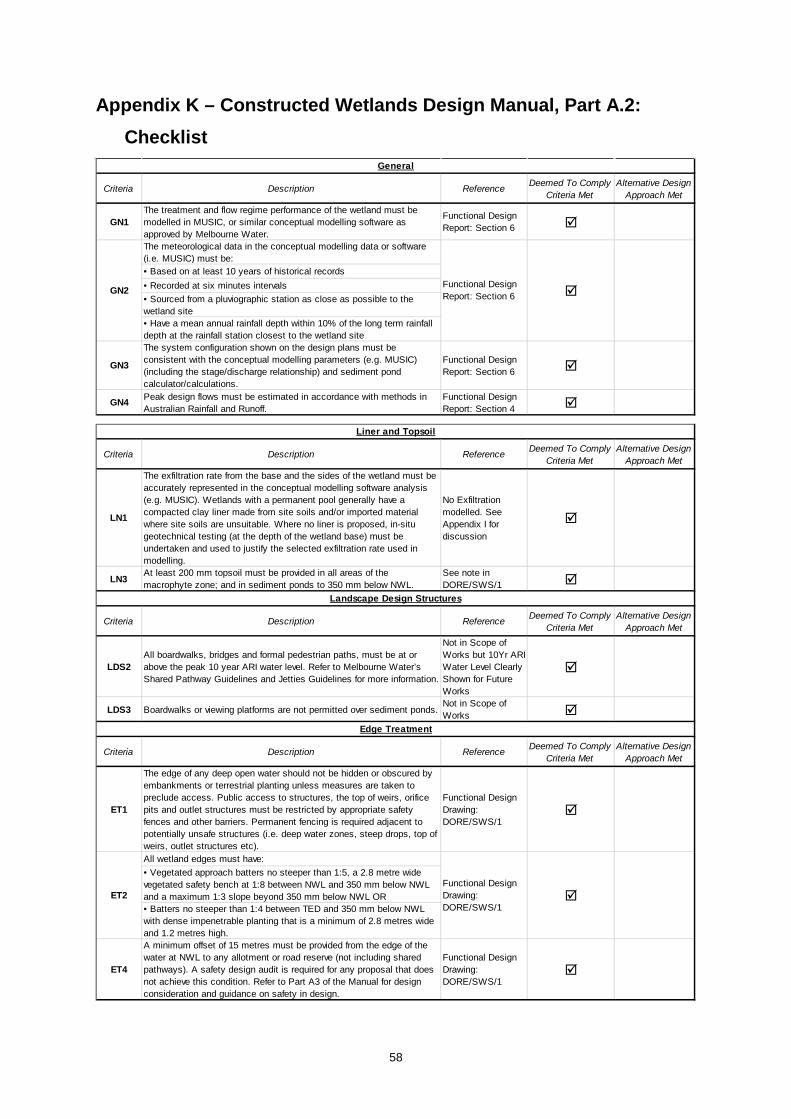
58
Appendix K – Constructed Wetlands Design Manual, Part A.2: Checklist
Criteria Description Reference Deemed To Comply Criteria Met
Alternative Design Approach Met
GN1The treatment and flow regime performance of the wetland must be modelled in MUSIC, or similar conceptual modelling software as approved by Melbourne Water.
Functional Design Report: Section 6
The meteorological data in the conceptual modelling data or software (i.e. MUSIC) must be: • Based on at least 10 years of historical records • Recorded at six minutes intervals • Sourced from a pluviographic station as close as possible to the wetland site • Have a mean annual rainfall depth within 10% of the long term rainfall depth at the rainfall station closest to the wetland site
GN3
The system configuration shown on the design plans must be consistent with the conceptual modelling parameters (e.g. MUSIC) (including the stage/discharge relationship) and sediment pond calculator/calculations.
Functional Design Report: Section 6
GN4 Peak design flows must be estimated in accordance with methods in Australian Rainfall and Runoff.
Functional Design Report: Section 4
General
GN2 Functional Design Report: Section 6
Criteria Description Reference Deemed To Comply Criteria Met
Alternative Design Approach Met
LN1
The exfiltration rate from the base and the sides of the wetland must be accurately represented in the conceptual modelling software analysis (e.g. MUSIC). Wetlands with a permanent pool generally have a compacted clay liner made from site soils and/or imported material where site soils are unsuitable. Where no liner is proposed, in-situ geotechnical testing (at the depth of the wetland base) must be undertaken and used to justify the selected exfiltration rate used in modelling.
No Exfiltration modelled. See Appendix I for discussion
LN3 At least 200 mm topsoil must be provided in all areas of the macrophyte zone; and in sediment ponds to 350 mm below NWL.
See note in DORE/SWS/1
Criteria Description Reference Deemed To Comply Criteria Met
Alternative Design Approach Met
LDS2 All boardwalks, bridges and formal pedestrian paths, must be at or above the peak 10 year ARI water level. Refer to Melbourne Water’s Shared Pathway Guidelines and Jetties Guidelines for more information.
Not in Scope of Works but 10Yr ARI Water Level Clearly Shown for Future Works
LDS3 Boardwalks or viewing platforms are not permitted over sediment ponds. Not in Scope of Works
Criteria Description Reference Deemed To Comply Criteria Met
Alternative Design Approach Met
ET1
The edge of any deep open water should not be hidden or obscured by embankments or terrestrial planting unless measures are taken to preclude access. Public access to structures, the top of weirs, orifice pits and outlet structures must be restricted by appropriate safety fences and other barriers. Permanent fencing is required adjacent to potentially unsafe structures (i.e. deep water zones, steep drops, top of weirs, outlet structures etc).
Functional Design Drawing: DORE/SWS/1
All wetland edges must have: • Vegetated approach batters no steeper than 1:5, a 2.8 metre wide vegetated safety bench at 1:8 between NWL and 350 mm below NWL and a maximum 1:3 slope beyond 350 mm below NWL OR • Batters no steeper than 1:4 between TED and 350 mm below NWL with dense impenetrable planting that is a minimum of 2.8 metres wide and 1.2 metres high.
ET4
A minimum offset of 15 metres must be provided from the edge of the water at NWL to any allotment or road reserve (not including shared pathways). A safety design audit is required for any proposal that does not achieve this condition. Refer to Part A3 of the Manual for design consideration and guidance on safety in design.
Functional Design Drawing: DORE/SWS/1
ET2 Functional Design Drawing: DORE/SWS/1
Landscape Design Structures
Edge Treatment
Liner and Topsoil
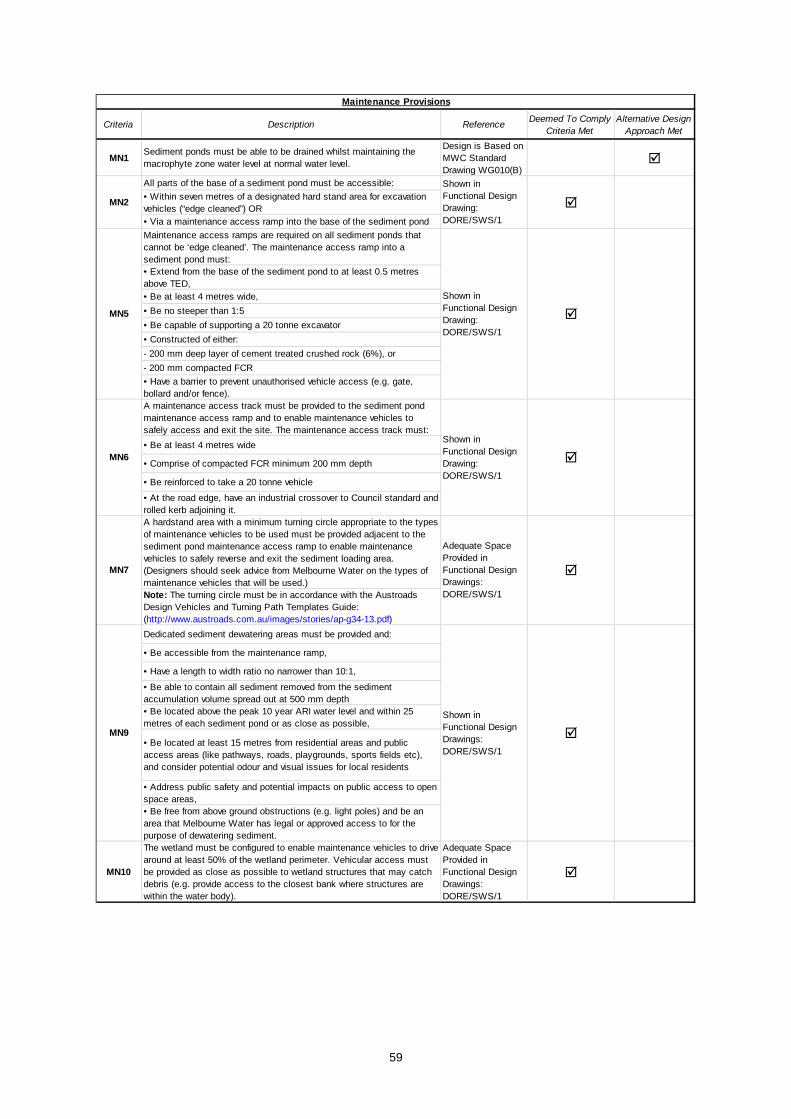
59
Criteria Description Reference Deemed To Comply Criteria Met
Alternative Design Approach Met
MN1 Sediment ponds must be able to be drained whilst maintaining the macrophyte zone water level at normal water level.
Design is Based on MWC Standard Drawing WG010(B)
All parts of the base of a sediment pond must be accessible: • Within seven metres of a designated hard stand area for excavation vehicles (“edge cleaned”) OR • Via a maintenance access ramp into the base of the sediment pond Maintenance access ramps are required on all sediment ponds that cannot be ‘edge cleaned’. The maintenance access ramp into a sediment pond must: • Extend from the base of the sediment pond to at least 0.5 metres above TED, • Be at least 4 metres wide, • Be no steeper than 1:5 • Be capable of supporting a 20 tonne excavator • Constructed of either: - 200 mm deep layer of cement treated crushed rock (6%), or - 200 mm compacted FCR • Have a barrier to prevent unauthorised vehicle access (e.g. gate, bollard and/or fence). A maintenance access track must be provided to the sediment pond maintenance access ramp and to enable maintenance vehicles to safely access and exit the site. The maintenance access track must: • Be at least 4 metres wide
• Comprise of compacted FCR minimum 200 mm depth
• Be reinforced to take a 20 tonne vehicle • At the road edge, have an industrial crossover to Council standard and rolled kerb adjoining it. A hardstand area with a minimum turning circle appropriate to the types of maintenance vehicles to be used must be provided adjacent to the sediment pond maintenance access ramp to enable maintenance vehicles to safely reverse and exit the sediment loading area. (Designers should seek advice from Melbourne Water on the types of maintenance vehicles that will be used.) Note: The turning circle must be in accordance with the Austroads Design Vehicles and Turning Path Templates Guide: (http://www.austroads.com.au/images/stories/ap-g34-13.pdf) Dedicated sediment dewatering areas must be provided and:
• Be accessible from the maintenance ramp,
• Have a length to width ratio no narrower than 10:1, • Be able to contain all sediment removed from the sediment accumulation volume spread out at 500 mm depth • Be located above the peak 10 year ARI water level and within 25 metres of each sediment pond or as close as possible,
• Be located at least 15 metres from residential areas and public access areas (like pathways, roads, playgrounds, sports fields etc), and consider potential odour and visual issues for local residents
• Address public safety and potential impacts on public access to open space areas, • Be free from above ground obstructions (e.g. light poles) and be an area that Melbourne Water has legal or approved access to for the purpose of dewatering sediment.
MN10
The wetland must be configured to enable maintenance vehicles to drive around at least 50% of the wetland perimeter. Vehicular access must be provided as close as possible to wetland structures that may catch debris (e.g. provide access to the closest bank where structures are within the water body).
Adequate Space Provided in Functional Design Drawings: DORE/SWS/1
MN5
Shown in Functional Design Drawing: DORE/SWS/1
MN6
Shown in Functional Design Drawing: DORE/SWS/1
MN7
Adequate Space Provided in Functional Design Drawings: DORE/SWS/1
MN9
Shown in Functional Design Drawings: DORE/SWS/1
MN2
Shown in Functional Design Drawing: DORE/SWS/1
Maintenance Provisions
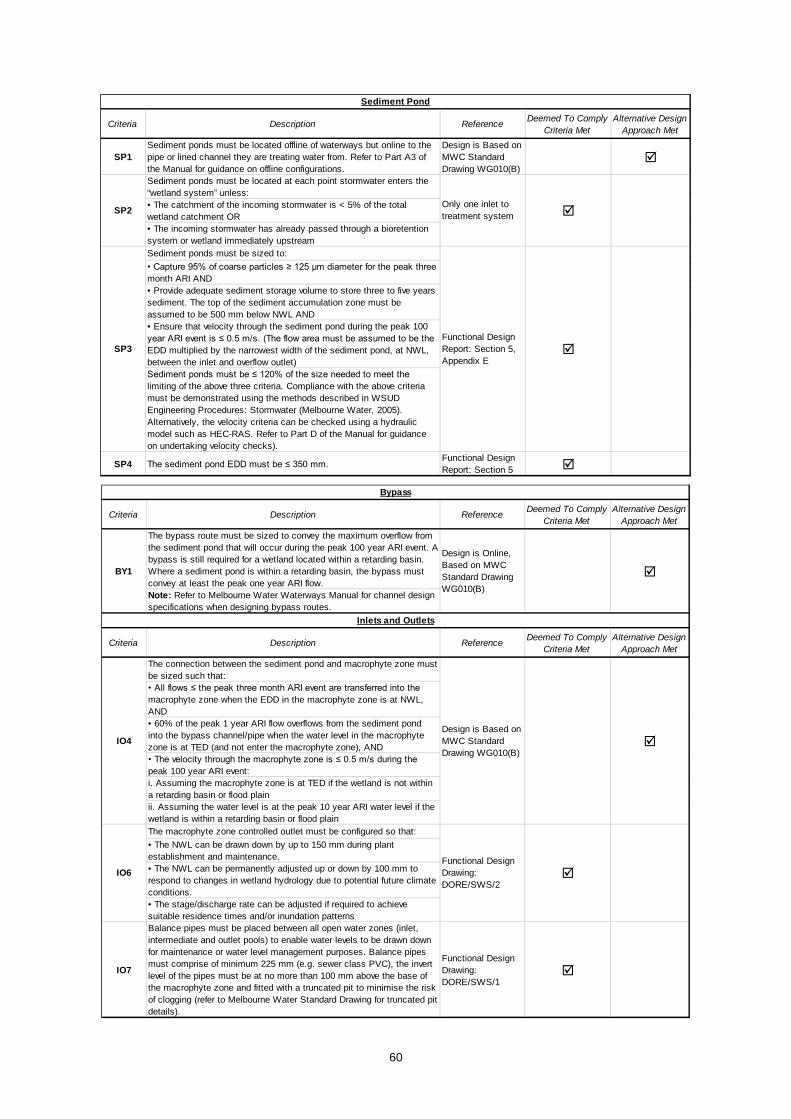
60
Criteria Description Reference Deemed To Comply Criteria Met
Alternative Design Approach Met
SP1 Sediment ponds must be located offline of waterways but online to the pipe or lined channel they are treating water from. Refer to Part A3 of the Manual for guidance on offline configurations.
Design is Based on MWC Standard Drawing WG010(B)
Sediment ponds must be located at each point stormwater enters the “wetland system” unless: • The catchment of the incoming stormwater is < 5% of the total wetland catchment OR • The incoming stormwater has already passed through a bioretention system or wetland immediately upstream Sediment ponds must be sized to: • Capture 95% of coarse particles ≥ 125 μm diameter for the peak three month ARI AND • Provide adequate sediment storage volume to store three to five years sediment. The top of the sediment accumulation zone must be assumed to be 500 mm below NWL AND • Ensure that velocity through the sediment pond during the peak 100 year ARI event is ≤ 0.5 m/s. (The flow area must be assumed to be the EDD multiplied by the narrowest width of the sediment pond, at NWL, between the inlet and overflow outlet) Sediment ponds must be ≤ 120% of the size needed to meet the limiting of the above three criteria. Compliance with the above criteria must be demonstrated using the methods described in WSUD Engineering Procedures: Stormwater (Melbourne Water, 2005). Alternatively, the velocity criteria can be checked using a hydraulic model such as HEC-RAS. Refer to Part D of the Manual for guidance on undertaking velocity checks).
SP4 The sediment pond EDD must be ≤ 350 mm. Functional Design Report: Section 5
SP3 Functional Design Report: Section 5, Appendix E
SP2 Only one inlet to treatment system
Sediment Pond
Criteria Description Reference Deemed To Comply Criteria Met
Alternative Design Approach Met
The bypass route must be sized to convey the maximum overflow from the sediment pond that will occur during the peak 100 year ARI event. A bypass is still required for a wetland located within a retarding basin. Where a sediment pond is within a retarding basin, the bypass must convey at least the peak one year ARI flow. Note: Refer to Melbourne Water Waterways Manual for channel design specifications when designing bypass routes.
Criteria Description Reference Deemed To Comply Criteria Met
Alternative Design Approach Met
The connection between the sediment pond and macrophyte zone must be sized such that: • All flows ≤ the peak three month ARI event are transferred into the macrophyte zone when the EDD in the macrophyte zone is at NWL, AND • 60% of the peak 1 year ARI flow overflows from the sediment pond into the bypass channel/pipe when the water level in the macrophyte zone is at TED (and not enter the macrophyte zone), AND • The velocity through the macrophyte zone is ≤ 0.5 m/s during the peak 100 year ARI event: i. Assuming the macrophyte zone is at TED if the wetland is not within a retarding basin or flood plain ii. Assuming the water level is at the peak 10 year ARI water level if the wetland is within a retarding basin or flood plain The macrophyte zone controlled outlet must be configured so that: • The NWL can be drawn down by up to 150 mm during plant establishment and maintenance. • The NWL can be permanently adjusted up or down by 100 mm to respond to changes in wetland hydrology due to potential future climate conditions. • The stage/discharge rate can be adjusted if required to achieve suitable residence times and/or inundation patterns
IO7
Balance pipes must be placed between all open water zones (inlet, intermediate and outlet pools) to enable water levels to be drawn down for maintenance or water level management purposes. Balance pipes must comprise of minimum 225 mm (e.g. sewer class PVC), the invert level of the pipes must be at no more than 100 mm above the base of the macrophyte zone and fitted with a truncated pit to minimise the risk of clogging (refer to Melbourne Water Standard Drawing for truncated pit details).
Functional Design Drawing: DORE/SWS/1
IO4 Design is Based on MWC Standard Drawing WG010(B)
IO6 Functional Design Drawing: DORE/SWS/2
Inlets and Outlets
BY1
Design is Online, Based on MWC Standard Drawing WG010(B)
Bypass

61
Criteria Description Reference Deemed To Comply Criteria Met
Alternative Design Approach Met
MZ1
At least 80% of the area of the macrophyte zone at NWL must be ≤ 350 mm deep to support shallow and deep marsh vegetation. The wetland bathymetry should provide approximately equal amounts of shallow marsh (≤ 150 mm deep) and deep marsh (150 mm to 350 mm deep).
Functional Design Report: Section 3, Functional Design Drawings: DORE/SWS/1
MZ2 The macrophyte zone EDD must be ≤ 350 mm. Functional Design Report: Section 3
MZ3 Macrophyte zones must be located offline from all waterways and drains (i.e. there must be a bypass route around the macrophyte zone).
Functional Design Drawing: DORE/SWS/1
MZ4 The length of the macrophyte zone must be ≥ four times the average width of the macrophyte zone.
Functional Design Drawing: DORE/SWS/1
MZ5 Major inlets to the macrophyte zone (i.e. those draining > 10% of the catchment to be treated) must be located within the first 20% of the macrophyte zone.
Functional Design Drawing: DORE/SWS/1
MZ6 The macrophyte zone outlet must be located at the opposite end of the macrophyte zone to the inlet(s).
Functional Design Drawing: DORE/SWS/1
MZ7 The macrophyte zone must have a sequence and mix of submerged, shallow and deep marsh zones arranged in a banded manner perpendicular to the direction of flow.
Functional Design Drawing: DORE/SWS/1
MZ8 Inlet and outlet pools must be ≤ 1.5 m depth.
Functional Design Report: Section 3, Functional Design Drawings: DORE/SWS/1
MZ9 Intermediate pools (between the inlet and outlet pool) must be ≤ 1.2 m deep.
Functional Design Report: Section 3, Functional Design Drawings: DORE/SWS/1
Velocities in the macrophyte zone must be: • less than 0.5 m/s for the peak 100 year ARI flow • less than 0.05 m/s for the peak three month ARI Compliance with the above criteria must be demonstrated using the methods described in WSUD Engineering Procedures: Stormwater (Melbourne Water, 2005) or using a hydraulic model such as HEC-RAS or TUFLOW. Refer to Part D of the Manual for guidance on undertaking velocity checks.
MZ11
The macrophyte zone must provide a 90th percentile residence time of 72 hours (assuming plug flow between inlet and outlet through the EDD and 50% of the permanent pool volume). Refer to the Melbourne Water online tool and Part D of the Manual for guidance on determining residence time.
Functional Design Report: Appendix G
MZ12
A minimum grade of 1:150 must be provided between marsh zones (longitudinally through the macrophyte zone) to enable the wetland to freely drain. Intermediate pools will generally be needed to transition between marsh zones.
Functional Design Drawing: DORE/SWS/1
MZ10 Appendix F shows calculations
Macrophyte Zone
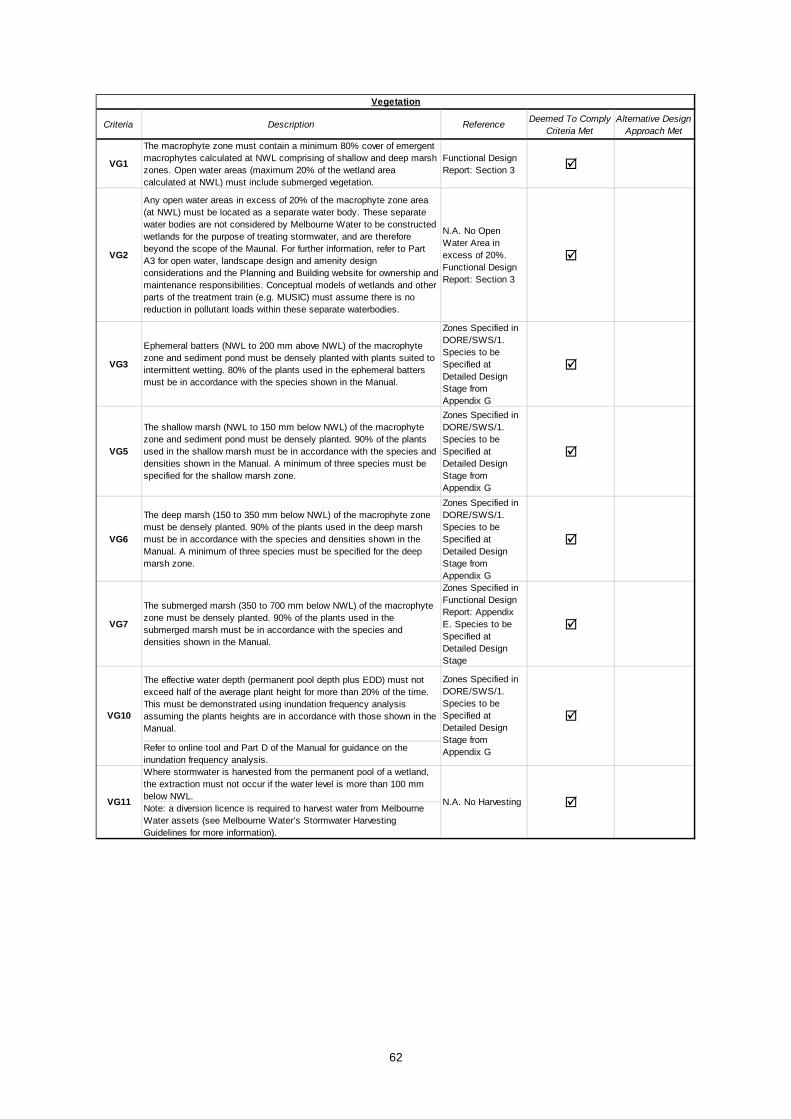
62
Criteria Description Reference Deemed To Comply Criteria Met
Alternative Design Approach Met
VG1
The macrophyte zone must contain a minimum 80% cover of emergent macrophytes calculated at NWL comprising of shallow and deep marsh zones. Open water areas (maximum 20% of the wetland area calculated at NWL) must include submerged vegetation.
Functional Design Report: Section 3
VG2
Any open water areas in excess of 20% of the macrophyte zone area (at NWL) must be located as a separate water body. These separate water bodies are not considered by Melbourne Water to be constructed wetlands for the purpose of treating stormwater, and are therefore beyond the scope of the Maunal. For further information, refer to Part A3 for open water, landscape design and amenity design considerations and the Planning and Building website for ownership and maintenance responsibilities. Conceptual models of wetlands and other parts of the treatment train (e.g. MUSIC) must assume there is no reduction in pollutant loads within these separate waterbodies.
N.A. No Open Water Area in excess of 20%. Functional Design Report: Section 3
VG3
Ephemeral batters (NWL to 200 mm above NWL) of the macrophyte zone and sediment pond must be densely planted with plants suited to intermittent wetting. 80% of the plants used in the ephemeral batters must be in accordance with the species shown in the Manual.
Zones Specified in DORE/SWS/1. Species to be Specified at Detailed Design Stage from Appendix G
VG5
The shallow marsh (NWL to 150 mm below NWL) of the macrophyte zone and sediment pond must be densely planted. 90% of the plants used in the shallow marsh must be in accordance with the species and densities shown in the Manual. A minimum of three species must be specified for the shallow marsh zone.
Zones Specified in DORE/SWS/1. Species to be Specified at Detailed Design Stage from Appendix G
VG6
The deep marsh (150 to 350 mm below NWL) of the macrophyte zone must be densely planted. 90% of the plants used in the deep marsh must be in accordance with the species and densities shown in the Manual. A minimum of three species must be specified for the deep marsh zone.
Zones Specified in DORE/SWS/1. Species to be Specified at Detailed Design Stage from Appendix G
VG7
The submerged marsh (350 to 700 mm below NWL) of the macrophyte zone must be densely planted. 90% of the plants used in the submerged marsh must be in accordance with the species and densities shown in the Manual.
Zones Specified in Functional Design Report: Appendix E. Species to be Specified at Detailed Design Stage
The effective water depth (permanent pool depth plus EDD) must not exceed half of the average plant height for more than 20% of the time. This must be demonstrated using inundation frequency analysis assuming the plants heights are in accordance with those shown in the Manual.
Refer to online tool and Part D of the Manual for guidance on the inundation frequency analysis. Where stormwater is harvested from the permanent pool of a wetland, the extraction must not occur if the water level is more than 100 mm below NWL. Note: a diversion licence is required to harvest water from Melbourne Water assets (see Melbourne Water’s Stormwater Harvesting Guidelines for more information).
VG10
Zones Specified in DORE/SWS/1. Species to be Specified at Detailed Design Stage from Appendix G
VG11 N.A. No Harvesting
Vegetation
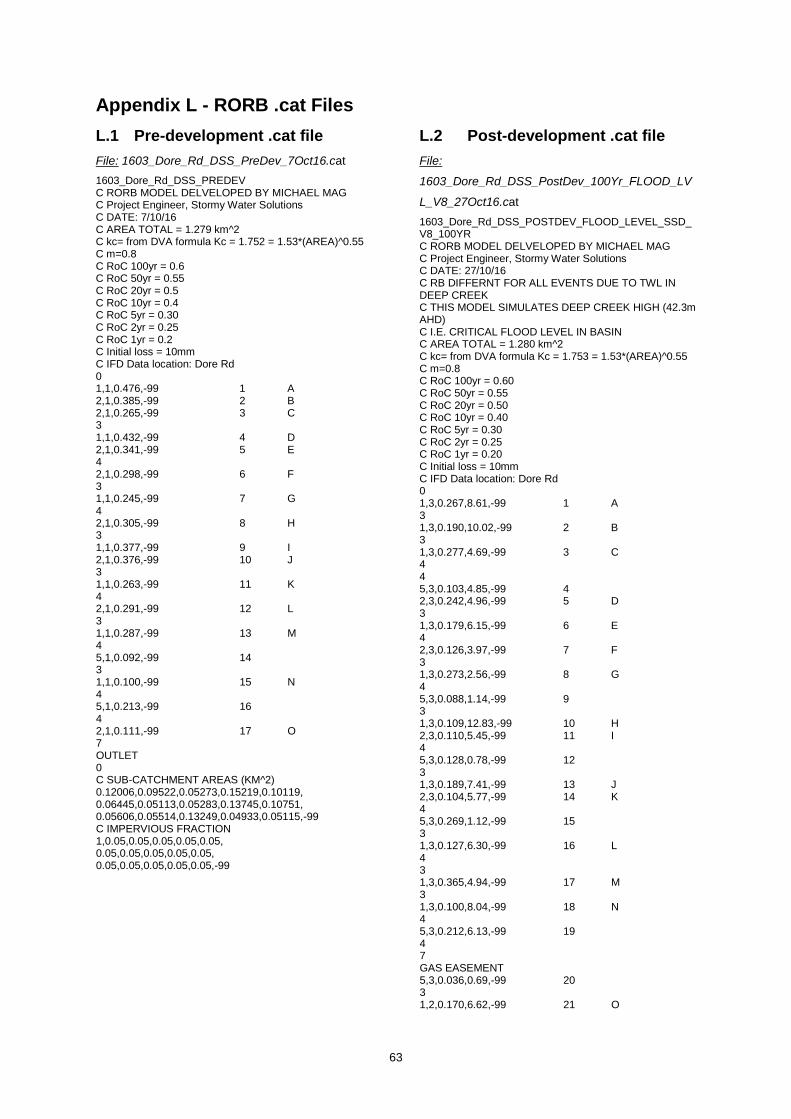
63
Appendix L - RORB .cat Files L.1 Pre-development .cat file File: 1603_Dore_Rd_DSS_PreDev_7Oct16.cat 1603_Dore_Rd_DSS_PREDEV C RORB MODEL DELVELOPED BY MICHAEL MAG C Project Engineer, Stormy Water Solutions C DATE: 7/10/16 C AREA TOTAL = 1.279 km^2 C kc= from DVA formula Kc = 1.752 = 1.53*(AREA)^0.55 C m=0.8 C RoC 100yr = 0.6 C RoC 50yr = 0.55 C RoC 20yr = 0.5 C RoC 10yr = 0.4 C RoC 5yr = 0.30 C RoC 2yr = 0.25 C RoC 1yr = 0.2 C Initial loss = 10mm C IFD Data location: Dore Rd 0 1,1,0.476,-99 1 A 2,1,0.385,-99 2 B 2,1,0.265,-99 3 C 3 1,1,0.432,-99 4 D 2,1,0.341,-99 5 E 4 2,1,0.298,-99 6 F 3 1,1,0.245,-99 7 G 4 2,1,0.305,-99 8 H 3 1,1,0.377,-99 9 I 2,1,0.376,-99 10 J 3 1,1,0.263,-99 11 K 4 2,1,0.291,-99 12 L 3 1,1,0.287,-99 13 M 4 5,1,0.092,-99 14 3 1,1,0.100,-99 15 N 4 5,1,0.213,-99 16 4 2,1,0.111,-99 17 O 7 OUTLET 0 C SUB-CATCHMENT AREAS (KM^2) 0.12006,0.09522,0.05273,0.15219,0.10119, 0.06445,0.05113,0.05283,0.13745,0.10751, 0.05606,0.05514,0.13249,0.04933,0.05115,-99 C IMPERVIOUS FRACTION 1,0.05,0.05,0.05,0.05,0.05, 0.05,0.05,0.05,0.05,0.05, 0.05,0.05,0.05,0.05,0.05,-99
L.2 Post-development .cat file
File:
1603_Dore_Rd_DSS_PostDev_100Yr_FLOOD_LV
L_V8_27Oct16.cat 1603_Dore_Rd_DSS_POSTDEV_FLOOD_LEVEL_SSD_V8_100YR C RORB MODEL DELVELOPED BY MICHAEL MAG C Project Engineer, Stormy Water Solutions C DATE: 27/10/16 C RB DIFFERNT FOR ALL EVENTS DUE TO TWL IN DEEP CREEK C THIS MODEL SIMULATES DEEP CREEK HIGH (42.3m AHD) C I.E. CRITICAL FLOOD LEVEL IN BASIN C AREA TOTAL = 1.280 km^2 C kc= from DVA formula Kc = 1.753 = 1.53*(AREA)^0.55 C m=0.8 C RoC 100yr = 0.60 C RoC 50yr = 0.55 C RoC 20yr = 0.50 C RoC 10yr = 0.40 C RoC 5yr = 0.30 C RoC 2yr = 0.25 C RoC 1yr = 0.20 C Initial loss = 10mm C IFD Data location: Dore Rd 0 1,3,0.267,8.61,-99 1 A 3 1,3,0.190,10.02,-99 2 B 3 1,3,0.277,4.69,-99 3 C 4 4 5,3,0.103,4.85,-99 4 2,3,0.242,4.96,-99 5 D 3 1,3,0.179,6.15,-99 6 E 4 2,3,0.126,3.97,-99 7 F 3 1,3,0.273,2.56,-99 8 G 4 5,3,0.088,1.14,-99 9 3 1,3,0.109,12.83,-99 10 H 2,3,0.110,5.45,-99 11 I 4 5,3,0.128,0.78,-99 12 3 1,3,0.189,7.41,-99 13 J 2,3,0.104,5.77,-99 14 K 4 5,3,0.269,1.12,-99 15 3 1,3,0.127,6.30,-99 16 L 4 3 1,3,0.365,4.94,-99 17 M 3 1,3,0.100,8.04,-99 18 N 4 5,3,0.212,6.13,-99 19 4 7 GAS EASEMENT 5,3,0.036,0.69,-99 20 3 1,2,0.170,6.62,-99 21 O
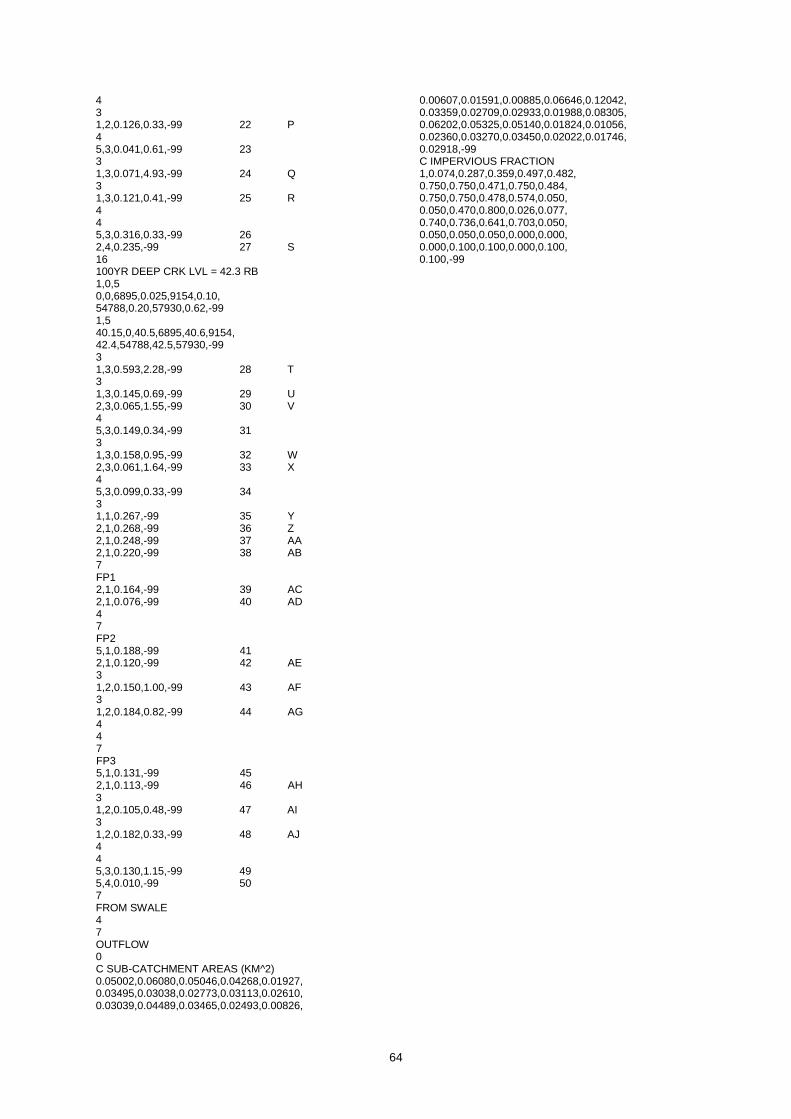
64
4 3 1,2,0.126,0.33,-99 22 P 4 5,3,0.041,0.61,-99 23 3 1,3,0.071,4.93,-99 24 Q 3 1,3,0.121,0.41,-99 25 R 4 4 5,3,0.316,0.33,-99 26 2,4,0.235,-99 27 S 16 100YR DEEP CRK LVL = 42.3 RB 1,0,5 0,0,6895,0.025,9154,0.10, 54788,0.20,57930,0.62,-99 1,5 40.15,0,40.5,6895,40.6,9154, 42.4,54788,42.5,57930,-99 3 1,3,0.593,2.28,-99 28 T 3 1,3,0.145,0.69,-99 29 U 2,3,0.065,1.55,-99 30 V 4 5,3,0.149,0.34,-99 31 3 1,3,0.158,0.95,-99 32 W 2,3,0.061,1.64,-99 33 X 4 5,3,0.099,0.33,-99 34 3 1,1,0.267,-99 35 Y 2,1,0.268,-99 36 Z 2,1,0.248,-99 37 AA 2,1,0.220,-99 38 AB 7 FP1 2,1,0.164,-99 39 AC 2,1,0.076,-99 40 AD 4 7 FP2 5,1,0.188,-99 41 2,1,0.120,-99 42 AE 3 1,2,0.150,1.00,-99 43 AF 3 1,2,0.184,0.82,-99 44 AG 4 4 7 FP3 5,1,0.131,-99 45 2,1,0.113,-99 46 AH 3 1,2,0.105,0.48,-99 47 AI 3 1,2,0.182,0.33,-99 48 AJ 4 4 5,3,0.130,1.15,-99 49 5,4,0.010,-99 50 7 FROM SWALE 4 7 OUTFLOW 0 C SUB-CATCHMENT AREAS (KM^2) 0.05002,0.06080,0.05046,0.04268,0.01927, 0.03495,0.03038,0.02773,0.03113,0.02610, 0.03039,0.04489,0.03465,0.02493,0.00826,
0.00607,0.01591,0.00885,0.06646,0.12042, 0.03359,0.02709,0.02933,0.01988,0.08305, 0.06202,0.05325,0.05140,0.01824,0.01056, 0.02360,0.03270,0.03450,0.02022,0.01746, 0.02918,-99 C IMPERVIOUS FRACTION 1,0.074,0.287,0.359,0.497,0.482, 0.750,0.750,0.471,0.750,0.484, 0.750,0.750,0.478,0.574,0.050, 0.050,0.470,0.800,0.026,0.077, 0.740,0.736,0.641,0.703,0.050, 0.050,0.050,0.050,0.000,0.000, 0.000,0.100,0.100,0.000,0.100, 0.100,-99