Domestic Tourism and SAA Pricing - Amazon Web...
19
Private and Confidential Domestic Tourism and SAA Pricing August 2012
Transcript of Domestic Tourism and SAA Pricing - Amazon Web...

Private and Confidential
Domestic Tourism and SAA Pricing
August 2012

YOUR LOGO Page 2
Domestic Market Share
5 years ago… Current…
Source SAA RCT report
SAA market share has reduced due to: • short-haul travel commoditisation; • stronger competition; and • low GDP growth restricting market growth .
YOUR LOGO
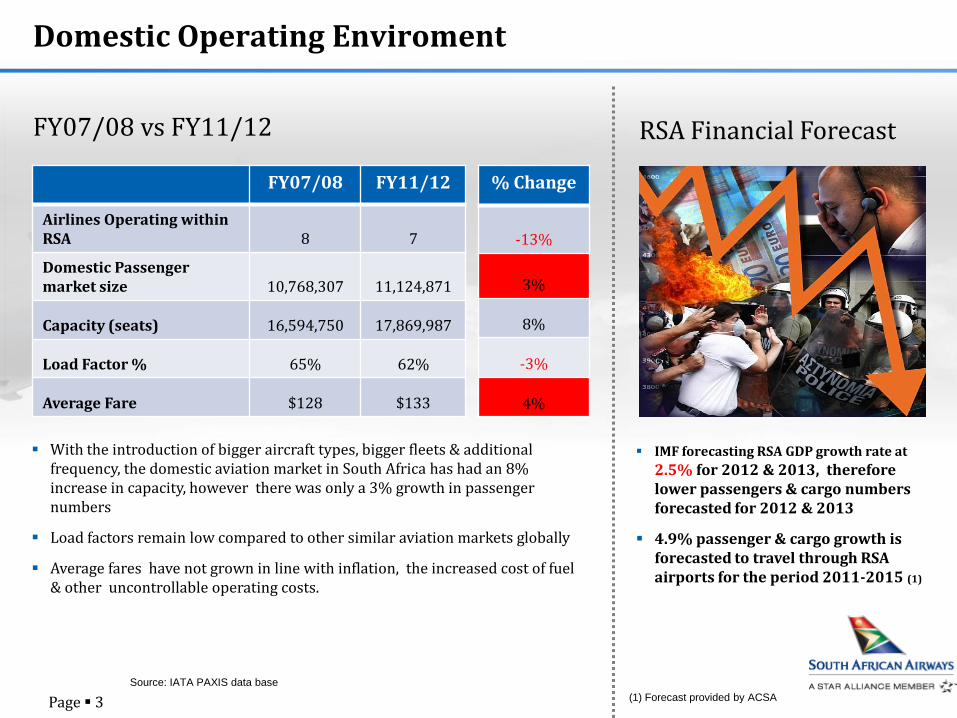
Domestic Operating Enviroment
FY07/08 vs FY11/12
FY07/08 FY11/12
Airlines Operating within RSA 8 7
Domestic Passenger market size 10,768,307 11,124,871
Capacity (seats) 16,594,750 17,869,987
Load Factor % 65% 62%
Average Fare $128 $133
% Change
-13%
3%
8%
-3%
4%
Source: IATA PAXIS data base
With the introduction of bigger aircraft types, bigger fleets & additional frequency, the domestic aviation market in South Africa has had an 8% increase in capacity, however there was only a 3% growth in passenger numbers
Load factors remain low compared to other similar aviation markets globally
Average fares have not grown in line with inflation, the increased cost of fuel & other uncontrollable operating costs.
RSA Financial Forecast
IMF forecasting RSA GDP growth rate at 2.5% for 2012 & 2013, therefore lower passengers & cargo numbers forecasted for 2012 & 2013
4.9% passenger & cargo growth is forecasted to travel through RSA airports for the period 2011-2015 (1)
(1) Forecast provided by ACSA Page 3

YOUR LOGO
Private and Confidential
SAA’s Domestic Passenger Profile
SAA’s passengers profile is divided amongst the following:
Corporate
Government
Leisure
VFR
International Connecting Passengers
SAA has the following distribution channels:
Online via flysaa.com
Direct Call Centre Payment through credit card or through Pick ‘n Pay stores (nationally)
City Town Offices in Johannesburg, Durban and Cape Town
Airport Offices: JNB, CPT, DUR, PLZ, ELS, BFN, KIM, PTG, MQP, GRJ, RCB
National Travel Agencies
National Tour operators
Page 4

YOUR LOGO
CLASS BASIC ONE WAY FARE
Y 1240
M 1080
K 920
H 760
Q 600
V 450
L 300
G 220
e.g.
Business Travelers Leisure Travelers
Currently 40%
Wants frequency
Books closer to departure time
Inflexible (wants specific time)
Currently 60%
Price sensitive, search all airlines for cheapest price
Books in advance
Flexible (Time)
Pricing Strategy is driven by passenger demand
Designs “fare products”
Sets fare levels
Page 5

YOUR LOGO
Private and Confidential
e.g. Johannesburg – Durban: Pricing
Page 6
On average, only 55% of the ticket price is income for SAA. 27% is used to recover fuel (in line with oil price fluctuations). The remainder is legislated taxes and fees

YOUR LOGO
SAA operates two airline brands: SAA; and Mango.
SAA Cargo supports the passenger business to promote trade.
SAA Technical and Air Chefs provide services to a range of international airlines.
SA Travel Centre sells SA destination travel products.
SAA is very clear on its mandate and strategic objectives as a State Owned Company, which include new route development, enabling tourism and creating employment in the economy.
Our Corporate Plan is targeting strong growth.
SAA is seeking to strengthen its tourism sectoral growth role and relationship with SA Tourism.
SAA Group
Premium airline Low cost airline Cargo airline/division
Aircraft engineering In-flight catering Retail travel franchises
SAA Already Plays a Strong Role in South African Tourism
All SAA businesses strongly support the tourism sector
Page 7

YOUR LOGO
SAA Already Plays a Strong Role in South African Tourism
SAA has a major catalytic demand¹ effect on the tourism sector
SAA’s activity has four distinct channels of effect
Direct impacts: activity and scale growth in the aviation sector, e.g. airport infrastructure development, airport retail.
Indirect impacts: acitivity supporting non-aviation tourism infrastructure development, e.g. car rental, hotels, ground transport, tours.
Induced impacts: activity (consumption and investment) generated by those directly/indirectly benefiting from aviation activity.
Consumer welfare impacts: general benefits to South Africans from increased tourism access.
¹ Catalytic demand models (e.g. International Civil Aviation Organisation, US Department of Transport and Oxford Economics) are a key part of any holistic analysis of the benefits of aviation activity. They also form a major element of SAA’s support for New Growth Path, beyond its direct employment and KPI’s agreed with DPE in the Shareholder’s Compact.
Page 8

YOUR LOGO
Current Challenges Facing the Aviation Sector in SA
Higher fuel costs with some volatility increases price of ticket
Fuel is approximately 1/3 of an airline’s operating costs
The Brent price moved above USD 115 per barrel.
Fuel is priced in USD, so airlines must manage commodity price and exchange rate risk.
Fuel price increases can only be partially recovered via passenger and cargo fuel levies.
Brent price Jan 2006 to July 2012. Source: World Bank
Page 9

YOUR LOGO
Current Challenges Facing the Aviation Sector in SA
High airport charges
South Africa’s airports are already high cost by global standards
In competitive developed market airport models, there is an element of negotiation with airlines (prior to construction) and there are alternative airports.
Airport charges increases: 129% from 2010 to 2015.
Airport charges are recovered by airlines through higher fares.
Page 10

YOUR LOGO
High Costs and high inflation
SAA prices to cover its ever-increasing costs
SAA direct operating costs have increased by 54%
Parking, Landing fees and Navigation fees up by 150%
Maintenance costs have increased considerably
Catering costs on the increase
With the economic downturn in 2008, the weaker economic outlook for South Africa & with the introduction of LCC‘s into the domestic market, has prevented SAA in obtaining higher passenger numbers
Page 11

YOUR LOGO
Private and Confidential
Domestic Statistics
SAA has increased number of seats by 3% in only four (4) months
SAA has the following number of flights per day:
Cape Town 36 flights per day
Durban 28 flights per day
Port Elizabeth 14 flights per day (incl. SA Express)
East London 12 flights per day (incl. SA Express)
Average passenger growth of 4% per annum over the last 3 years
Page 12

YOUR LOGO
Private and Confidential
Domestic Tactical Promotions
Page 13
However, SAA is competitive in the domestic market. Examples of marketing campaigns using the SAA newsletter

YOUR LOGO
Private and Confidential
Domestic Tactical Promotions
Page 14
Examples of marketing campaigns using the SAA newsletter
Fly from Johannesburg to Beijing from R7004* book now London from R7350* book now Mumbai from R4522* book now Hong Kong from R8458* book now Durban from R685** book now Dubai from R6734* book now (operated by our codeshare partner Emirates)
31649 seats available
Quote booking code: ws19jan12
Book now on www.flysaa.com or through the SAA Call Centre on 0861 606 606

YOUR LOGO
Private and Confidential
Domestic Tactical Promotions
Page 15
National newspaper marketing

YOUR LOGO
Private and Confidential
Domestic Tactical Promotions
Page 16
Selling Cape Town through our package division – SAA Holidays

YOUR LOGO
Private and Confidential
Domestic Tactical Promotions
Page 17
Selling Durban through our package division – SAA Holidays
YOUR LOGO
Private and Confidential
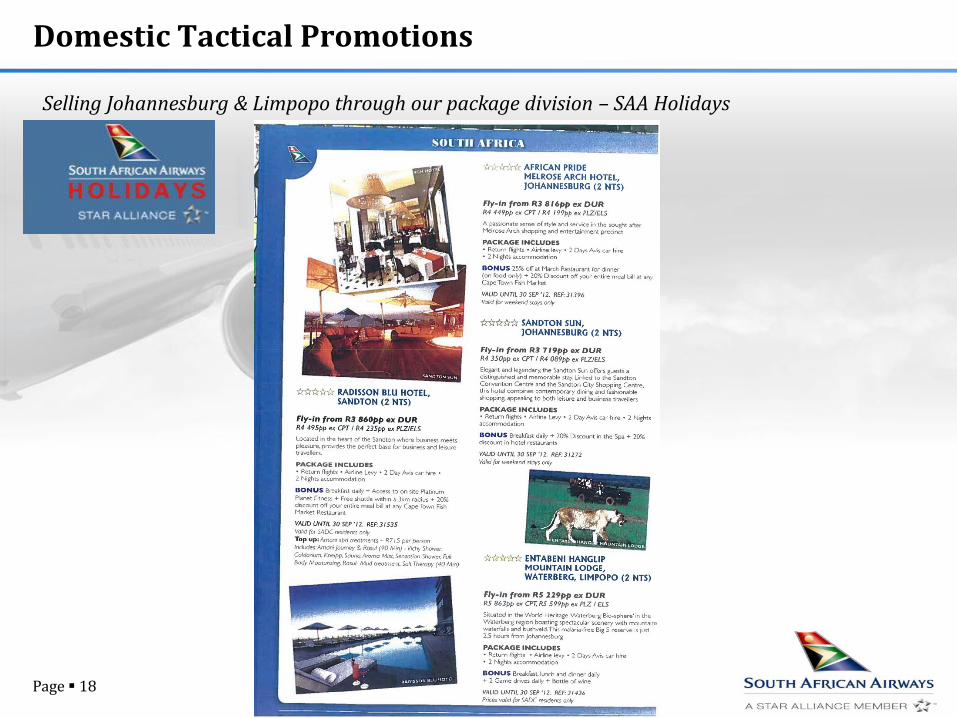
Domestic Tactical Promotions
Page 18
Selling Johannesburg & Limpopo through our package division – SAA Holidays

YOUR LOGO
Private and Confidential
Questions?
Page 19