DOF/DAF comparison for the treatment of milk industry ...
14
Ambiente & Água - An Interdisciplinary Journal of Applied Science ISSN 1980-993X – doi:10.4136/1980-993X www.ambi-agua.net E-mail: [email protected] This is an Open Access article distributed under the terms of the Creative Commons Attribution License, which permits unrestricted use, distribution, and reproduction in any medium, provided the original work is properly cited. DOF/DAF comparison for the treatment of milk industry wastewater ARTICLES doi:10.4136/ambi-agua.2553 Received: 30 Mar. 2020; Accepted: 07 Jul. 2020 Magno dos Santos Pereira ; Alisson Carraro Borges * ; Gustavo Lopes Muniz ; Fernanda Fernandes Heleno ; Lêda Rita D'Antonino Faroni Departamento de Engenharia Agrícola. Universidade Federal de Viçosa (UFV), Avenida PH Rolfs, s/n, CEP: 36570-900, Viçosa, MG, Brazil. E-mail: [email protected], [email protected], [email protected], [email protected] * Corresponding author. E-mail: [email protected] ABSTRACT The objective of this study was to evaluate the efficiency of dissolved ozone flotation (DOF) in comparison to dissolved air flotation (DAF) for treatment of milk industry wastewater (MW). In the first phase of the experiment, a synthetic milk wastewater (SMW) was used to evaluate DOF and DAF, with and without addition of hydrogen peroxide, at pH 4.0 and pH 11.4. In the DOF tests, the concentration of ozone was equal to 19 (± 0.5) mg L -1 and in the tests with addition of hydrogen peroxide, the H2O2/O3 ratios tested were 0.5, 1.0 and 1.5. In the second phase, tests were performed using three MW from three different industries to validate the results obtained and to determine the DOF system's ability to treat this type of effluent. The parameters tested during validation were turbidity, total suspended solids, oils and greases (O&G), chemical oxygen demand (COD), biochemical oxygen demand (BOD), total nitrogen (TN) and total phosphorus (TP). It was observed that the efficiency of the treatments was better at pH 4.0. The results showed a reduction of the efficiency with the use of DOF. The addition of H2O2 in DAF and DOF also resulted in reduced system efficiency. The results obtained with SMW only approximated those obtained with the MW from one of the industries that contained the largest traces of milk and cheese. Keywords: advanced oxidation process, dairy wastewater, dissolved ozone flotation. Comparação entre FAD e FAOD para o tratamento da água residuária de laticínios RESUMO O objetivo deste estudo foi avaliar a eficiência da flotação por ar e ozônio dissolvido (FAOD) em comparação à flotação por ar dissolvido (FAD) no tratamento da água residuária de laticínios (ARL). Na primeira fase do experimento foi utilizada água residuária de laticínios sintética (ARLS) para avaliar a FAD e a FAOD, com e sem a adição de peróxido de hidrogênio em dois valores de pH, 4,0 e 11,4. Nos testes de FAOD, a concentração de ozônio utilizada no ar foi igual a 19 (± 0,5) mg L -1 e nos testes com adição de peróxido de hidrogênio, as relações H2O2/O3 testadas foram de 0,5, 1,0 e 1,5. Na segunda parte do experimento, foram realizados testes com três ARL de três diferentes laticínios para validar os resultados obtidos e determinar a capacidade do sistema FAOD para tratar esse tipo de efluente. Os parâmetros testados durante a validação foram: turbidez, sólidos totais suspensos, óleos e graxas (O&G), demanda química
Transcript of DOF/DAF comparison for the treatment of milk industry ...
Ambiente & Água - An Interdisciplinary Journal of Applied Science
ISSN 1980-993X – doi:10.4136/1980-993X
www.ambi-agua.net
E-mail: [email protected]
This is an Open Access article distributed under the terms of the Creative Commons
Attribution License, which permits unrestricted use, distribution, and reproduction in any
medium, provided the original work is properly cited.
DOF/DAF comparison for the treatment of milk industry wastewater
ARTICLES doi:10.4136/ambi-agua.2553
Received: 30 Mar. 2020; Accepted: 07 Jul. 2020
Magno dos Santos Pereira ; Alisson Carraro Borges* ; Gustavo Lopes Muniz ;
Fernanda Fernandes Heleno ; Lêda Rita D'Antonino Faroni
Departamento de Engenharia Agrícola. Universidade Federal de Viçosa (UFV), Avenida PH Rolfs, s/n,
CEP: 36570-900, Viçosa, MG, Brazil. E-mail: [email protected], [email protected],
[email protected], [email protected] *Corresponding author. E-mail: [email protected]
ABSTRACT The objective of this study was to evaluate the efficiency of dissolved ozone flotation
(DOF) in comparison to dissolved air flotation (DAF) for treatment of milk industry wastewater
(MW). In the first phase of the experiment, a synthetic milk wastewater (SMW) was used to
evaluate DOF and DAF, with and without addition of hydrogen peroxide, at pH 4.0 and pH
11.4. In the DOF tests, the concentration of ozone was equal to 19 (± 0.5) mg L-1 and in the
tests with addition of hydrogen peroxide, the H2O2/O3 ratios tested were 0.5, 1.0 and 1.5. In the
second phase, tests were performed using three MW from three different industries to validate
the results obtained and to determine the DOF system's ability to treat this type of effluent. The
parameters tested during validation were turbidity, total suspended solids, oils and greases
(O&G), chemical oxygen demand (COD), biochemical oxygen demand (BOD), total nitrogen
(TN) and total phosphorus (TP). It was observed that the efficiency of the treatments was better
at pH 4.0. The results showed a reduction of the efficiency with the use of DOF. The addition
of H2O2 in DAF and DOF also resulted in reduced system efficiency. The results obtained with
SMW only approximated those obtained with the MW from one of the industries that contained
the largest traces of milk and cheese.
Keywords: advanced oxidation process, dairy wastewater, dissolved ozone flotation.
Comparação entre FAD e FAOD para o tratamento da água
residuária de laticínios
RESUMO O objetivo deste estudo foi avaliar a eficiência da flotação por ar e ozônio dissolvido
(FAOD) em comparação à flotação por ar dissolvido (FAD) no tratamento da água residuária
de laticínios (ARL). Na primeira fase do experimento foi utilizada água residuária de laticínios
sintética (ARLS) para avaliar a FAD e a FAOD, com e sem a adição de peróxido de hidrogênio
em dois valores de pH, 4,0 e 11,4. Nos testes de FAOD, a concentração de ozônio utilizada no
ar foi igual a 19 (± 0,5) mg L-1 e nos testes com adição de peróxido de hidrogênio, as relações
H2O2/O3 testadas foram de 0,5, 1,0 e 1,5. Na segunda parte do experimento, foram realizados
testes com três ARL de três diferentes laticínios para validar os resultados obtidos e determinar
a capacidade do sistema FAOD para tratar esse tipo de efluente. Os parâmetros testados durante
a validação foram: turbidez, sólidos totais suspensos, óleos e graxas (O&G), demanda química

Rev. Ambient. Água vol. 15 n. 5, e2553 - Taubaté 2020
2 Magno dos Santos Pereira et al.
de oxigênio (DQO), demanda bioquímica de oxigênio (DBO), nitrogênio total (NT) e fósforo
total (PT). Ao final do experimento, observou-se que a eficiência dos tratamentos foi melhor em
pH 4. Os resultados mostraram uma redução da eficiência com o uso da FAOD. A adição de
H2O2 na FAD e FAOD também resultou em menor eficiência nos dois sistemas. Os resultados
obtidos com ARLS aproximaram-se apenas dos obtidos com o ARL de uma das indústrias que
continham os maiores traços de leite e queijo.
Palavras-chave: efluentes de laticínios, flotação por ozônio dissolvido, processos oxidativos
avançados.
1. INTRODUCTION
The traditional biological treatment systems present unsatisfactory results when applied to
the degradation of effluents that have a high amount of bio refractory compounds (such as
effluents from agri-food industries) and the development of chemical oxidation strategies
becomes necessary (Martins and Quinta-Ferreira, 2014).
Ozone is a powerful oxidizing compound (Eº = 2.07 V) capable of reacting with various
chemical species under normal conditions of pressure and temperature.
In simple ozonation (without catalyst), ozone has a double action on the pollutants
according to the pH of the medium. At low pH values (pH ≤ 4), ozone reacts directly and
selectively with compounds that have sites of high electron density such as chromophoric
groups and with unsaturated bonds. For alkaline conditions (pH > 10), hydroxide ions promote
the molecular decomposition of ozone into hydroxyl radicals capable of decomposing a broader
range of organic pollutants (free radical pathways). For pH around 7, both reaction pathways
are present. Thus, there were different ways in which ozone can react with polluting organic
compounds. The decomposition of ozone in water can also be caused by UV radiation and
hydrogen peroxide (Mahmoud and Freire, 2007; Martins and Quinta-Ferreira, 2014; Shokri,
2015; Shokri et al., 2015).
The homogeneous combination between ozone (O3) and hydrogen peroxide (H2O2) is
considered a promising alternative in the removal of organic compounds from effluents. The
conjugated base of hydrogen peroxide, in low concentrations, can initiate the decomposition of
ozone much more rapidly, generating OH●, than the hydroxide ion (OH-) (Catalkaya and Kargi,
2007). The generation of hydroxyl radicals through the combination of ozone and hydrogen
peroxide is based on Equation 1 (Jaafarzadeh et al., 2017; Ahmadi and Ghanbari, 2018).
2𝑂3 + 2𝐻𝑂2− + 𝐻2𝑂 → 2𝐻𝑂• + 3𝑂2 + 𝑂𝐻− + 𝐻𝑂2
−• (1)
Dissolved ozone flotation (DOF) is an innovative water treatment process that combines
the benefits of ozonation and flotation. Consequently, coagulation, separation, discoloration,
odor removal and disinfection can occur simultaneously in DOF systems (Jin et al., 2015).
Other benefits are: reduction in coagulant/flocculant dosage; removal of pathogens; increased
biodegradability of effluents; removal of micro pollutants and reduction of the amount of
biological sludge generated (Wilinski and Naumczyk, 2012).
In the past, ozone research used conventional flotation (thick bubbles), not micro or nano
flotation, thus omitting the essential factor in the process. The main parameter that may limit
the kinetics of the process is the mass transfer of the ozone to the liquid (Wilinski and
Naumczyk, 2012).
The efficiency of the process depends on the total area of ozone bubbles in solution,
because a larger area (amount of bubbles generated) increases the mass transfer of ozone and
the oxidation rate of organic compounds. In conclusion, the problem of mass transfer of the
ozone to the liquid medium can be solved using appropriate air dispersion technologies (micro-

3 DOF/DAF comparison for the treatment …
Rev. Ambient. Água vol. 15 n. 5, e2553 - Taubaté 2020
and nano-bubble generating systems) (Wilinski and Naumczyk, 2012).
Lee et al. (2008) compared the efficiencies of the dissolved ozone flotation system, and
associated costs, with other technologies such as conventional ozonation, membrane filtration,
electro flocculation ozonation, electrodialysis, and sand filtration followed by chlorination.
According to the authors, DOF technology is highly effective and economically feasible for the
treatment of effluents these days.
Due to these facts, DOF has become increasingly popular in effluent treatment. Compared
to the conventional treatment process, which consists of coagulation, sedimentation and
filtration, the DOF process is superior in removal of color, odor and organic matter from
effluents. In addition, the hydraulic retention time (HRT) of the DOF process is three times
lower than the conventional tertiary wastewater treatment process, which results in much
smaller space requirements (Jin et al., 2015).
The objective of this experiment was to evaluate flotation by dissolved ozone, with and
without the addition of hydrogen peroxide, compared to dissolved air flotation for the treatment
of milk wastewater.
2. MATERIALS AND METHODS
2.1. Samples, reagents and solutions used
In the experiment, a synthetic milk wastewater (SMW) was used, as suggested by Silva et
al. (2013). According to the authors, this formulation satisfactorily characterizes a synthetic
effluent that does not contain whey derived from the manufacture of cheese. The average
composition of the synthetic milk effluent used in the experiment was: pH equal to 7.6; 3065.0
mg L-1 of COD; 625.0 NTU of turbidity; 186.0 mg L-1 of O&G; 3974.0 mg L-1 of total solids
(TS); 282.0 mg L-1 of total suspended solids (TSS) and 1367.0 mg L-1 of alkalinity as CaCO3.
The agro-industrial effluent samples were collected from three milk industries in the region
of Viçosa-MG. The samples, either synthetic or from the industries, were used on the same day
of the tests or on the day immediately after collection, being in this case conserved at 5°C.
The hydrogen peroxide solutions were prepared using a 30% w/w H2O2 solution, [H2O2]
= 9.0 mol L-1 and density of 1.1 g mL-1. The coagulant used was ferrous sulfate heptahydrate
(FeSO4.7H2O). The pH was adjusted using 1:1 v/v solutions of sodium hydroxide (NaOH) or
hydrochloric acid (HCl).
2.2. Obtaining and measuring of ozone gas in air and water
Ozone gas was obtained from an ozone generator developed by the company Ozone & Life
(São José dos Campos, SP), being used in the oxygen process (90-95% purity) after drying and
concentration of atmospheric air in the equipment.
The concentration of ozone in the air stream at a flow rate of 5 L min-1 was determined
immediately before of the saturation chamber by the iodometric method (APHA et al., 2012),
having a value equal to 19 (± 0.5) mg L-1, which was used throughout the experiment.
The ozone dissolved in water, measured in distilled water after the release of the
supersaturated water with the ozone at atmospheric pressure, was determined by the DDPD
method using a Vacu-vials kit from CheMetrics, having a value equal to 5.3 (± 0.3) mg L-1.
2.3. Experimental planning
The experiment consisted of the evaluation of the dissolved ozone flotation system (DOF),
with and without the addition of hydrogen peroxide (H2O2), compared to the traditional
dissolved air flotation system (DAF). The tests were carried out in acidic (pH = 4) and basic
(pH = 11.4) medium for the evaluation of the different effects of ozone on the treatment
efficiency at each pH range of the solution.
In the tests with peroxide addition, the H2O2/O3 ratios of 0.5, 1.0 and 1.5, calculated on the

Rev. Ambient. Água vol. 15 n. 5, e2553 - Taubaté 2020
4 Magno dos Santos Pereira et al.
basis of the mass of ozone released into the flotation column, were tested according to
Equation 2 adapted from Edzwald and Haarhoff (2011). Hydrogen peroxide was added and
mixed to the samples in the flotation column immediately prior to flotation tests (with and
without ozone).
𝑀𝑜𝑧 = 44.6𝑥10−3𝑥 (273.15
273.15 + 𝑇) 𝑥 (
𝑃𝑎𝑏𝑠
101.3) 𝑥 (
𝑀
𝐻𝑒𝑥 𝑓𝑥) 𝑥
𝑅𝑅
100 𝑥 𝑉𝑀𝑊 (2)
Where: Moz - mass of ozone liberated in the flotation column (mg); T - solution
temperature, equal to 20°C; Pabs - absolute pressure within the saturation chamber, equal to
919.2 kPa; M - ozone molar mass, equal to 48000 mg mol-1; He - Henry's constant for ozone,
equal to 3.408; fx - molar fraction of the ozone in the gas stream, equal to 9.56x10⁻³; RR -
recirculation rate, equal to 20%; VMW - milk wastewater sample volume, equal to 2 L.
The steps of the first part of the experiment are summarized in Table 1; in all of them, three
replicates of each treatment were made. For the determination of the best treatment and
evaluation of the efficiency of the system in each treatment, analyses of turbidity, COD, total
organic carbon (TOC) and color were made.
Table 1. Stages of the experiment for the evaluation of dissolved ozone flotation,
with and without addition of hydrogen peroxide, using the synthetic milk
wastewater.
Stages of the experiment Description
1 Dissolved air flotation tests
2 Dissolved ozone flotation tests
3 Dissolved air flotation tests with addition of H2O2
4 Dissolved ozone flotation tests with addition of H2O2
After the determination of the best treatment, whether at pH 4 or 11.4 and with or without
H2O2 addition, tests of DAF and DOF were performed using the three milk effluents cited for
validation of the best treatment. For the validation, the parameters of turbidity, chemical oxygen
demand (COD), biochemical oxygen demand (BOD), oils and greases (O&G), total suspended
solids (TSS), total nitrogen (NT) and total phosphorus (PT) were analyzed, according to APHA
et al. (2012).
The color analysis was done using a Konica Minolta colorimeter, Model Chroma Meters
CR-400, as presented in Equation 3 (MacDougall, 2002).
𝐷𝑒𝑙𝑡𝑎 𝑐𝑜𝑙𝑜𝑟 = √(𝐿 − 𝐿0)2 + (𝑎 − 𝑎0)2 + (𝑏 − 𝑏0)2 (3)
Where: Delta color - color variation of the treated sample; L - luminosity of the treated
sample; L0 - luminosity of distilled water; a - red/green coordinate (+a indicates red and -a
indicates green) of the treated sample; a0 - red/green coordinate (+a indicates red and -a
indicates green) of the distilled water; b - yellow/blue coordinate (+b indicates yellow and -b
indicates blue) of the treated sample; b0 - yellow/blue coordinate (+b indicates yellow and -b
indicates blue) of the distilled water.
The values obtained for the parameters (turbidity, delta color, COD, BOD, O&G, TSS, TN
and TP) after analysis were corrected using Equation 4 due to the dilution effect caused by the
water injection of the saturation chamber in the flotation column.
𝑃𝑐𝑜𝑟 = 𝑃𝑚𝑒𝑠 𝑥 (100 + 𝑅𝑅
100) (4)

5 DOF/DAF comparison for the treatment …
Rev. Ambient. Água vol. 15 n. 5, e2553 - Taubaté 2020
Where: Pcor - corrected parameter value; Pmes - value of the measured parameter; RR -
recirculation ratio, equal to 20%.
For the statistical analysis of the results, the Tukey test was used to compare means at a
significance level of 5%.
2.4. Used system and operating conditions
A batch dissolved ozone flotation system composed of an air compressor, a pressure
regulating valve, a saturation chamber for the dissolution of the gas mixture and a flotation
column was used in the experiment (Figure 1).
Figure 1. System used in the experiment. 1 – ozone
generator; 2 – compressor; 3 – pressure regulator; 4
– saturation chamber; 5 – flotation column.
The operating conditions of the flotation system were: saturation pressure of 10 bar;
recirculation ratio of 20%; flotation speed of 10 cm min-1; speed gradient for coagulation of
220.0 G; speed gradient for flocculation of 80 G; flocculation time equal to 5 min and FeSO4
dose equal to 250,0 mg L-1. The parameters were adopted according to Edzwald's
recommendation (Edzwald, 2010) and based on preliminary tests.
The flotation was done using the same procedure in all the tests. The air and ozone mixture
were injected by the lower inlet and dissolved in potable water until the pressure of 10 bar was
attained in the saturation chamber. After reaching the pressure inside the saturation chamber,
the gas injection was maintained for 2 min for the saturation of the water. In sequence, the valve
of the pipeline connecting the saturation chamber to the flotation column was opened by
injecting the supersaturated water with air and ozone into the flotation column.
To maintain the pressure established in the saturation chamber, during the opening of the
valve, air was injected through the upper opening of the saturation chamber to compensate for
the pressure drop caused by the water exhaust of the chamber. By the process, a maximum
pressure drop of 1 bar was obtained during the entire process of water release in the flotation
column.
The inlet air flow into the system was adjusted to 5 L min-1 and the flotation velocity in
the flotation column was set to 10.0 ± 1 cm min-1 using needle valves in both cases.
After injection of the volume of water corresponding to the pre-established recirculation
ratio, the chamber water outlet valve was closed, with the water and gas injection being
withdrawn into the flotation column. After 5 min of flotation start, the valve was closed, and
500 mL of the clarified samples were collected in each trial from the bottom of the flotation
column.
3. RESULTS AND DISCUSSION
Table 2 shows the results of the comparative tests between DAF and DOF in acidic and
basic medium, respectively, using synthetic milk wastewater (SMW).
Rev. Ambient. Água vol. 15 n. 5, e2553 - Taubaté 2020
6 Magno dos Santos Pereira et al.
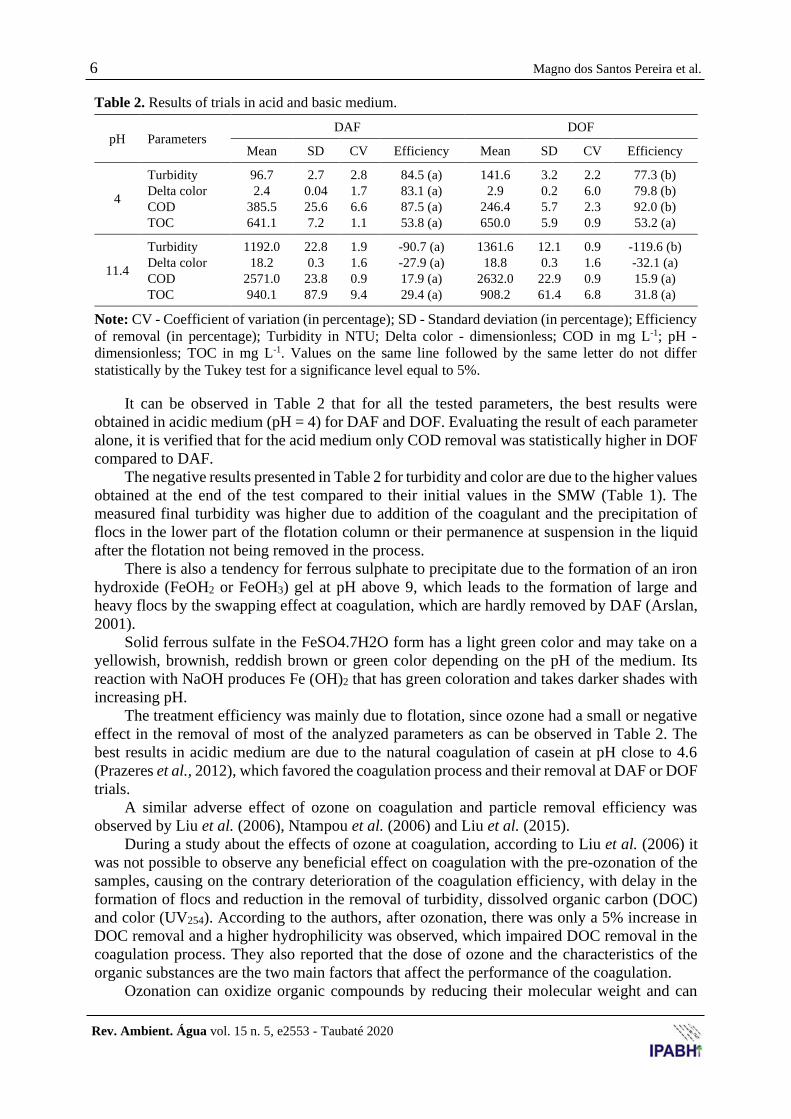
Table 2. Results of trials in acid and basic medium.
pH Parameters DAF DOF
Mean SD CV Efficiency Mean SD CV Efficiency
4
Turbidity 96.7 2.7 2.8 84.5 (a) 141.6 3.2 2.2 77.3 (b)
Delta color 2.4 0.04 1.7 83.1 (a) 2.9 0.2 6.0 79.8 (b)
COD 385.5 25.6 6.6 87.5 (a) 246.4 5.7 2.3 92.0 (b)
TOC 641.1 7.2 1.1 53.8 (a) 650.0 5.9 0.9 53.2 (a)
11.4
Turbidity 1192.0 22.8 1.9 -90.7 (a) 1361.6 12.1 0.9 -119.6 (b)
Delta color 18.2 0.3 1.6 -27.9 (a) 18.8 0.3 1.6 -32.1 (a)
COD 2571.0 23.8 0.9 17.9 (a) 2632.0 22.9 0.9 15.9 (a)
TOC 940.1 87.9 9.4 29.4 (a) 908.2 61.4 6.8 31.8 (a)
Note: CV - Coefficient of variation (in percentage); SD - Standard deviation (in percentage); Efficiency
of removal (in percentage); Turbidity in NTU; Delta color - dimensionless; COD in mg L-1; pH -
dimensionless; TOC in mg L-1. Values on the same line followed by the same letter do not differ
statistically by the Tukey test for a significance level equal to 5%.
It can be observed in Table 2 that for all the tested parameters, the best results were
obtained in acidic medium (pH = 4) for DAF and DOF. Evaluating the result of each parameter
alone, it is verified that for the acid medium only COD removal was statistically higher in DOF
compared to DAF.
The negative results presented in Table 2 for turbidity and color are due to the higher values
obtained at the end of the test compared to their initial values in the SMW (Table 1). The
measured final turbidity was higher due to addition of the coagulant and the precipitation of
flocs in the lower part of the flotation column or their permanence at suspension in the liquid
after the flotation not being removed in the process.
There is also a tendency for ferrous sulphate to precipitate due to the formation of an iron
hydroxide (FeOH2 or FeOH3) gel at pH above 9, which leads to the formation of large and
heavy flocs by the swapping effect at coagulation, which are hardly removed by DAF (Arslan,
2001).
Solid ferrous sulfate in the FeSO4.7H2O form has a light green color and may take on a
yellowish, brownish, reddish brown or green color depending on the pH of the medium. Its
reaction with NaOH produces Fe (OH)2 that has green coloration and takes darker shades with
increasing pH.
The treatment efficiency was mainly due to flotation, since ozone had a small or negative
effect in the removal of most of the analyzed parameters as can be observed in Table 2. The
best results in acidic medium are due to the natural coagulation of casein at pH close to 4.6
(Prazeres et al., 2012), which favored the coagulation process and their removal at DAF or DOF
trials.
A similar adverse effect of ozone on coagulation and particle removal efficiency was
observed by Liu et al. (2006), Ntampou et al. (2006) and Liu et al. (2015).
During a study about the effects of ozone at coagulation, according to Liu et al. (2006) it
was not possible to observe any beneficial effect on coagulation with the pre-ozonation of the
samples, causing on the contrary deterioration of the coagulation efficiency, with delay in the
formation of flocs and reduction in the removal of turbidity, dissolved organic carbon (DOC)
and color (UV254). According to the authors, after ozonation, there was only a 5% increase in
DOC removal and a higher hydrophilicity was observed, which impaired DOC removal in the
coagulation process. They also reported that the dose of ozone and the characteristics of the
organic substances are the two main factors that affect the performance of the coagulation.
Ozonation can oxidize organic compounds by reducing their molecular weight and can
7 DOF/DAF comparison for the treatment …
Rev. Ambient. Água vol. 15 n. 5, e2553 - Taubaté 2020
also increase the amount of acidic functional groups, affecting in various ways the interaction
between the organic matter and the coagulating agent. It may affect the coagulation of organic
matter, mainly by altering the electrostatic interactions between the coagulant and the organic
molecules, rather than altering the intrinsic affinity of the compounds by adsorptive sites on the
surface of the coagulant. Therefore, the impact of ozonation on coagulation will depend on the
characteristics of the treatment system, the particles and the type of coagulant used (Ntampou
et al., 2006).
Ozonation may also reduce the concentration of hydrolyzed aluminum species (eg:
[Al(OH)(H2O)5]2+, [Al(OH)2(H2O)4]
+, Al(OH)3) and iron (eg: Fe2O3, Fe(OH)SO4, Fe2(SO4)3,
FeOH2), responsible for particle coagulation (Liu et al., 2015; Richter, 2009).
Another factor that may have contributed to the fact that ozone did not have a positive
effect in increasing the treatment efficiency is the high alkalinity of the SMW (1367.0 mg L-1)
caused by the presence of bicarbonates (HCO3-) or carbonates (CO3
2-) that can act as
sequestrants of the hydroxyl radicals (Beltrán, 2004).
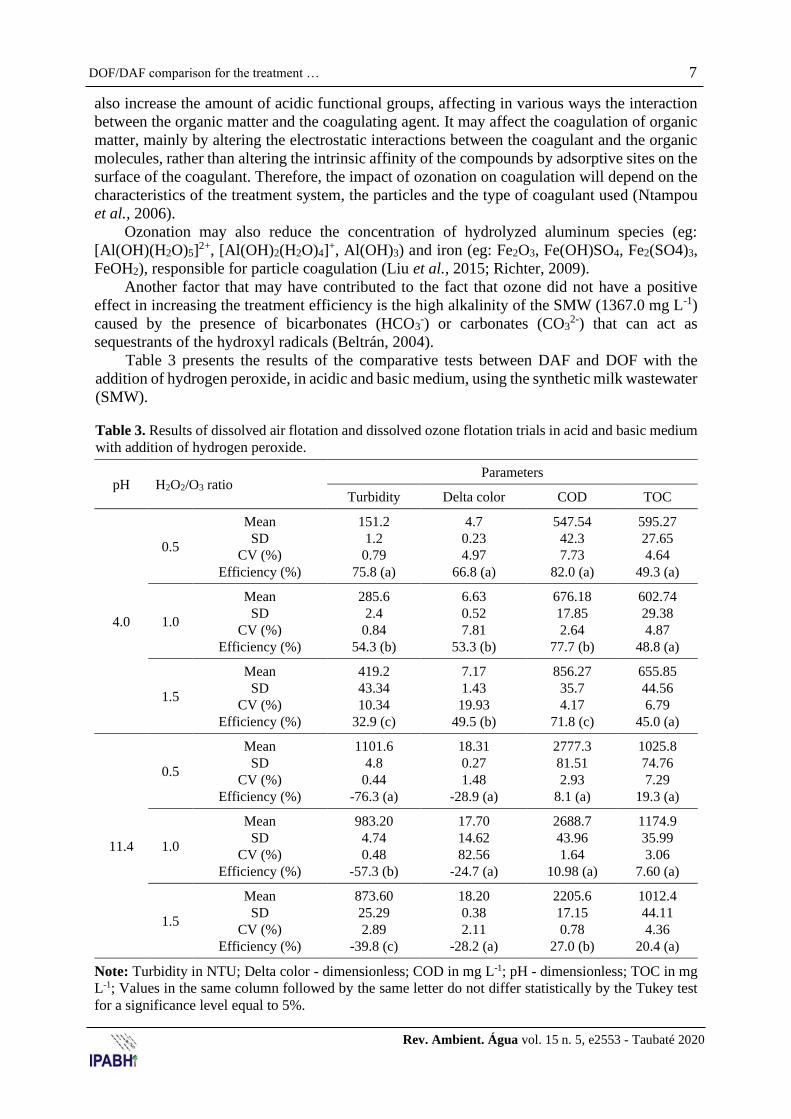
Table 3 presents the results of the comparative tests between DAF and DOF with the
addition of hydrogen peroxide, in acidic and basic medium, using the synthetic milk wastewater
(SMW).
Table 3. Results of dissolved air flotation and dissolved ozone flotation trials in acid and basic medium
with addition of hydrogen peroxide.
pH H2O2/O3 ratio Parameters
Turbidity Delta color COD TOC
4.0
0.5
Mean 151.2 4.7 547.54 595.27
SD 1.2 0.23 42.3 27.65
CV (%) 0.79 4.97 7.73 4.64
Efficiency (%) 75.8 (a) 66.8 (a) 82.0 (a) 49.3 (a)
1.0
Mean 285.6 6.63 676.18 602.74
SD 2.4 0.52 17.85 29.38
CV (%) 0.84 7.81 2.64 4.87
Efficiency (%) 54.3 (b) 53.3 (b) 77.7 (b) 48.8 (a)
1.5
Mean 419.2 7.17 856.27 655.85
SD 43.34 1.43 35.7 44.56
CV (%) 10.34 19.93 4.17 6.79
Efficiency (%) 32.9 (c) 49.5 (b) 71.8 (c) 45.0 (a)
11.4
0.5
Mean 1101.6 18.31 2777.3 1025.8
SD 4.8 0.27 81.51 74.76
CV (%) 0.44 1.48 2.93 7.29
Efficiency (%) -76.3 (a) -28.9 (a) 8.1 (a) 19.3 (a)
1.0
Mean 983.20 17.70 2688.7 1174.9
SD 4.74 14.62 43.96 35.99
CV (%) 0.48 82.56 1.64 3.06
Efficiency (%) -57.3 (b) -24.7 (a) 10.98 (a) 7.60 (a)
1.5
Mean 873.60 18.20 2205.6 1012.4
SD 25.29 0.38 17.15 44.11
CV (%) 2.89 2.11 0.78 4.36
Efficiency (%) -39.8 (c) -28.2 (a) 27.0 (b) 20.4 (a)
Note: Turbidity in NTU; Delta color - dimensionless; COD in mg L-1; pH - dimensionless; TOC in mg
L-1; Values in the same column followed by the same letter do not differ statistically by the Tukey test
for a significance level equal to 5%.
Rev. Ambient. Água vol. 15 n. 5, e2553 - Taubaté 2020
8 Magno dos Santos Pereira et al.
In Table 3, it can be observed that the addition of hydrogen peroxide in the H2O2/O3 ratios
of 0.5, 1 and 1.5 did not lead to an improvement in the removal efficiency of the parameters
evaluated. In the acidic medium there was a reduction in the treatment efficiency as the H2O2/O3
ratio increased. In the basic medium there was a small improvement in removal of turbidity and
COD with increase of the ratio, but all the parameters had worse results compared to the
treatments without addition of hydrogen peroxide (Table 2).
Effect similar to that described for ozone may have occurred with addition of hydrogen
peroxide in the sample, resulting in a reduction in particle removal efficiency due to coagulation
impairment or the neutralization of its oxidizing action due to the high alkalinity of the SMW.
It is important to remember that H2O2 was used as a co oxidant with ozone and preferably, in
basic medium, as a catalyst for the formation of hydroxyl radicals. However, the concentrations
of ozone and peroxide used in the experiment had a small effect on the treatment.
Therefore, flotation has been shown to be the governing factor of the process and the main
factor responsible for the efficiency of the treatment; its addition possibly impaired the quality
of the coagulation, impacting the flotation performance, providing inferior results.
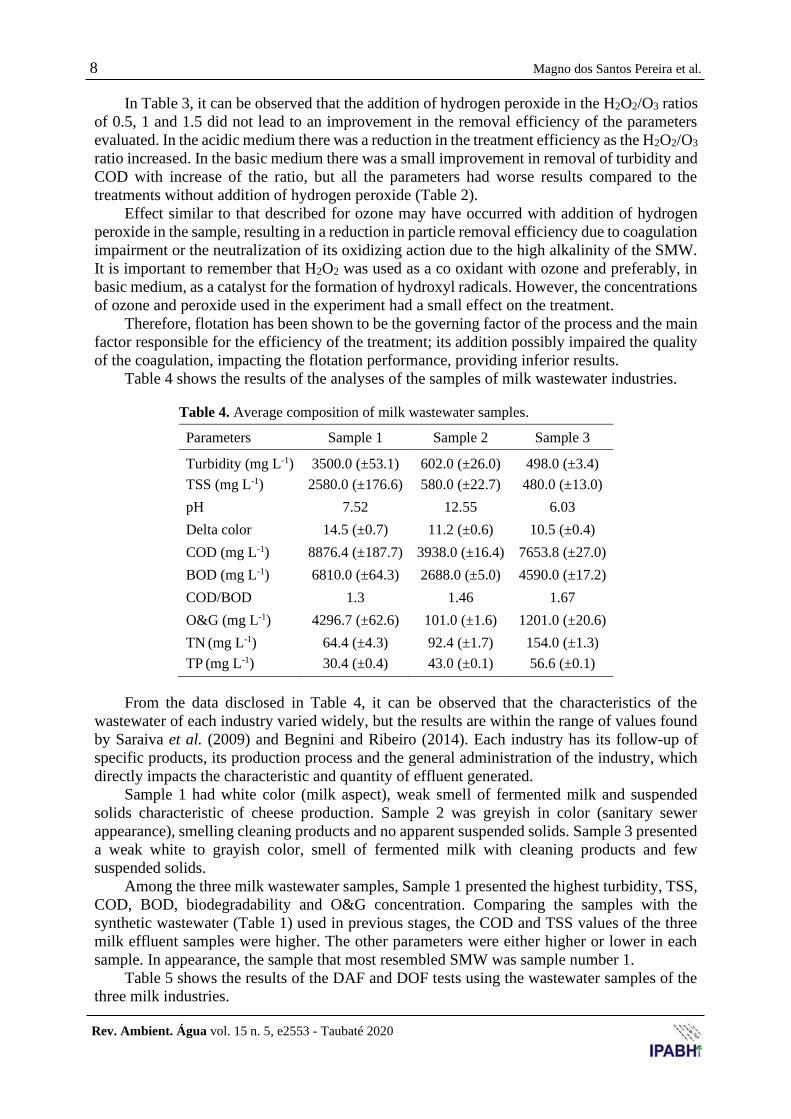
Table 4 shows the results of the analyses of the samples of milk wastewater industries.
Table 4. Average composition of milk wastewater samples.
Parameters Sample 1 Sample 2 Sample 3
Turbidity (mg L-1) 3500.0 (±53.1) 602.0 (±26.0) 498.0 (±3.4)
TSS (mg L-1) 2580.0 (±176.6) 580.0 (±22.7) 480.0 (±13.0)
pH 7.52 12.55 6.03
Delta color 14.5 (±0.7) 11.2 (±0.6) 10.5 (±0.4)
COD (mg L-1) 8876.4 (±187.7) 3938.0 (±16.4) 7653.8 (±27.0)
BOD (mg L-1) 6810.0 (±64.3) 2688.0 (±5.0) 4590.0 (±17.2)
COD/BOD 1.3 1.46 1.67
O&G (mg L-1) 4296.7 (±62.6) 101.0 (±1.6) 1201.0 (±20.6)
TN (mg L-1) 64.4 (±4.3) 92.4 (±1.7) 154.0 (±1.3)
TP (mg L-1) 30.4 (±0.4) 43.0 (±0.1) 56.6 (±0.1)
From the data disclosed in Table 4, it can be observed that the characteristics of the
wastewater of each industry varied widely, but the results are within the range of values found
by Saraiva et al. (2009) and Begnini and Ribeiro (2014). Each industry has its follow-up of
specific products, its production process and the general administration of the industry, which
directly impacts the characteristic and quantity of effluent generated.
Sample 1 had white color (milk aspect), weak smell of fermented milk and suspended
solids characteristic of cheese production. Sample 2 was greyish in color (sanitary sewer
appearance), smelling cleaning products and no apparent suspended solids. Sample 3 presented
a weak white to grayish color, smell of fermented milk with cleaning products and few
suspended solids.
Among the three milk wastewater samples, Sample 1 presented the highest turbidity, TSS,
COD, BOD, biodegradability and O&G concentration. Comparing the samples with the
synthetic wastewater (Table 1) used in previous stages, the COD and TSS values of the three
milk effluent samples were higher. The other parameters were either higher or lower in each
sample. In appearance, the sample that most resembled SMW was sample number 1.
Table 5 shows the results of the DAF and DOF tests using the wastewater samples of the
three milk industries.
9 DOF/DAF comparison for the treatment …
Rev. Ambient. Água vol. 15 n. 5, e2553 - Taubaté 2020
Table 5. Results of the dissolved air flotation and dissolved ozone flotation.
Sample Parameters DAF DOF
Mean SD CV Efficiency Mean SD CV Efficiency
1
Turbidity (mg L-1) 117.6 4.3 3.7 96.6 (a) 167.6 9.1 5.4 95.2 (b)
Delta Color 3.2 0.4 11.0 77.8 (a) 4.0 0.3 6.7 72.7 (a)
COD (mg L-1) 2233.8 95.2 4.3 74.8 (a) 2267.1 79.6 3.5 74.5 (a)
BOD (mg L-1) 960.0 18.3 1.9 85.9 (a) 982.1 26.8 2.7 85.6 (a)
O&G (mg L-1) 218.0 12.0 5.5 94.9 (a) 607.2 20.8 3.4 85.9 (b)
TSS (mg L-1) 190.4 26.6 13.9 92.6 (a) 197.3 14.1 7.1 92.4 (a)
TN (mg L-1) 14.3 1.9 13.3 77.7 (a) 14.6 1.9 13.3 77.4 (a)
TP (mg L-1) 18.5 0.5 2.7 39.2 (a) 20.5 0.3 1.2 32.6 (b)
2
Turbidity (mg L-1) 113.9 12.1 10.7 81.1 (a) 166.8 5.5 3.3 72.3 (b)
Delta Color 5.9 0.7 11.8 47.4 (a) 6.6 0.2 2.6 40.7 (a)
COD (mg L-1) 2576.8 21.8 0.8 34.6 (a) 2657.8 21.8 0.8 32.5 (b)
BOD (mg L-1) 1936.8 7.2 0.4 27.9 (a) 1944.0 7.2 0.4 27.7 (a)
O&G (mg L-1) 0.0 0.0 0.0 100.0 (a) 0.0 0.0 0.0 100.0 (a)
TSS (mg L-1) 80.8 7.3 9.1 86.1 (a) 106.4 3.7 3.4 81.7 (b)
TN (mg L-1) 43.9 1.6 3.7 52.5 (a) 42.9 1.6 3.8 53.5 (a)
TP (mg L-1) 42.5 0.2 0.4 1.2 (a) 42.7 0.1 0.3 0.7 (b)
3
Turbidity (mg L-1) 305.6 4.2 1.4 38.6 (a) 310.8 2.4 0.8 37.6 (a)
Delta Color 11.2 1.0 9.0 -6.4 (a) 12.6 0.4 3.2 -20.5 (a)
COD (mg L-1) 5015.4 34.3 0.7 34.5 (a) 4721.9 40.2 0.9 38.3 (b)
BOD (mg L-1) 2612.0 18.3 0.7 43.1 (a) 2280.0 52.3 2.3 50.3 (b)
O&G (mg L-1) 232.0 8.5 3.7 80.7 (a) 263.6 17.0 6.5 78.1 (a)
TSS (mg L-1) 273.8 14.9 5.5 43.0 (a) 279.2 8.0 2.9 41.8 (a)
TN (mg L-1) 118.7 1.9 1.6 22.9 (a) 119.8 1.9 1.6 22.2 (a)
TP (mg L-1) 42.5 0.2 0.4 24.9 (a) 42.2 0.3 0.6 25.3 (a)
Note: Values on the same line followed by the same letter do not differ statistically by
the Tukey test for a significance level equal to 5%.
As can be seen in Table 5 (highlighted in bold), there was a significant difference in seven
comparative analyses between DAF and DOF. There was a reduction in removal efficiency of
turbidity, COD, O&G, TSS and TP of samples 1 and 2 and an increase only in the removal
efficiency of COD and BOD of Sample 3.
Among the samples evaluated, the best results of the analyzed parameters were obtained
for Sample 1. This fact is possibly due to the greater presence of milk and cheese remains in
this sample, which contain large quantities of casein, the main milk protein and which has an
isoelectric point at pH equal to 4.6. At this pH, or close to it, destabilization of the casein occurs
and its natural coagulation takes place, leading to better removal efficiencies of these particles
in flotation systems (Prazeres et al., 2012). During the research it was observed that the SMW
used did not adequately represent the characteristics of the milk effluents in general and only
with one of the three milk wastewater samples was it possible to obtain results similar to those
obtained with the SMW.

Rev. Ambient. Água vol. 15 n. 5, e2553 - Taubaté 2020
10 Magno dos Santos Pereira et al.
Lee and Song (2006) tested a continuous-flow pilot scale DOF system with an additional
contact chamber to treat bovine wastewater. In that experiment, a recirculation ratio of 20%,
flotation time equal to 20 min and ozone concentrations of 40 to 200 mg L-1 in the feed air were
used as operational parameters. According to the authors, it was possible to obtain removal
efficiencies of COD, TSS, TN and TP of 88%, 92%, 67.7% and 94.6%, respectively, with the
system.
According to Lee and Song (2006), increase in ozone concentration has led to higher rates
of COD removal and ozone in high concentrations improves the flotation process for two
reasons: the first reason is that ozone improves coagulation by oxidizing the hydrophilic
colloidal particles, making them hydrophobic and facilitating their removal; the second reason
is due to the higher solubility of ozone in water, so higher concentrations of ozone causes an
increase in the concentration of microbubbles, improving the efficiency of the process.
Lee et al. (2008) evaluated a DOF system and a common ozonation system (large bubbles),
in laboratory-scale and pilot-scale, for the treatment of a secondary effluent from a sewage
treatment plant. According to the authors, DOF has been shown to be a more effective
ozonization technique compared to common ozonation. In the laboratory phase, the optimum
ozone concentration found in the DOF was 6.1 mg L-1. The DOF pilot scale system evaluated
for one month provided removal efficiencies of 86.9% of turbidity, 81% of total suspended
solids, 72.6% of color, 82.4% of BOD and 92% of total phosphorus. However, lower removal
efficiencies of 42.9% and 33.4% were obtained for COD and TN, respectively. Nearly 100%
disinfection efficiency was achieved by the removal of heterotrophic bacteria and fecal
coliforms.
An ozone system by microbubbles and macrobubbles for the treatment of a textile effluent
was evaluated by Chu et al. (2008). In this work, the authors verified that with the use of the
microbubbles, higher rates of mass transfer of ozone to the liquid medium were obtained, higher
rates of color removal (80% in 140 min compared to 280 min) and 20% higher COD removal.
Beneventi et al. (2009) used a flotation system with ozone (60 mg L-1) using a flotation
column and with recirculation of the clarified water to treat the effluent of a paper industry.
According to the authors, it was possible to obtain an improvement in COD removal, compared
to DAF, of 41 to 63%, but there was no difference in effluent color removal efficiency (92%).
The efficiency of DAF and DOF was compared by Wilinski and Naumczyk (2012), using
a pilot scale system operated in continuous flow on treatment of wastewater from fruit
processing. The authors observed a greater efficiency in treatment with DOF compared to DAF.
In DOF, removal efficiencies of COD, soluble COD and BOD equal to 33.8%, 29.3% and
34.8%, respectively, were obtained. In DAF, the removal efficiencies of COD, soluble COD
and BOD were equal to 20.1%, 6.6% and 20.3%, respectively.
Jin et al. (2015) used a pilot-scale DOF system, without pressurizing, to treat a secondary
effluent from a sewage treatment plant. The operating conditions of the system were:
recirculation ratio of 50%, hydraulic retention time of 30 minutes and concentrations of ozone
ranging from 0 to 1.6 mg L-1. The optimum ozone dosage determined by the authors was equal
to 1.6 mg L-1. Removal efficiencies of 80% and 60%, respectively, were obtained for color and
TOC. Due to the ozone effect, there was also a large reduction in the molecular weight of the
effluent components, from 6000 Da to 3000 Da, with predominance of molecules up to 500 Da.
Contrary to the results of the mentioned authors, with the system used and under the
conditions of this experiment, it was not possible to obtain an effective improvement in the
removal efficiency of the evaluated parameters with the use of the ozone in the flotation process.
In most of the tests there was a reduction in the removal efficiency of the evaluated parameters.
The dissolved air flotation process had better performance and the physical mechanisms
predominated in the treatment of the milk effluent.
The small or negligible effect of ozone in the process was possibly caused by the small

11 DOF/DAF comparison for the treatment …
Rev. Ambient. Água vol. 15 n. 5, e2553 - Taubaté 2020
concentration of ozone used (19 mg L-1) in the inlet air of the saturation chamber, which
provided a small amount of dissolved ozone, around 21.6 mg, for the degradation of the organic
effluent load (COD of 2233.8 to 5015.4 mg L-1).
Hydrogen peroxide was used in this experiment, with the function of co-oxidant and a
catalyst for hydroxyl radical formation. Its punctual and pre-flotation addition had a similar
effect to the ozone in the treatment, impairing the coagulation/flocculation and reducing particle
removal efficiency during flotation. Usually, in the process called peroxone, the addition of
H2O2 (via solution) and ozone (via gas flow) in the liquid medium is done together and
continuously for long periods of time (10 to 360 min), providing at the end of treatment an
amount of oxidant much higher than the one used in this work (Catalkaya and Kargi, 2007; Li
et al., 2013; Paschoalato et al., 2008).
Better results could be obtained with higher concentrations of ozone, since the
concentration of ozone is small in relation to the high organic load of the milk effluent. Another
important factor was the batch system used, which did not allow the recirculation of the clarified
effluent and the reduced contact time (≤ 2 min) with ozone.
As can be seen in works of Lee and Song (2006), Lee et al. (2008), Chu et al. (2008), Kim
et al. (2011), Wilinski and Naumczyk (2012) and Jin et al. (2015), in all those studies in which
DOF had superior performance compared to DAF, it was possible to observe that at least one
of these features existed: the ozonation had an application time ≥ 1 h using microbubbles; pilot-
scale systems operated at continuous flow and with recirculation of clarified effluent; an
additional ozone tank was used that was incorporated into the system, called dissolved ozone
flotation with pressurized ozone oxidation (DOF-PO2) (Kim et al., 2011; Lee and Song, 2006).
The recirculation and the additional tank increase the contact time of the dissolved ozone
with the effluent to be treated, promoting the oxidation of pollutants and their degradation.
Continuous flow systems would also enable the continuous addition of H2O2 at the ideal
H2O2/O3 ratio for the formation of hydroxyl radicals, which would increase the degradation
capacity of the pollutants and the overall efficiency of the system.
4. CONCLUSIONS
In the experimental conditions of the present work, dissolved ozone flotation did not
demonstrate better performance compared to dissolved air flotation, with only a slight tendency
to improve the removal of COD and BOD. In all tests of dissolved air flotation and dissolved
ozone flotation, with and without the addition of hydrogen peroxide, better treatment results
were obtained at pH 4.
The tests with hydrogen peroxide at H2O2/O3 ratios of 0.5, 1.0 and 1.5 at pH 4 demonstrated
a gradual reduction in treatment efficiency, with a ratio increase and a slight tendency to
increase at pH 11.4, but still significatively below the results without hydrogen peroxide.
The results with synthetic effluent differed from the results with the three milk industry
effluents, being closer in only one of them that contained more traces of milk and cheese
residue.
It is suggested for future experiments, using the same flotation system, that tests be made
using ozone concentrations equal to 100 mg L-1 or above. It is also suggested that tests be made
using a flotation system operated at continuous flow, with recirculation of clarified effluent and
an additional ozonation tank, and that tests with hydrogen peroxide be made with its continuous
addition in the complementary ozonation tank, at pH ranges from 8 to 12 and with H2O2/O3
ratios varying from 0.5 to 3.0.
5. ACKNOWLEDGEMENTS
This work was funded by National Council for Scientific and Technological Development

Rev. Ambient. Água vol. 15 n. 5, e2553 - Taubaté 2020
12 Magno dos Santos Pereira et al.
(CNPq Grant 164598/2014-6) and Coordination for the Improvement of Higher Education
Personnel (CAPES Finance Code 001).
6. REFERENCES
APHA; AWWA; WEF. Standard methods for the examination of water and wastewater.
22nd edition. Washington, 2012.
AHMADI, M.; GHANBARI, F. Degradation of organic pollutants by photoelectro-
peroxone/ZVI process: Synergistic, kinetic and feasibility studies. Journal of
Environmental Management, v. 228, p. 32-39, 2018.
https://doi.org/10.1016/j.jenvman.2018.08.102
ARSLAN, I. Treatability of a simulated dispersed dye-bath by ferrous iron coagulation,
ozonation, and ferrous iron-catalyzed ozonation. Journal of Hazardous Materials, v.
85, n. 3, p. 229-241, 2001. http://doi.org/10.1016/S0304-3894(01)00232-1
BEGNINI, B. C.; RIBEIRO, H. B. Plano para redução de carga poluidora em indústria de
lacticínios. Saúde e Meio Ambiente: Revista Interdisciplinar, v. 3, n. 1, p. 19-30, 2014.
http://dx.doi.org/10.24302/sma.v3i1.519
BELTRÁN, F. J. Ozone reaction kinetics for water and wastewater systems. Boca Raton:
Lewis Publishers, 2004.
BENEVENTI, D.; ALMEIDA, F.; MARLIN, N.; CURTIL, D.; SALGUEIRO, L.;
AUROUSSEAU, M. Hydrodynamics and recovered papers deinking in an ozone flotation
column. Chemical Engineering and Processing. v. 48, p. 1517-1526, 2009.
http://doi:10.1016/j.cep.2009.10.007
CATALKAYA, E. C.; KARGI, F. Color, TOC and AOX removals from pulp mill effluent by
advanced oxidation processes: A comparative study. Journal of Hazardous Materials,
v. 139, n. 2, p. 244-253, 2007. http://doi.org/10.1016/j.jhazmat.2006.06.023
CHU, L.-B.; XING, X.-H.; YU, A.-F.; SUN, X.-L.; JURCIK, B. Enhanced treatment of
practical textile wastewater by microbubble ozonation. Process Safety and
Environmental Protection, v. 86, n. 5, p. 389-393, 2008.
http://doi.org/10.1016/j.psep.2008.02.005
EDZWALD, J.; HAARHOFF, J. Dissolved air flotation for water clarification. New York:
McGraw Hill Professional, 2011.
EDZWALD, J. K. Dissolved air flotation and me. Water Research, v. 44, n. 7, p. 2077-2106,
2010. http://doi.org/10.1016/j.watres.2009.12.040
JAAFARZADEH, N.; BARZEGAR, G.; GHANBARI, F. Photo assisted electro-peroxone to
degrade 2,4-D herbicide: The effects of supporting electrolytes and determining
mechanism. Process Safety and Environmental Protection, v. 111, p. 520-528, 2017.
https://doi.org/10.1016/j.psep.2017.08.012
JIN, X.; JIN, P.; WANG, X. A study on the effects of ozone dosage on dissolved-ozone flotation
(DOF) process performance. Water Science and Technology, v. 71, n. 9, p. 1423-1428,
2015. http://doi.dx.org/10.2166/wst.2015.115

13 DOF/DAF comparison for the treatment …
Rev. Ambient. Água vol. 15 n. 5, e2553 - Taubaté 2020
KIM, J. H.; KIM, H. S.; LEE, B. H. Combination of sequential batch reactor (SBR) and
dissolved ozone flotation-pressurized ozone oxidation (DOF-PO2) processes for
treatment of pigment processing wastewater. Environmental Engineering Research, v.
16, n. 2, p. 97-102, 2011. http://doi.dx.org/10.4491/eer.2011.16.2.97
LEE, B.; SONG, W. High concentration of ozone application by the DAF (Dissolved Air
Flotation) system to treat livestock wastewater. WIT Transactions on Ecology and the
Environment, v. 95, p. 561-569, 2006. http://doi.dx.org/10.2495/WP060551
LEE, B. H.; SONG, W. C.; MANNA, B.; HA, J. K. Dissolved ozone flotation (DOF)—a
promising technology in municipal wastewater treatment. Desalination, v. 225, n. 1, p.
260-273, 2008. http://doi.org/10.1016/j.desal.2007.07.011
LI, Z.; YUAN, S.; QIU, C.; WANG, Y.; PAN, X.; WANG, J.; WANG, C.; ZUO, J. Effective
degradation of refractory organic pollutants in landfill leachate by electro-peroxone
treatment. Electrochimica Acta, n. 102 p. 174-182, 2013.
http://doi.org/10.1016/j.electacta.2013.04.034
LIU, H.-L.; WANG, D.-S.; SHI, B.-Y.; WANG, M.; TANG, H.-X. Effects of pre-ozonation on
organic matter removal by coagulation with IPF-PACl. Journal of Environmental
Sciences (China), v. 18, n. 3, p. 453-458, 2006.
LIU, H.; GUO, X.; WANG, M.; JIAO, R.; SHI, J. Effects of interaction of ozonation and
coagulation on coagulation results. Huan Jing Ke Xue= Huanjing Kexue, v. 36, n. 9, p.
3285-3291, 2015.
MACDOUGALL, D. B. Colour in food: Improving quality. Cambridge: Woodhead
Publishing, 2002.
MARTINS, R. C.; QUINTA-FERREIRA, R. M. A review on the applications of ozonation for
the treatment of real agro-industrial wastewaters. Ozone: Science & Engineering, v. 36,
n. 1, p. 3-35, 2014. http://dx.doi.org/10.1080/01919512.2013.842158
MAHMOUD, A.; FREIRE, R. S. Métodos emergentes para aumentar a eficiência do ozônio no
tratamento de águas contaminadas. Química Nova, v. 30, n. 1, p. 198-205, 2007.
http://dx.doi.org/10.1590/S0100-40422007000100032
NTAMPOU, X.; ZOUBOULIS, A.; SAMARAS, P. Appropriate combination of physico-
chemical methods (coagulation/flocculation and ozonation) for the efficient treatment of
landfill leachates. Chemosphere, v. 62, n. 5, p. 722-730, 2006.
http://doi.org/10.1016/j.chemosphere.2005.04.067
PASCHOALATO, C. F. P. R.; TRIMAILOVAS, M. R.; DI BERNARDO, L. Formação de
subprodutos orgânicos halogenados nas operações de pré-oxidação com cloro, ozônio e
peroxônio e pós-cloração em água conténdo substância húmica. Engenharia Sanitária e
Ambiental, v. 13, n. 3, p. 313-322, 2008. https://doi.org/10.1590/S1413-
41522008000300011
PRAZERES, A. R.; CARVALHO, F.; RIVAS, J. Cheese whey management: A review,
Journal of Environmental Management, n. 110, p. 48-68, 2012.
http://doi.dx.org/10.1016/j.jenvman.2012.05.018
RICHTER, C. A. Água: métodos e tecnologia de tratamento. São Paulo: Edgard Blucher, 2009.

Rev. Ambient. Água vol. 15 n. 5, e2553 - Taubaté 2020
14 Magno dos Santos Pereira et al.
SARAIVA, C. B.; MENDONÇA, R. C. S.; SANTOS, A. L.; PEREIRA, D. A. Consumo de
água e geração de efluentes em uma indústria de laticínios. Revista do Instituto de
Laticínios Cândido Tostes, v. 64, n. 367, p. 10-18, 2009.
SHOKRI, A. Degradation of 2-Nitrophenol from Petrochemical Wastewater by Ozone.
Russian Journal of Applied Chemistry, v. 88, n. 12, p. 2038-2043, 2015.
https://doi.org/10.1134/S10704272150120216
SHOKRI, A.; MAHANPOOR, K.; SOODBAR, D. Degradation of Ortho-Toluidine in
petrochemical wastewater by ozonation, UV/O3, O3/H2O2 and UV/O3/H2O2 processes.
Desalination and Water Treatment, v. 57, n. 35, p. 16473-16482, 2015.
https://doi.org/10.1080/19443994.2015.1085454
SILVA, L. V. C.; ANDRADE, M. V.; RODRIGUES, K.; MARINHO, G. Treatment of
synthetic dairy wastewater in batch reactors inoculated with Aspergillus niger AN400.
Engenharia Sanitária Ambiental, v. 18, p. 371-380, 2013.
https://doi.org/10.1590/S1413-41522013000400009
WILINSKI, P.; NAUMCZYK, J. Dissolved Ozone Flotation as an innovative and prospect
method for treatment of micropollutants and wastewater treatment costs reduction. In:
WORLD WIDE WORKSHOP FOR YOUNG ENVIRONMENTAL SCIENTISTS, 12.,
21-25 May 2012, Arcueil, France, 2012. Proceedings[…] Villeurbanne: CCSD, 2012.