Does education raise productivity and wages equally ?The ...
66
Working Paper Research Does education raise productivity and wages equally ? The moderating roles of age, gender and industry by François Rycx, Yves Saks and Ilan Tojerow April 2015 No 281
Transcript of Does education raise productivity and wages equally ?The ...

Working Paper Research
Does education raise productivity and wages equally ?
The moderating roles of age, gender and industry
by François Rycx, Yves Saks and Ilan Tojerow
April 2015 No 281
NBB WORKING PAPER No. 281 - APRIL 2015
Editor Jan Smets, Governor of the National Bank of Belgium Statement of purpose:
The purpose of these working papers is to promote the circulation of research results (Research Series) and analytical studies (Documents Series) made within the National Bank of Belgium or presented by external economists in seminars, conferences and conventions organised by the Bank. The aim is therefore to provide a platform for discussion. The opinions expressed are strictly those of the authors and do not necessarily reflect the views of the National Bank of Belgium. Orders
For orders and information on subscriptions and reductions: National Bank of Belgium, Documentation - Publications service, boulevard de Berlaimont 14, 1000 Brussels Tel +32 2 221 20 33 - Fax +32 2 21 30 42 The Working Papers are available on the website of the Bank: http://www.nbb.be © National Bank of Belgium, Brussels All rights reserved. Reproduction for educational and non-commercial purposes is permitted provided that the source is acknowledged. ISSN: 1375-680X (print) ISSN: 1784-2476 (online)

NBB WORKING PAPER No. 281 - APRIL 2015
Abstract
The labour market situation of low-educated people is particularly critical in most advanced economies, especially among youngsters and women. Policies aiming to increase their employability either try to foster their productivity and/or to decrease their wage cost. Yet, the evidence on the misalignment between education-induced productivity gains and corresponding wage cost differentials is surprisingly thin, inconclusive and subject to various econometric biases. We investigate this issue using rich Belgian linked employer-employee panel data for the period 1999-2010. Moreover, we provide first evidence on the moderating roles of age, gender and industry in the relationship between education, productivity and wage costs. Controlling for simultaneity issues, time-invariant workplace characteristics and dynamics in the adjustment process of dependent variables, findings support the existence of a ‘wage-compression effect’, i.e. a situation in which the distribution of wage costs is more compressed than the education-productivity profile. This effect, robust across industries, is found to disappear among older cohorts of workers and to be more pronounced among women than men. Overall, findings suggest that particular attention should be devoted to the productivity to wage cost ratio of low-educated workers, especially when they are young and female, but also to policies favouring gender equality in terms of remuneration and career advancement.
JEL classification: C33, I21, J24, J31.
Keywords: Education, labour costs, productivity, linked panel data.
Authors: François Rycx (corresponding author), Université libre de Bruxelles, SBS-EM (CEB and DULBEA),
and IZA, e-mail: [email protected]. Yves Saks, National Bank of Belgium, Research Department, e-mail: [email protected]. Ilan Tojerow, Université libre de Bruxelles, SBS-EM (CEB and DULBEA), and IZA, e-mail: [email protected]. We are grateful to the National Bank of Belgium for financial support and to Statistics Belgium (DGS) for giving access to the data. We also would like to thank Philippe Delhez, Catherine Fuss, Sile O’Dorchai, Raf Wouters and seminar participants at the NBB (Brussels, December 12th, 2014) for very helpful comments on an earlier version of this paper. The views expressed in this paper are those of the authors and do not necessarily reflect those of the National Bank of Belgium or the Eurosystem.

NBB WORKING PAPER - No. 281- APRIL 2015
TABLE OF CONTENTS
1 Introduction ............................................................................................................................. 1
2 Review of the literature ........................................................................................................... 4
2.1 Theoretical background ........................................................................................................ 4
2.2 Empirical background ........................................................................................................... 8
3 Set-up of the analysis ........................................................................................................... 10
3.1 Model ................................................................................................................................. 10
3.2 Functional specification ...................................................................................................... 12
3.3 Estimation techniques ........................................................................................................ 15
4 Data and descriptive statistics ............................................................................................. 18
5 Results................................................................................................................................... 20
5.1 Benchmark estimates ......................................................................................................... 20
5.2 Estimates across industries and groups of workers............................................................. 23
References .................................................................................................................................. 30
Tables.......................................................................................................................................... 38
Appendix ..................................................................................................................................... 46
National Bank of Belgium - Working papers series ....................................................................... 61
1. Introduction
A vast literature examines the impact of education on wages (Ashenfelter et al., 1999; Card,
1999). Empirical results typically document a substantial wage gap between high- and low-
educated workers. Moreover, they show that this gap has been increasing over the last few
decades (Harmon et al., 2003; Picketty and Saez, 2003). Diversity in individual, job and/or
firm characteristics accounts for a significant fraction of the educational wage differential.
However, a substantial wage premium is still recorded for more highly educated workers after
controlling for observable heterogeneity and other econometric issues such as endogeneity
(Chevalier, 2011; Dickson and Harmon, 2011; Devereux and Fan, 2011).
Human capital theory (Becker, 1964) posits that: i) education develops skills that make
workers more productive, and ii) wage differentials reflect differences in productivity.
Accordingly, more highly educated workers would earn higher wages ceteris paribus simply
because they are more productive than their less educated counterparts. This explanation of
pay inequality has been challenged by empirical and theoretical work on labour markets:
“Sociologists have long been dissatisfied with [neoclassical and human capital theory],
particularly with their silence about the many forces that generate a mismatch between
marginal productivity or skills and wages in the ever-present short run” (Weeden, 2002: 71).
Indeed, a range of labour market theories hypothesize sources of inequality other than labour
productivity, such as collective action, labour market institutions or the use of power and
authority to obtain economic advantages (Berg, 1981; Kalleberg and Sørensen, 1979).
Although each of these theories on inequality focuses on distinct social processes, they appear
to have in common that they associate labour market inequality at least implicitly to an
element of ‘unearned’, or ‘unjust’ allocation of resources to dominant groups. On the other
hand, economists have also developed explanations of differences between productivity and
wages without abandoning the assumptions of individual rationality and profit-maximizing
firms. In this literature, productivity-wage gaps are thought to be rational strategies of firms to
address a range of market distortions (Lazear and Shaw, 2007).
The abundance of theories on education-driven productivity-wage gaps is not matched by
a corresponding body of empirical literature. Indeed, very few studies have actually examined
how the composition of the labour force affects firm productivity (Galindo-Rueda and Haskel,
2005; Haegeland and Klette, 1999; Haltiwanger et al., 1999; Lebedenski and Vandenberghe,
1
2014; Moretti, 2004).1 Moreover, the evidence on whether education raises productivity and
wages equally is very thin, inconclusive and subject to various possible econometric biases.
The endogeneity of education and the presence of firm-level time-invariant unobserved
heterogeneity are for instance seldom controlled for. Most estimates regarding the education-
productivity nexus and the existence of possible education-driven productivity-wage gaps are
thus potentially inconsistent. What’s more, to our knowledge, no study has tried to assess
whether the education-productivity-wage nexus varies across working environments. Yet,
numerous arguments (notably related to working conditions, adjustment costs, information
asymmetries, social norms or labour market regulations) suggest that this is probably the case.
The aim of this paper is threefold. First, we put the relationship between the educational
composition of the workforce and firm productivity to an updated test, using detailed Belgian
linked employer-employee panel data for the years 1999-2010. These data offer several
advantages. The panel covers a large part of the private sector, provides accurate information
on average productivity (i.e. the average value added per hour worked) and allows us to
control for a wide range of worker and firm characteristics. It also enables us to address
important methodological issues, often neglected in other studies, such as firm-level time-
invariant heterogeneity, endogeneity and state dependence of firm productivity. To do so, we
rely on both the generalized method of moments (GMM) and the Levinsohn and Petrin (2003)
estimators. A second objective is to examine whether education increases productivity and
wage costs equally (i.e. to extend the analysis to productivity-wage gaps). Finally, our study
aims to provide first evidence on whether the alignment between productivity and wage costs
across educational levels depends on the characteristics of workers (i.e. their age and sex) and
the sector in which they work (i.e. industry vs. services).
Research questions addressed in this paper are very important for economic policy. The
labour market situation of low-educated workers is particularly critical in most industrialised
countries. This is also the case in Belgium (Eurostat, 2014). The unemployment rate in
Belgium among the low-educated (i.e. people with less than upper secondary education) is
three times larger than that among tertiary educated workers (16 vs. 4.9 percent in 2013). As
regards the employment rate, it is found to be more than 40 percentage points lower among
the former group of workers (37.5 versus 81 percent in 2013). These observations hold for
1 At the macro-level, some studies suggest that education fosters output per worker and income per capita (Krueger and Lindahl, 2001; Mankiw et al., 1992). However, the use of cross-country panel data over long periods makes the identification of the causal relationship between education and productivity difficult. In particular, controlling for reverse causality (i.e. for the fact that countries with higher growth rates invest more in education) remains challenging (Lebedinski and Vandenberghe, 2014; Sianesi and Van Reenen, 2003).
2

both genders. Yet, differences in employment rates across educational levels are sharper
among women than men. Less than 30 percent of low-educated women aged between 15 and
64 are actually employed in Belgium (compared to around 44 percent of low-educated men).
Low-educated people are also particularly at risk on the labour market when they are young.
The unemployment rate among the low-educated aged 15-24 is about 3 times higher than
among their older (i.e. 25-64 years old) low-educated counterparts (39.8 versus 13.5 percent
in 2013).2 Various theories, including skilled-biased technological change and competition
from low-wage countries, have been put forward to explain this phenomenon (Acemoglu,
2002; Bernard et al., 2006; Biscourp and Kramarz, 2007; Hertveldt and Michel, 2013). A key
argument here is that low-educated workers are too costly with respect to their added value.
As a result, firms are willing to substitute low-educated workers by capital, to outsource part
of their activities to cheap-labour countries and (especially in the case of excess labour
supply) to hire more educated workers as their productivity to wage cost ratio is more
favourable.
Despite the fact that alternative theories (based on tournaments, internal decision-making
processes of organisations, monopsony or monitoring issues) suggest that low-educated
workers might actually not be too costly relative to their marginal products (Lazear and
Rosen, 1981; Bebchuk and Fried, 2003; Manning, 2003; Osterman et al., 2009), most policies
aiming to increase the employability of low-educated people in the OECD area either try to
foster the latters’ productivity (e.g. through specific training programmes) and/or to decrease
their wage cost (e.g. through reduced payroll taxes). Belgium is no exception in this respect.
Indeed, it is among the highest spenders for active labour market policies in Europe (Eurostat,
2010) and reductions in employers’ and personnel social security contributions (notably
targeted on the low-skilled) represent more than 1.5 percent of GDP (Belgian federal
government, 2012). While these policies are quite standard to improve the labour market
prospects of low-educated people, their effectiveness remains highly controversial (Heckman
et al., 1999; Kluwe and Schmidt, 2002; Burggraeve and du Caju, 2003; Cockx et al., 2004;
Dagsvik et al., 2011; Cahuc and Carcillo, 2012; Huttunen et al., 2013; Konings and
Vanormelingen, 2014). This is notably due to the fact that the relationship between education,
wage costs and productivity is still not well understood. In particular, it remains unclear
whether education-induced productivity gains are well aligned with corresponding wage cost 2 Figures for the OECD area show a very similar pattern (OECD, 2013). For example, the unemployment rate among the low-educated is more than two times bigger than among tertiary educated workers (i.e. 12.6 and 4.8 percent in 2012). Moreover, the employment rate is almost 30 percentage points higher among tertiary educated people than among low-educated ones (i.e. 83 and 55.5 percent in 2012).
3

differentials. The objective of this paper is to improve our understanding of these issues with
a specific focus on workers’ age, sex and sectoral affiliation.
The remainder of this paper is organised as follows. A review of the literature regarding
the relationship between education, wages and productivity is presented in the next section.
The following two sections, respectively, describe our model, methodology and data set. We
then analyse the impact of the composition of the workforce in term of education on
productivity, wages, and productivity-wage gaps across working environments and end with a
discussion of the results and a conclusion.
2. Review of the literature
2.1. Theoretical background
Many of the theories predicting productivity-wage gaps are either formulated without
referring to specific categories of workers or focus on gaps based on categories other than
education, like age or gender. In this section, we show how some of the more prominent
theories on mismatches between productivity and wages can be adapted to account for
workers’ educational heterogeneity.
Compensating wage differentials and adjustment costs
A first set of explanations for the existence of a relationship between education, wages and
productivity refers to compensating wage differential theories, i.e. to human capital and the
hedonic theory of wages.
According to human capital theory (Becker, 1964), education (as well as training and
work experience) develops skills that make workers more productive. Moreover, given that
workers are assumed to be paid at their marginal productivity, this theory suggests that
education-driven productivity gains will be aligned to education-induced wage differentials.
Put differently, human capital theory predicts that firm’s profitability is on average not
affected by the educational composition of the labour force.
Heterogeneity in working conditions is also likely to influence the relationship between
education, wages and productivity. Indeed, the hedonic theory of wages (Rosen, 1974)
highlights that perfect competition mechanisms provide reimbursement for workers
occupying strenuous jobs (e.g. dangerous jobs, jobs with a heavy workload, an unpleasant
4

environment or a low social status). The underlying intuition is that employers have to
compensate a greater harshness by a higher wage so that workers’ utility remains unchanged
and that the hardest jobs get filled. Workers with identical productivity may thus earn
different wages due to heterogeneity in working conditions. Given that low-educated workers
are more likely to hold jobs with inferior working conditions and greater insecurity, the
hedonic theory of wages suggests that the latter, at given productivity, should be paid more
than their high-educated counterparts. If diversity in working conditions is not (or
imperfectly) controlled for, empirical results will indicate that low-educated workers are paid
above their marginal productivity and that firm profits increase with the share of high-
educated workers.
Labour adjustment costs (i.e. hiring and separation costs) can also affect the education-
productivity-pay nexus. In the dynamic labour demand model, adjustment costs are taken into
account and amortized over a worker’s average length of service within a firm (Oi, 1962).
Workers are thus not paid at their current marginal productivity. Indeed, the total present
value of wages is now equal to the difference between the total present value of marginal
productivities and adjustment costs. Given that adjustment costs are generally lower for low-
educated workers (Dhyne and Mahy, 2012), this model predicts that the gap between
productivity and wages is bigger for high-educated workers.
Information asymmetry
For employers willing to manage asymmetric information through incentive practices,
tournament theory (Lazear and Rosen, 1981) suggests the implementation of a performance-
related pay system, where the prize (a promotion or a bonus) is attributed to the most
productive worker. This system aims to trigger competition and to encourage workers to
provide sustained effort. It generates a convex relationship between a worker’s pay and his
position in the firm’s hierarchy, to the extent that workers at the top of the hierarchy receive
wages beyond their marginal products. According to tournament theory, “the president of a
corporation is viewed as the winner of a contest in which he receives the higher prize. His
wage is settled on not necessarily because it reflects his current productivity as president, but
rather because it induces that individual and all other individuals to perform appropriately
when they are in more junior positions” (Lazear and Rosen, 1981: 847). Given that low-
educated workers are generally found at the bottom of corporate hierarchies, tournament
theory suggests that firm-level profits should increase with the share of low-educated workers.
5
Another strand of the literature uses more sophisticated assumptions about the individual
utility function of the worker. Hamermesh (1975), for instance, developed a theory in which
utility depends not only on one’s own, but also on other people’s wages. As a consequence,
high wage inequality could lead to lower utility and lower effort. Workers may perceive wage
inequality as ‘unfair’ and decrease their effort accordingly (Akerlof and Yellen, 1988). Hence,
there is an efficiency argument in paying high-productivity jobs in a firm below and low-
productivity jobs above their marginal products so as to compress the overall wage structure
(Mahy et al., 2011a,b). If one assumes that low-educated workers are less productive than
their high-educated counterparts, this theory suggests that firm-level profits decrease with the
share of low-educated workers.
Social norms, political processes and labour market regulations
The literature on social norms and remuneration has also some relatively straightforward
implications for the over- or under-payment of low-educated workers with respect to
productivity. Skott (2005) treats wage norms as endogenous, with past events shaping what
are considered to be ‘fair’ wages. This creates a hysteresis of the wage structure, slow
adjustment to productivity shocks and therefore potential deviations from productivity-based
pay. Similarly, Doeringer and Piore (1985) view the related concepts of ‘customs’ and
‘habits’ as important factors in the determination of employment rules in their model of
internal labour markets. They argue that beside efficiency considerations (employers’
interests) and demands for stability and job security (employees’ interests), strong customs
render changes in pay rules difficult. Given that technological change over the past decades
appears to be skill/task biased and that low-educated workers are typically less skilled and
often doing more routine tasks (Autor et al., 1998; Acemoglu, 2002; Goos et al., 2014), the
hysteresis in social norms could lead to the overpayment of low-educated workers whose
productivity might have been negatively affected by technological change, and the
underpayment of high-educated workers whose productivity might have increased.
Many institutional economists focus on collective processes that complement the analysis
of market forces. Osterman et al. (2009: 705) affirm that employment rules and systems “are
the result of a political process in which competing objectives and rationalities play out a
contest”. The educational wage structure could thus to some extent reflect the competing
objectives of educational groups and their respective influence on internal decision-making
processes of organisations. For instance, it seems plausible that any rent generated by the firm
6

is unequally distributed among educational groups reflecting informational and power
asymmetries between workers of different educational backgrounds (and occupational
groups). There is a parallel between this idea and the standard analysis of principal agent
problems: wages of occupations that cannot be controlled effectively by their principals (and
that are generally occupied by more educated workers) might be higher than predicted by
standard competitive theory (Bebchuk and Fried, 2003). Monitoring issues and political
processes thus contribute to explain why high-educated workers may be overpaid relative to
their respective marginal products.
Education-induced productivity-pay gaps may also result from labour market regulations,
such as minimum wages, collective bargaining or unemployment benefits. Minimum wages’
first aim is to set a floor at the bottom of the wage distribution in order to protect and sustain
the earnings of the most vulnerable workers (notably the least educated ones). More precisely,
they affect wage inequalities by pushing the earnings of low-wage workers upwards and by
generating spillover effects associated with job losses and ‘wave effects’ on earnings above
the prevailing minimum (Butcher et al., 2012). Minimum wages may thus lead to the relative
overpayment of low-educated workers (Cardoso, 2010). A negative association between the
productivity-pay gap (i.e. profits) and the share of low-educated workers could also derive
from collective bargaining. In most advanced economies, high-educated workers are less
likely to be affiliated to a trade union than their low-educated counterparts (Riley, 1997).
Trade unions may thus be more willing to defend the advantages of the latter, so that wage
claims (profits) will be bigger (smaller) in firms employing more low-educated workers. Yet,
collective bargaining may also contribute to protect workers against the monopsonistic power
of firms (Manning, 2003). Workers with little education are generally quite ‘fragile’ on the
labour market. As their labour supply curve is on average more inelastic (e.g. due to smaller
geographical and occupational mobility), they are more likely to accept harder jobs and to be
paid below their marginal productivity. Accordingly, trade unions and collective bargaining
(notably on minimum wages) may enable low-educated workers to be paid in line with their
marginal products, i.e. not to be under-paid. Other labour market regulations, such as
unemployment benefits, may also affect the productivity-pay gap across educational levels.
Unemployment benefits are indeed likely to increase the reservation wage, especially for
workers at the bottom of the earnings distribution, and to exert upward pressure on low wages
(Cahuc and Zylberberg, 2004). The latter may thus also generate a wage-compression effect.
However, in case of monopsony, they can also eliminate or at least reduce wage
discrimination against the most vulnerable workers.
7

2.2. Empirical background
The private returns of schooling have been investigated in hundreds of papers. Empirical
evidence, based on Mincer (1974) type earnings equations, consistently highlight that more
educated workers earn higher wages. Estimates of the elasticity between education and wages
depend on the data used, the underlying assumptions and the estimation techniques (Dickson
and Harmon, 2011). Methodological debates are thus still vivid. This is especially due to the
fact that education is a choice variable that depends on other factors (such as family
background, individual history or innate ability) that affect earnings (Ashenfelter et al., 1999).
Education is thus likely to be endogenous and controlling for this issue often requires
identification assumptions that are difficult to verify. According to Card’s (1999) survey of
the literature, the effect of an additional year of schooling on a worker’s wage stands at
around 10 percent. Interestingly, he also shows that (differenced) IV estimates are not that
different from those obtained with simple cross-sectional regressions. The meta-analysis
performed by Ashenfelter et al. (1999) leads to a similar conclusion, namely that variability in
estimates due to differences in estimation methods are relatively small, although sometimes
statistically significant. In contrast, Harmon et al. (2003) find that OLS and IV estimates vary
substantially when based on data from natural experiments. Yet, returns to education for sub-
groups of workers affected by treatments (e.g. changes in compulsory schooling laws) may
not directly be generalized to all individuals. To sum up, there is little controversy in the
principle that schooling investments prompt workers’ wages. Moreover, although the exact
magnitude of the return to education is still debated, it is generally admitted that the latter has
been increasing since the 1970s and is quite large relative to other types of investments
(Harmon et al., 2003; Picketty and Saez, 2003; Dickson and Harmon, 2011).
In line with human capital theory (Becker, 1964), the education-induced wage premium
is often interpreted as evidence for the fact that more educated workers are more productive.
The assumption is that workers are paid at their marginal productivity and that education
improves workers’ skills/productivity. Yet, this interpretation should be done with care.
Indeed, non-competitive models of wage determination (including collective bargaining, rent-
sharing, discrimination or monopsony) also find support in the empirical literature (e.g.
Bayard et al., 2003; Manning, 2003; Mortensen, 2003; Rusinek and Rycx, 2011). Hence,
equally productive workers do not always receive the same wages. Moreover, a surprisingly
small number of papers have examined how the educational composition of the labour force
affects productivity at the firm-level (Galindo-Rueda and Haskel, 2005; Haegeland and
8

Klette, 1999; Haltiwanger et al., 1999; Ilmakunnas and Maliranta, 2005; Lebedenski and
Vandenberghe, 2014; Moretti, 2004; Van Biesebroeck, 2011).3 Much more effort has actually
been devoted to understand the productivity consequences of other workforce characteristics
such as age or gender (Bartolucci, 2013; Cardoso et al., 2011; Cataldi et al., 2011, 2012;
Garnero et al., 2014a; Hellerstein et al., 1999a; Lallemand and Rycx, 2009; van Ours and
Stoeldraijer, 2011; Vandenberghe, 2011, 2013). Nevertheless, empirical studies (Galindo-
Rueda and Haskel, 2005; Haegeland and Klette, 1999; Haltiwanger et al., 1999b; Lebedenski
and Vandenberghe, 2014; Moretti, 2004) show that firms employing a larger fraction of high-
educated workers are more productive. They also often suggest that education-induced
productivity premia are relatively well aligned with earnings or wage cost differentials.
However, some authors conclude that high-educated workers are paid below their marginal
productivity (Hellerstein and Neumark, 2004; Ilmakunnas and Maliranta, 2005), while others
suggest the reverse outcome (Van Biesebroeck, 2011).
This being said, most studies should be interpreted with great caution as they generally
neither control for firm-level invariant unobserved heterogeneity nor for the endogeneity of
education. Put differently, given that most estimates are potentially inconsistent, it is still
quite difficult to draw clear conclusions. Moreover, to our knowledge, no study has tried to
assess whether the education-productivity-wage nexus varies across working environments.
Yet, theoretical arguments reviewed in the previous section of this paper suggest that this is
likely to be the case. Indeed, factors potentially leading to education-driven productivity-wage
gaps (e.g. compensating wage differentials, adjustment costs, information asymmetries, social
norms or labour market regulations) may be more or less relevant depending on the
characteristics of workers (e.g. their age and sex) and the sectors in which they work (e.g.
industry or services). As an example, it could be noted that labour market regulations (such as
minimum wages or unemployment benefits) essentially affect the lower end of the earnings
distribution. As a result, these regulations are more likely to lead to a ‘wage-compression
effect’ (i.e. a distribution of wage costs by educational groups that is more compressed than
the education-productivity profile)4 among workers earning lower wages, e.g. younger
workers (Cardoso, 2010). Along the same lines, given that trade unions are generally found to
be stronger in the manufacturing industry than in private sector services, a stronger ‘wage-
compression effect’ could be expected in the former sector. As regards workers’ sex, given
3 See footnote 1. 4 This corresponds to a situation in which low-educated (high-educated) workers are paid above (below) their marginal productivity.
9

that upper management jobs are mainly occupied by men, tournament theory (Lazear and
Rosen, 1981) suggests that high-educated men have a greater likelihood to be paid above their
marginal productivity. However, given that adjustment costs generally increase with workers’
wages and that women typically earn less than men, the reverse result can also be
hypothesized. These examples, among others, suggest that workers’ age, sex and sectoral
affiliation may have a substantial effect on the (mis)alignment of wages and productivity
across educational groups. They also illustrate that theoretical predictions are numerous and
very inconclusive.
Our paper contributes to this literature by investigating how education affects hourly
productivity, wage costs and the productivity-wage gap (i.e. profits) at the firm level.
Moreover, we provide first evidence on how the education-productivity-wage nexus varies
according to workers’ age, sex and sectoral affiliation. Our empirical approach relies on
longitudinal linked employer-employee data from the Belgian private sector, uses accurate
information on average productivity and wage costs within firms (i.e. the average added value
per worker and the mean hourly wage cost), controls for a large set of covariates and
implements both dynamic system GMM and LP estimation techniques. These techniques
control for a range of measurement issues that considerably improve the reliability of
estimation results compared to existing research. For instance, the consequential issue of
simultaneity, firm fixed effects and state dependence of firm productivity/pay/profits is rarely
addressed in previous studies.5
3. Set-up of the analysis
3.1. Model
The test developed in this article is based on the estimation of a value added function and a
wage cost equation at the firm level. The value added function yields parameter estimates for
the average marginal products of workers with different educational levels, while the wage
equation estimates the respective impact of each educational group on the average wage bill
paid by the firm. Given that both equations are estimated with the same set of firms,
educational categories and covariates, the parameters for marginal products and wages can be
compared so that conclusions on educational productivity-wage gaps can be drawn. This
5 For more details see section 3.3.
10

technique was pioneered by Hellerstein et al. (1999a,b) and refined/applied by Cardoso et al.
(2011), van Ours and Stoeldraijer (2011), Mahlmberg et al. (2013) and Vandenberghe (2013)
among others.
Equation (1) is a function linking a range of inputs of firm i to its value added Yi:
),( iii QLKFY (1)
where Ki represents the firm's capital stock and QLi is a quality of labour term. The latter
allows introducing a heterogeneous labour force into the value added function.
There is an abundant econometric literature on the estimation of relationships as the one
depicted in Equation (1). In an attempt to reflect more accurately the production process
inside the firm, specialists in the field have proposed specifications allowing e.g. for
production inefficiencies or different elasticities of substitution between production factors.
Since our focus is not on the production process itself, but rather on the comparison between
productivity and wage costs for a set of workers’ educational levels, we use a standard Cobb-
Douglas version of Equation (1), with substitution elasticities equal to one and the assumption
that firms operate at the efficiency frontier. This restriction is standard in the corresponding
literature and appears to be unproblematic as previous firm-level studies have shown that
productivity coefficients obtained with a Cobb-Douglas production function are robust to
other functional specifications (see e.g. Hellerstein and Neumark, 2004). We thus rewrite
equation (1) as follows:
)log()log()log()log( iiii QLKAY (2)
where Ai is a constant. The parameters and are the respective marginal productivities of
each input factor. QLi can be written as:
i
jiJ
jjiii L
LLQL ,
}0{, )1(1 (3)
where Li is the total labour force of the firm i and Li,j/Li the proportion of workers with
educational level j in the total labour force. Substituting Equation (3) into (2) allows for
different marginal productivities for each of the J educational categories. If for educational
11

group j the parameter j is bigger (smaller) than unity, then this group has a higher (lower)
marginal impact on productivity than the reference educational category. If all groups have
’s equal to one, then Equation (3) becomes QLi = Li , i.e. labour is perfectly homogeneous.
As for the wage cost equation, it can be shown that the average wage bill of firm i can be
expressed as:
J
j i
ji
i
jii
J
j i
ji
i
jiiJ
jji
J
jjiji
iL
Lww
wL
Lww
wL
Lww
}0{
,
0,
,0,
0
,
0,
,0,
0,
0,,
11 (4)
where wi,j is the average wage bill of Li,j and j = 0 the reference educational category with the
wage bill wi,0. Similar to the interpretation of in the production function, if the ratio wj/w0 is
bigger (smaller) than unity, then the marginal impact of educational group j on the average
wage bill of the firm is higher (lower) compared to the reference educational category.
Comparing marginal productivities and wage cost differentials across educational groups
boils down to comparing j with the corresponding wj/w0.
3.2. Functional specification
We now move from the general form of the value added and wage cost equations (i.e.
Equations (2) and (4)) to a set of functional specifications.
The model formed by Equations (5) and (6) is our baseline specification and similar to
the model in Hellerstein et al. (1999a). The j in Equation (5) is the relative marginal impact
of educational group j on the average productivity at firm level (note that j corresponds to j -
1 in Equation (3)). In Equation (6), j* is the relative marginal impact of educational group j
on the firm’s average wage bill ( j* corresponds to wj/w0 - 1 in Equation (4)). The terms i,t
and *i,t represent the error terms.
titi
J
jtijjti XEducationHoursAddedValue ,,
}0{,,,ln (5)
*,,
*
}0{,,
**,ln titi
J
jtijjti XEducationHoursCostWage (6)
12

The dependent variable in equation (5) is firm j's hourly value added, obtained by
dividing the total value added (at factor costs) of firm j in period t by the total number of
hours worked (taking into account paid overtime hours) that have been declared for the same
period. The dependent variable in equation (6) is firm j's average wage bill (including payroll
taxes and variable pay components, such as wage premia for overtime, weekend or night
work, performance bonuses and other premia). It is obtained by dividing the firm's total wage
cost by the total number of hours worked. Hence, the dependent variables in the estimated
equations are firm averages of value added and wage costs (net of social security payroll tax
cuts) on an hourly basis.
The main independent variables are the shares of hours worked by each educational
category in total hours worked, Educationj,i,t. This is a better employment indicator than the
number of employees in each category since it takes into account educational differences in
working time. We split the employees of a firm into three educational groups (i.e. at most
lower secondary education, at most higher secondary education, and tertiary education,
respectively) and consider the share of workers with at most lower secondary education as our
reference category. As a robustness test, we also consider more detailed educational groups
including up to seven categories.
In addition to the shares of workers by educational level in total hours worked, we also
include the vector Xi,t.. It contains a set of variables controlling for observable worker, job and
firm characteristics. More precisely, it includes the share of the workforce within a firm that:
(i) has at least 10 years of tenure, (ii) is younger than 30 and older than 49 years, respectively,
(iii) is female, (iv) works part-time, (v) occupies blue-collar jobs, (vi) has a fixed-term
employment contract, and (vi) is apprentice or under contract with a temporary employment
agency. Xi,t also comprises the natural logarithm of firm size (i.e. the number of full-time
equivalent workers)6, the natural logarithm of capital stock per worker7, the level of collective
wage bargaining (1 dummy), sectoral affiliation (8 dummies), the region where the firm is
located (2 dummies), and 11 year dummies.8
6 As highlighted in section 4, information on firm size is taken from the ‘Structure of Earnings Survey’, while the value added, wage cost and profit per hour variables are constructed from the ‘Structure of Business Survey’. This design eliminates the spurious relation issue that might have arisen due to common measurement error, i.e. because the number of hours appears (in the denominator) on the left-hand side of Equations (5) to (8) and the number of full-time equivalent employees (in the numerator) on the right-hand side. 7 This is estimated through the ‘perpetual inventory method’ (or PIM, see e.g. OECD (2009) for more details). The PIM incorporates the idea that the capital stock results from investment flows and corrects for capital depreciation and efficiency losses. Following standard practice, we assume a 5 percent annual rate of depreciation. 8 All independent variables are measured in terms of shares in total work hours. For instance, the fraction of part-time workers is computed on the basis of the proportion of hours worked by employees working less than 30
13

Estimating equations (5) and (6) allows gauging the effect of education on firm
productivity and wage costs, but it does not allow testing directly whether the difference
between the added value and wage cost coefficients for a given educational group is
statistically significant. A simple method to obtain a test for the significance of productivity-
wage gaps has been proposed by van Ours and Stoeldraijer (2011). This method boils down to
estimating Equation (7):
**,,
**
}0{,,
****,, lnln titi
J
jtijjtiti XEducationHoursCostWageHoursAddedValue (7)
in which the gap between firm i’s log hourly value added and log hourly wage costs (i.e. the
log of the ratio between value added and wage costs) is regressed on the same set of
explanatory variables as in equations (5) and (6). This produces coefficients for the
educational variables and directly measures the size and significance of their respective
productivity-pay gaps.
As a robustness test, we also adopted a more direct approach to examine whether
potential education-induced productivity gains are aligned with wage cost differentials. To do
so, we estimate Equation (8):
***,,
***
}0{,,
******,ln titi
J
jtijjti XEducationHoursprofitGross (8)
in which firm i’s log gross operating surplus per hour, i.e. the log of the difference between
the hourly value added and hourly wage costs, is regressed on the same covariates as in
equation (7). This alternative approach measures the sensitivity of profits (rather than of the
ratio between value added and wage costs) to shares of workers at different educational levels.
Estimates of equations (7) and (8) should a priori not lead to very different conclusions.
However, given that both approaches have been used in the literature (Garnero et al., 2014b;
Pfeifer and Wagner, 2012; Syverson, 2011) and that no one approach has been demonstrated
to be superior, results of both equations will be compared and interpreted.
hours per week over the total amount of hours worked with the firm. The control variables that have been included in our regressions are in line with extant literature (for a review of the set of covariates that should be included in this type of analysis see e.g. Göbel and Zwick, 2009). As highlighted by Mahlmberg et al. (2013: 10): ‘by including a rather broad set of independent variables, we account for heterogeneity among firms, in order to mitigate the bias that could be caused by omitted variables’.
14

3.3. Estimation techniques
Equations (5) to (8), have been estimated with four different methods: pooled ordinary least
squares (OLS), a fixed-effects (FE) model, the generalized method of moments (GMM)
estimator developed by Arellano and Bover (1995) and Blundell and Bond (1998), and a more
structural approach suggested by Levinsohn and Petrin (2003, hereafter LP). The OLS
estimator is based on the cross-section variability between firms and the longitudinal
variability within firms over time. However, this OLS estimator suffers from a potential
heterogeneity bias because firm productivity can be related to firm-specific, time-invariant
characteristics that are not measured in micro-level surveys (e.g. an advantageous location,
firm-specific assets such as patent ownership, or other firm idiosyncrasies).
One way to remove unobserved firm characteristics that remain unchanged during the
observation period is to estimate a FE model. However, neither pooled OLS nor the FE
estimator address the potential endogeneity of our explanatory variables.9 Yet, as highlighted
by Gautier et al. (2002: 523), “employers might exploit cyclical downturns to improve the
average skill level of their work force”. To put it differently, there might be some cyclical
‘crowding out’, namely a process by which during recessions – because of excess labour
supply – highly educated workers take the jobs that could be occupied by less educated ones.
This assumption, supported empirically for certain countries including Belgium (Cockx and
Dejemeppe, 2002; Dolado et al., 2000), suggests that the share of more educated workers
within firms may increase as a result of lower labour productivity (and vice versa). To control
for this endogeneity issue, in addition to temporal persistence in the dependent variable (firm
productivity, wage costs or profits) and firm fixed unobserved heterogeneity, we estimate
equations (5) to (8) with the dynamic system GMM (GMM-SYS) and LP estimators,
respectively.
The GMM-SYS approach implies to simultaneously estimate a system of two equations
(respectively in level and in first differences) and rely on internal instruments to control for
endogeneity. More precisely, educational variables10 are instrumented by their lagged levels
in the differenced equation and by their lagged differences in the level equation.11 The
implicit assumption is that changes (the level) in (of) the dependent variable – productivity, 9 Expected biases associated with OLS and the relatively poor performance and shortcomings of the FE estimator in the context of firm-level productivity regressions are reviewed in Van Beveren (2012). 10 By ‘educational variables’, we mean shares of workers by educational level and other input factors. 11 Bond and Söderbom (2005) provide a review of the literature regarding the identification of production functions. The authors notably highlight that adjustment costs of labour and capital can justify the use of lagged values (of endogenous variables) as instruments.
15

salary costs or profits – in one period, although possibly correlated with contemporaneous
variations (levels) in (of) educational variables, are uncorrelated with lagged levels
(differences) of the latter. Moreover, changes (levels) in (of) educational variables are
assumed to be reasonably correlated to their past levels (changes).
One advantage of the system GMM is that time-invariant explanatory variables can be
included among the regressors, while they typically disappear in difference GMM.12
Asymptotically, the inclusion of these variables does not affect the estimates of the other
regressors because instruments in the level equation (i.e. lagged differences of educational
variables) are expected to be orthogonal to all time-invariant variables (Roodman, 2009). To
examine the validity of our estimates, we apply Hansen’s (1982) and Arellano-Bond’s (1991)
tests. The first is a test for overidentification which allows to test the validity of the
instruments. The second is a test for autocorrelation, where the null hypothesis assumes no
second order autocorrelation in the first differenced errors. The non-rejection of the two tests
is required in order to assume that our estimates are reliable. In order to be as parsimonious as
possible, we choose the model with the minimum number of lags that passes both tests.
The adoption of a dynamic GMM specification aims to account for the persistency in
firm-level profits, wage costs and productivity.13 It is also likely to improve the identification
of the parameters of interest (even though the coefficient on the lagged dependent variable is
not a central issue in the analysis). Indeed, as illustrated by Bond (2002), the use of a dynamic
12 It is standard in the literature to use dynamic panel data methods such as those proposed by Arellano and Bond (1991) to overcome key econometric issues, in particular lag-dependency, firm fixed effects and endogenity of input shares. Accordingly, many recent papers rely on dynamic GMM methods to estimate the impact of workforce and job characteristics (e.g. age, educational mismatch and employment contracts) on productivity and/or labour costs (see e.g. Göbel and Zwick, 2012, 2013; Kampelman and Rycx, 2012a; Mahlberg et al., 2013; Mahy et al., 2015; Nielen and Schiersch, 2012, 2014). 13 From a theoretical perspective, competitive forces should eliminate abnormal profits (McMillan and Wohar, 2011). The intuition is as follows: if a firm makes excess profits, a competitor should enter the market and offer the same good or service at a lower price until profits return to their competitive level. Likewise, firms making profits below the competitive rate will disappear as investors move to markets that are more profitable or will take actions to increase their profitability. This said, a large literature, dating back to Shepherd (1975) and Mueller (1977) and taken further by Geroski and Jacquemin (1988) and McGahan and Porter (1999) and Bou and Satorra (2007) among others, suggests that profit persistence is large and inconsistent with the competitive framework. More recent papers further show that firms with above (below) normal profits have high (low) barriers to entry and exit (McMillan and Wohar, 2011). In light of this so-called ‘persistence of profits literature’, there are strong arguments for modelling profits in a dynamic way, i.e. for including the lagged dependent variable among covariates in Equations (7) and (8). The assumption of persistent productivity both at the industry and firm level also finds some support in the literature (see e.g. Baily et al., 1992; Bartelsman and Dhrymes, 1988; Bartelsman and Doms, 2000). Researchers ‘documented, virtually without exception, enormous and persistent measured productivity differences across producers, even within narrowly defined industries’ (Syverson, 2011: 326). Large parts of these productivity differences are still hard to explain. This implies that productivity at time t in a given industry or firm is likely to depend significantly on its lagged value. The persistency of wage costs is also highlighted in the literature (see e.g. du Caju et al., 2011, 2012; Fuss and Wintr, 2009; Heckel et al., 2008; Messina et al., 2010). Wage stickiness is notably the outcome of labour market institutions, adjustment costs and efficiency wages’ motives.
16

model is necessary to obtain consistent results when estimating a production function with
serially correlated productivity shocks and explanatory variables that are correlated to these
shocks. While serial correlation of productivity shocks may arise if for instance the effects of
demand shocks are only partially captured by the industry-specific control variables
(Hempell, 2005), the responsiveness of input factors to productivity shocks may be explained
by the above-mentioned endogeneity issue. Interestingly, the inclusion of the lagged
dependent variable in the OLS, fixed-effects and system GMM specifications also provides an
ad hoc test for the appropriateness of the latter. As outlined by Roodman (2009), this test
consists in checking whether or not the regression coefficient on the lagged dependent
variable obtained with system GMM falls between the OLS and fixed effects estimates.
As an alternative to the GMM-SYS method, Olley and Pakes (1996) have developed a
consistent semi-parametric estimator. This estimator, particularly well-suited for panels with
small t and big N, controls for endogeneity by using the employer’s investment decision to
proxy for unobserved productivity shocks. The intuition is that firms respond to time-varying
productivity shocks observed by managers (and not by econometricians) through the
adjustment of their investments. Put differently, profit-maximizing firms react to positive
(negative) productivity shocks by increasing (decreasing) their output, which requires more
(less) investments (or intermediate inputs, see below). The OP estimation algorithm relies on
the assumptions that there is only one unobserved state variable at the firm level (i.e. its
productivity) and that investments increase strictly with productivity (conditional on the
values of all state variables). This monotonicity condition implies that any observation with
zero investment has to be dropped from the data, which generally leads to a sharp decrease in
sample size and is hence likely to create a sample selection issue. To avoid this drawback,
Levinsohn and Petrin (2003) use intermediate inputs (i.e. inputs such as energy, raw materials,
semi-finished goods and services that are typically subtracted from gross output to obtain
added value) rather than investments as a proxy for productivity shocks. Given that firms
typically report positive values for intermediate inputs each year, most observations can be
kept with the LP approach. An additional argument for using intermediate inputs rather than
investments is that the former may adjust more smoothly to the productivity term than the
latter, especially if adjustment costs are an important issue. For instance, “if adjustment costs
lead to kink points in the investment demand function, plants may not respond fully to
productivity shocks, and some correlation between the regressors and the error term can
remain” (Petrin et al., 2004: 114). Intermediate inputs would thus provide a better proxy for
unobserved productivity shocks. In the basic LP model, labour is a fully variable input,
17
whereas capital is a fixed input. Given our focus, the variable inputs in our setup include the
first moments of workforce characteristics. Assuming that intermediate inputs depend on
capital and unobservable productivity shocks, this relationship can be solved for the
productivity term (Ilmakunnas and Ilmakunnas, 2011). When relying on the LP estimation
algorithm, standard errors are computed using a bootstrap approach taking into account the
panel structure of the data (Petrin et al., 2004).
4. Data and descriptive statistics
We use a combination of two large datasets covering the years 1999-2010. The first is the
‘Structure of Earnings Survey’ (SES), carried out by Statistics Belgium. It covers all firms
that are operating in Belgium, employ more than 10 workers and have economic activities
within sections C to K of the NACE Rev. 1 nomenclature.14 This survey gathers information
on firms’ characteristics (e.g. sector, region where the firm is located, number of workers,
level of collective wage bargaining) as well as information on workers’ characteristics (e.g.
age, education, tenure, paid hours, sex, occupation, employment contract). However, the SES
does not provide any financial information. It has thus been merged with a firm-level survey,
namely the ‘Structure of Business Survey’ (SBS), also carried out by Statistics Belgium. This
survey provides financial information (e.g. firm-level wage cost, value added and gross
operating surplus per hour worked). The coverage of the SBS differs from that of the SES in
that it does not cover the whole financial sector (NACE J) but only Other Financial
Intermediation (NACE 652) and Activities Auxiliary to Financial Intermediation (NACE 67).
The merger of the SES and SBS datasets has been carried out by Statistics Belgium using
firms’ social security numbers.
Information in the SES refers to the month of October of each year, while data in the SBS
are measured over entire calendar years, i.e. from January to December. To avoid running a
regression where information on the dependent variable (collected for the entire year)
precedes the recording of the explanatory variables (collected in October), all explanatory
variables in equation (1) have been lagged by one year. This way, information on educational
variables is recorded in October in year t and used to explain firm-level productivity, wage
costs and profits during the calendar year t+1. The imperfect synchronization of the SBS and 14 It thus covers the following sectors: (i) mining and quarrying (C), (ii) manufacturing (D), (iii) electricity, gas and water supply (E), (iv) construction (F), v) wholesale and retail trade, repair of motor vehicles, motorcycles and personal and household goods (G), (vi) hotels and restaurants (H), (vii) transport, storage and communication (I), (viii) financial intermediation (J), and ix) real estate, renting and business activities (K).
18

SES data might introduce some fuzziness into our estimates since we cannot exclude the
occurrence of external events influencing firm performance in the intermediate period. This
concern could only be completely eliminated if we had firm-level information on educational
variables for the entire calendar year. This being said, even if this information were available,
there is a compelling argument for using asynchronised information on educational variables:
it is difficult to conceive how changes in shares of workers by educational level could
generate immediate effects notably on firm productivity and profits. Potential effects are
indeed more likely to occur after a certain adjustment period. The slightly asynchronised use
of SBS and SES is therefore arguably the best option in light of data availability and firm
performance dynamics.
As a consequence, our sample contains firms that are observed in at least two consecutive
years and thus over-represents medium-sized and large firms since the sampling percentages
for each firm in our dataset increase with the size of the latter.15 Next, we exclude workers
and firms for which data are missing or inaccurate.16 Finally, we drop firms with fewer than
10 observations, because the use of average values at the firm level requires a suitable number
of observations.17 Our final sample covering the period 1999-2010 consists of an unbalanced
panel of 6,714 firm-year-observations from 1,844 firms. It is representative of all medium-
sized and large firms in the Belgian private sector, with the exception of large parts of the
financial sector (NACE J) and the electricity, gas and water supply industry (NACE E).
[Insert Table 1 about here] 15 The SES is a stratified sample. The stratification criteria refer respectively to the region (NUTS-groups), the principal economic activity (NACE-groups) and the size of the firm. The sample size in each stratum depends on the size of the firm. Sampling percentages of firms are respectively equal to 10, 50 and 100 percent when the number of workers is lower than 50, between 50 and 99, and above 100. Within a firm, sampling percentages of employees also depend on size. Sampling percentages of employees reach respectively 100, 50, 25, 14.3 and 10 percent when the number of workers is lower than 20, between 20 and 50, between 50 and 99, between 100 and 199, and between 200 and 299. Firms employing 300 workers or more have to report information for an absolute number of employees. This number ranges between 30 (for firms with between 300 and 349 workers) and 200 (for firms with 12,000 workers or more). To guarantee that firms report information on a representative sample of their workers, they are asked to follow a specific procedure. First, they have to rank their employees in alphabetical order. Next, Statistics Belgium gives them a random letter (e.g. the letter O) from which they have to start when reporting information on their employees (following the alphabetical order of workers’ names in their list). If they reach the letter Z and still have to provide information on some of their employees, they have to continue from the letter A in their list. Moreover, firms that employ different categories of workers, namely managers, blue- and/or white-collar workers, have to set up a separate alphabetical list for each of these categories and to report information on a number of workers in these different groups that is proportional to their share in the firm’s total employment. For example, a firm with 300 employees (namely, 60 managers, 180 white-collar workers and 60 blue-collar workers) will have to report information on 30 workers (namely, 6 managers, 18 white-collar workers and 6 blue-collar workers). For more details see Demunter (2000). 16 For instance, we eliminate a (very small) number of firms for which the recorded value added was negative. 17 This restriction is unlikely to affect our results as it leads to a very small drop in sample size. The average number of observations per firm in each year is equal to 37 in our final sample.
19

Descriptive statistics of selected variables are presented in Table 1. We observe that firms
have a mean value added per hour worked of 66.19 EUR and that workers’ mean hourly wage
cost stands at 33.34 EUR.18 Average hourly profits (i.e. gross operating surplus) are equal to
32.85 EUR. As regards the educational composition of the labour force, we find that the share
of workers with at most lower secondary education stands at around 30 percent, the fraction
of workers with higher secondary educational attainment reaches approximately 42 percent,
and about 28 percent of employees have a degree of tertiary education.
Employees in our sample are essentially concentrated in the manufacturing industry (58
percent), wholesale and retail trade, repair of motor vehicles, motorcycles and personal and
household goods (12 percent), construction (10 percent), real estate, renting and business
activities (10 percent), and transport, storage and communication (6 percent). Moreover, firms
employ on average 26 percent of women, 62 percent of prime-age workers (i.e. workers aged
between 30 and 49 years), 40 percent of employees with less than ten years of tenure, 53
percent of blue-collar workers, 11 percent of part-time workers, and 3 percent of workers with
a fixed-term employment contract. Also noteworthy is that 57 percent workers are employed
in Flanders, 28 percent in Wallonia and 15 percent in Brussels. Finally, as regards collective
bargaining, Table 1 shows that 32 percent of workers are covered by a firm-level collective
agreement (in addition to an industry-level agreement).
5. Results
5.1. Benchmark estimates
Given above mentioned econometric issues associated with pooled OLS and FE estimates, we
directly report findings based on the dynamic GMM-SYS and LP estimators.19 Table 2 shows
the impact of shares of workers by level of education on hourly productivity, wage costs and
productivity-pay gaps20 at the firm level. Workers have been split in three educational groups
according to whether they had: i) at most lower secondary education (low-educated workers),
ii) an upper secondary educational attainment (middle-educated workers) and iii) at least an
18 All variables measured in monetary terms have been deflated to constant prices of 2004 by the consumer price index taken from Statistics Belgium. 19 OLS estimates (using respectively 3 and 7 educational categories) are reported in Appendices 1 and 2. 20 As noted in section 3.2, this variable is measured respectively by: a) the value added-wage cost gap (i.e. the difference between log hourly value added and log wage costs) and b) log profits (i.e. the log of the difference between value added and wage costs).
20

undergraduate degree (high-educated workers). The share of low-educated workers serves as
reference category.
[Insert Table 2 about here]
GMM-SYS estimates are reported in columns (1) to (4).21 To examine their reliability, we
first apply the Hansen and Arellano-Bond tests. For all regressions, they do not reject
respectively the null hypotheses of valid instruments22 and of no second order auto-correlation
in the first differenced errors. Results in column (1) indicate that middle- and high-educated
workers are significantly more productive than low-educated workers. They also show23 that
the productivity of middle-educated workers is significantly smaller than that of high-
educated workers. The regression coefficient associated with the share of middle-educated
workers is equal to 0.054. This means that if the fraction of middle-educated workers within a
firm increases by 10 percentage points (and is compensated by a proportional decrease in the
share of low-educated workers), mean hourly productivity rises on average by 0.54 percent
(i.e. 0.054*0.10 = 0.0054 = 0.54 percent). Similarly, estimates suggest that increasing the
share of high-educated workers by 10 percentage points at the expense of low-educated
(middle-educated) workers increases firm hourly productivity on average by 1.33 percent
(0.79 percent). LP results, reported in column (5), confirm that workers’ educational
attainment has a significant positive influence on firm-level productivity. Estimates indeed
suggest that hourly value added rises on average by respectively 1.28 and 0.19 percent
following a 10 percentage points increase in the incidence of high- and middle-educated
workers (at the expense of the reference educational group). They also indicate that
productivity grows on average by 1.09 percent if the share of high-educated workers increases
by 10 percentage points and is compensated by a proportional decrease in the fraction of
middle-educated workers.
Turning to the relationship between education and wage costs, results show (see column
(2)) that a 10 percentage points rise in the share of middle-educated (high-educated) workers,
at the expense of low-educated workers, increases mean hourly wage costs on average by 0.27
21 Note that lagged dependent variables are always found to be highly significant in our regressions. In line with extant literature (see footnote 13), they confirm that productivity, wage costs and profitability are highly persistent at the firm level. Moreover, GMM coefficients on lagged dependent variables fall systematically between the OLS and FE estimates (available on request). As highlighted by Roodman (2009), this result supports the appropriateness of our dynamic GMM-SYS specification. 22 First and second lags of explanatory variables (except time dummies) are used as instruments. 23 On the basis of a Chi-squared test for equality of regression coefficients.
21

percent (1.45 percent). Moreover, they suggest that wage costs rise on average by 1.18
percent if the share of high-educated workers is increased by 10 percentage points and
compensated by a comparable decrease in the incidence of middle-educated workers.
Findings thus support the existence of a significant upward-sloping relation between
education and wage costs.
In order to determine whether marginal wage costs of different educational groups are in
line with corresponding marginal productivities, we re-estimated our benchmark equation
using as dependent variable the value added-wage cost gap. Results, reported in column (3) of
Table 2, suggest that firm rents increase when low-educated workers are substituted by high-
educated ones. Indeed, estimates show that the productivity-pay gap rises on average by 0.55
percent following a 10 percentage points increase in the share of high-educated workers (at
the expense of low-educated ones). The additional value generated by high-educated workers
with respect to their low-educated co-workers is thus found to exceed their wage cost
differential. In sum, findings in column (3) suggest that high-educated workers are under-paid
with respect to their low-educated counterparts (and vice versa). Our robustness test, using log
profits as dependent variable, confirms this conclusion. Indeed, estimates in column (4) show
that high-educated workers are significantly more profitable than their middle- and low-
educated co-workers.24,25
To fine-tune our understanding of the education-productivity-pay nexus, we re-estimated
our benchmark specification using seven rather than three educational categories.26 While the
inclusion of additional educational variables is likely to increase the standard errors of our
estimates (as the share of observations within each educational group decreases), results
reported in Appendix 3 actually support and refine our conclusions. Indeed, they show a
significant upward-sloping profile between education and wage costs, on the one hand, and
24 The exclusion of firm size among covariates does not affect our conclusions (results available on request). 25 Note that regression coefficients obtained through a dynamic specification correspond to short-run effects. To obtain the long-run impact of changes in educational shares on productivity, wage costs and profits, Koyck (1954) has shown that estimates reported in Table 2 should be divided by 1 minus the coefficient associated to the lagged dependent variable. Applying this transformation to our benchmark results, we find that elasticities are between 2 and 5 times bigger in the long run than in the short run. For instance, according to GMM estimates (see column (1)), we find that increasing the share of higher educated workers by 10 percentage points (at the detriment of low-educated workers) increases hourly productivity on average by 3,88 percent (1,33 percent) in the long run (short run). Similarly, estimates (in column (2)) suggest that hourly wage costs rise on average by 2,62 percent (1,45 percent) in the long run (short run) if the fraction of high-educated workers within a firm increases by 10 percentage points (and is compensated by a proportional decrease in the share of low-educated workers). 26 We differentiated workers according to whether they had: i) at most primary education, ii) lower or upper secondary education, iii) a Bachelor’s or equivalent degree, and iv) at least a Master’s or equivalent degree. In comparison to our benchmark model, this specification focuses on very low-educated workers and distinguishes between workers with first- and advanced-level tertiary education.
22

education and productivity, on the other. They also indicate (see estimates in columns (3) and
(4)) that low-educated workers tend to be over-paid with respect to other educational groups.
Decreasing their share at the benefit of more educated groups of employees appears indeed to
be beneficial for firms’ profitability. Findings thus corroborate the hypothesis that the
distribution of wage costs across educational groups is more compressed than the education-
productivity profile. More precisely, they support the existence of a ‘wage-compression
effect’ according to which the substitution of low- by high-educated workers increases
employer rents (and vice versa).27
5.2. Estimates across industries and groups of workers
The education-productivity-pay nexus is likely to vary across working environments. Various
theoretical arguments (reviewed in Section 2) suggest in particular that this nexus may depend
on workers’ age, sex and sectoral affiliation. Given the importance of this issue and the lack
of empirical results, this section examines these interaction effects in more detail.
Does workers’ age matter?
We first focus on the potential impact of workers’ age. To do so, we re-estimated equations
(5) to (8), including the education and age shares variables in interaction. More precisely, we
computed shares of hours worked respectively by young and older workers of different
educational groups within firms and estimated their effects on productivity, wage costs and
productivity-pay gaps. In order to guarantee that the number of observations in each
education-age group was sufficiently large (i.e. to maximize the robustness of our estimates),
we fixed the threshold separating young from older workers at 40 years.28 Next, following our
baseline specification, we split young and older workers in three educational groups. We thus
differentiated workers according to whether they were: i) low-educated (i.e. had at most lower
secondary education), ii) middle-educated (i.e. had upper secondary educational attainment),
or iii) high-educated (i.e. had at least an undergraduate degree). The share of young low-
educated workers has been used as reference category. 27 Note that results (available on request) based on static GMM-SYS and LP estimators leave our conclusions unaffected. Yet, as expected (see footnote 25), the size of regression coefficients is found to be larger than in dynamic specifications. 28 As can be seen from columns (1) to (3) of Appendix 4, this age limit generates a quite balanced distribution of observations across education-age groups. Results based respectively on the 30 and 50 years threshold (available on request) show somewhat larger standard errors. However, they corroborate our conclusions.
23
[Insert Table 3 about here]
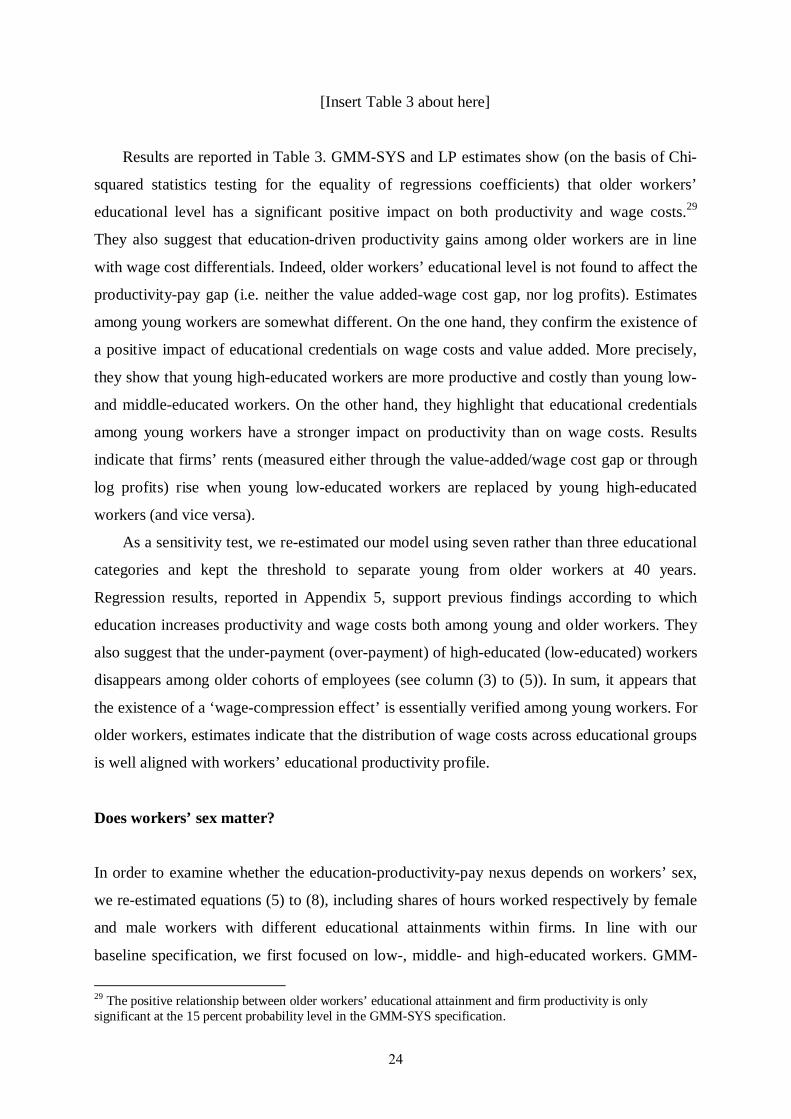
Results are reported in Table 3. GMM-SYS and LP estimates show (on the basis of Chi-
squared statistics testing for the equality of regressions coefficients) that older workers’
educational level has a significant positive impact on both productivity and wage costs.29
They also suggest that education-driven productivity gains among older workers are in line
with wage cost differentials. Indeed, older workers’ educational level is not found to affect the
productivity-pay gap (i.e. neither the value added-wage cost gap, nor log profits). Estimates
among young workers are somewhat different. On the one hand, they confirm the existence of
a positive impact of educational credentials on wage costs and value added. More precisely,
they show that young high-educated workers are more productive and costly than young low-
and middle-educated workers. On the other hand, they highlight that educational credentials
among young workers have a stronger impact on productivity than on wage costs. Results
indicate that firms’ rents (measured either through the value-added/wage cost gap or through
log profits) rise when young low-educated workers are replaced by young high-educated
workers (and vice versa).
As a sensitivity test, we re-estimated our model using seven rather than three educational
categories and kept the threshold to separate young from older workers at 40 years.
Regression results, reported in Appendix 5, support previous findings according to which
education increases productivity and wage costs both among young and older workers. They
also suggest that the under-payment (over-payment) of high-educated (low-educated) workers
disappears among older cohorts of employees (see column (3) to (5)). In sum, it appears that
the existence of a ‘wage-compression effect’ is essentially verified among young workers. For
older workers, estimates indicate that the distribution of wage costs across educational groups
is well aligned with workers’ educational productivity profile.
Does workers’ sex matter?
In order to examine whether the education-productivity-pay nexus depends on workers’ sex,
we re-estimated equations (5) to (8), including shares of hours worked respectively by female
and male workers with different educational attainments within firms. In line with our
baseline specification, we first focused on low-, middle- and high-educated workers. GMM-
29 The positive relationship between older workers’ educational attainment and firm productivity is only significant at the 15 percent probability level in the GMM-SYS specification.
24
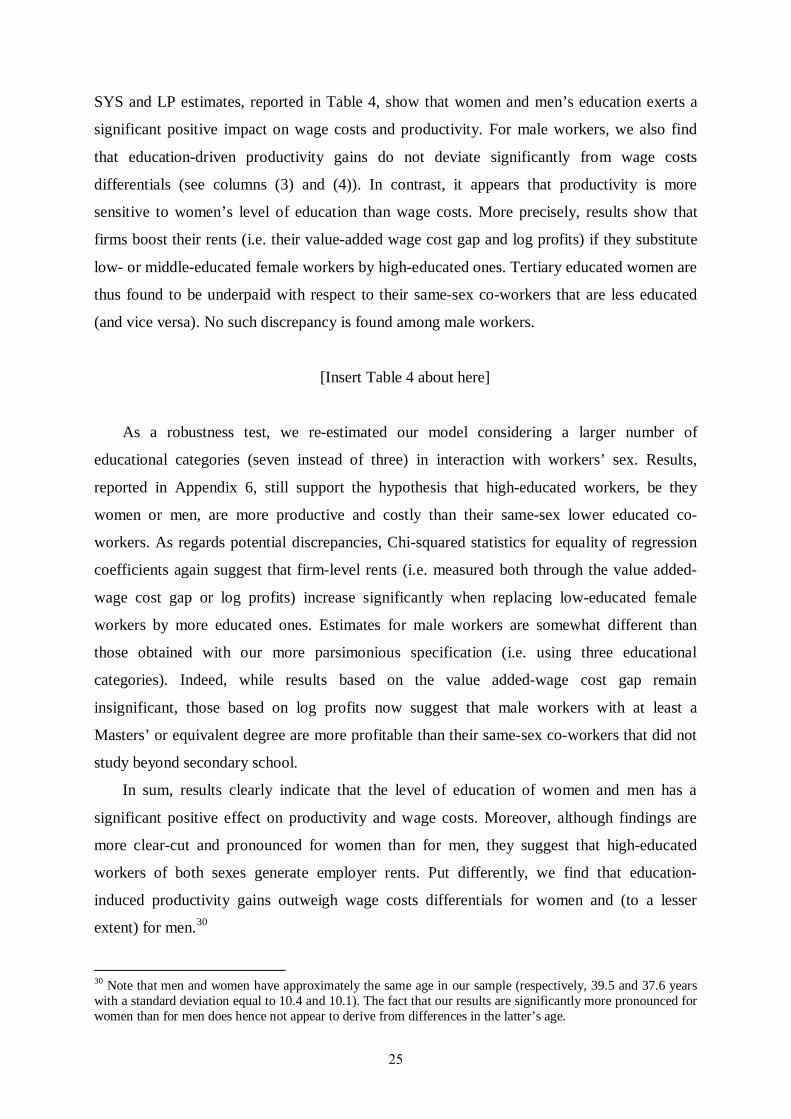
SYS and LP estimates, reported in Table 4, show that women and men’s education exerts a
significant positive impact on wage costs and productivity. For male workers, we also find
that education-driven productivity gains do not deviate significantly from wage costs
differentials (see columns (3) and (4)). In contrast, it appears that productivity is more
sensitive to women’s level of education than wage costs. More precisely, results show that
firms boost their rents (i.e. their value-added wage cost gap and log profits) if they substitute
low- or middle-educated female workers by high-educated ones. Tertiary educated women are
thus found to be underpaid with respect to their same-sex co-workers that are less educated
(and vice versa). No such discrepancy is found among male workers.
[Insert Table 4 about here]
As a robustness test, we re-estimated our model considering a larger number of
educational categories (seven instead of three) in interaction with workers’ sex. Results,
reported in Appendix 6, still support the hypothesis that high-educated workers, be they
women or men, are more productive and costly than their same-sex lower educated co-
workers. As regards potential discrepancies, Chi-squared statistics for equality of regression
coefficients again suggest that firm-level rents (i.e. measured both through the value added-
wage cost gap or log profits) increase significantly when replacing low-educated female
workers by more educated ones. Estimates for male workers are somewhat different than
those obtained with our more parsimonious specification (i.e. using three educational
categories). Indeed, while results based on the value added-wage cost gap remain
insignificant, those based on log profits now suggest that male workers with at least a
Masters’ or equivalent degree are more profitable than their same-sex co-workers that did not
study beyond secondary school.
In sum, results clearly indicate that the level of education of women and men has a
significant positive effect on productivity and wage costs. Moreover, although findings are
more clear-cut and pronounced for women than for men, they suggest that high-educated
workers of both sexes generate employer rents. Put differently, we find that education-
induced productivity gains outweigh wage costs differentials for women and (to a lesser
extent) for men.30
30 Note that men and women have approximately the same age in our sample (respectively, 39.5 and 37.6 years with a standard deviation equal to 10.4 and 10.1). The fact that our results are significantly more pronounced for women than for men does hence not appear to derive from differences in the latter’s age.
25
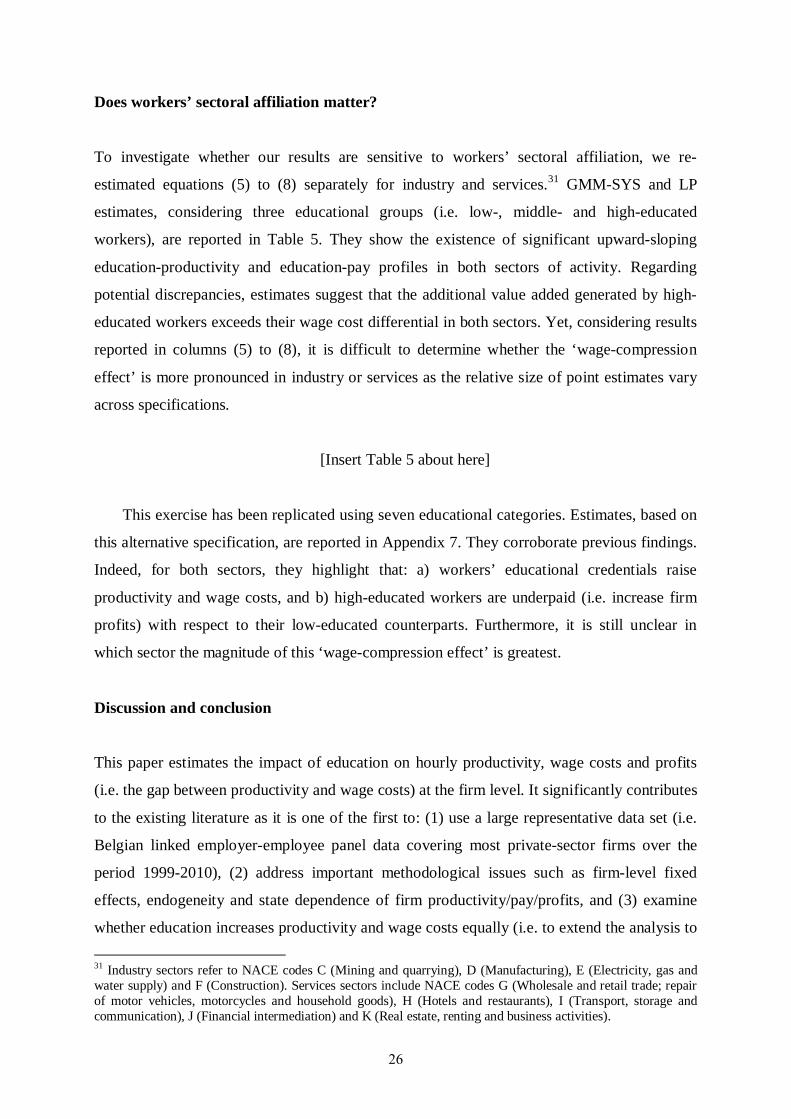
Does workers’ sectoral affiliation matter?
To investigate whether our results are sensitive to workers’ sectoral affiliation, we re-
estimated equations (5) to (8) separately for industry and services.31 GMM-SYS and LP
estimates, considering three educational groups (i.e. low-, middle- and high-educated
workers), are reported in Table 5. They show the existence of significant upward-sloping
education-productivity and education-pay profiles in both sectors of activity. Regarding
potential discrepancies, estimates suggest that the additional value added generated by high-
educated workers exceeds their wage cost differential in both sectors. Yet, considering results
reported in columns (5) to (8), it is difficult to determine whether the ‘wage-compression
effect’ is more pronounced in industry or services as the relative size of point estimates vary
across specifications.
[Insert Table 5 about here]
This exercise has been replicated using seven educational categories. Estimates, based on
this alternative specification, are reported in Appendix 7. They corroborate previous findings.
Indeed, for both sectors, they highlight that: a) workers’ educational credentials raise
productivity and wage costs, and b) high-educated workers are underpaid (i.e. increase firm
profits) with respect to their low-educated counterparts. Furthermore, it is still unclear in
which sector the magnitude of this ‘wage-compression effect’ is greatest.
Discussion and conclusion
This paper estimates the impact of education on hourly productivity, wage costs and profits
(i.e. the gap between productivity and wage costs) at the firm level. It significantly contributes
to the existing literature as it is one of the first to: (1) use a large representative data set (i.e.
Belgian linked employer-employee panel data covering most private-sector firms over the
period 1999-2010), (2) address important methodological issues such as firm-level fixed
effects, endogeneity and state dependence of firm productivity/pay/profits, and (3) examine
whether education increases productivity and wage costs equally (i.e. to extend the analysis to 31 Industry sectors refer to NACE codes C (Mining and quarrying), D (Manufacturing), E (Electricity, gas and water supply) and F (Construction). Services sectors include NACE codes G (Wholesale and retail trade; repair of motor vehicles, motorcycles and household goods), H (Hotels and restaurants), I (Transport, storage and communication), J (Financial intermediation) and K (Real estate, renting and business activities).
26
wage costs and profits). It also adds to previous research by providing first evidence on
whether the alignment between productivity and wage costs across educational levels depends
on workers’ characteristics (i.e. their age and sex) and the sectors in which they work (i.e.
industry vs. services).
Findings, based on the generalized method of moments (GMM) and Levinsohn and Petrin
(2003) estimators, show a robust upward-sloping profile between education and wage costs,
on the one hand, and education and productivity, on the other. They also systematically
highlight that educational credentials have a stronger impact on productivity than on wage
costs. Firms’ profitability is indeed found to rise when lower educated workers are substituted
by higher educated ones (and vice versa). Estimates thus support the existence of a ‘wage-
compression effect’, i.e. a situation in which the distribution of wage costs is more
compressed than workers’ education-productivity profile. More precisely, they suggest that
hourly profits increase on average by 6,2 percent (3,4 percent) in the long run (short run) if
the fraction of high-educated workers within a firm increases by 10 percentage points (and is
compensated by a proportional decrease in the share of low-educated workers). Yet, the size
of this effect is found to depend on the characteristics of workers (i.e. their age and gender).
The misalignment between education-driven productivity gains and wage cost differentials
appears to be essentially verified among young workers. Put differently, results suggest that
high-educated (low-educated) workers are no longer under-paid (over-paid) when they
become older. As regards gender, findings are more clear-cut and pronounced for women than
for men. This said, for both sexes, they suggest that firms’ profitability rises following an
increase in the share of high-educated workers. Finally, results suggest that the ‘wage-
compression effect’ is not sector-specific. Yet, it remains unclear whether this effect is more
pronounced in industry or in services.
How can these findings be interpreted? Results from our baseline specification showing
the existence of a ‘wage-compression effect’ partially back up the predictions of human
capital theory. On the one hand, they corroborate the idea that education develops skills that
make workers more productive and that wages reflect differences in productivity. On the
other, they do not support the hypothesis that education-driven productivity gains are well
aligned with wage differentials. Our findings are also not in line with theories (based on
tournaments, internal decision-making processes of organisations or monitoring issues)
suggesting that high-educated workers are overpaid relative to their respective marginal
products. Estimates are actually more compatible with the literature on social norms and the
hysteresis of the wage structure, fairness theories and arguments according to which labour
27

market regulations (such as minimum wages, collective bargaining and unemployment
benefits) increase the reservation wage, especially for workers at the bottom of the wage
distribution, and reduce wage inequalities by pushing earnings of low-wage workers upwards.
We may not exclude that compensating wage differentials may also contribute to explain why
low-educated workers appear to be overpaid. Yet, given the excess of low-educated labour
supply (which reduces firms’ incentives to compensate potentially less attractive working
conditions by higher wages) and the large number of covariates already included in our set-
up, the explanatory power of this argument should probably not be over-stated. An
explanation based on differences in adjustment costs between high- and low-educated workers
is also likely to be less relevant as our focus is on wage costs (which encompass all personnel
expenses) rather than on wages.
Results according to workers’ age can be understood through additional hypothesis
testing. Estimates, based on our benchmark regression (see Table 4), suggest that the
education-driven wage cost differential is smaller among young workers than among older
workers (z-statistic = -2.48 and p-value = 0.01), while the contribution of education to firm’s
value added is not found to be statistically different across age groups (z-statistics = -0.58 /
0.12 and p-values = 0.56 / 0.90 with GMM-SYS / LP estimators).32,33 The observation that the
wage cost differential between high- and low-educated workers increases with workers’ age
can be explained by the fact that white-collar workers in Belgium are much more likely to be
paid according to seniority than their blue-collar counterparts (which are typically less
educated) and that seniority-pay profiles are generally much steeper for high- than low-
educated workers. A complementary explanation is that labour market institutions (such as
unemployment benefits, minimum wages and trade unions) essentially affect the lower end of
the wage distribution. Hence, they are more likely to compress the wage cost differential
between low- and high-educated workers when they are young. Overall, results thus suggest
that high-educated (low-educated) workers are no longer under-paid (over-paid) when they
become older because their wage cost to productivity ratio increases at a faster (slower) pace
during their career than that of low-educated (high-educated) workers.
32 These results are obtained with the ‘lincom’ command in STATA, after estimating the same regressions as in Table 4 but using as reference category ‘young middle-educated workers’ (i.e YE34). The exact syntax is as follows: lincom YE567 – YE12 – OE567 + OE12. 33 We do not reject the hypothesis that the education-driven productivity differential may decrease among older cohorts of workers, notably among 50+ workers. Yet, it is difficult to provide consistent evidence on this as the number of observations within each education-age group decreases quite substantially when moving the age threshold from 40 to 50 years.
28
Estimates by gender suggest that the over-payment (under-payment) of low-educated
(high-educated) workers is more pronounced among women than men. This finding may be
explained by the fact that women are over-represented among low-wage earners and are thus
more likely to have their working conditions influenced by labour market regulations (such as
minimum wages, collective bargaining and unemployment benefits). However, the stronger
wage-compression effect among women might also be explained by a glass-ceiling effect, i.e.
the fact that women face invisible but real barriers preventing them from obtaining higher-
level positions (Christophides et al., 2013). Indeed, results of Kampelman and Rycx (2012b)
show that the occupation-pay profile in Belgian is steeper than the occupation-productivity
profile. Accordingly, the fact that women are less likely to hold jobs at the upper rungs of the
corporate ladder should ceteris paribus have a stronger detrimental effect on their pay than on
their productivity. Our finding that high-educated women are relatively more underpaid than
their male counterparts could thus be explained by the fact that women have a lower
likelihood to be promoted to high-ranking positions. A complementary argument, provided by
Card et al. (2013: 1), is that high-educated women, in a given occupation, “are less likely to
initiate wage bargaining with their employer and are (often) less effective negotiators than
men”. These interpretations echo the estimates of Garnero et al. (2014b). The latter show that
women generate employer rents in the Belgian private sector and that these rents derive from
the fact that women earn less than men at any given level of productivity.
To sum up, our results show that firms located in Belgium (operating both in industry and
services) face financial disincentives to employing low-educated workers, especially when
they are young. We indeed find that firms employing a larger share of young low-educated
workers tend to be less profitable. Policies aiming to improve the labour market prospects of
young low-educated workers should thus try to boost their productivity and/or to decrease
their wage cost. A substantial number of policies (i.e. training programmes, wage subsidies,
reductions of social security contributions) are already implemented in Belgium to reach this
goal. Yet, our findings suggest that these efforts should be continued and intensified
(alongside policies fostering total employment). Furthermore, results show that the wage-
compression effect is somewhat more pronounced among women than men. This finding
suggests that particular attention should be devoted to the productivity to wage cost ratio of
low-educated women but also to policies favouring gender equality in terms of remuneration
and career advancement.
29

References
Acemoglu, D. (2002), “Technical change, inequality and the labor market”, Journal of
Economic Literature, 40(1), 7-72.
Akerlof, G., Yellen, J. (1988), “Fairness and unemployment”, American Economic Review,
78(2): 44-49.
Arellano, M. and Bond, O. (1991), “Some tests of specification for panel data: Monte Carlo
evidence and an application to employment equations”, Review of Economic Studies,
58(2): 277-297.
Arellano, M. and Bover, O. (1995), “Another look at the instrumental variable estimation of
error-component models”, Journal of Econometrics, 68(1): 28-51.
Ashenfelter, O., Harmon C. and H. Oosterbeek (1999), “A Review of estimates of the
schooling/earnings relationship, with tests for publication bias”, Labour Economics, 6(4):
453-470.
Autor, D., Katz, L. and Krueger, A. (1988), “Computing inequality: have computers changed
the labor market?”, Quarterly Journal of Economics, 113(4), 1169-1213.
Baily, M., Hulten, C. and Campbell, D. (1992), “The distribution of productivity in
manufacturing plants”, Brooking Papers on Economic Activity: Microeconomics, 187-
249.
Bartelsman, E. and Doms, M. (2000), “Understanding productivity: Lessons from longitudinal
microdata”, Quarterly Journal of Economics, 122(4): 1721-1758.
Bartelsman, E. and Dhrynes, P. (1988), “Productivity dynamics: US manufacturing plants
1972-1986”, Journal of Productivity Analysis, 9(1): 5-34.
Bartolucci, C. (2013), “Gender wage gaps reconsidered: A structural approach using matched
employer-employee data”, Journal of Human Resources, 48(4): 998-1034.
Bayard, K., Hellerstein, J., Neumark, D. and Troske, K. (2003), “New evidence on sex
segregation and sex differences in wages from matched employer-employee data”,
Journal of Labor Economics, 21(4): 887-922.
Bebchuk, L. and Fried, J. (2003), “Executive compensation as an agency problem”, Journal of
Economic Perspectives, 17(3): 71-92.
Becker, G. (1964), Human capital, New York: NBER.
Belgian federal government (2012), National plan programme 2012, Brussels.
Berg, I. (1981), Sociological perspectives on labor markets. Academic Press.
30
Bernard, A., Jensen, J. and Schott, P. (2006), “Survival of the best fit: Exposure to low-wage
countries and the (uneven) growth of U.S. manufacturing plants”, Journal of
International Economics, 68(1), 219-237.
Biscourp, P. and Kramarz, F. (2007), “Employment, skill structure and international trade:
Firm-level evidence for France”, Journal of International Economics, 72(1), 22-51.
Blundell, R. and Bond, S. (1998), “Initial conditions and moment restrictions in dynamic
panel data models”, Journal of Econometrics, 87(1): 115-143.
Bond, S. (2002), “Dynamic panel data models: A guide to micro data methods and practice”,
Portuguese Economic Journal, 1(2): 141-162.
Bond, S. and Söderbom, M. (2005), “Adjustment costs and the identification of Cobb Douglas
production functions”, IFS Working Paper, No. 05/04, London.
Bou, J. and Satorra, A. (2007), “The persistence of abnormal returns at industry and firm
levels: Evidence from Spain”, Strategic Management Journal, 28: 707-722.
Burggraeve, K. and du Caju, P. (2003), “Reduction in social security contributions in a wage
norm and automatic indexing regime”, Brussels Economic Review, 46(4): 31-64.
Butcher, T., Dickens, R. and Manning, A. (2012), “Minimum wages and wage inequality:
Some theory and application to the UK”, CEP Discussion paper 1177, London.
Cahuc, P. and Carcillo, S. (2012), “Les conséquences des allègements généraux de cotisations
patronales sur les bas salaires”, Revue française d’économie, 27(2): 19-61.
Cahuc, P. and Zylberberg, A. (2004), Labor Economics, Cambridge (Ma.): MIT Press.
Card, D. (1999), “The causal effect of education on earnings”, in: O. Ashenfelter and D. Card
(eds.), Handbook of labor economics, Vol. 3, Amsterdam: Elsevier, pp. 1801-1863.
Card, D., Cardoso, A. and Kline P. (2013), “Bargaining and the gender wage gap: A direct
assessment”, IZA Discussion Paper, No. 7592, Bonn.
Cardoso, A. (2010), “Do firms compress the wage distribution”, in D. Marsden and F. Rycx
(eds.), Wage structures, employment adjustments and globalisation: Evidence from linked
and firm-level panel data, Palgrave Macmillan, pp. 202-218.
Cardoso, A., Guimaraes, P. and Varejao, J. (2011), “Are older workers worthy of their pay?
An empirical investigation of age-productivity and age-wage nexuses”, De Economist,
159(2): 95-111.
Cataldi, A., Kampelmann, S. and Rycx, F. (2011), “Productivity-wage gaps among age
groups: Does the ICT environment matter?”, De Economist, 159(2): 193-221.
Cataldi, A., Kampelmann, S. and Rycx, F. (2012), “Does it pay to be productive? The case of
age groups”, International Journal of Manpower, 33(3): 264-283.
31

Chevalier, A. (2011), “Subject choice and earnings of UK graduates”, Economics of
Education Review, 30(6): 1187-1201.
Chevalier, A., Harmon, C., Walker, I., Zhu, Y. (2004), “Does education raise productivity, or
just reflect it?”, Economic Journal, 114(499): F499-F519.
Christophides, L., Polycarpou, A. and Vrachimis, K. (2013), “Gender wage gaps, ‘sticky
floors’ and ‘glass ceilings’ in Europe”, Labour Economics, 21: 86-102.
Cockx, B. and Dejemeppe, M. (2002), “Do the higher educated unemployed crowd out the
lower educated ones in competition for jobs?”, IZA Discussion Paper, No. 541, Bonn.
Cockx, B., Sneessens H. and Van der Linden, B. (2004), “Allègements de charges sociales:
une mesure à promouvoir mais à reformer”, Reflets et perspectives de la vie économique,
XLIII(1):55-68.
Dagsvik, J., Zhiyang J., Orsini, K. and Van Camp, G. (2011), “Subsidies on low-skilled
workers’ social security contributions: the case of Belgium”, Empirical Economics, 4(3):
779-806.
Demunter, C. (2000), “Structure and dispersion of earnings survey: analysis 1995”, Working
Paper, Statistics Belgium, Brussels.
Devereux, P. and Fan W. (2011), “Earnings returns to the British education expansion”,
Economics of Education Review, 30(6): 1153-1166.
Dhyne, E., Mahy, B. (2012), “Work organization, labour contracts and employment”,
International Journal of Manpower, 33(3): 246-263.
Dickson, M. and Harmon C. (2011), “Economic returns to education: What we know, what
we don’t know, and where we are going. Some brief pointers”, Economics of Education
Review, 30(6): 1118-1122.
Dolado, J., Felgueroso, F. and Jimeno, J. (2000), “Youth labour markets in Spain: Education,
training crowding out”, European Economic Review, 44(4-6): 943-956.
du Caju, P., Rycx, F. and Tojerow, I. (2011), “Inter-industry wage differentials: How much
does rent-sharing matter?”, Manchester School, 79(4): 691-717.
du Caju, P., Rycx, F. and Tojerow, I. (2012), “Wage structure effects of international trade in
a small open economy: The case of Belgium”, Review of World Economics, 148(2): 297-
331.
Eurostat (2010), Labour market policy – expenditure and participants – Data 2010, Eurostat:
Luxembourg.
Eurostat (2014), Labour force survey, Eurostat: Luxemburg.
32

Fuss, C. and Wintr, L. (2009), “Rigid labour compensation and flexible employment? Firm-
level evidence with regard to productivity for Belgium”, ECB Working Paper, No. 1021,
Frankfurt.
Galindo-Rueda, F. and Haskel, J. (2005), “Skills, workforce characteristics and firm-level
productivity: Evidence from the matched ABI/employer skills survey”, IZA Discussion
Paper, No. 1542, Bonn.
Garnero, A., Kampelmann, S. and Rycx, F. (2014a), “The Heterogeneous effects of
workplace diversity on productivity, wages and profits”, Industrial Relations, 53(3): 430-
477
Garnero, A., Kampelmann, S. and Rycx, F. (2014b), “Part-time work, wages and productivity:
Evidence from Belgian matched panel data”, Industrial and Labor Relations Review,
67(3), pp. 926-954.
Gautier, P., van den Berg, G., van Ours, J. and Ridder, G. (2002), “Worker turnover at the
firm level and crowding out of lower educated workers”, European Economic Review,
46(3), 523-538.
Geroski, P. and Jacquemin, A. (1988), “The persistence of profits: A European comparison”,
Economic Journal, 98: 375-389.
Göbel, C. and Zwick, T. (2009), “Age and productivity: Evidence from linked employer
employee data”, ZEW Discussion Paper, No. 09-020, Mannheim.
Göbel, C. and Zwick, T. (2012), “Age and productivity: Sector differences”, De Economist,
160: 35-57.
Göbel, C. and Zwick, T. (2013), “Are personnel measures effective in increasing productivity
of old workers?”, Labour Economics, 22: 80-93.
Goos, M., Manning, A. and Salomons, A. (2014), “Explaining job polarization: Routine-
biased technological change and offshoring”, American Economic Review, 104(8), 2509-
2526.
Haegeland, T. and Klette, T. (1999), “Do higher wages reflect higher productivity? Education,
gender and experience premiums in a matched plant-worker data set”, in Haltiwanger J.,
Lane, J., Spletzer, J., Theeuwes, J. and Troske, K. (eds.), The creation and analysis of
employer-employee matched data, North-Holland: Elsevier, pp. 231-259.
Haltiwanger, J., Lane J. and Spetze J. (1999), “Productivity differences across employers: The
roles of employer size, age and human capital”, American Economic Review, 89(2): 94-
98.
33

Hamermesh, D. (1975), “Interdependence in the labour market”, Economica, 42(168), 420-
429.
Hansen, L. (1982), “Large sample properties of generalized method of moment estimators”,
Econometrica, 50(4): 1029-1054.
Harmon, C., Oosterbeek, H. and Walker, I. (2003), “The returns to education: micro-
economics”, Journal of Economic Surveys, 17(2): 115-155.
Heckel, T., Le Bihan, H. and Montornès, J. (2008), “Sticky wages: Evidence from quarterly
microeconomic data”, ECB Working Paper, No. 893, Frankfurt.
Heckman, J., LaLonde, R. and Smith J. (1999), “The economics and econometrics of active
labor market programs”, in Ashenfelter, O. and Card, D. (eds.), Handbook of labor
economics, Amsterdam: Elsevier, 1865-2097.
Hellerstein, J., Neumark, D. and Troske, K. (1999a), “Sex, wages, productivity: An empirical
analysis of Israel firm-level data”, International Economic Review, 40(1): 95-123.
Hellerstein, J., Neumark, D. and Troske, K. (1999b), “Wages, productivity and worker
characteristics: Evidence from plant-level production functions and wage equations”,
Journal of Labor Economics, 17(2): 409-446.
Hellerstein, J. and Neumark, D. (2004), “Production function and wage equation estimation
with heterogeneous labor: Evidence from a new matched employer-employee data set”,
NBER Working Paper, No. 10365, Cambridge (Ma.).
Hertveldt, B. and Michel, B. (2013), “Offshoring and the skill structure of labour demand in
Belgium”, De Economist, 161(4): 399-420.
Huttunen K; Pirttilä J. and Uusitalo, R. (2013), “The employment effects of low-wage
subsidies”, Journal of Public Economics, 97(0), 49-60.
Ilmakunnas, P. and Ilmakunnas S. (2011), “Diversity at the workplace: Whom does it
benefit?”, De Economist, 159(2): 223-255.
Ilmakunnas, P. and Maliranta, M. (2005), “Technology, labour characteristics and wage-
productivity gaps”, Oxford Bulletin of Economics and Statistics, 67(5), 623-645.
Kalleberg, A. and Sørensen, A. (1979), “The sociology of labor markets”, Annual Review of
Sociology, 5(1): 351-379.
Kampelmann, S. and Rycx, F. (2012a), "Are Occupations Paid What They Are Worth? An
Econometric Study of Occupational Wage Inequality and Productivity", De Economist,
160(3), pp. 257-287.
Kampelmann, S. and Rycx F. (2012b), “The impact of educational mismatch on productivity:
Evidence from linked panel data”, Economics of Education Review, 31(6): 918-931.
34

Kluve, J. and Schmidt (2002), “Can training and employment subsidies combat European
unemployment?”, Economic Policy, 17(35): 411-448.
Konings, J. and Vanormelingen, S. (2014), “The impact of training on productivity and
wages: firm-level evidence”, Review of Economics and Statistics, forthcoming.
Koyck, L. (1954), Distributed lags and investment analysis, Amsterdam: North Holland.
Krueger, A. and Lindahl, M. (2001), “Education and growth: Why and for whom?”, Journal
of Economic Literature, 39(4): 1101-1136.
Lallemand, T. and Rycx, F. (2009), “Are older workers harmful for firm productivity ?”, De
Economist, 157(3): 273-292.
Lazear, E. and Rosen, S. (1981), “Rank-order tournaments as optimum labor contracts”,
Journal of Political Economy, 89(5), 841-864.
Lazear, E. and Shaw, K. (2007), “Personnel economics: The economist's view of human
resources”, Journal of Economic Perspectives, 21(4): 91-114.
Lebedinski, L. and Vandenberge, V. (2014), “Assessing education’s contribution to
productivity using firm-level evidence”, International Journal of Manpower,
forthcoming.
Levinsohn, J. and Petrin, A. (2003), “Estimating production functions using inputs to control
for unobservables”, Review of Economics and Statistics, 70(2): 317-341.
Mahhlberg, B., Freund, I., Cuaresma J. and Prskawets, A. (2013), “Ageing productivity and
wages in Austria”, Labour Economics, 22: 5-15.
Mahy, B., Rycx F. and Vermeylen, G. (2015), “Educational mismatch and firm productivity:
Do skills, technology and uncertainty matter?”, De Economist, forthcoming.
Mahy, B., Rycx, F. and Volral, M. (2011a), “Does wage dispersion make all firms more
productive?”, Scottish Journal of political Economy, 58(4): 455-489.
Mahy, B., Rycx, F. and Volral, M. (2011b), “Wage dispersion and firm productivity in
different working environments”, British Journal of Industrial Relations, 49(3): 460-485.
Mankiw, G., Rome, D. and Weil, D. (1992), “A contribution to empirics of economic
growth”, Quarterly Journal of Economics, 107: 407-437.
Manning, A. (2003), Monopsony in motion. Imperfect competition in labor markets,
Princeton: Princeton University Press.
McGahan, A. and Porter, M. (1999), “The persistence of shocks to profitability”, Review of
Economics and Statistics, 81: 143-153.
McMillan, D. and Wohar, M. (2011), “Profit-persistence revisited: The case of the UK”,
Manchester School, 79(3): 510-527.
35

Messina, J., du Caju, P., Izquierdi, M., Duarte C. and Lynggärd Hansen, N. (2010), “The
incidence of nominal and real wage rigidity: An individual-based sectoral approach”;
Journal of the European Economic Association, 8(2-3): 487-496.
Mincer, J. (1974), Schooling, experience and earnings, New York: Columbia University
Press.
Moretti, E. (2004), “Workers’ education, spillovers and productivity: Evidence from plant-
level production functions”, American Economic Review, 94(3): 656-690.
Mortensen, D. (2003), Wage dispersion. Why are similar workers paid differently?,
Cambridge (Ma.): MIT Press.
Mueller, D. (1977), “The persistence of profits above the norm”, Economica, 44(176): 369-
380.
Nielen, S. and Schiersch, A. (2012), ‘Productivity in German manufacturing firms: Does
fixed-term employment matter?’, Schumpeter Discussion Paper, No. 4, Schumpeter
School of Business and Economics, University of Wuppertal, Germany.
Nielen, S. and Schiersch, A. (2014), ‘Temporary agency work and firm competitiveness:
Evidence from German manufacturing firms’, Industrial Relations, 53(3): 365-393.
OECD (2009), Measuring capital, Paris: OECD.
OCDE (2013), OECD employment outlook 2013, OECD: Paris.
Oi, W. (1962), “Labor as a quasi-fixed factor”, Journal of Political Economy, 70(6): 538-555.
Olley, S. and Pakes, A. (1996), “The dynamics of productivity in telecommunications
equipment industry”, Econometrica, 64(6): 1263-1297.
Osterman, P., Auer, P., Gautié, J. and Marsden, D. (2009), “Discussion: A new labour
economics?”, Socio-Economic Review, 7(4): 695-726.
Petrin, A., Poi, B. and Levinsohn, J. (2004), “Production function estimation in Stata using
inputs to control for unobservables”, Stata Journal, 4(2): 113-123.
Piketty, T. and Saez, E. (2003), “Income inequality in the United States, 1913-1998”,
Quarterly Journal of Economics, 118(1): 1-39.
Pfeifer, C. and Wagner, J. (2012), “Age and gender composition of the workforce,
productivity and profits: Evidence from a new type of data for German entreprises”, IZA
Discussion Paper 6381, Bonn.
Riley, N-M. (1987), “Determinants of union membership: A review”, Labour, 11(2) 265-301.
Roodman, D. (2009), “How to do xtabond2: An introduction to difference and system GMM
in Stata”, Stata Journal, 9(1): 86-136.
36
Rosen, S. (1974), “Hedonic prices and implicit markets”, Journal of Political Economy,
82(1): 34-55.
Rusinek, M. and Rycx, F. (2012), “Rent-sharing under different bargaining regimes: Evidence
from linked employer-employee data”, British Journal of Industrial Relations, 50(4): 28-
58.
Shepherd, W. (1975), The treatment of market power, New York: Columbia University Press.
Sianesi, B. and Van Reenen (2003), “The returns to education: macroeconomics”, Journal of
Economic Surveys, 17(2): 157-200.
Skott, P. (2005), “Fairness as a source of hysteresis in employment and relative wages”,
Journal of Economic Behavior and Organization, 57(3): 305-331.
Syverson, C. (2011), “What determines productivity?”, Journal of Economic Literature,
49(2): 326-365.
Van Beveren, I. (2012), “Total factor productivity estimation: A practical review”, Journal of
Economic Surveys, 26(1): 98-128.
Van Biesebroeck, J. (2011), “Wages equal productivity. Fact or fiction? Evidence from sub-
Saharan Africa”, World Economy, 39(8): 1333-1346.
van Ours, J. and Stoeldraijer, L. (2011), “Age, wage and productivity in Dutch
manufacturing”, De Economist, 159(2): 113-137.
Vandenberghe V. (2011), “Firm-level evidence on gender wage discrimination in the Belgian
private economy”, LABOUR, 25(3): 330-349.
Vandenberghe V. (2013), “Are firms willing to employ a greying and feminizing
workforce?”, Labour Economics, 22: 30-42.
Weeden, K. (2002), “Why do some occupations pay more than others? Social closure and
earnings inequality in the United States”, American Journal of Sociology, 108(1): 55-101.
37
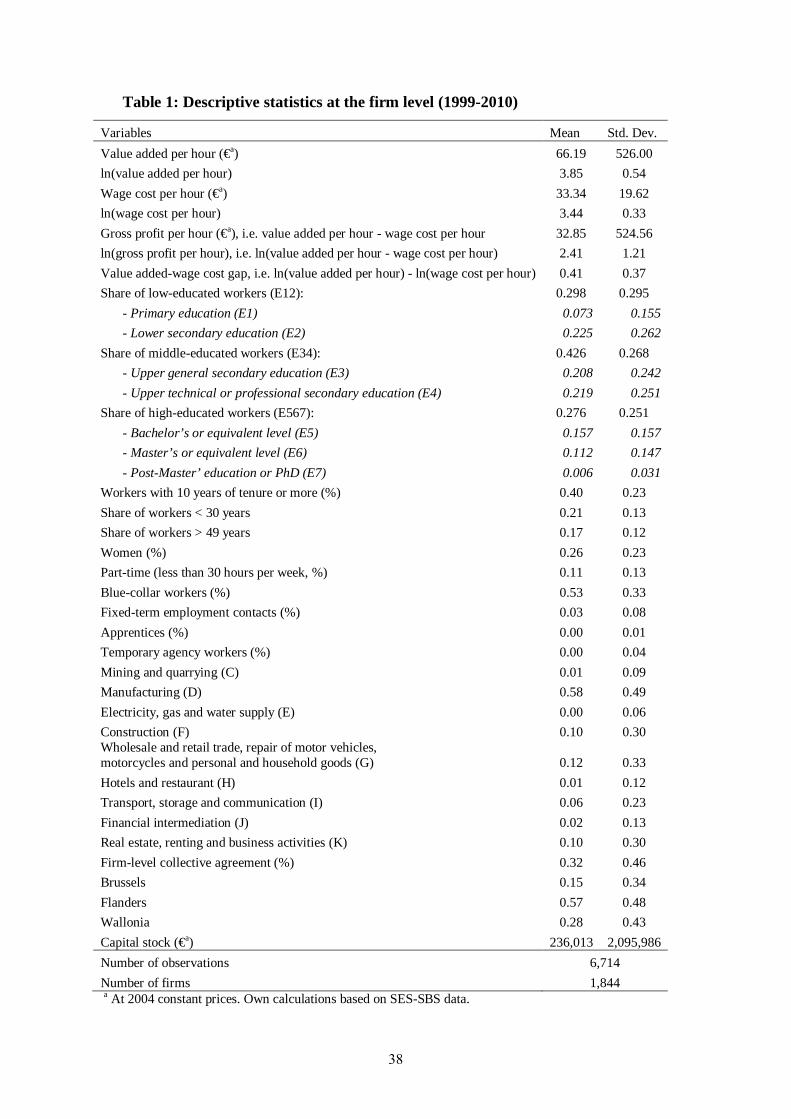
Table 1: Descriptive statistics at the firm level (1999-2010)
Variables Mean Std. Dev. Value added per hour (€a) 66.19 526.00 ln(value added per hour) 3.85 0.54 Wage cost per hour (€a) 33.34 19.62 ln(wage cost per hour) 3.44 0.33 Gross profit per hour (€a), i.e. value added per hour - wage cost per hour 32.85 524.56 ln(gross profit per hour), i.e. ln(value added per hour - wage cost per hour) 2.41 1.21 Value added-wage cost gap, i.e. ln(value added per hour) - ln(wage cost per hour) 0.41 0.37 Share of low-educated workers (E12): 0.298 0.295
- Primary education (E1) 0.073 0.155 - Lower secondary education (E2) 0.225 0.262
Share of middle-educated workers (E34): 0.426 0.268 - Upper general secondary education (E3) 0.208 0.242 - Upper technical or professional secondary education (E4) 0.219 0.251
Share of high-educated workers (E567): 0.276 0.251 - Bachelor’s or equivalent level (E5) 0.157 0.157 - Master’s or equivalent level (E6) 0.112 0.147 - Post-Master’ education or PhD (E7) 0.006 0.031
Workers with 10 years of tenure or more (%) 0.40 0.23 Share of workers < 30 years 0.21 0.13 Share of workers > 49 years 0.17 0.12 Women (%) 0.26 0.23 Part-time (less than 30 hours per week, %) 0.11 0.13 Blue-collar workers (%) 0.53 0.33 Fixed-term employment contacts (%) 0.03 0.08 Apprentices (%) 0.00 0.01 Temporary agency workers (%) 0.00 0.04 Mining and quarrying (C) 0.01 0.09 Manufacturing (D) 0.58 0.49 Electricity, gas and water supply (E) 0.00 0.06 Construction (F) 0.10 0.30 Wholesale and retail trade, repair of motor vehicles, motorcycles and personal and household goods (G) 0.12 0.33 Hotels and restaurant (H) 0.01 0.12 Transport, storage and communication (I) 0.06 0.23 Financial intermediation (J) 0.02 0.13 Real estate, renting and business activities (K) 0.10 0.30 Firm-level collective agreement (%) 0.32 0.46 Brussels 0.15 0.34 Flanders 0.57 0.48 Wallonia 0.28 0.43 Capital stock (€a) 236,013 2,095,986 Number of observations 6,714 Number of firms 1,844 a At 2004 constant prices. Own calculations based on SES-SBS data.
38

T
able
2: E
stim
ates
for
the
entir
e sa
mpl
e, th
ree
educ
atio
nal c
ateg
orie
s
GM
M-S
YS
LP
V
alue
add
ed p
er
hour
wor
ked
(ln)
Wag
e co
st pe
r ho
ur w
orke
d (ln
) V
alue
add
ed-w
age
cost
gap
c Pr
ofit
per h
our
wor
ked
(ln)d
Val
ue a
dded
per
ho
ur w
orke
d (ln
)
(1)
(2)
(3)
(4)
(5)
Lagg
ed d
epen
dent
var
iabl
e (ln
) 0.
657*
**
(0.0
57)
0.44
7***
(0
.135
) 0.
613*
**
(0.0
46)
0.45
0***
(0
.033
) 0.
791*
**
(0.0
43)
Shar
es o
f wor
kera :
Low
-edu
cate
d (E
12)
Refe
renc
e Re
fere
nce
Refe
renc
e Re
fere
nce
Refe
renc
e M
iddl
e-ed
ucat
ed (E
34)
0.
054*
* (0
.012
)
0.
027*
* (0
.013
)
0.
027
(0.0
21)
0.
084
(0.0
74)
0.
019*
* (0
.009
) H
igh-
educ
ated
(E56
7)
0.13
3***
(0
.040
) 0.
145*
**
(0.0
47)
0.05
5*
(0.0
31)
0.34
1***
(0
.130
) 0.
128*
**
(0.0
26)
Han
sen
over
-iden
tific
atio
n te
st, p
-val
ue
0.28
9 0.
132
0.61
9 0.
616
A
rella
no-B
ond
test
for A
R(2)
, p-v
alue
0.
129
0.34
2 0.
219
0.19
2
Num
ber o
f obs
erva
tions
6,
714
6,71
4 6,
714
6,71
4 6,
691
Num
ber o
f firm
s 1,
844
1,84
4 1,
844
1,84
4 1,
844
Chi
-squ
ared
sta
tistic
for e
qual
ity o
f re
gres
sion
coe
ffici
ents
, H0:
E34
= E5
67
4.50
**
6.24
**
1.15
5.
24**
17
.83*
**
Inte
rpre
tatio
nb : E1
2 <
E34
E12
< E3
4 E1
2 <
E567
E1
2 <
E567
E1
2 <
E34
E1
2 <
E567
E3
4< E
567
Ed
ucat
ion
incr
ease
s pr
oduc
tivity
E12
< E5
67
E34<
E56
7
Educ
atio
n in
crea
ses
wag
e co
sts
but
E12
= E3
4 E3
4 =
E567
E567
mor
e pr
ofita
ble
th
an E
12
E34
< E5
67
but
E12
= E3
4
E567
mor
e pr
ofita
ble
th
an E
12 a
nd E
34
E12
< E5
67
E34<
E56
7
Educ
atio
n in
crea
ses
prod
uctiv
ity
Not
es: *
** p
<0.0
1, *
* p<
0.05
, * p
<0.1
. Rob
ust s
tand
ard
erro
rs a
re r
epor
ted
betw
een
pare
nthe
ses.
Regr
essio
ns a
lso
cont
rol f
or: %
of
wor
kers
with
10
year
s of
tenu
re o
r m
ore;
% w
orke
rs y
oung
er th
an 3
0 an
d ol
der t
han
49 y
ears
, res
pect
ivel
y; %
wom
en; %
par
t-tim
e w
orke
rs; %
blu
e-co
llar w
orke
rs; %
wor
kers
with
fixe
d te
rm e
mpl
oym
ent
cont
ract
; % a
ppre
ntic
es; %
tem
pora
ry a
genc
y w
orke
rs; l
n of
firm
size
; ln
of c
apita
l sto
ck p
er w
orke
r; le
vel o
f col
lect
ive
wag
e ba
rgai
ning
; reg
ion
whe
re th
e fir
m is
loca
ted
(2
dum
mie
s); i
ndus
tries
(8 d
umm
ies)
, and
yea
rs d
umm
ies (
11).
AR
(2) r
efer
s to
seco
nd-o
rder
aut
ocor
rela
tion
in fi
rst-d
iffer
ence
d er
rors
. GM
M-S
YS
spec
ifica
tions
incl
ude
first
an
d se
cond
lags
of e
xpla
nato
ry v
aria
bles
(exc
ept t
ime
dum
mie
s) a
s in
strum
ents
. a Low
-edu
cate
d w
orke
rs (E
12) h
ave
at m
ost a
deg
ree
of lo
wer
sec
onda
ry sc
hool
. Mid
dle-
educ
ated
wor
kers
(E34
) hav
e at
mos
t a d
egre
e fr
om u
pper
(gen
eral
, tec
hnic
al o
r pro
fess
iona
l) se
cond
ary
scho
ol. H
igh-
educ
ated
wor
kers
(E56
7) h
ave
a te
rtiar
y ed
ucat
iona
l at
tain
men
t (i.e
. at l
east
a B
ache
lor’
s or e
quiv
alen
t deg
ree)
. b ‘<’ (
‘=’)
indi
cate
s if r
egre
ssio
n co
effic
ient
s are
(not
) sta
tistic
ally
diff
eren
t at t
he 1
0 pe
rcen
t lev
el. c V
alue
add
ed-
wag
e co
st g
ap =
ln(v
alue
add
ed p
er h
our)
– ln
(wag
e co
st p
er h
our)
. d ln(p
rofit
per
hou
r wor
ked)
= ln
(val
ue a
dded
per
hou
r – w
age
cost
per
hou
r).
39

T
able
3: E
stim
ates
acc
ordi
ng to
wor
kers
’ age
(thr
esho
ld =
40
year
s), t
hree
edu
catio
nal c
ateg
orie
s
GM
M-S
YS
LP
V
alue
add
ed p
er
hour
wor
ked
(ln)
Wag
e co
st pe
r ho
ur w
orke
d (ln
) V
alue
add
ed-w
age
cost
gap
c Pr
ofit
per h
our
wor
ked
(ln)d
Val
ue a
dded
per
ho
ur w
orke
d (ln
)
(1)
(2)
(3)
(4)
(5)
Lagg
ed d
epen
dent
var
iabl
e (ln
) 0.
659*
**
(0.0
58)
0.46
5***
(0
.138
) 0.
614*
**
(0.0
47)
0.45
1***
(0
.033
) 0.
792*
**
(0.0
43)
Shar
es o
f wor
kers
a :
You
ng lo
w-e
duca
ted
(YE1
2)
Refe
renc
e
Refe
renc
e Re
fere
nce
Refe
renc
e Re
fere
nce
Old
er lo
w-e
duca
ted
(OE1
2)
-0.0
28
(0.0
55)
-0.0
10
(0.0
39)
-0.0
34
(0.0
46)
0.03
8 (0
.172
) -0
.026
(0
.032
) Y
oung
mid
dle-
educ
ated
(YE3
4)
0.04
6 (0
.044
) 0.
004
(0.0
22)
0.04
0 (0
.043
) 0.
002
(0.1
24)
-0.0
17
(0.0
22)
Old
er m
iddl
e-ed
ucat
ed (O
E34)
0.
039
(0.0
47)
0.05
9*
(0.0
34)
-0.0
33
(0.0
43)
0.22
9 (0
.159
) 0.
035
(0.0
22)
You
ng h
igh-
educ
ated
(YE5
67)
0.15
8***
(0
.058
) 0.
096*
* (0
.048
) 0.
093*
* (0
.045
) 0.
466*
**
(0.1
78)
0.12
0***
(0
.033
) O
lder
hig
h-ed
ucat
ed (O
E567
) 0.
080
(0.0
69)
0.23
5***
(0
.080
) -0
.029
(0
.056
) 0.
152
(0.2
11)
0.10
6***
(0
.036
) H
anse
n ov
er-id
entif
icat
ion
test,
p-v
alue
0.
451
0.23
8 0.
799
0.66
3
Are
llano
-Bon
d te
st fo
r AR(
2), p
-val
ue
0.13
2 0.
306
0.22
4 0.
219
N
umbe
r of o
bser
vatio
ns
6,71
4 6,
714
6,71
4 6,
714
6,69
1 N
umbe
r of f
irms
1,84
4 1,
844
1,84
4 1,
844
1,84
4 C
hi-s
quar
ed s
tatis
tic fo
r equ
ality
of
regr
essi
on c
oeffi
cien
ts, H
0:
OE1
2 =
YE3
4 1.
94
0.17
2.
58
0.05
0.
13
OE1
2 =
OE3
4 2.
14
5.14
**
0.00
1.
96
5.27
**
OE1
2 =
YE5
67
8.62
***
4.21
**
6.38
**
5.10
**
20.3
9***
O
E12
= O
E567
2.
36
7.73
***
0.01
0.
29
11.2
5***
Y
E34
= O
E34
0.01
2.
22
1.43
1.
58
2.96
* Y
E34
= Y
E567
4.
68**
3.
48*
1.94
8.
13**
* 17
.51*
**
YE3
4 =
OE5
67
0.22
7.
58**
* 1.
26
0.54
8.
87**
* O
E34
= Y
E567
3.
01*
0.64
4.
34**
1.
55
9.34
***
OE3
4 =
OE5
67
0.36
5.
33**
0.
01
0.15
4.
62**
40

YE5
67 =
OE5
67
0.91
3.
88**
3.
11*
1.66
0.
19
Inte
rpre
tatio
nb :
a)
Am
ong
youn
g w
orke
rs:
Y
E12
< Y
E567
Y
E34
< Y
E567
bu
t Y
E12
= Y
E34
YE1
2 <
YE5
67
YE3
4 <
YE5
67
but
YE1
2 =
YE3
4
YE1
2 <
YE5
67
but
YE1
2 =
YE3
4 Y
E34
=YE5
67
YE1
2 <
YE5
67
YE3
4 <
YE5
67
but
YE1
2 =
YE3
4
YE1
2 <
YE5
67
YE3
4 <
YE5
67
but
YE1
2 =
YE3
4
Y
E567
si
gnifi
cant
ly
mor
e pr
oduc
tive
than
YE3
4 an
d Y
E12
YE5
67
sign
ifica
ntly
mor
e co
stly
than
YE3
4 an
d Y
E12
YE5
67
sign
ifica
ntly
m
ore
prof
itabl
e th
an Y
E12
YE5
67
sign
ifica
ntly
m
ore
prof
itabl
e th
an Y
E12
and
YE3
4
YE5
67
sign
ifica
ntly
m
ore
prod
uctiv
e th
an Y
E34
and
YE1
2
b)
Am
ong
olde
r wor
kers
:
OE1
2 =
OE3
4 O
E12
= O
E567
O
E34
= O
E567
Edu
catio
n ha
s no
sign
ifica
nt im
pact
on
pro
duct
ivity
OE1
2 <
OE3
4 O
E34
< O
E567
O
E12
< O
E567
Edu
catio
n in
crea
ses w
age
cost
s sig
nific
antly
OE1
2 =
OE3
4 O
E34
= O
E567
O
E12
= O
E567
Edu
catio
n ha
s no
sign
ifica
nt
impa
ct o
n pr
ofits
OE1
2 =
OE3
4 O
E34
= O
E567
O
E12
= O
E567
Edu
catio
n ha
s no
sign
ifica
nt
impa
ct o
n pr
ofits
OE1
2 <
OE3
4 O
E34
< O
E567
O
E12
< O
E567
Edu
catio
n in
crea
ses
prod
uctiv
ity
sign
ifica
ntly
N
otes
: **
p<0.
01, *
* p<
0.05
, * p
<0.1
. Rob
ust s
tand
ard
erro
rs a
re re
porte
d be
twee
n pa
rent
hese
s. Re
gres
sion
s al
so c
ontro
l for
: % o
f wor
kers
with
10
year
s of
tenu
re o
r mor
e;
% w
orke
rs y
oung
er th
an 3
0 an
d ol
der t
han
49 y
ears
, res
pect
ivel
y; %
wom
en; %
par
t-tim
e w
orke
rs; %
blu
e-co
llar w
orke
rs; %
wor
kers
with
fixe
d te
rm e
mpl
oym
ent c
ontra
ct;
% a
ppre
ntic
es;
% t
empo
rary
age
ncy
wor
kers
; ln
of
firm
siz
e; l
n of
cap
ital
stoc
k pe
r w
orke
r; le
vel
of c
olle
ctiv
e w
age
barg
aini
ng; r
egio
n w
here
the
firm
is
loca
ted
(2
dum
mie
s); i
ndus
tries
(8 d
umm
ies)
, and
yea
rs d
umm
ies (
11).
AR
(2) r
efer
s to
seco
nd-o
rder
aut
ocor
rela
tion
in fi
rst-d
iffer
ence
d er
rors
. Mod
els (
1) a
nd (3
) and
(4) i
nclu
de fi
rst
and
seco
nd la
gs o
f ex
plan
ator
y va
riabl
es (
exce
pt t
ime
dum
mie
s) a
s in
strum
ents
. Mod
el (
2) u
ses
first
and
third
lags
of
expl
anat
ory
varia
bles
(ex
cept
tim
e du
mm
ies)
as
instr
umen
ts. a Y
oung
(old
er) w
orke
rs a
re d
efin
ed a
s be
ing
less
than
(at
leas
t) 40
yea
rs o
ld. L
ow-e
duca
ted
wor
kers
(E12
) hav
e at
mos
t a d
egre
e of
low
er s
econ
dary
scho
ol.
Mid
dle-
educ
ated
wor
kers
(E3
4) h
ave
at m
ost a
deg
ree
from
upp
er (
gene
ral,
tech
nica
l or
pro
fess
iona
l) se
cond
ary
scho
ol. H
igh-
educ
ated
wor
kers
(E5
67)
have
a t
ertia
ry
educ
atio
nal a
ttain
men
t (i.e
. at l
east
a B
ache
lor’
s or
equ
ival
ent d
egre
e). b ‘<
’ (‘=
’) in
dica
tes
if re
gres
sion
coe
ffici
ents
are
(not
) sta
tistic
ally
diff
eren
t at t
he 1
0 pe
rcen
t lev
el. c
Val
ue a
dded
-wag
e co
st g
ap =
ln(v
alue
add
ed p
er h
our)
– ln
(wag
e co
st pe
r hou
r). d ln
(pro
fit p
er h
our w
orke
d) =
ln(v
alue
add
ed p
er h
our –
wag
e co
st p
er h
our)
.
41

T
able
4: E
stim
ates
acc
ordi
ng to
wor
kers
’ sex
, thr
ee e
duca
tiona
l cat
egor
ies
G
MM
-SY
S L
P
Val
ue a
dded
per
hou
r w
orke
d (ln
) W
age
cost
per h
our
wor
ked
(ln)
Val
ue a
dded
-wag
e co
st g
apc
Prof
it pe
r hou
r w
orke
d (ln
)d V
alue
add
ed p
er
hour
wor
ked
(ln)
(1
) (2
) (3
) (4
) (5
) La
gged
dep
ende
nt v
aria
ble
(ln)
0.66
1***
(0
.056
)
0.45
3***
(0
.135
) 0.
621*
**
(0.0
45)
0.45
4***
(0
.033
) 0.
791*
**
(0.0
43)
Shar
es o
f wor
kers
a :
Mal
e lo
w-e
duca
ted
(ME1
2)
Refe
renc
e
Refe
renc
e Re
fere
nce
Refe
renc
e Re
fere
nce
Fem
ale
low
-edu
cate
d (F
E12)
-0
.029
(0
.060
) -0
.060
(0
.049
) 0.
007
(0.0
46)
-0.2
25
(0.2
06)
-0.0
34
(0.0
26)
Mal
e m
iddl
e-ed
ucat
ed (M
E34)
0.
058*
* (0
.025
) 0.
031*
* (0
.016
) 0.
029
(0.0
24)
0.09
3 (0
.090
) 0.
009
(0.0
13)
Fem
ale
mid
dle-
educ
ated
(FE3
4)
0.01
4 (0
.060
) -0
.035
(0
.041
) 0.
019
(0.0
43)
-0.1
84
(0.1
69)
0.02
5 (0
.020
) M
ale
high
-edu
cate
d (M
E567
) 0.
101*
(0
.054
) 0.
150*
**
(0.0
50)
0.00
9 (0
.045
) 0.
238
(0.1
76)
0.11
9***
(0
.032
) Fe
mal
e hi
gh-e
duca
ted
(FE5
67)
0.15
1*
(0.0
77)
0.08
2 (0
.069
) 0.
125*
* (0
.051
) 0.
231
(0.2
03)
0.12
8***
(0
.039
) H
anse
n ov
er-id
entif
icat
ion
test,
p-v
alue
0.
319
0.13
8 0.
737
0.74
0
Are
llano
-Bon
d te
st fo
r AR(
2), p
-val
ue
0.12
9 0.
338
0.21
5 0.
177
N
umbe
r of o
bser
vatio
ns
6,71
4 6,
714
6,71
4 6,
714
6,69
1 N
umbe
r of f
irms
1,84
4 1,
844
1,84
4 1,
844
1,84
4 C
hi-s
quar
ed s
tatis
tic fo
r equ
ality
of
regr
essi
on c
oeffi
cien
ts, H
0:
FE12
= M
E34
2.36
4.
10**
0.
25
2.97
* 2.
71*
FE12
= F
E34
0.68
0.
43
0.08
0.
06
3.11
* FE
12 =
ME5
67
3.77
* 11
.30*
**
0.00
4.
24**
12
.33*
**
FE12
= F
E567
6.
09**
3.
44*
4.96
**
3.90
**
10.7
6***
M
E34
= FE
34
0.55
2.
88*
0.06
2.
95*
0.58
M
E34
= M
E567
0.
70
6.19
**
0.23
0.
81
14.6
8***
M
E34
= FE
567
1.42
0.
54
3.68
* 0.
51
9.29
***
FE34
= M
E567
1.
60
9.45
***
0.05
5.
02**
10
.60*
**
FE34
= F
E567
4.
35**
2.
57
4.51
**
4.33
**
5.38
**
42

ME5
67 =
FE5
67
0.31
1.
11
3.17
* 0.
00
0.05
In
terp
reta
tionb :
a)
Am
ong
mal
e w
orke
rs:
M
E12
< M
E567
M
E12
< M
E34
but
ME1
2 <
ME5
67
ME1
2 <
ME3
4 M
E34
< M
E567
ME1
2 =
ME5
67
ME1
2 =
ME3
4 M
E34
= M
E567
ME1
2 =
ME5
67
ME1
2 =
ME3
4 M
E34
= M
E567
ME1
2 <
ME5
67
ME3
4 <
ME5
67
but
M
E34
= M
E567
ME1
2 si
gnifi
cant
ly le
ss
prod
uctiv
e th
an
ME3
4 an
d
ME5
67
E
duca
tion
incr
ease
s wag
e co
sts
sign
ifica
ntly
E
duca
tion
has n
o si
gnifi
cant
im
pact
on
prof
its
E
duca
tion
has
no si
gnifi
cant
im
pact
on
prof
its
ME1
2 =
ME3
4
ME5
67
sign
ifica
ntly
m
ore
prod
uctiv
e th
an M
E12
and
ME3
4
b)
A
mon
g fe
mal
e w
orke
rs:
FE
12 <
FE5
67
FE34
< F
E567
bu
t FE
12 =
FE3
4
FE5
67
sign
ifica
ntly
mor
e pr
oduc
tive
than
FE
12 a
nd F
E34
FE12
< F
E567
bu
t FE
12 =
FE3
4 FE
34 =
FE5
67
F
E567
si
gnifi
cant
ly
mor
e co
stly
th
an F
E12
FE12
< F
E567
FE
34 <
FE5
67
but
FE12
= F
E34
F
E567
si
gnifi
cant
ly
mor
e pr
ofita
ble
than
FE1
2 an
d FE
34
FE12
< F
E567
FE
34 <
FE5
67
but
FE12
= F
E34
F
E567
si
gnifi
cant
ly
mor
e pr
ofita
ble
than
FE1
2 an
d FE
34
FE12
< F
E567
FE
12 <
FE3
4 FE
34 <
FE5
67
E
duca
tion
inc
reas
es
p
rodu
ctiv
ity
s
igni
fican
tly
Not
es: *
* p<
0.01
, **
p<0.
05, *
p<0
.1. R
obus
t sta
ndar
d er
rors
are
repo
rted
betw
een
pare
nthe
ses.
Regr
essi
ons
also
con
trol f
or: %
of w
orke
rs w
ith 1
0 ye
ars
of te
nure
or m
ore;
%
wor
kers
you
nger
than
30
and
olde
r tha
n 49
yea
rs, r
espe
ctiv
ely;
% w
omen
; % p
art-t
ime
wor
kers
; % b
lue-
colla
r wor
kers
; % w
orke
rs w
ith fi
xed
term
em
ploy
men
t con
tract
; %
app
rent
ices
; %
tem
pora
ry a
genc
y w
orke
rs;
ln o
f fir
m s
ize;
ln
of c
apita
l st
ock
per
wor
ker;
leve
l of
col
lect
ive
wag
e ba
rgai
ning
; reg
ion
whe
re t
he f
irm i
s lo
cate
d (2
du
mm
ies)
; ind
ustri
es (
8 du
mm
ies)
, and
yea
rs d
umm
ies
(11)
. AR
(2)
ref
ers
to s
econ
d-or
der
auto
corr
elat
ion
in f
irst-d
iffer
ence
d er
rors
. Mod
els
(1)
to (
4) in
clud
e fir
st a
nd
seco
nd la
gs o
f ex
plan
ator
y va
riabl
es (
exce
pt ti
me
dum
mie
s) a
s in
strum
ents
. a Low
-edu
cate
d w
orke
rs (
E12)
hav
e at
mos
t a d
egre
e of
low
er s
econ
dary
sch
ool.
Mid
dle-
educ
ated
wor
kers
(E34
) hav
e at
mos
t a d
egre
e fr
om u
pper
(gen
eral
, tec
hnic
al o
r pro
fess
iona
l) se
cond
ary
scho
ol. H
igh-
educ
ated
wor
kers
(E56
7) h
ave
a te
rtiar
y ed
ucat
iona
l at
tain
men
t (i.e
. at l
east
a B
ache
lor’
s or e
quiv
alen
t deg
ree)
. b ‘<’ (
‘=’)
indi
cate
s if r
egre
ssio
n co
effic
ient
s are
(not
) sta
tistic
ally
diff
eren
t at t
he 1
0 pe
rcen
t lev
el. c V
alue
add
ed-
wag
e co
st g
ap =
ln(v
alue
add
ed p
er h
our)
– ln
(wag
e co
st p
er h
our)
. d ln(p
rofit
per
hou
r wor
ked)
= ln
(val
ue a
dded
per
hou
r – w
age
cost
per
hou
r).
43

T
able
5: E
stim
ates
acc
ordi
ng to
wor
kers
’ sec
tori
al a
ffili
atio
n, th
ree
educ
atio
nal c
ateg
orie
s
GM
M-S
YS
LP
V
alue
add
ed p
er h
our
wor
ked
(ln)
Wag
e co
st pe
r hou
r w
orke
d (ln
) V
alue
add
ed-w
age
cost
gap
c Pr
ofit
per h
our
wor
ked
(ln)d
Val
ue a
dded
per
hou
r w
orke
d (ln
)
(1)
(2)
(3)
(4)
(5)
(6)
(7)
(8)
(9)
(10)
Indu
stry
Serv
ices
In
dustr
y Se
rvic
es
Indu
stry
Serv
ices
In
dustr
y Se
rvic
es
Indu
stry
Serv
ices
La
gged
dep
ende
nt
varia
ble
(ln)
0.64
0***
(0
.043
) 0.
588*
**
(0.1
35)
0.51
4***
(0
.107
) 0.
411*
* (0
.191
) 0.
581*
**
(0.0
32)
0.67
7***
(0
.82)
0.
404*
**
(0.0
38)
0.45
4***
(0
.048
) 0.
791*
**
(0.0
28)
0.74
8***
(0
.097
)
Shar
es o
f wor
kers
a :
Low
-edu
cate
d (E
12)
-0.0
40**
(0
.020
) -0
.104
* (0
.058
) -0
.031
**
(0.0
14)
-0.0
60**
(0
.027
) -0
.020
(0
.020
) -0
.051
(0
.049
) -0
.016
(0
.085
) -0
.280
* (0
.148
) -0
.009
(0
.012
) -0
.048
* (0
.028
) M
iddl
e-ed
ucat
ed (E
34)
Refe
renc
e
Refe
renc
e
Refe
renc
e Re
fere
nce
Re
fere
nce
Refe
renc
e
Refe
renc
e
Refe
renc
e
Refe
renc
e Re
fere
nce
H
igh-
educ
ated
(E56
7)
0.13
6**
(0.0
53)
0.17
7**
(0.0
89)
0.07
9*
(0.0
43)
0.21
7**
(0.0
99)
0.09
7***
(0
.045
) 0.
039
(0.0
29)
0.31
9**
(0.1
60)
0.28
1*
(0.1
70)
0.08
6***
(0
.028
) 0.
116*
* (0
.051
) H
anse
n ov
er-id
entif
icat
ion
test
, p-v
alue
0.
344
0.48
2 0.
350
0.34
3 0.
746
0.47
4 0.
775
0.24
7
Are
llano
-Bon
d te
st fo
r A
R(2)
, p-v
alue
0.
232
0.12
7 0.
428
0.48
9 0.
468
0.17
1 0.
843
0.10
7
Num
ber o
f obs
erva
tions
4,
511
2,01
5 4,
511
2,01
5 4,
511
2,01
5 4,
511
2,01
5 4,
501
2,00
3 N
umbe
r of f
irms
1,14
3 69
3 1,
143
693
1,14
3 69
3 1,
143
693
1,14
3 69
3 C
hi-s
quar
ed s
tatis
tic fo
r eq
ualit
y of
regr
essio
n co
effic
ient
s, H
0:
E12
= E5
67
11.9
4***
6.
85**
9.
02**
7.
64**
6.
44**
2.
65*
4.16
**
6.01
**
13.9
5***
11
.13*
**
Inte
rpre
tatio
nb : E1
2<E3
4 E1
2<E5
67
E34<
E567
Educ
atio
n in
crea
ses
prod
uctiv
ity
E12<
E34
E12<
E567
E3
4<E5
67
Ed
ucat
ion
incr
ease
s pr
oduc
tivity
E12<
E34
E12<
E567
E3
4<E5
67
Ed
ucat
ion
incr
ease
s w
age
cost
s
E12<
E34
E12<
E567
E3
4<E5
67
Ed
ucat
ion
incr
ease
s w
age
cost
s
E12<
E567
E3
4<E5
67
Ed
ucat
ion
incr
ease
s pr
ofits
E12<
E567
E567
mor
e pr
ofita
ble
than
E12
E12<
E567
E3
4<E5
67
E5
67 m
ore
prof
itabl
e th
an E
12
and
E34
E12<
E34
E12<
E567
E3
4<E5
67
Ed
ucat
ion
incr
ease
s pr
ofita
bilit
y
E12<
E567
E3
4<E5
67
Ed
ucat
ion
incr
ease
s pr
oduc
tivity
E12<
E34
E12<
E567
E3
4<E5
67
Ed
ucat
ion
incr
ease
s pr
oduc
tivity
Not
es: *
** p
<0.0
1, *
* p<
0.05
, * p
<0.1
. Rob
ust s
tand
ard
erro
rs a
re re
porte
d be
twee
n pa
rent
hese
s. Re
gres
sions
als
o co
ntro
l for
: % o
f wor
kers
with
10
year
s of
tenu
re o
r m
ore;
%
wor
kers
you
nger
tha
n 30
and
old
er t
han
49 y
ears
, res
pect
ivel
y; %
wom
en;
% p
art-t
ime
wor
kers
; % b
lue-
colla
r w
orke
rs;
% w
orke
rs w
ith f
ixed
ter
m e
mpl
oym
ent
cont
ract
; %
44

ap
pren
tices
; %
tem
pora
ry a
genc
y w
orke
rs; l
n of
firm
siz
e; ln
of
capi
tal
stoc
k pe
r w
orke
r; le
vel
of c
olle
ctiv
e w
age
barg
aini
ng; r
egio
n w
here
the
firm
is
loca
ted
(2 d
umm
ies)
; in
dustr
ies (
3 an
d 4
dum
mie
s, re
spec
tivel
y), a
nd y
ears
dum
mie
s (11
). A
R (2
) ref
ers t
o se
cond
-ord
er a
utoc
orre
latio
n in
firs
t-diff
eren
ced
erro
rs. M
odel
s (1)
to (5
) and
(7) i
nclu
de fi
rst
and
seco
nd l
ags
of e
xpla
nato
ry v
aria
bles
(ex
cept
tim
e du
mm
ies)
as
instr
umen
ts.
Mod
el (
6) i
nclu
des
first
and
thi
rd l
ags
of e
xpla
nato
ry v
aria
bles
(ex
cept
tim
e du
mm
ies)
as
instr
umen
ts. M
odel
(8) i
nclu
des
first
and
sec
ond
lags
of s
elec
ted
expl
anat
ory
varia
bles
(sha
res
of h
ours
by
educ
atio
n, a
ge, s
ex a
nd o
ccup
atio
n, la
gged
pro
fits
and
capi
tal s
tock
) as
instr
umen
ts. a L
ow-e
duca
ted
wor
kers
(E12
) hav
e at
mos
t a d
egre
e of
low
er s
econ
dary
scho
ol. M
iddl
e-ed
ucat
ed w
orke
rs (E
34) h
ave
at m
ost a
deg
ree
from
upp
er (g
ener
al, t
echn
ical
or
pro
fess
iona
l) se
cond
ary
scho
ol. H
igh-
educ
ated
wor
kers
(E5
67)
have
a t
ertia
ry e
duca
tiona
l at
tain
men
t (i.e
. at
leas
t a
Bach
elor
’s o
r eq
uiva
lent
deg
ree)
. b ‘
<’ in
dica
tes
whe
n re
gres
sion
coe
ffici
ents
are
sta
tistic
ally
diff
eren
t at t
he 1
0 pe
rcen
t lev
el.
c Val
ue a
dded
-wag
e co
st ga
p =
ln(v
alue
add
ed p
er h
our)
– ln
(wag
e co
st pe
r ho
ur).
d ln(p
rofit
per
hou
r w
orke
d) =
ln(v
alue
add
ed p
er h
our –
wag
e co
st p
er h
our)
.
45

App
endi
x 1:
OL
S (s
tatic
and
dyn
amic
) est
imat
es fo
r th
e en
tire
sam
ple,
thre
e ed
ucat
iona
l cat
egor
ies
V
alue
add
ed p
er
hour
wor
ked
(ln)
Wag
e co
st pe
r ho
ur w
orke
d (ln
) V
alue
add
ed-w
age
cost
gap
c Pr
ofit
per h
our
wor
ked
(ln)d
(1
) (2
) (3
) (4
) (5
) (6
) (7
) (8
) La
gged
dep
ende
nt v
aria
ble
(ln)
0.
839*
**
(0.0
38)
0.
765*
**
(0.0
99)
0.
839*
**
(0.0
26)
0.
839*
**
(0.0
38)
Shar
es o
f wor
kers
a :
Low
-edu
cate
d (E
12)
Re
fere
nce
Refe
renc
e Re
fere
nce
Refe
renc
e Re
fere
nce
Refe
renc
e Re
fere
nce
Refe
renc
e
Mid
dle-
educ
ated
(E34
)
0.05
1***
(0
.018
) 0.
020*
***
(0.0
10)
0.03
6***
(0
.010
) 0.
010*
(0
.006
) 0.
015
(0.0
14)
0.01
1 (0
.010
) 0.
051*
**
(0.0
18)
0.02
0*
(0.0
10)
Hig
hly
educ
ated
(E56
7)
0.75
2***
(0
.038
) 0.
131*
**
(0.0
30)
0.56
4***
(0
.023
) 0.
130*
* (0
.053
) 0.
188*
**
(0.0
28)
0.04
4***
(0
.016
) 0.
752*
**
(0.0
38)
0.13
1***
(0
.030
) R-
squa
red
0.43
1 0.
841
0.51
7 0.
819
0.23
2 0.
748
0.43
1 0.
841
F-st
at (j
oint
sign
ifica
nce)
, p-v
alue
0.
00
0.00
0.
00
0.00
0.
00
0.00
0.
00
0.00
N
umbe
r of o
bser
vatio
ns
6,71
4 6,
714
6,71
4 6,
714
6,71
4 6,
714
6,71
4 6,
714
Num
ber o
f firm
s 1,
844
1,84
4 1,
844
1,84
4 1,
844
1,84
4 1,
844
1,84
4 F-
stat
istic
for e
qual
ity o
f reg
ress
ion
coef
ficie
nts,
H0:
E34
= E5
67
203.
58**
* 9.
71**
* 29
1.16
***
3.09
**
42.9
2***
6.
64**
* 20
3.58
***
9.71
***
Inte
rpre
tatio
nb : E1
2<E3
4 E1
2<E5
67
E34<
E567
Educ
atio
n in
crea
ses
prod
uctiv
ity
E12<
E34
E12<
E567
E3
4<E5
67
Ed
ucat
ion
incr
ease
s pr
oduc
tivity
E12<
E34
E12<
E567
E3
4<E5
67
Ed
ucat
ion
incr
ease
s w
age
cost
s
E12<
E34
E12<
E567
E3
4<E5
67
Ed
ucat
ion
incr
ease
s w
age
cost
s
E12<
E567
E3
4<E5
67
E5
67 m
ore
prof
itabl
e
than
E12
an
d E3
4
E12<
E567
E3
4<E5
67
E5
67 m
ore
prof
itabl
e
than
E12
an
d E3
4
E12<
E34
E12<
E567
E3
4<E5
67
Ed
ucat
ion
incr
ease
s pr
ofita
bilit
y
E12<
E34
E12<
E567
E3
4<E5
67
Ed
ucat
ion
incr
ease
s pr
ofita
bilit
y
Not
es: *
** p
<0.0
1, *
* p<
0.05
, * p
<0.1
. Rob
ust s
tand
ard
erro
rs a
re re
porte
d be
twee
n pa
rent
hese
s. Re
gres
sions
als
o co
ntro
l for
: % o
f wor
kers
with
10
year
s of
tenu
re o
r m
ore;
%
wor
kers
you
nger
tha
n 30
and
old
er t
han
49 y
ears
, res
pect
ivel
y; %
wom
en;
% p
art-t
ime
wor
kers
; % b
lue-
colla
r w
orke
rs;
% w
orke
rs w
ith f
ixed
ter
m e
mpl
oym
ent
cont
ract
; %
ap
pren
tices
; %
tem
pora
ry a
genc
y w
orke
rs; l
n of
firm
siz
e; ln
of
capi
tal
stoc
k pe
r w
orke
r; le
vel
of c
olle
ctiv
e w
age
barg
aini
ng; r
egio
n w
here
the
firm
is
loca
ted
(2 d
umm
ies)
; in
dustr
ies
(8 d
umm
ies)
, and
yea
rs d
umm
ies
(11)
. a Low
-edu
cate
d w
orke
rs (E
12) h
ave
at m
ost a
deg
ree
of lo
wer
sec
onda
ry sc
hool
. Mid
dle-
educ
ated
wor
kers
(E34
) hav
e at
mos
t a
degr
ee f
rom
upp
er (
gene
ral,
tech
nica
l or
pro
fess
iona
l) se
cond
ary
scho
ol.
Hig
h-ed
ucat
ed w
orke
rs (
E567
) ha
ve a
ter
tiary
edu
catio
nal
atta
inm
ent
(i.e.
at
leas
t a
Bach
elor
’s o
r eq
uiva
lent
deg
ree)
. b ‘<’ i
ndic
ates
whe
n re
gres
sion
coe
ffici
ents
are
stat
istic
ally
diff
eren
t at t
he 1
0 pe
rcen
t lev
el. c V
alue
add
ed-w
age
cost
gap
= ln
(val
ue a
dded
per
hou
r) –
ln(w
age
cost
per
hou
r). d ln
(pro
fit p
er h
our w
orke
d) =
ln(v
alue
add
ed p
er h
our –
wag
e co
st p
er h
our)
.
46

App
endi
x 2:
OL
S (s
tatic
and
dyn
amic
) est
imat
es fo
r th
e en
tire
sam
ple,
seve
n ed
ucat
iona
l cat
egor
ies
V
alue
add
ed p
er
hour
wor
ked
(ln)
Wag
e co
st pe
r ho
ur w
orke
d (ln
) V
alue
add
ed-w
age
co
st g
apb
Prof
it pe
r hou
r w
orke
d (ln
)c
(1)
(2)
(3)
(4)
(5)
(6)
(7)
(8)
Lagg
ed d
epen
dent
var
iabl
e (ln
)
0.83
5***
(0
.039
)
0.75
7***
(0
.101
)
0.83
8***
(0
.026
)
0.73
8***
(0
.016
) Sh
ares
of w
orke
rs:
Prim
ary
educ
atio
n (E
1)
Re
fere
nce
Refe
renc
e Re
fere
nce
Refe
renc
e Re
fere
nce
Refe
renc
e Re
fere
nce
Refe
renc
e
Low
er s
econ
dary
(E2)
-0
.002
(0
.026
) 0.
001
(0.0
15)
-0.0
27
(0.0
17)
-0.0
04
(0.0
09)
0.02
5 (0
.020
) 0.
003
(0.0
14)
-0.0
01
(0.0
73)
-0.0
12
(0.0
51)
Gen
eral
upp
er s
econ
dary
educ
atio
n (E
3)
0.08
4***
(0
.029
) 0.
036*
* (0
.015
) 0.
021
(0.0
17)
0.00
8 (0
.009
) 0.
062*
**
(0.0
22)
0.02
9**
(0.0
13)
0.20
4***
(0
.080
) 0.
105*
(0
.056
)
Tech
nica
l and
pro
fess
iona
l upp
er
seco
ndar
y ed
ucat
ion
(E4)
0.
039
(0.0
28)
0.01
2 (0
.014
) 0.
023
(0.0
17)
0.01
0 (0
.009
) 0.
016
(0.0
21)
0.00
3 (0
.012
) 0.
028
(0.0
74)
-0.0
12
(0.0
52)
Bach
elor
’s o
r equ
ival
ent l
evel
(E5)
0.48
3***
(0
.049
) 0.
078*
**
(0.0
28)
0.33
8***
(0
.031
) 0.
075*
* (0
.036
) 0.
142*
**
(0.0
36)
0.02
7 (0
.020
) 0.
633*
**
(0.1
25)
0.15
9*
(0.0
85)
Mas
ter’
s or e
quiv
alen
t lev
el (E
6)
0.
993*
**
(0.0
65)
0.20
0***
(0
.043
) 0.
736*
**
(0.0
38)
0.18
6***
(0
.072
) 0.
263*
**
(0.0
50)
0.07
6***
(0
.023
) 1.
425*
**
(0.1
42)
0.48
8***
(0
.094
) Po
st-M
aste
r’s l
evel
or P
hD (E
7)
2.
265*
**
(0.4
10)
0.33
8**
(0.1
55)
1.39
1***
(0
.229
) 0.
317*
* (0
.160
) 0.
859*
**
(0.3
01)
0.11
8 (0
.120
) 3.
299*
**
(0.6
41)
0.84
0***
(0
.314
) R-
squa
red
0.44
4 0.
841
0.53
4 0.
820
0.23
6 0.
748
0.33
8 0.
685
F-st
at (j
oint
sign
ifica
nce)
, p-v
alue
0.
00
0.00
0.
00
0.00
0.
00
0.00
0.
00
0.00
N
umbe
r of o
bser
vatio
ns
6,71
4 6,
714
6,71
4 6,
714
6,71
4 6,
714
6,71
4 6,
714
Num
ber o
f firm
s 1,
844
1,84
4 1,
844
1,84
4 1,
844
1,84
4 1,
844
1,84
4 F-
stat
istic
for e
qual
ity o
f reg
ress
ion
coef
ficie
nts,
H0:
E2 =
E3
13.7
2***
5.
97**
13
.46*
**
1.71
3.
96**
3.
81*
10.9
5***
7.
21**
* E2
= E
4 3.
44*
0.70
15
.04*
**
3.36
* 0.
25
0.00
0.
25
0.00
E2
= E
5 11
0.22
***
7.84
***
163.
88**
* 4.
47*
12.1
3***
1.
57
30.1
1***
4.
74**
E2
= E
6 25
2.80
***
21.6
6***
45
5.08
***
6.58
**
23.5
6***
8.
51**
* 11
2.42
***
31.2
0***
E2
= E
7 30
.62*
**
4.73
**
38.1
6***
3.
94**
7.
71**
* 0.
90
26.6
4***
7.
43**
* E3
= E
4 3.
76*
3.70
* 0.
01
0.05
7.
04**
* 6.
35**
8.
84**
* 8.
10**
* E3
= E
5 70
.57*
**
2.83
* 11
8.04
***
4.21
**
5.21
**
0.02
13
.97*
**
0.51
E3
= E
6 21
6.98
***
17.6
1***
39
6.86
***
6.64
***
18.2
7***
4.
87**
87
.41*
**
20.3
9***
47

E3 =
E7
28.6
0***
3.
95**
35
.86*
**
3.88
**
7.12
***
0.56
23
.62*
**
5.60
**
E4 =
E5
85.2
7***
6.
10**
10
9.90
***
3.54
* 13
.07*
**
1.62
28
.10*
**
5.45
**
E4 =
E6
232.
89**
* 20
.83*
**
371.
83**
* 6.
17*
27.9
9***
11
.75*
**
109.
10**
* 31
.69*
**
E4 =
E7
29.6
4***
4.
51**
35
.40*
**
3.74
* 7.
98**
* 0.
94
26.2
7***
7.
50**
* E5
= E
6 41
.66*
**
11.2
1***
88
.24*
**
6.63
***
3.83
* 2.
97*
222.
89**
* 9.
94**
* E5
= E
7 18
.22*
**
2.96
* 20
.46*
**
3.35
* 5.
43**
0.
54
16.7
7***
4.
53**
E6
= E
7 9.
51**
* 0.
91
7.58
***
1.47
4.
15**
0.
13
8.17
***
1.16
In
terp
reta
tiona :
E1<E
(3,5
,6,7
) E2
<E(3
,4,5
,6,7
) E3
<E(4
,5,6
) E4
<E(5
,6,7
) E5
<E(6
,7)
E6<E
7
Educ
atio
n in
crea
ses
prod
uctiv
ity
E1<E
(3,5
,6,7
) E2
<E(3
,5,6
,7)
E3<E
(4,5
,6,7
) E4
<E(5
,6,7
) E5
<E(6
,7)
Ed
ucat
ion
incr
ease
s pr
oduc
tivity
E1<E
(5,6
,7)
E2<E
(3,4
,5,6
,7)
E3<E
(5,6
,7)
E4<E
(6,7
) E5
<E(6
,7)
E6<E
7
Educ
atio
n in
crea
ses
wag
e co
sts
E1<E
(5,6
,7)
E2<E
(4,5
,6,7
) E3
<E(5
,6,7
) E4
<E(5
,6,7
) E5
<E(6
,7)
E6<E
7
Educ
atio
n in
crea
ses
wag
e co
sts
E1<E
(3,5
,6,7
) E2
<E(3
,5,6
,7)
E3<E
(4,5
,6,7
) E4
<E(5
,6,7
) E5
<E(6
,7)
E6<E
7
Educ
atio
n in
crea
ses
prof
itabi
lity
E1<E
(3,6
) E2
<E(3
,6)
E3<E
(4,6
) E4
<E6
E5<E
6
Educ
atio
n in
crea
ses
prof
itabi
lity
E1<E
(3,5
,6,7
) E2
<E(3
,5,6
,7)
E3<E
(4,5
,6,7
) E4
<E(5
,6,7
) E5
<E(6
,7)
E6<E
7
Educ
atio
n in
crea
ses
prof
itabi
lity
E1<E
(3,5
,6,7
) E2
<E(3
,5,6
,7)
E3<E
(4,6
,7)
E4<E
(5,6
,7)
E5<E
(6,7
)
Educ
atio
n in
crea
ses
prof
itabi
lity
Not
es: *
** p
<0.0
1, *
* p<
0.05
, * p
<0.1
. Rob
ust s
tand
ard
erro
rs a
re re
porte
d be
twee
n pa
rent
hese
s. Re
gres
sions
als
o co
ntro
l for
: % o
f wor
kers
with
10
year
s of
tenu
re o
r m
ore;
%
wor
kers
you
nger
tha
n 30
and
old
er t
han
49 y
ears
, res
pect
ivel
y; %
wom
en;
% p
art-t
ime
wor
kers
; % b
lue-
colla
r w
orke
rs;
% w
orke
rs w
ith f
ixed
ter
m e
mpl
oym
ent
cont
ract
; %
ap
pren
tices
; %
tem
pora
ry a
genc
y w
orke
rs; l
n of
firm
siz
e; ln
of
capi
tal
stoc
k pe
r w
orke
r; le
vel
of c
olle
ctiv
e w
age
barg
aini
ng; r
egio
n w
here
the
firm
is
loca
ted
(2 d
umm
ies)
; in
dustr
ies
(8 d
umm
ies)
, and
yea
rs d
umm
ies
(11)
. a ‘<’
indi
cate
s w
hen
regr
essi
on c
oeffi
cien
ts a
re s
tatis
tical
ly d
iffer
ent a
t the
10
perc
ent
leve
l. b V
alue
add
ed-w
age
cost
gap
=
ln(v
alue
add
ed p
er h
our)
– ln
(wag
e co
st p
er h
our)
. c ln(p
rofit
per
hou
r wor
ked)
= ln
(val
ue a
dded
per
hou
r – w
age
cost
per
hou
r).
48

A
ppen
dix
3: E
stim
ates
for
the
entir
e sa
mpl
e, se
ven
educ
atio
nal c
ateg
orie
s
GM
M-S
YS
LP
V
alue
add
ed p
er
hour
wor
ked
(ln)
Wag
e co
st pe
r ho
ur w
orke
d (ln
) V
alue
add
ed-w
age
cost
gap
b Pr
ofit
per h
our
wor
ked
(ln)c
Val
ue a
dded
per
ho
ur w
orke
d (ln
)
(1)
(2)
(3)
(4)
(5)
Lagg
ed d
epen
dent
var
iabl
e (ln
) 0.
664*
**
(0.0
56)
0.47
1***
(0
.137
) 0.
466*
**
(0.0
31)
0.46
6***
(0
.031
) 0.
785*
**
(0.0
44)
Shar
es o
f wor
kers
:
Prim
ary
educ
atio
n (E
1)
Re
fere
nce
Refe
renc
e Re
fere
nce
Refe
renc
e Re
fere
nce
Low
er s
econ
dary
(E2)
0.
018
(0.0
28)
-0.0
15
(0.0
23)
0.03
0 (0
.025
) 0.
150
(0.0
98)
0.00
4 (0
.018
) G
ener
al u
pper
sec
onda
ry ed
ucat
ion
(E3)
0.06
8**
(0.0
30)
0.00
1 (0
.022
) 0.
064*
* (0
.026
) 0.
220*
* (0
.105
) 0.
037*
* (0
.017
) Te
chni
cal a
nd p
rofe
ssio
nal u
pper
sec
onda
ry
educ
atio
n (E
4)
0.06
8**
(0.0
30)
0.02
3 (0
.023
) 0.
041*
(0
.023
) 0.
177*
(0
.104
) 0.
014
(0.0
15)
Bach
elor
’s o
r equ
ival
ent l
evel
(E5)
0.12
2***
(0
.047
) 0.
056
(0.0
40)
0.08
5**
(0.0
35)
0.40
9**
(0.1
69)
0.07
1***
(0
.022
) M
aste
r’s o
r equ
ival
ent l
evel
(E6)
0.19
9***
(0
.061
) 0.
243*
**
(0.0
74)
0.08
2*
(0.0
42)
0.55
8***
(0
.165
) 0.
205*
**
(0.0
55)
Post
-Mas
ter’
s lev
el o
r PhD
(E7)
0.36
6**
(0.1
61)
0.29
5*
(0.1
63)
0.23
5*
(0.1
41)
1.07
1***
(0
.383
) 0.
392*
**
(0.1
42)
Han
sen
over
-iden
tific
atio
n te
st, p
-val
ue
0.48
7 0.
154
0.68
6 0.
707
A
rella
no-B
ond
test
for A
R(2)
, p-v
alue
0.
129
0.28
4 0.
217
0.16
3
Num
ber o
f obs
erva
tions
6,
714
6,71
4 6,
714
6,71
4 6,
691
Num
ber o
f firm
s 1,
844
1,84
4 1,
844
1,84
4 1,
844
Chi
-squ
ared
stat
istic
for e
qual
ity o
f reg
ress
ion
coef
ficie
nts,
H0:
E2 =
E3
3.63
* 1.
36
1.78
0.
75
4.72
**
E2 =
E4
4.40
**
5.13
**
0.28
0.
09
0.55
E2
= E
5 5.
21**
2.
81*
2.84
* 2.
79*
11.6
7***
E2
= E
6 8.
48**
* 10
.61*
**
1.41
7.
48**
* 14
.22*
**
E2 =
E7
4.65
**
3.47
* 2.
18
6.05
**
7.62
***
E3 =
E4
0.00
2.
14
1.34
0.
36
3.35
* E3
= E
5 1.
35
1.73
0.
41
1.83
2.
59
49

E3 =
E6
5.25
**
9.73
* 0.
20
5.70
**
12.7
8***
E3
= E
7 3.
51*
3.14
* 1.
55
5.20
**
6.20
**
E4 =
E5
1.33
0.
57
1.94
2.
52
6.64
***
E4 =
E6
4.74
**
7.81
***
1.02
6.
52**
14
.60*
**
E4 =
E7
3.48
* 2.
60
1.94
5.
83**
7.
31**
* E5
= E
6 1.
14
8.75
***
0.00
0.
73
6.50
***
E5 =
E7
2.37
2.
64
1.10
2.
82*
5.78
**
E6 =
E7
1.16
0.
15
1.22
1.
70
1.39
In
terp
reta
tiona :
E1 <
E(3
,4,5
,6,7
) E2
< E
(3,4
,5,6
,7)
E3 <
E(4
,5,6
,7)
E4 <
E(5
,6,7
) E5
< E
(6,7
) E6
<E7
Educ
atio
n in
crea
ses
prod
uctiv
ity
E1 <
E(6
,7)
E2 <
E(4
,5,6
,7)
E3 <
E(6
,7)
E4 <
E6
E5 <
E6
Ed
ucat
ion
incr
ease
s w
age
cost
s
E1 <
E(3
,4,5
,6,7
) E2
< E
5
Low
-edu
cate
d le
ss
prod
uctiv
e th
an
mor
e ed
ucat
ed
E1 <
E(3
,4,5
,6,7
) E2
< E
(5,6
,7)
E3 <
E(6
,7)
E4 <
E(6
,7)
E5 <
E7
Ed
ucat
ion
incr
ease
s pr
ofita
bilit
y
E1 <
E(3
,5,6
,7)
E2 <
E(3
,5,6
,7)
E3 <
E(4
,6,7
) E4
< E
(5,6
,7)
E5 <
E(6
,7)
Ed
ucat
ion
incr
ease
s pr
oduc
tivity
N
otes
: ***
p<0
.01,
**
p<0.
05, *
p<0
.1. R
obus
t sta
ndar
d er
rors
are
repo
rted
betw
een
pare
nthe
ses.
Regr
essio
ns a
lso
cont
rol f
or: %
of w
orke
rs w
ith 1
0 ye
ars
of te
nure
or
mor
e; %
w
orke
rs y
oung
er t
han
30 a
nd o
lder
tha
n 49
yea
rs, r
espe
ctiv
ely;
% w
omen
; %
par
t-tim
e w
orke
rs; %
blu
e-co
llar
wor
kers
; %
wor
kers
with
fix
ed t
erm
em
ploy
men
t co
ntra
ct;
%
appr
entic
es;
% t
empo
rary
age
ncy
wor
kers
; ln
of f
irm s
ize;
ln o
f ca
pita
l st
ock
per
wor
ker;
leve
l of
col
lect
ive
wag
e ba
rgai
ning
; reg
ion
whe
re th
e fir
m i
s lo
cate
d (2
dum
mie
s);
indu
strie
s (8
dum
mie
s), a
nd y
ears
dum
mie
s (11
). A
R (2
) ref
ers t
o se
cond
-ord
er a
utoc
orre
latio
n in
firs
t-diff
eren
ced
erro
rs. G
MM
-SY
S sp
ecifi
catio
ns in
clud
e fir
st a
nd se
cond
lags
of
expl
anat
ory
varia
bles
(exc
ept t
ime
dum
mie
s) a
s in
strum
ents
. a ‘<’ i
ndic
ates
whe
n re
gres
sion
coe
ffici
ents
are
stat
istic
ally
diff
eren
t at t
he 1
0 pe
rcen
t lev
el. b V
alue
add
ed-w
age
cost
gap
= ln
(val
ue a
dded
per
hou
r) –
ln(w
age
cost
per
hou
r). c ln
(pro
fit p
er h
our w
orke
d) =
ln(v
alue
add
ed p
er h
our –
wag
e co
st p
er h
our)
.
50

App
endi
x 4:
Fir
m-le
vel s
hare
s of h
ours
wor
ked
acco
rdin
g to
wor
kers
’ edu
catio
nal l
evel
, age
, sex
and
sect
oria
l aff
iliat
ion
(199
9-20
10)
Cat
egor
ies:
Lo
wer
ed
ucat
ion
(E12
)
Mid
dle
educ
atio
n (E
34)
Hig
her
educ
atio
n (E
567)
Prim
ary
educ
atio
n (E
1)
Low
er &
upp
er
seco
ndar
y (E
234)
Bach
elor
’s o
r eq
uiva
lent
leve
l (E
5)
Mas
ters
’s o
r equ
ival
ent l
evel
&
Pos
t-Mas
ter a
nd P
hD
(E67
)
(1)
(2)
(3)
(4)
(5)
(6)
(7)
Age:
Wor
kers
< 4
0 ye
ars
0.13
1 0.
235
0.16
4 0.
026
0.34
0 0.
097
0.06
7 W
orke
rs
40
year
s 0.
167
0.19
1 0.
112
0.04
8 0.
311
0.06
0 0.
052
Sex:
Wom
en
0.06
1 0.
108
0.09
1 0.
016
0.15
3 0.
059
0.03
2 M
en
0.23
7 0.
318
0.18
5 0.
058
0.49
7 0.
098
0.08
7 Se
ctor
of a
ctiv
ity:
In
dustr
ya 0.
340
0.43
4 0.
225
0.08
6 0.
696
0.12
8 0.
090
Serv
ices
b 0.
205
0.41
1 0.
384
0.05
7 0.
558
0.22
2 0.
164
Not
es :
Num
ber o
f obs
erva
tions
= 6
,714
. Num
ber o
f firm
s = 1
,844
. a NA
CE c
odes
C to
F. b N
ACE
cod
es G
to K
.
51

A
ppen
dix
5: E
stim
ates
acc
ordi
ng to
wor
kers
’ age
, fou
r ed
ucat
iona
l cat
egor
ies
G
MM
-SY
S L
P
Val
ue a
dded
pe
r hou
r w
orke
d (ln
) 40
yea
rs
thre
shol
d a
Wag
e co
st
per h
our
wor
ked
(ln)
40 y
ears
th
resh
old a
Val
ue a
dded
-w
age
co
st g
apd
40 y
ears
th
resh
old a
Prof
it
per h
our
wor
ked
(ln)e
40 y
ears
th
resh
old a
Prof
it
per h
our
wor
ked
(ln)e
50 y
ears
th
resh
old b
Val
ue a
dded
pe
r hou
r w
orke
d (ln
) 40
yea
rs
thre
shol
d a
(1
) (2
) (3
) (4
) (5
) (6
) La
gged
dep
ende
nt v
aria
ble
(ln)
0.66
6***
(0
.055
) 0.
477*
**
(0.1
36)
0.61
6***
(0
.045
) 0.
464*
**
(0.0
33)
0.45
8***
(0
.033
) 0.
787*
**
(0.0
43)
Shar
es o
f wor
kers
:
You
ng &
prim
ary
educ
atio
n (Y
E1)
-0.1
65**
* (0
.062
) -0
.060
(0
.042
) -0
.096
**
(0.0
44)
-0.3
84*
(0.2
10)
-0.1
50
(0.1
22)
-0.0
21
(0.0
30)
Old
er &
prim
ary
educ
atio
n (O
E1)
0.04
4 (0
.060
) 0.
054
(0.0
42)
-0.0
25
(0.0
52)
0.26
0 (0
.188
) 0.
195
(0.3
32)
-0.0
38
(0.0
33)
You
ng &
low
er o
r upp
er se
cond
ary
educ
atio
n (Y
E234
) Re
fere
nce
Refe
renc
e Re
fere
nce
Refe
renc
e Re
fere
nce
Refe
renc
e
Old
er &
low
er o
r upp
er s
econ
dary
ed
ucat
ion
(OE2
34)
-0.0
27
(0.0
47)
0.00
6 (0
.032
) -0
.050
(0
.042
) 0.
128
(0.1
44)
0.07
9 (0
.195
) -0
.029
(0
.027
) Y
oung
& B
ache
lor’
s or e
quiv
alen
t de
gree
(YE5
) 0.
130*
* (0
.063
) 0.
057
(0.0
47)
0.07
4*
(0.0
45)
0.47
6**
(0.1
98)
0.27
5*
(0.1
67)
0.06
0*
(0.0
32)
Old
er &
Bac
helo
r’s o
r equ
ival
ent
degr
ee (O
E5)
-0.0
45
(0.0
81)
0.07
3 (0
.071
) -0
.050
(0
.061
) -0
.013
(0
.248
) 0.
200
(0.4
38)
-0.0
03
(0.0
36)
You
ng &
Mas
ters
’s o
r equ
ival
ent
degr
ee o
r bey
ond
(YE6
7)
0.12
4 (0
.078
) 0.
132*
(0
.075
) 0.
072
(0.0
49)
0.46
3**
(0.1
92)
0.34
3**
(0.1
58)
0.20
1***
(0
.046
) O
lder
& M
aste
rs’s
or e
quiv
alen
t de
gree
or b
eyon
d (O
E67)
0.
188*
* (0
.087
) 0.
421*
**
(0.1
23)
-0.0
06
(0.0
71)
0.56
8**
(0.2
50)
0.81
3*
(0.4
41)
0.13
7**
(0.0
61)
Han
sen
over
-iden
tific
atio
n te
st, p
-val
ue
0.47
4 0.
402
0.60
6 0.
704
0.56
7
Are
llano
-Bon
d te
st fo
r AR(
2), p
-val
ue
0.12
4 0.
287
0.21
7 0.
192
0.23
3
Num
ber o
f obs
erva
tions
6,
714
6,71
4 6,
714
6,71
4 6,
714
6,69
1 N
umbe
r of f
irms
1,84
4 1,
844
1,84
4 1,
844
1,84
4 1,
844
Chi
-squ
ared
sta
tistic
for e
qual
ity o
f re
gres
sion
coe
ffici
ents
, H0:
YE1
= O
E1
4.19
**
2.65
* 0.
82
3.95
**
0.78
0.
10
YE1
= O
E234
3.
83*
2.26
0.
64
4.88
**
1.14
0.
04
YE1
= Y
E5
13.5
3***
3.
46*
8.12
***
9.58
***
4.31
**
2.78
*
52
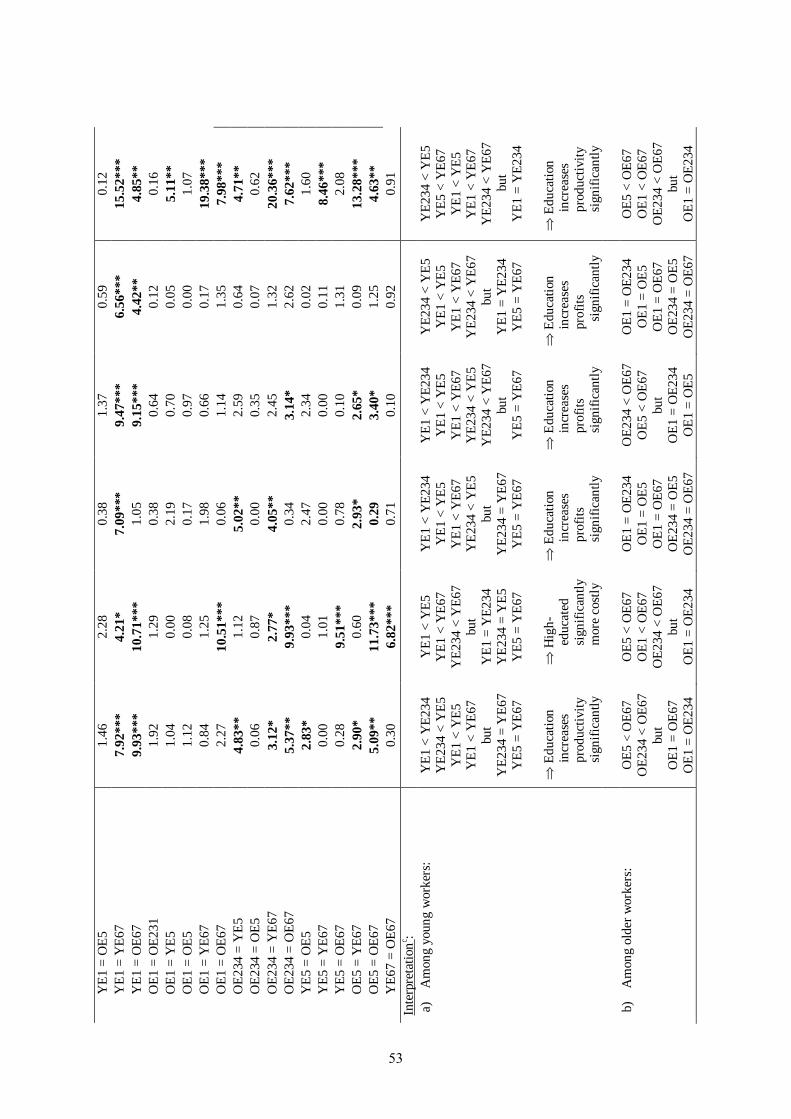
YE1
= O
E5
1.46
2.
28
0.38
1.
37
0.59
0.
12
YE1
= Y
E67
7.92
***
4.21
* 7.
09**
* 9.
47**
* 6.
56**
* 15
.52*
**
YE1
= O
E67
9.93
***
10.7
1***
1.
05
9.15
***
4.42
**
4.85
**
OE1
= O
E231
1.
92
1.29
0.
38
0.64
0.
12
0.16
O
E1 =
YE5
1.
04
0.00
2.
19
0.70
0.
05
5.11
**
OE1
= O
E5
1.12
0.
08
0.17
0.
97
0.00
1.
07
OE1
= Y
E67
0.84
1.
25
1.98
0.
66
0.17
19
.38*
**
OE1
= O
E67
2.27
10
.51*
**
0.06
1.
14
1.35
7.
98**
* O
E234
= Y
E5
4.83
**
1.12
5.
02**
2.
59
0.64
4.
71**
O
E234
= O
E5
0.06
0.
87
0.00
0.
35
0.07
0.
62
OE2
34 =
YE6
7 3.
12*
2.77
* 4.
05**
2.
45
1.32
20
.36*
**
OE2
34 =
OE6
7 5.
37**
9.
93**
* 0.
34
3.14
* 2.
62
7.62
***
YE5
= O
E5
2.83
* 0.
04
2.47
2.
34
0.02
1.
60
YE5
= Y
E67
0.00
1.
01
0.00
0.
00
0.11
8.
46**
* Y
E5 =
OE6
7 0.
28
9.51
***
0.78
0.
10
1.31
2.
08
OE5
= Y
E67
2.90
* 0.
60
2.93
* 2.
65*
0.09
13
.28*
**
OE5
= O
E67
5.09
**
11.7
3***
0.
29
3.40
* 1.
25
4.63
**
YE6
7 =
OE6
7 0.
30
6.82
***
0.71
0.
10
0.92
0.
91
Inte
rpre
tatio
nc :
a)
A
mon
g yo
ung
wor
kers
:
YE1
< Y
E234
Y
E234
< Y
E5
YE1
< Y
E5
YE1
< Y
E67
but
YE2
34 =
YE6
7
YE5
= Y
E67
E
duca
tion
incr
ease
s pr
oduc
tivity
si
gnifi
cant
ly
YE1
< Y
E5
YE1
< Y
E67
YE2
34 <
YE6
7
but
YE1
= Y
E234
Y
E234
= Y
E5
YE5
= Y
E67
H
igh-
educ
ated
si
gnifi
cant
ly
mor
e co
stly
YE1
< Y
E234
Y
E1 <
YE5
Y
E1 <
YE6
7 Y
E234
< Y
E5
but
YE2
34 =
YE6
7 Y
E5 =
YE6
7
Edu
catio
n in
crea
ses
prof
its
sign
ifica
ntly
YE1
< Y
E234
Y
E1 <
YE5
Y
E1 <
YE6
7 Y
E234
< Y
E5
YE2
34 <
YE6
7
but
YE5
= Y
E67
E
duca
tion
inc
reas
es
p
rofit
s
sig
nific
antly
YE2
34 <
YE5
Y
E1 <
YE5
Y
E1 <
YE6
7 Y
E234
< Y
E67
but
YE1
= Y
E234
Y
E5 =
YE6
7
Edu
catio
n
i
ncre
ases
pro
fits
s
igni
fican
tly
YE2
34 <
YE5
Y
E5 <
YE6
7 Y
E1 <
YE5
Y
E1 <
YE6
7 Y
E234
< Y
E67
but
YE1
= Y
E234
Edu
catio
n in
crea
ses
prod
uctiv
ity
sign
ifica
ntly
b)
Am
ong
olde
r wor
kers
:
OE5
< O
E67
OE2
34 <
OE6
7 bu
t O
E1 =
OE6
7 O
E1 =
OE2
34
OE5
< O
E67
OE1
< O
E67
OE2
34 <
OE6
7
but
OE1
= O
E234
OE1
= O
E234
O
E1 =
OE5
O
E1 =
OE6
7 O
E234
= O
E5
OE2
34 =
OE6
7
OE2
34 <
OE6
7 O
E5 <
OE6
7 bu
t O
E1 =
OE2
34
OE1
= O
E5
OE1
= O
E234
O
E1 =
OE5
O
E1 =
OE6
7 O
E234
= O
E5
OE2
34 =
OE6
7
OE5
< O
E67
OE1
< O
E67
OE2
34 <
OE6
7
but
OE1
= O
E234
53

OE2
34 =
OE5
Hig
h-ed
ucat
ed
wor
kers
si
gnifi
cant
ly
mor
e pr
oduc
tive
OE2
34 =
OE5
O
E1 =
OE5
Hig
h-ed
ucat
ed
wor
kers
si
gnifi
cant
ly
mor
e co
stly
OE5
= O
E67
E
duca
tion
has
no si
gnifi
cant
ef
fect
on
prof
itabi
lity
OE1
= O
E67
OE2
34 =
OE5
Hig
h-
e
duca
ted
sig
nific
antly
mor
e
p
rofit
able
OE5
= O
E67
E
duca
tion
has
no si
gnifi
cant
ef
fect
on
prof
itabi
lity
OE2
34 =
OE5
O
E1 =
OE5
Hig
h-ed
ucat
ed
sign
ifica
ntly
m
ore
prod
uctiv
e
Not
es: *
* p<
0.01
, **
p<0.
05, *
p<0
.1. R
obus
t sta
ndar
d er
rors
are
rep
orte
d be
twee
n pa
rent
hese
s. Re
gres
sion
s al
so c
ontro
l for
: % o
f wor
kers
with
10
year
s of
tenu
re o
r m
ore;
%
wor
kers
you
nger
tha
n 30
and
old
er t
han
49 y
ears
, res
pect
ivel
y; %
wom
en;
% p
art-t
ime
wor
kers
; % b
lue-
colla
r w
orke
rs;
% w
orke
rs w
ith f
ixed
ter
m e
mpl
oym
ent
cont
ract
; %
ap
pren
tices
; %
tem
pora
ry a
genc
y w
orke
rs; l
n of
firm
siz
e; ln
of
capi
tal
stoc
k pe
r w
orke
r; le
vel
of c
olle
ctiv
e w
age
barg
aini
ng; r
egio
n w
here
the
firm
is
loca
ted
(2 d
umm
ies)
; in
dustr
ies (
8 du
mm
ies)
, and
yea
rs d
umm
ies (
11).
AR
(2) r
efer
s to
seco
nd-o
rder
aut
ocor
rela
tion
in fi
rst-d
iffer
ence
d er
rors
. GM
M-S
YS
spec
ifica
tions
incl
ude
first
and
seco
nd la
gs o
f ex
plan
ator
y va
riabl
es (e
xcep
t tim
e du
mm
ies)
as
instr
umen
ts. a Y
oung
(old
er) w
orke
rs a
re d
efin
ed a
s be
ing
less
than
(at l
east
) 40
year
s ol
d. b Y
oung
(old
er) w
orke
rs a
re d
efin
ed a
s be
ing
less
than
(at l
east
) 50
year
s ol
d. c ‘<
’ (‘=
’) in
dica
tes
if re
gres
sion
coe
ffici
ents
are
(not
) sta
tistic
ally
diff
eren
t at t
he 1
0 pe
rcen
t lev
el. d V
alue
add
ed-w
age
cost
gap
= ln
(val
ue
adde
d pe
r hou
r) –
ln(w
age
cost
per
hou
r). e ln
(pro
fit p
er h
our w
orke
d) =
ln(v
alue
add
ed p
er h
our –
wag
e co
st p
er h
our)
.
54

A
ppen
dix
6: E
stim
ates
acc
ordi
ng to
wor
kers
’ sex
, fou
r ed
ucat
iona
l cat
egor
ies
G
MM
-SY
S L
P
Val
ue a
dded
pe
r hou
r w
orke
d (ln
)
Wag
e co
st
per h
our
wor
ked
(ln)
Val
ue a
dded
-w
age
co
st g
apb
Prof
it pe
r hou
r w
orke
d (ln
)c
Val
ue a
dded
pe
r hou
r w
orke
d (ln
)
(1)
(2)
(3)
(4)
(5)
Lagg
ed d
epen
dent
var
iabl
e (ln
) 0.
664*
**
(0.0
56)
0.46
2***
(0
.135
) 0.
627*
**
(0.0
43)
0.46
4***
(0
.032
) 0.
786*
**
(0.0
42)
Shar
es o
f wor
kers
:
Fem
ale
& p
rimar
y ed
ucat
ion
(FE1
) -0
.131
* (0
.070
) -0
.093
(0
.058
) -0
.031
(0
.048
) -0
.301
(0
.231
) -0
.081
***
(0.0
30)
Mal
e &
prim
ary
educ
atio
n (M
E1)
0.02
8 (0
.054
) 0.
076*
(0
.043
) -0
.129
* (0
.072
) 0.
159
(0.1
73)
0.00
5 (0
.020
) Fe
mal
e &
low
er o
r upp
er s
econ
dary
ed
ucat
ion
(FE2
34)
Refe
renc
e Re
fere
nce
Refe
renc
e Re
fere
nce
Refe
renc
e
Mal
e &
low
er o
r upp
er se
cond
ary
educ
atio
n (M
E234
) 0.
037
(0.0
53)
0.06
2 (0
.039
) -0
.104
(0
.065
) 0.
213
(0.1
50)
0.00
3 (0
.016
) Fe
mal
e &
Bac
helo
r’s o
r equ
ival
ent
degr
ee (F
E5)
0.14
1*
(0.0
73)
0.06
9 (0
.071
) 0.
125*
(0
.064
) 0.
404*
(0
.234
) 0.
069*
(0
.036
) M
ale
& B
ache
lor’
s or e
quiv
alen
t de
gree
(ME5
) 0.
048
(0.0
69)
0.10
7*
(0.0
55)
-0.1
38*
(0.0
79)
0.24
1 (0
.209
) 0.
037
(0.0
32)
Fem
ale
& M
aste
rs’s
or e
quiv
alen
t de
gree
or b
eyon
d (F
E67)
0.
156
(0.1
21)
0.18
2 (0
.121
) 0.
087
(0.0
75)
0.45
2 (0
.286
) 0.
212*
* (0
.090
) M
ale
& M
aste
rs’s
or e
quiv
alen
t de
gree
or b
eyon
d (M
E67)
0.
172*
* (0
.074
) 0.
339*
**
(0.0
92)
-0.0
93
(0.0
81)
0.57
6***
(0
.202
) 0.
184*
**
(0.0
35)
Han
sen
over
-iden
tific
atio
n te
st, p
-val
ue
0.37
3 0.
297
0.20
9 0.
541
A
rella
no-B
ond
test
for A
R(2)
, p-v
alue
0.
125
0.28
9 0.
561
0.17
3
Num
ber o
f obs
erva
tions
6,
714
6,71
4 6,
714
6,71
4 6,
691
Num
ber o
f firm
s 1,
844
1,84
4 1,
844
1,84
4 1,
844
Chi
-squ
ared
sta
tistic
for e
qual
ity o
f re
gres
sion
coe
ffici
ents
, H0:
FE1
= M
E1
4.01
**
6.13
**
1.12
2.
77*
7.17
***
FE1
= M
E234
5.
95**
7.
07**
* 0.
80
4.96
**
9.45
***
FE1
= FE
5 8.
80**
* 3.
42*
5.23
**
4.87
**
13.6
1***
FE
1 =
ME5
4.
63**
7.
89**
* 1.
25
3.77
**
7.65
***
55

FE1
= FE
67
4.09
**
3.98
**
1.94
4.
72**
9.
56**
* FE
1 =
ME6
7 11
.08*
**
16.8
1***
0.
37
9.64
***
35.2
1***
M
E1 =
ME2
34
0.09
0.
33
0.83
0.
22
0.01
M
E1 =
FE5
1.
92
0.01
6.
13*
0.98
3.
03*
ME1
= M
E5
0.10
0.
35
0.03
0.
14
0.91
M
E1 =
FE6
7 0.
97
0.84
3.
77*
0.96
5.
79**
M
E1 =
ME6
7 4.
04**
10
.51*
**
0.46
3.
98**
20
.59*
**
ME2
34 =
FE5
1.
75
0.01
6.
09**
0.
70
3.88
**
ME2
34 =
ME5
0.
03
0.85
0.
53
0.02
1.
27
ME2
34 =
FE6
7 0.
84
1.09
3.
19*
0.71
5.
76**
M
E234
= M
E67
3.72
* 11
.29*
**
0.04
3.
90**
26
.1**
* FE
5 =
ME5
0.
98
0.27
5.
39*
0.32
0.
57
FE5
= FE
67
0.01
0.
86
0.17
0.
02
1.94
FE
5 =
ME6
7 0.
10
10.2
9***
3.
62*
0.38
8.
63**
* M
E5 =
FE6
7 0.
64
0.50
3.
68*
0.40
3.
96**
M
E5 =
ME6
7 2.
19
11.1
5***
0.
59
2.28
15
.5**
* FE
67 =
ME6
7 0.
01
2.16
2.
17
0.13
0.
09
Inte
rpre
tatio
na : a)
A
mon
g m
ale
wor
kers
:
M
E1 <
ME6
7 M
E234
< M
E67
but
ME1
= M
E234
M
E234
= M
E5
ME5
= M
E67
ME1
= M
E5
M
E67
sign
ifica
ntly
m
ore
prod
uctiv
e th
an M
E1 a
nd
ME2
34
M
E1 <
ME6
7 M
E234
< M
E67
ME5
< M
E67
but
ME1
= M
E234
M
E1 =
ME5
M
E234
= M
E5
M
E67
mor
e co
stly
than
ot
her
educ
atio
nal
grou
ps
M
E1 =
ME2
34
ME1
= M
E5
ME1
= M
E67
ME2
34 =
ME5
M
E234
= M
E67
ME5
= M
E67
E
duca
tion
has
no si
gnifi
cant
ef
fect
on
prof
itabi
lity
M
E1 <
ME6
7 M
E234
< M
E67
but
ME1
= M
E234
M
E234
= M
E5
ME1
= M
E5
ME5
= M
E67
M
E67
mor
e pr
ofita
ble
than
ME1
and
M
E234
M
E234
< M
E67
ME1
< M
E67
ME5
< M
E67
but
ME1
= M
E234
M
E234
= M
E5
ME1
= M
E5
M
E67
sign
ifica
ntly
m
ore
prod
uctiv
e th
an lo
wer
-ed
ucat
ed
wor
kers
56

b)
Am
ong
fem
ale
wor
kers
:
FE1
< FE
234
FE23
4 <
FE5
FE1
< FE
5 FE
1 <
FE67
bu
t FE
5 =
FE67
FE
234
= FE
67
E
duca
tion
incr
ease
s pr
oduc
tivity
si
gnifi
cant
ly
FE1
< FE
67
FE1
< FE
5 bu
t FE
1 =
FE23
4 FE
234
= FE
5 FE
234
= FE
67
FE5
= FE
67
F
E67
and
FE5
sign
ifica
ntly
m
ore
cost
ly
than
FE1
FE1
< FE
5 FE
1 <
FE67
FE
234
< FE
5 bu
t FE
1 =
FE23
4 FE
234
= FE
67
FE5
= FE
67
F
E67
and
FE5
sign
ifica
ntly
m
ore
prof
itabl
e th
an F
E1
FE1
< FE
67
FE1
< FE
5 FE
234
< FE
5 bu
t FE
1 =
FE23
4 FE
234
= FE
67
FE5
= FE
67
E
duca
tion
incr
ease
s pr
ofits
si
gnifi
cant
ly
FE1
< FE
234
FE23
4 <
FE5
FE23
4 <
FE67
FE
1 <
FE5
FE1
< FE
67
but
FE5
= FE
67
E
duca
tion
incr
ease
s pr
oduc
tivity
si
gnifi
cant
ly
Not
es: *
* p<
0.01
, **
p<0.
05, *
p<0
.1. R
obus
t sta
ndar
d er
rors
are
rep
orte
d be
twee
n pa
rent
hese
s. Re
gres
sion
s al
so c
ontro
l for
: % o
f wor
kers
with
10
year
s of
tenu
re o
r m
ore;
%
wor
kers
you
nger
tha
n 30
and
old
er t
han
49 y
ears
, res
pect
ivel
y; %
wom
en;
% p
art-t
ime
wor
kers
; % b
lue-
colla
r w
orke
rs;
% w
orke
rs w
ith f
ixed
ter
m e
mpl
oym
ent
cont
ract
; %
ap
pren
tices
; %
tem
pora
ry a
genc
y w
orke
rs; l
n of
firm
siz
e; ln
of
capi
tal
stoc
k pe
r w
orke
r; le
vel
of c
olle
ctiv
e w
age
barg
aini
ng; r
egio
n w
here
the
firm
is
loca
ted
(2 d
umm
ies)
; in
dustr
ies (
8 du
mm
ies)
, and
yea
rs d
umm
ies (
11).
AR
(2) r
efer
s to
seco
nd-o
rder
aut
ocor
rela
tion
in fi
rst-d
iffer
ence
d er
rors
. GM
M-S
YS
spec
ifica
tions
incl
ude
first
and
seco
nd la
gs o
f ex
plan
ator
y va
riabl
es (e
xcep
t tim
e du
mm
ies)
as i
nstru
men
ts. a ‘<
’ (‘=
’) in
dica
tes i
f reg
ress
ion
coef
ficie
nts a
re (n
ot) s
tatis
tical
ly d
iffer
ent a
t the
10
perc
ent l
evel
. b Val
ue a
dded
-wag
e co
st g
ap =
ln(v
alue
add
ed p
er h
our)
– ln
(wag
e co
st p
er h
our)
. c ln(p
rofit
per
hou
r wor
ked)
= ln
(val
ue a
dded
per
hou
r – w
age
cost
per h
our)
.
57
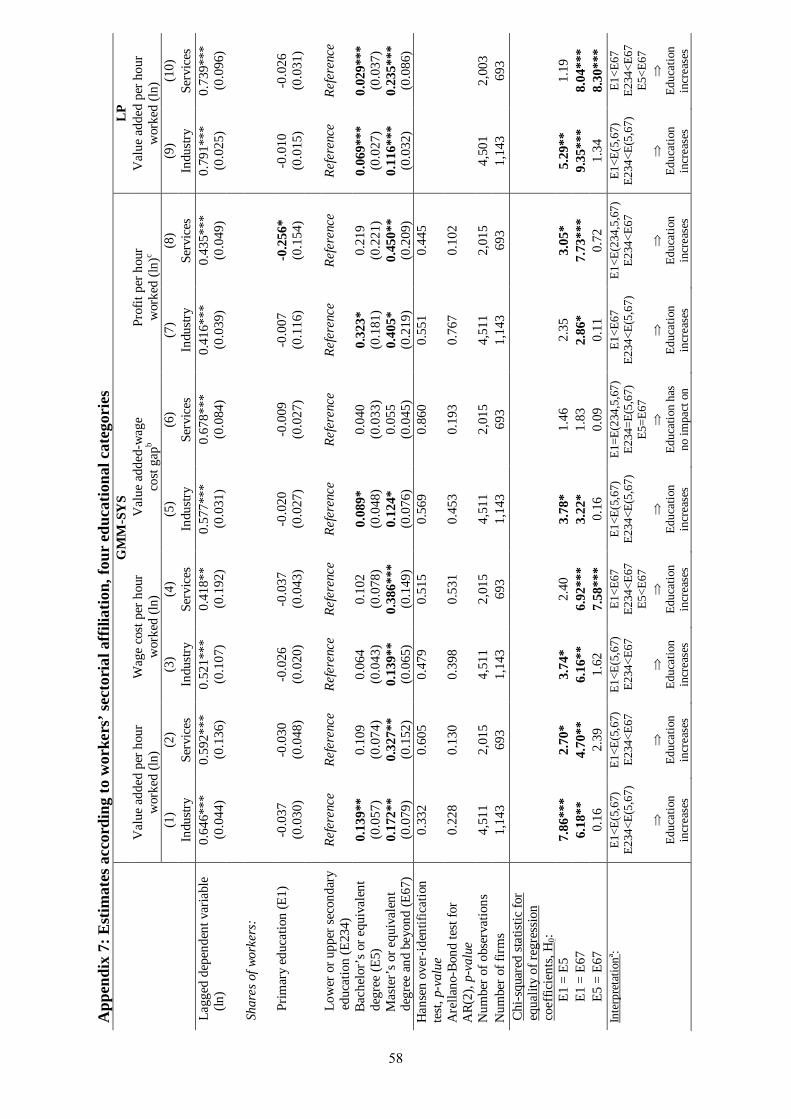
A
ppen
dix
7: E
stim
ates
acc
ordi
ng to
wor
kers
’ sec
tori
al a
ffili
atio
n, fo
ur e
duca
tiona
l cat
egor
ies
G
MM
-SY
S L
P
Val
ue a
dded
per
hou
r w
orke
d (ln
) W
age
cost
per h
our
wor
ked
(ln)
Val
ue a
dded
-wag
e co
st g
apb
Prof
it pe
r hou
r w
orke
d (ln
)c V
alue
add
ed p
er h
our
wor
ked
(ln)
(1
) (2
) (3
) (4
) (5
) (6
) (7
) (8
) (9
) (1
0)
In
dustr
y Se
rvic
es
Indu
stry
Serv
ices
In
dustr
y Se
rvic
es
Indu
stry
Serv
ices
In
dustr
y Se
rvic
es
Lagg
ed d
epen
dent
var
iabl
e (ln
) 0.
646*
**
(0.0
44)
0.59
2***
(0
.136
) 0.
521*
**
(0.1
07)
0.41
8**
(0.1
92)
0.57
7***
(0
.031
) 0.
678*
**
(0.0
84)
0.41
6***
(0
.039
) 0.
435*
**
(0.0
49)
0.79
1***
(0
.025
) 0.
739*
**
(0.0
96)
Sh
ares
of w
orke
rs:
Prim
ary
educ
atio
n (E
1)
-0.0
37
(0.0
30)
-0.0
30
(0.0
48)
-0.0
26
(0.0
20)
-0.0
37
(0.0
43)
-0.0
20
(0.0
27)
-0.0
09
(0.0
27)
-0.0
07
(0.1
16)
-0.2
56*
(0.1
54)
-0.0
10
(0.0
15)
-0.0
26
(0.0
31)
Lo
wer
or u
pper
sec
onda
ry
educ
atio
n (E
234)
Re
fere
nce
Re
fere
nce
Re
fere
nce
Re
fere
nce
Re
fere
nce
Refe
renc
e
Refe
renc
e
Refe
renc
e
Refe
renc
e Re
fere
nce
Bach
elor
’s o
r equ
ival
ent
degr
ee (E
5)
0.13
9**
(0.0
57)
0.10
9 (0
.074
) 0.
064
(0.0
43)
0.10
2 (0
.078
) 0.
089*
(0
.048
) 0.
040
(0.0
33)
0.32
3*
(0.1
81)
0.21
9 (0
.221
) 0.
069*
**
(0.0
27)
0.02
9***
(0
.037
) M
aste
r’s o
r equ
ival
ent
degr
ee a
nd b
eyon
d (E
67)
0.17
2**
(0.0
79)
0.32
7**
(0.1
52)
0.13
9**
(0.0
65)
0.38
6***
(0
.149
) 0.
124*
(0
.076
) 0.
055
(0.0
45)
0.40
5*
(0.2
19)
0.45
0**
(0.2
09)
0.11
6***
(0
.032
) 0.
235*
**
(0.0
86)
Han
sen
over
-iden
tific
atio
n te
st, p
-val
ue
0.33
2 0.
605
0.47
9 0.
515
0.56
9 0.
860
0.55
1 0.
445
Are
llano
-Bon
d te
st fo
r A
R(2)
, p-v
alue
0.
228
0.13
0 0.
398
0.53
1 0.
453
0.19
3 0.
767
0.10
2
Num
ber o
f obs
erva
tions
4,
511
2,01
5 4,
511
2,01
5 4,
511
2,01
5 4,
511
2,01
5 4,
501
2,00
3 N
umbe
r of f
irms
1,14
3 69
3 1,
143
693
1,14
3 69
3 1,
143
693
1,14
3 69
3 C
hi-s
quar
ed s
tatis
tic fo
r eq
ualit
y of
regr
essio
n co
effic
ient
s, H
0:
E1 =
E5
7.86
***
2.70
* 3.
74*
2.40
3.
78*
1.46
2.
35
3.05
* 5.
29**
1.
19
E1 =
E67
6.
18**
4.
70**
6.
16**
6.
92**
* 3.
22*
1.83
2.
86*
7.73
***
9.35
***
8.04
***
E5 =
E67
0.
16
2.39
1.
62
7.58
***
0.16
0.
09
0.11
0.
72
1.34
8.
30**
* In
terp
reta
tiona :
E1<E
(5,6
7)
E234
<E(5
,67)
Educ
atio
n in
crea
ses
E1<E
(5,6
7)
E234
<E67
Educ
atio
n in
crea
ses
E1<E
(5,6
7)
E234
<E67
Educ
atio
n in
crea
ses
E1<E
67
E234
<E67
E5
<E67
Educ
atio
n in
crea
ses
E1<E
(5,6
7)
E234
<E(5
,67)
Educ
atio
n in
crea
ses
E1=E
(234
,5,6
7)
E234
=E(5
,67)
E5
=E67
Educ
atio
n ha
s no
impa
ct o
n
E1<E
67
E234
<E(5
,67)
Educ
atio
n in
crea
ses
E1<E
(234
,5,6
7)
E234
<E67
Educ
atio
n in
crea
ses
E1<E
(5,6
7)
E234
<E(5
,67)
Educ
atio
n in
crea
ses
E1<E
67
E234
<E67
E5
<E67
Educ
atio
n in
crea
ses
58
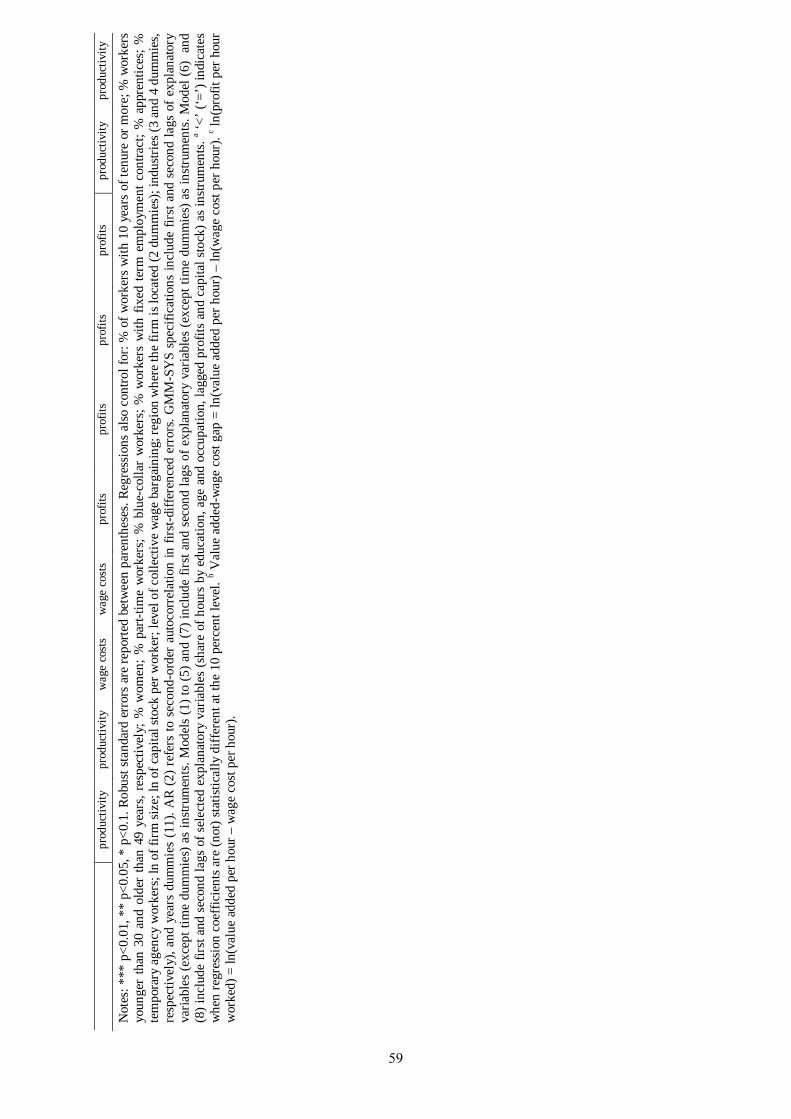
prod
uctiv
ity
prod
uctiv
ity
wag
e co
sts
wag
e co
sts
prof
its
prof
its
prof
its
prof
its
prod
uctiv
ity
prod
uctiv
ity
Not
es: *
** p
<0.0
1, *
* p<
0.05
, * p
<0.1
. Rob
ust s
tand
ard
erro
rs a
re re
porte
d be
twee
n pa
rent
hese
s. Re
gres
sion
s al
so c
ontro
l for
: % o
f wor
kers
with
10
year
s of
tenu
re o
r mor
e; %
wor
kers
yo
unge
r th
an 3
0 an
d ol
der
than
49
year
s, re
spec
tivel
y; %
wom
en; %
par
t-tim
e w
orke
rs; %
blu
e-co
llar
wor
kers
; % w
orke
rs w
ith f
ixed
term
em
ploy
men
t con
tract
; % a
ppre
ntic
es; %
te
mpo
rary
age
ncy
wor
kers
; ln
of fi
rm si
ze; l
n of
cap
ital s
tock
per
wor
ker;
leve
l of c
olle
ctiv
e w
age
barg
aini
ng; r
egio
n w
here
the
firm
is lo
cate
d (2
dum
mie
s); i
ndus
tries
(3 an
d 4
dum
mie
s, re
spec
tivel
y), a
nd y
ears
dum
mie
s (1
1). A
R (2
) ref
ers
to s
econ
d-or
der
auto
corr
elat
ion
in fi
rst-d
iffer
ence
d er
rors
. GM
M-S
YS
spec
ifica
tions
incl
ude
first
and
sec
ond
lags
of e
xpla
nato
ry
varia
bles
(exc
ept t
ime
dum
mie
s) a
s in
strum
ents
. Mod
els
(1) t
o (5
) and
(7) i
nclu
de fi
rst a
nd s
econ
d la
gs o
f exp
lana
tory
var
iabl
es (e
xcep
t tim
e du
mm
ies)
as
instr
umen
ts. M
odel
(6)
and
(8) i
nclu
de fi
rst a
nd s
econ
d la
gs o
f sel
ecte
d ex
plan
ator
y va
riabl
es (s
hare
of h
ours
by
educ
atio
n, a
ge a
nd o
ccup
atio
n, la
gged
pro
fits
and
capi
tal s
tock
) as i
nstru
men
ts. a ‘<
’ (‘=
’) in
dica
tes
whe
n re
gres
sion
coe
ffici
ents
are
(not
) sta
tistic
ally
diff
eren
t at t
he 1
0 pe
rcen
t lev
el. b V
alue
add
ed-w
age
cost
gap
= ln
(val
ue a
dded
per
hou
r) –
ln(w
age
cost
per
hou
r). c ln
(pro
fit p
er h
our
wor
ked)
= ln
(val
ue a
dded
per
hou
r – w
age
cost
per
hou
r).
59

NBB WORKING PAPER No. 281 - APRIL 2015 61
NATIONAL BANK OF BELGIUM - WORKING PAPERS SERIES The Working Papers are available on the website of the Bank: http://www.nbb.be. 224. “Asymmetric information in credit markets, bank leverage cycles and macroeconomic dynamics”, by
A. Rannenberg, Research series, April 2012. 225. “Economic importance of the Belgian ports: Flemish maritime ports, Liège port complex and the port of
Brussels - Report 2010”, by C. Mathys, Document series, July 2012. 226. “Dissecting the dynamics of the US trade balance in an estimated equilibrium model”, by P. Jacob and G.
Peersman, Research series, August 2012. 227. “Regime switches in volatility and correlation of financial institutions”, by K. Boudt, J. Daníelsson,
S.J. Koopman and A. Lucas, Research series, October 2012. 228. “Measuring and testing for the systemically important financial institutions”, by C. Castro and S. Ferrari,
Research series, October 2012. 229. “Risk, uncertainty and monetary policy”, by G. Bekaert, M. Hoerova and M. Lo Duca, Research series,
October 2012. 230. “Flights to safety”, by L. Baele, G. Bekaert, K. Inghelbrecht and M. Wei, Research series, October 2012. 231. “Macroprudential policy, countercyclical bank capital buffers and credit supply: Evidence from the Spanish
dynamic provisioning experiments”, by G. Jiménez, S. Ongena, J.-L. Peydró and J. Saurina, Research series, October 2012.
232. “Bank/sovereign risk spillovers in the European debt crisis”, by V. De Bruyckere, M. Gerhardt, G. Schepens and R. Vander Vennet, Research series, October 2012.
233. “A macroeconomic framework for quantifying systemic risk”, by Z. He and A. Krishnamurthy, Research series, October 2012.
234. “Fiscal policy, banks and the financial crisis”, by R. Kollmann, M. Ratto, W. Roeger and J. in't Veld, Research series, October 2012.
235. “Endogenous risk in a DSGE model with capital-constrained financial intermediaries”, by H. Dewachter and R. Wouters, Research series, October 2012.
236. “A macroeconomic model with a financial sector”, by M.K. Brunnermeier and Y. Sannikov, Research series, October 2012.
237. “Services versus goods trade: Are they the same?”, by A. Ariu, Research series, December 2012. 238. “Importers, exporters, and exchange rate disconnect”, by M. Amiti, O. Itskhoki and J. Konings, Research
series, December 2012. 239. “Concording EU trade and production data over time”, by I. Van Beveren, A.B. Bernard and
H. Vandenbussche, Research series, December 2012. 240. “On the origins of the Triffin dilemma: Empirical business cycle analysis and imperfect competition theory”,
by I. Maes, Research series, December 2012. 241. “The Influence of the Taylor rule on US monetary policy”, by P. Ilbas, Ø. Røisland and T. Sveen, Research
series, January 2013. 242. “Economic importance of the Belgian ports: Flemish maritime ports, Liège port complex and the port of
Brussels - Report 2011”, by C. Mathys, Document series, July 2013. 243. “The fragility of two monetary regimes: The European Monetary System and the Eurozone”, by
P. De Grauwe and Y. Ji, Research series, October 2013. 244. “Funding liquidity, market liquidity and TED spread: A two-regime model”, by K. Boudt, E. C.S. Paulus and
D. W.R. Rosenthal, Research series, November 2013. 245. “Robustifying optimal monetary policy using simple rules as cross-checks”, by P. Ilbas, Ø. Røisland and T.
Sveen, Research series, November 2013. 246. “Household and firm leverage, capital flows and monetary policy in a small open economy”, by
M. Pirovano, Research series, November 2013. 247. “The BIS and the Latin American debt crisis of the 1980s”, by P. Clement and I. Maes, Research series,
December 2013. 248. “The importance of the right amount of business resources for firms' exporting behavior”, by I. Paeleman,
C. Fuss and T. Vanacker, Research series, December 2013. 249. “The role of financial frictions during the crisis: An estimated DSGE model”, by R. Merola, Research series,
December 2013. 250. “Bank reactions after capital shortfalls”, by C. Kok and G. Schepens, Research series, December 2013. 251. “Why firms avoid cutting wages: Survey evidence from European firms”, by P. Du Caju, T. Kosma,
M. Lawless, J. Messina and T. Rõõm, Research series, December 2013. 252. “The distribution of debt across euro area countries: The role of individual characteristics, institutions and
credit conditions”, by O. Bover, J. M. Casado, S. Costa, Ph. Du Caju, Y. McCarthy, E. Sierminska, P. Tzamourani, E. Villanueva and T. Zavadil, Research series, December 2013.

NBB WORKING PAPER No. 281 - APRIL 2015 62
253. “Micro-based evidence of EU competitiveness: The CompNet database”, by CompNet Task Force, Research series, March 2014.
254. “Information in the yield curve: A macro-finance approach”, by H. Dewachter, L. Iania and M. Lyrio, Research series, March 2014.
255. “The Single supervisory mechanism or ‘SSM’, part one of the Banking Union”, by E. Wymeersch, Research series, April 2014.
256. “Nowcasting Belgium”, by D. de Antonio Liedo, Research series, April 2014. 257. “Human capital, firm capabilities and productivity growth”, by I. Van Beveren and S. Vanormelingen,
Research series, May 2014. 258. “Monetary and macroprudential policies in an estimated model with financial intermediation”, by P. Gelain
and P. Ilbas, Research series, May 2014. 259. “A macro-financial analysis of the euro area sovereign bond market”, by H. Dewachter, L. Iania, M. Lyrio
and M. de Sola Perea, Research series, June 2014. 260. “Economic importance of the Belgian ports: Flemish maritime ports, Liège port complex and the port of
Brussels - Report 2012”, by C. Mathys, Document series, June 2014. 261. “European competitiveness: A semi-parametric stochastic metafrontier analysis at the firm level”, by
M. Dumont, B. Merlevede, G. Rayp and M. Verschelde, Document series, July 2014. 262. “Employment, hours and optimal monetary policy”, by M. Dossche, V. Lewis and C. Poilly, Research
series, September 2014. 263. “On the conjugacy of off-line and on-line Sequential Monte Carlo Samplers”, by A. Dufays, Research
series, September 2014. 264. “The effects of state aid on Total Factor Productivity growth”, by P. Van Cayseele, J. Konings and
I. Sergant, Research series, October 2014. 265. “Assessing the role of ageing, feminising and better-educated workforces on TFP growth”, by A. Ariu and
V. Vandenberghe, Research series, October 2014. 266. “A constrained nonparametric regression analysis of factor-biased technical change and TFP growth at the
firm level”, by M. Verschelde, M. Dumont, B. Merlevede and G. Rayp, Research series, October 2014. 267. “Market imperfections, skills and total factor productivity: Firm-level evidence on Belgium and the
Netherlands”, by S. Dobbelaere and M. Vancauteren, Research series, October 2014. 268. “Import competition, productivity and multi-product firms”, by E. Dhyne, A. Petrin, V. Smeets and
F. Warzynski, Research series, October 2014. 269. “International competition and firm performance: Evidence from Belgium”, by J. De Loecker, C. Fuss and
J. Van Biesebroeck, Research series, October 2014. 270. “Acquisitions, productivity, and profitability: Evidence from the Japanese cotton spinning industry”, by
S. Braguinsky, A. Ohyama, T. Okazaki and C. Syverson, Research series, October 2014. 271. “Total factor productivity: Lessons from the past and directions for the future”, by B. van Ark, Research
series, October 2014. 272. “Outward Foreign Direct Investment and domestic performance: In search of a causal link”, by E. Dhyne
and S. S. Guerin, Research series, October 2014. 273. “Economic importance of air transport and airport activities in Belgium - Report 2012”, by
F. Van Nieuwenhove, Document series, November 2014. 274. “Fiscal policy and TFP in the OECD: Measuring direct and indirect effects”, by G. Everaert F. Heylen and
R. Schoonackers, Research series, November 2014. 275. “Effectiveness and transmission of the ECB's balance sheet policies”, by J. Boeckx, M. Dossche and
G. Peersman, Research series, December 2014. 276. “How do exporters react to changes in cost competitiveness?”, by S. Decramer, C. Fuss and J. Konings,
Research series, January 2015. 277. “Optimal monetary policy response to endogenous oil price fluctuations”, by A. Stevens, Research series,
January 2015. 278. “Comparing fiscal multipliers across models and countries in Europe”, by J. Kilponen, M. Pisani,
S. Schmidt, V. Corbo, T. Hledik, J. Hollmayr, S. Hurtado, P. Júlio, D. Kulikov, M. Lemoine, M. Lozej, H. Lundvall, J. R. Maria, B. Micallef, D. Papageorgiou, J. Rysanek, D. Sideris, C. Thomas and G. de Walque, Research series, March 2015.
279. “Assessing European competitiveness: The new CompNet micro-based database”, by P. Lopez-Garcia, F. di Mauro and the CompNet Task Force, Research series, April 2015.
280. “FloGARCH: Realizing long memory and asymmetries in returns volatility”, by H. Vander Elst, Research series, April 2015.
281. “Does education raise productivity and wages equally? The moderating roles of age, gender and industry”, by F. Rycx, Y. Saks and I. Tojerow, Research series, April 2015.

© Illustrations : National Bank of Belgium
Layout : Analysis and Research Group Cover : NBB AG – Prepress & Image
Published in April 2015
Editor
Jan SmetsGovernor of the National Bank of Belgium
National Bank of Belgium Limited liability company RLP Brussels – Company’s number : 0203.201.340
www.nbb.be