Complaints Report - UH Bristol NHS FT · Complaints Report . ... equally likely to generate a...
28
University Hospitals Bristol NHS Foundation Trust, Complaints Report Q1 2017/18 Page 1 Complaints Report Quarter 1, 2017/2018 (1 April 2017 to 30 June 2017) Author: Tanya Tofts, Patient Support and Complaints Manager
Transcript of Complaints Report - UH Bristol NHS FT · Complaints Report . ... equally likely to generate a...

University Hospitals Bristol NHS Foundation Trust, Complaints Report Q1 2017/18 Page 1
Complaints Report
Quarter 1, 2017/2018
(1 April 2017 to 30 June 2017)
Author: Tanya Tofts, Patient Support and Complaints Manager

University Hospitals Bristol NHS Foundation Trust, Complaints Report Q1 2017/18 Page 2
Overview Successes Priorities • Although the total number of complaints received in quarter 1 was 26%
more than in quarter 4, this was largely due to a one-off incident which attracted public interest as a result of adverse press coverage.
• Complaints received by Bristol Eye Hospital continued a positive downwards trend in quarter 1
• Complaints received by the department of Trauma & Orthopaedics reduced notably in quarter 1.
• The overall number of complaints received by the Bristol Heart Institute fell by 22% compared to quarter 4.
• Information about Trust Services complaints has been included in this quarterly report for the first time
• For the first time, this quarterly report includes a split of inpatient, outpatient and ED complaints, an analysis we will develop further in subsequent quarterly reports.
• To re-focus on ensuring timely complaints responses – in quarter 1, 80.2% of formal complaints and 76.7% of informal complaints were responded to within the agreed timeframe.
• To continue to focus on getting the tone and substance of response letters right. Despite our efforts, in 2016/17 as a whole, more complainants expressed dissatisfaction with our initial response to their formal complaints than in 2015/16 (65 compared to 59). All dissatisfied cases are now being formally reviewed on a monthly basis with learning shared with Divisions and the Patient Experience Group.
Opportunities Risks & Threats • To continue to work with the Patients Association to develop a potential
model for independent review of high-risk complaints. An interim report from the Patients Association was discussed at the Patient Experience Group in August 2017.
• The Trust’s new complaints review panel is due to meet for the first time in October 2017 (Division of Medicine), including lay representation.
• In quarter 1, complaints about appointments and admissions rose in all bed-holding divisions with the exception of Medicine, ending a previously long-term downwards trend. This included an increase in complaints about the appointments department at Bristol Haematology and Oncology Centre.
• Complaints about Bristol Dental Hospital rose significantly in quarter 1, driven largely by an increase in complaints about contacting the hospital by phone.
University Hospitals Bristol NHS Foundation Trust, Complaints Report Q1 2017/18 Page 3
1. Complaints performance – Trust overview The Board monitors three indicators of how well the Trust is doing in respect of complaints performance:
• Total complaints received; • Proportion of complaints responded to within timescale; and • Numbers of complainants who are dissatisfied with our response.
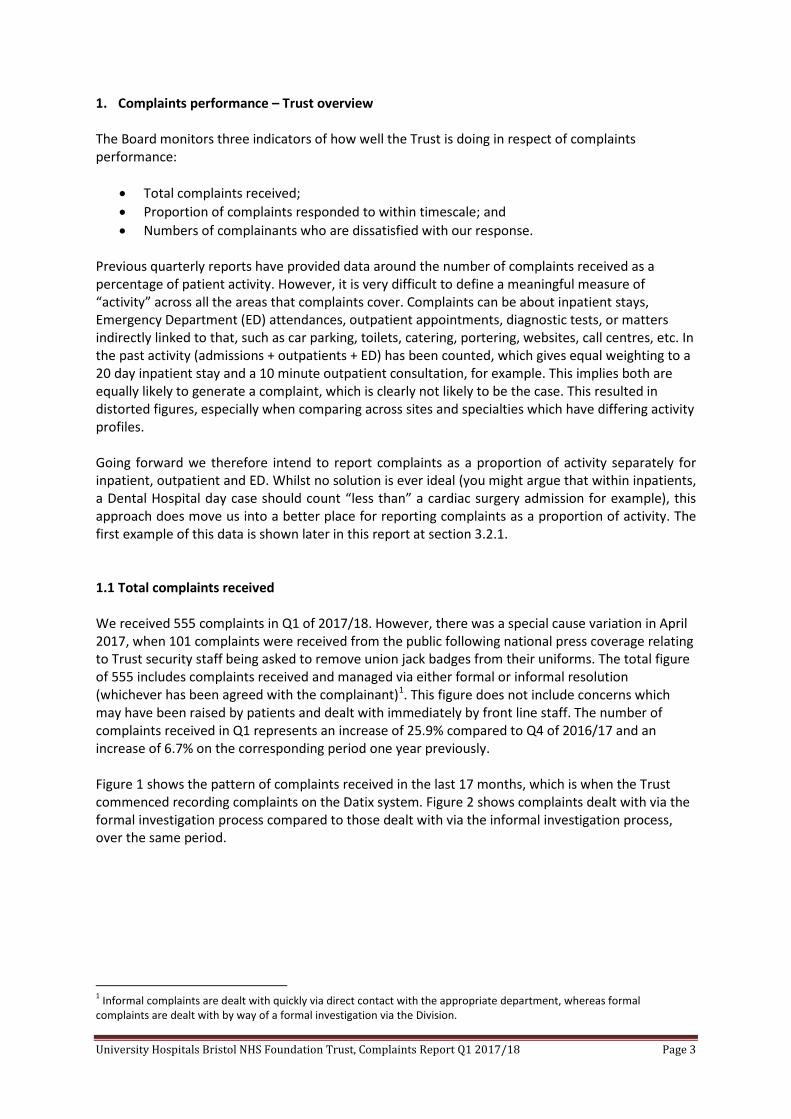
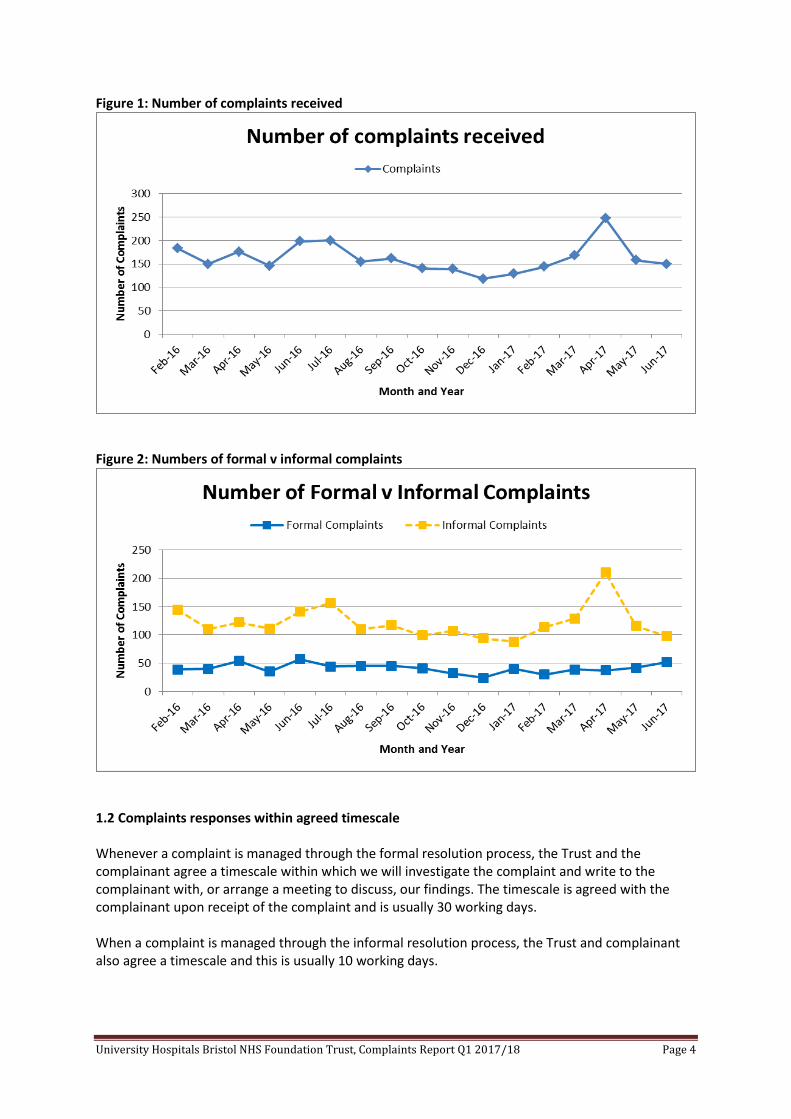
Previous quarterly reports have provided data around the number of complaints received as a percentage of patient activity. However, it is very difficult to define a meaningful measure of “activity” across all the areas that complaints cover. Complaints can be about inpatient stays, Emergency Department (ED) attendances, outpatient appointments, diagnostic tests, or matters indirectly linked to that, such as car parking, toilets, catering, portering, websites, call centres, etc. In the past activity (admissions + outpatients + ED) has been counted, which gives equal weighting to a 20 day inpatient stay and a 10 minute outpatient consultation, for example. This implies both are equally likely to generate a complaint, which is clearly not likely to be the case. This resulted in distorted figures, especially when comparing across sites and specialties which have differing activity profiles. Going forward we therefore intend to report complaints as a proportion of activity separately for inpatient, outpatient and ED. Whilst no solution is ever ideal (you might argue that within inpatients, a Dental Hospital day case should count “less than” a cardiac surgery admission for example), this approach does move us into a better place for reporting complaints as a proportion of activity. The first example of this data is shown later in this report at section 3.2.1. 1.1 Total complaints received We received 555 complaints in Q1 of 2017/18. However, there was a special cause variation in April 2017, when 101 complaints were received from the public following national press coverage relating to Trust security staff being asked to remove union jack badges from their uniforms. The total figure of 555 includes complaints received and managed via either formal or informal resolution (whichever has been agreed with the complainant)1. This figure does not include concerns which may have been raised by patients and dealt with immediately by front line staff. The number of complaints received in Q1 represents an increase of 25.9% compared to Q4 of 2016/17 and an increase of 6.7% on the corresponding period one year previously. Figure 1 shows the pattern of complaints received in the last 17 months, which is when the Trust commenced recording complaints on the Datix system. Figure 2 shows complaints dealt with via the formal investigation process compared to those dealt with via the informal investigation process, over the same period.
1 Informal complaints are dealt with quickly via direct contact with the appropriate department, whereas formal complaints are dealt with by way of a formal investigation via the Division.
University Hospitals Bristol NHS Foundation Trust, Complaints Report Q1 2017/18 Page 4
Figure 1: Number of complaints received
Figure 2: Numbers of formal v informal complaints
1.2 Complaints responses within agreed timescale Whenever a complaint is managed through the formal resolution process, the Trust and the complainant agree a timescale within which we will investigate the complaint and write to the complainant with, or arrange a meeting to discuss, our findings. The timescale is agreed with the complainant upon receipt of the complaint and is usually 30 working days. When a complaint is managed through the informal resolution process, the Trust and complainant also agree a timescale and this is usually 10 working days.

University Hospitals Bristol NHS Foundation Trust, Complaints Report Q1 2017/18 Page 5
1.2.1 Formal Investigations The Trust’s target is to respond to at least 95% of complaints within the agreed timescale. The end point is measured as the date when the Trust’s response is posted to the complainant. In Q1 of 2017/18, 80.2% of responses were posted within the agreed timescale, compared to 86.0% in Q4 of 2016/17 and 76.2% during the same period one year previously. This represents 26 breaches out of 132 formal complaints which were due to receive a response during Q1 of 2017/182. Figure 3 shows the Trust’s performance in responding to complaints since February 2016. Figure 3: Percentage of formal complaints responded to within agreed timescale
1.2.2 Informal Investigations In Q1 2017/18, the Trust received 314 complaints that were investigated via the informal process. This quarter, for the first time, we are reporting on how the Trust performed in respect of resolving these complaints within the agreed timescale. In Q1, 76.7% of informal complaints (241 of 314) were resolved within the time agreed with the complainant. Data relating to past performance is not available (not previously recorded). 1.3 Dissatisfied complaints Reducing numbers of dissatisfied complainants was one of the Trust’s corporate quality objectives for 2015/16, remained a priority throughout 2016/17 and will continue to be closely monitored in 2017/18. We are disappointed whenever anyone feels the need to complain about our services; but especially so if they are then dissatisfied with the quality of our investigation into and response to their concerns. For every complaint we receive, our aim is to identify whether and where we have
2 Note that this will be a different figure to the number of complainants who made a complaint in that quarter.
0%10%20%30%40%50%60%70%80%90%
100%
Perc
enta
ge o
f Com
plai
nts
Month
Percentage of Complaints Responded To Within Timeframe
Actual Performance Target

University Hospitals Bristol NHS Foundation Trust, Complaints Report Q1 2017/18 Page 6
made mistakes, to put things right if we can, and to learn as an organisation to that we do not make the same mistake again. Our target is that nobody should be dissatisfied with the quality of our response to their complaint3. The way in which dissatisfied cases are reported is expressed as a percentage of the responses the Trust has sent out in any given month. Since Q3 2015/16, our target has been for less than 5% of complainants to be dissatisfied. This data is now reported two months’ in arrears in order to capture the majority of cases where complainants tell us they were not happy with our response. In Q1, of the responses sent out in April 2017 and by the cut-off point of mid-June 2017 (the date on which the dissatisfied data for April 2017 was finalised), six people had contacted us to say they were dissatisfied. This represents 15.8% of the responses sent out that month. Previously, in Q4, of a total of 136 responses sent out in the quarter, 17 had received a dissatisfied response at the point when monthly data was frozen for board reporting. This represents 12.5% of the responses sent out. Figure 4 shows the percentage of complainants who were dissatisfied with aspects of our complaints response up until April 2017. Figure 4: Dissatisfied cases as a percentage of responses
For each case where a complainant advises they are dissatisfied, the case is reviewed by a Patient Support and Complaints Officer, leading to one of the following courses of action, according to the complainant’s preference:
• The lead Division is asked to reinvestigate the outstanding concerns and send a further response letter to the complainant addressing these issues;
3 Please note that we differentiate this from complainants who may raise new issues or questions as a result of our response.
University Hospitals Bristol NHS Foundation Trust, Complaints Report Q1 2017/18 Page 7
• The lead Division is asked to reinvestigate the outstanding concerns and arrange to meet with the complainant to address these issues
• On rare occasions, a letter may be sent to the complainant advising that the Trust feels that it has already addressed all of the concerns raised and reminding the complainant that if they remain unhappy, they have the option of asking the Ombudsman to independently review their complaint. This option might be appropriate if, for example, if a complainant was disputing certain events that had been captured on CCTV and were therefore incontrovertible.
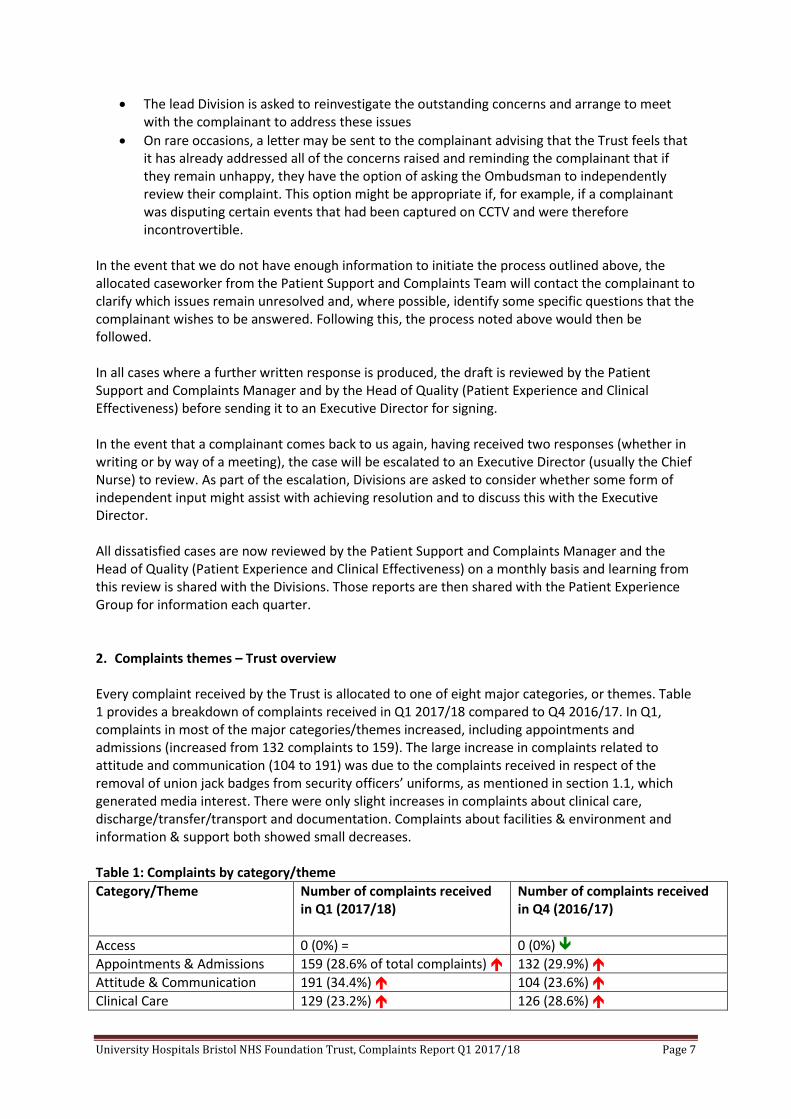
In the event that we do not have enough information to initiate the process outlined above, the allocated caseworker from the Patient Support and Complaints Team will contact the complainant to clarify which issues remain unresolved and, where possible, identify some specific questions that the complainant wishes to be answered. Following this, the process noted above would then be followed. In all cases where a further written response is produced, the draft is reviewed by the Patient Support and Complaints Manager and by the Head of Quality (Patient Experience and Clinical Effectiveness) before sending it to an Executive Director for signing. In the event that a complainant comes back to us again, having received two responses (whether in writing or by way of a meeting), the case will be escalated to an Executive Director (usually the Chief Nurse) to review. As part of the escalation, Divisions are asked to consider whether some form of independent input might assist with achieving resolution and to discuss this with the Executive Director. All dissatisfied cases are now reviewed by the Patient Support and Complaints Manager and the Head of Quality (Patient Experience and Clinical Effectiveness) on a monthly basis and learning from this review is shared with the Divisions. Those reports are then shared with the Patient Experience Group for information each quarter. 2. Complaints themes – Trust overview Every complaint received by the Trust is allocated to one of eight major categories, or themes. Table 1 provides a breakdown of complaints received in Q1 2017/18 compared to Q4 2016/17. In Q1, complaints in most of the major categories/themes increased, including appointments and admissions (increased from 132 complaints to 159). The large increase in complaints related to attitude and communication (104 to 191) was due to the complaints received in respect of the removal of union jack badges from security officers’ uniforms, as mentioned in section 1.1, which generated media interest. There were only slight increases in complaints about clinical care, discharge/transfer/transport and documentation. Complaints about facilities & environment and information & support both showed small decreases. Table 1: Complaints by category/theme Category/Theme Number of complaints received
in Q1 (2017/18)
Number of complaints received in Q4 (2016/17)
Access 0 (0%) = 0 (0%) Appointments & Admissions 159 (28.6% of total complaints) 132 (29.9%) Attitude & Communication 191 (34.4%) 104 (23.6%) Clinical Care 129 (23.2%) 126 (28.6%)

University Hospitals Bristol NHS Foundation Trust, Complaints Report Q1 2017/18 Page 8
Discharge/Transfer/Transport 17 (3.1%) 15 (3.4%) Documentation 6 (1.1%) 4 (0.9%) Facilities & Environment 16 (2.9%) 21 (4.8%) Information & Support 37 (6.7%) 39 (8.8%) Total 555 441 Each complaint is also assigned to a more specific sub-category, for which there are over 100. Table 2 lists the ten most consistently reported sub-categories. In total, these sub-categories account for slightly over half of the complaints received in Q1 (285/555). Complaints relating to attitude of security staff (totalling 101) have been excluded from Table 2 as this was considered a ‘one-off’ event. Table 2: Complaints by sub-category Sub-category Number of
complaints received in Q1 (2017/18)
Q4 (2016/17)
Q3 (2016/17)
Q2 (2016/17)
Cancelled/delayed appointments and operations
75 (38.9% increase compared to Q4)
54
66 106
Communication with patient/relative
15 (25% decrease compared to Q4)
20
25 23
Clinical Care (Medical/Surgical)
70 = 70
54 60
Failure to answer telephones/failure to respond
22 = 22
24 27
Clinical Care (Nursing/Midwifery)
18 (38.5% increase compared to Q4)
13
13 19
Attitude of Medical Staff
29 (7.4% increase compared to Q4)
27
14 24
Attitude of Admin/Clerical Staff
4 (77.8% decrease compared to Q4)
18 11 11
Attitude of Nursing Staff
3 = 4
5 17
Appointment Administration Issues
46 (31.4% increase compared to Q4)
35 15 38
Transport (Late/Non Arrival/Inappropriate)
3 (50% increase compared to Q4)
2
2 11
Complaints about ‘cancelled or delayed appointments or operations/procedures’ rose in Q1, having previously decreased for three consecutive quarters. There was also a rise in complaints in respect of ‘appointment and administration issues’ in Q1, and we will undertake a more detailed analysis if the reporting pattern is sustained in Q2 of 2017/18. Complaints about ‘attitude of nursing staff’ have reduced for three consecutive quarters, whilst the Q4 upturn in complaints about ‘attitude of admin/clerical staff’ was reversed in Q1. Figures 5, 6, and 7 show the four most commonly recorded sub-categories of complaint as detailed above, tracked since February 2016.

University Hospitals Bristol NHS Foundation Trust, Complaints Report Q1 2017/18 Page 9
Figure 5: Cancelled or delayed appointments and operations
Figure 6: Clinical care – Medical/Surgical

University Hospitals Bristol NHS Foundation Trust, Complaints Report Q1 2017/18 Page 10
Figure 7: Communication with patient/relative and telephone answering

University Hospitals Bristol NHS Foundation Trust, Complaints Report Q1 2017/18 Page 11
3. Divisional Performance 3.1 Divisional analysis of complaints received Table 3 provides an analysis of Q1 complaints performance by Division. In addition to providing an overall view, the table includes data for the three most common reasons why people complain: concerns about appointments and admissions; concerns about staff attitude and communication; and concerns about clinical care. Data for the Division of Trust Services is not included in this table but is summarised in section 3.1.6 of the report.
Table 3 Surgery Medicine Specialised Services Women & Children Diagnostics & Therapies Total number of complaints received
175 (155) 102 (88) 70 (82) 73 (67) 13 (11)
Number of complaints about appointments and admissions
94 (72) 13 (19) 31 (17) 18 (15) 3 (7)
Number of complaints about staff attitude and communication
30 (37) 27 (17) 9 (17) 19 (22) 1 (2)
Number of complaints about clinical care
36 (29) 42 (34) 19 (35) 26 (27) 5 (1)
Area where the most complaints have been received in Q4
Bristol Dental Hospital – 79 (48) Bristol Eye Hospital – 25 (44) Trauma & Orthopaedics – 8 (15) ENT – 10 (10) Lower GI – 9 (7) Upper GI – 7 (12)
Emergency Department (BRI) – 28 (18) Dermatology – 9 (10) Sleep Unit 9 (7) Ward A300 (AMU) – 9 (5)
BHI (all) – 50 (64) BHI Outpatients – 12 (20) BHI Waiting List Office - 8 (8) Ward C708 – 6 (6) Appointments Dept (BHOC) – 10 (2)
Children's ED & Ward 39 (BRHC) – 4 (9) Gynaecology Outpatients (StMH) – 6 (7) Paediatric Orthopaedics – 2 (7) Central Delivery Suite (STMH) – 6 (3)
Radiology – 4 (3) Physiotherapy – 3 (2) Audiology – 2 (1)
Notable deteriorations compared to Q4
Bristol Dental Hospital - 79 (48) Emergency Department (BRI) – 28 (18) Ward A300 (AMU) – 9 (5)
Appointments Dept (BHOC) – 10 (2)
None None
Notable improvements compared to Q4
Bristol Eye Hospital - 25 (44) Trauma & Orthopaedics – 8 (15)
None BHI (all) – 50 (64) BHI Outpatients – 12 (20)
Paediatric Orthopaedics – 2 (7) Children's ED & Ward 39 (BRHC) – 4 (9)
None
University Hospitals Bristol NHS Foundation Trust, Complaints Report Q1 2017/18 Page 12
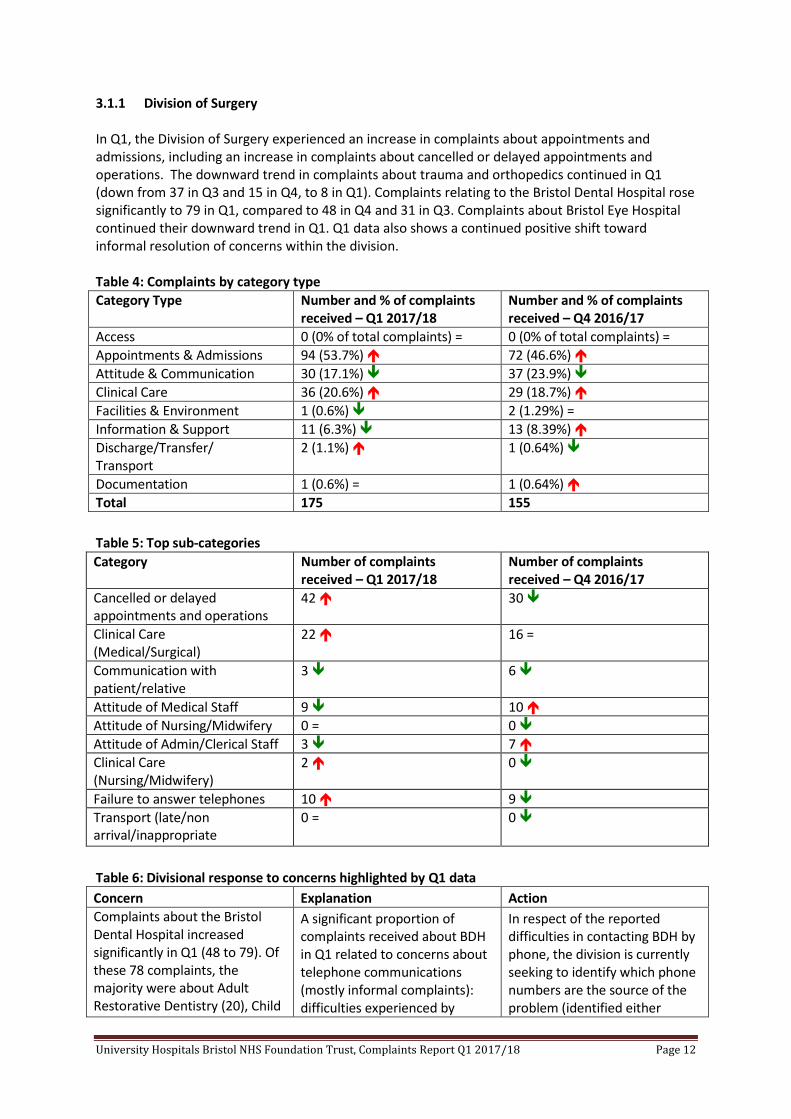
3.1.1 Division of Surgery In Q1, the Division of Surgery experienced an increase in complaints about appointments and admissions, including an increase in complaints about cancelled or delayed appointments and operations. The downward trend in complaints about trauma and orthopedics continued in Q1 (down from 37 in Q3 and 15 in Q4, to 8 in Q1). Complaints relating to the Bristol Dental Hospital rose significantly to 79 in Q1, compared to 48 in Q4 and 31 in Q3. Complaints about Bristol Eye Hospital continued their downward trend in Q1. Q1 data also shows a continued positive shift toward informal resolution of concerns within the division. Table 4: Complaints by category type Category Type Number and % of complaints
received – Q1 2017/18 Number and % of complaints received – Q4 2016/17
Access 0 (0% of total complaints) = 0 (0% of total complaints) = Appointments & Admissions 94 (53.7%) 72 (46.6%) Attitude & Communication 30 (17.1%) 37 (23.9%) Clinical Care 36 (20.6%) 29 (18.7%) Facilities & Environment 1 (0.6%) 2 (1.29%) = Information & Support 11 (6.3%) 13 (8.39%) Discharge/Transfer/ Transport
2 (1.1%) 1 (0.64%)
Documentation 1 (0.6%) = 1 (0.64%) Total 175 155 Table 5: Top sub-categories Category Number of complaints
received – Q1 2017/18 Number of complaints received – Q4 2016/17
Cancelled or delayed appointments and operations
42 30
Clinical Care (Medical/Surgical)
22 16 =
Communication with patient/relative
3 6
Attitude of Medical Staff 9 10 Attitude of Nursing/Midwifery 0 = 0 Attitude of Admin/Clerical Staff 3 7 Clinical Care (Nursing/Midwifery)
2 0
Failure to answer telephones 10 9 Transport (late/non arrival/inappropriate
0 = 0
Table 6: Divisional response to concerns highlighted by Q1 data Concern Explanation Action Complaints about the Bristol Dental Hospital increased significantly in Q1 (48 to 79). Of these 78 complaints, the majority were about Adult Restorative Dentistry (20), Child
A significant proportion of complaints received about BDH in Q1 related to concerns about telephone communications (mostly informal complaints): difficulties experienced by
In respect of the reported difficulties in contacting BDH by phone, the division is currently seeking to identify which phone numbers are the source of the problem (identified either

University Hospitals Bristol NHS Foundation Trust, Complaints Report Q1 2017/18 Page 13
Dental Health (18), the Administration Department (16) and Oral Surgery (16).
patients when attempting to phone BDH to discuss their appointments and/or the attitude of administration staff when calls were answered.
retrospectively from patient letters or prospectively by asking the Patient Support and Complaints Team and Communication Team (re. concerns raised via social media) to record/seek this information)). This will identify whether the complaints relate to the Trust’s outpatient call centre or direct lines into the BDH (and which ones). Customer services training is also being arranged for BDH admin staff.
Figure 8: Surgery, Head & Neck – formal and informal complaints received
University Hospitals Bristol NHS Foundation Trust, Complaints Report Q1 2017/18 Page 14
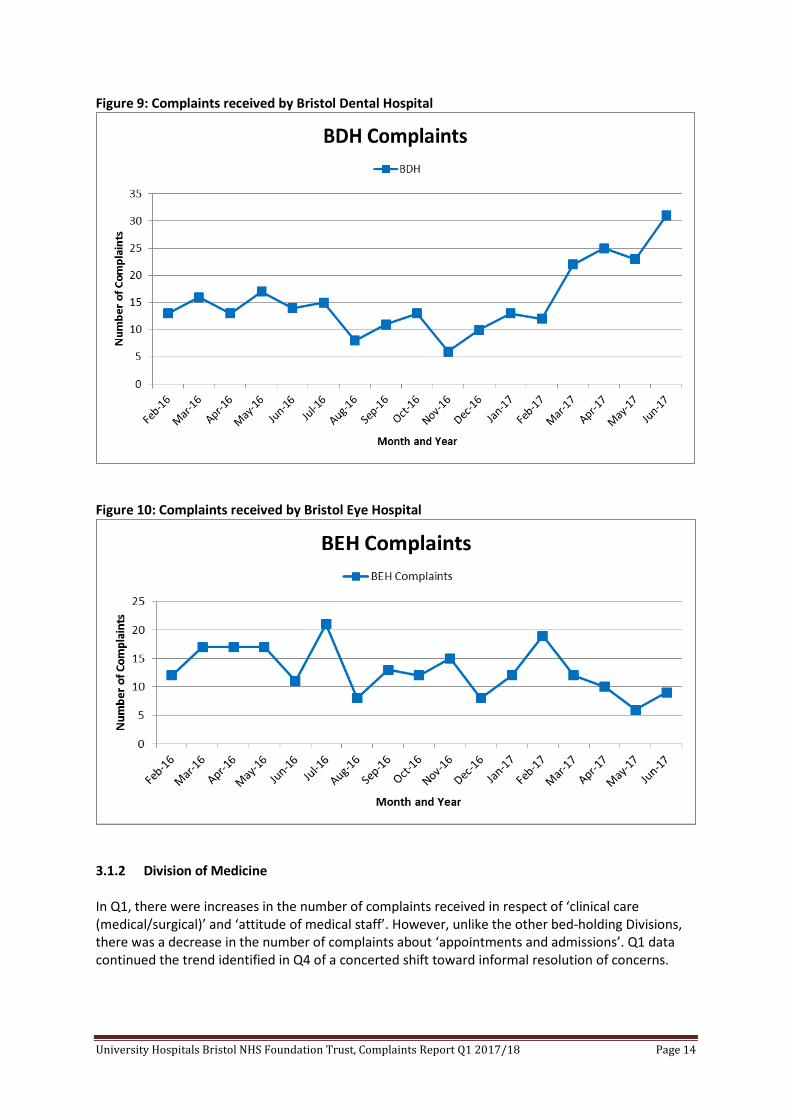
Figure 9: Complaints received by Bristol Dental Hospital
Figure 10: Complaints received by Bristol Eye Hospital
3.1.2 Division of Medicine In Q1, there were increases in the number of complaints received in respect of ‘clinical care (medical/surgical)’ and ‘attitude of medical staff’. However, unlike the other bed-holding Divisions, there was a decrease in the number of complaints about ‘appointments and admissions’. Q1 data continued the trend identified in Q4 of a concerted shift toward informal resolution of concerns.

University Hospitals Bristol NHS Foundation Trust, Complaints Report Q1 2017/18 Page 15
Table 7: Complaints by category type Category Type Number and % of complaints
received – Q1 2017/18 Number and % of complaints received – Q4 2016/17
Access 0 (0% of total complaints) = 0 (0% of total complaints) = Appointments & Admissions 13 (12.7%) 19 (21.6%) Attitude & Communication 27 (26.5%) 17 (19.3%) Clinical Care 42 (41.2%) 34 (38.6%) Facilities & Environment 4 (3.9%) 6 (6.8%) = Information & Support 4 (3.9%) = 4 (4.5%) Discharge/Transfer/ Transport
8 (7.8%) 6 (6.8%)
Documentation 4 (3.9%) 2 (2.3%) Total 102 88 Table 8: Top sub-categories Category Number of complaints
received – Q1 2017/18 Number of complaints received – Q4 2016/17
Cancelled or delayed appointments and operations
5 6
Clinical Care (Medical/Surgical)
26 17
Communication with patient/relative
2 3
Attitude of Medical Staff 12 7 Attitude of Nursing/Midwifery 2 0 Attitude of Admin/Clerical Staff 0 2 Clinical Care (Nursing/Midwifery)
7 4
Failure to answer telephones 5 4 Table 9: Divisional response to concerns highlighted by Q1 data Concern Explanation Action There was an increase in the number of complaints under the category of ‘clinical care (medical/surgical)’ from 17 in Q4 to 26 in Q1. 10 of these related to the Emergency Department (BRI), five to Ward A300 (AMU) and four to the Dermatology Centre.
A review of these cases has taken place there are no identified themes other than within ED.
A continued focus on embedding the learning from these complaints and continued review of any identified themes will continue.
In addition to the concern noted above, there was a general increase in the number of complaints for the Emergency Department (ED) and Ward A300 (AMU). Eight complaints in the ED were in respect of ‘attitude and communication’.
A theme was identified in ED regarding identification of injuries and subsequent requirement to return for ED for ongoing treatment.
The ED lead consultant has reviewed the six cases and identified that four relate to radiology and the reporting or results. This will be discussed in the departmental management meeting to raise awareness and plan any appropriate actions.

University Hospitals Bristol NHS Foundation Trust, Complaints Report Q1 2017/18 Page 16
Figure 11: Medicine – formal and informal complaints received
Figure 12: Complaints received by BRI Emergency Department
3.1.3 Division of Specialised Services In Q1, the Division of Specialised Services experienced significant decreases in complaints about ‘attitude and communication’ and ‘clinical care’ when compared to Q4. In line with the other bed-holding Divisions (with the exception of Medicine), the Division did see an increase in the number of complaints relating to ‘appointments and admissions’ (from17 in Q4 to 31 in Q1).

University Hospitals Bristol NHS Foundation Trust, Complaints Report Q1 2017/18 Page 17
Table 10: Complaints by category type Category Type Number and % of
complaints received – Q1 2017/18
Number and % of complaints received – Q4 2016/17
Access 0 (0% of total complaints ) = 0 (0% of total complaints) = Appointments & Admissions 31 (44.3%) 17 (20.7%) Attitude & Communication 9 (12.9%) 17 (20.7%) Clinical Care 19 (27.1%) 35 (42.7%) Facilities & Environment 3 (4.3%) 1 (1.2%) Information & Support 6 (8.6%) 7 (8.5%) Discharge/Transfer/Transport 2 (2.9%) 5 (6.1%) Documentation 0 (0%) = 0 (0%) = Total 70 82 Table 11: Top sub-categories Category Number of complaints
received – Q1 2017/18 Number of complaints received – Q4 2016/17
Cancelled or delayed appointments and operations
16 8 =
Clinical Care (Medical/Surgical)
10 3
Communication with patient/relative
1 5
Attitude of Medical Staff 3 = 3 Attitude of Nursing/Midwifery 0 1 Attitude of Admin/Clerical Staff 0 = 0 = Clinical Care (Nursing/Midwifery)
1 = 1
Failure to answer telephones 5 7 Table 12: Divisional response to concerns highlighted by Q4 data Concern Explanation Action The Division has seen an increase in complaints about ‘appointments and admissions’ in Q1. Seven of these complaints were about the BHI Waiting List Office and six were received in respect of the BHOC Appointments Department.
There was significant sickness absence across the waiting list and admin teams in the BHI in Q1 which was also compounded by vacancies in the cardiac waiting list team; this led to delays in answering telephones and responding to patients queries. See below for BHOC appointments
The sickness has resolved across both teams and therefore the expected service has resumed.
In addition to the above point, the BHOC Appointments Department saw an increase from two complaints in Q4 to 10 complaints in Q1.
The BHOC is experiencing a significant rise in the number of patients requiring chemotherapy which has been compounded by a reduction of the number of
The Division is working with health care at home to increase capacity for the delivery of chemotherapy during September. In October, a new method of managing patients

University Hospitals Bristol NHS Foundation Trust, Complaints Report Q1 2017/18 Page 18
chemotherapy slots available as a result of bank holidays.
will be introduced to increase capacity in the Chemotherapy Day Unit. The Division is also working with the Division of Diagnostics and Therapies to develop a service covering bank holidays.
Figure 13: Specialised Services – formal and informal complaints received
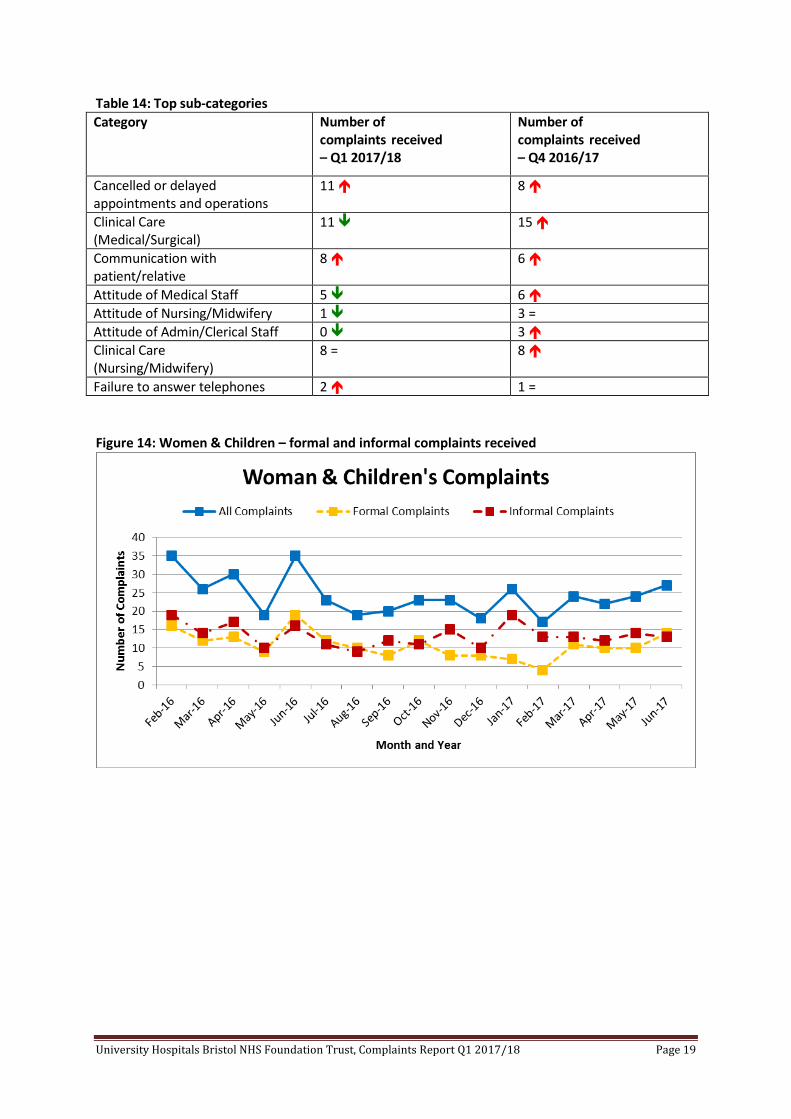
3.1.4 Division of Women’s and Children’s Services In Q1, the Division of Women’s and Children’s Services received a similar number of complaints to Q3. Complaints about Attitude and Communication rose (up from 15 to 22), however, there were no discernable patterns within this group of complaints. Table 13: Complaints by category type Category Type Number and % of complaints
received – Q1 2017/18 Number and % of complaints received – Q4 2016/17
Access 0 (0% of total complaints) = 0 (0% of total complaints) = Appointments & Admissions 18 (24.7%) 15 (22.4%) = Attitude & Communication 19 (26.1%) 22 (32.8%) Clinical Care 26 (35.6%) 27 (40.3%) Facilities & Environment 2 (2.7%) 1 (1.5%) = Information & Support 5 (6.8%) 1 (1.5%) Discharge/Transfer/Transport 2 (2.7%) 0 (0%) Documentation 1 (1.4%) = 1 (1.5%) Total 73 67
University Hospitals Bristol NHS Foundation Trust, Complaints Report Q1 2017/18 Page 19
Table 14: Top sub-categories Category Number of
complaints received – Q1 2017/18
Number of complaints received – Q4 2016/17
Cancelled or delayed appointments and operations
11 8
Clinical Care (Medical/Surgical)
11 15
Communication with patient/relative
8 6
Attitude of Medical Staff 5 6 Attitude of Nursing/Midwifery 1 3 = Attitude of Admin/Clerical Staff 0 3 Clinical Care (Nursing/Midwifery)
8 = 8
Failure to answer telephones 2 1 = Figure 14: Women & Children – formal and informal complaints received
University Hospitals Bristol NHS Foundation Trust, Complaints Report Q1 2017/18 Page 20
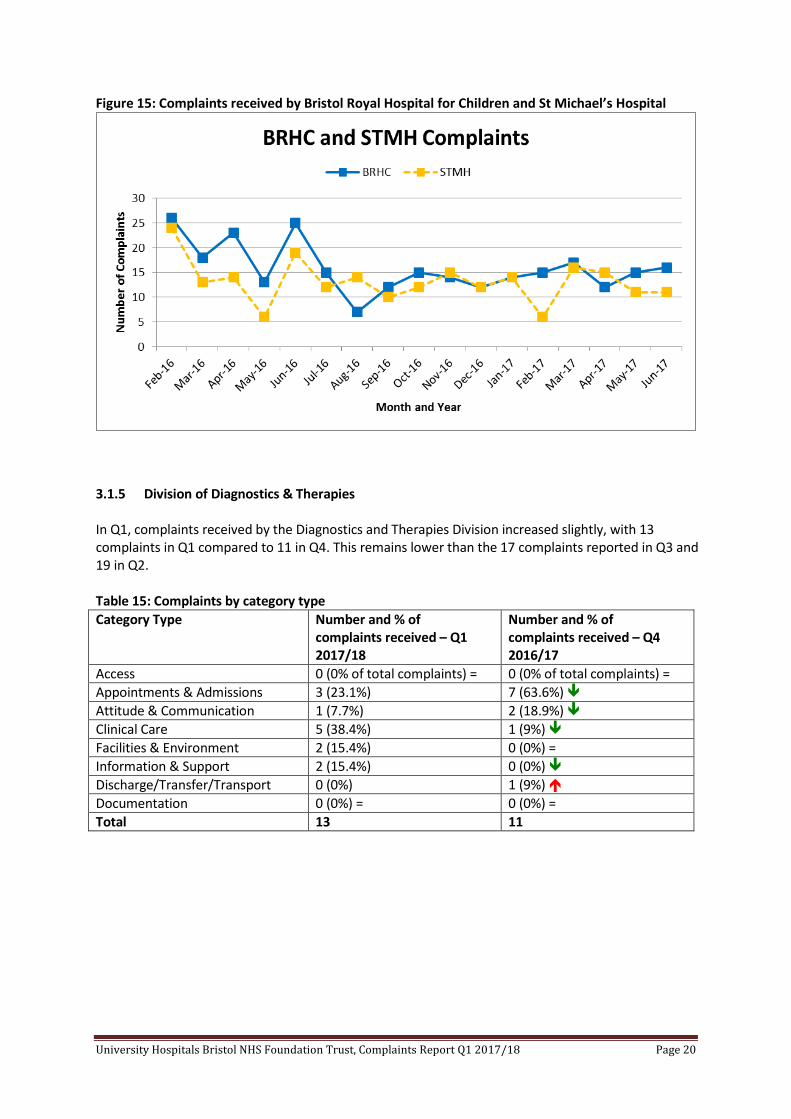
Figure 15: Complaints received by Bristol Royal Hospital for Children and St Michael’s Hospital
3.1.5 Division of Diagnostics & Therapies In Q1, complaints received by the Diagnostics and Therapies Division increased slightly, with 13 complaints in Q1 compared to 11 in Q4. This remains lower than the 17 complaints reported in Q3 and 19 in Q2. Table 15: Complaints by category type Category Type Number and % of
complaints received – Q1 2017/18
Number and % of complaints received – Q4 2016/17
Access 0 (0% of total complaints) = 0 (0% of total complaints) = Appointments & Admissions 3 (23.1%) 7 (63.6%) Attitude & Communication 1 (7.7%) 2 (18.9%) Clinical Care 5 (38.4%) 1 (9%) Facilities & Environment 2 (15.4%) 0 (0%) = Information & Support 2 (15.4%) 0 (0%) Discharge/Transfer/Transport 0 (0%) 1 (9%) Documentation 0 (0%) = 0 (0%) = Total 13 11

University Hospitals Bristol NHS Foundation Trust, Complaints Report Q1 2017/18 Page 21
Figure 16: Diagnostics and Therapies – formal and informal complaints received
3.1.6 Division of Trust Services For the first time this quarter (Q1 2017/18), we are including data relating to complaints received by Trust Services, which includes the Facilities & Estates department. Figure 17 below shows the number of complaints received by the Division since February 2016 and clearly shows the spike in complaints in April 2017 when the Trust received over 100 complaints about security officers being asked to remove wearing union jack badges. Figure 17: Trust Services – formal and informal complaints received

University Hospitals Bristol NHS Foundation Trust, Complaints Report Q1 2017/18 Page 22
3.2 Complaints by hospital site Of those complaints with an identifiable site, the breakdown by hospital is as follows: Table 16: Breakdown of complaints by hospital site Hospital/Site Number and % of
complaints received in Q1 2017/18
Number and % of complaints received in Q4 2016/17
Bristol Royal Infirmary 279 (50.3%) 164 (37.2%) Bristol Dental Hospital 79 (14.2%) 48 (10.9%) Bristol Heart Institute 50 (9.0%) 64 (14.5%) Bristol Royal Hospital for Children 44 (7.9%) 49 (11.1%) St Michael’s Hospital 37 (6.7%) 36 (8.2%) Bristol Eye Hospital 25 (4.5%) 43 (9.8%) Bristol Haematology & Oncology Centre
21 (3.8%) = 21 (4.8%)
South Bristol Community Hospital 7 (1.3%) 6 (1.4%) Community Midwifery Services 3 (0.5%) 1 (0.2%) Central Health Clinic 3 (0.5%) = 3 (0.7%) Southmead Hospital (UH Bristol services)
3 (0.5%) 1 (0.2%)
Other Trust 2 (0.4%) 4 (0.8%) Community Dental Sites 1 (0.2%) = 1 (0.2%) Trust Headquarters 1 (0.2%) 0 (0%) TOTAL 555 441 The large increase in complaints relating to the BRI is due to the ‘union jack’ complaint described elsewhere in this report, i.e. all 101 related complaints are included in the BRI total of 279. 3.2.1 Breakdown of complaints by inpatient/outpatient/ED status Also for the first time, this quarterly report includes data differentiating between inpatient, outpatient and Emergency Department complaints.

University Hospitals Bristol NHS Foundation Trust, Complaints Report Q1 2017/18 Page 23
Figure 18: Complaints received broken down by inpatients and outpatients
Table 17: Breakdown of Area Type Complaints Area Type Month ED Inpatient Outpatient Other Grand Total Apr-16 14 59 86 17 176 May-16 11 46 70 19 146 Jun-16 10 85 86 17 198 Jul-16 14 90 64 32 200 Aug-16 10 72 57 16 155 Sep-16 10 57 71 24 162 Oct-16 9 40 66 25 140 Nov-16 10 56 53 20 139 Dec-16 9 44 48 17 118 Jan-17 5 47 63 14 129 Feb-17 12 39 60 33 144 Mar-17 10 59 64 35 168 Apr-17 12 45 65 125 247 May-17 21 56 54 27 158 Jun-17 6 43 71 30 150 Grand Total 163 838 978 451 2430
3.3 Complaints responded to within agreed timescale All Divisions, with the exception of Diagnostics and Therapies, reported breaches in Q1, totalling 26, which is an increase on the 19 breaches recorded in Q4. These breaches are spread across all of the

University Hospitals Bristol NHS Foundation Trust, Complaints Report Q1 2017/18 Page 24
bed-holding Divisions, with the largest increase within the Division of Specialised Services (when compared to Q4). Comments on this increase are included in table 12 in section 3.1.3. Table 18: Breakdown of breached deadlines Division Q1 (2017/18) Q4 (2016/17) Q3 (2016/17) Q2 (2016/17) Surgery 6 (14.6%) 7 (14.3%) 1 (0.7%) 0 (0%) Medicine 6 (22.2%) 4 (15.4%) 0 (0%) 4 (11.1%) Specialised Services 6 (24%) 2 (6.4%) 4 (8.9%) 1 (4.5%) Women & Children 6 (18.2%) 6 (24%) 3 (4.7%) 5 (16.7%) Diagnostics & Therapies
0 (0%) 0 (0%) 0 (0%) 0 (0%)
Trust Services 2 (50%) 0 (0%) 0 (0%) 2 (66.7%) All 26 breaches 19 breaches 8 breaches 12 breaches (So, as an example, there were six breaches of timescale in the division of Specialised Services in Q1, which constituted 24% of the complaints responses which had been due in that division in Q1). Breaches of timescale were caused either by late receipt of draft responses from Divisions which did not allow adequate time for Executive review and sign-off; delays in processing by the Patient Support and Complaints Team; delays during the sign-off process itself; and/or responses being returned for amendment following Executive review. 3.4 Outcome of formal complaints In Q1 we responded to 132 formal complaints4. Tables 19 and 20 below show a breakdown, by Division, of how many cases were upheld, partly upheld or not upheld in Q1 of 2017/18 and Q4 of 2016/17. Whilst the number of responses in Q1 was similar to Q4 (132 compared to 136), 15 more complaints were upheld, with a corresponding reduction in cases recorded as partly upheld. This shift applied to responses in all Divisions, however there is no discernible reason for this change. Table 19: Outcome of formal complaints – Q1 2017/18 Upheld Partly Upheld Not Upheld Surgery 6 (14.6%) 28 (68.3%) 7 (17.1%) Medicine 6 (22.2%) 15 (55.6%) 6 (22.2%) Specialised Services 3 (12%) 17 (68%) 5 (20%) Women & Children 7 (21.2%) 21 (63.6%) 5 (15.2%) Diagnostics & Therapies 1 (100%) 0 (0%) 0 (0%) Trust Services 1 (20%) 3 (60%) 1 (20%) Total 24 (18.2%) 84 (63.6%) 24 (18.2%)
4 Note: this is different to the number of formal complaints we received in the quarter

University Hospitals Bristol NHS Foundation Trust, Complaints Report Q1 2017/18 Page 25
Table 20: Outcome of formal complaints – Q4 2016/17 Upheld Partly Upheld Not Upheld Surgery 3 (6.1%) 34 (69.4%) 12 (24.5%) Medicine 3 (11.5%) 21 (80.8%) 2 (7.7%) Specialised Services 1 (3.2%) 26 (83.9%) 4 (12.9%) Women & Children 2 (8%) 17 (68%) 6 (24%) Diagnostics & Therapies 0 (0%) 1 (50%) 1 (50%) Trust Services 0 (0%) 2 (66.7%) 1 (33.3%) Total 9 (6.6%) 101 (74.3%) 26 (19.1%) 4. Information, advice and support In addition to dealing with complaints, the Patient Support and Complaints Team is also responsible for providing patients, relatives and carers with help and support, including:
• Non-clinical information and advice; • A contact point for patients who wish to feedback a compliment or general information
about the Trust’s services; • Support for patients with additional support needs and their families/carers; and • Signposting to other services and organisations.
In Q1, the team dealt with 174 such enquiries, compared to 191 in Q4. These enquiries can be categorised as:
• 138 requests for advice and information (142 in Q4) • 34 compliments (47 in Q4)5 • 2 request for support (4 in Q4)
Table 21 below shows a breakdown of the 138 requests for advice, information and support dealt with by the team in Q1. Table 21: Enquiries by category Category Number of enquiries Information about patient 35 Hospital information request 23 Signposting 15 Medical records requested 8 Appointments administration issues 6 Clinical care 4 Clinical information request 4 Transport request 4 Employment and volunteering 4 Delayed operation/procedure 3 Freedom of information request 3 Accommodation enquiry 3 Travel arrangements 3 Invoicing 2
5 This figure includes compliments added directly to the Datix system by Divisions.

University Hospitals Bristol NHS Foundation Trust, Complaints Report Q1 2017/18 Page 26
Translating & Interpreting 2 Lost/misplaced test results 2 Failure to answer phone/respond 2 Admissions arrangements 2 Cleanliness (internal) 2 Telecommunications 1 Signage 1 Medication incorrect 1 Follow up treatment 1 Expenses claim 1 Confidentiality 1 Discharge arrangements 1 Bereavement support 1 Waiting time in clinic 1 Appointment letter not received 1 Car parking 1 Total 138 In addition to the enquiries detailed above, in Q1 the Patient Support and Complaints team recorded 203 enquiries that did not proceed. This is where someone contacts the department to make a complaint or enquiry but does not leave enough information to enable the team to carry out an investigation, or they subsequently decide that they no longer wish to proceed with the complaint. 5. Acknowledgement of complaints by the Patient Support and Complaints Team One of the Key Performance Indicators (KPIs) used to monitor the performance of the Patient Support and Complaints Team is the length of time between receipt of a complaint and sending an acknowledgement. The Trust’s Complaints and Concerns Policy states that when the Patient Support and Complaints Team reviews a complaint following receipt:
• a risk assessment will be carried out; • agreement will be reached with the complainant about how we will proceed with their
complaint and a timescale for doing so; • The appropriate paperwork will be produced and sent to the Divisional Complaints
Coordinator for investigation; and • An acknowledgement letter confirming how the complaint will be managed will be sent to
the complainant. The NHS Complaints Procedure (2009) states that complaints must be acknowledged within three working days. This is also a requirement of the NHS Constitution. The Trust’s own policy states that complaints made in writing (including emails) will be acknowledged within three working days and that complaints made orally (via the telephone or in person) will be acknowledged within two working days. In Q1, 333 complaints were received in writing (email, letter or complaint form) and 222 were received verbally (35 in person via drop-in service and 187 by telephone). Of the 555 complaints received in Q1, 515 (92.8%) met the Trust’s standard of being acknowledged within two working days (verbal) and three working days (written).
University Hospitals Bristol NHS Foundation Trust, Complaints Report Q1 2017/18 Page 27
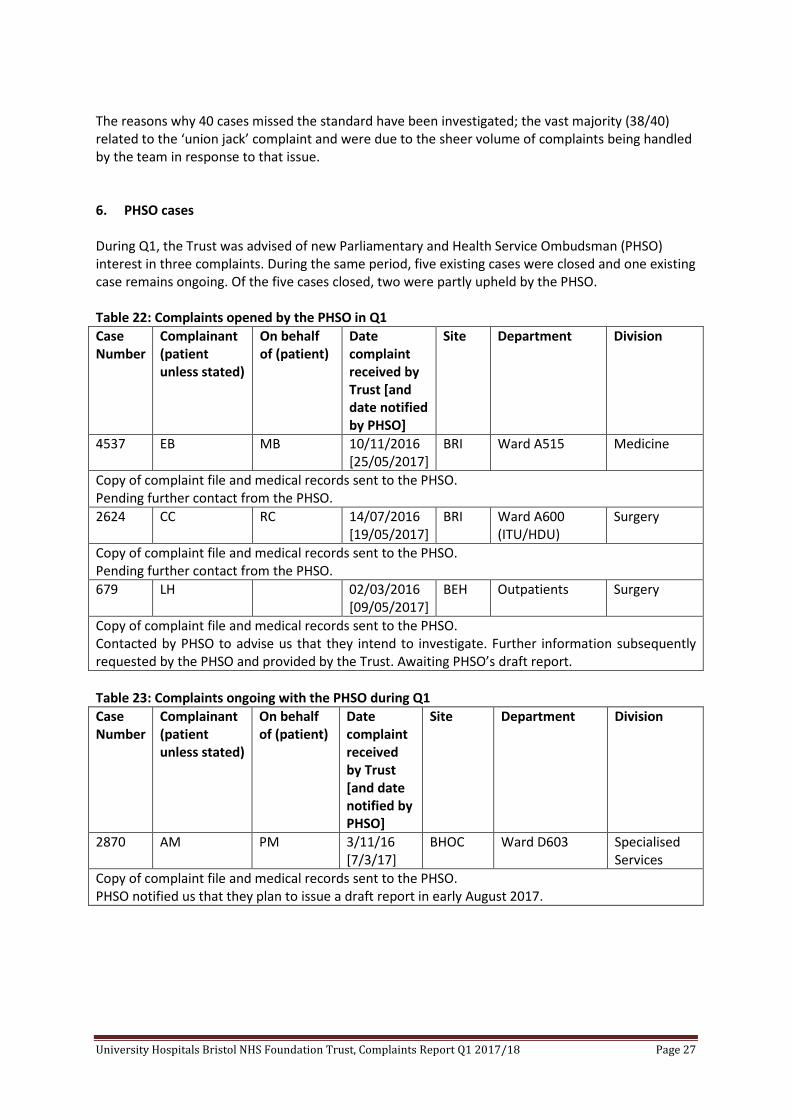
The reasons why 40 cases missed the standard have been investigated; the vast majority (38/40) related to the ‘union jack’ complaint and were due to the sheer volume of complaints being handled by the team in response to that issue. 6. PHSO cases During Q1, the Trust was advised of new Parliamentary and Health Service Ombudsman (PHSO) interest in three complaints. During the same period, five existing cases were closed and one existing case remains ongoing. Of the five cases closed, two were partly upheld by the PHSO. Table 22: Complaints opened by the PHSO in Q1 Case Number
Complainant (patient unless stated)
On behalf of (patient)
Date complaint received by Trust [and date notified by PHSO]
Site Department Division
4537 EB MB 10/11/2016 [25/05/2017]
BRI Ward A515 Medicine
Copy of complaint file and medical records sent to the PHSO. Pending further contact from the PHSO. 2624 CC RC 14/07/2016
[19/05/2017] BRI Ward A600
(ITU/HDU) Surgery
Copy of complaint file and medical records sent to the PHSO. Pending further contact from the PHSO. 679 LH 02/03/2016
[09/05/2017] BEH Outpatients Surgery
Copy of complaint file and medical records sent to the PHSO. Contacted by PHSO to advise us that they intend to investigate. Further information subsequently requested by the PHSO and provided by the Trust. Awaiting PHSO’s draft report. Table 23: Complaints ongoing with the PHSO during Q1 Case Number
Complainant (patient unless stated)
On behalf of (patient)
Date complaint received by Trust [and date notified by PHSO]
Site Department Division
2870 AM PM 3/11/16 [7/3/17]
BHOC Ward D603 Specialised Services
Copy of complaint file and medical records sent to the PHSO. PHSO notified us that they plan to issue a draft report in early August 2017.

University Hospitals Bristol NHS Foundation Trust, Complaints Report Q1 2017/18 Page 28
Table 24: Complaints formally closed by the PHSO in Q1 Case Number
Complainant (patient unless stated)
On behalf of (patient)
Date complaint received by Trust [and date notified by PHSO]
Site Department Division
3604 GV PV 16/09/2016 [17/01/2017]
BRI/StMH Lower GI/Ward 78
Surgery & Women’s & Children’s
Final report received from PHSO – complaint not upheld 2095 NH MH 16/6/16
[26/10/16] BRI Lower GI Surgery
Final report received from PHSO – complaint partly upheld and the following recommendations made for the Trust to:
• Acknowledge the failings summarised in the report and apologise for the anxiety, distress and discomfort these caused; and
• Provide assurances to the patient and the Ombudsman that it will take additional remedial action to more effectively manage future patients presenting with similar symptoms to prevent unnecessary delays in their further assessment and admittance, and to ensure they are appropriately hydrated at these times in accordance with relevant guidance.
3983 AG LCY 29/9/15 [7/9/16]
BRI Trauma and Orthopaedics
Surgery
Final report received from PHSO – complaint not upheld
4841 AJ 9/11/15 [30/9/16]
BEH Outpatients Surgery
Final report received from PHSO – complaint partly upheld and the following recommendations made for the Trust to:
• Within one month of the date of the final report, write to the patient to acknowledge the communication failings identified in the report (both in the consent process and in communication with us), and apologise for the impact that these failings had on her
The PHSO’s draft report included a recommendation of financial recompense due to the Trust not being able to provide evidence that Mrs J had signed a consent form in October 2014. During subsequent conversations between the Division and the PHSO, the Division was able to provide a copy of this missing evidence. Therefore, the PHSO altered their report to withdraw the recommendation of financial recompense, but still partly upheld the complaint. The patient is currently appealing the PHSO’s decision, which she does not agree with. 18856 SC VP 22/5/15
[15/2/16] BRI Ward B501 Medicine
Final report received from PHSO – complaint not upheld