Does Adjustment Lending Work - Brigham Young … Adjustment Lending Work.pdfBrigham Young University...
29
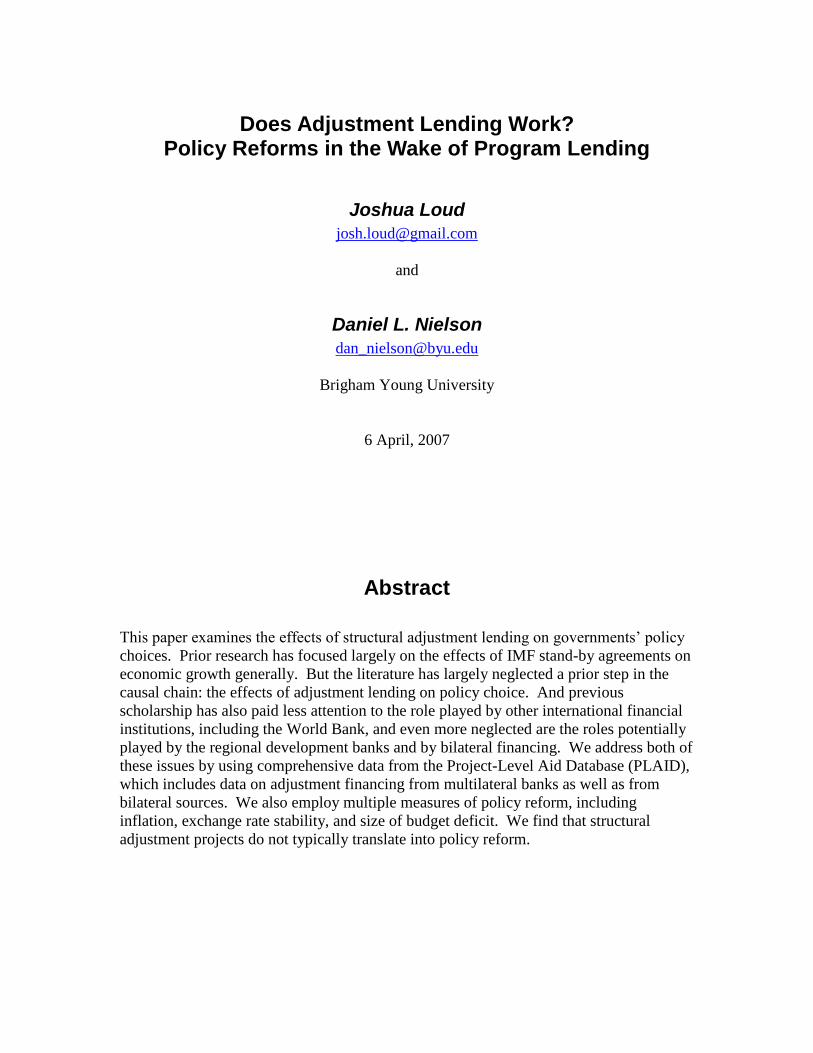
Does Adjustment Lending Work? Policy Reforms in the Wake of Program Lending Joshua Loud [email protected] and Daniel L. Nielson [email protected] Brigham Young University 6 April, 2007 Abstract This paper examines the effects of structural adjustment lending on governments’ policy choices. Prior research has focused largely on the effects of IMF stand-by agreements on economic growth generally. But the literature has largely neglected a prior step in the causal chain: the effects of adjustment lending on policy choice. And previous scholarship has also paid less attention to the role played by other international financial institutions, including the World Bank, and even more neglected are the roles potentially played by the regional development banks and by bilateral financing. We address both of these issues by using comprehensive data from the Project-Level Aid Database (PLAID), which includes data on adjustment financing from multilateral banks as well as from bilateral sources. We also employ multiple measures of policy reform, including inflation, exchange rate stability, and size of budget deficit. We find that structural adjustment projects do not typically translate into policy reform.
Transcript of Does Adjustment Lending Work - Brigham Young … Adjustment Lending Work.pdfBrigham Young University...
Does Adjustment Lending Work? Policy Reforms in the Wake of Program Lending
Joshua Loud
and
Daniel L. Nielson
Brigham Young University
6 April, 2007
Abstract
This paper examines the effects of structural adjustment lending on governments’ policy
choices. Prior research has focused largely on the effects of IMF stand-by agreements on
economic growth generally. But the literature has largely neglected a prior step in the
causal chain: the effects of adjustment lending on policy choice. And previous
scholarship has also paid less attention to the role played by other international financial
institutions, including the World Bank, and even more neglected are the roles potentially
played by the regional development banks and by bilateral financing. We address both of
these issues by using comprehensive data from the Project-Level Aid Database (PLAID),
which includes data on adjustment financing from multilateral banks as well as from
bilateral sources. We also employ multiple measures of policy reform, including
inflation, exchange rate stability, and size of budget deficit. We find that structural
adjustment projects do not typically translate into policy reform.

Introduction
Contradictory stories of structural adjustment pervade the popular press. On the one
hand, structural adjustment is feckless, where, as journalist Sebastian Mallaby writes,
recipient states have traditionally understood that adjustment loans turn as much on
geopolitical concerns and the international financial institutions’ (IFIs) need to push
money out the door to justify their existence as it does on countries’ objective need and
subsequent conformity to loan conditions. The result: “Mutually assured hypocrisy...”
(Mallaby 2004, 46). This story holds that adjustment lending fails especially because
most adjustment loans are fully disbursed regardless of whether or not the conditions are
met.
On the other hand, some critics have claimed that the International Monetary Fund
and World Bank have great power to alter government decisions. The problem: they
force feed bad medicine that makes sick economies sicker. As Nobel laureate Joseph
Stiglitz, the former chief economist at the Bank, writes of the Fund’s efforts following the
Asian Financial Crisis of the late-1990s, “All the IMF did was make East Asia's
recessions deeper, longer, and harder” (Stiglitz 2000).
Defenders of structural adjustment claim that loan conditions are necessary to ensure
the long-term economic well-being and fiscal responsibility of recipient governments.
Without the Bretton Woods institutions and their management of the international
economy, the world economy would be a much less stable place.
Unfortunately, careful and extensive social science has done little to resolve this
public debate. Some scholars have argued that aid boosts economic growth only when
accompanied by the good policies demanded by conditionality (Burnside and Dollar

2001, Noorbakhsh and Paloni 2001). Others have held that aid spurs growth regardless of
the policy environment (Hansen and Tarp 2001). Still others present compelling
evidence that adjustment lending has a negative effect on economic growth, even apart
from countries’ prior circumstances (Przeworski and Vreeland 2001).
This prior work has asked a critical question by focusing on the ultimate effects of
adjustment lending. But as the unsettled debate shows, agreement among scholars has
proven elusive. However, in connecting adjustment programs directly to economic
growth, the literature has largely talked past a prior question: Does adjustment lending
actually induce policy change? In this paper we examine the effects of structural
adjustment lending on governments’ policy choices.
Moreover, earlier studies have usually focused on one or a few international
institutions, particularly the International Monetary Fund. However, countries in need of
adjustment lending often receive loans from multiple institutions, including the IMF, the
World Bank, regional development banks, and other governments bilaterally – and the
conditional effects of the loans may be magnified if they come from more than one
source.
We employ econometric analysis using the new Project-Level Aid Database, which
provides nearly the full universe of multilateral and bilateral development aid, including
adjustment loans, from 1970 to 2000. Use of PLAID data allows us to weight each
adjustment episode by the number and identity of adjustment lenders involved, and it also
allows us to control for the size of each adjustment loan. Prior studies have often
examined countries’ receipt of structural adjustment loans or not, coded as dummy
variables – thus ignoring variance in terms of size of loans and the degree to which they

are coordinated with program lending from other multilaterals and governments. Our
PLAID dataset thus allows us to generate measures of adjustment lending that are more
complete.
Finally, prior work has explored the effects of structural adjustment loans on
economic growth or other similarly distant dependent variables. But uncovering factors
that affect GDP growth often proves elusive, and thus changes in GDP may not be
proximate enough for the effects of adjustment lending to be observed. Instead, we
examine the effects of structural adjustment loans on the more proximate dependent
variable of policy choices, including stabilization, budget deficits, trade liberalization,
and current account deficits. Thus, these more proximate dependent variables, along with
more complete data and more nuanced data for each lender, ought to more directly reflect
the effects of adjustment lending.
To test the core hypothesis that adjustment lending affects policies, we perform
pooled time series–cross-section analysis on a dataset including 80 countries from 1980
to 2000. Here, we test the effects of adjustment loans on overall levels of inflation,
budget shortfalls, and exchange rates.
The Argument
Despite advanced methods and generally shared epistemology, the literature on the
effectiveness of foreign aid, including adjustment lending, has reached quite
contradictory conclusions. On the one hand, some scholars have found that aid promotes
economic growth regardless of the degree of recipient countries’ conformity to conditions
imposed by lenders (Morrissey 2004, Hansen and Tarp 2001). Others have argued that
the effectiveness of aid is largely conditioned by governments’ providing “good policy

environments,” where policymakers heed the international financial institutions’ (IFIs)
demands for market liberalization, stabilization, and sound fiscal management (Burnside
and Dollar 2000). Still others find that IMF adjustment programs are related to lower
rates of economic growth even when adjusting for the selection bias inherent in the
countries chosen for IMF programs (Przeworski and Vreeland 2001).
We argue here that there are good theoretical reasons to side with the latter camp.
First, IFIs’ threats to discontinue lending to non-conforming countries simply are not
credible. This argument has been demonstrated formally. Because developing-country
government leaders understand that part of the motivation behind aid is poverty
alleviation, they also understand that donors will disburse future money even if recipients
fail to follow through on attached conditions. Therefore, commitment fails and
conditionality is feckless (Svensson 2000).
Relatedly, international financial institutions were created for the purpose of
engendering stability in the global economy and moving large sums of money to do so.
If IFIs do not move money, they lose their purpose. Therefore, recipient governments
understand that IFIs must lend to them even if their records on conditionality are spotted.
Commitment fails doubly.
To these well-understood reasons for the failure of conditionality, we add an
additional reason that has largely been overlooked: the recipient countries have
significant voice in the decisionmaking of the IFIs. The IMF, the World Bank, and all of
the regional development banks are governed like joint stock corporations, with member
governments as shareholders. Together, the member governments comprise a “collective
principal” that governs the agents composed of the IFIs’ staffs. In agency theory,

principals’ and agents’ never exactly coincide, but principals have information-gathering
and contracting and tools by which they can monitor and motivate agents to pursue the
principals’ welfare. Self-interested agents, of course, can hide information and their
actions from principals and can even use the authority delegated them against the
principals’ interests (see Kiewiet and McCubbins 1990; Hawkins et al. 2006).
International organization adds a twist to agency theory: the principal is not a single
individual but a corporate entity comprised of many members (Nielson and Tierney 2003;
Lyne et al. 2006). In order for a collective principal to contract and re-contract with an
agent, a critical mass (often a majority) of members must coalesce into a bloc that is
empowered to act for the whole. In the case of the IFIs, a majority vote of the
shareholders is required to approve all programs and projects and otherwise give
marching orders to the IFI staffs.
While voting shares at some IFIs are dominated by developed countries, developing
countries – most of them loan recipients – have significant shares as well. At the World
Bank and the European Bank for Reconstruction and Development these developing-
country shares total nearly fifty percent of all shares. At the IMF, voting rules weight
developing countries even more. And at the regional development banks – such as the
Asian, Inter-American, and African Development Banks – developing countries often
hold strong majority shares. Evidence suggests that the combined voting weights of the
developing world have made critical differences in the recent changes in emphases at the
development banks, particularly in causing the large increases in social lending for
health, education and safety nets (see Lyne, Nielson and Tierney 2006).

Applied to adjustment lending, the strong voting weights – and potential for collusive
coalition-building – of recipient countries likely means that commitments to enforce
conditionality are not credible because of a systemic conflict of interest. The very
countries subject to the threats to cut off financing are themselves non-trivial members of
the collective principals that govern the IFIs and ostensibly enforce the commitments. As
game theory emphasizes, promises to self enforce are usually cheap talk. This additional
rationale for the toothlessness of conditionality only underscores Mallaby’s conclusion
that conditionality is merely “mutually assured hypocrisy…” (Mallaby 2004, 46). Thus,
as a central hypothesis, we do not expect that receipt of adjustment loans will make a
significant difference in governments’ subsequent policy choices.
Methods and Results
We obtained our data from the PLAID database, a collaboration between the
College of William and Mary and Brigham Young University that seeks to compile all
development finance statistics, both bilateral and multilateral, during the period 1970 to
2003 (PLAID, 2006). We extracted all structural adjustment loans during the period
1973-2000 from six multilateral aid agencies (the African Development Bank, the Asian
Development Bank, the Inter-American Development Bank, the European Union, the
World Bank, and the United Nations Development Programme) and five of their bilateral
counterparts (the United States, France, the United Kingdom, Germany, and Japan.) We
obtained data from the International Monetary Fund from their website (IMF, 2006).
Using these project-level data, we obtained the total value of structural adjustment loans
each recipient nation received from all donors in each year (in 2000 US dollars), as well

as the total from each individual multilateral or bilateral institution. Additionally, we
obtained the total number of projects each nation received during the period, as well as
the total number from each of the respective institutions.
We obtained our controls from the Development Research Institute at New York
University, which compiles data from the World Bank’s World Development Indicators
and Global Development Finance databases (World Bank, 2006).
We include three different measures of structural adjustment loans. For the first,
we include only those loans that are specifically tagged as structural adjustment projects
by the donor institutions. For the second, we include the first measure and add balance of
payments and budget support projects. The third measure includes the first two and adds
import support. We use these three measures because all of these projects are given to
countries in economic crises, but the policy conditions between the three are not clear.
The first measure is the most stringent and will be referred to throughout the text, but all
analyses were performed using each of the three measures. Using the different measures
did not yield significantly different results, which are therefore not reported.
Table A
Number of
Projects
0 1-5 6-10 11-15 16-20
Number of Countries
69 37 30 20 14
Number of
Projects
21-25 26-35 36-50 51-75 >75
Number of
Countries
8 9 6 11 0

Table A gives a sense of the distribution of the data. Sixty-nine countries received no
structural adjustment packages between 1973 and 2000, whereas eleven received between
fifty and seventy-five. Roughly half of the countries in the study received five loans or
fewer. (To see the distributions for the second and third measure of structural
adjustment, please refer to table C and D, respectively, in the appendix.)
Table B
stats log inflation log ex rate deficit SA total proj count
min -4.190631 -29.95381 -1501028 -2172505 0
mean 2.23425 1.024082 -2833.476 1.30E+07 0.4935007
median 2.216281 0.9932518 -3.017171 0 0
max 10.07631 14.22578 292642.2 4.27E+09 11
sd 1.351494 4.595118 58972.54 9.13E+07 1.254922
AFDB_1 ASDB_1 EU_1 IADB_1 IMF_1
min 0 0 -1.20E+07 0 0
mean 285600.6 0 1054956 0 118301.5
median 0 0 0 0 0
max 9.71E+07 0 1.11E+08 0 4.29E+07
sd 3474607 0 6594340 0 1366441
UNDP_1 WB France_1
min -402309.7 0 0
mean -88.72272 8268376 854753.7
median 0 0 0
max 4773.38 4.27E+09 3.18E+08
sd 6023.257 8.71E+07 9957869
Table B gives the summary statistics for the relevant data.
As a first cut in looking at basic relationships in the data, we opted for a set of pooled
time-series–cross-sectional regressions assessing the effects of adjustment loans on
overall levels of three policy variables: inflation, budget deficits, and exchange rate
stability. As an initial approach to this question, we begin by using prais-winsten
regressions to test whether structural adjustment projects have a significant effect on our

three policy variables. All policy variables are differences to allow the model to address
changes in policy rather than static levels. All analyses are performed according to the
following hypothesize relationships:
policyit Xit SA_dollarsit SA_ project _ countit recipienti it
policyit Xit SA_dollarsijt SA_ project _ countijt recipienti it
policyit Xit SAijt recipienti it
where i indicates recipient, t represents year, j represents donor, X represents a
matrix of covariates, recipienti indicates a vector of dummy variables for each recipient i,
and SA represents a vector of dummy variables for each recipient donor pair, indicating
whether or not country i received a structural adjustment project from donor j in year t.
Using Prais-Winsten regressions with panel-corrected standard errors and an AR1
correction, we attempted to determine whether the amount of structural adjustment
dollars, the number of structural adjustment loans, or the mere presence of a structural
adjustment project cause nations to alter their economic policy (Prais and Winsten,1954;
Beck and Katz 1995). We selected the Prais-Winsten model to control for possible
autocorrelation across time. We lagged each of our key independent variables one period
to test for possible implementation lags. As controls, we include the exchange rate
(except where exchange rate stability is the dependent variable), population growth, GDP
(measured in US dollars), GDP growth, and external debt, in addition to recipient fixed
effect dummies to control for unit effects.
We began by using ∆inflation as our dependent variable. Our results indicate that
only bilateral projects from Japan seem to have an impact on inflation, with a one million
dollar adjustment project corresponding to a 4.89 decrease in the rate of inflation (i.e.
inflation would slow down by 4.89%. Note this does not indicate a reversal, merely a
slowing.) Neither the size of total adjustment funds nor the total number of projects are
significant. It is important to note that the signs are in the expected direction, but that the
standard errors indicate that there is no conclusive evidence that structural adjustment
projects have any impact on inflation in recipient nations (See table E in the appendix.)
When examining exchange rate stability, it appears that structural adjustment
projects do not have a statistically significant effect, regardless of donor, size of loan, or
number of loans (see table F in the appendix).
Our third dependent variable is the change in budget deficits. These results indicate
that structural adjustment projects, do, in fact, decrease the change in budget deficits.
Projects from the EU, IMF, World Bank, and UK all have an impact on deficits. In each
case, the signs on the coefficients for dollars and the coefficients for the number of
projects are in the opposite direction, indicating an offsetting effect. In total, however,
these effects are negative. These final results serve as a good control for our theory.
Budget deficits are the most proximate of our three variables and would most likely be
directly affected by structural adjustment projects. In some ways, the very act of
receiving a project should directly impact the deficit. The fact that deficits are affected
by adjustment projects while neither inflation nor exchange rates are indicates that
recipients, may, in fact, be opting to avoid policy changes in those areas they have direct
control over.
Conclusion
We began with the hypothesis that we expected little effect of structural adjustment
programs on subsequent government policy. The reported results suggest a good deal of
supportive evidence for this argument.
Changes in the overall levels of policy indicators pose only the easiest test for the
effects of structural adjustment, however. This paper has examined only whether
structural adjustment projects have dampened economic crises, let alone reversed them.
Given that limited evidence exists that adjustment loans subsequently induce the
expected policy changes, it is likely that when we raise the threshold for policy reform
that the effects will diminish even further. A promising avenue would be to perform
hazard analysis of the effects of adjustment packages on the rate at which governments
hit specified targets for policies, such as designated levels of inflation, budget deficits,
and exchange rate stability.
Overall, adding a much larger portion of the universe of adjustment lending and
testing the more proximate effects of that lending on policy variables seem promising
directions. If the results here are borne out with additional methods and testing, it should
help policymakers considering the reform of conditionality practices and discretional
financing to focus on more effective methods of promoting the well being of citizens in
member countries.

References
Beck, Nathaniel, and Jonathan N. Katz. 1995. What To Do (and Not To Do) with Times-
Series Cross-Section Data.” American Political Science Review 89: 634-647.
Burnside, C. and D. Dollar. 2000. Aid, policies, and growth. American Economic Review
90, 4: 847-68.
Hansen, Henrik and Finn Tarp. 2001. Aid and growth regressions. Journal of
Development Economics. 64, 2: 547-70.
International Monetary Fund. 2006. IMF Lending Arrangements. At < http://www.imf.
org/external/np/tre/tad/extarr1.cfm.>. Accessed 14 August 2006
Kiewiet, D. Roderick, and Mathew D. McCubbins. 1991. The Logic of Delegation:
Congressional Parties and the Appropriations Process. Chicago: University
of Chicago Press.
Lyne, Mona, Daniel L. Nielson, and Michael J. Tierney. 2006. Who delegates?
Alternative models of principals in development aid. In Darren Hawkins, David Lake,
Daniel Nielson, and Michael Tierney, editors. Delegation and Agency in
International Organizations. New York: Cambridge University Press.
Mallaby, Sebastian. 2004. The world’s banker. New York: Penguin Press.
Morrissey, Oliver. 2004. Conditionality and aid effectiveness re-evaluated. World
Economy. 27, 2 : 153-171.
Noorbakhsh, F. and A. Paloni. 2001. Structural adjustment and growth on Sub-Saharan
Africa: The importance of complying with conditionality. Economic Development
and Cultural Change 49, 3: 479-509.
Nielson, Daniel L., and Michael J. Tierney. 2003. Delegation to international
organizations: Agency theory and World Bank environmental reform. International
Organization 57: 241-276.
PLAID. 2006. At <www.wm.edu/plaid>
Prais, S. J., and C. B. Winsten. 1954. Trend Estimators and Serial Correlation. Cowles
Foundation, Discussion Paper 383, Chicago.
Przeworski, Adam and James R. Vreeland. 2000. The effect of IMF programs on
economic growth. Journal of Development Economics. 62: 385-421.
Stiglitz, Joseph. 2000. What I learned at the world economic crisis. New Republic.

Svensson, Jakob. 2000. When is foreign aid policy credible? Aid dependence and
conditionality. Journal of Development Economics. 61: 61-84.
World Bank. 2006. World Development Indicators. At <http://devdata.worldbank.org
/dataonline/>
----- ------ .2006. Global Development Finance. At < http://devdata.worldbank.org/
apponline/default.asp?app=gf
Appendix
Table C
Table D
Number of
Projects
0 1-5 6-10 11-15 16-20
Number of
Countries
45 34 33 13 16
Number of
Projects
21-25 26-35 36-50 51-75 >75
Number of
Countries
12 16 9 13 13
Number of
Projects
0 1-5 6-10 11-15 16-20
Number of
Countries
34 31 31 14 6
Number of
Projects
21-25 26-35 36-50 51-75 >75
Number of
Countries
15 15 13 18 27

Table E
Inflation
(1) (2) (3)
Variable ∆inflation ∆inflation ∆inflation
Totals Totals by Donor
Donor dummies
SA dollars -0.000000227
(0.00000018)
# of Projects -10.16
(14.0)
SA dollars -1.75e-09
(lagged 1 period) (0.00000018)
# of Projects -0.363
(lagged 1 period) (15.4)
AFDB dollars 0.000000308
(in millions of dollars)
(0.0000019)
ASDB dollars 0
(in millions of dollars)
(0)
EU dollars -0.000000651
(in millions of dollars)
(0.0000019)
IADB dollars 0
(in millions of dollars)
(0)
IMF dollars 0.00000665
(in millions of dollars)
(0.000012)
UNDP dollars -0.0104
(in millions of dollars)
(0.077)
WB dollars 0.0000000290
(in millions of dollars)
(0.00000041)
France dollars 0.000000155
(in millions of dollars)
(0.00000036)
Germany dollars -0.0000000291
(in millions of dollars)
(0.0000094)
Japan dollars -0.00000489***
(in millions of dollars)
(0.0000011)
UK dollars 0.00000104
(in millions of dollars)
(0.0000011)

US dollars -0.00000335
(in millions of dollars)
(0.0000030)
AFDB count -14.26
(87.1)
ASDB count 0
(0)
EU count 13.70
(13.1)
IADB count 0
(0)
IMF count -104.8
(63.9)
UNDP count -41.29
(378)
WB count -6.682
(79.5)
France count 9.958
(28.7)
Germany count -46.65
(159)
Japan count 48.88
(102)
UK count -22.24
(65.6)
US count 190.2
(478)
IMF*WB -0
(0)
IMF count*WB count
33.52
(96.6)
AFDB dollars 0.000000864
(lagged 1 period) (0.0000018)
ASDB dollars 0
(lagged 1 period) (0)
EU dollars -0.000000491
(lagged 1 period) (0.0000021)
IADB dollars 0
(lagged 1 period) (0)

IMF dollars 0.000000199
(lagged 1 period) (0.000014)
UNDP dollars -0.000565
(lagged 1 period) (0.00057)
WB dollars -0.0000000323
(lagged 1 period) (0.00000019)
France dollars -0.000000408
(lagged 1 period) (0.00000039)
Germany dollars 0.000000982
(lagged 1 period) (0.0000099)
Japan dollars 0.000000194
(lagged 1 period) (0.0000017)
UK dollars 0.00000295
(lagged 1 period) (0.0000044)
US dollars 0.000000641
(lagged 1 period) (0.0000015)
AFDB count -33.00
(lagged 1 period) (93.6)
ASDB count 0
(lagged 1 period) (0)
EU count 6.719
(lagged 1 period) (11.4)
IADB count 0
(lagged 1 period) (0)
IMF count -16.45
(lagged 1 period) (59.9)
UNDP count -69.34
(lagged 1 period) (106)
WB count 17.57
(lagged 1 period) (77.2)
France count 10.84
(lagged 1 period) (35.2)
Germany count -31.69
(lagged 1 period) (181)
Japan count -19.41
(lagged 1 period) (102)
UK count -76.97
(lagged 1 period) (95.3)
US count -28.52

(lagged 1 period) (402)
IMF -66.23
(66.1)
EU 26.84
(48.0)
AFDB -3.449
(54.1)
IADB 0
(0)
UNDP -33.89
(115)
WorldBank 17.22
(101)
France 17.18
(42.8)
Germany -68.77
(186)
Japan -89.18
(108)
UK -51.52
(105)
US 34.94
(442)
Bretton_Woods 49.95
(209)
L.IMF -5.822
(lagged 1 period) (63.7)
L.EU 11.98
(lagged 1 period) (60.3)
L.AFDB -8.564
(lagged 1 period) (61.7)
L.IADB 0
(lagged 1 period) (0)
L.UNDP -14.69
(lagged 1 period) (69.8)
L.WorldBank 20.20
(lagged 1 period) (103)
L.France -0.873
(lagged 1 period) (52.0)

L.Germany 12.04
(lagged 1 period) (200)
L.Japan -15.01
(lagged 1 period) (108)
L.UK -58.64
(lagged 1 period) (120)
L.US 12.93
(lagged 1 period) (416)
Exchange Rate -0.0000199 -0.00000752 -0.0000138
-0.000036 -0.000046 -0.000035
Population Growth -12.22 -13.56 -14.12
-27.3 -27.7 -27.7
GDP Growth -7.456* -7.838* -7.566*
-4.09 -4.11 -4.13
GDP 1.2E-10 1.19E-10 1.11E-10
-1.76E-10 -1.69E-10 -1.77E-10
External Debt -3.09E-10 -5.08E-11 -2.97E-10
-9.14E-10 -1.06E-09 -9.5E-10
Constant -3.961 -5.422 -8.553
(51.1) (81.0) (95.7)
Observations 2126 2126 2126
Number of countryid
120 120 120
R-squared 0.00 0.02 0.01
Standard errors in parentheses
*** p<0.01, ** p<0.05, * p<0.1
Fixed effects not reported
Table F
Exchange Rate Stability
(1) (2) (3)
Variable ∆Exchange Rate
∆Exchange Rate
∆Exchange Rate
Totals Totals by Donor
Donor dummies
SA dollars 0.00000208

(0.000043)
# of Projects -115.2
(684)
SA dollars 0.0000619
(lagged 1 period) (0.000046)
# of Projects -644.8
(lagged 1 period) (664)
AFDB dollars -0.0000721
(in millions of dollars)
(0.00011)
ASDB dollars 0
(in millions of dollars)
(0)
EU dollars -0.0000188
(in millions of dollars)
(0.000090)
IADB dollars 0
(in millions of dollars)
(0)
IMF dollars 0.000255
(in millions of dollars)
(0.0052)
UNDP dollars -4.303
(in millions of dollars)
(34.0)
WB dollars -0.00000933
(in millions of dollars)
(0.00015)
France dollars -0.0000201
(in millions of dollars)
(0.000023)
Germany dollars -0.000163
(in millions of dollars)
(0.00025)
Japan dollars 0.00000427
(in millions of dollars)
(0.000018)
UK dollars 0.000186
(in millions of dollars)
(0.00055)
US dollars -0.0000338
(in millions of dollars)
(0.000057)
AFDB count 488.7
(2123)
ASDB count 0
(0)
EU count -93.97

(499)
IADB count 0
(0)
IMF count 414.8
(3989)
UNDP count 20057
(163357)
WB count 684.1
(8448)
France count 131.2
(973)
Germany count -1459
(3430)
Japan count 277.7
(1546)
UK count -1483
(1427)
US count -211.9
(2694)
IMF*WB 0
(0)
IMF count*WB count
-405.4
(2681)
AFDB dollars -0.0000746
(lagged 1 period) (0.00023)
ASDB dollars 0
(lagged 1 period) (0)
EU dollars 0.0000113
(lagged 1 period) (0.000037)
IADB dollars 0
(lagged 1 period) (0)
IMF dollars -0.00105
(lagged 1 period) (0.0063)
UNDP dollars -0.0368
(lagged 1 period) (0.17)
WB dollars 0.0000709
(lagged 1 period) (0.000046)
France dollars 0.0000187
(lagged 1 period) (0.000022)

Germany dollars 0.00000388
(lagged 1 period) (0.00029)
Japan dollars 0.00000377
(lagged 1 period) (0.000046)
UK dollars -0.000304
(lagged 1 period) (0.0024)
US dollars 0.0000105
(lagged 1 period) (0.000082)
AFDB count 522.2
(lagged 1 period) (5518)
ASDB count 0
(lagged 1 period) (0)
EU count -235.0
(lagged 1 period) (581)
IADB count 0
(lagged 1 period) (0)
IMF count 4498
(lagged 1 period) (4052)
UNDP count -3747
(lagged 1 period) (23364)
WB count -2925
(lagged 1 period) (2038)
France count -700.8
(lagged 1 period) (1217)
Germany count -559.8
(lagged 1 period) (4804)
Japan count 244.0
(lagged 1 period) (2452)
UK count 2033
(lagged 1 period) (18105)
US count -990.5
(lagged 1 period) (2868)
IMF -356.6
(4509)
EU 53.74
(1018)
AFDB -2226
(4354)
IADB 0

(0)
UNDP 1890
(7943)
WorldBank -612.4
(13093)
France -912.5
(1840)
Germany -3011
(3454)
Japan -807.9
(1748)
UK 3533
(12883)
US -1715
(2407)
Bretton_Woods 852.4
(17846)
L.IMF 5133
(lagged 1 period) (4582)
L.EU -477.2
(lagged 1 period) (812)
L.AFDB -3338
(lagged 1 period) (3056)
L.IADB 0
(lagged 1 period) (0)
L.UNDP 2184
(lagged 1 period) (5493)
L.WorldBank 12026
(lagged 1 period) (9896)
L.France -2796
(lagged 1 period) (2134)
L.Germany -1787
(lagged 1 period) (3778)
L.Japan -249.4
(lagged 1 period) (1729)
L.UK -3806
(lagged 1 period) (14142)
L.US -217.7
(lagged 1 period) (1589)

Population Growth 104.3 60.80 -36.20
(738) (659) (699)
GDP Growth -109.0 -96.31 -102.3
(267) (245) (239)
GDP 0.0000000866** 0.0000000819* 0.0000000696**
(0.000000037) (0.000000045) (0.000000034)
External Debt -0.000000129 -0.000000138 -0.000000103
(0.00000035) (0.00000031) (0.00000027)
Constant 1277 1158 1255
(3178) (2880) (2856)
Observations 2185 2185 2185
Number of countryid
109 109 109
R-squared 0.01 0.01 0.01
Standard errors in parentheses
*** p<0.01, ** p<0.05, * p<0.1
Fixed effects not reported
Table G
Budget Deficits
(1) (2) (3)
Variable ∆Deficit/Surplus ∆Deficit/Surplus ∆Deficit/Surplus
Totals Totals by Donor Donor dummies
LD.ovrall_def_surp -0.185 -0.114 -0.0956
(0.22) (0.21) (0.22)
SA dollars -0.00000710
(0.0000052)
# of Projects 3674
(2447)
# of Projects -5968**
(lagged 1 period) (2496)
AFDB dollars 0.000849

(in millions of dollars)
(0.00089)
ASDB dollars 0
(in millions of dollars)
(0)
EU dollars 0.00122**
(in millions of dollars)
(0.00054)
IADB dollars 0
(in millions of dollars)
(0)
IMF dollars -0.00169**
(in millions of dollars)
(0.00075)
UNDP dollars -1.194
(in millions of dollars)
(3.27)
WB dollars -0.0000783*
(in millions of dollars)
(0.000042)
France dollars -0.000122
(in millions of dollars)
(0.00018)
Germany dollars -0.000253
(in millions of dollars)
(0.0012)
Japan dollars 0.00000997
(in millions of dollars)
(0.000051)
UK dollars 0.00221**
(in millions of dollars)
(0.00098)
US dollars -0.000142
(in millions of dollars)
(0.00034)
AFDB count -1754
(33044)
ASDB count 0
(0)
EU count -7982***
(2940)
IADB count 0
(0)
IMF count 20009***
(7529)
UNDP count 0
(0)
WB count 20186**

(10088)
France count 7356
(10597)
Germany count 22566
(43478)
Japan count 2644
(13070)
UK count -30626**
(12188)
US count 4098
(40142)
IMF*WB 0
(0)
IMF count*WB count
-20049
(15115)
AFDB dollars -0.000771
(lagged 1 period) (0.00081)
ASDB dollars 0
(lagged 1 period) (0)
EU dollars -0.00113*
(lagged 1 period) (0.00062)
IADB dollars 0
(lagged 1 period) (0)
IMF dollars 0.00132*
(lagged 1 period) (0.00070)
UNDP dollars 3.362
(lagged 1 period) (3.08)
WB dollars 0.000166**
(lagged 1 period) (0.000065)
France dollars 0.000467**
(lagged 1 period) (0.00021)
Germany dollars -0.00124
(lagged 1 period) (0.00091)
Japan dollars -0.0000716
(lagged 1 period) (0.00011)
UK dollars 0.000395
(lagged 1 period) (0.00082)
US dollars 0.000146
(lagged 1 period) (0.00045)

AFDB count 48597*
(lagged 1 period) (25700)
ASDB count 0
(lagged 1 period) (0)
EU count 5200**
(lagged 1 period) (2549)
IADB count 0
(lagged 1 period) (0)
IMF count -11609*
(lagged 1 period) (6192)
UNDP count 0
(lagged 1 period) (0)
WB count -44097**
(lagged 1 period) (18855)
France count -14311
(lagged 1 period) (10195)
Germany count 20768
(lagged 1 period) (22333)
Japan count 6502
(lagged 1 period) (22799)
UK count 2272
(lagged 1 period) (10520)
US count -12909
(lagged 1 period) (29984)
IMF 13595*
(7883)
EU 30560**
(14408)
AFDB -8356
(10376)
IADB 0
(0)
UNDP 14445
(11468)
WorldBank 11210**
(5404)
France -8284
(6884)
Germany 1951

(18399)
Japan 1454
(14908)
UK 3349
(4635)
US 2999
(46485)
Bretton_Woods -3920
(18055)
L.IMF -7866
(lagged 1 period) (5905)
L.EU -33532**
(lagged 1 period) (17004)
L.AFDB 19732**
(lagged 1 period) (9364)
L.IADB 0
(lagged 1 period) (0)
L.UNDP -6735
(lagged 1 period) (8793)
L.WorldBank -22131**
(lagged 1 period) (9516)
L.France 14685*
(lagged 1 period) (8469)
L.Germany 8284
(lagged 1 period) (12577)
L.Japan -3051
(lagged 1 period) (20663)
L.UK -3852
(lagged 1 period) (5274)
L.US -28765
(lagged 1 period) (45430)
Exchange Rate -0.000821 0.00185 0.000873
-0.0016 -0.0038 -0.0028
Population Growth -5593 -3370 -4280
-3450 -3747 -3864
GDP Growth 458.9 540.9 570.8
-389 -380 -399
GDP -2.21E-10 -4.79E-10 1.51E-10
-3.91E-09 -0.000000008 -5.32E-09

External Debt -6.25E-08 -6.31E-08 -8.14E-08
-0.000000044 -0.000000052 -0.000000053
Constant -8336 -7200 -8172
(5462) (5797) (5970)
Observations 960 960 960
Number of countryid
77 77 77
R-squared 0.10 0.14 0.11
Standard errors in parentheses
*** p<0.01, ** p<0.05, * p<0.1
Fixed effects not reported