
Documentation of Atmospheric Conditions During Observed ...€¦ · NASA Contractor Report 4767...
42
NASA Contractor Report 4767 Documentation of Atmospheric Conditions During Observed Rising Aircraft Wakes j. Allen Zak ViGYAN, Inc. • Hampton, Virginia William G. Rodgers, Jr. Lockheed Martin Engineering and Sciences • Hampton, Virginia Prepared for Langley Research Center under Contract NAS1-96014 April 1997 https://ntrs.nasa.gov/search.jsp?R=19970018786 2020-05-02T20:57:53+00:00Z
Transcript of Documentation of Atmospheric Conditions During Observed ...€¦ · NASA Contractor Report 4767...

NASA Contractor Report 4767
Documentation of Atmospheric ConditionsDuring Observed Rising Aircraft Wakes
j. Allen Zak
ViGYAN, Inc. • Hampton, Virginia
William G. Rodgers, Jr.
Lockheed Martin Engineering and Sciences • Hampton, Virginia
Prepared for Langley Research Centerunder Contract NAS1-96014
April 1997
https://ntrs.nasa.gov/search.jsp?R=19970018786 2020-05-02T20:57:53+00:00Z

Available electronically at the following URL address:
Printed copies available from the following:
NASA Center for AeroSpace Information
800 Elkridge Landing Road
Linthicum Heights, MD 21090-2934
(301) 621-0390
http://techreports.larc.nasa.gov/ltrs/ltrs.html
National Technical Information Service (NTIS)
5285 Port Royal Road
Springfield, VA 22161-2171
(703) 487-4650
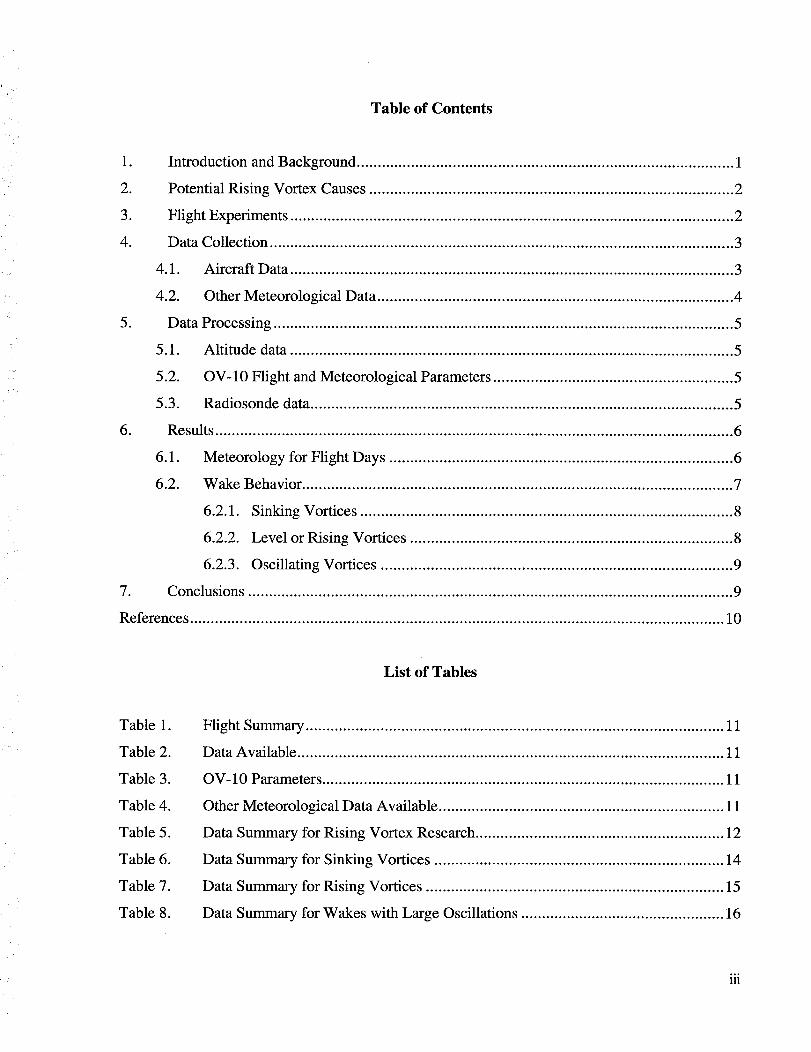
Table of Contents
1. Introduction and Background ........................................................................................... 1
2. Potential Rising Vortex Causes ........................................................................................ 2
3. Flight Experiments ........................................................................................................... 2
4. Data Collection ................................................................................................................ 3
4.1. Aircraft Data ........................................................................................................... 3
4.2. Other Meteorological Data ...................................................................................... 4
5. Data Processing ............................................................................................................... 5
5.1. Altitude data ........................................................................................................... 5
5.2. OV-10 Flight and Meteorological Parameters .......................................................... 5
5.3. Radiosonde data ...................................................................................................... 5
6. Results ............................................................................................................................. 6
6.1. Meteorology for Flight Days ................................................................................... 6
6.2. Wake Behavior ........................................................................................................ 7
6.2.1. Sinking Vortices .......................................................................................... 8
6.2.2. Level or Rising Vortices .............................................................................. 8
6.2.3. Oscillating Vortices ..................................................................................... 9
7. Conclusions ..................................................................................................................... 9
References ................................................................................................................................. 10
List of Tables
Table 1.
Table 2.
Table 3.
Table 4.
Table 5.
Table 6.
Table 7.
Table 8.
Flight Summary ..................................................................................................... 11
Data Available ....................................................................................................... 11
OV-10 Parameters ................................................................................................. 11
Other Meteorological Data Available ..................................................................... 11
Data Summary for Rising Vortex Research ............................................................ 12
Data Summary for Sinking Vortices ...................................................................... 14
Data Summary for Rising Vortices ........................................................................ 15
Data Summary for Wakes with Large Oscillations ................................................. 16
iii

Figure 1.Figure2.
Figure3.Figure4a.Figure4b.
Figure4c.Figure5.Figure6a.
Figure6b.Figure6c.Figure6d.
Figure6e.Figure7a.Figure7b.
Figure7c.Figure8a.Figure8b.
Figure8c.Figure9a.Figure9b.Figure9c.
Figure 10a.Figure 10b.Figure 10c.
Figure 11.Figure 12.Figure 13.
Figure 14.Figure 15.Figure 16.Figure 17.
List of Figures
WakeVortexFlowField.......................................................................................17WakeVortex DescentRates.................................................................................17
Video Frameof OV-10Drifting BehindtheC130.................................................18Video Frameof OV-10Levelwith theStarboardVortex......................................18
Video Frameof OV-10PenetratingStarboardVortex...........................................18Video Frameof OV-10BelowthePortVortex.....................................................18
OV-10ExperimentalConfiguration.......................................................................19SurfaceWeatherMap for October19,1995,1200GMT.......................................20
850HectopascalWeatherMap for October19,1995,1200..................................20Balloon Soundingfor October19,1995,1400GMT.............................................20Balloon Soundingfor October19,1995,1750GMT.............................................21Balloon Soundingfor October19,1995,2046GMT.............................................21
SurfaceWeatherMap for October26, 1995,1200GMT.......................................22850HectopascalWeatherMap for October26, 1995,1200..................................22Balloon Soundingfor October26,1995,1131GMT.............................................22
SurfaceWeatherMap for November6, 1995,1200GMT .....................................23850HectopascalWeatherMap for November6, 1995,1200.................................23Balloon Soundingfor November6, 1995,1730GMT ...........................................23
SurfaceWeatherMap for November8, 1995,1200GMT .....................................24850HectopascalWeatherMapfor November8, 1995,1200.................................24Balloon Soundingfor November8, 1995,1600GMT ...........................................24SurfaceWeatherMap for November9, 1995,1200GMT.....................................25
850HectopascalWeatherMapfor November9,1995,1200.................................25BalloonSoundingfor November9, 1995,1843GMT...........................................25
C130andOV-10GPSAltitude for Flight551at RunTimesShown......................26C130andOV-10GPSAltitude for Flight 552at RunTimesShown.....................27C130andOV-10GPSAltitude for Flight 553atRunTimesShown......................29
C130andOV-10GPSAltitude for Flight555atRunTimesShown......................30C130andOV-10GPSAltitude for Flight 556atRunTimesShown......................31C130andOV-10GPSAltitude for Flight 557atRunTimesShown......................33
VideoFramesFromDifferentTimesof theC130WakeVortex SmokeSignature.34
iv

Appendices
Appendix A - Balloon Sounding Data For Wake Decay Flight Days
Because of the extensive data contained in this appendix, it has not been included
in the printed copy of this report but is available from the Langley Technical
Report Server (LTRS). Open the files with the following Uniform Resource
Locator (URL):
ftp ://techreports.larc.nasa.gov /pub/techreports/larc/1997 /cr/N AS A-97-
cr4767appA.txt
Appendix B - Altitude Comparison Data
Because of the extensive data contained in this appendix, it has not been included
in the printed copy of this report but is available from the Langley Technical
Report Server (LTRS). Open the files with the following Uniform Resource
Locator (URL):
ftp://techreports.larc .nasa.gov/pub/techreports/larc/1997/cr/NASA-97-
cr4767appB.txt
V

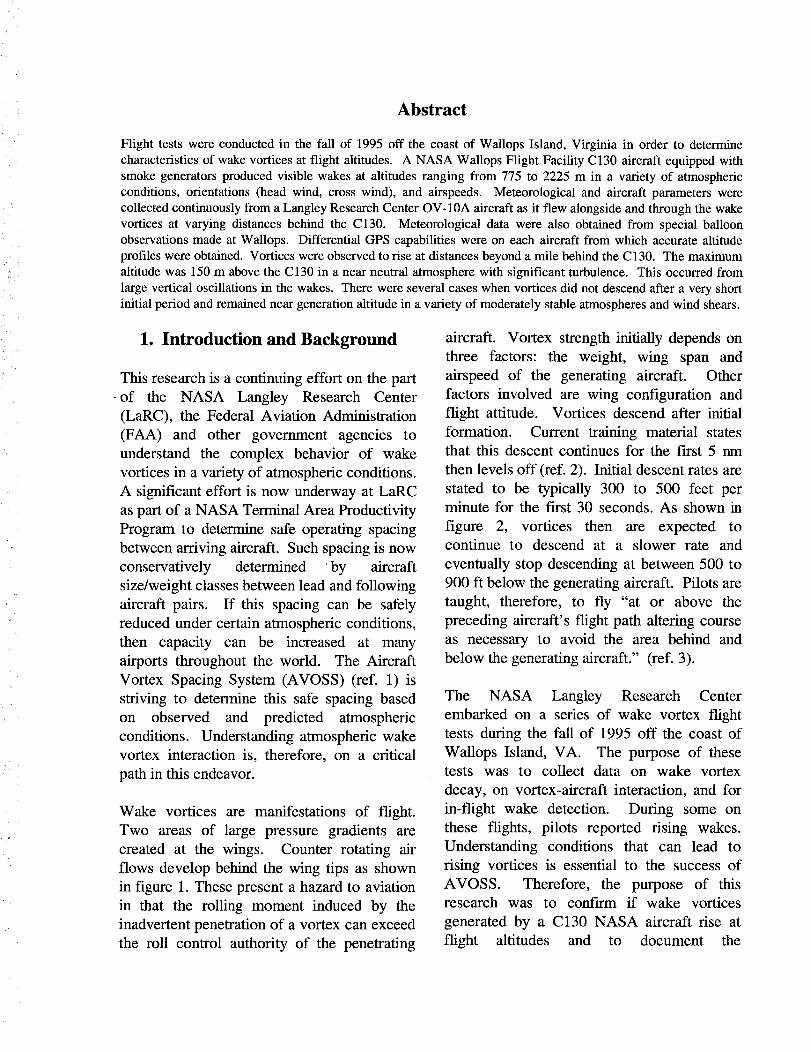
Abstract
Flight tests were conducted in the fall of 1995 off the coast of Wallops Island, Virginia in order to determinecharacteristics of wake vortices at flight altitudes. A NASA Wallops Flight Facility C130 aircraft equipped withsmoke generators produced visible wakes at altitudes ranging from 775 to 2225 m in a variety of atmosphericconditions, orientations (head wind, cross wind), and airspeeds. Meteorological and aircraft parameters werecollected continuously from a Langley Research Center OV-10A aircraft as it flew alongside and through the wakevortices at varying distances behind the C130. Meteorological data were also obtained from special balloonobservations made at Wallops. Differential GPS capabilities were on each aircraft from which accurate altitudeprofiles were obtained. Vortices were observed to rise at distances beyond a mile behind the C130. The maximumaltitude was 150 m above the C130 in a near neutral atmosphere with significant turbulence. This occurred fromlarge vertical oscillations in the wakes. There were several cases when vortices did not descend after a very shortinitial period and remained near generation altitude in a variety of moderately stable atmospheres and wind shears.
1. Introduction and Background
This research is a continuing effort on the part
-of the NASA Langley Research Center
(LaRC), the Federal Aviation Administration
(FAA) and other government agencies to
understand the complex behavior of wake
vortices in a variety of atmospheric conditions.
A significant effort is now underway at LaRC
as part of a NASA Terminal Area Productivity
Program to determine safe operating spacing
between arriving aircraft. Such spacing is now
conservatively determined _by aircraft
size/weight classes between lead and following
aircraft pairs. If this spacing can be safely
reduced under certain atmospheric conditions,
then capacity can be increased at many
airports throughout the world. The Aircraft
Vortex Spacing System (AVOSS) (ref. 1) is
striving to determine this safe spacing based
on observed and predicted atmospheric
conditions. Understanding atmospheric wake
vortex interaction is, therefore, on a critical
path in this endeavor.
Wake vortices are manifestations of flight.
Two areas of large pressure gradients are
created at the wings. Counter rotating air
flows develop behind the wing tips as shown
in figure 1. These present a hazard to aviation
in that the rolling moment induced by the
inadvertent penetration of a vortex can exceed
the roll control authority of the penetrating
aircraft. Vortex strength initially depends on
three factors: the weight, wing span and
airspeed of the generating aircraft. Other
factors involved are wing configuration and
flight attitude. Vortices descend after initial
formation. Current training material statesthat this descent continues for the first 5 nm
then levels off (ref. 2). Initial descent rates are
stated to be typically 300 to 500 feet perminute for the first 30 seconds. As shown in
figure 2, vortices then are expected tocontinue to descend at a slower rate and
eventually stop descending at between 500 to
900 ft below the generating aircraft. Pilots are
taught, therefore, to fly "at or above the
preceding aircraft's flight path altering course
as necessary to avoid the area behind and
below the generating aircraft." (ref. 3).
The NASA Langley Research Center
embarked on a series of wake vortex flight
tests during the fall of 1995 off the coast of
Wallops Island, VA. The purpose of thesetests was to collect data on wake vortex
decay, on vortex-aircraft interaction, and for
in-flight wake detection. During some on
these flights, pilots reported rising wakes.
Understanding conditions that can lead to
rising vortices is essential to the success of
AVOSS. Therefore, the purpose of thisresearch was to confirm if wake vortices
generated by a C130 NASA aircraft rise at
flight altitudes and to document the

meteorology associated with theseoccurrences. Other characteristics of the
vortices such as strength and decay will becandidates for future research.
The atmosphere plays a significant role in the
movement and decay as well as in the general
behavior of the vortex pair following initialdescent. This research documents some of
these atmospheric effects and identifies some
cases where the vortex actually rises to an
altitude above the generating aircraft in level
flight outside of ground effects.
2. Potential Rising Vortex Causes
The effects of atmospheric stratification on
aircraft wake vortices have been investigated
in the past (ref. 4, 5, 6). The vortex pair
descends and warms adiabatically owing to
compression. The vortices can then achieve a
temperature warmer than the environment,
and upward buoyancy forces can theoretically
counteract and eventually exceed thedownward momentum if the stable
stratification is very strong. The magnitude of
the buoyancy force can be measured by the
Brundt-Vais_iRi (B-V) frequency (ref. 6)
squared, which is the numerator in the
Richardson Number, a frequently used
measure of atmospheric turbulence:
Vortices can be imbedded in strong vertical
currents, especially during the afternoon on
convectively active days. Such "thermals" can
exceed 1 m/s (several hundred feet per minute)
on thermally active days as any soaringenthusiast can confirm. These conditions can
be inferred from measures of atmospheric
stability (ref. 8) from balloon soundings.
Rising motion can be imparted to the vortex
pair due to mountain waves or gravity waves
propagating along atmospheric discontinuities
such as inversions. Gravity waves from
mountains in NW Montana have been reportedto affect the initiation of thunderstorms as far
as several hundred kilometers downstream
(ref. 9).
Finally, atmospheric turbulence can enhancevortex instabilities that can be manifest in
oscillatory motions (ref. 10). Such features as
vortex bursting, Crow instability, and linking
have been observed and described in the past
(see ref. 11 for a summary). Vertical sinusoids
can be a potential source of vortices ascending
above flight generation altitude.
The above is a simplification for discussion
purposes. It is likely on any given day that
several of these effects and others, perhaps not
yet identified, can act on the vortices at any
given time and place in very complex ways.Some of these effects will be discussed in the
context of results found in this research.
where g is the acceleration of gravity, theta
the potential temperature, and Z the altitude. 3. Flight Experiments
Wind shear also plays a role. Most recently,
Proctor, et. al., have shown in vortex
simulations that nonlinear cross wind profiles
can arrest the descent of vortex pairs and that
this nonlinearity was more important than the
shear itself (ref. 7).
The NASA Langley Research Center with the
cooperation of the NASA Wallops Flight
Facility conducted a series of wake decay
flights off the coast of Wallops Island, VA. ANASA C130 aircraft acted as the wake-
generation aircraft. It was equipped with wing
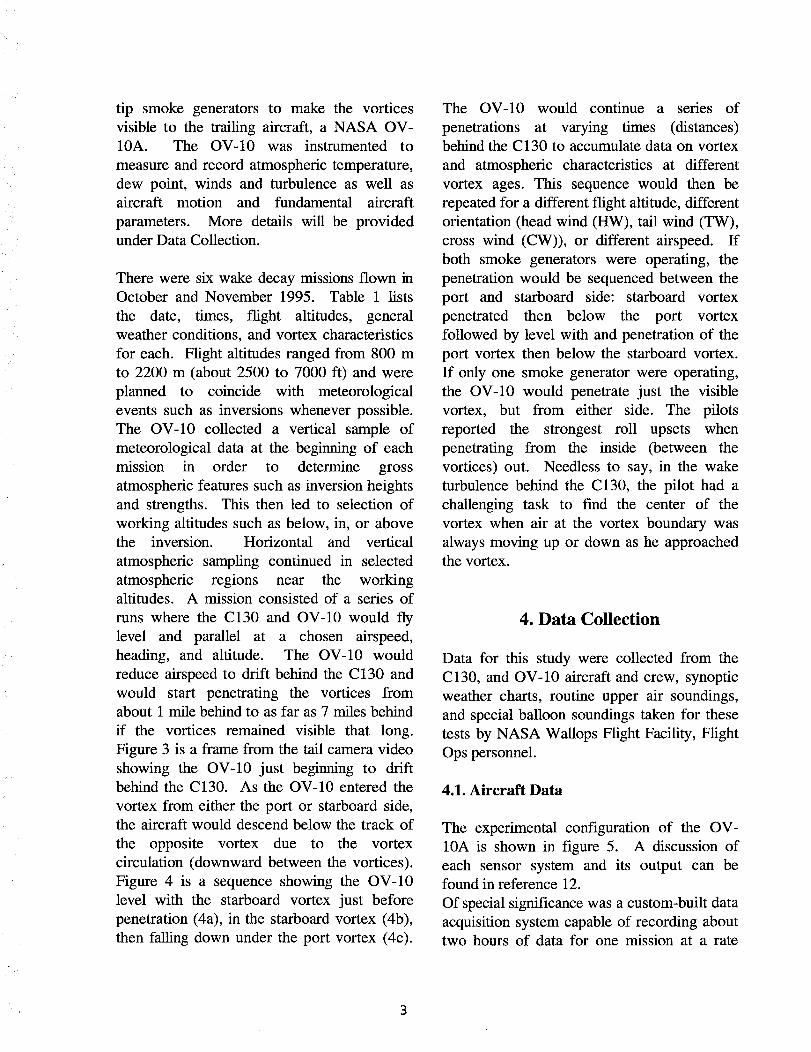
tip smoke generators to make the vortices
visible to the Vailing aircraft, a NASA OV-10A. The OV-10 was instrumented to
measure and record atmospheric temperature,
dew point, winds and turbulence as well as
aircraft motion and fundamental aircraft
parameters. More details will be providedunder Data Collection.
There were six wake decay missions flown in
October and November 1995. Table 1 fists
the date, times, flight altitudes, general
weather conditions, and vortex characteristics
for each. Fright altitudes ranged from 800 m
to 2200 m (about 2500 to 7000 ft) and were
planned to coincide with meteorological
events such as inversions whenever possible.
The OV-10 collected a vertical sample of
meteorological data at the beginning of each
mission in order to determine gross
atmospheric features such as inversion heights
and strengths. This then led to selection of
working altitudes such as below, in, or abovethe inversion. Horizontal and vertical
atmospheric sampling continued in selected
atmospheric regions near the workingaltitudes. A mission consisted of a series of
runs where the C130 and OV-10 would fly
level and parallel at a chosen airspeed,
heading, and altitude. The OV-10 would
reduce airspeed to drift behind the C130 and
would start penetrating the vortices fromabout 1 mile behind to as far as 7 miles behind
if the vortices remained visible that long.
Figure 3 is a frame from the tail camera video
showing the OV-10 just beginning to driftbehind the C130. As the OV-10 entered the
vortex from either the port or starboard side,
the aircraft would descend below the track of
the opposite vortex due to the vortex
circulation (downward between the vortices).
Figure 4 is a sequence showing the OV-10
level with the starboard vortex just before
penetration (4a), in the starboard vortex (4b),
then falling down under the port vortex (4c).
The OV-10 would continue a series of
penetrations at varying times (distances)behind the C130 to accumulate data on vortex
and atmospheric characteristics at different
vortex ages. This sequence would then be
repeated for a different flight altitude, different
orientation (head wind (HW), tail wind (TW),
cross wind (CW)), or different airspeed, ff
both smoke generators were operating, the
penetration would be sequenced between the
port and starboard side: starboard vortex
penetrated then below the port vortex
followed by level with and penetration of the
port vortex then below the starboard vortex.
If only one smoke generator were operating,
the OV-10 would penetrate just the visible
vortex, but from either side. The pilots
reported the strongest roll upsets when
penetrating from the inside (between the
vortices) out. Needless to say, in the wake
turbulence behind the C130, the pilot had a
challenging task to find the center of the
vortex when air at the vortex boundary was
always moving up or down as he approachedthe vortex.
4. Data Collection
Data for this study were collected from the
C130, and OV-10 aircraft and crew, synoptic
weather charts, routine upper air soundings,
and special balloon soundings taken for these
tests by NASA Wallops Fright Facility, Flight
Ops personnel.
4.1. Aircraft Data
The experimental configuration of the OV-
10A is shown in figure 5. A discussion of
each sensor system and its output can befound in reference 12.
Of special significance was a custom-built data
acquisition system capable of recording about
two hours of data for one mission at a rate

sufficiently high to characterize high-frequency
atmospheric turbulence. Also critical to this
study were Ashtech differential Global
Positioning System (GPS) receivers on both
the C130 and OV-10 with associated ground
stations at NASA Langley and NASA Wallops
from which highly accurate positions
(longitudinal, lateral and vertical) could be
obtained. On these flights the data rate for the
Rosemount probe on the graphite-epoxy nose
boom from which wind components were
calculated was 128 samples per second.Measurement rates from the other sensors
ranged from 4 to 32 samples per second.
Temperature and dew point were recorded at
8 samples per second. The tail camera
provided video tape documentation of each
mission along with audio tracks of pilot and/or
researcher comments as well as an IRIG time
code at the top of each frame. Pilot logs were
also available from the C130 and OV-10 flight
crews. The C130 has a wing span of 40.2 m
(132 ft) and its weight ranged from 44,452 kg
to 47,627 kg (98,000 lb to 105,000 lb) during
these missions.
For this study the temperature, dew point,
wind components, GPS positions, especially
altitude, and turbulent wind components were
used in conjunction with the OV-10 video
tapes, and pilot logs to characterize the height
of the vortex encounters as well as pertinent
atmospheric conditions and vortex behavior. A
summary of major aircraft data sources
available is presented in Table 2, and Table 3
shows the parameters collected on the OV-10.
Note that in Table 2 the Ashtech differential
GPS was not available on the C 130 for Flights
552 and 553. Also note that there was no
Ashtech GPS on the OV-10 until Flight 555.
There was excellent agreement in comparisons
of pressure altitude, Ashtech GPS, and
Honeywell GPS when they were all available.
Therefore, for the earlier flights, the
Honeywell non-differential GPS was used for
the OV-10 flight altitude. Finally, there was
little or no video available for Flights 552 and
555.
4.2. Other Meteorological Data
It is important in any study of wake vortex
phenomena in the atmosphere that the ambient
meteorological conditions be determined. It
was stated earlier that atmospheric
stratification or vertical temperature and
moisture gradients, vertical wind shear, and
turbulence can play significant roles in wake
vortex behavior. Special upper air balloon
radiosonde observations were taken during
each flight to provide ambient vertical
temperature, moisture and wind profiles.
Radiosonde packages (VIZ W-9000 MK-2)
with cross-chain Loran were used with a 300
gm balloon. Ascent rate was 305 m/min for
the special soundings. In addition, Wallops
personnel take upper-air radiosonde
observations twice daily at 0000 and 1200
GMT for the National Weather Service as part
of the National Network. These were 600 grn
balloons with an ascent rate of 366 m/min.
The special data for Flights 551 and 552 wereavailable at either 2 second or 5 second
resolution corresponding to 10 and 25 meter
vertical resolution respectively; but for the
other flights (and for the network soundings)
the vertical resolution was about 750 m for
temperature and dew point and 300 m for
winds. If there were significant temperature
features, more resolution was available. The
wind information output at the 2 or 5 second
rate was a running 6 second average.
The meteorological measurements from theballoon as well as from the OV-10 must be
understood in the context of the larger scale
features of the atmosphere. Therefore, the
surface and 850 hectopascal weather maps
were obtained for each flight day. A summary
of other meteorological data available for this
study is shown in Table 4.
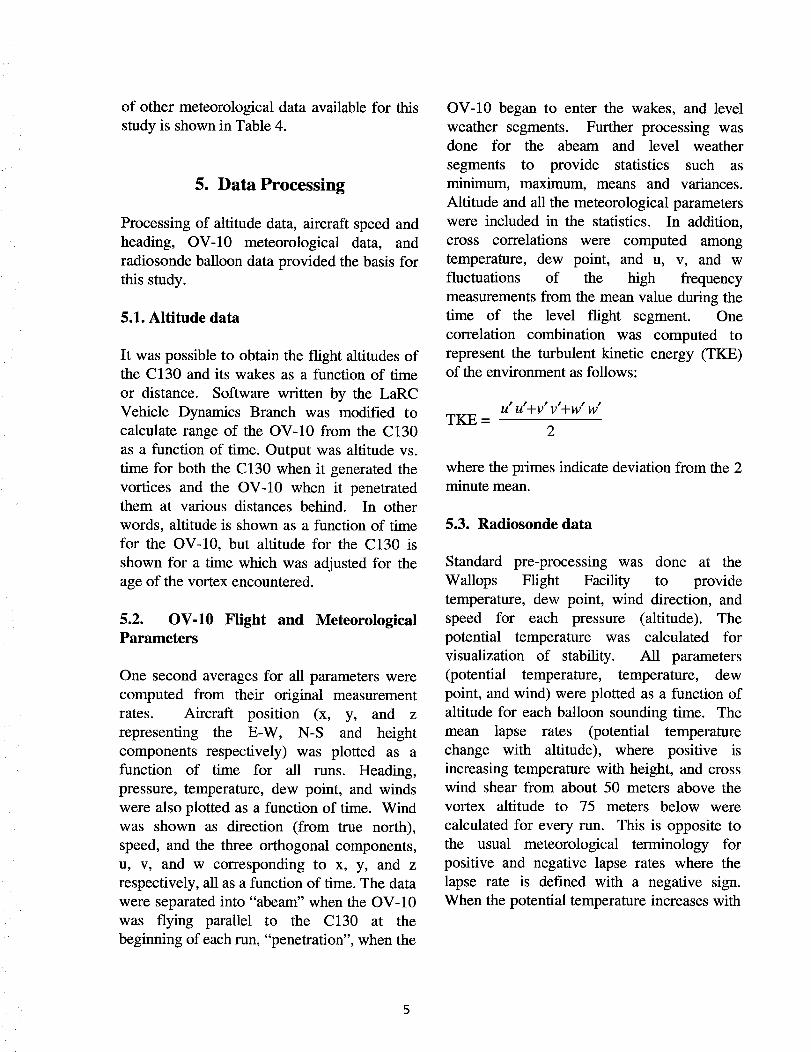
5. Data Processing
Processing of altitude data, aircraft speed and
heading, OV-10 meteorological data, and
radiosonde balloon data provided the basis for
this study.
5.1. Altitude data
It was possible to obtain the flight altitudes ofthe C130 and its wakes as a function of time
or distance. Software written by the LaRC
Vehicle Dynamics Branch was modified to
calculate range of the OV-10 from the C130
as a function of time. Output was altitude vs.
time for both the C130 when it generated the
vortices and the OV-10 when it penetratedthem at various distances behind. In other
words, altitude is shown as a function of time
for the OV-10, but altitude for the C130 is
shown for a time which was adjusted for the
age of the vortex encountered.
5.2. OV-10 Flight and MeteorologicalParameters
One second averages for all parameters were
computed from their original measurement
rates. Aircraft position (x, y, and z
representing the E-W, N-S and height
components respectively) was plotted as a
function of time for all runs. Heading,
pressure, temperature, dew point, and winds
were also plotted as a function of time. Wind
was shown as direction (from true north),
speed, and the three orthogonal components,
u, v, and w corresponding to x, y, and z
respectively, all as a function of time. The data
were separated into "abeam" when the OV-10
was flying parallel to the C130 at the
beginning of each run, "penetration", when the
OV-10 began to enter the wakes, and level
weather segments. Further processing wasdone for the abeam and level weather
segments to provide statistics such as
minimum, maximum, means and variances.
Altitude and all the meteorological parameters
were included in the statistics. In addition,
cross correlations were computed among
temperature, dew point, and u, v, and w
fluctuations of the high frequency
measurements from the mean value during the
time of the level flight segment. One
correlation combination was computed to
represent the turbulent kinetic energy (TKE)of the environment as follows:
TKE =U"I.tP+ V" V"+ W" W'
2
where the primes indicate deviation from the 2
minute mean.
5.3. Radiosonde data
Standard pre-processing was done at the
Wallops Flight Facility to provide
temperature, dew point, wind direction, and
speed for each pressure (altitude). The
potential temperature was calculated for
visualization of stability. All parameters
(potential temperature, temperature, dew
point, and wind) were plotted as a function of
altitude for each balloon sounding time. The
mean lapse rates (potential temperature
change with altitude), where positive is
increasing temperature with height, and cross
wind shear from about 50 meters above the
vortex altitude to 75 meters below were
calculated for every run. This is opposite to
the usual meteorological terminology for
positive and negative lapse rates where the
lapse rate is defined with a negative sign.
When the potential temperature increases with

height, the atmosphereis stable1 . B-Vfrequencywas also calculatedfor eachrun.Finally, the bottom and top of temperatureinversions and maximum strength wereidentified from the changing lapse ratestructurefor eachsounding. The data for allthe balloon soundings are included inAppendixA.
6. Results
A discussion of the most important
characteristics of vortex behavior and
associated meteorology will be the focus of
this section. First, the meteorology for each
flight day will be discussed. Next will be the
discussion of the combined vortex generation
altitude and altitude of penetration at various
vortex ages and distances behind the
generating aircraft. Finally, the meteorology
and vortex behavior will be presented for
times of sinking vortices, steady or rising
vortices, and disturbed vortices. Cause-effect
mechanisms will be included when possible.
6.1. Meteorology for Flight Days
There were no extraordinary meteorological
events occurring on any wake encounter day.
Flight tests were planned and executed when
no adverse weather was threatening the test
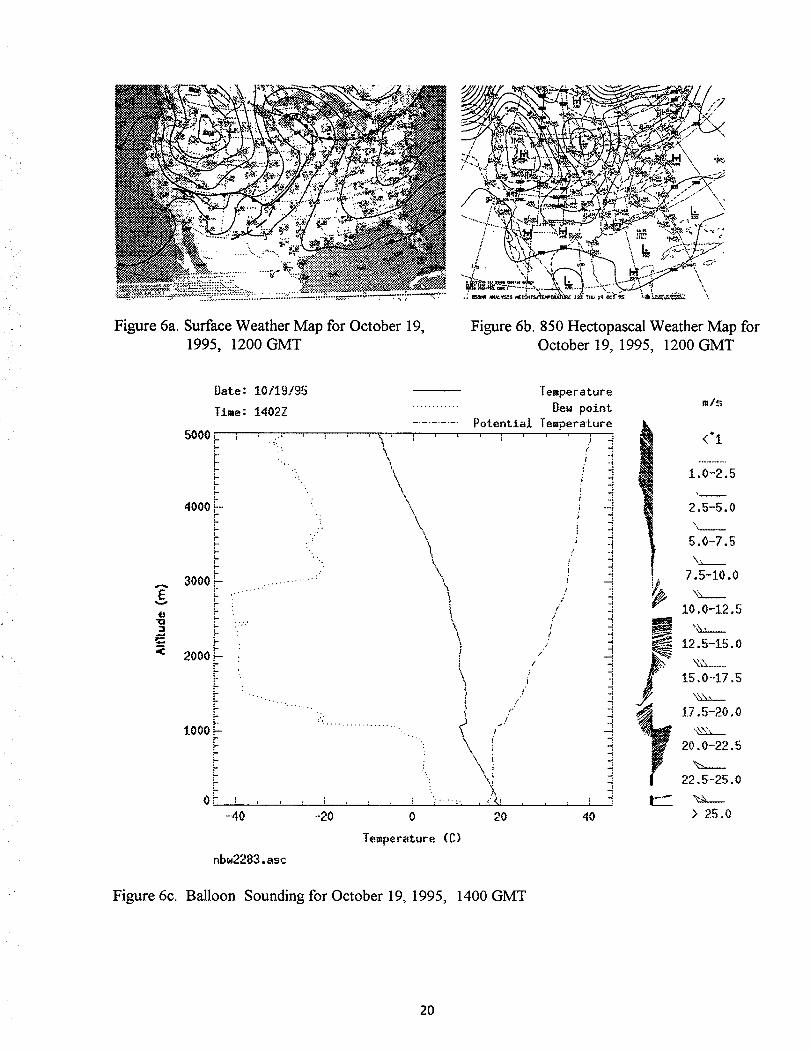
region. Figure 6 shows the surface weather
map (6a) and 850 hectopascal analysis (6b) for
October 19, 1995 whereas Figure 6c, d, and e
show plots of the balloon soundings at the
times indicated. There were two flights on
this day. High pressure dominated the region
with clear skies in the morning and scattered
cumulus clouds in the afternoon. The high
pressure aloft created subsiding air which was
indicated as a weak inversion and generally
stable conditions in the balloon soundings.
1or more precisely, conditionally unstable until itexceeds the moist adiabatic lapse rate
Stability at flight altitudes generally decreased
in the afternoon except for Flight 552, runs 8
and 9, which were in the top of a rather weak
inversion layer. All the other runs were above
the inversion but still in stable air. Winds at
flight altitudes were generally SW 5-8 m/s.
There was little turbulence with some cross
wind shear on some runs. The next flight day,
October 26, was very similar (Fig. 7a, b) with
even higher pressure dominating the region.
The sounding (Fig. 7c) reflects a stronger
inversion. Three of the runs (11, 12, and 13)
were at the top of the inversion where there
was a very stable atmosphere. Flight level
winds were Westerly 5-12 m/s with stronger
cross wind shears at the inversion top. There
were scattered clouds and haze trapped below
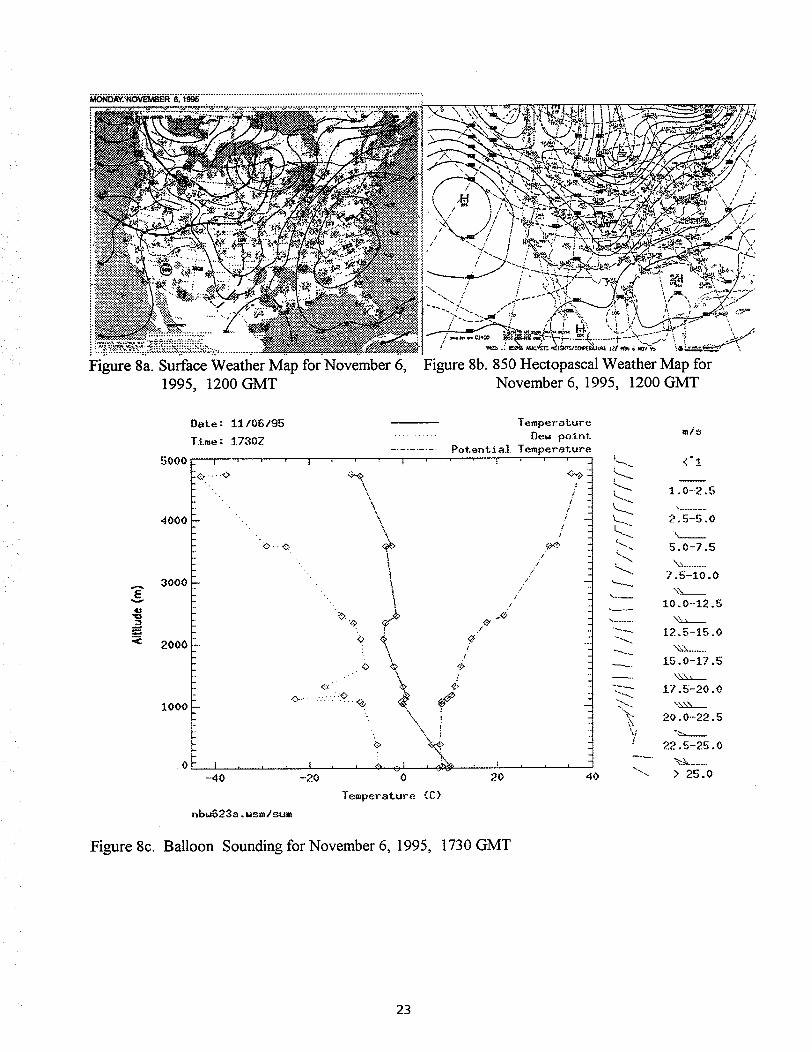
the inversion. High pressure at the surface
was the major feature on the next flight day,
November 6 (Fig. 8a, b). Again, the sounding
(Fig. 8c) shows the characteristic inversion
and stability. Lapse rates for all flight altitudes
were closer to neutral than on any prior
flights, however, skies remained clear. Winds
aloft and shears remained light, but turbulence
levels increased from the earlier flights. There
was a significant difference for the next two
flight days. A strong cold front moved
through the region early on November 8 with
a strong NW flow from the surface to 3 km
altitude and strong cold air advection (Fig. 9
a, b). This combination produced a well
mixed lower atmosphere with neutral stability
and significant turbulence. The sounding
shown in Figure 9c reflects the neutral stabilitybelow 1300 m. All the runs were in this well-
mixed, turbulent layer. Winds were 12 rn/s at
flight altitude with a trajectory perpendicular
to the mountains in Western Maryland. There
were clouds slightly above the flight altitude of
900 m (3,000 ft), some of which had vertical
development and looked like toweringcumulus in the video. Conditions on the last
flight day, November 9, 1995, were similar at
flight level, but there was increased stability

aloft from a building surface high pressure
system that moved into the area from the West
(Fig. lOa, b, and c).
The above meteorological conditions will be
called upon to help explain somecharacteristics of the wakes discussed next.
6.2. Wake Behavior
Results for every flight and run are
summarized in Table 5. All the important
information from the processing and analyses
of all the data are presented in this table. In the
discussion that follows, it is not necessary
(except to confirm a table entry) to refer to
either the weather maps or soundings. A
series of plots was generated for superimposedC130 altitude and OV-10 altitude. The C130
altitude was plotted at the time of vortex
generation. The OV-10 distance (in nautical
miles) behind the C 130 is shown in each plot.
These plots for all flights and runs for which
data were available are shown in Figures 11-
16, one sequence of runs for each flight. The
altitude data for these flights are included in
Appendix B. OV-10 vortex penetrations and
basic vortex behavior (sink, rise, or steady)
can be seen by visual inspection. One can see
the change in altitude of the OV-10 as it is
penetrating the vortices after about one mile
behind the C130: descent upon penetration,
then climb for the next penetration. Figure
lla (run 06), for example, shows the altitude
changes for the OV-10 after it started vortex
penetrations at about 1 1/4 miles behind the
C130 at 1332 GMT. The plot shows a steadydescent to the vortices until about 4 1/2 miles
behind the C130. In Figure llc (run 13) one
can see the altitude of the C130 changing (top
curve) so that the behavior of the vortex,
showing to be steady at 1500 m between 1442
and 1443 GMT, would have actually been
descending because the C130 was rising as it
was generating the vortices. The altitude
scales are the same for all plots, but the time
scales (abscissa) change depending on how
long the vortices could be seen. Unfortunately,
for Flights 553 and 555 there was no altitude
available for the C130 so we can only assume
it was level in interpreting vortex ascent or
descent. There was evidence from pilot
comments that the autopilot on the C130 was
not working properly for portions of Flights551 and 552 as can be seen in the altitude
plots for some of these runs.
There were some limitations, however, that
could affect the results. The lack of video
confirmation and pilot comments for Flights
552 and 555 prevented confmnation of wake
behavior, and the absence of altitude
information for the wake generating C130makes the determination of vortex behavior
(sinking, steady, or rising) speculative. There
were also some inconsistencies noted in pilotaltitude calls from his altimeter with the GPS
altitude plots. The GPS data are assumed tobe correct. Vertical wind measurements
appear to have a positive bias of 0.5 m/s, a
large number for atmospheric vertical motion,
so this information is only used in a relative
sense. There were some differences in
horizontal wind measurements between the
OV-10, C130, and balloons, but none beyond
that reasonably expected in the atmosphere.
The only corrections made in the data
presented in Table 5 were for differences in
Earth Geoid references for the GPS systems,
constants in both cases. Change in potential
temperature with height was also graphically
determined from balloon potential temperature
plots. The wind shear information presented
in Table 5 was calculated from the soundingtaken at a different time and location from the
wake encounter flights. When there were two
soundings bracketing a flight, some
interpolation was performed. Furthermore,
there was considerable smoothing in the
vertical winds, so that shears are not very
7

representative of those that may have
contributed to vortex behavior for any of the
runs. For this reason other parameters such as
Richardson Number used by many to assess
atmospheric turbulence is not calculated since
it includes the wind components squared in thedenominator.
Since a major goal of this study was to
determine whether or not wakes rise at flight
altitudes, the sequence of plots in Figure 11
through 16 is critical to the outcome.
During _ghts on October 19 (551 and 552)
there are only small differences between
generation altitude and vortex altitude among
the runs. For 553 and 555 there was no C130
altitude so the C130 was assumed to be in
level flight. Nevertheless, those runs in which
the vortices predominantly descended and
those where there was very little or no descent
beyond an initial period were identified and
separated for discussion purposes. Because
vortices on the last two days underwent
significant vertical and horizontal undulations,
they were also separated. Each group will bediscussed below.
6.2.1. Sinking Vortices. Vortices appeared
to be predominantly sinking during their
lifetime (represented by their smoke trail) for
551 run 06, 552 runs 05 and 10, 553 run 8,
and 555 run 03 and 04. These cases are
extracted from Table 5 and summarized in
Table 6. Note that the average potential
temperature lapse rate was 0.48 degrees
C/100 m and B-V frequency was 0.0127/s for
the sinking cases. The lower lapse rate
represents fewer upward motion forces, as
would be expected, than for the level to rising
cases presented next. Also of interest are the
two runs separated by 45 minutes in Flight
551 (runs 06 and 10). Both were head wind
cases and at the same altitude. The former
sank significantly, whereas the latter remained
nearly level. Notwithstanding wind shear
effects which may not be adequately
represented, the biggest difference was that
the airspeed of the C130 was 90 m/s for run
10 and 60 m/s for run 06. The other difference
is a slight increase in stability, therefore
buoyancy, for this later flight as interpolated
between the two closest balloon soundings.
For Flight 552 there also was a sinking vortex
followed by a steady vortex. The only
difference here was that run 05 was in a tail
wind configuration and run 06 was a cross
wind. Therefore, the cross wind shear for run
06 was three times the value of the first run
(run 05), or 0.3 compared to 0.1 m/s per 100
m. There did not seem to be any other
correlations with orientation (head wind, tail
wind, cross wind) or anything else separating
these sinking vortex cases from the others.
6.2.2. Level or Rising Vortices These cases
are spread throughout the flights as shown in
Table 7. The average lapse rate increased to
1.03 degrees C/100 m and the corresponding
average B-V frequency (0.0177) was higher.
There are individual exceptions, however.
Flight 551 run 10 and 552 run 6 were already
discussed. There may be other factorsinvolved such as wind shear and/or
interactions of all the effects, some of which
cannot be adequately determined. The
assumption that the C130 was steady for
Flight 553 may also be incorrect. It is
interesting to note that the one case
documented from the GPS plots, 552 run 9,
when the vortices rose above the generating
altitude, involved a flight near the top of the
inversion in the region of maximum positive
lapse rate. There were other cases when
vortices rose above the wake generation
altitude, but these involved large sinusoidaloscillations to be discussed next.

6.2.3. Oscillating Vortices Strong horizontal
and vertical oscillations began to appear in the
vortices on the last two flight days as close asone-fourth mile behind the C130. Some of
these oscillations are shown in Figure 17 as
the OV-10 is drifting behind the C130.
Oscillating vortex cases are shown in Table 8.
There was little discussion of the TKE
parameter up to this point because there did
not seem to be any correlation with vortex
behavior. However, it can now be seen that
all these runs are associated with high values
of TKE (average value: 1.31). It appears that
ambient turbulence was enhancing vortex pair
interaction and precipitating the oscillatory
motion. Ambient winds were perpendicular to
mountains about 300 km upwind, but the
atmosphere did not appear to be favorable for
mountain wave propagation. Normally these
would travel along a discontinuity in the fluid
such as an inversion top, but the atmosphere
at flight altitude was near neutral and well
mixed. Also, there did not seem to be much
difference in oscillation wave length fromcross wind to head-tail wind orientation as one
would expect for a mountain wave. The
vertical motion measured from the OV-10 was
higher and changed significantly during the
course of the runs. There could be more
organized vertical motion fields in the
atmosphere caused by the turbulent
overturning associated with strong cold air
advection at flight altitudes. Note that in
Flight 556 run 26, some of these oscillations
reached altitudes of 150 meters above the
generation height. The low points in thevertical sinusoids were 100 meters below
C 130 flight altitude. The degree of hazard has
not yet been determined. The C130
maintained a very steady altitude during these
flights.
Vortices remained at or below generation
height for all the runs of Flight 557 despite the
vertical oscillations. The increased
atmospheric stability may have played a role
different from buoyancy effects on that day.
Increased stability above flight altitude and
reduced cold air advection below may have
suppressed larger scale vertical motion than
might have been active on the previous day.
7. Conclusions
Aircraft wakes produced in level flight well
above the ground have been shown in severalcases to remain near the altitude of their
generation and to rise above their generated
altitude in a few cases. This is in sharp
contrast to wake vortex training material
available to the aviation community which
depicts wakes descending 500 to 901)feet
below their generation altitude. On one
occasion the OV-10 was penetrating vortices
confirmed by GPS altitude to be above the
C130 generation altitude by as much as 150
m. These large excursions were associated
with vertical oscillations in the vortex pair
most likely triggered by atmospheric
turbulence and instability. Turbulence, as
measured by the TKE parameter, and neutral
stability were highly correlated to the earlyoccurrence of these oscillations. The one
documented case (Flight 552, run 9) with nooscillations and where the vortex was above
the C130, occurred near the top of an
inversion where both buoyancy and wind shear
may have played a role. However, the wind
shear could not be resolved to a scale
sufficient to allow correlation.
9

References
1. Hinton, D.A., "Aircraft Vortex Spacing System (AVOSS) Conceptual Design," NASA Tech
Memo No 110184, Aug, 1995.
. Hay, George C. and Robert H. Passman, Wake Turbulence Training Aid, US Department of
Transportation, Volpe National Transportation Systems Center, Cambridge, MA, DOT-
VNTSC-FAA-95-4, Apr, 1995, page 2.14.
3. Aeronautical Information Manual, US Department of Transportation, Federal Aviation
Administration, Nov. 9, 1995, page 7-3-2.
4. Tombach, I., "Observations of Atmospheric Effects on Vortex Wake Behavior," J. Aircraft,
Vol 10, 1973, pp. 641-647.
5. Sarpkaya, T., "Trailing Vortices in Homogeneous and Density-Stratified Media," J. Fluid
Mech., Vol 136, 1983, pp. 85-109.
6. Greene, G. C., "An Approximate Model of Vortex Decay in the Atmosphere," J. Aircraft, Vol
23, 1986, pp. 566-573.
. Proctor, F. H., D. A. Hinton, J. Han, D.G. Schowalter, and Y. L. Lin., "Two Dimensional
Wake Vortex Simulations in the Atmosphere: Preliminary Sensitivity Studies," AIAA 97-0056, Jan 1997.
8. Higgens, Harry C. "The Thermal Index," Soaring Magazine, Vol. 27, No. 1, 1963, pp. 8-11.
. Koch, Steven E. et. al., "A Mesoscale Gravity-Wave Event during CCOPE, Part IV: Stability
Analysis and Doppler-derived Wave Vertical Structure," Monthly Weather Review, Vol 121,
Sep 1993, pp. 2483-2510.
10. Sarpkaya,T. and J. J. Daly, "Effect of Ambient Turbulence on Trailing Vortices," J. Aircraft,
Vol. 24, No. 6, Jun 1987, pp. 399-404.
11. Hallock, J. N., "Aircraft Wake Vortices: An Assessment of the Current Situation," DOT-
FAA-RD-90-29, Jan, 1991, US Department of Transportation, John A. Volpe National
Transportation Systems Center, Cambridge, MA.
12. Stuever, Robert A. Eric C. Stewart, and Robert A. Rivers, "Overview of the Preparation and
Use of an OV-10 Aircraft for Wake Vortex Hazards Flight Experiments," AIAA 95-3935,
Sep 1995.
10
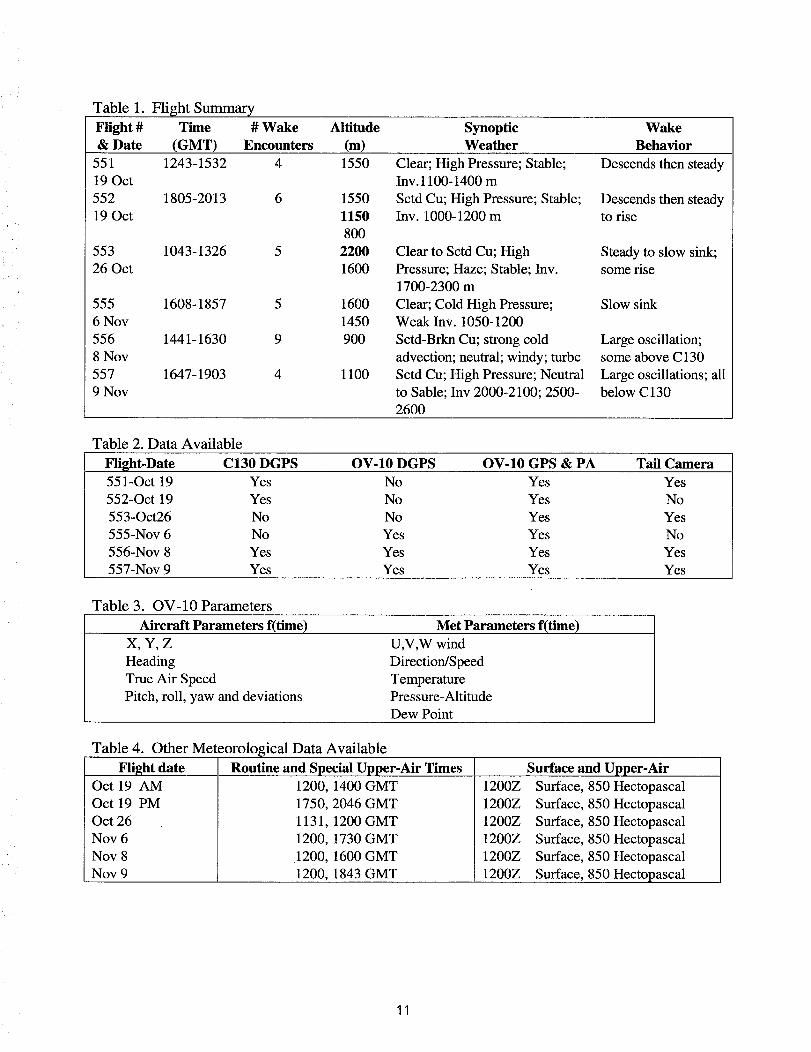
Table 1. Flight Summary
Flight # Time # Wake Altitude
& Date (GMT) Encounters (m)
SynopticWeather
Wake
Behavior
551 1243-1532 4 1550
19 Oct
552 1805-2013 6 1550
19 Oct 1150
800
553 1043-1326 5 2200
26 Oct 1600
555 1608-1857 5 1600
6 Nov 1450
556 1441-1630 9 900
8 Nov
557 1647-1903 4 1100
9 Nov
Clear; High Pressure; Stable;Inv. 1100-1400 m
Sctd Cu; High Pressure; Stable;Inv. 1000-1200 m
Clear to Sctd Cu; High
Pressure; Haze; Stable; Inv.1700-2300 m
Clear; Cold High Pressure;Weak Inv. 1050-1200
Sctd-Brkn Cu; strong cold
advection; neutral; windy; turbc
Sctd Cu; High Pressure; Neutralto Sable; Inv 2000-2100; 2500-2600
Descends then steady
Descends then steadyto rise
Steady to slow sink;some rise
Slow sink
Large oscillation;some above C130
Large oscillations; allbelow C130
Table 2. Data Available
Flight-Date C130 DGPS OV-10 DGPS OV-10 GPS & PA Tail Camera551-Oct 19 Yes No Yes Yes
552-Oct 19 Yes No Yes No
553-Oct26 No No Yes Yes
555-Nov 6 No Yes Yes No
556-Nov 8 Yes Yes Yes Yes
557-Nov 9 Yes Yes Yes Yes
Table 3. OV-10 Parameters
Aircraft Parameters f(time) Met Parameters f(time)
X,Y,Z
Heading
True Air Speed
Pitch, roll, yaw and deviations
U,V,W wind
Direction/Speed
TemperaturePressure-Altitude
Dew Point
Table 4. Other Meteorological Data Available
Flight date Routine and Special Upper-Air TimesOct 19 AM
Oct 19 PM
Oct 26
Nov 6
Nov 8
Nov 9
Surface and Upper-Air1200, 1400 GMT
1750, 2046 GMT
1131, 1200 GMT
1200, 1730 GMT
1200, 1600 GMT
1200, 1843 GMT
1200Z
1200Z
1200Z
1200Z
1200Z
1200Z
Surface, 850 Hectopascal
Surface, 850 Hectopascal
Surface, 850 Hectopascal
Surface, 850 Hectopascal
Surface, 850 Hectopascal
Surface, 850 Hectopascal
11

Table 5. Data Summary for Rising Vortex Research
Flight No.
551
Date Run No.
19-Oct-95
6 132743 133000
10 141645 141818
13 144047 144200
14 145100 145359
19-Oct-95
5 183433 183650
6 184956 185200
7 190044 190150
8 190758 190900
9 191735 191900
10 192808 192940
26-Oct-95
8 115324 115530
9 120725 120900
11 123420 123530
12 124600 124734
13 125925 130115
6-Nov
2 164315 164420
3 165540 165730
4 170630 170730
5 173500 173600
6 175122 175330
8-Nov-95
22 153450 153550
23 154743 154918
24 155650 155750
25 160750 160844
26 162145 162245
27 163230 163323
28 165213 165320
9-Nov-95
Abeam Penetration
Beg. Time End Time Beg. Time End Time
HMS-GMT HMS-GM'I HMS-GMT HMS-GMT
Nom Fit Lvl Fit Level IAS Heading
Feet meters m/s deg
133154 134238 5000 1540 60 220
141821 142100 5000 1575 90 220
144216 144358 5000 1560 90 310
145405 150000 5000 1560 60 310
552
553
555
183707 184200 5000 1540 95 20
185310 185650 5000 1530 95 300
190210 190600 3700 1150 95 120
190957 191200 3300 1025 95 310
191910 192250 3300 1025 95 50
192949 193350 2500 775 95 220
115550 115750 5200 1600 65 290
120912 121322 5200 1650 100 100
123549 123919 7000 2225 100 80
124736 125007 7000 2225 100 170
130133 130400 7000 2225 100 350
Orientation Wake Character
556
TKE
mZ/s2
557
22 1_1_ 1_200
23 1_925 1_040
24 1_730 1_843
25 1866_ 186725
HW sinking 0.12HW slow sink -level 0.213
XW 0.222
XW 0.215
AVG 0.214
TW sinkingXW slow sink - level
XW level
XW slow sink-level
TW sink-rise-sink
HW slow sink
HW *slow sink
TW *steady
XW *slow sink
XW *slow sink-level
XW *steady-rise
164423 164800 5000 1450 70 360 XW *slow sink
165810 165940 5000 1450 70 90 TW *sink
170755 171355 5000 1450 100 270 HW *sink
173605 173750 5000 1600 70 350 XW *slow sink
175520 175834 5000 1575 70 70 TW *sink-rise
1_6_ 1543_ 3000 900 70 300
154925 155335 3000 900 70 120
155755 1_9_ 3000 900 100 300
100900 161316 3000 900 100 120
1_2_ 162750 3000 900 100 210
163330 1636_ 3000 900 100 30
165330 1657_ 3000 900 100 210
174245 174603 3800
1_0_ 1_300 38OO
175847 180055 3800
180732 181019 3800
* C130 altitude was not available and was assumed constant
HW large oscillations
TW large oscillations
HW large oscillations
TW large oscillations
XW i large oscillations
XW large oscillations!
XW large oscillations
0.142
0.222
0.17
0.083
0.187
0.356
AVG 0.249
0.156
0.209
0.041
0.348
0.115
AVG 0.136
0.866
0.176
0.743
0.386
0.386
AVG 0.626
I1100 70 145
1100 70 325
1100 70 65
1100 70 245
0.774
1.2
2.16
0.97
1.27
2.86
0.574
AVG 1.40
TW large oscillations 1.29
HW large oscillations 0.873
XW large oscillations 0.956
XW large osdllations 1.47AVG 1.3[
OV-10 C130
Mean Wind Mean Wina
deg/m/s deg/m/s
230105 224103
220107 200103
210106 N/A
220107 200105
195/09 190103
200106 190103
240104 240105
225102 240105
200104 N/A
200102 220105
315106 386103
28615.5 305/07
255/12 260116
260/11 260/10
260/11.5 250/10
270/02 270/05
270/04 270/03
300/03 270/03
230/2.5 270/03
260/04 270/03
308/12 300/08
290/10 290/12
300/10 300/09
290/11 300/13
300/10 300/10
300/10 281/11
312/15 300/11
300/10 315/08
325/07 300/10
300/08 305/20
320/10 320/08

Table 5. (continued
Mean Temp Pot Temp Mean Dew Point Mean W DTh/DZ DDir/DZ DS/DZ B-V
C K C m/s degK/100m deg/100m [ m/s/100m per sec
11.2 297.9 0.7 20 1 0.0151749
11 298 1 20 1 0.0181345
10.6 298 20 0.0181345
10.5 298 1 20 1 0.0181345
11.3 298 0.5
0.511
0.3
0.3298
0.012823
0.012823
13.4 295.5 0.8 20 0.3 0.0162884
13.2 295 1.1 20
1.1
0.3
0.313.5 20295
0.0191161
0.0191161
13.5 291 0.5 2 0.3 0.0129763
3.4 0.4 0.3292 0.0115865
4 292 0.6 10 0.3 0.0141905
6 301 2.4 15 1.3 0.0279534
288 0.4 8 0.8 0.0116667
6 301 2.4 5 13 0.0279534
6.5 301 2.4 5 1.3 0.0279534
-1.5 285 0.4 12 0.8 0.0117279
-1.5 285 0.4 12 0.8 0.0117279
-1 285 0.4 12 0.8 0.0117279
-2 289 0.4 7 0.8 0.0116465
-2
1.9 285 0 1 0.5 0
1.5 285 0 1 0.5 0
-27.3 0.5
-10 0.5
-7 0.5
-6 0.5
1 0.5
4 0.5
-21 0.5
-10 0.2
-10 1
3 0.2
-0.5 0.6
-2 0.4
-15 0.4
-13.6 0.5
-15 0.2
-7.8 0.5
-8.3 0.5
-8.6 0.5
-8.8 0.5
-9.3 0.5
-2 1
-1 1
-1 1.5
-1 1
-1 1.5
-2 2
-2 2
-8 1
-10 0.8
-10 0.8
-9 0.8
1.5
1.5
1.5
1.5
0.5
-7
-6.7
1.5
1.5
1.5
1.5
-7
-6.8
285
285
285
0.5
0.5
0.5
0.5
0.5
0.5
0.5
0.5
0.5
285
285
275.5
275.5
275.5
275.5
Crosswind Shr Inversionbse.
nds/100m meters
1100
1
1
0.5
0.5
900
0.1
0.3
1
1
1
0.1
1700
1.5
1.5
0.3
0.3
0.3
1100
0.4
0
0
0.4
0
1300
0
0
0
0
0.5
0.5
0.5
1280
0
0.2
1
1
Inversion top Strength
meters deg/100m
1200 2
1100 2
2300 2.4
1300 2
1500 1
1500 1

=
Table 6. Data Summary for Sinking VorticesAl:eam Pen_xati_
FlightNo. Date R_No. NomFltLvl FltLevel IAS _g Orientation WakeOmmaer
Feet rr_ters m/s deg
551 19-Oct-95
6
552 19-Oct-95
Beg. Time End T11m
HMS-GMT HMS-GMT
132743 133000
183433 183650
192808 19294O
115324 115530
165540 165730
170630 170730
Beg. Tn'ne End Turn
HMS-GMI HMS-GMr
133154 134238
183707 184200
192949 193350
115550 115750
165810 165940
170755 171355
5OO0 1540 60 22O I-1W sinldng
5 5000 1540 95 20 TW sink- level
10 2500 775 95 220 HW slow sink
553 26-Oct-95
8 5200 1600 65 290 HW *slow sink
555 6-Nov-95
3 ND0 1450 70 90 TW *sink
4 5000 1450 100 270 HW *sink
* C130 altitude was not available and was assumed constant
OV-10 C130
TKE _WmdMmnWmd MemTernp PotTerrp _Pan_wR/nt MmnW DIh/DZ DDir/I3E _ B-V Cross_indShr
rn2/s3 deg/n-/s deg/m/s C K C rn/s C/100m deg/100m m/s/100m per sec w/gl00m
I
N/A 230/05 Z24/03 11.2 24.9 -27.3 0.5 0.7 20 1 0.015175 1
0.142 195/09 190/03 11.3 25 1 0.5 0.5 1 0.3 0.012823 0.1
0.356 200/02 220/05 13.5 18 3 0.2 0.5 2 0.3 0.012976 0.1
0.156 315/06 300/03 3.4 19 -0.5 0.6 0.4 7 0.3 0.011586 1.5
0.176 270/04 270/03 -1.5 12 -8.3 0.5 0.4 12 0.8 0.011728 0
0.743 3(D/03 270/03 -1 12 -8.6 0.5 0.4 12 0.8 0.011728 0
AVG0.315 AVG 0.47 AVG 0.48 [ AVG0.01267r

Table 7. Data Surnmary for Rising VorticesAbeam
Flight No. Date Run No. Beg. Time End Time
HMS-GMT HMS-GMT551 19-Oct-95
10 141645 141818
552 19-Oct-95
6 184956 185200
7 190044 190150
9 191735 191900
553 26-Oct-95
13 125925 130115
555 6-N3v-95
6 175122 175330
* C130 altitude was not available and was assumed constant
Penetration
Beg. Time End Tir_
HMS-GMT HMS-GMT
141821 142100
185310 185650
190210 190600
191910 192250
130133 130400
175520 175834
INomFlt Lv] Fit Level IAS
Feet n'e_,ters m/s
I5000 1575 90
5000 1530 95
3700 1150 95
3300 1025 95
7000 2225 100
5000 1575 70
Heading Orientation Wake Gaaracter
deg
220 HW slow sink- level
300 XW slow sink- level
120 XW slow sink-rise
50 TW sink-rise-sink
350 XW *steady-rise
70 TW *sink-rise
OV-10
TKE Mean Wind
m2/# aegn4s
0.213 220/07
0.222 200/06
0.17 240/04
0.187 200/04
0.115 260/11.5
0.386 260/04
AVG0.216
C130
MmnV_rd M_aTetrp! PctTearp _E_vPdnt lVlx_W
_/ii1/s c K C m/s
2_03 11 25 -10 0.5
1_0/03 11 25 4 0.5
2A0/05 13.4 22.5 -21 0.5
N1A 13.5 295 -10 1
250/10 6.5 28 -15 0.2
270/03 -2 15 -9.3 0.5
AVG0.533
DINDZ DDir/I3Ei 13f213E B-V
C/103m deg/lOOm rffs/100m _ sec
1 20 1 0.018134
0.5 1 0.3 0.012823
0.8 20 0.3 0.016288
1.1 20 0.3 0.019116
Z4 5 1.3 0.027953
0.4 8 0.8 0.011(67
AVG 1.0331 AVG0.01fi
Sir Inm'simlre. Inx_sicntop _'engthn/gl00m nxters
11oo 1230
deg/100m
21
1100 2
0.3
1
1
1700 2300 Z4
0.3
1100 1300 2
0

Table 8. Data Summary for Wakes with Large OscillationsI Abeam Penetration
Flight No. Date Run No. Beg. Time End Time
HMS-GMT HMS-GMT
556 8-Nov-95
557 9-Nov-95
22
23
24
25
26
27
28
22
23
24
25
Beg. Time End Time
HMS-GMT HMS-GMT
Nora Fit Lvl Fit Level IAS Heading
Feet meters m/s deg
153450 153550 153650 154317 3000
154743 154918 154925 155335 3000
155650 155750 155755 155953 3000
160750 160844 160900 161316 3000
162145 162245 162255 162750 3000
163230 163323 163330 163650 3000
165213 165320 165330 165755 3000
I174103 174200 174245 174603 3800
174925 175040 175045 175300 3800
175730 175843 175847 180055 3800
180642 180725 180732 181019 3800
900 70 300
900 70 120
900 100: 300
900 100 120
900 100 210
900 100 30
900 100 210
1100
1100
1100
1100
70
70
70
70
145
325
65
245
Orientation Wake Character
HW large oscillations
TW large oscillationsHW large oscillations
TW large oscillations
XW large oscillations
XW large oscillations
XW large oscillations
TW large oscillations
HW large oscillations
XW large oscillationsXW large oscillations
TKE
m2/s 2
0.774
1.2
2.16
0.97
1.27
2.86
0.574
1.29
0.873
0.956
1.47
AVG 1.31
OV-lO
Mean Wind
deg/m/s
308/12
290/10
300/10
290/11
300/10
300/10
312/15
300/10
325/07
300/08
320/10
C130
Mean Wind Mean Temp Pot Temp
deg/m/s C
300/08 1.9
290/12 1.5
300/09 1.5
300/13 1.5
300/10 1.5
281/11 1.5
300/11 0.5
315/08 -7
300/10 -6.7
305/20 -7
320/08 -6.8
K
Mean Dew Point Mean W DTh/DZ DDir/DZ
C m/s C/100m deg/100m
12 -2
12 -1
12 -1
12 -1
12 -1
12 -2
12 -2
1 0
1 0
1.5 0
1 0
1.5 0
2 0
2 0
2.5 -8 1
2.5 -10 0.8
2.5 -10 0.8
2.5 -9 I 0.8AVG 1.22
0
0
0
0
DS/DZ
m/s/100m
1 0.5
1 0.5
1 0.5
t 0.5
1 0.5
1 0.5
1 0.5
1.5 0.5
1.5 0.5
1.5 0.5
1.5 0.5
B-V
per sec
Crosswind Shr
m/s/100m
Inversion bse.
0.5
0.5
0.5
Inver_on top Strength
1280 1500 10
0.2
1
1
meters meters deg/100m
1300 1500 1
0
0
0

Counter
conlroi
Figure l. Wake Vortex Flow Field (from ref. 2)
Flightpath
Levels off in approximately
5 nm in approach configuration
500 to 900 feet
Figure 2. Wake Vortex Descent Rates (from ref. 2)
17

CO
Figure 3. Video Frame of OV-10 Drifting
Behind the C130Figure 4a. Video Frame of OV-10 Level with the
Starboard Vortex
iiiiiii!iiii_iiiiiiii_i
Figure 4b. Video Frame of OV-10 PenetratingStarboard Vortex
Figure 4c. Video Frame of OV-10 Below the Port
Vortex
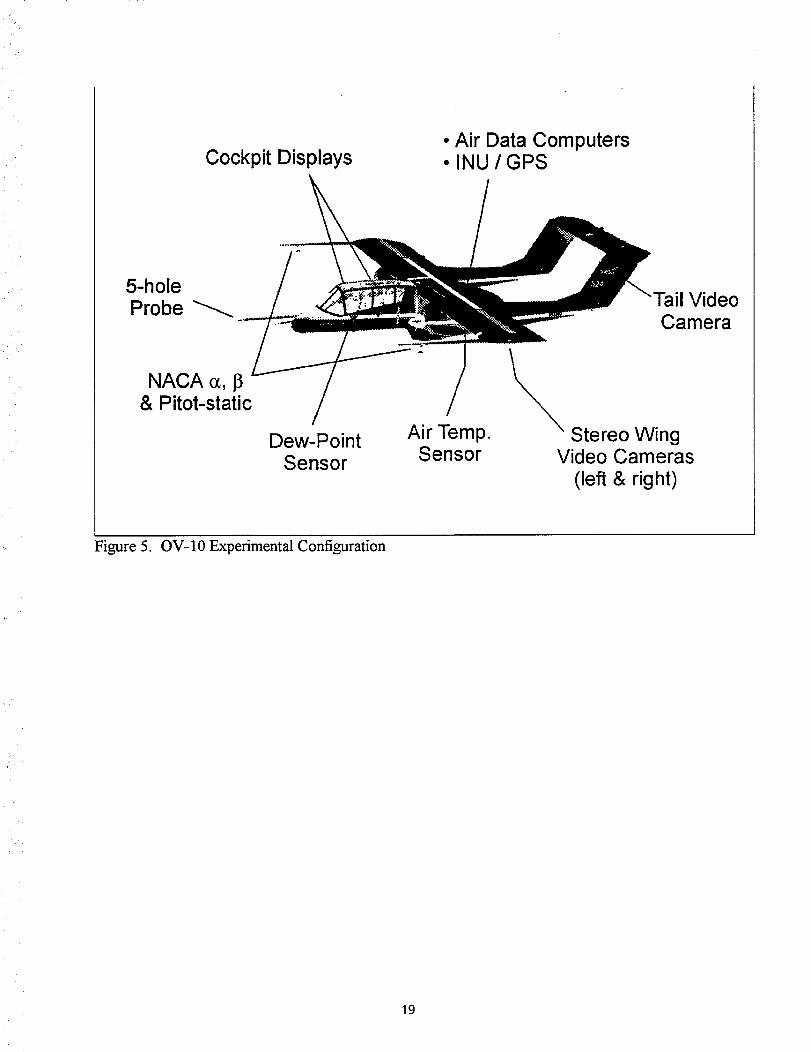
Cockpit Displays
5-holeProbe
NACA o_,13& Pitot-static
Dew-PointSensor
• Air Data Computers• INU / GPS
/
Air Temp.Sensor
VideoCamera
Stereo WingVideo Cameras
(left & right)
Figure 5. OV-10 Experimental Configuration
19
mWf ZJ:
Figure 6a. Surface Weather Map for October 19,
1995, 1200 GMT
_,_ _. • _.- , -_. _ z_-=_..._,,,
, ,_',_._..,.. ......_,-.-,,ff¢'_.• . !_<_ .,,,,.:_<
_.,:t_ _,/_I,L£'I,._/;I_.._'_"f"s.-"_. ;_.%-:,7"'_,<,Nz".-"..'\.,
I ,)_'" _ ', _ ,7+ 'l>z" '
Figure 6b. 850 Hectopascal Weather Map for
October 19, 1995, 1200 GMT
Bate: 10119195
Time: 1402Z
5000 F _ .:.., ,
_ ..
"°°i"! ..._ •
... SOOOF .........
i ,. .... -
:"
_ P :......
< 2000_ :
"".,..,
tOOO_
-40
¢) •nbw2,.83.asc
lemperature
............ Bee point
.......... Potentlal Iemperature
\k
'\\,
\,%k\
%%
--20
' i
"....
i
0
\\
\
/t
\f /i /\ i
i _o.,
i
#
• i\ t
\k',
',..... :, , < <i ,
20
' 4-4
"i"!"!.-!,
'44-4.-4
, i
4
-4• -I
---t_I
.--4q
40
Temperature (C)
m/s
<'1
1.0-2,5
2,5-5.0
5.0-7.5
\.,
7.5-10.0
10.0-12.5
..._ 12.5-15.0
_ _& .......
15.0.--17.5
1.7.5-20.0
20.0-22.5
22.5.--25.0
>25.0
Figure 6c. Balloon Sounding for October 19, 1995, 1400 GMT
20

•.c 2000 !--- :
i ..
.1.oooF
I,-
Date : I0/19/9_
Time : 1750Z
5000 i.- iI-
I-1-
4000 b
i-3000 _:-.............
_, -_. ..,
'.,.
.... ....
\\\\.
\\
.......... PotentJ.al
I
\
\\
}
k
\\ :
i ;''J(
Tem _erature
Oew point
Tern _erat.ure
t
0 k....t.................................J..................................L....::...................£_ .................................t......
---40 -20 0 20 40
Temperature (C)
nbu2284.1ua
Figure 6d. Balloon Sounding for October 19, 1995, 1750 GMT
E
.qE
Date : 1011gl95 ................... Temperature
............ Dew pointTime: 2046Z................. Potential Temperature
5000 ;....... "r....... ,........ ,........ ,....... _ ....... ,"....... :"'_'" ....... _ ....... :........ "....... _ ....... 1........ r........ r....... ,-....... r,"......,- .:: . \E ...... . ' i_L '_ ,-- ': k
4000 F'" "'" \": \
r- - \3000 F- "
...................... . \
F : \2ooo_ :. t
\
::::::/ --}..... ........
i-
F
I000 k
-40r i I I r i , I ; i
-2O 0
|emper-_ L_re (C)
nbu_tf3._ua
/
t
i
!
i)
.t
/
/
./
/-
i
./
"_-4 , ,
2Oi
40
Figure 6e. Balloon Sounding for October 19, 1995, 2046 GMT
|
7.:"
<
.
<'.I.
1.0-2 ._
2.5-=5.0
5.0--7.5
7.5--'10.0
3.0.0-12.
1.2.5-1.5. o
15.0-17._
17.5--20.0
20.0-22.5
22.5-25. o
"_-.._ .......
> 25.0
m/s
<'I
1.0-2.5;
2.5-5.0
sio--_7.s
7.5-10.0
",,%..........I0.0-12.5
I._. S-.'LS .0
15.0-17. S
17.5-20.0
_\._ .....20.0-22.
22. S-_S. O
._...__...__> 25.0
21

Figure 7a. Surface Weather Map for October 26, Figure 7b. 850 Hectopascal Weather Map for
1995, 1200 GMT October 26, 1995, 1200 GMT
E
It)
::)
Bate: t0126/95
Time: _._31Z
5000_ ......... I ......... I ......... _......... I ......... _......... _........FbF
4000_0.
3000
L
2000 k
k
i000o.
................... Temperature
......... Dew point
.......... PoLen'ti_I Temperaturei
"" _ //
".. \. ."
/"
i \ /
_" J _/
• ! /
....\.,, /
• \ .,.
), ,/: ),
,'-- _. /
p - _ ;.
i , , ..___12"0.......... ......... ........ , i, ; =_j,_.¢ ......... I ......... I ........
-30 -20 --10 0 .10 20 30
Temperature ((')
nb,.,8Ola,usm/sum
i
40
Figure 7c. Balloon Sounding for October 26, 1995, 1131 GMT
\.
\
I
mls
<'1
1.0-2.5
x ......._
2.5-5.O
5.0--7.5
"k2,._._
7.5-10.¢
XX
10.0-12.5
,.,,_____._
12.5-15.0
.15.0--.17.5
\:_ .....
17.5-20.0
20.0-22.5
22.5-25.0
>25.0
22
. • _ ._.,,_.- ._...._ z_?_`'_zx..-_`_--_7_?_?-°_.._::._._°7`._`.._¢?._`_.-_.._._.-_.°:_..._-.?_,_.-.._.._¢_ -
_'"............":-:"::,':;':-._iii _"/ .... _;_""-.:"":'-",':7 -: .......
Figure 8a. Surface Weather Map for November 6,
1995, 1200 GMT
A
Z}
Figure 8c.
Date : 11106/95
T.i.me : .1.7307.
5000
4000
3000
2000
I000
.0
I
:_:. .... @
_..._
!
\\
\k
@[
'. !
\\
4:c" " }_.......,.........:o., z¢
i i i r I
-40 -20
nbu623a.usm/sum
I
TempeY-ature
De,-, point
Potential Temperature
.I
//
/
!
!
/"
/"
/"
/
/
ii
@i
P•. \
X• \
0
il
Z
I , , i ......
20 40
Temperature (C)
Balloon Sounding for November 6, 1995, 1730 GMT
mls
"_ 1.0--2,5
,... 2.5-5.0L,_ %____, 5.0-7.5
:"" 7.5-10.0,--.....
10.0-12.5
"_ I2.5-15.0
.___ _.x .......
___ 15.0-17.5
"_ 17,5-20,0
_" 20.0-22.5
/ 22,5-25.0
-_,.._.......""_ > 25.0
23

_ES_A_;i_MBER 8_ "1995
'_ . K':_.....K ,.. .:.: " '; _-.", \ '_i_,N_.._";a';_.M _-.-......("J:"%;'\"_ ,'_...... •_.. " '._- -':-" ' ,..k ': _ ". _\'X' >.- ; ...... .: " '. l ' :--_' ." _'
_. ._.._ _. • ' _.. _ ,, ",,_,_,",_._• •N. ..-,.. =,..-;,t,, {-• . W. _;.., -... _:
•, _ _ _ ..... , .... .-..:_,., ...!_,...... .,_..,.._...... _,. _, , .,. _.._ ..... .,.
; _%_i.-'.-" .... _ 7i>.'"_'_#{L4"_' ._' ".'.-.'_-:.__-"-- .... ' ,_ " _-:_> _ '_: 4 - ,...... _<o_ :, . _---/. "_--." .......... _: a_ .... ", '.--.+_g ' . 1. ,.,<-,,:............. w .... .... 19 ..5g;_...... _. --,_ __,
• x.:+,,_..x.- {......._!_!_ ;_ eaE -.... _:.,. < -, -. , x.- .......i':.:.:._.:._.?:'_@... _.. 7L. _, '_....... .}'_ "'... _:_.';_:" ,'" . "L_" ',Li g.",'. ".', "_., "
_"<:_.,-%__.,- --..-..'"_ .<*g"-':, .i_'<'_ ..... ,_ , .._-,-.."_L',_i_'_'*"::_ig_i_ - " _:_:"":% "" g _{_"-.2,.......>" ........"_o/ '"',_...'_" =".,>_i":"'+__,_-5._ ....... <,., < , "'-_-_, ._,_;,., ._. ,. ",_:x... ,, :::::.u:..aa,v,.:.'.a....... .... ::2 ....... , , _ , \
Figure 9a. Surface Weather Map for November 8,
1995, 1200 GMTFigure 9b. 850 Hectopascal Weather Map for
November 8, 1995, 1200 GMT
..,-.,.
v
Figure 9c.
5000
4000
3000
2000
1000
0
Date:
Time:
-40
11108195
1600Z
f
\
nbu627a. _sm/sum
.......... Potential!
\%
\\
\\
\ /"-._> t V,
\ ik i
i
I +
, , I:,C,:_;., ._._> ,-20 0
Temperature (C)
Balloon Sounding for November 8, 1995, 1600 GMT
Temperature
Oe_ point
Temperature
./
/
2"
_ -
i
' r
2O
m/s
"_'- <'i
1.0-2,5
"_'_ 2.5.--5.0\-%._°.
5.0---7.5
x._.. 7.5-.'[.0.0
_- ...... 10.0-12.5
\4,-- o--. ,.N_
L 12.5-15.0
, --- 15,0-17,5
_-- a7.5-20.0_"'" _-;_C._.....
_. 20,0-22.5
Q-. 22.5-25.0%'. _
> 25.0
24

"' #.
__..:....
Figure 10a. Surface Weather Map for November 9,
1995, 1200 GMT
Figure 10b. 850 Hectopascal Weather Map for
November 9,1995, 1200 GMT
5OOO
4000
3000
v
< 2000
tO00
Figure lOc.
Date : 11/09195 ................... Temperature
Tlme: i843Z ............ De= point.......... PoLen'L.i.BI Temperature
[2.......l.........:.........r.........r........1........._........."........._........"I.........".........:.........:......... f.........' ........_.........
l--
g
-- _ /..... _ > ..'>_
9<i ° .... '_ i,,- \ ,-
i ! i\
/.
, /,.": :.
'k- t "i
F- "7- : \ /' C" ,._'Z" "_. ........... -_ ............. .5 .. q.ee
.-. _ _, .I'- ":
_. : _ i_- . _-.i
.......,......................................,.................................. .......................................................-40 -20 0 20
Te_per-ature (C.)
nbuG29a, usa/_um
Balloon Sounding for November 9, 1995, 1843 GMT
7--.%
'-..
%:"--."-.....
m/.'_
<':1
1.0--2.5
2.5-5.0
5.0-7.5
7.5---I0.0
lO .0-12.5
1.2.. 5-I.5.0
,,_15,. 0.--17.5
"-_-_.,......17.5-20.0
20.0-22. ,_
22.5-25.0
> 25.0
25

16001550
_ _ 1500_ 1450_ 1400
13501300
13:28:00
16001550
_ 1500= • 1450
14oo13501300
14:16:00
16001550
_ 1500
1450"- _ 140013501300
14:40:00
16001550
_ 15oo: • 1450
14oo13501300
14:52:00
551 run 06OV-lO thick C130 thin
1600
._ 1550
150014501400
n,m, 135o....... "" 1300
13:30:00 13:32:00 13:34:00 13:36:00 13:38:00 13:40:00 13:42:00 13:44:00
time of day
551 run 10OV-IO thick C130 thin
I I1 I 2 13 i I _ 4 I , ' I,4"9,
14:18:00 14:20:00
time of day
,nm ,
16oo
1550
15001450140013501300
14:22:00
551 run 13OV-lO thick C130 thin
1600
_- 1550
1500145014001350
i i 1 nm 1.851 T 1300
14:42:00 14:44:00
time of day
551 run 14OV-IO thick C130 thin
1600
_ 1550
15001450140013501300
14:54:00 14:56:00 14:58:00 15:00:00
time of day
Figure 1 l. C130 and OV-10 GPS Altitude for Flight 551 at Run Times Shown
26

b
1600
1550
1500
• 1450
"_ E 1400
1350
1300
18:34:00
552 run 05OV-1- thick C130 thin
1600
I I 1 i, 2 ii 3 Ir4 I 5 I 6 L6:7, nn
18:36:00 18:38:00 18:40:00
time of day
16OO
1550
1500
1450
1400
1350
1300
18:42:00
t550
1500
1450
1400
1350
1300
18:50:00
552 run 06OV-IO thick C130 thin
, , ,I 1 , , ,12 , , , ],3l 14 ..... I 5' / nm
18:52:00 18:54:00 18:56:00time of day
13OO
1250
1200
1150
1100
1050
1000
19:00:00
::3
T 1600
+ 1550
+ 1500
÷ 1450
÷ 1400
÷ 1350
i 1300
552 run 07OV-IO thick C130 thin
, ,I 1 12 ,i3, , , 1,4, ,nrn
19:02:00 19:04:00time of day
552 run 08
1200 OV-lO thick C130 thin1150
1100
1050
1000
1300
1250
1200
1150
1100
1050
.... 1000
19:06:00
95O
900 [1 _ 12 i 3 nm 4
19:08:00 19:10:o0d time of day
1200
1150
1100
1050
1000
95O
9OO
19:12:00
Figure 12. C130 and OV-10 GPS Altitude for Flight 552 at Run Times Shown
27

e
12oo
115o
_ 1100
1050
lOOO.m
950
900
19:17:00
552 run 09OV-lO thick C130 thin
11 i 2 13 14.... is nm19:19:00
1200
1150
1100
1050
1000
95O
9OO
19:21:00 19:23:00time of day
f
900
85O
_ 800
750"- _ 700
650
600
19:28:00
552 run 10
OV-IO thick C130 thin -- 90o
85O
- 800
__"" _ 750- 700
_ 650
I ' I1 j2 13 ,I4 nm 4.8 I l 600
19:30:00 time of day 19:32:00 19:34:00
Figure 12. (continued) C130 and OV-10 GPS Altitude for Flight 552 at Run Times Shown
28

17001650
-8 _ 16oo"_ • 1550
=E 150014501400
11:53:00
a
1700
1650 I
1600
E 15oo14501400
12:07:00
b
2300
2250 I
2200
_ E 21oo20502000
12: 34:O0
C
23OO
2250 1--
2200
21oo2050
2000
12:46:00d
23002250
-8 _ 2200
m 2150"- _ 210020502000
12:59:00
e
__ m
OV-10 553 run 08
I I
1700
1650
16001550150014501400
11:55:00 11:57:00
Time of Day
OV-IO 553 run 09
I I I
1700
1650
16001550150014501400
12:09:00 12:11:00 12:13:00
Time of Day
OV-IO 553 run 11
I I
23OO
2250
2200
2150210020502000
12:36:00 12:38:00 12:40:00
Time of Day
OV-10 553 run 12T 2300
2250.."_.,.._,,,,,'_2200
-_2150
_2100
_2050r _2000
12:48:00 12:50:00Time of Day
OV-IO 553 run 13 2300
2250
22002150210020502O00
13:01:00
Time of Day
13:03:00
Figure 13. C130 and OV-10 GPS Altitude for Flight 553 at Run Times Shown
29

.8`=
.,e,=_
a
.8`=
.9,=.=.
b
.8.=
.9,=_
C
d
e
1500
1450 I
14001350130012501200
OV-10 555 run 021500
_v______ 1450
1400135013001250
I i 120016:43:00 16:45:00
Time of Day
16:47:00
1500145014001350130012501200
OV-lO 555 run 03
i i I
150O
1450
14001350130012501200
16:55:00 16:57:00 16:59:00 17:01:00
Time of Day
1500145014001350130012501200
17:06:00
OV-10 555 run 04
i i r
17:08:00 17:10:00 17:12:00
Time of Day
1500145014001350130012501200
17:14:00
1700
165o
1600
"._ 1500E 1450
1400
OV-10 555 run 05 1700165016001550150014501400
17:35:00 17:37:00
Time of Day
1700 OV-10 555 run 06
1650
1600_ 1550 "-""-'-----"_'_--__-"•_ 1500
E 14501400 I i I
1700165016001550150014501400
17:50:00 17:52:00 17:54:00 17:56:00 17:58:00 18:00:00
Time of Day
Figure 14. C130 and OV-10 GPS Altitude for Flight 555 at Run Times Shown
30

L
"t G,
::3 _,
b
c
d
C
1000
900 I800
700
15:12:00
1000
900
800
700
15:24:00
1000
900
800
700
15:34:00
1000
9OO
8OO
70O
15:46:00
1000
9OO
8OO
70O
15:56:00
556 run 20
OV-IO thick C130 thin lOOO
600
700
15:14:00 15:16:00 15:18:00 15:20:00time of day
556 run 21OV-IO thick C130 thin
i l 1 ,I 2 , , i 13 I ,I4 , ,rim , ,
15:26:00 15:28:00 15:30:00time of day
1000
900
800
, , , 700
15:32:00
556 run 22OV-IO thick C130 thin
i i1, t 12 i I 3[ i 4
15:36:00 15:38:00 15:40:00 15:42:00time of day
lOO0
9OO
800
nm 7oo
15:44:oo
556 run 23
OV-IO thick C130 thin lOOO
9oo800
Ir1 I 700omE15:48:00 15:50:00 15:52:00 15:54:00
time of day
556 run 24
OV-IO thick C130 thin lOOO
800
i1 C ' ,r2, , , 13 , , , q4, nm 700
15:58:00 16:00:00
time of day
Figure 15. C130 and OV-10 GPS Altitude for Flight 556 at Run Times Shown
31

1000
900
80O
7OO
16:06:00
556 run 25
OV-IO thick C130 thin
, , , 1,1.... 12 , , _t3, , ,p4 , , ,F5 , ,li6, , I, 7 , ,I8 .....
16:08:00 16:10:00 16:12:00time of day
1000
I90080O
nm 700
16:14:00
g
1000
900 I800
700
16:20:00
556 run 26
OV-lO thick C130 thin /_ t lOOO
_ _ 900
r ],1 p2 , i ' ,i3 , , i,4 .... i5 _ , , _6 , ,nm, ,_ 7,_._ , 700
16:22:00 16:24:00 16:26:00 16:28:00time of day
h
1000
900
556 run 27
OV-IO thick C130 thin
8OO
700 I 1, , _I 2 , , ,I 3 , 14 , , ,I § , 1,6 , ,nm
16:32:00 16:34:00 16:36:00time of day
1000
9OO
80O
7OO
16:38:00
556 run 28
lOOO OV-IO thick C130 thin lOOO
°° ooI i oo-_ _ 800 800
700 1,1 Hi2 , , b3 p4 4,5 _ , , I 6, , J7 ,nm , _,8 700
16:52:00 16:54:00 16:56:00 16:58:00i time of day
Figure 15. (continued) C130 and OV-10 GPS Altitude for Flight 556 at Run Times Shown
32

b
C
d
557 run 22
OV-IO thick C130 thin1200
1150 I'-- __
1 lOO ---_-_
N _ 1000950900 lil I
17:41:00 17:43:00 17:45:00
time of day
12001150110010501000
nm 950900
17:47:00
557 run 23
OV-lO thick C130 thin
1150 115011oo -- ,-, 11oo:} 1050 1050"_ _ 1000 1000
950 950900 900
17:49:00 17:51:00 17:53:00
time of day
"_ E
12001150110010501000
950900
17:57:00
-- i
557 run 24
OV-lO thick C130 thin1200
I150
__ 1100
_ lO5O1000950
,I 1 12 nm 900
17:59:00 18:01:00
time of day
12001150110010501000
95O9OO
18:06:00
557 run 25
OV-lO thick C130 thin
i I 1 ,I 2 i nm
18:08:00 18:10:00
time of day
1200115011001050100095O9OO
Figure 16. Cl30 and OV-10 GPS Altitude for Flight 557 at Run Times Shown
33

I.O
Figure 17. Video Frames From Different Times of the C130 Wake Vortex Smoke Signature


REPORT DOCUMENTATION PAGE Form ApprovedOMB No. 0704-0188
Public reporting burden for this collection of information is estimated to average 1 hour per response, including the time for reviewing instructions, searching existing data sources,
gathering and maintaining the data needed and completing and reviewing the collect on of nformat on Send comments regard ng th s burden est mate or any other aspect of thiscollection of information, including suggestions for reducing this burden to Washington Headquarters Services, D rec orate for nformat on Operat ons and Reports, 1215 Jefferson Davis
Highway, Suite 1204, Arlington, VA 22202-4302, and to the Office of _l'anagement and Budget, Paperwork Reduction Project (0704-0188). Washington, DC 20503.
1. AGENCY USE ONLY ( Leave blank) 2. REPORT DATE 3. REPORTTYPE AND DATES COVERED
April 1997 Contractor Report4. TITLE AND SUBTITLE
Documentation of AtmosphericConditionsDuringObserved Rising AircraftWakes
6. AUTHOR(S)
J. Allen Zak, Vigyan, Inc.William G. Rodgers, Jr., Lockheed Martin Engineering and Sciences
!7. PERFORMINGORGANIZATIONNAME(S)ANDADDRESS(ES)
Lockheed Martin Engineering & Sciences
Langley Program Office
Langley Research Center, Mail Stop 371Hampton, VA 23681-0001
9. SPONSORING/ MONITORINGAGENCYNAME(S)ANDADDRESS(ES)
National Aeronautics and Space AdministrationLangley Research CenterHampton, VA 23681-0001
5. FUNDING NUMBERS
C NAS1-96014
538-04-11-11
8. PERFORMING ORGANIZATION
REPORT NUMBER
10. SPONSORING/MONITORING
AGENCY REPORT NUMBER
NASA CR-4767
11. SUPPLEMENTARY NOTES
Langley Technical Monitor: BurnellT. McKissick
12a. DISTRIBUTION / AVAILABILITY STATEMENT
Unclassified - Unlimited
Subject Category 47
12b. DISTRIBUTION CODE
13. ABSTRACT (Maximum 200 words)
Flight tests were conducted in the fall of 1995 off the coast of Wallops Island, Virginia in order to determinecharacteristics of wake vortices at flight altitudes. A NASA Wallops Flight Facility C130 aircraft equipped withsmoke generators produced visible wakes at altitudes ranging from 775 to 2225m in a variety of atmosphericconditions, orientations (head wind, cross wind), and airspeeds. Meteorological and aircraft parameters werecollected continuously from a Langley Research Center OV-10A aircraft as it flew alongside and through thewake vortices at varying distances behind the C130. Meteorological data were also obtained from specialballoon observations made at Wallops. Differential GPS capabilities were on each aircraft from which accuratealtitude profiles were obtained. Vortices were observed to rise at distances beyond a mile behind the C130.The maximum altitude was 150m above the C130 in a near neutral atmosphere with significant turbulence. Thisoccurred from large vertical oscillations in the wakes. There were several cases when vortices did not descendafter a very short initial period and remained near generation altitude in a variety of moderately stableatmospheres and wind shears.
14. SUBJECT TERMS
Aircraft wakes; Wake vortex; Flighttests; Wake decay research flights;Rising vortices;Atmospheric conditions;Wind shear
17. SECURITY CLASSIFICATIONOF REPORT
UnclassifiedNSN7540-01-280-5500
18. SECURITY CLASSIFICATION 19. SECURITY CLASSIFICATION
OF THIS PAGE OF ABSTRACT
Unclassified
15. NUMBER OFPAGES
40
16. PRICE CODE
A03
20. LIMITATION OF ABSTRACT
Standard Form 298 (Rev. 2-89)
Prescribed t_y ANSI Std. Z39-18
298-102
36


![CONSTRAINTS FROM ATMOSPHERIC MEASUREMENTS ON THE …acmg.seas.harvard.edu/.../Wednesday/WedF_Carbon_suntharalingam… · Suntharalingam et al. [GRL, 2008] •Matching observed seasonal](https://static.fdocuments.in/doc/165x107/6082bfe97d4e4d3c903485b4/constraints-from-atmospheric-measurements-on-the-acmgseas-suntharalingam-et-al.jpg)