2011 Air Chemistry Study at the Boulder Atmospheric ... · PDF file2011 Air Chemistry Study at...
20
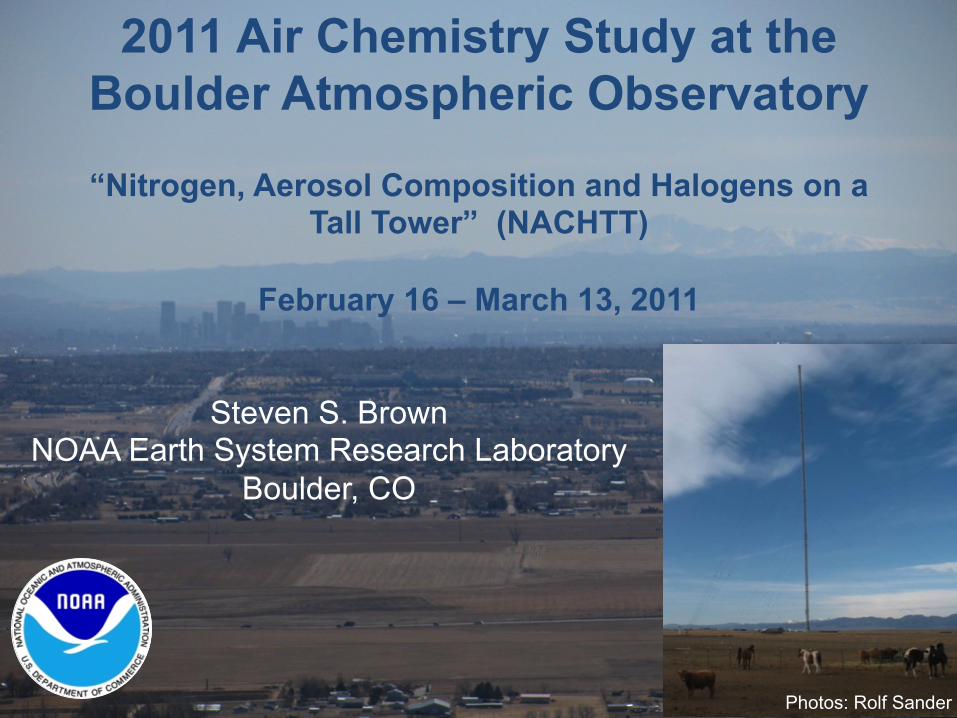
2011 Air Chemistry Study at the Boulder Atmospheric Observatory “Nitrogen, Aerosol Composition and Halogens on a Tall Tower” (NACHTT) February 16 – March 13, 2011 Photos: Rolf Sander Steven S. Brown NOAA Earth System Research Laboratory Boulder, CO
Transcript of 2011 Air Chemistry Study at the Boulder Atmospheric ... · PDF file2011 Air Chemistry Study at...
2011 Air Chemistry Study at the Boulder Atmospheric Observatory
“Nitrogen, Aerosol Composition and Halogens on a
Tall Tower” (NACHTT)
February 16 – March 13, 2011
Photos: Rolf Sander
Steven S. Brown NOAA Earth System Research Laboratory
Boulder, CO
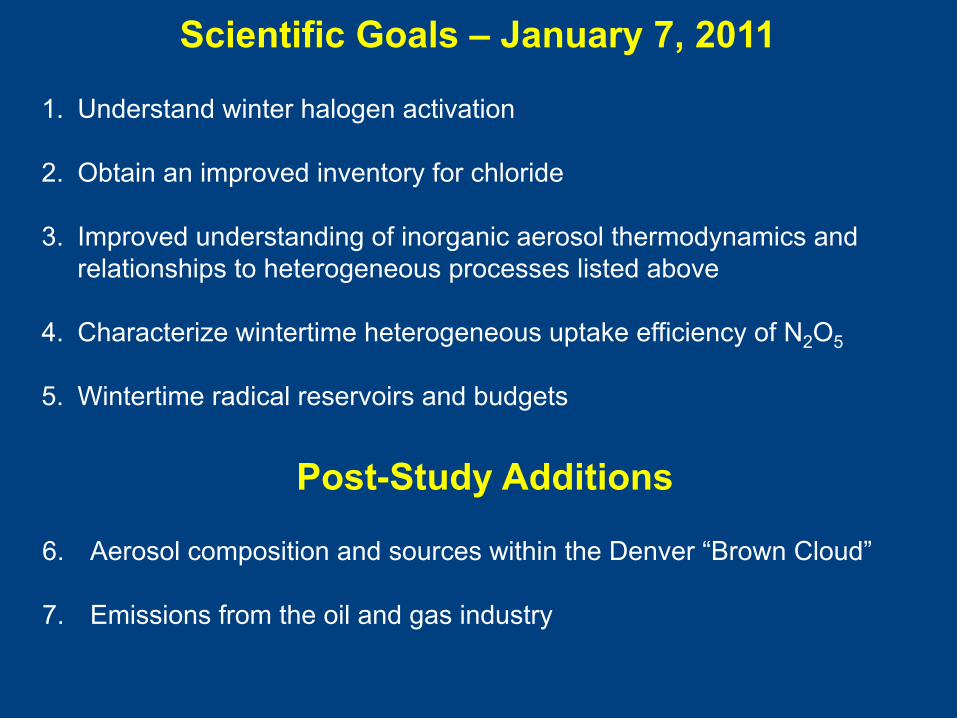
Scientific Goals – January 7, 2011
1. Understand winter halogen activation 2. Obtain an improved inventory for chloride
3. Improved understanding of inorganic aerosol thermodynamics and relationships to heterogeneous processes listed above
4. Characterize wintertime heterogeneous uptake efficiency of N2O5
5. Wintertime radical reservoirs and budgets
Post-Study Additions
6. Aerosol composition and sources within the Denver “Brown Cloud” 7. Emissions from the oil and gas industry

Instruments & Participants - BAO Tower Species Instrument Investigators
NO, NO2, NO3, N2O5, O3 CRDS Wagner, Young, Dubé, Brown
ClNO2, Cl2, N2O5 CIMS (I-) Riedel, Thornton (UW)
HCl, HNO3, HONO, etc. CIMS (acetate) Vandenboer, Roberts
Aerosol Composition AMS Ozturk, Bahreini, Middlebrook
Aerosol Size Distribution UHSAS Brock
Speciated VOCs Canister samples Sive (UNH / Appalachian State)
Height Data on Carriage Counter, GPC Dubé
Met Data on Carriage Sonics, RH probe, etc.
Wolfe, Williams, Wagner
Tower server, ground communication & Control
Jameson, Wagner, Dubé
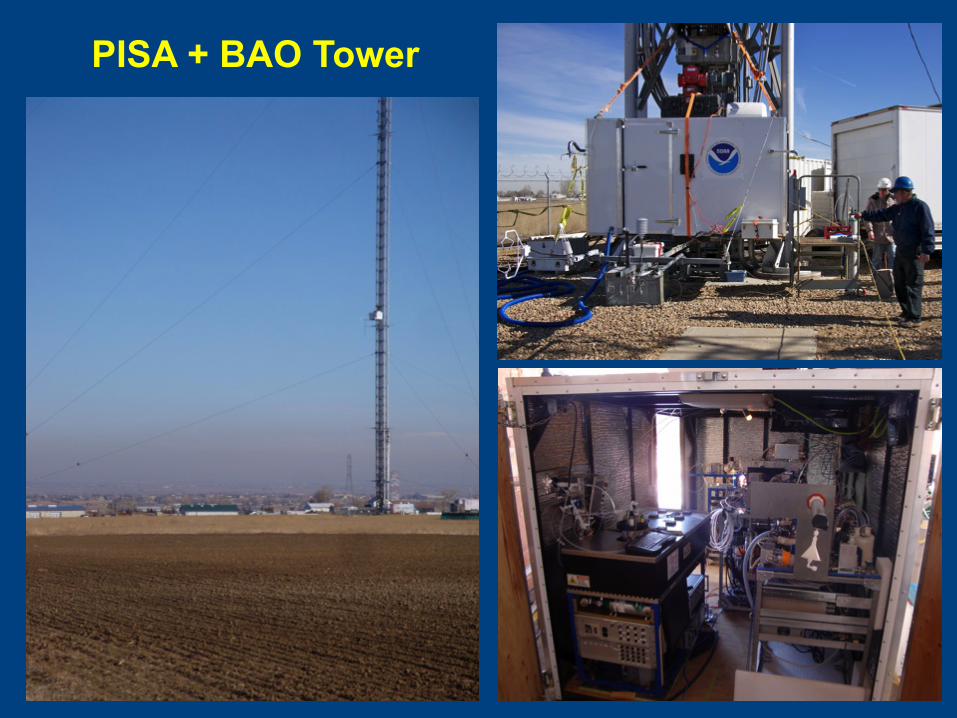
PISA + BAO Tower

Instruments & Participants - Ground Site Species Instrument Investigators
HCl, HNO3, NH3, HCOOH, CH3COOH, soluble Br- (gas and particle phase)
Mist Chamber / IC Pszenny (UNH), Keene (UVA)
Size resolved aerosol ionic composition, 0.25 - 20 µm
Cascade Impactor / IC Pszenny (UNH), Keene (UVA)
HCl CRDS Yalin / Hagen (CSU)
Micrometeorology Tethered balloon Meillier (CU)
VOCs PTR TOF / GC Warneke, Gilman, Lerner, Graus de Gouw
VOCs Canister samples Sive (UNH)
OH CIMS Kim (NCAR)
Photolysis rates (NO2, O3) Filter radiometer Lerner
Ozone UV absorption Williams
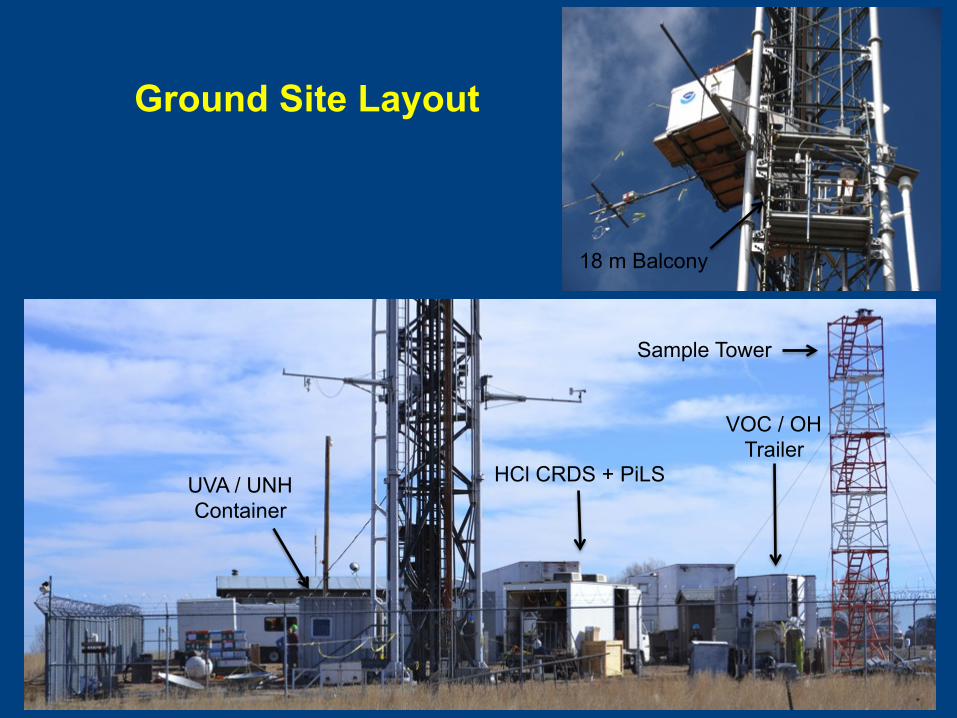
Ground Site Layout
HCl CRDS + PiLS
VOC / OH Trailer
Sample Tower
UVA / UNH Container
18 m Balcony
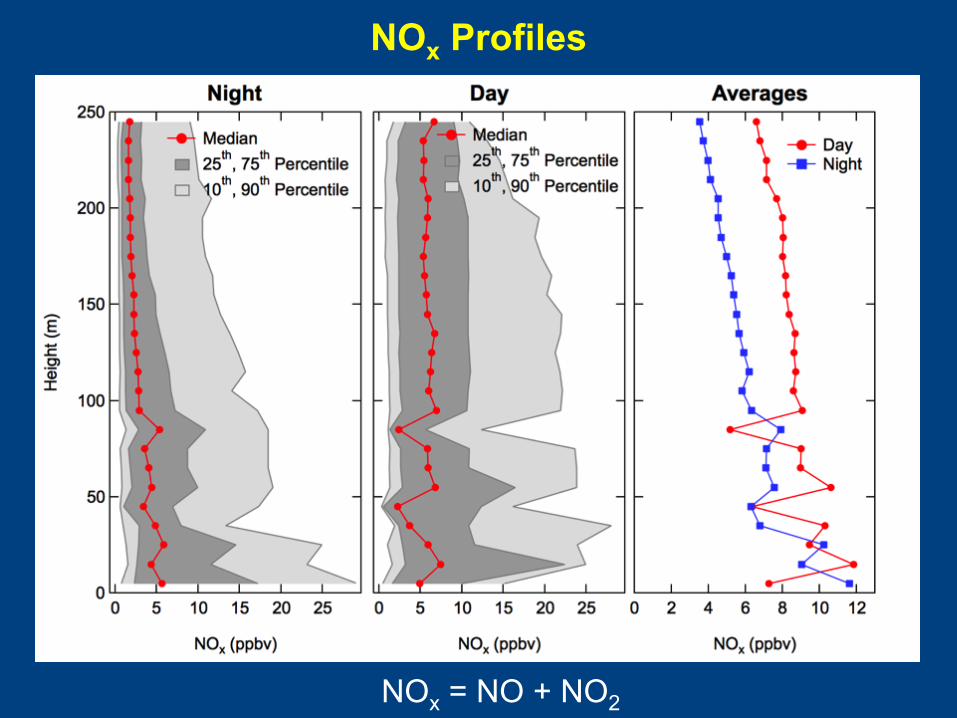
NOx Profiles
NOx = NO + NO2
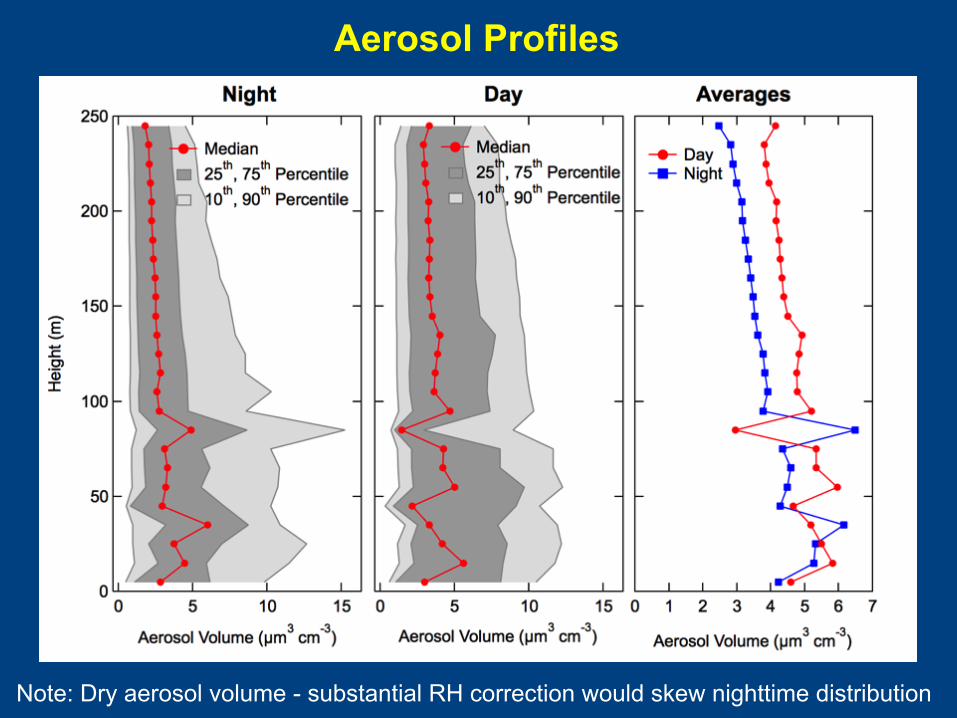
Aerosol Profiles
Note: Dry aerosol volume - substantial RH correction would skew nighttime distribution

NOx vs. Wind Direction
• Westerly (downslope) flow observed both day and night, uniformly warm • Night has: SW (warm), SE (cooler) and NE (cold) sectors
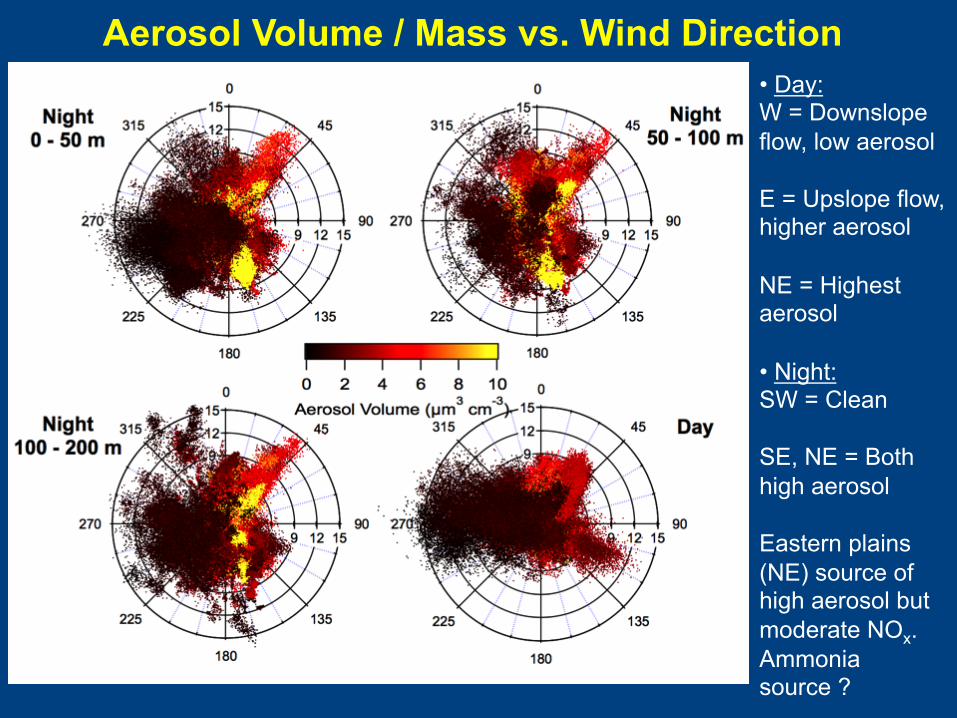
Aerosol Volume / Mass vs. Wind Direction • Day: W = Downslope flow, low aerosol E = Upslope flow, higher aerosol NE = Highest aerosol • Night: SW = Clean SE, NE = Both high aerosol Eastern plains (NE) source of high aerosol but moderate NOx. Ammonia source ?
VOC inlet
VOC trailer
~8 m
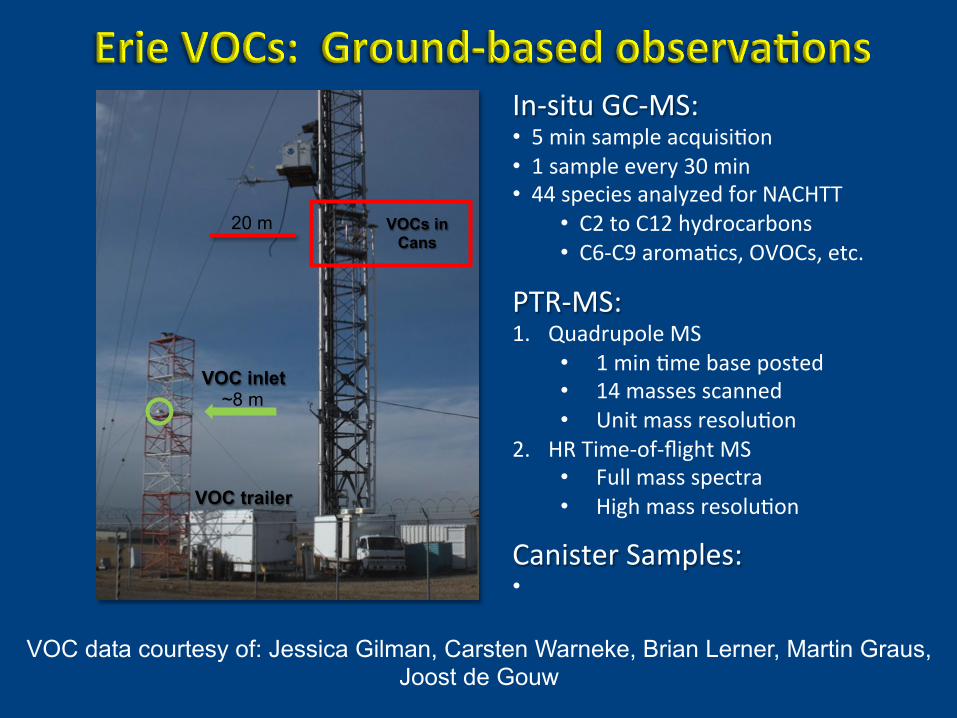
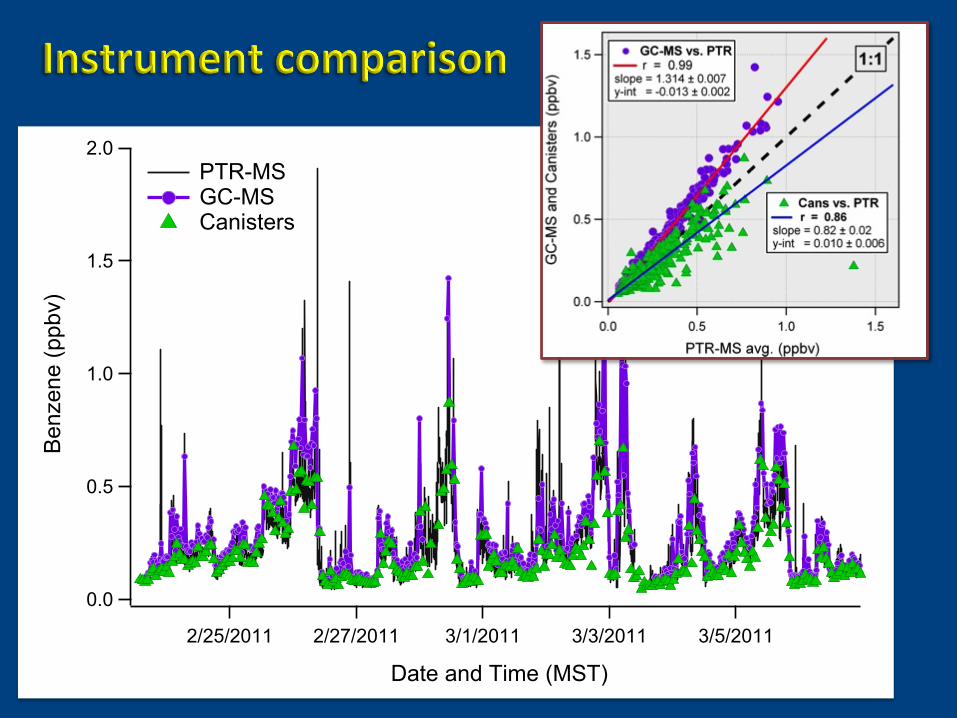
In-‐situ GC-‐MS: • 5 min sample acquisi6on • 1 sample every 30 min • 44 species analyzed for NACHTT
• C2 to C12 hydrocarbons • C6-‐C9 aroma6cs, OVOCs, etc.
PTR-‐MS: 1. Quadrupole MS
• 1 min 6me base posted • 14 masses scanned • Unit mass resolu6on
2. HR Time-‐of-‐flight MS • Full mass spectra • High mass resolu6on
VOCs in Cans
20 m
Canister Samples: • Discrete samples once an hour
VOC data courtesy of: Jessica Gilman, Carsten Warneke, Brian Lerner, Martin Graus, Joost de Gouw
2.0
1.5
1.0
0.5
0.0
Ben
zene
(ppb
v)
2/25/2011 2/27/2011 3/1/2011 3/3/2011 3/5/2011
Date and Time (MST)
PTR-MS GC-MS Canisters

0.001
0.01
0.1
1
10
100
Mix
ing
Rat
io (p
pbv)
Etha
nePr
opan
en-
Buta
nei-B
utan
en-
Pent
ane
i-Pen
tane
n-H
exan
en-
Hep
tane
Cyc
lope
ntan
en-
Oct
ane
n-N
onan
en-
Dec
ane
n-U
ndec
ane
Tolu
ene
Benz
ene
m&p
-Xyl
enes
o-Xy
lene
Benz
ene_
1eth
ylBe
nzen
e_13
5trim
ethy
lEt
hene
Prop
ene
Styr
ene
Isop
rene
Ethy
ne
Average Mixing Ratio ± St. Dev.
C2-‐C12 Alkanes
Aroma0cs
Alkenes
Average Mixing Ra0o ± Std. Dev.
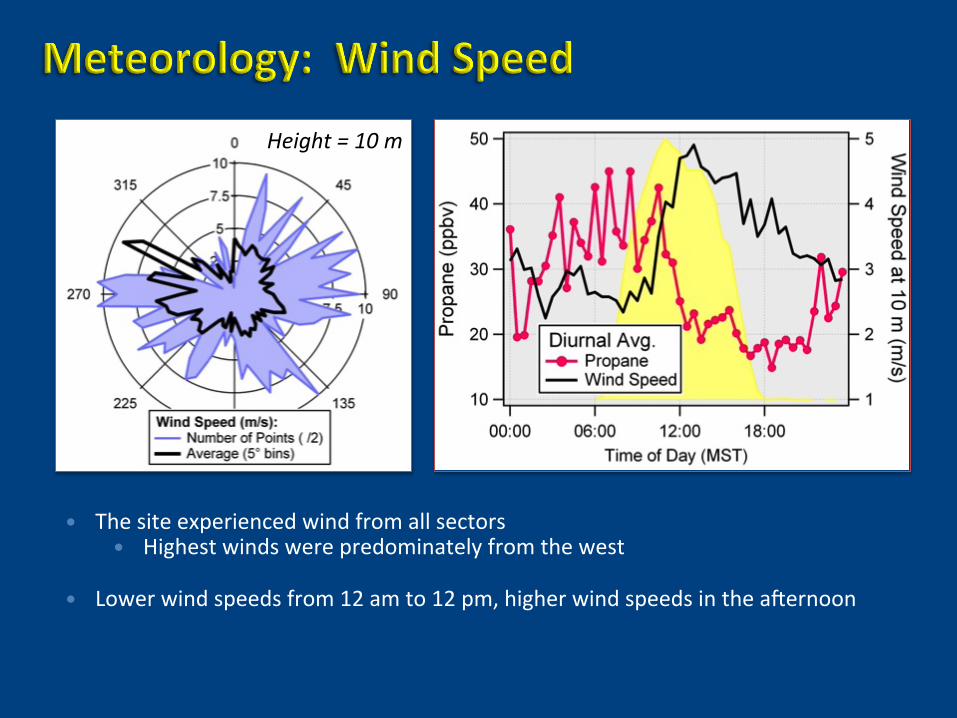
The site experienced wind from all sectors Highest winds were predominately from the west
Lower wind speeds from 12 am to 12 pm, higher wind speeds in the aZernoon
Alkane mixing ra6os generally an6-‐correlate with local wind speeds
Height = 10 m
-0.4 -0.2 0.0 0.2 0.4
Ethane
Propane
n-Butane
i-Butane
n-Pentane
i-Pentane
Cyclopentane
n-Hexane
n-Heptane
n-Octane
Benzene
n-Nonane
Toluene
m&p-Xylenes
n-Decane
n-Undecane
o-Xylene
Benzene_1ethyl
Benzene_vinyl (Styrene)
Benzene_135trimethyl
Ethene
Propene
Ethyne
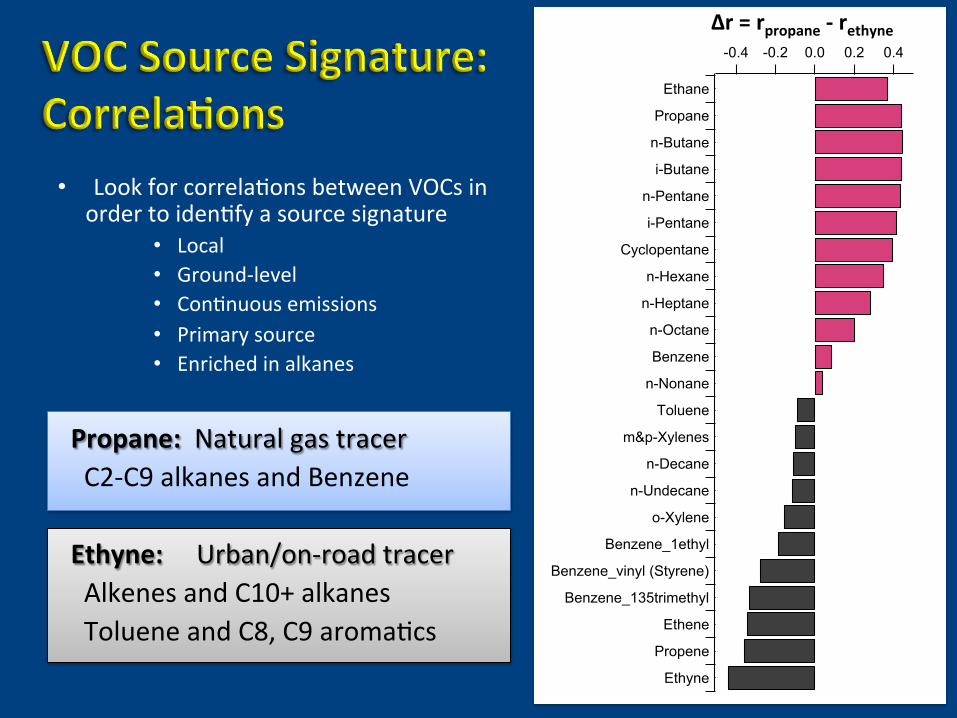
• Look for correla6ons between VOCs in order to iden6fy a source signature
• Local • Ground-‐level • Con6nuous emissions • Primary source • Enriched in alkanes
Propane: Natural gas tracer C2-‐C9 alkanes and Benzene
Ethyne: Urban/on-‐road tracer Alkenes and C10+ alkanes Toluene and C8, C9 aroma6cs
Δr = rpropane -‐ rethyne
60
40
20
0
Num
ber o
f Occ
uran
ces
1 10 100Propane (ppbv)
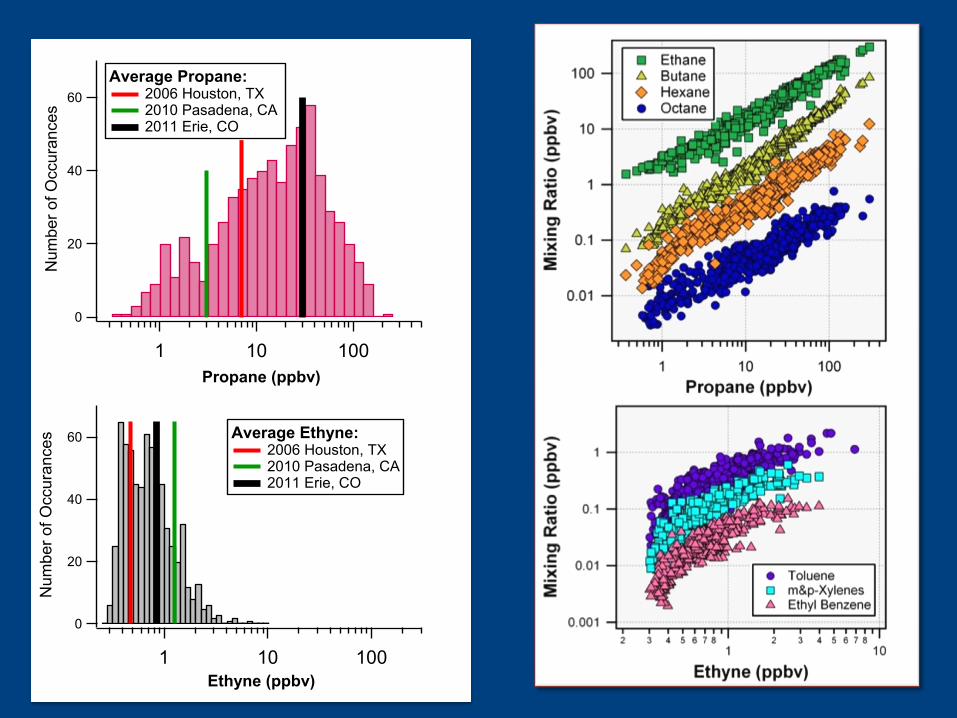
Average Propane: 2006 Houston, TX 2010 Pasadena, CA 2011 Erie, CO
60
40
20
0
Num
ber o
f Occ
uran
ces
1 10 100Ethyne (ppbv)
Average Ethyne: 2006 Houston, TX 2010 Pasadena, CA 2011 Erie, CO
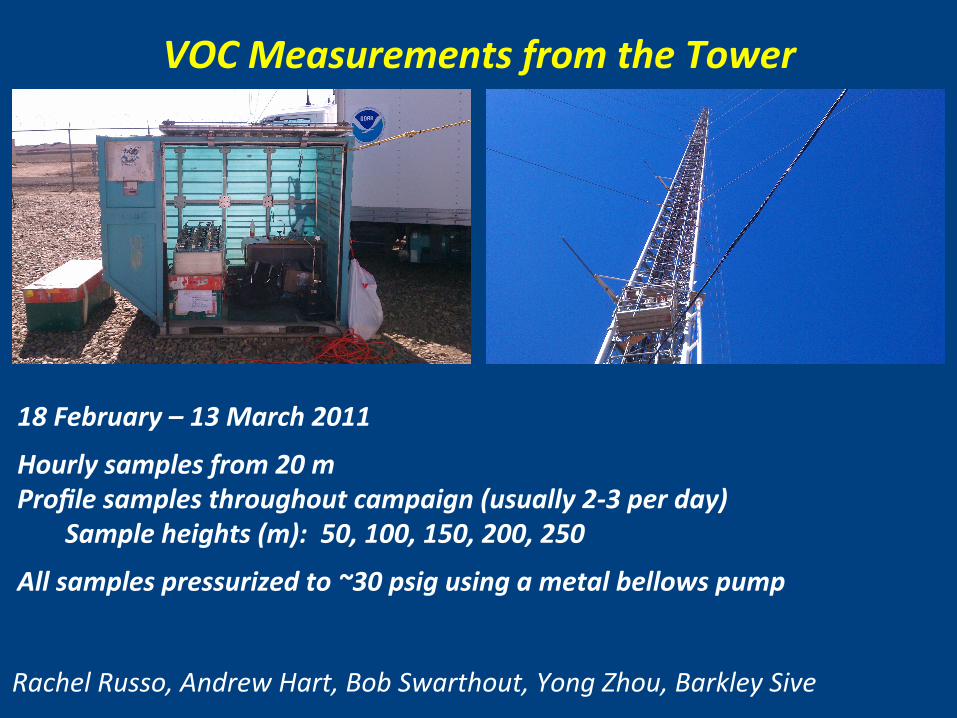
Rachel Russo, Andrew Hart, Bob Swarthout, Yong Zhou, Barkley Sive
VOC Measurements from the Tower
18 February – 13 March 2011
Hourly samples from 20 m Profile samples throughout campaign (usually 2-‐3 per day)
Sample heights (m): 50, 100, 150, 200, 250
All samples pressurized to ~30 psig using a metal bellows pump

0
5000
10000
15000
20000
25000
30000
35000
0
5000
10000
15000
20000
25000
30000
35000
N
NW
W
SW
S
SE
E
NE
ethanepropanen-butane
0
100
200
300
400
500
600
700
800
0
100
200
300
400
500
600
700
800
N
NW
W
SW
S
SE
E
NE
etheneethynetoluene
Wind Rose Mean mixing ra6os in 45o wind sectors
Oil and Gas Urban
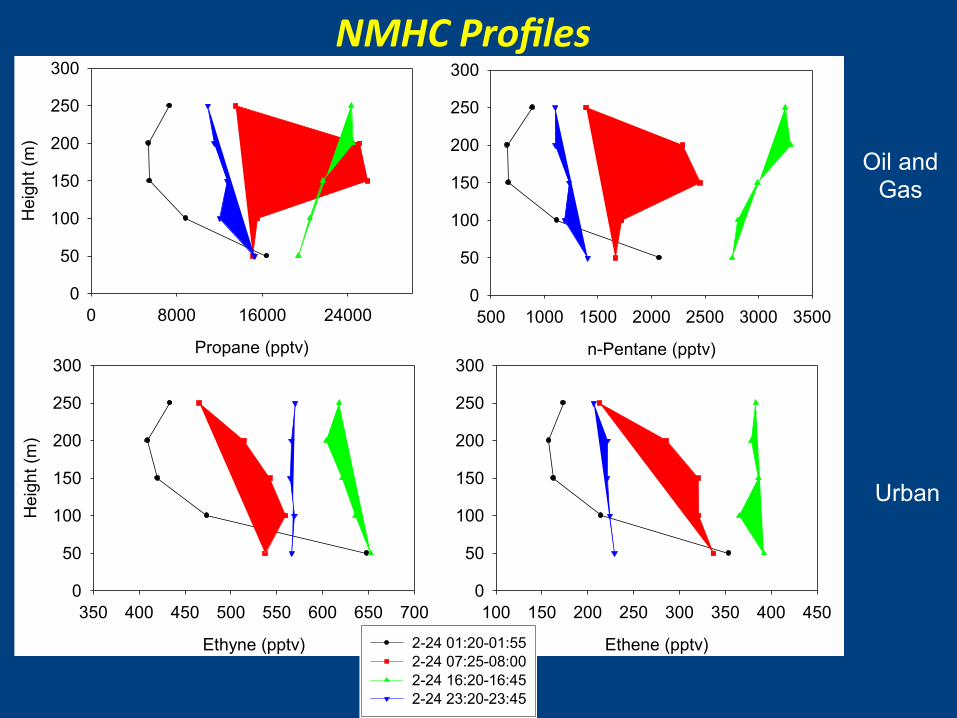
Propane (pptv)
0 8000 16000 24000
Hei
ght (
m)
0
50
100
150
200
250
300
2-24 01:20-01:552-24 07:25-08:002-24 16:20-16:452-24 23:20-23:45
Ethene (pptv)
100 150 200 250 300 350 400 4500
50
100
150
200
250
300
Ethyne (pptv)
350 400 450 500 550 600 650 700
Hei
ght (
m)
0
50
100
150
200
250
300n-Pentane (pptv)
500 1000 1500 2000 2500 3000 35000
50
100
150
200
250
300
2-24 01:20-01:552-24 07:25-08:002-24 16:20-16:452-24 23:20-23:45
NMHC Profiles
Oil and Gas
Urban
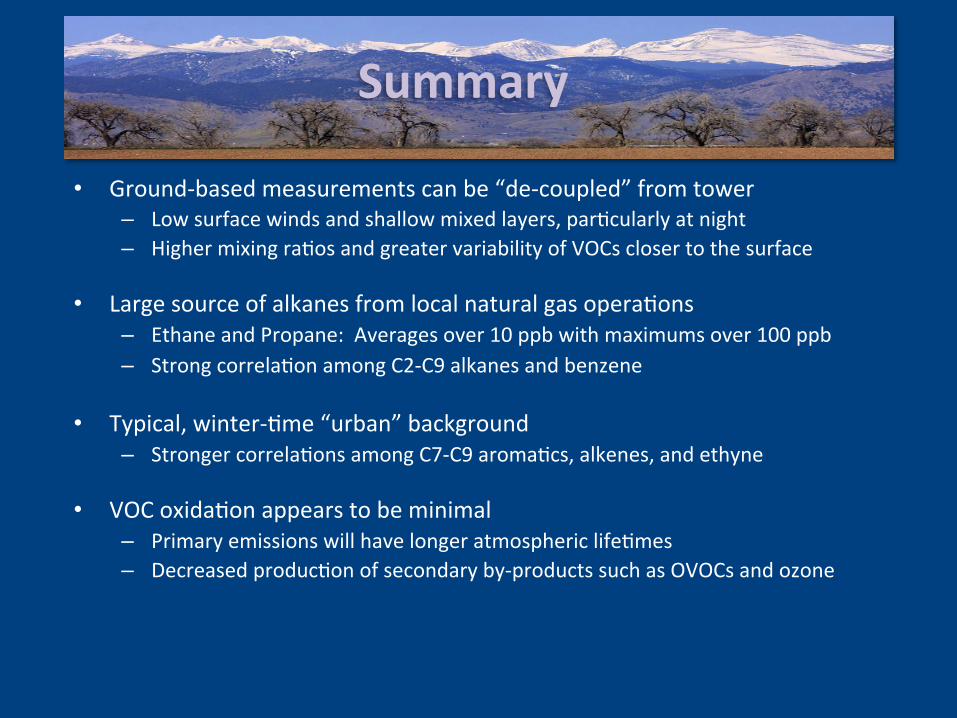
Summary
• Ground-‐based measurements can be “de-‐coupled” from tower – Low surface winds and shallow mixed layers, par6cularly at night – Higher mixing ra6os and greater variability of VOCs closer to the surface
• Large source of alkanes from local natural gas opera6ons – Ethane and Propane: Averages over 10 ppb with maximums over 100 ppb – Strong correla6on among C2-‐C9 alkanes and benzene
• Typical, winter-‐6me “urban” background – Stronger correla6ons among C7-‐C9 aroma6cs, alkenes, and ethyne
• VOC oxida6on appears to be minimal – Primary emissions will have longer atmospheric life6mes – Decreased produc6on of secondary by-‐products such as OVOCs and ozone