DOCUMENT RESUME ED 392 783 SP 036 532 · PDF fileIn addition to an analysis of this ......
106
DOCUMENT RESUME ED 392 783 SP 036 532 TITLE The American Teacher, 1984-1995, Metropolitan Life Survey. Old Problems, New Challenges. INSTITUTION Harris (Louis) and Associates, Inc., New York, N.Y. SPONS AGENCY Metropolitan Life Insurance Co., New York, N.Y. PUB DATE 95 NOTE 106p. AVAILABLE FROM MetLife, The American Teacher Survey, P.O. Box 807, Madison Square Station, New York, NY 10159-0807. PUB TYPE Statistical Data (110) Reports Research/Technical (143) Tests/Evaluation Instruments (160) EDRS PRICE MF01/PC05 Plus Postage. DESCRIPTORS Educational Change; Educational Environment; Elementary Secondary Education; *Job Satisfaction; National Surveys; Public Education; *Public School Teachers; Rural Education; Rural Urban Differences; Suburban Schools; *Teacher Attitudes; Teacher Burnout; *Teacher Morale; Teacher Persistence; *Teaching (Occupation); *Teaching Conditions; Urban Teaching IDENTIFIERS *Teacher Satisfaction ABSTRACT During the past.decade there have been considerable efforts to reform the American public school system. This survey, based on 15-minute telephone interviews with a nationally representative sample of 1,011 public school teachers in the United States, duplicates the sampling and interviewing process used in a similar study in 1984 and 1985. In addition to an analysis of this year s findings, the survey looks at how teachers views and experiences have changed in the past decade. The topics addressed in five chapters include: (1) American teathers' job satisfaction; (2) quality of public schools; (3) strengthening the profession; (4) reasons for teachers considering leaving teaching; (5) reasons why tPachers stay; and (6) a demographic profile of the American teacher. Findings reveal many significant changes in the teaching profession in the past ten years. Although many teachers still believe they lack support from parents and community members, their outlook has changed considerably with regard to personal satisfaction with their career choice, and their pay has steadily improved. However, teachers are still confronted with many of the same societal problems they faced a decade ago, such as inadequate public funding and a lack of parental and community support. Additional problems identified include overcrowded classrooms, alcohol consumption among teens, and the level of.violence in ant around public schools. Findings also suggest that teachers opinions ami experiences are not uniform. Teachers in suburban and rural areas have generally seen improvements in their work environments and the recognition they receive, improved public and parental support, and a decline in the number of students lacking basic skills, teenage suicides, and student absenteeism. Urban teachers have seen their conditions worsen, and are less likely to say they feel respected and recognizqd for good performance, and are also less positive in their assessment of the curriculum in their schools, academic standards, and the level of funding their schools receive. Data are presented in data tables. A detailed survey methodology is provided in Appendix A; the.questionnaire showing marginal frequencies for all questions appears in Appendix B. (ND)
Transcript of DOCUMENT RESUME ED 392 783 SP 036 532 · PDF fileIn addition to an analysis of this ......

DOCUMENT RESUME
ED 392 783 SP 036 532
TITLE The American Teacher, 1984-1995, Metropolitan LifeSurvey. Old Problems, New Challenges.
INSTITUTION Harris (Louis) and Associates, Inc., New York,N.Y.
SPONS AGENCY Metropolitan Life Insurance Co., New York, N.Y.PUB DATE 95NOTE 106p.AVAILABLE FROM MetLife, The American Teacher Survey, P.O. Box 807,
Madison Square Station, New York, NY 10159-0807.PUB TYPE Statistical Data (110) Reports
Research/Technical (143) Tests/EvaluationInstruments (160)
EDRS PRICE MF01/PC05 Plus Postage.DESCRIPTORS Educational Change; Educational Environment;
Elementary Secondary Education; *Job Satisfaction;National Surveys; Public Education; *Public SchoolTeachers; Rural Education; Rural Urban Differences;Suburban Schools; *Teacher Attitudes; TeacherBurnout; *Teacher Morale; Teacher Persistence;*Teaching (Occupation); *Teaching Conditions; UrbanTeaching
IDENTIFIERS *Teacher Satisfaction
ABSTRACTDuring the past.decade there have been considerable
efforts to reform the American public school system. This survey,based on 15-minute telephone interviews with a nationallyrepresentative sample of 1,011 public school teachers in the UnitedStates, duplicates the sampling and interviewing process used in asimilar study in 1984 and 1985. In addition to an analysis of thisyear s findings, the survey looks at how teachers views andexperiences have changed in the past decade. The topics addressed infive chapters include: (1) American teathers' job satisfaction; (2)quality of public schools; (3) strengthening the profession; (4)
reasons for teachers considering leaving teaching; (5) reasons why
tPachers stay; and (6) a demographic profile of the American teacher.Findings reveal many significant changes in the teaching professionin the past ten years. Although many teachers still believe they lacksupport from parents and community members, their outlook has changedconsiderably with regard to personal satisfaction with their careerchoice, and their pay has steadily improved. However, teachers arestill confronted with many of the same societal problems they faced adecade ago, such as inadequate public funding and a lack of parentaland community support. Additional problems identified includeovercrowded classrooms, alcohol consumption among teens, and thelevel of.violence in ant around public schools. Findings also suggestthat teachers opinions ami experiences are not uniform. Teachers in
suburban and rural areas have generally seen improvements in theirwork environments and the recognition they receive, improved publicand parental support, and a decline in the number of students lacking
basic skills, teenage suicides, and student absenteeism. Urbanteachers have seen their conditions worsen, and are less likely tosay they feel respected and recognizqd for good performance, and are
also less positive in their assessment of the curriculum in theirschools, academic standards, and the level of funding their schools
receive. Data are presented in data tables. A detailed survey
methodology is provided in Appendix A; the.questionnaire showing
marginal frequencies for all questions appears in Appendix B. (ND)

cNeN
Old Problems,New Challenges
U S DEPARTMENT OF EDUCATIONoffice o Educational Research and ,,nrovernont
EDUCATIONAL RESOURCES INFORMATIONCENTER (ERIC)
O This document has been reproduced asreceived from the person or organizationoriginating it
Minor changos have been made toimprove reproduction quality
_ -
Points of view or opinions stated ui thisdocument do not necessarily representofficial OERI position cr policy
"PERMISSION TO REPRODUCE THISMATERIAL HAS BEEN GRANTED BY
'74
TO THE EDUCATIONAL RESOURCESINFORMATION CENTER (ERIC)
MetLifd
0BEST COPY AVALABLE

Surveys in this Series
This report is the 15th in a series of surveys that explores teachers' opinions and brings them to
the attention of the American public and policy makers.
The Metropolitan Life Survey of the American Teacher, 1984 analyzes attitudes of elemen-tary and secondary school teachers toward both public education in the United States and educa-
tional reform. (Out of print)
The Metropolitan Life Survey of the American Teacher, 1985: Strengthening the Profession
examines teachers' own agenda for educational reform. (Out of print)
The Metropolitan Life Survey of the American Teacher, 1986: Restructuring the TeachingProfession explores the current structure of the teaching profession and ways to restructure it.(Executive summary available)
Tke Metropolitan Life Survey of Former Teachers in America, 1986 reflects the views of those
who left the teaching profession for other occupations. (Out of print)
The Metropolitan Llfe Survey of the American Teacher, 1987: Strengthening Links Between
Home and School includes the views of parents of America's schoolchildren and reveals how par-
ents and teachers are united in their commitment to educating America's youth. (Out of print)
The Metropolitan Life Survey of the American Teacher, 1988: Strengthening the RelationshipBetween Teachers and Students includes the views of students in grades 4-12, and also focuses on
minority teachers' satisfaction with teaching and ways to increase their participation in theprofession. (Executive summary available)
The Metropolitan Life Survey of the American Teacher, 1989: Preparing Schoolsfor the 1990s
looks back at the changes in education through the 1980s and looks ahead to the changos teachers
say would improve education.
The Metropolitan Life Survey of the American Teacher, 1990, New Teachers: Expectationsand Ideals Part I Entering the Classroom examines the views of first-time teachers entering the
classroom in the fall of 1990.
17te Metropolitan Life Survey of the American Teacher, 1991, The First Year: New Teachers
Expectations and IdeaLs returns to the cohort of new teachers who entered the classroom in thefall of 1990 and gauges their attitudes as they conclude their first year in the classroom.
The Metropolitan Life Survey of the American Teacher, 1992. The Second Year: New Teachers'
Expectations and Ideals revisits the new teachers after completing two years of teaching in America's
classrooms.
The Metropolitan Life Survey of the American Teacher, 1993, Teachers Respond to PresidentClinton's Education Proposals provides valuable insight into what teachers believe needs to be
done to make our schools safe and productive places for learning.
The Metropolitan Life Survey of tlw American Teacher, 1993, Violence in America's Public
Schools illustrates the concerns of teachers, students and law enforcement officers across the
country, about the increasing violence and fears of violence in their schools.
The Metropolitan Life Survey of the American Teacher, 1994, Violence in America's PublicSchools: The Family Perspective examines the contrasting views of parents and students about what
goes on in and around the school building.
(Continued on inside back cover)

Thje Metrop6ii tanlife7SV-rvey df
A A k11,
Old Problems, New Challenges
Fiel(hvork: NlaN 4 ti) une I I, 14 5
Conducted forMetropolitan Life Insurance Company
by
Louis Harris and Associates, Inc.
Project Directors:Robert Leitman, Executive Vice President
Katherine Binns, Senior Vice PresidentAnn Duffett, Research Director
LOUIS HARRIS AND ASSOCIATES, INC.
111 Fifth Avenue
New York, New York 10003
(212) 539-9600
4

.1HE
AMERICAN(l'ACH ER
FOREWORD FROM METLIFE
"If we as a nat ion t ruly want public education, we must pay more attention to the
needs and concerns of our teachers. They must be an integral part of any effort toattain a higher level of educational excellence." This was part of MetLife's foreword
in the first American teacher survey. For 12 years, and 15 surveys, we have stayed
with our commitment to listen to teachers on matters that concern their students
and profession.The Metropolitan Life Surrey of the American Teacher, 1984-1995: Old
Problems, New Challenges revisits concerns addressed by our first survey, in anattempt te find out whether the educational system has changed after years of inten-
sive reform efforts. In 1985, teachers who had considered leaving the profession
most often cited their satisfaction in seeing children grow (63%) and love of teach-
ing (39%) as their reasons for staying in teaching. Today, these reasons are still cited
most often, but by significantly smaller percentages 40% and 29% respectively.
Are teachers' views different from those in 1984? Has the classroom or school build-
ing undergone the change that many had hoped for? How much progress have we
as a nation made? Clearly, this survey does not have all the answers. It does, how-
ever, underscore the significance of reaching out to teachers, students and parents
for their leadership in meeting the challenge of improving our schools.MetLife acknowledges Louis Harris and Associates for its faithful commitment
to The Metropolitan Life Surrey of the American Teacher for the past 12 years.

TABLE OF CONTENTS
INTRODUCTION 1
Surrey Method 1
Comparability Of Trend Bata
Notes on Reading Mb les
Public Release of Survey Findings 2
Project Responsibility and Acknowledgements .
EXECUTIVE SUMMARY ...3
The Major Findings 4
1. Satisfactim, With the Mach ing Proj'etisi011 5
IL Teachers liews on tlw Quality off:ducat ion 6
III. Strengthening the PrOfffsion 7
IV Coafronting the Challenges of Teach i ng 7
V Comparing Teaching co Other Professions 8
CHAPTER 1: THE JOB SATISFACTION OF THEAMERICAN TEACHER 9
Satisfaction With the Teaching Profession Has Increased in Ten . 9
Attitudes Award Specific Aspects of Job Satisfaction 12
Attitudes Mward Specific Aspects of Their Profession 14
CHAPTER 2: EVALUATING THE QUALITY OF PUBLIC SCHOOLS 19
Overall Quality of Education 19
Rating Their Schools on Specific Educational Issues... .20
Problems Teachers Face in Their Schools 24
Budget and Iklbrm Issues. 32
Teachers'17ews qf Immigration Legislation (Proposition 187) 34
Strengthening the Quality of Education 35
CHAPTER 3: STRENGTHENING THE PROFESSION. .. 41
Establishing Standards 41
Evaluating Suggested Changes fbr Improving the Profission 43
CHAPTER 4: WHY TEACHERS THINK ABOUT LEAVING . . 47
Who Thinks of Leaving Teaching . ............. 47
The Impact of Job Stirss on Leaving Teaching 53
Reasons Teachem Citefir Thinking About Leaving .. 59
CHAPTER 5: WHY TEACHERS STAY IN TEACIHNG .. 61
Comparing Teaching With Other Professions . ..61
Reasons Thaebers Decide to Stay in Machina .61
( continual I

TABLE OF CONTENTS (continued)
CHAPTER 6: PROFILE OF THE AMERICAN TEACHER: 1995 AND 1984 65
Teaching Erperience. 65
A Teacher's Wick MTh.. .... . ................ 65
Demogmph lc Prigilc.. 69
APPENDIX A: METHODOLOGY. 75
Sample Disposil ion and Complet ion Ratesfin. Mockers . 75
CATI System Used in Interviews . 79
Reliability id So row Percentages . .79
APPENDIX B: THE QUESTIONNAIRE 8,3
7

INDEX OF TABLES
CHAPTER 1: THE JOB SATISFACTION OF THEAMERICAN TEACHER
1-1 Machers Overall Job Satisfaction ... . 10
1-2 Teachers' Satisfaction With Packing as Career:By Gender and Job Stress 11
1-3 The Things Teachers Like .Vost About Their Jobs 13
14 Teachers' Altitudes Thward Specific Aspects of Job Satisfaction . 16
1-5 Teachers' Attitudes Award Specific Averts of Job Satisfaction:By Region and Size qf Place 17
1-6 Teachers' Attitudes Thward Specific Aspects ofJob Satisfaction:By 7)/pe of School. Evperience, and Gender . 18
CHAPTER 2: EVALUATING THE QUALITY OF PUBLIC SCHOOLS
2-1 Teachers' Overall Ratings of Their Schools 19
2-2 Teachers' Ratings of Their Schools on Specific Educational A.s.rws 21
2-3 Teachers' Ratings of Their Schools on Specific Educational Issues:By Region and Size of Place 22
24 Teachers' Ratings of Their Schools on Specific Educational Issues:By Type of School. Experience, and Gender . 23
2-5 Teachers Evaluate Problems in the Schools 28
2-6 Teachers Evaluate Problems in the Schools: By Size of Place . 29
2-7 Teachers Evaluate Problems in the Schools:By Region 30
2-8 Teachers Evaluate Problems in the Schools:By Thpe of School and Ezperience 31
2-9 Attitudes About Fund Allocation.
2-10 Attitudes About Fund Allocation:By Regicn and Size of Place 33
2-11 Attitudes About Fund Allocation:By Type of School, Years of Experience. and Gender 33
2-12 Effect of Proposition 187 on Ability to Teach .34
2-13 Whether Suggested Changes [fill Hale a Positive Effecton Education in General 37
2-14 Whether Suggested Changes Will Have a Positive Effecton Education in General: By Region and Size of Place . .38
2-15 Whether Suggested Changes Will Have a Positive Effecton Education in General: By 7)jpe of School.Experience. and Gender 39
CHAPTER 3: STRENGTHENING THE PROFESSION
3- I Views on Establishing Standards.fi)r the Teaching Proli,ssion .. 42
3-2 Ube Ilwr Suggested Changes Will Have a Positive Eyed on theQuality of :Pilch lug .
44

INDEX OF TABLES (continued)
3-3 1f7irther Suggested Changiw Will Haw a Positive Effect on theQuality of Teaching: By Region and Size of Place 45
34 nether Suggested Changes UV! Have a Posit i re 1; (feet on theQuality of li,aching: By Type qlSchool, Experience. and Gender . .46
CHAPTER 4: WHY TEACHERS THINK ABOUT LEAVING
4-1 Who Thinks About Leaving Mach ing: By Region .. 48
4-2 Who Thinks About Leaving Teaching: Bll Size of Place. 49
4-3 Who Thinks About Leaving Teaching: By Type of School
44 Pio Thinks About Leaving Teach ing:By Elperience and Gender
4-5 Maehers Rho Think About Leaving Teaching:By Degree of Career Satisfaction
.
4-6 Teachers Who Think About Leaving kaching:By Frequency of Job Stress 54
4-7 Teachers and Job Stress: By Region 55
4-8 Teachers and Job Stress: By Size of Place 56
4-9 kachers and Job Stress: By Type of School and Experience 57
4-10 Teachers and Job Stress: By Seriousness of a7bp Problem in Their School 58
4-11 What Makes Teachers Think About Leaving 60
CHAPTER 5: WHY TEACHERS STAY IN TEACHING
5-1 1985 Teachers Compare Teaching Prsus Other Occupations .........
5-2 1995 Teachers Compare Teaching Prsus Other Occupations 63
5-3 Reasons Teachers Decide to Stay in Teaching 64
CHAPTER 6: PROFILE OF THE AMERICAN TEACHER:1995 AND 1984
6-1 Distribution of Teachers By li,ars Thught 66
Number of Hours per Pek Spent w,School-Related Responsibilities 67
6-3 Distribution of Teachers By Hours ithrked 68
6-4 Distribution of Teachers By Gender 70
6-5 Distribution of Teachers By Aye 71
6-6 Distribution of Teachers By Household Income 72
6-7 Distribution of Teachers By Rare
6-8 Distribution of Teackrs 13y Race and Size of Place. . . 74
6-9 Distribution of Teachers By Mpe qrSehoolTheir Children A t t en d ( ed ).... 74

INDEX OF TABLES (continued)
APPENDIX A: METHODOLOGY
A-1 Final Sample Disposition 77
A-2 Distribution qf the Sample of Teachers .. 78
A-3 Approximate Sampling Thlerances ( at 951', Confidence ) to use inEvaluating Porentage Results Appearing in this 1?eport . . . 80
A4 Approximate Sampling blerances (at 95T Confidence ) to use inEvaluating Differences Between Pro Avrei tage ResultsAppearing in this Report 82

ffrie
'AMERICANT6ACIIER
INTRODUCTION
This is the latest in a series of surveys sponsored by Met Life that focuses on the
experiences and opinions of the American teacher. It represents a sustained pro-gram of research designed to bring teachers opinions to the attention of the edu-cation community and the American public. This is the fifteenth survey in the series,
and year twelve of a long-standing partnership between Met Life and Louis Harris
and Associates, Inc.In part. t he Surrey of the American Teacher. 1984-1995: Old Problems, New
Challenges revisits ideas and concerns addressed a decade ago in the earliestMetLife Surveys of the American Teacher. in its simplest terms the survey asks, "flow
has the educational system changed after ten years of heightened public attention
and concern?" During the past decade there have been considerableefforts to reform
the American public school system. Although it appears to have improved in some
regards, the system as a whole does not seem to have progressed and teachers today
face many new problems and challenges.The survey looks at relatively new concerns like the growth of violence in schools,
and at long-standing issues like funding and efforts to strengthen the profession. In
addition to an analysis of this year's findings, the survey looks at how teachers' views
and experiences have changed in the past decade. The topics addressed include:
An overall evaluation of American public schools.
Satisfaction with teaching, and the factors that contribute to teachers' level
of satisfaction with their profession.
Problems teachers encounter in school such as overcrowding, absenteeism,
drug abuse and a lack of basic skills.
An assessment of policy options designed to improve the educational system
and the teaching profession.
Teachers' assessments of teaching compared to other occupations they may
have considered.
A demographic profile of the American teacher.
Survey Method
The survey is based on 15-minute telephone interviews with a nationally repre-
sentative sample of 1,011 public school teachers. All interviewing was completed
between May 4 and June 11, 1995. This year's sampling and interviewing processes
duplicate t he methods used in the 1984 and 1985 studies. A detailed survey method-
ology is provided in Appendix A. The questionnaire showing marginal frequencies
for all questions, in percent terms, appears in Appendk B.

111
AME.RIcANloctiER
2
Comparability of Trend Data
This year's sampling and interviewing processes duplicate the methods used inThe American Teacher 1984, The American Macher 1985: Strengthening the
Profession, The American Teacher 1989: Preparing Schootsfor the 1990s. For
t he purposes of this report. all references to changes that have occurred in teach-
ing over the past decade refer to the findings in the 1984 and 1985 reports.
Notes on Reading Tables
An asterisk (*) on a table signifies a value of less t han one-half percent (0.5%).
A dash (-) represents a value of zero. Percentages may not always add up to 100%
because of computer rounding or the acceptance of multiple answers from respon-dents. The base for each question is the total number of respondents answering that
quest ion.
Public Release of Survey Findings
All Louis Harris and Associates, Inc. surveys are designed to adhere to the code
of standards of the Council of American Survey Research Organizations (CASRO)
and the code of the National Council of Public Polls (NCPP). Because data from the
survey may be released to the public, any release must stipulate that the complete
report is also available.
Project Responsibility and Acknowledgements
The Harris team responsible for the design and analysis of thequestionnaire was
Robert Leitman, Executive Vice President, Katherine Binns, Senior Vice President,
and Ann Duffett, Research Director. Louis Harris and Associates gratefully acknowl-
edges the contributions to this project of our colleagues at MetLife.
Louis Harris and Associates, Inc. is responsible for the final determination of the
topics, question wording, collection of the actual data, and analysis and interpre-
tation in the report.
1 2

ItitAMERICAN.Tocnr
EXECUTIVE SUMMARY
America's public school teachers report many significant changes in their pro-fession since the first Metropolitan Life Survey of the American Teacher was con-
ducted in 1984 some for the better and some making things worse. More than a
decade ago, the great majority of American teachers felt beleaguered by a lack of
respect and inadequate financial support. Although manyteachers still believe they
lack support from parents and community members, their outlook has changed con-siderably with regard to personal satisfaction with their career choice, and theirpay has steadily improved. Teachers are nearly twice as likely today as they were in
1984 to say their jobs permit them to earn a decent salary. Yearly increases during
the past decade have been relatively consistent; this is fairly unique, as manyotherprofessional groups experienced sizable increases in the late 1980s, which have lev-
eled off in the 1990s.Many teachers believe aspects of the public school system have improved con-
siderably over the past ten years. For example, where only one-fourth of teachers
believed their own schools had excellent academic standards a decade ago, fully
two in five assess their schools* academic standards as excellent in 1995. Today, a
majority believe the quality of the teachers in their schools is excellent; in 1984,
only two in five teachers felt this way about their colleagues.However, teachers are still confronted with many of the same societal problems
they faced a decade ago, such as inadequate public funding and a lack ofparental and community support. Many teachers believe that overcrowded class
rooms and alcohol consumption among teens are more serious problems today
than they were in 1984. They are also concerned about the level of violence in
and around public schools and about the numbers of students carrying weapons
to school; two in five and one in four teachers, respectively, say these are at least
somewhat serious problems.It is also important to note that teachers' opinions and experiences are not uni-
form. Unfortunately, while teachers in suburban and rural schools have generally
seen improvements in their work environments and in the recognition they receive,
the same cannot be said for urban public school teachers. While rural and subur-
ban teachers generally believe they have seen a decline in the number of students
lacking basic skills, in the number of teenage suicides, and in student absenteeism,
urban teachers believe these problems have worsened. Urban teachers are least
likely to say they feel respected in today's society, recognized for good performance
or rewarded with decent salaries. They are also less positive in their assessment of
the curriculum in their schools, academic standards and the level offunding their
schools receive. While suburban and rural teachers believe that public and parental
support. for their schools has improved somewhat. in the past decade, urban teach-
ers believe it has declined considerably. As such, it is not surprising that urban teach-
ers are more often dissatisfied with their careers.
'Bureau of Labor Statistics from Census Bureau data
r> 3

?fHE
AmeRicANTOCIIER
4
But even wit h t hese continuing challenges the overwhelming majority of teach-
ers in all communit ies remain committed to their profession, because they valueworking with children and they love to teach. Overall, teachers today express a greatdeal more personal satisfact ion with their jobs, and they are much more likely to
say they would recommend teaching as a profession. This level of commitment isreflected in the teacher population itself: in 1984 one in four teachers had at least
twenty years experience and in 1995 this proportion has increased to more than two
in five teachers.But these shifts also reflect the past decade's larger economic and societal changes.
It is not entirely surprising to see teachers preferring to remain in an environmentthey believe is secure and rewarding at the end of a decade that has been marked
by economic recession, growing uncertainty in the private sector and the advent, of
corporate downsizing. As a result, not only are today's teachers more experienced,
they are also older and less likely to consider leaving teaching for other career oppor-tunities. What remains to be seen is whether or not the quality of educationwill be
affected positively or negatively by this new environment and the ever-grow-
ing established population of older, more experienced teachers.
The Major Findings
I. Satisfaction With the Teaching Profession
1. Overall, teachers today express a great deal more personal satisfaction withtheir jobs than they did eleven years ago, and they are much more likely to
say they would recommend teaching as a prgfession.
In 1985, 44% of teachers were very satisfied with their career choice; in 1995,
the percentage has increased to 54%.
Today, fully two-thirds of teachers would recommend a career in teaching to
a young person, in 1984 only two in five teachers would have given that rec-
ommendation. This is equally true for teachers across the nation, regardless
of their school location urban, suburban or rural.
2. Teachers are nearly twice as likely today as they were in 1984 to say theirjobspermit them to earn a decent salary and they are more likely to say they feel
recognized for good peiformance.
Three in five teachers agree either strongly (17%) or somewhat (46%) that
their jobs allow them the opportunity to earn decent salaries. In 1984, only
8% agreed strongly and 29% somewhat.
More teachers today (77%) than in 1984 (70%) agree they are usually recog-
nized for good performance.
1 4

fttE
AtyleRICAN1-5ACif ER
3. However these impmcements are not equally common. Urban teachers in par-
ticular are less likely to believe they are recog nized for good performance; 72%
say this compared to 82% qf suburban and 79% qf rural teachers.
Although urban teachers, like their rural and suburban peers, are more sat-isfied with their careers than they were eleven years ago, they still lag behindtheir peers. Majorities of teachers in rural (58%), small town (55%) and sub-urban (57%) schools are very satisfied with teaching. By contrast, fewer innercity (49%) and other urban teachers (46%) are equally satisfied.
4. Wien asked why they enjoy their prqfession. teachers most often mention theyoung people they work with and, as in 1984, teachers overwhelmingly agree
with. the statement, "I love to leach". iis is true jin. teachers in urban as well
as suburban and rural schools.
Teachers are most likely to mention their students when asked their reasonsfor staying in teaching. Teachers' comments about their pupils include:
Seeing children develop, learn and succeed (31%)
Egjoying working with children (25%)
The interaction with students (15%)
Making a difference in a child's life (8%)
5. Teachers are remaining in the profession longer than they did in the past; in1995, 45% qf teachers say they have at least 20 or more years' experience, com-
pared to 27% in the 1984 survey
6. Although they remain committed and are more satisfied with their prqfes-sion, teachers are only somewhat more likely to feel respected in today's soci-
ety than they were in 1984 (53% vs. 47%).
7. Although a majority of teachers, nationwide, believe that parental and com-munity support jbr their schools is excellent Or good, there are significant dif-
ferences between teachers in urban, suburban and rural schools.
Urban school teachers believe that public support has worsened in the pastdecade; from 53% saying excellent or good in 1984 to 37% in 1995.
Suburban and rural teachers have seen improvements during that period;from 55% in 1984 for both groups to 75% and 63% saying excellent or
good today.
II. Teachers' Views on the Quality of Education
1. 7bda# many more teachers believe the teachers, academic standards and gen-
eral curriculum in their schools are Vexed/en t quality.
a 69% of teachers tnday believe t he quality of teachers in t heir schools is either
excellent or good over half (55%) say excellent, compared to just 37% in
1984.
5

tHE
AME.RICANTOCHER
6
07% give high ratings for academic standards 40% say excellent and 45%
good. Excellent ratings have increased substantially since 1984, from 26% to
40%.
The positive ratings for school curriculum have improved from one in four
(25%) saying excellent in 1984 to one in three (32%) in 1995.
I However. urban teachers are not as optimistic Is their peers in other schools;
77% of urban teachers rate their school curriculum excellent or good vs. 86%
of suburban and 88% of rural teachers.
2, Teachers are more likely to give negative ratings when asked about the avail-
ability offundsjbr use by their schools half say thefun dsavailablefor use
is only fair ( 33%) or poor ( /8%).
<3. Based on overall e.lperiences at their schools, nearly all teachers believe that
a broad variety of measures could be taken that would help strengthen the
quality of education. A majority sometimes nearly all teachers believe
the following suggested policies would have a somewhat or strongly positive
effect on education in general:
Emphasizing school discipline and safety (97%)
Emphasizing basic skills such as reading, writing and arithmetic (96%)
Broadening the curriculum to include computer literacy and foreign lan-
guages (94%)
Tightening graduation requirements (80%)
Establishing minimum competency tests for students at predetermined grade
levels (77%)
Increasing the amount of homework required of students (62%)
4. Since 1984. there has been an increasefrom three in five (60%) to three injour
( 75%) teachers who believe that emphasizing school discipline and safety will
have a strongly positive effect on education in general. Similar proportions
of teachers feel this way, regardless of the type ofcommunity in which they
teach.
5. Teachers' strongly believe that benefits are gained by emphasizing basic skills,
uch as reading, writing and math, and their opinions have remained con-
stant since 1984 (96% today vs. 97% in 1984 ).
6. Nine in ten teachers remain convinced that broadening the curriculum to
include such things as computer literacy and foreign languages will have a
positive effect on education (94% in 1995 vs. 92% in 1984).

IHE
AMeRIcANlocHER
/-;
HI. Strengthening the Profession
I. America's teachers have &finite opin ions on what will or will not have a pos-
itive (ffect on the quality o f teaching ht public schools. SpecificallA a largemajority of teachers believe that positive results can be gained from:
Providing incentives to encourage students to go into teaching (91%);
Making it easier to remove incompetent teachers (89%); and
Requiring competency tests f'or certification (86%).
III Smaller majorities believe there would be a positive result if there wererequired periodic re-testing of teachers in specific subjects (62%) and high-er salaries for teachers who specialize in subjects where there are teacher
shortages (56%).
2. Overall, the extent to which teachers support these suggested measures hasremained constant over the past decade. For erample, in 1984 82% of teach-
ers believed that requiring teachers to take competency tests before certyica-
tion would have a positive effect on teaching.
IV. Confronting the Challenges of Teaching
1. Teachers continue to be confronted with many of the same societal problems
they faced a decade ago. In many cases these problems have groum worse, and
teachers working in urban schools are most likely to believe their problems
have worsened.
Teachers say the problem ofjunior high and high school student drinking hasincreased from 66% in 1984 to 76% today; the number of students using drugsfrom 58% to 64%. Drinking is more often cited as a problem by teachers in rural
areas; drug use more often by teachers in the city. However, they are problems
for most teachers regardless of the type of community in which they teach.
Three in five (59%) junior high and high school teachers say the number ofteenage pregnancies is at least a somewhat serious problem, an increase of
10% since 1984 (49%). Urban teachers (81% in inner city and 71% in otherurban schools) are considerably more likely than others to say so; suburban
teachers are least likely (43%).
The number of students who lack basic skills has slightly declined as a prob-lem for teachers in general, from 80% in 1984 to 74% in 1995; it has declined
for teachers in other urban areas, the suburbs, small towns and rural areas.However, it has increased slightly for inner city teachers, from 83% in 1985
to 87% today.
Elementaty school teachers in inner city (66%) and other urban (55%) schools
are more likely to consider overcrowded classes t o be a serious problem t han
t eachers working in t he suburbs (5:3%), small towns (52%) or rural areas
(46%).
77

AME-R16ATOCtiER
2. Machers are concerned about violence in and around their schools, more so
in junior highs and high schools, but in elementary schools as well. Three in
ten teachers in the suburbssmall towns, rural areas and other urban areas
think it is a serious problem, considerably fewer than the seven in ten teach-
ers in inner city schools.
The number of students carrying handguns. knives and weapons to school is
a problem for one in four (25%) junior high and high school teachers in gen-
eral, but for almost half of inner city teachers (46%).
V. Comparing Teaching to Other Professions
I. hvolwfive teachers have at some time considered leaving teaching jbr anoth-
er occupation. However far fewer believe they are likely to consider leaving
teaching in thefuture (24%).
51% of teachers say they are not at all likely to consider leming teaching for
another occupation within the next five years.
2. Given the choices of job security and benefits, love of teaching or difficultyfinding anotherjob, teachers who say they are not likely to leave teaching for
another profession are overwhelmingly likely to say that love qfteaching (72%)
is the reason they will stay in the profession.
1 6

OaAMERICANl'OCHER
CHAPTER 1: THE JOB SATISFACTION OF THE AMERICAN TEACHER
Satisfaction With Teaching as a Profession Has Increased in Ten Years
Teachers' overall level of satisfaction with their careers has increased consider-
ably in the past eleven years. Over half (54%) currently say they are very satisfied,
compared to 44% in 1985. Teachers at all grade levels show an increase in satisfac-
tion with their teaching careers. In 1985, :37% of high school and junior high teach-
ers said they were very satisfied; in 1995, the proportions are 50% and 49%,respectively. For elementary school teachers, there has been an increase of 9%, from
49% in 1985 to 58% today.
Figure 1
60
50
40
30
20
101984 1989 1995
Teachers' overallsatisfaction with theircareers has improvedconsiderably in just the pastsix years.
11111 Very Sat isfied
IIII Dissatisfied
While the overall level of satisfaction has increased over the past decade for teach-
ers in all types of communities, teachers in rural areas (58%), the suburbs (57%)
and small towns (55%) are somewhat more likely to say they are very satisfied with
their teaching careers than teachers in inner cities (49%) or other urban areas
(46%). This finding was similar in 1985 when the proportions were 45%, 45%, 46%,
40% and :36%, respectively.
OBSERVATION: These ongoing differences are not surprising in light of the
consistent and considerable differences in urban teachers'experiences and views about the education system as a whole
and of their schools in particular. These differences arediscussed in greater detail throughout this report.

oiMeSlcMJ-1ActiER
The proportion of inner city teachers who are dissatisfied with teaching as acareer has been halved since 1985, from 30% (19% somewhat and 11% very dissat-
isfied) to 16% (11% somewhat and 5% very dissatisfied). In other urban areas, theproportion is one-third of what it was eleven years ago; it was one in three in 1985
and is only one in ten in 1995.As might be expected. teachers working in highly stressful environments are con-
siderably less likely to be satisfied with teaching as a career. However, whether they
feel under stress often or only occasionally, most teachers are more satisfied withtheir careers than they were in 1985.
Female teachers (58%) are more likely than male teachers (46%) to say they are
very satisfied with teaching as a career (48% and 34% in 1985, respectively). Male
teachers are more inclined to say they are somewhat satisfied (41% vs. :30% in 1095,
and 40% vs. 33% in 1985). The proportions of both female and male teachers whosay they are dissatisfied with teaching as a career have decreased over the past
decade.
Table 1-1 TEACHERS' OVERALL JOB SATISFACTION
QUESTION: .411 in all, how satisfied would you say you are with teaching as a
career rery satisfied, somewhat satisfied, somewhat dissatisfied,or very dissatisfied?
TOTALTEACHERS
TYPE OF SCHOOL SIZE OF PLACE
ELEMEN-TARY
JUNIORHIGH
HIGHSCHOOL
INNERCITY
OTHERURBAN SUBURB
SMALLTOWN RURAL
'95 '85 '95 '85 '95 '85 '95 '85 '95 '85
T
'95
A
'85
G E
'95 '85 '95 '85 '95 '85
PER CENrffll
Very Satisfied 54 58 49 49 37 50 37 49 40 46 36 57 45 55 46 58 45
'ARSomewhat Satisfied 33 35 30 32 37 39 37 39 35 30 42 35 30 35 32 36 34 37
Somewhat Dissatisfied 1046,tteS
9 14 11 17 11 19 11 19 8 23 11 16 11 14 7 13
Very Dissatisfied 2F6) 2 3 3 7'.3 6 5 11 2 6 3 3 3 4 * 4
BASE 523 1124 240 407 30c! 453 148 264 98 231 271 528 275 478 216 3401011 1848
*Less than 0.5%
10
2 0

Table 1-2 TEACHERS' SATISFACTION WITH TEACHING AS CAREER:
BY GENDER AND JOB STRESS
QUESTION: All in all, how satisfied would you say you are with teaching as acareer very satisfied, somewhat saisisfied. somewhat dissatisfied,or very dissatisfied?
GENDER FREQUENCY OF FEEUNG UNDER GREAT JOB STRESS
TOTALTEACHERS MALE FEMALE
SEVERAL DAYSA WEEK
OR MORE
ONCE ORTWICE
A WEEK
LESS THANONCE A MEEK
OR NBER
'95 '85 '95 '85 '95 '85 '95 '85 '95 '85 '95 '85
P ER CEN T A GErT----1
Very Satisfied 54 44 46 34 58 48 39 33 56 41 71 61
,,.. ,,
Somewhat Satisfied 33 35 41 40 ;30 33 39 35 36 40 24 30
Somewhat Dissatisfied 10 16 10 18 10 15 17 24 7 16 4 6
Very Dissatisfied 2 5 2, 3 8 2 3 5 9 1 2 1 311BASE 1011 ; _1846
301 591 710 1255 354 700 382 618 275 526
11

fiNialcANTeACHER
12
Attitudes Toward Specific Aspects of Job Satisfaction
For the overwhelming majority of teachers, what they like most abouttheir jobs
is centered around their interaction with children. Three in ten (31%) teachers say
"Seeing children develop" is the one thing they like most about their job as a teach-
er. One-quarter (25%) say "Working with children" is what they like most. Otherchild-related items cited as the one thing teachers like most about their jobs are
"Interaction with students " (15%), "Making a difference in a child's life" (8%), and
"Seeing the look of joy when a child finally 'gets it" (5%). By contrast, only small
minorities mention aspects of the job that are more closely related to their Own
experiences rather than t heir students, such as good hours or summers off (3%).
Elementary school teachers (33%) are more likely t o say "Seeing children devel-
op" is the one thing they like most as teachers, compared to junior high (26%) or
high school (28%) teachers. The number of years of teaching experience and gen-
der has little impact on teachers' responses regarding the one thing they like most
abcut their job as a teacher.

Table 1-3 THE THINGS TEACHERS LIKE MOST ABOUT THEIR JOI1S
QUESTION: Ifhat is the one thing you like most about your job as a teacher?
TOTAL
TYPE OF SCHOOLYEARS OF TEACHING
EXPERIENCE GENDER
ELEMETARY
it NIORHIGH
HIGHtiCHOOL
LESSTHAN 10
10 ORMORE MALE FEMALE
PER CEN T AGE
Seeing Children Develop/ 31 35 26 28 32 30 31 31Progress:Succeed/MotivatingStudents to Learn
Working With Children -;).)- 24 23 29 24 9-..;) 26 25
interaction With Students 15 12 17 19 14 16 18 14
Making a Difference in a 8 7 10 7 9 7 7 8Child's Life
Seeing Look of.loy When a 5 7 5 3 6 5 2 7Child Finally "Gets It"
Academic/Creative Freedom 3 4 5 2 4 3 2 4
I Like the Hours/Summers Off 3 2 4 4 2 4 3 3
I Love to Teach 2 2 2 2 3 2 3 2
Other 7 5 9 6 7 7 8 7
BASE 1011 523 240 309 254 757 301 710
n
13

offAMUICAN71-ACHER
14
Attitudes Toward Specific Aspects of Their Profession
Teachers today have a positive attitude about the teaching profession as a whole,
but still express concerns and frustrations with specific aspects of their profession.
Teachers agree with the statement "I love to teach": over three-quarters (78%) agree
strongly (I he same proportion as in 1984), and 20% agree somewhat ( J.8% in 1984).
However, while teachers continue to say t hey love to teach, the proportions who feel
they are recognized for their efforts bot h in school and in society are not as
large. Three-quarters agree strongly (:37%) or somewhat (40%) t hat they are usual-
ly recognized for good performance (similar to the proportions in 1984, which were
:33% and 37%, respect iveiy). Only one in ten (9%) agrees st rongly that thcy feel
respected as a tc-acher in today's society, virtually an unchanged proportion since
1984 (10%). leachers continue to feel they spend too much time on administrative
tasks (74% in 1995, 72% in 1984), and sizeable numbers say they sometimes feel
pressure to promote students who have not mastered the minimum requirements:
54% agree at least. somewhat with this statement.Despite t hese ongoing frustrations, teachers' overall views of their profession
have improved since 1984. A decade ago, less than half (45%) of teachers agreed
they would advise a young person to pursue a career in teaching; in 1995, two-thirds
(67%) agree. This trend is evident regardless of type of school or community in which
they teach, years of experience, gender or geographic region.
OBSERVATION: This shift in opinion may reflect larger economic and societalchanges of the past decade. Although teaching is still achallenging though sometimes frustrating occupation, teachers
may choose to remain in jobs that theyperceive to be more
secure than many prirate sector occupations. And cm life in the
private sector has come to be perceived as more uncertain andstressful, the teaching profession may appear more attractive in
comparison.
Chapter 5 of this report discusses the changing Hews ofteachers in more detail. It notes that in many ways teachingcompares more favorably with other professions than it did a
decade ago.
Similarly, in 1984 less than half (46%) of teachers agreed that the training and
preparation teachers received did a good job preparing them for the classroom. In
1995, a majority of teachers (56%) agree with this statement. The trend is evident
regardless of type of school in which they teach, years of experience, gender, region
or communit y.
4

AMERICAN1-OCHER
Teachers have become steadily more pleased with their salaries over the pastdecade. In 1984, just 37% of teachers surveyed agreed with the statement: "My joballows me the opportunity to earn a decent salary." In 1989, this had risen to 48%and in 1995, 63% of teachers agree. This trend is evident i , gardless of type of school
in which they teach, years of experience, gender, region or type of community. Thesechanges are most evident in the East, where twice as many teachers believe theyearn decent salaries now (80%) compared to 1984 (40%). The proportion also dou-bled for high school teachers (from 33% to (8%) and for teachers with five to nineyears professional experience (from 31% to 64%).
Figure 2 The past ten years haveseen a significant increase
651 in the percent of teacherswho believe their occupation
60 provides them with theopportunity to earn a
55 decent salary.
50
45
40
35
301984 1989 1995
15

Table 1-4 TEACHERS' ATTITUDES TOMRD SPECIFIC ASPECTS OF JOB SATISFACTION
QUESTION:
I love to teach
I am usually recognized forgood performance
I have to spend too much timeon administrative tasks
I wculd athise a young personto pursue a career in teaching
My job allows me theopportunity to earn a decentsalaq
The training and preparationteachers receive today does agood job preparing them forthe classroom
I sometimes feel pressure topromote students even when Iknow t.hey have not masteredminimum requirements
As a teacher, I feel respectedin today's society
I would like to read you some statements people hare made abouttheirjobs. For each, please tell me if you agree strongly, agreesomewhat, disagree somewhat, or disagree strongly in terms of yourown job as a teacher in the public schools. (READ EACH
STATEMENT)
13 10
26 n/a
GREE STROM,LY AGREE SOMEWHATDISAGREE
SOMEWHAT
PERCENT AGE11111M11111111
43 36
29 n/a
DISAGREE STRONGLY
'95 '84 '95 '84 '95 '84 '95 '84
1111.111MOIMMI MANNINO
78 78 20 18 2 3 1*
3 7 33 40 37 15 19 8 10
32 38 42 34 21 19 5 7
'24 12 43 33 21 29 12 24
17 8 46 29 18 26 19 37
29 31 13 19
20 n/a 24 n/a
9 10 44 .,37 31 31 16 21
NIMIIIII111111
B A S E 1995:1011 1984:1981
*Less than 0.5°,
1.G
16

Table 1-5 TEACHERS' ATTITUDES TOUARD SPECIFIC kSPECTS OF JOB SATISFACTION:
BY Rli(HON AND SIZE OF PLACE
QUESTION:
TOTALTEACHERS
'95 '84
I love to teach 97 97
I am usually recognized for 77 70good performance
I have to spend too much time 74 73on administrative tasks
I would advise a young person 67.45to pursue a career in teaching
My job allows me the 63 '.37,4opportunity to earn adecent salary
The training and in eparationteachers receive today does agood job preparing them forthe classroom
57 46
I would like to read you some statements people hare made abouttheirjobs. For each, please tell me if you agree strongly, agreesomewhat, disagree somewhat, or disagree strongly in terms of your
own job as a teacher in the public schools. (READ EACH
STATEMENT)
"AGREE STRONGLY" OR "AGREE SOMEWHAT"REGION SIZE OF PLACE
EAST MIDWEST SOUTH WEST CITY SUBURB RURAL
'95 '84 '95 '84 '95 '84 '95 '84 '95 '84 '95 '84 '95 '84
PERCENT AGE95 94 98 97 98 97 98 99 98 96 97 97 99 97
i1 68 75 70 1 73 67 67 72 68 )2 69 79 72
68 73 76 66 79 77 68 77 73 75 73 74 74 70
67 39 71 45 63 46 71 56 67 39 70 46 66 50
80 40 74 42 48 29 57 40 57 38 68 39 59 35
59 42 61 50 34 51 54 38 56 43 36 44 60 51
I sometimes feel pressure to 54 iila 51 n/a 31 n/a 56 n/a 38 n/a 58 n/a 33 n/a 50 n/apromote, students even when Iknow they have not masteredminimum requirements
As a teacher, I feel respected 34 47 54 37 55 50 54 52 32 47 49 39 56 47 53 52in today's society
BASE 1011 1901 197 684 278 414 340 602 196 281 246 551 271 869 215 561
17

Table 1-6 TEACHERS' ATTITUDES TOWARD SPECIFIC ASPECTS OF JOB SATISFACTION:
BY TYPE OF SCHOOL, EXPERIENCE, AND GENDER
QUESTION: I would like to read you some statements people hare made abouttheirjobs. For each, please tell me if you agree strongly, agreesomewhat, disagree somewhat, or disagree strongly in terms of your
own job as a teacher in the public schools. (READ EACH
STATEMENT)
I love to teach
I am usually recognized forgood performance
I have to spend too much timeon administrative tasks
I would advise a young personto pursue a career in teaching
My job allows me theopportunity to earn adecent salary
The training and preparationteachers receive today does agood job preparing them forthe classroom
I sometimes feel pressure topromote students even when Iknow they have not masteredminimum requirements
TOTAL
"AGREE STRONGL Y" OR "AGREE SOMEWHAT"TYPE OF SCHOOL EXPERIENCE GENDER
ELEMEN-TAM*
JUNIORHIGH
HIGHSCHOOL
LESS THAN5 YEARS 5-9 YEARS
10 YEARSOR MORE MALE FEMALE
'95 '84 '95 '84 '95 '84 '95 '84 '95 '84 '95 '84 '95 '84 '95 '84 '95 '84
PERCEN T A GE
97
77
74
67
63
57
97
70
73
45
37,
46
98
77
76
69
59
58
97
72
75
46
39
47
95
78
70
67
63
55
96
74
70
45
35
40
97
75
72
64
68
55
97
64
71
46
33
48
99
80
72
77
43
64
98
72
65
63
31
58
97
75
76
77
64
58
96
64
68
48
31
39
97
77
73
64
65
56
96
71
75
43
39
47
96
71
70
65
(57
55
95
64
70
42
34
42
98
79
75
68
61
58
97
73
74
47
39
48
54 n/a 59 n/a 61 n/a 39 n/a 59 n/a 57 n/a 53 n/a 47 n/a 57 n/a
As a teacher, I feel respected 54 47 55 48 52 41 51 49 57 49 58 46 52 47 55 45 53 48in today's society
BASE 1011 1981 523 972 240 375 309 491 95 142 159 326 757 1513 301 685 710 1296
18A,

1HE
AMERICANTOCHER
CHAPTER 2: EVALUATING THE QUALITY OF PUBLIC SCHOOLS
Overall Quality of Education
Just as teachers have seen numerous improvements in their profession, they alsobelieve t hat the education system, as a whole, has made improvements over the pastdecade. Teachers are pleased with the overall quality of education in their schools.Nine in ten teachers report the quality of education in their schools is excellent(47%) or good (45%). In 1984, they were slightly more likely to say good (49%) thanexcellent (42%). Currently, only 6% say fair and 1% poor (7% and 1% in 1984, respec-
tively).Teachers in elementary schools (5:3%) are more likely than those in junior high
(45%) or high schools (:38%) to rate the quality of education in their schools as excel-
lent. This pattern was similar in 1984. Regardless of their years of teaching experi-ence or whether they are male or female, majorities of teachers rate quality in their
schools as either excellent or good.
Table 2-1 TEACHERS' OVERALL RATINGS OF THEIR SCHOOLS
QUESTION:
TOTAL
'95 '84
Excellent 47
Good 45
Fair 6
Poor
As you know, there has been much discussion recently aboutAmerican education and especially about our primary and secondarypublic schools, Thinking about the public school in which you teach,how would you rate the quality of education in your schoolexcellent, good, fair or poor?
TYPE OF SCHOOL EXPERIENCE GENDER
ELEMEN-TARY
JUNIORHIGH
HIGHSCHOOL
LESS THAN5 YEARS 5-9 YEARS
10 YEARSOR MORE MALE FEMALE
'95 '84 '95 '84 '95 '84 '95 '84 '95 '84 '95 '84 '95 '84 '95 '84
PER CEN T A GE
53 50 45 40 38 31 43 33 43 39 49 44 44 33 49 47
41 44 41, 51 52 57 45 56 50 51 44 48 47 55 45 46
5 5 7 8 9 10 11 7 5 9 6 7 7 10 6 6
1 1 2 2 1 1 1 2 1 1 1 1 2 . 1 1 1
B ASE 101111981 523 972 240 375 309 491 95 142 159 326 757 1513 301 685 710 1296LAwou
c,919

AnneRICANTOCHER
20
Rating Their Schools on Specific Educational Issues
In rating several criteria by which public schools can be judged, majorities of
teachers give positive ratings to the quality of teachers in their schools (96%), the
curriculum in general (85%), academic standards in their schools (85%) andparental
and community support (61%). Half (49%) give positive ratings to the funds avail-
able for use by their schools. Each of these have seen increases in positive ratings
since 1984.Of these five possible criteria, only the quality of teachers in your school is rated
excellent by a majority (55%) of teachers. Four in ten (40%) teachers rate the aca-
demic standards in their schools as excellent, three in ten (32%) thecurriculum in
general, two in telt (22%) parental and community support for their schools, and
one in ten (11%) the funds available for use by their schools.
While such positive ratings are still the minority, excellent ratings have increased
since 1984. At that time, the quality of teachers received an excellent rating by 37%
(an increase of 18%); academic standards by 26% (an increase of 14%); curriculum
by 25% (an increase of 7%); and parental and community support by 16% (an increase
of 6%).
Figure 3
75
70
65
60
55
50
45
40
35
301984 1995
In 1984, teachers in alltypes of schools had similarviews about parental andcommunity support.Today, urban experiencesare much worse while othershave seen improvements.
IIII City
Suburban
IIII Rural
The proportions of teachers who give either excellent or good ratings to parental
and community support for their schools has increased since 1984 among teachers
in the suburbs (from 55% to 75%) and in rural areas (from 55% to 63%). However, it
has decreased in city schools from over half (53%) in 1984 to less than four in ten
(37%) in 1995. Likewise, while suburban and rural teachers have seen improvements
in their schools' curriculum and academic standards over the past twelve years,
urban teachers have not seen these kinds of changes in their own schools. Positive
ratings for the level of public support teachers receive have increased in the Midwest
30
IHE
AMERICANTeACil ER
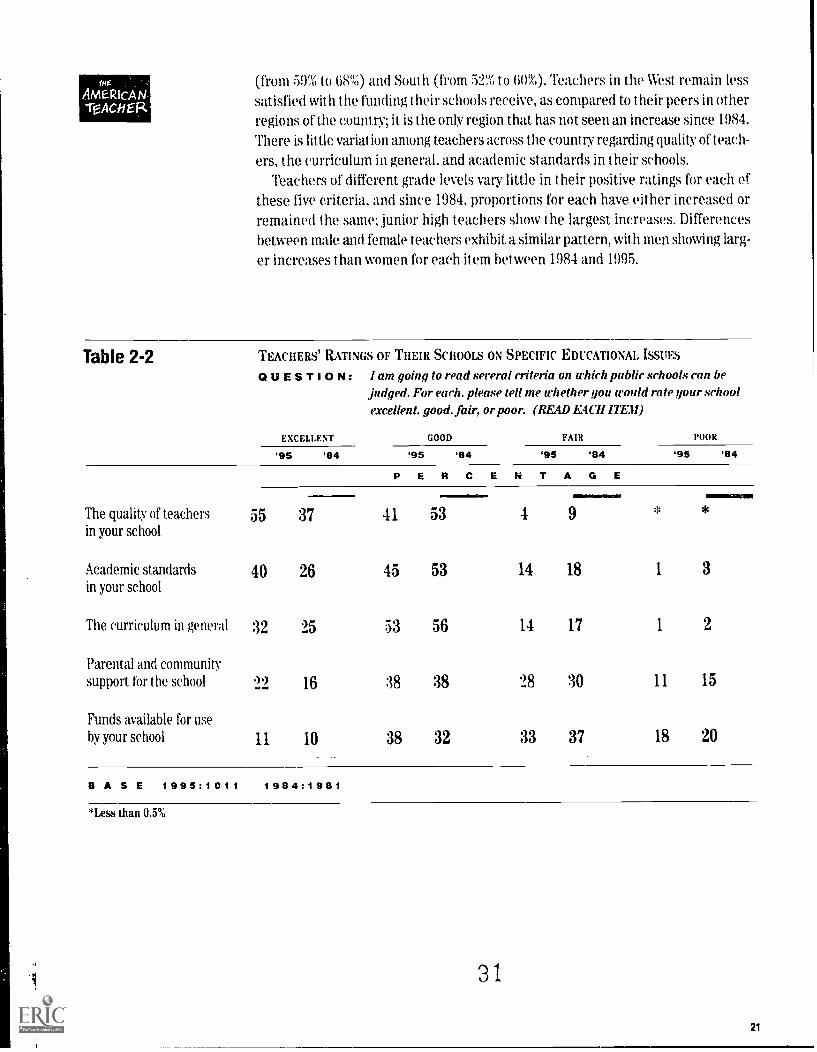
(from 59% to 68%) and Soul h (from 52% to 60%). Teachers in the West remain lesssatisfied wit h the funding their schools receive, as compared to their peers in otherregions of the country; it is the only region that has not seen an increase since 1984.There is little variation among teachers across the country regarding quality of teach-ers, the curriculum in general, and academic standards in t heir schools.
Teachers of different grade levels vary little in their positive ratings for each ofthese five criteria, and since 1984, proportions for each have either increased orremained the same; .junior high teachers show t he largest increases. Differencesbetween male and female teachers exhibit a similar pattern, with men showing larg-er increases t han women for each item between 1984 and 1995.
Table 2-2 TEACHERS' RATINGS OF THEIR SCHOOLS ON SPECIFIC EDUCATIONAL ISSUES
QUESTION: I am going to read several criteria on which public schools can bejudged. For each, please tell me whether you would rate your schoolexcellent. good. fair, or poor. (READ E4CH ITEM)
EXCELLENT GOOD FAIR POOR
'95 '84 '95 '84 '95 '84 '95 '84
PER CEN T A GE111.
The quality of teachersin your school
55 37 41 53 4 9 *
Academic standardsin your school
40 26 45 53 14 18 1 3
The curriculum in general 32 25 53 56 14 17 1 2
Parental and communitysupport fig the school 22 16 38 :38 28 30 11 15
Funds available for useby your school 11 10 38 32 33 37 18 20
A E 1 9 9 5 : 1 0 1 1 1 9 8 4 : 1 9 8 1
*Less than 0.5%
3 1
21

Table 2-3 TEACHERS' RATINGS OF THEIR SCHOOLS ON SPECIFIC EDUCATIONAL ISSUES:
BY REGION AND SIZE OF PLACE
QUESTION: I am going to read several criteria on which public schools can bejudged. For each. please tell me whether you would rate your schoolexcellent, good. fair, or poor. (READ EACH ITEM)
70TALTEACHERS
"EXCELLENT" OR "GOOD"REGION SIZE OF PLACE
EAST MIDWEST SOUTH WEST CITY SUBURB RURAL
'95 '84 '95 '84 '95 '84 '95 '84 '95 '84 '95 '84 '95 '84 '95 '84
PERCEN T A G E
The quality of teachersin your school
96 90 96 91 96 90 95 90 95 89 92 85 98 91 95 92
The curriculum in general 85 81 83 81 87 80 84 81 85 79 77 79 86 81 88 81
Academic standardsin your school
85,78 84 77 88 81 S5 78 82 76 74 73 90 80 88 79
Parental and communitysupport for the school
61.55 57 51 68 59 60 52 55 59 37 53 75 55 63 55
Funds available for useby your school
49142 49 43 53 42 53 43 36 35 43 36 56 41 42 46
BASE 10111 981 197 684 278 414 340 602 196 281 246 551 271 869 216 561
3

Table 2-4 TEACHERS' RATINGS OF THEIR SCHOOIS ON SPECIFIC EDUCATIONAL ISSUES:
BY TYPE OF SCHOOL, EXPERIENCE, AND GENDER
QUESTION: l am going to read several criteria on which public schools can bejudged. For each, please tell me whether you would rate your schoolexcellent, good, fair, or poor. (READ EACH ITEM)
TOTAL
"E XCELLENT" OR "GOOD"TYPE OF SCHOOL EXPERIENCE GENDER
ELEMEN-TARY
JUNIORHIGH
HIGHSCHOOL
LESS THAN5 YEARS 5-9 YEARS
10 YEARSOR MORE MALE FEMALE
'95 '84 '95 '84 '95 '84 '95 '84 '95 '84 '95 '84 '95 '84 '95 '84 '95 '84
PER CEN T A G E
The quality of teachersin your school
96.90 96 92 94 89 95 87 96 89 94 90 96 90 95 87 96 91
The curriculum in general 85 81 84 83 80 s3 78 82 73 84 83 85 81 84 75 83 83
Academic standards 85 78 Si 83 85 76 MI 72 86 70 62 79 65 79 SI 72 86 81
in your school,-,,i.A
,r.f...
,-,:..-, :..., ... .,i,:s
Parental and community 6155 63 59 61 51 5750 56 47 57 56 62 55 56 50 62 57
support for the school 'Al ,Funds available for use 49 42 49 44 50 41 48 41 56 44 45 43 18 41 46.38 50 44
by your school .'
-- ,-- j*:141 . L--:....
BASE 10111981 523 9172 240 375 309 491 95 142 159 326 757 1513 301 685 710 1296alm.4
33
23

Mt.
liMERICANl'ACHER
24
Problems Teachers Face in Their Schools
Since 1985, larger proportions of junior high and high school teachers feel thatproblems in their public schools are either very or somewhat serious. Those whothink the amount of drinking by students is a serious problem increased from 66%in 1985 to 81% in 1989; in 1995, it is 76%. Concern about the number of studentsusing drugs also increased, from 58% in 1985 to 70% in 1989; currently it is 64%.Student drinking is more likely to be considered a serious problem by teachers asthey move farther out of the inner city to rural communities, while drug use is morelikely to be a serious problem for city schools. Both are more likely to be consideredserious problems in high schools than in junior highs.
Figure 4
90
85
80
75
70
65
60
55
501985 1989 1995
Teenage drinking remainsa problem; however, manyschools have seenimprovements in the pastsix years.
im Inner City
atio4.°117/1 Other Urban
BEI Suburban
Small Town
1111 Rural
Figure 5
85
80
75
70
65
60
50
55
45
401985 1989 1995
3 4
Teachers in urban schoolsare most likely to haveproblems with student druguse, though it has declinedsomewhat since 1989.However, improvements overthe past six years have beenmore significant in rural andsuburban schools.
Inner City
Other Urban
Suburban
Small Town
Rural

IHE
AMERIcANTOCHER
The proport ion of t eachers who t hink the number of t eenage pregnancies is aserious problem increased front 49% in 1985 to 61% in 1089: currently it is 59%. This
is less likely t o be considered a serious problem by teachers in the suburbs com-pared to t hose in rural areas, small towns. or cities, and among high school rat herthan junior high teachers. It is more likely to be considered a serious problem by
teachers in t he South than in any other region of the country.
Figure 6
80 ,
75
701
651
60
55
50
45
40
35
301985 1989 1995
While most teachers sawdramatic increases in teenpregnancies between 1985and 1989. which haresince leceled off teachersin other urban areas aremore likely to hare seen anopposing trend.
11111 Inner ('ity
Other Urban
". Suburban
Small Tmn
III Rural
Today, violence in schools is considered a problem by many t eachers. Forty-one
percent of teachers say the incidence of violence in and around schools is a serious
problem. It is more likely to be considered serious by teachers in inner cities (72%)
and other urban areas (54%) compared to those in the suburbs (41%), rural areas
(30%) and small towns (28%). Similarly, 25% of junior high and high school teach-
ers say the number of students carrying handguns, knives and other weapons to
school is a serious problem, mostly in inner cities (46%) and other urban areas (31%),
a.s compared to rural areas (24%), the suburbs (20%), and small towns (18%). However,
even though these problems are less.common in suburban and rural communities,
they have not escaped the growing trend of violence among young people. In tact,
in 1993 one in seven teachers in urban and suburban schools had been the victim
of a violent act that occurred in or around their schools.'The number of students who lack basic skills in grades seven through twelve has
decreased as a serious problem, from 80% in 1984 to 74% in 1995. At least eight in
ten teachers in inner city (87%) and other urban schools (79%) consider this a prob-
lem, compared t o no less t han two-thirds of t eachers in rural areas (74%), small
towns (72%) and the suburbs (68%). Similarly, I he proportion who consider teenage
The .11i ropuida 1.0; Sur( o Iffih, menea r [ifthwee iii .Imcom's Public Schools.
3 r25

AMERICANTO'ACH ER
26
suicides a serious problem has decreased from 18% to 14%. But once again, whilesuburban and rural teachers express less concern that they did twelve years ago,urban teachers have become more concerned with the problem of teen suicides.
Since 1085, larger proportions of elementary school teachers also believe thatmany problems in their public schools are either very or somewhat serious.Overcrowded classes as a serious problem has increased slightly (from 49% in 1985to 51% in 1989, to 5:3% in 1995). It continues to be considered a more frequent prob-
lem in the West (70%) than in the East (55%), Midwest (49%) or South (46%). Notsurprisingly, it is more often cited as a serious problem by teachers in inner cityschools (66%) rather than other urban (55%), suburban (53%), small town (52%) or
rural (46%) schools.
Figure 7
70
65
60
55
50
45
401985 1989 1995
Over the past decade,elementary school teachersin different communities hadvaried experiences withproblems of overcrowding;these remain of greatestconcern for inner cityteachers.
IIII Inner City
7,,,"1 Other Urban
El Suburban
1111 Small Town
IIIII Rural
Figure 8
75
70
65
60
55
50
45
40
35
30
25
20
151985 1989
3 6
1995
Problems with absenteeismpeaked for elementaryschool teachers in 1989, andhave declined considerablysince then in all types ofschools. But the differencesbetween inner city schoolsand other schools have beenconsistent over time.
III Inner City
Other Urban
IC Suburban
MI Small Town
III Rural

AWSZICANTOCHER
The problem of absenteeism increased considerably between 1985 and 1989, front28% to 53%. Since then it has decreased to :34%. It is almost twice as likely to be con-
sidered a serious problem by teachers in the West (46%) than in the East (25%), andin inner cities (50%) compared to other urban areas (40%), rural areas (36%), small
towns (37%) and the suburbs (20%).Half of all elementary school teachers indicate that students lack of interest in
their classes is a serious problem. This is more likely to be a problem in the South(56%), than in the West (51%), Midwest (46%) or the East (41%). It is least likely to
be a serious problem for teachers in the suburbs (35%) at least half the teach-
ers in other areas consider it a very or somewhat serious problem.Inadequate programs fbr remedial students are a serious problem for two in five
(41%) elementary school teachers. It is considerably higher for teachers in the\Vest (54%) than for those in the East (44%), South (39%) or Midwest (33%). It is
less likely to be a serious problem for teachers in suburban (35%) or rural (:35%)
schools. compared to those in small t owns (44%), inner cities (48%) or other urban
areas (60%).The incidence of violence in and around elementary schools (26%) is considerably
less of a concern than in junior high and high schools (41%). However, it is aserious
problem for 35% of elementary school teachers in the \Vest and for 51% of teachers
in inner city grade schools. By contrast, it is a serious problem for no more than one-
third of the teachers in other urban areas, small towns, suburbs and rural areas.
9 '7
27

"NW
Table 2-5 TEACHERS EVALUATE PROBLEMS IN THE SCHOOLS
QUESTION:
TEACHERS OF GRADES 7-12
The amount of drinkingby students
The number of studentswho lack basic skills
The number of studentsusing drugs
The number of teenagepregnancies
The number of dropouts
Incidence of violence inand around schools
The number of studentscarrying handguns, knivesand weapons to school
The number of teenagesuicides
BASE 1 9 9 5:5 1 8
I am going to read some things that some people have said areproblems with the public schools. After I read each one, please tell meif you think that problem is very serious, somewhat serious, not veryserious, or not at all serious in the public school in which you teach.(READ EACH ID If)
VERYSEROWS
SOMEWHATSER011 5
NOT VERYSEROWS
NOT AT ALLSEROWS
'95 '85 '95 '85 '95 '85 '95 '85
PER CEN T A GE
26 27 50 39 IS 20 5 13
21 30 53 50 22 16 4 4
13 14 50 44 30 29 5 11
20 19 39 20 25 29 15 20
10 13 33 27 34 34 22 22
8 n/a 33 n/a 42 ii/a 18 n/a
5 n/a 20 n/a 39 n/a 36 n/a
3 4 12 13 36 33 49 45
TEACHERS OF GRADES K-6
Overcrowded classes
Students' lack of interest intheir classes
Inadequate programs forremedial students
Absenteeism
ncidence of violence inand around schools
1 9 8 5 : 3 2 0
AGEERCENT18 18 35 31 24 29 23 21
10 n/a 40 n/a :36 n/a 14 n/a
10 n/a 32 n/a 30 n/a 28 n/a
6 6 29 22 40 41 25 30
4 n/a 23 n/a :38 n/a 35 n/a
Va=1BASE 1 9 9 5:5 2 3 1 9 8 5:1 1 2 4
=Man
*Less than 0.5%
2835

Table 2-6 TEACHERS E%1LI vrE PROBLEMS IN THE SCHOOLS: BY SIZE OF PLACE
QUESTION:
TOTALTEACHERS
'95'85
I am going to read some things that some people hare said areproblems with the public schools. After I read each one, please tell meif you think that problem is rery serious, somewhat serious, not reryserious, or not at all serious in the public school in which you teach.(REID E1(11 ITEM)
TEACHERS OF GRADES 7-12
The amount Of drinkingby students
The number of studentswho lack basic skills
The number of studentsusing drugs
The number of teenagepregnancies
The number of dropouts
Incidence of violence inand around schools
The number of studentscaming handguns, knivesand weapons to school
The number of teenagesuicides
BASE
TEACHERS OF GRADES K-1
Overcrowded classes
Students' lack of interest irtheir classes
Inadequate programs forremedial students
Absent evism
Incidence of violence inand around schools
BASE
76 66
74 80
64 58
59 49
44 40
41 n/a
Okuki
25 do,
1.-5.7E4
14 18
518 820
"VERY SERIOUS" OR "SOMEWHAT SERIOUS"SIZE OF PLACE
INNER (Iii oTIIER URBAN SUBURB SMALL TOWN RURAL
'95 '85 '95 '85 '95 '85 '95 'as '95 '85
PERCENT AGE61 60 69 68 77 71 80 60 80 67
87 83 79 90 68 76 72 81 74 79
73 63 73 66 59 68 67 55 55 19
81 57 71 62 43 32 58 54 62 47
69 49 52 48 29 30 40 44 47 36
72 n/a 54 n/a U n/a 28 n/a 30 n/a
46 pia 31 n/a 20 n/a 18 n/a 24 n/a
18 10 21 30 15 21 10 10 13 21
53 49
50 n/a
41 niakitt:u1
34 2826 n/a
a...a.
67 93 52 102 137 251 141 216 119 156
PERCEN T A GE
66 60 55 44 53 50 52 48 46 50
65 n/a 57 n/a :35 n/a 19 n/a 56 n/a
48 n/a 60 n/a :35 n/a 1-1 lila :35 n/a
50 42 40 31 20 18 37 26 36 31
51 n/a 34 n/a 20 nia 25 n/a 16 n/a
523 1124 32 82 4 7 134 42 300 42 284 109 :20_
29

Table 2-7 TEACHERS EVALUATE PROBLEMS IN THE SCHOOLS: Ey REGION
QUESTION: I am going to read some things that some people hare said areproblems with the public schools. After I read each one, please tell meif you think that problem is very serious, somewhat serious, not eeryserious, or not at all serious in the public school in which you teach.(RE4D EACH ITEM)
TEACHERS OF GRADES 7-12
IOTAI.TEACHERS
'95 '85
"VERY SERIOUS" OR "SOMEWHAT SERIOUS"REGION
E 1ST_
'95 '85MIDWEST
'95 '85
SOI TO
'95 '85
ES1
'95 '85
PERCENT AGEThe amount of drinkingby students
76 66 79 59 80 79 68 57 79 69
The number of studentswho lack basic skills
74 80 70 81 66 72 78 85 82 83
The number of studentsusing drugs
64 58 68 61 62 61 56 54 75 60
The number of teenage 59 49 51 47 58 40 67 60 57 42pregnancies :
The number of dropouts 44 40 36 32 37 28 49 50 54 49
Incidence of violence inand around schools
41 n/a 42 n/a 37 n/a 45 n/a 38 n/a
The number of studentscarrying handguns, knivesand weapons to school
25 n/a 22 n/a 19 n/a 31 n/a 28 n/a
The number of teenagesuicides
14 18 14 21 16 20 11 14 17 15
BASE 518 820 99 312
TEACHERS OF GRADES K-6
Overcrowded classes 53 49 55 44
Students' lack of interest in 50 n/a 41 n/atheir classes
Inadequate programs for 41 n/a 44 n/aremedial students
Absent (pism 34 28 225 30
Incidence of violence in 26 n/a 22 n/aand around schools
156 112 167 136 96 260
PERCEN T AGE49 44 46 52 70 62
46 n/a 56 n/a 51 lila
33 nia 39 n/a 54 n/a
31 22 35 29 46 30
23 n/a 27 n/a 35 n/a
BASE 523 1124 100 395 132 156 188 209 103 364
30 4 0

Table 2-8
TEACHERS OF GRADES 7-12
The amount of drinkingby st udents
The number of studentswho lack basic skills
The number of studentsusing drugs
The number of teenagepregnancies
The number of dropouts
Incidence of violence inand around schools
The number of studentscarrying handguns, knivesand weapons to school
TEACHERS EVALUATE PROBLEMS IN THE SCHOOLS:BY TYPE Or SCIIOOL AND EXPERIENCE
QUESTION: I am going to read some things that some people have said areproblems with the public schools. Afte. read each one, please tell nu,if you think that problem is very serious, somewhat serious, not veryserious, or not at all serious in the public school in which you teach.(READ EACH ITEM)
1 OTALTEACHERS
'95 '85
76 65
74 80.::
64 59
*E.
59 O.
44 39
41 n/a
25 n/a
The number of teenage 14 18suicides
BASE
"VERY SERIOUS" OR "SOMEWHAT SERIOUS"TYPE OF SCHOOL EXPERIENCE
.11510R HIGHSCHOOL HIGH
'95SCHOOL
'85'95 '85
PERCENT63 51 87 81
74 80 72 80
58 50 69 67
46 37 69 59
30 30 54 50
43 n/a 38 n/a
27 n/a 23 nk
14 18 16 18
LESS10 YEARS
'95
THAN
'85
10 TO 19YEARS
20 YEARSOR MORE
'95 '85'95 '85
AGE83 73 70 62 76 66
71 82 72 84 76 73
75 58 57 60 62 56
58 55 55 48 63 44
43 46 40 38 47 35
49 n/a 35 n/a 40 n/a
34 n/a 21 n/a 23 n/a
18 21 12 19 14 13
518 820 240 407 309 453 116 137 159 399 243 284
4 131

AMeRICANTOACH ER
Budget and Reform Issues
Most teachers do not agree that fund allocations in their districts are equitable.llowever, only a third agree that funds to serve children with special needs are toohigh. One-fifth (21%) of teachers agree tnat the allocation of funds across schooldistricts in their states is equitable; four in five disagree (79%). The proportionsvary little, despite the type of community where schools are located, the type ofschool in which they teach, the number of years of experience, and gender (differ-ing by no more than 4%). Teachers in the South (25%) are more inclined to agreethan those in other regions.
One-third (34%) of teachers agree that the proportion of funds in their schcaldistricts going to serve children with special needs is too high; 64% disagree. Notsurprisingly, teachers in inner city schools (30%) where students are more oftenfaced with environmental pressures and family concerns that leave them ill pre-pared for the classroom agree somewhat less with this statement than teachersin other urban areas (37%), as well as those in small towns (38%), rural areas (34%)or the suburbs (32%). 'leachers in the South (29%) are less likely to agree than teach-ers in other regions. Male teachers (41%) are more inclined to feel this way thanfemale teachers (31%). 'Itvo in five teachers in both junior high (40%) and high school
(40%) agree that funds going to serve children with special needs are too high, com-pared to only 27% of elementary school teachers.
Table 2-9
32
ATTITUDES ABOU'T Fun ALLOCATION
QUESTION: Do you agree or disagree with the following statements?
AGREE DISAGREE
PERCENTAGE
The proportion of funds in my district going to serve childrenwith special needs is too high
I feel that the allocation of funds across school districtsin my state is equitable
21 79
BASE 1995:1011
4 ' )

Table 2-10 ATTITUDES ABOUT FUND ALLOCATION:
BY REGION AND SIZE OF PLACE
QUESTION: Do you agree or disagree with the following statements?
Base: % Who Agree
REGION SIZE OF PLACE
MID INNER OTHER SUB- SMALLTOTAL EAST WEST SOUTH WEST CITY URBAN URBAN TOWN RURAL
I feel that the allocation offunds across school districts inmy state is equitable
The proportion of funds in mydistrict going to serve childrenwith special needs is too high
PER C E U T A G E
21 21 23 20 23 23 20 24 20
34 27 40 40 25 27 37 41 31
BASE 1011 523 240 309 95 159 757 301 710
Table 2-11 ATTITUDES ABOUT FUND ALLOCATION:
BY TYPE OF SCHOOL, YEARS OF EXPERIENCE, AND GENDER
QUESTION: Do you agree or disagree with the following statements?
Base: % Who Agree
TYPE OF SCHOOL YEARS OF TEACHING EXPERIENCE GENDER
ELEMEN JUNIOR HIGH LESS 10 ORTOTAL TAR1 HIGH SCHOOL THAN 10 5 - 9 MORE MALE FEMALE
T AGEI feel that the allocation offunds across school districts inmy state is equitable
The proportion of funds in mydistrict going to serve childrenwith special needs is too high
PER CEN21 19 17 25 21
34 38 37 29 35
21 21 21 22 19
30 37 32 38 34
BASE 1011 197 278 340 196 148 98 271 275 216
4 3
33

'Atvie,RIcANTeachers' Views of Immigration Legislation (Proposition 187)
California has recently passed legislation requiring that. children must be docu-mented residents before being permitted to attend public schools; the legislationis commonly known as "Prop 187."
Teachers outside California are very clear where they stand on the possible effects
of legislation similar to Proposition 187 on their ability to teach: three-quarters(72%) say it would have no effect at all. Teachers in inner city schools (61%) andother urban area schools (65%) are less inclined to feel this way than those in thesuburbs (70%), rural areas (75%) or small towns (79%).
In California, where this legislation was passed by voters (although it was erdoinedin November 1994), opinions are not so distinct. While a plurality of 47% says thelegislation will have no effect at all on their ability to teach, one in three (33%) sayit will have a negative effect, and one in five (19%) a positive one. Teachers in ruralCalifornia (70%) are considerably more likely than others to say the legislation willhave no effect at all. Those in small towns (40%) and the suburbs (39%) are morelikely to say it will have a negative effect. Suburban teachers are also likely to say itwill have a positive effect (26%), suggesting that teachers in the suburbs are themost ambivalent about the potential effects of the legislation.
Table 2-12 EFFECT OF PROPOSITION 187 ON ABILITY TO TEACH
QUESTION:
QUESTION:
You are probably aware of Cal(fornia's Proposition 187, the recentlegislation requiring that children must be documented residentsbefore being permitted to attend public schools. In your opinion, whattype of effect do you think Proposition 187 will hare on your ability toteach a positive effect, negative effect, or no effect at all?
If similar legislation was passed in your state, what type of effect doyou think it would hare on your ability to teach a positive effect,negative effect, or no effect at all?
OUTSIDE CALIFORNIA CALIFORNIA ONLYSIZE OF PLACE SIZE OF PLACE
INNER OTHER SUB. SMALL INNER OTHER SUB. SMALLRam, CITY URBAN URBAN TOWN RURAL TOTAL CITY URBAN URBAN TOWN RURAL
PER CENTPositive Effect 14 20 8 14 13 12
Negative Effect 12 18 24 13 7 11
No EfThct At MI 72 61 65 70 79 75
BASE
34
19
. .'.z33...,
q-Z1:47
AGE
14 15 26 20 10
24 31 39 40 20
62 54 35 35 70
916 127 85 240 255 206 95 21 13 31. 20 10

AMertIcANTeACHER
Strengthening the Quality of Education
As the challenges and problems that teachers confront at school have changedover the past decade, so have their views about how the quality of education can bestrengthened. Growing concerns about violence and changes in the academic needs
of students are reflected in teachers' views about the suggested actions that mightpositively impact the quality of education. Based on overall experiences at theirschools, most teachers believe that emphasizing school discipline, basic skills and
broadening the curriculum would have a positive effect on education in general.Majorities also believe there would be positive outcomes as a result of tighteninggraduation requirements, establishing minimum competency tests and increasing
the amount of homework required of students.A vast majority of teachers believe emphasizing school discipline and safety would
have either a strongly (75%) or somewhat (22%) positive effect on education in gen-
eral. Since 1984, there has been a considerable increase in the number of teachers
who feel this suggestion would have a strongly positive effect, from 60% to 75%. No
other suggested action has gained support to this extent. According to a majority of
teachers, emphasizing basic skills, such as reading, writing, and math, would also
have a strong (70%) or somewhat (26%) positive effect on education in general. This
has changed only slightly since 1984, when 74% felt strongly positive and 23% were
somewhat positive about this suggestion. Regardless of region, size of community,
type of school in which they teach, years of experience or gender, noless than 94%
of teachers say emphasizing school discipline and safety would have a positive effect.
Broadening the curriculum to include such things as computer literacy and for-
eign languages also is a popular suggestion for improving the quality of education,
with 58% of teachers feeling it would have a strongly positive effect (up from 49% in
1984) and 36% a somewhat pf itive effect. Nine in ten teachers feel broadening the
curriculum in these ways would have a positive effect, regardless of region, size of
community, type of school in which they teach, years of experience or gender.
OBSERVATION: This shift may be a reflection of the exponential growth in theday-to-day use of computer technology and the new wave ofimmigration into the country, two trends that are particularlynoticeable to teachers and which have greatly diverstfted thepublic school population over the past decade.
Tightening graduation requirements to include more academicallystringent sub-
jects would have either a strongly (38%) or somewhat (42%) positive effect on edu-
cation according to four in five teachers. In 1984, 50% of teachers felt it would be
strongly positive and 41% thought it would be somewhat positive. There are differ-
ences among teachers' views on tightening graduation requirements in this man-
ner. Teachers in the West (74%) are less likely to feel it will have a positive effect
than those in the Midwest (80%), South (82%) or East (86%). Elementary school
teachers (84%) are more likely to consider this suggestion as positive than are teach-
ers in junior high (79%) or high school (75%).
35

'-tHE
AMERICANT ACti ER
36
Eight in ten teachers believe that establishing minimum competency tests forstudents at predetermined grade levels would have a strongly (31%) or somewhat(46%) positive effect on education in general, a decline of 11% since 1984 for thosewho feel the effect would be strongly positive. High school (85%) and junior high(81%) teachers are more likely to feel this suggestion would have a positive effectthan elementary school teachers (73%). Teachers in the East (84%) are more inclinedto feel this way than those in other regions of the country.
Three out of five teachers feel it would have either a strongly (14%) or somewhat(48%) positive effect on education in general to increase the amount of homeworkrequired by students. However, since 1984, there has been an increase from 24% to36% of teachers who feel increasing homework would have a somewhat negativeeffect. Teachers with five to nine years' experience (56%) are less likely to think itwill have a positive effect than those with less (60%) or more (64%) experience.

Table 2-13
Emphasize basic skills. suchas reading, writing and math
Emphasize school disciplineand safety
Broaden the curriculum toinclude such things ascomputer literacy andforeign languages
Tighten graduation require-ments to include moreacademically stringentsubjects
Establish minimumcompetency tests for studentsat predetermined grade levels
Increase the amount of home-work required of students
WHETHER SUGGESTED CHANGES WILL HAVE A POSITIVE EFFECT ON EDUCATIONIN GENERAL
QUESTION: Based on your overall experience al your whool, and whether or notyour school already has such a policy. please tell nw whetlwr youthink each suggestion would hare a strongly positive effect, asomewhat positive effect, a somewhat negative effect, or a stronglynegative effect on education in general. (READ EA('H ITEW)
STRONGLYPOSITIVE
'95 '84
SOMEWHATPOSITIVE
'95
SOM FAVILATNEGATIVE
'95 '84
STRONGLYNEGATI%
'95
E
E
'84 '84
P ER CEN T A G
70 74 26 23 3 2 1
75 60 22 35 2 3 1 1
58 49 36 43 4 6 1 1
38 50 42 41 15 7 2 1
31 42 46 45 16 9 4 3
14 18 48 56 29 20 7 4
B A S E 1 995:1 01 1 1 9 8 4 : 1 9 8 1
*Less than 0.5%
4 7
37

Table 2-14
Emphasize basic skills. suchas reading. writing and mat Ii
Emphasize school disciplineand safety
Broaden the curriculumto include such things ascomputer literacy andforeign languages
Tighten graduationrequirements to includemore academically stringcntsuldects
Establish minimumcompetency tests for studentsat predetermined grule levels
I ii'i'tsi I he althltInt Of homeork required of students
BASE
38
- --- J - __a- --a
WHETHER SUGGESTED CHANGES WILL HAVE A POSITIVE EFFECT ON EDUCATIONIN GENERAL: BY REGION AND SIZE OF PEM'E
QUESTION: Based on your overall experience at your school, and whether or notyour school already has such a poll% please tell me whether you'think earh suggestion would hare a strongly positive effect, asomewhat positive effect, a somewhat negative effect, or a stronglynegative effect on education in general. (READ EA(H ITEM)
IOTAII EAVIIERs._ . ..
'95 '84
. _
"STRONGLY POSITIVE" OR "SOMEWHAT POSITIVE" EFFECT. .
REGION SIZE OF PLAGE
I-: Vs1 NIIIMEs1 Sot 'I H 11/4 Es I ( IT1 SI III RR RI 101. . .
'95 '84 '95 '84 '95 '84 '95 '84 '95 '84 '95 '84 '95 '84
PERCENT AGE96 97 95 97 96 98 97 97 93 92 93 96 95 96 96 98
96 95. 96 96 97 96 97 96 94 92 95 94 96 95 96 96
94 92. 93 94 95 93 94 92 95 88 92 92 94 91 95 93
81 91 86 92 80 91 82 92 74 90 78 93 79 91 81 91
44,
78 87 84 88 76 85 77 88 76 88 78 91 76 88 78 84
62 73.. 66 75 59 78 62 69 64 70 64 78 63 73 60 70
1011 1981 197 684 278 414 340 602 196 281 246 551 271 869 216 561
413

Table 2-15
Einphasize bask skills. suchas reading, writ ing and math
Emphasize scht oil disciplineand safety
Broaden the curriculum toinclude such things ascomputer literacy andforeign languages
Tighten graduationrequirements to includemore academically stringentsubjects
Establish minimummmpetency t est s for st udent sat predetermined grade levels
Increase the amount of borne-work required of students
BASE
WHETHER SUGGESTED CHANGES WILL BALE A POSITIVE EFFECT ON EDUCATIONIN GENERAL: BY TYPE OF SCHOOL, EXPERIENCE, AND GENDER
QUESTION: Based on your overall experience at your school, and whether or notyour school already has such a policy, please tell me whether youthink each suggestion would have a strongly positive effect, asomewhat positive effect, a somewhat negative effect, or a stronglynegative effect on education in general. (READ EACH ITEM)
TOTAL
'95 '84 _
"STRONGLY POSITIVE" OR "SOMEWHAT POSITIVE" EFFECTTYPE OF SCHOOL
LESS MAN5 YEARS
'95 '84
EXPERIENCE
5-9 YEARS
'95 '84
GE
10 YEARSOR MORE
'95 '84M )I.E
'95 '84
GENDER
FEMALE
'95 '84
ELEMEN-TARY
'95 '84
JUNIOR111611
'95 '84
1116115C11001.
'95 '84
CENP ER T A
96 97 95 97 96 97 95 95 97 96 97 96 95 97 96 97 95 97
96 95 97 95 96 95 95 95 )0 96 96 95 96 95 96 94 96 96
94 92 94 89 95 96 95 93 93 93 97 93 94 92 93 93 95 92
31 91 34 92 79 92 75 90 32 91 S I 90 80 91 79 91 81 92
78 87 73 85 81 90 85 88 76 93 71 84 79 87 81 90 76 86
62 73. 60 68 61 77 66 80 60 72 56 70 64 74 70 79 59 70
1011 1981 523 972 240 375 309 491 95 142 159 326 757 1513 301 685 710 1296
4_9
39

1HE
.4MeRICAN-TOICH ER
CHAPTER 3: STRENGTHENING THE PROFESSION
Establishing Standards
Three-quarters of teachers Nvor the current system for establishing profession-al standards, which allows individual states to set standards and define certifica-tion requirements for teachers. However, support for a state-directed system ofestablishing teacher standards and certification varies based on t he type of com-munity where teachers work. Inner cit, teachers (63%) are considerably less like-ly than small town teachers (80%) to favor the current system. Teachers in ruralareas (75%), other urban areas (71%) and suburbs (70%) fall between t hese twoextremes. Male teachers (78%) are more likely than female teachers (71%) to agreethat the job of establishing teacher standards and certification belongs to individ-ual states.
Half (52%) of public school teachers agree that having a national teachers' exam-ination will provide a sense that there are definable standards of excellence in teach-ing (47% disagree). The idea of a national teachers' examination has sparked debatein the profession for many years, so it is not surprising to find ambivalent support.There are differences among teachers in different communit ies. Teachers in theinner city (60%) are considerably more likely to agree that a national teachers' exam-ination will provide definable teaching standards, compared to less than half (48%)of suburban teachers. Those in other urban areas (54%), rural areas (53%) and smalltowns (51%) fall between these two ext remes. Female teachers (55%) are moreinclined than male teachers (46%) to believe that having a national teachers exam-ination will help define standards of excellence in teaching.
4)
:
41

Table 3-1
,- --------
The job of establishingteacher standards andcertification belongs to tlwindividual states
flaying a national teachers'examination will provide asense that there are definablestandards of excellence inteaching
BASE
42
VIEWS ON ESTABLISHING STANDARDS FOR THE TEACHING PROFESSION
QUESTION: Do you agree or disagree with the following statements?
Base: o Who Agree
SIZE OF PLACE GENDER
TOTM.INNERCITA
OTHERURBAN
PERSUB( MIAS
i-CENTSMALLTOWN RURAL
-----------A GE
MALE FEMALE
73 63 71 70 80 75 78 71
52 60 54 48 51 53 46 55
1011 148 98 271 275 216 301 710
t- 4

AMERICAN'TEACHER
Evaluating Suggested Changes for Improving the Profession
America's teachers have definite opinions on what will or will not have a positive
effect on the quality of teaching in public schools. Large majorities believe provid-ing incentives to encourage students to go into teaching (92% in !995, 94% in 1984),making it. easier to remove incompetent teachers (89% in 1995. 84% in 1984), andrequiring competency tests for certification (86% in 1995, 82% in 1984) would have
a positive effect on the quality of teaching. Smaller majorities feel it would have a
positive effect to require periodic re-testing of teachers in specific subjects (62% in1995, 57% in 1984) and to set higher salaries for teachers who specialize in subjectsin which there are teacher shortages (56% in 1995, a plurality of 50% in 1984). Three
in five teachers (59% in 1995; 61% in 1984) think it would have a negative effect toallow school districts to hire talented people who are not certified teachers. However,
two in five (39%; 37% in 1984) teachers continue to agree that allowing school dis-tricts to hire talented people who are not certified teachers would have a positive
effect.
OBSERVATION: It is interesting to note that support for competency tesUng forboth students and teachers has declined since 1984.
Teachers in different regions of the country have varied views about these sug-gestions for reform. In the East (91%), they are more likely than in the West (80%)to think requiring teachers to take competency tests before certification would have
a positive impact. Since 1984, more teachers in both the East and South are likely
to feel this way. Teachers in the South (68%) are considerably more likely than in
any other region to support setting higher salaries for teachers who teach in sci-
ence and math or other areas in which there are teacher shortages, and the Southis the only region where there is a significant increase since 1984 in the proportionof teachers who feel this way. Teachers in rural areas are supportive of setting high-
er salaries for scarce teachers (63%), compared to those in cities (57%) or in thesuburbs (49%). Also, only for teachers in rural areas has there been an increase inthe proportion who support this suggestion, from 50% in 1984 to 63% in 1995. However,
teachers in rural areas (57%) are less likely than those in the suburbs (61%) or cities
(66%) to support periodic re-testing of teachers in their subject matter. Only cityteachers have seen an increase in the proportion who support this, from 55% in 1984
to 66% in 1995.Teachers of different grade levels, for the most part, share similar views about
suggestions for reform. However, while all large rritOrities, junior high teachers(93%) are more inclined than elementary (88%) or high school (88%) teachers tothink it would have a positive effect on the quality of teaching to make it easier to
remove incompetent teachers.Teachers with ten or more years of experience are less inclined than teachers
with fewer years of experience to spy t hat setting higher salaries for scarce teach-
ers and requiring periodic testing of teachers would have a posit ive effect on t he
quality of teaching in America's putelichools.
43

Table 3-2 WHETHER SUGGESTED CHANGES WILL HAVE A POSITIVE EFFECT ON THE
QUALITY OF TEACHING
QUESTION:
Provide special incentives toencourage outstandingstudents to go into teaching
Make it easier for incompetent;teachers to be removed
Require teachers to takecompetency tests beforecertificat ion
Set higher salaries forteachers who teach in scienceand math or other areas inwhich there are teachershortages
Require periodic retestingof teachers in their subjectmatter
Allow school districts to hiretalented people who are not(ertified teachers
Again, based on your overall experience at your school, and whetheror not your school already has such a policy, please tell me whether
you think each suggestion wovld have a strongly positive effect, a
somewhat positive effect, a somewhat negative effect, or a stronglynegative effect on the quality of teaching in America's public schools.
STRONGLYPOSITIVE
SOMEWHATPOSITIVE
SOMEWHATNEGATIVE
STRONGLYNEGATIVE
'95 '84 '95 '84 '95 '84 '95 '84
PER CE N T A G E
49 51 43 43 5 5 1 1
54 52 35 32 8 10 '3 4
42 42 44 40 8 11 4 6
23 21 33 29 25 26 18 23
16 15 46 42 24 25 14 17
11 9 28 28 31 29 28 32
BASE1995:1011 1984:1981
44

Table 3-3 WHETHER SUGGESTED CHANGES WILL RAVE A POSITIVE EFFECT ON TEE
QUALITY OF TEACHING: BY REGION AND SIZE OF PLACE
QUESTION: Again, based on your overall eaperience at your school, and whetheror not your school already has such a policy, please tell me whetheryou think each suggestion would have a strongly positive effect, asomewhat positive effect, a somewhat negative effect, or a stronglynegative effect on the quality of teaching in America's public schools.
"AGR EE STRONGLY" OR "AGREE SOMEWHAT"REGION SIZE OF PIACE
TOTALTEACHERS EAST MIDWEST SOUTH WEST CITY SUBURB RURAL
'95 '84
Provide special incent ives to 91.93
encourage outstandingstudents to go into teaching
Make it easier for incompetent 89 . 85
teachers to be removed
Require teachers to takecompetency tests beforecertification
Po86 82
Set higher salaries for 56. 50
teachers who teach in scienceand math or other areas inwhich there are teachershortages
Require periodic retesting 62,57of teachers in their subjectmatter ,,1
Allow school districts to hire 39 38talented people who are notcertified teachers
'95 '84 '95 '84 '95 '84 '95 '84 '95 '84 '95 '84 '95 '84
PER CEN T AGE
93 92 92 94 93 94 86 93 91 92 89 93 94 94
93 83 85 85 91 86 86 85 88 82 90 86 87 85
91 80 84 85 88 82 80 80 85 84 87 80 85 84
49 50_ 47 44 68 55 47 57 50 49 50 63 50..57
:
68 55 66 61 56 53 60 58 66 55 61 56 57 59
37 41 30 34 45 36 43 42 45 39 35'38 38 36
ASE 1011 1981 197 684 278 414 340 602 196 281 266 551 271 869 216 561
4;
45

Table 3-4 WHETHER SUGGESTED CHANGES WILL HAVE A POSITIVE EFFECT ON THE QUALITY
OF TEACHING: HY TYPE OF SCHOOL, EXPERIENCE, AND GENDER
QUESTION: Again, based on your overall experience at your school, and whetheror not your school already has such a policy, please tell me whetheryou think each suggestion would have a strongly positive effect, asomewhat positive effect, a somewhat negative effect, or a stronglynegative effect on the quality of teaching in America's public schools.
STRONGLY OR SOMEWHAT POSITIVETYPE OF SCHOOL EXPERIENCE GENDER
ELEMEN- JUNIOR HIGH LESS THAN 10 YEARSTOTAL TARY HIGH SCHOOL 5 YEARS 5.9 YEARS OR MORE MALE FEMALE
'95 '84 '95 '84 '95 '84 '95 '84 '95 '84 '95 '84 '95 '84 '95 '84 '95 '84
Provide special incentives toencourage outstandingstudents to go into teaching
PERCENT AGE91 93 91 93 91 95 90 93 94 95 92 92 91 93 93 94 91 93
Make it emier for incompetent 89 85. 88 84 93 85 88 85 92 90 91 87 88 84 87 86 89 84teachers to be removed
Require teachers to takecompetency tests beforecertification
Set higher salaries forteachers who teach in scienceand math or other areas inwhich there are teachershortages
Require periodic retestingof teachers in their subjectmatter
Allow school districts to hiretalented people who are notcertified teachers
BASE
46
86 82 85 79 90 86 87 84 87 90 86 79 86 82 85 85 87 80
v:114.
56 50 57 53 57 48 55 48 72 65. 60 61 54 48 59 51 55 50
62..57i 61 54 64 59 61 61 68 72 70 61 59 54 66 59 60 55
39-38 41 36 :38 41 39 38 :35 38 44 40 38 37 39 41 :39 36
1011 1911 :23 972 240 375 309 491 ?5 142 159 326 "57 1513 301 685 710 1296
5

AMeRIcANTACHER
CHAPTER 4: WHY TEACHERS THINK ABOUT LEAVING
Who Thinks of Leaving Teaching
On t he whole, teachers are less likely to say t hey have seriously considered leav-Mg teaching now than t hey were in 1985. Of those that have consideled it, only onein four say it is either fairly or very likely they will leave for another profession inthe next five years. Teachers in the East, South, and West have seen considerabledecreases since 1985 in the proportions who say they have considered leaving; onlyin t he Midwest has the number remained constant (42% in 1995 vs. 46% in 1985).
Two in five (41%) teachers have, at some time in their careers, seriously consid-ered leaving the profession for another occupation, a 10% decrease from 51% in 1985.
With this proportion declining over the past decade, it is not surprising that onlyone in four (24%) report they are likely to leave teaching for some other professionin the next five years. Fully half (51%) currently say they are not at all likely to leaveteaching for another profession in the next five years (47% in 1985), and 24% saythey are not too likely (26% in 1985). Majorities say they have not considered leav-ing, regardless of the region in which they teach, the size of their communities, years
of experience, gender or type of schools in which they teach. As would be expected.teachers who are very satisfied with their careers (26%) are the least likely to haveconsidered leaving, compared to those who are somewhat satisfied (52',) or dis-satisfied (75%).
56
47

Table 4-1 WHO THINKS ABOUT LEAVING TEACHING: BY REGION
QUESTION:
QUESTION:
TOTALTEACHERS
'95 '85
flare you erer seriously considered leaving teaching to go into someother occupation?
Within the next 5 years, how likely is it that you will leave theteaching profession to go into some different occupation rerylikely, fairly likely, not too likely, or not at all likely?
EVER SERIOUSLYCONSIDERED LEAVING:
Yes, Considered 41 51
No, Not Considered 59 49
LIKELY TO LEAVEWITHIN THE NEXT 5 YEARS:
Very Likely 12 -12
Fairly Likely 12 1441
Not Too Likely 24 26
Not At All Likely 51 wiz-14
REGION
EAST MIDWEST SOUTH WEST
'95 '85 '95 '85 '95 '85 '95 '85
PER CE N T A G E
37 52 42 46 41 52 41 56
63 48 58 54 59 47 58 14
13 13 11 10 14 13 12 15
12 15 12 12 13 16 12 14
15 29 28 27 25 24 22 27
59 43 49 50 48 48 53 44-:
B A S E NM 11346 197 676 278 254 340 325 196 591
t70-4
48

Table 4-2 WHO THINKS ABOUT LEAVING TEACHING: BY SIZE OF PLACE
QUESTION:
QUESTION:
Hare you ever seriously considered leaving teaching to go into someother occupation?
Within the next 5 years, how likely is it that you will leave theteaching profession to go into some different occupation verylikely, fairly likely, not too likely, or not at all likely?
TOTALTEACH E RS
'95 '85
SIZE OF PLACE
INNER CITY OTIIER URBAN SUBURB SMALL TOWN RURAL
'95 '85'95 '85 '95 '85 '95 '85 '95 '85
EVER SERIOUSLYCONSIDERED LEAVING:
PER CEN T AGEYes, Considered 41 51 47 56 49 53 39 51 40 50 37 50
No, Not Considered 59 49 53 44 50 47 61 49 60 50 63 49
LIKELY TO LEAVEWITHIN THE NEXT 5 YEARS:
Very Likely 12 12 15 17 15 16 13 13 14 12 7 9
Fairly Likely 12 14 18 19 15 20 10 12 9 13 14 13
Not Too Likely 24 26 24 20 17 24 23 27 23 27 26 29
Not At All Likely 51 47 43 45 51 40 54 47 53 48 52 48
B ASE 1011 '18e 148 264 98 231 271 .528 275 478 216 340
49

Table 4-3 WHO THINKS ABOUT LEAVING TEACHING: BY TYPE OF SCHOOL
QUESTION:
QUESTION:
TO rAl. TEACHERS
'95 '85
EVER SERIOUSLYCONSIDERED LEMING:
Yes, Considered 41 :51
No, Not Considered 59 49
LIKELY TO LEAVEWITHIN THE NEXT 5 YEARS:
Very Likely 12 -:;4. 2.. .
450Fairly Likely 12 ,,. 4.
trire.4Not Too Likely 24 4 t.:
Have you ever seriously considered leaving teaching to go into someother occupation?
Within the nest 5 years, how likely is it that you will leare theteaching profession to go into some different occupation rerylikely, fairly likely, not too likely, or not at all likely?
:-.,,,,-4Not At All Likely 51 .Y.I..}. 1.
TYPE OF SCHOOL
ELEMENTARY
'95 '85
JUNIOR
'95
HIGH
'85
HIGH SCHOOL- -'95 '85
PERCENT AGE37 46 43 59 46 60
62 54 57 41 54 40
12 11 14 15 13 15
11 13 10 17 16 14
22 25 27 26 24 32
54 50 49 42 47 39
BASE 1=46 523 1124 240 487 309 453
ng
50

Table 4-4 WHO THINKS ABO1T LEAVING TEACHING: BY EXPERIENCE AND GENDER
QUESTION:
QUESTION:
Hare you ever seriously considered Ieming teaching to go into someother occupation?
Hithin the next 5 years. how likely is it that you will leave theteaching profession to go into some different occupation verylikely, fairly likely. not too likely, or not at all likely.'
EVER SERIOUSLYCONSIDERED LEAVING:
LOT NIFF: V II F:lis
'95 '85
LESS ill s.5 ',FARS
'95 '85)
'95
PERCE
EXPERIENCE
5-9 10-19E Rs 1E \
'85 '95 '85
N
1E %RsOR MORE
'95 '85
T A G
'95
E
GENDER
xl I FEM NH:
'85 '95 '85
Yes, Considered 41 51 42 38 :39 57 43 54 40 46 50 67 :37 45
No. Not Considered 59 49 58 6') i;1 13 57 46 60 54 50 3.) 63 55
LIKELY TO LEAVE
1VITHIN THE NEXT 5 YEARS:
Very Likely 12 12 13 10 7 13 8 8 17 20 15 17 11 10
Fairly Likely 12 14 23 9 13 16 11 17 11 10 11 16 13 13
Not Too Likely 24 26 29 :34 35 :32 29 15 17 24 30 24 25
Not At All Likely 51 47 43 50 45 36 49 45 57 53 30 36 52 51
BASE__
1011 1846 95 88
_
159 252 302 894 455 610 301 591 710 1255
60
51

Table 4-5 TEACHERS WHO THINK ABM T LEANING TEAcHING:
BY DEGREE OF CAREER SATIsACTION
QUESTION:
QUESTION:
Hare you erer seriously considered leaving teaching to go into some
other occupation?
Within the next 5 years. how likely iu it that you will leare theteaching profession to go into some different occupation rery
likely. fairly likely, not too likely, or not at all likely!
SATISFACTION WITH TEACHING AS A CAREER
SOMEWHATNEI %I. TEACHERS %E.R5 sklisFIED SATISFIED Dm.% risi-nn
_ .
'85
1
'95
41
59
12
12
24
51
EVER SERIOUSLYCONSIDERED LEAVING:
Yes, Considered
No. Not Considered
LIKELY TO LEAVEWITHIN THE NEXT 5 YEARS:
Very Likely
Fairly Likely
Not Too Likely
Not At All Likely
BASE
52
, 51;.....-..
i=.E''..
491--. .
....1:
...-
'95
P E
'85 '95 '85 '95 '85
R C E N T A G E
26 29 52 59 75 86
74 71 48 40 25 14
7 7 12 10 38 28
6 6 18 17 23 28
21 20 31 35 15 27
66 67 38 38 24 18
1011 :1846 548 ..785 338 652 123 .433

ES
'SI0011.1S !put! .10 umpuins UI sJo
-puo ',Moan? Innit slotlayol loops ogynd tnnim ill011111 0111.)11 ,L10111 ,),111 stuolgo.n1
osotp g1ot1 .10!1.In1 no lou sv .((?8fi I II! 00!1.10(load )tuus .11).W.ko Isom ly
ssoa wall-I oplin foal 01 saot110 11Eql ,aqa)!ll olow osn? (.4,1 molgo.ni snopos y s! sigls otsmi `situlor! smopros Jo aogtunu otu uni ..us Otim SJ l.W)1 th?!.nut.ms
(ti8!!! u! isougy ss,mis 1B34.1 o.nlopodxo 01 s.lotuo o.nnu
o.n? molgoad snows X.loA E s-ossup popm0.1o.limo Xus !aim .s.topyol lootios mow olo itiotut? ssoals g0i.01 porlaa Xiosola tumuo.1 sossup pop.kw.uhmo
.Suunutuum Jo uo!'siad `oouopmbca Jo sivo, 'puol bq qouvvi u! loops Jo othi aq 1 Jo ssolpa0a1 `wols!suoo /0Agyi,u JiB so,ntopodxo osou
:tiao.ko pup? Ii oal ((ay apBoop B pm? hpol ,k,o! x!s ow) puy '100.11 ti,"i111) nuakos ssaais watsi Joplin laaJ 0 otunuma (y86 u! (.?;,oz: '(:66 u! %6!)
o.kg UI ou0 '.1oAo.kk0ll .(!-)) ov opuoap 1.? Sy uo!llodold oums Jul .11Bri.1.1!A 5loom
o.n.kk1 oauo um1 1 olotu SSJJ1 1BJJ aapun pa! ./U?s (tut:9) sputil-ukki 'wool -sstp )tl1 u! Joy] S1J1i.M)1 wq sutolgold it.quasaom uogo pm? litutut Jul ndsou
a.kg Ixou Jul triu .totumn? .10.1 tunssomd ataql 3Aual ilv lB 100 on? fljj oveating
'loops u? a.mopodxo .Wti ssalls JO aa.tap NI JO ssolp.rao.1 .soppolYat .10 sat lgvanvi
11! 1 Io.ou .10 loom B Jou!? umn sso! ssags pa! otok &mill Jo 068 put? >loom 1? aovik.1 .10
oolut sso,us poi 011.kk .0 I 01 poredumo 'suolluolu! timis ssoatho Jam .10 looAk B satull imakos ssol 1 poi 01i .kk &mu?, JO %8! - savoli; JAL) 1X011 01111111MM 1.1011Bd11.M0 11.10.I0J
-AP E .I0J 110!titi0J0.1d iitlItpB111 Jul iBJ 01 XIol!I .u0.1 JiB JLl I ;11;!ti 01 slotuo atom On s!syq monbog .q.uy! Y ssoals pal 01 pual oqkk saopyo '.kl.ryintu!s?
.110!ssokud otu UI
po.lop!suo.) .k)snopos ,ot11 Nys JoAou .10 >loom y ootto liBti I sso! ssol Is gal 0q.kk
,),!;t: Pup loom o.n.kk 1 Jo ootio ,k1u0 n otIkk %!;!- 'loom B s.1:1) paws SSA! Is gal 0q.kk slogoro I Jo .m:9 uoti.kk `(:8!! j u! 1IBL I lakw! .kicpuoinsuo.) JIB stio!podogi oson
'so.tuopotixo luosogi .goli I JO ssogwei.fol pig '.10A011 .10 100.11 11 0.1110 U1?111 Sticl IS
lopun pa! otok ptn? Noom B n!Akl Jam) ssat I pal Ou.kk osotli Jo %61: 01 po.uni
-0110.) "sitnAvol poloptstwo .qsnopos oAyq &NI ABS 0.10111 .10 MMAI ly.w.kos Sti0.115
tior foal otl,kx 5.1oti.tyol ,tt! (%!(:) JivH lunssop.nitotliour .101 inutioyoi
.lop!suo.) 01 o.n? .011 .1o>!!! awn! JLII `ssol tio!' pa! saoti.mo1 tiouo (mow ,nu,
fiumoBoi hu!neal uo ssails qor lo pedwi cqi

Table 4-G TEACHERS WHO THINK ABOUT LEMING TEACHING: B1 FREQUENCY OF JOB STRESS
QUESTION:
QUESTION:
flare you erer seriously considered Ieming teaching to go into some
other occupation?
Hithin the next 5 years, how likely is it that you will leave tlwteaching profession to go into some different occupation rerylikely, fairly likely, not too likely, or not at all likely?
EVER SERIOUSLYCONSIDERED LEAVING:
for II. I E VDERS
'95 '85
,
Yes. Considered 41 51
No. Not Considered 59 49
LIKELY TO LEAVEWITHIN THE NEXT 5 YEARS:
Vet-y Likely 12 12
.' "77:: ' :
Fairly Likely 12 14
Not Too Likely 94 26
vc.i.:-..--1
Not At All Likely 51 47_
BASE
54
,..........._.
FREQUENCY OF FEELING UNDER GREAT JOB STRESS^ - - - ,
SEA ERAI. DAIS Os.CE OR 1.1..s IDA \ OM EA %UTE OR MORE 'MDT I %IEEE I III:Eh OR NI I I.R....
'95 '85 '95 '85 '95 '85
PER51 63
i9 37
18 16
16 18
24 28
42 38
CEN T AGE39 49 30 39
1;1 51 70 61
1011 unr14-6 354 700
63
10 11 8 9
19 13 8 11
26 26 19 25
5 i 49 65 55
382 618 275 .526

Table 4-7 TEACIIERS AND JOB STRESS: BY REGION
QUESTION: Almost all people hare some stress in their tires. but some hare a greatdeal of stress. In yourjob as a teacher, how often do youfeel undergreat stress almost erery day. several days a week, once or twice aweek, less often than once a week, or neren)
Almost Every Day
Several Days a Week
Once or Twice a Week
Less Often than Once a Week
Never
TO po,T E NCH Elt
'95 '85
16 16: . i
19 20
38 34
24 27
3 i ':,,, 3 ..;
_'95
, -it,
18
37
24
6
EAST
'85
PER
.1.4
19
:36
26
3
MI DW EST
'95 '85
CEN
15 15
21 22
40 30
22 31
2 3
REGION
sot TII
'95 '85
T A GE
18 18
18 21
:37 35
24 24
2 2
W Es!'
'95 '85
16 13
17 20
37 35
26 29
4 3
B ASE
,.... __,
1011 --1146 -' 197 676 278 254
64
340 325 196 591
^
55

Table 4-8 TEACHERS AND JOB STRESS: BY SIZE OF PLACE
QUESTION: Almost all people hare some stress in their lives, but some hare a greatdeal of stress. In yourjob as a teacher, how often do youfeel undergreat stress almost every day, several days a week, once or twice aweek, less often than once a week, or never?
TOTALTEACHERS
SIZE OF PLACE
INNER CITY OTHER URBAN SMALL TOWN
'95 '85
15
18
:36
29
3
KURA!
'95 '85
16
21
27
34
2
'95 '85 '95 '85 '95 '85 '95 '85
Almost Every Day
Several Days a Week
Once or 'Mice a Week
Less Often than Once a Week
Never
F.--16 16
H.19 . 20
! .
38 34
24 271
3 L.;
PER20
17
45
17
1
17
22
36
21
4
C
17
16
10
19
7
EN
15
24
:39
18
3
T
15
21
). r--
25
2
A G
17
20
35
25
2
E
16
21
32
26
5
15
15
41
27
2
B A SE 1011 '78-41" 148 264 98 231 271 528 275 478 216 340
56
65

Table 4-9 TEACHERS AND JOB STRESS: BY TYPE OF SCHOOL AND EXPERIENCE
QUESTION:
101A1.IEM 11ERN
95 '85-
Almost Every Da 16 16
Several Days a Week 19 20
Once or Bvice a Week 38 :34
Less Often than Once a Wee 24 27
Never 3 3
BASE
1
lmost all people hare some stress in their lives, but some have a greatdeal of stress. In yourjob as a teacher. how Oen do youfeel undergreat stress almost every day. several days a week, once or twice aweek, less alien than once a week, or never.'
ELEMENl'AR1
'95 '85
TYPE
.11
'95
P ER
OF SCHOOL
1111.11
. .
'85
LESS 111AN10 1E1RS
'95 '85
T A GE
EXPERIENCE
10191EARS
'95 '85
20 lEARNOR MORE
'95 '85
N1OR
'85
til11001._
'95
CEN18 15 19 15 12 16 11 14 13 14 21 19
19 20 20 24 17 18 21 17 19 24 17 18
39 34 36 :30 :37 36 42 34 41 36 33 30
2228 22 29 28 28 23 32 23 24 25 30
2 2 4 3 5 2 3 2 4 2 3 4
mil T846 523 1124 240 407 309 453 254 340 302 894 455 610
6657

Table 4-10
Almost Every Day
Several Days a Week
Once or Twice a Week
Less Often than Once a Week
Never
BASE
58
TEACHERS AND JOB STRESS: BY SERIOUSNESS OF A TOP PROBLEM IN THEIR SCHOOL
QUESTION:
MT 51.TE HERS
'95 '85
16 16
19 20
38.34:
24J271
3 4.
Almost all people have some stress in their lives, but some have a greatdeal of stress. In yourjob as a teacher, how often do youfeel underoeat stress almost every day, several days a week, once or twice aweek, less often than once a week, or never?
ELEMENTARY TEACHERS SAYINGTHAT OVERCROWDED CLASS IS:
1ER1SERIOI S
PROBLEM. _
'95 '85
SOMEItIIATSERIOUSPROBLEM
'95
P ER'85
SOTSOT
SERIOIPROBLEM
'95
CEN
URI..1.1
'85
24 23 16 16 16 12
19 18 20 20 18 20
32 36 38 35 43 33
22 21 23 26 22 32
3 1 2 3 2 3
SECONDARY TEACHERS SAYINGTHAT THE NUMBER OF STUDENTS
LACKING BASIC SKILLS IS:
VER1SERIOUSPROBLEM
'95 '85
NOT sEin.Nifr
SOMEWILVISERIOUS SERIM SPROBLEM PROBLEM
'95 '85 '95 '85
T A G E
21 21 14 12 10 17
13 21 22 22 15 18
42 30 36 35 36 29
21 26 23 28 34 33
3 2 5 3 4 2
1011 1846 96 253 183 350 244 520 107 276 275 390 135 153
6 7

1HE
AMERICANTeACti ER
Reasons Teachers Cite for Thinking About Leaving
In 1985, inadequate salaty was the most often ment ioned reason teachers gavefor making them consider leaving teaching. Eleven years later, it is st ill the mostfrequently mentioned reason, just to a lesser degree: in 1085, t hree in five (62'1.)teachers cited inadequate salaries: in 1995 it has decreased to two in five (-11%).The most often ment ioned item on the rise since 1085 is the lack of administrativesupport (from 14% to 25%). On the decline over the past decade are lack of respector support from parents (from 21". to 1-1".), lack of motivation by students (from11". to W.) and paperwork (frion 12". to 4%).
59

Table 4-11 WHAT MAKES TEACH EltS THINK ABOUT LEAVING
QUESTION: nal were the main things that made you consider leaving teaching?Anything eLse?
Base: Current Teachers Who Seriously Considered Leasing
Inadequate, Low Salary
Lack of Administrative Support
Lack of Discipline by Students
Lack of Respect/Support from Parents
Society's Attitude Toward Teaching/Lack of Respect or Support
Extracurricular Activities
CURRENT TEACHERS WHO SERIOUSLY CONSIDERED LEAVING
M EN
'85. _
WO M EN
'95
A GE_
'85'95
51 77 :34 53
11 24 15
11 19 20 23
10 13 17 24
12 5 8 8
4 n/a 8 n/a
5 7 7 9
7 13 6 10
7 5 5 7
4 3 4 5
5 5 4 17
1 4 6 6
3 5 3 10
1 5 3 7
1 5 3 5
1 6 3 7
TOTAL
'95 '85
PERCENT41 62
25 14
18 21
14 21
9 7cFr
.:1 - .r ,1
7 n/a.g
Stress 6
A!: 1.;1 ,-A i --,,.11Lack of Motivation by Students/Student Apathy -r,-:- .-1.;. -.. .i
Lack of Respect from Students .06:. ,- =:.6-
Burnout 'I .4
.. .. ,. .
Paperwork ' 12
4,...7;,:ii-- . -.-fe:-.'Long Hours ,./:..0-:; : -.-- u :.
. ,.
Overcrowding, Cla:zs Size '' 3 .,8. ...
:,-..Lack of Supplies, Materials, Funds
..3 6
Frustration (with the System) 1 - .5
,-.-,
Opportunity to do Something Else/Wanted to Try Something New
BASE
2 7
411 985 150 387 281 598
60 6 9

10.Nol oitomuthuo.) u gorlaqlotiv `iitgpuu LI! .tirtJm) Jo osnuooq -t pin! sujouou pla? .1!.1noos q0{.101 s! Xus pinom mo.mod ouo!ss,)jo.ul 4)111 ioq I u0svol flJ 1 s! (%F. jo 0.10) 1P11) .)!S 0) .q0111 ISOIll 0,11! S.I1W 0,:ou at!) Log I tuussojaul 30 quoin? .10J'iiumapo oAro! 01.q,»I!! Iou on? .0t11..0?s !Rim slogo-uol'uof aou ftitpu!.!
Jo `ii011pi:0 1 JO 0.101 'Sluouog Pm? ,1!.1noos gorjo so.now IJ 1 tia.,!)
&spinal u! AS oi oppou moon, suoseold
"sllIill.)1) UI uutil olom suoissajomi ao1110 UI so!JITIN ,n1) Hoj siallouol JO %18 '(.18!!I UI :pauutio Iou VdJ uo!itiaoaad au) 'ffela.0 "siumovol UI umillo I I, I 01 slit!! judn.),)0 101110 saprivs iu amao.lod (41) m slatpuol jo so!u.u*w 'suo!ssajoad o3IAJos .itiourt aftave urtuaoglqg 'apv3op isud .1oAo sasilaa3u! .i.rep?s olguloptsuo.) udsou .('i2,8) illtijouol O pamiwo,) Not) su0!11?chloa0 .1014 40 Joilog oq oi PaJoNs 4103 tI 0.WAJOM 11 X)ares jellosJad tU0!1!pp1 U lugudnoo0 .hu.00 olv ( IL) gum 1.10M 01 awl! Soto luatudInbo puu (%F.1) woad luuo!ssajold pa) S.10 ual LI! Lianas 'ajdumo JOA .`ittutiovol 01 soA! plump? S1 po.hw!suoo 0.1141 coq1 11;)!tot suotrudnpoo ama saapro) Imp sulau Jo lawn I? an oJato, .xia,!wadsai '%ut, pup %tt 30(.3o,tom suot wodo.ut uatim `e861 INP hto LI1i olow sucurednooo .totrio urall`liuulova) U lonog (%Fc;) sjuauaq aouusuisu! tiquati pm? (%F(-1) sujouog mauraapo.1`(%80 )uoloup Jun -oollolut oqj '(%80 sanlivollo3 JIJ3JO lo(pluo at!) ,ilua.uno pa! JaA0 No.k!1 -oodsaa .0861 ui %09 pm? !?,;89 `(09 01 pon?dumo) polaptsuoa Oati aoq10 oto U treql Iluppro I u! Jo nog S (% T L) tuumjstm pmosJod pul? (%11) s -uou uoppom ,cuJnoos go!' saagouoj uoi UI ua:los Isual .(%8t) saotpuo JO jjiq 1smure A liu!qoPo) u! la nag poaap!suo.) :11uo.lano 0861 lu! It: A liu! -gova) 10)10q palapisuo.) saaipua qaulm s,ou0 loA010.0u0;)ou sno.i uoAala PH) I1 limo suotpArwoo oIllo 01 .qqvio.vj 'mow son(1wo.) .s.101;yrj jo so!los um) oalolusuoo t;ogisuotvedn.mo ojuu.hmu oui liumoro I o.Imi -woo oi polst? olom suotssojo.ld palop!suoo .qsno!Jos o.wq 010 slou.yeol
suolssaiold lagio LIM Ougloeg Oupeclum
ONIN3V31. NI AVIS SH3H3V3I AKA :g U3IcIVH3 Id 1.1.2VAL
N'01211INV

Table 5-1 1985 TEACHERS COMPARE TEACHING VERSUS OTHER OCCUPATIONS
QUESTION: H'e'd like you to rale some of the aspects of teaching compared to(OCC(iPATION MENTIONED LV Q.14). From what you know, is/arethe (READ LI( H ITEM) better in teaching or better in (OCCUPATIO.VMEATIONED IN Q.I4)?
Base: 714 Teachers Who Seriously Considered Leaving For Some Specific New Occupation
MPECTS IN WHICH TEACHING IS RATEDBETTER OR EQUAL:
Job Security
Vacation Benefits
Personal Sat isfact ion
Caliber of the Colleagues You Wnrk With
Intellectual Challenge
Retirement Benefits
Health Insurance Benefits
BETTE RIN
TEACH! NG_
PERCENTBrrTER IN
OTHEROCCUPATION
SAME. NODIFFERENCE
(VOLUNTARN )
A GENOT SI RE
69 19 9 3
68 24 5 3
65 23 8 4
50 26 20 4
47 .' 38 13 2
44 -: as 8 11
40 35 17 9
ASPECTS IN WHICH OTHER OCCUPATIONSARE RXTED BETTER:
Total Number of Hours Worked Each Week 33
Your Control Over Your Own Work 31
Equipment You Have te Work Wit h 17
Professional Prest ige 18
Salary 12
7 1
62
;,` 47.....16 3
57 9 3
68 11 5
7; 74 6 3
81 3 3

Table 5-2 1995 TEACHERS COMPARE TEACHING VERSUS OTHER OCCUPATIONS
QUESTION: We'd like you to rate some of the aspects ofteaching compared to themost recent job you were considering. From what you know. is/arethe (READ EACH ITEM) better in teaching or better in the otheroccupation?
Base: 411 Teachers Who Seriously Considered Leasing For Some Specific New Occupation
BETTERIN
TEACHING
HEFTER INOTHER
OCCUPATION
NAME. NODIFFERENCE001.1 NTAR1) NOT NI RE
ASPECTS IN WHICH TEACHING IS RATED PERCENT AGEBETTER OR EQUAL:
Job Security 13 2
Vacat ion Benefits 71 23 4 2
Personal Sat isi'act ion 71 13 10 6
Caliber of t he Colleagues Thu Work Wit h 58 20 16 6
Intellectual Challenge 58 t'29 11 2
Retirement Benefits 52 7 8
Health Insurance Benefits 52 14 5
Your Control Over Your Own Work 48 :*42 7 3
ASPECTS IN WHIN OTHER OCCUPATIONSARE RATED BEnER:
Personal Safety at t he Wiirkplace 37 40 18 4
Total Number of 11i mrs Worked Each Week 25 . 60 13 2
Professional Prestige 18 8 2
Equipment You Have to Work Wit h 17 71 8 4
Salary 17 76 5 2
7263

Table 5-3 REASONS TEACHEIts DECIDE 1.0 STA\ IN TEACHING
64
QUESTION: (If the following masons. which One is the most important reason youare likely to stay in teaching? Is it because of the job security andbemjits. your lore of teaching. or tlw difficulty in finding anotherjobat a comparable lerel.'
Base: Likely To Stay In Teaching
.101) Security and Benefits
I.H\eoricitchilo;
Difficulty ill Finding Anilt her
BASE
73
YEARS OF TEACHING EXPERIENCE
10 OR10.111. I II V\ 10 NOIRE
PER CEN T A GE23 10 27
72 88 66
4 2 5
761 188 573

fNI
AME,RIcANTOCHER
CHAPTER 6: PROFILE OF THE AMERICAN TEACHER:1995 AND 1984
Teaching Experience
Thachers are staying in the profession considerably longer I hiii t hey did a decade
ago. Forty-five percent of teachers in t he United States say t hey have worked as ateacher for 20 or more years. From 1984 to 1995, the proport ion of teachers wit h 20years or more experience has increased at all grade levels: elementary school teach-ers from 25% to 42%, junior high teachers from 29% to 48% and high school teach-ers from 11% to 49%. The median nunther of years teachers have worked in total is18 years, an increase of 3.3 years since 1984.
A Teacher's Work Week
Majorit ies of teachers spend at least 46 hours in an average week on school-relat-ed responsibilit ies: inside the classroom, outside the classroom and at home. Thirty-five percent of teachers spend more t han 55 hours per week on school-relatedact ivit ies: 14% spend 51 to 55 hours, and 30% spend 46 to 50 hours. Teachers in sub-
urban schools spend a median of 55 hours per week on school-related act ivit ies,compared to 51 hours for teachers in rural schools and 50 hours for t hose in urbanareas. Those wit h 10 years or more experience spend 50 hours per week, comparedto a median of 54 hours for teachers wit h less t han 10 years experience. Fifty-fivehours per week is t he median number of hours high school teachers spend on school-
related responsibilit ies, four hours more t han t eachers in junior high (51 hours) orelementary (51 hours) schools.
Teachers at all grade levels spend a considerable number of hours each week ontasks not direct ly related to teachieg st udents, such as paperwork and administ ra-tive responsibilit ies. Fifteen percent spend more t han 20 hours per week, 14% spend16 to 20 hours, 18",. spend 11 to 15 hours, and 35% spend 5 t 0 10 hours. Only one in
five (18%) teachers spends less than 5 hours a week on tasks not direct ly related toteaching students in t he classroom. These t ime requirements are consistent for ele-mentaryjunior high and high school t eachers.
7 4
65

Table 6-1 DKFRIBI TION OF TEACHERS BY YEARS TAI GHT
QUESTION: Regardless of the types qf sehools you're taught in.Ar about howmany years. in total, hare you worked as a teacher!
TYPE OF SCHOOL
101 kl. 1 1-: kCIIERS F.I.EN1 1: '. 1.T lis .11 MOIL H11,11 1111,11 sl 11001.
YEARS TAI.Girr:
Lt's t han 5
95
9
7)1,9 16
11, to 14 14
i:- to Hi 15
More 45
Median Years 18
'84_ _____ ______
8
19
25
21
27
.14.7-1
'95_ _PERCENT
'84 '95 '84
AGE'95 '84
10 7 11 9 8 8
19 20 13 15 15 17
16 25 15 28 13 23
13 23 19 18 15 20
42 25 43 29 49 31
17 14.6 17 14.6 19 15.5
BASE 1011 1981 523 972 240 375 309 491
7566

Table 6-2-------
NUMBER OF HOURS PER WEEK SPENT ON SCHOOL-REIATEDRESPONSIBILITIESQUESTION: In an average week. how many hours do you spend, in total, on
school-related responsibilities including all responsibilities inclassroom, any responsibilities outside the classroom, and any workyou do at home?
rord.
YEARS OF TEACHINGEXPERIENCE
LENS (0 ORTIM In MORE
PER
TYPE OF SCHOOL
ELEMEV it NIOR 111(.11TARN MOM NC11001.
CEN T A
I }MAN
GE
SIZE OF PUCE
NI HI RR; \ RI HU
Less t han 40 9 6 12 12 :3 9 it) 10
41-45 12 10 12 11 15 9 17 10 11
4ti-5n 30 :),0 30 31 28 29 10 28 :12
51-55 14 15 13 16 9 14 13 15 11
More t han 55 35 38 :34 30 40 39 29 :37 :38
Median 50 54 50 51 51 55 50 55 51
BASE 1011 754 757 523 240 309 246 271 216
76

Table 6-3
68
DISTRIBUTION OF TEACHERS By HOURS WORKED
QUESTION: Qf the (READ NUMBER GIT EV IN Q.F1: IF "Not sure," READ "total")
hours you spend in an arerage week on school-relatedresponsibilities, how many hours would you say are on paperwork.administration, and other tasks not directly related to teachingstudents in y;mr classes?
PERTOTAL
TEACHERS
CEN
_
ELEMENTAR1
T A_ .._.... ._
TYPE OF SCHOOL_
\HUM
GE....._ .
_-
IOW(S( 11001.
_ .
Less than 5 Hours 18 17 19 20
5 to H) Hours 35 36 34 33
11-15 Hours 18 18 18 18
16-20 Hours 14 15 12 13
More than 20 Hours 15 13 18 16
Median Hours 10 10 10 10
B ASE 1011 523 240 309

intAMERIcAN1-5ACtIER
Demographic Profile
The teaching profession continues to be dominated by women; 70%, compared to30% men. Male teachers are far more likely to work in high schools and junior highst han elementary schools. Since 1984, t here has been a modest decrease in t he pro-portion of male teachers from 34% to 30%. There has been no change in t he pro-portion of female to male teachers in elementary schools over the past decade (85",.to 15%). However, the proportion of male teachers in junior high and high schoolshas decreased from 42% to 35% in junior high schools and from 62% to 53% in highschools.
More teachers are remaining in the profession for longer periods of time t hanthey were a decade ago, and as a result, the profession has' aged. Current ly, nearlyeight in ten teachers are at least 35 years old, up from seven in ten in 1984. Overhalf (52%) are 35 to 49 years old (compared to 49% in 1984), and one-quarter (26%)are 50 to 64 (compared to 23% in 1984). The proportion of teachers 65 years andover remains steady at one percent.
The median age of teachers has increased at all grade levels: from 40.5 to 44 yearsold for elementary school teachers, from 39.5 to 44 years old for junior high teach-ers and from 41.7 to 46 years old for high school teachers.
As the workforce has gained experience, there has been an increase in teachers'household incomes over the past decade. Four times as many teachers report total1994 household incomes of $50,000 or more, 50% as compared to 13% in 1984.
There is little disparity among the household incomes of teachers working in dif-ferent, grade levels. In median dollars, junior high teachers report. annual incomesnf $51,100 (up from $32,600 in 1984), compared to $50,900 for high school teachers,up from $29,400 in 1984) and $49,000 for elementary school teachers (up from$29,800). Unlike many other professions where salaries are stagnat ing or showingonly modest improvement, salary increases for elementary school teachers havebeen higher than the rate of inflation over the past decade.'
The number of teachers with household incomes of $40,000 or less has decreased.In 1984, one in five teachers (19%) had incomes of $20,000 or less, compared to onlyone in fifty now (2%). The proportion of teachers with household incomes between$20,001 and $40,000 has declined by half, from 53% in 1984 to 28% currently.
The majority of teachers in the United States are white (89%). This is virtuallyunchanged since 1988 (90%). Six percent of t eachers are black or African-Americanand 5% are Hispanic, also virtually unchanged over the past eleven years (from 7%and 4%, respectively).
Of Labor Stallsi ics from Consii Bureau data
78 69

YHE
AMERIcANTOACii ER
Inner city schools are more likely to have higher prof tort ions of black or African-American teachers. Approximately one in eight (12".,) city schml teachers are black
Or African-American, compared to each in suburban ;itirl rural areas.
OBSERVATION: In all communities. these proportions are lower than thepopulation in gmeral and eren lower than among public schoolstudents. Sixteen percent of third to twelfth grade students inurban schools are black or.lfrican-.4merican. compared to 7%in the suburbs and 21% in rural areas, a finding from the 1993MetLife report on lolence in America's Public Schools.
Teachers increasing fait h in t he public school system is evidenced by t he risingnumber of teachers who send t heir own children to public schools. Since 1984. t here
has been a 21". increase in t he number of teachers who have or had children in jnih-
lu school. from -13",, o 64", While I he proporl ions are significant ly smaller. therealso has been an increase in those who send t heir children to private and parochialschools. ftom ' to 1 l
Table 6-4 DISTRIBI TION OF TEAcumts By GENDER
Male
Female
BASE
70
TEACHER',
'95 '84
trmr.oi
30 34 .
11x4
70 66 .
1011 tTingi
_
Ell:ME:ST.\ RI
'95 '84
TYPE OF SCHOOL
\ 1012 HIGH_
'95 '84
II 1(,Il sC111101.
'95 '84- _PER C EN T AGE
15 15
85 85
523 972
35
65
OTWOIMINU
PI BIM
'95 '84
42 53 62 54 56
58 47 38 64 44
240 .375 309 .491
79

Table 6-5 DISTRIBMON OF TEACHERS BY AGE
QUESTI 0 N :
TOTAL TEACHERS
1Thw old are you?
TYPE OF SCHOOL
ELEMENTARY JUNIOR HIGH HIGH SCHOOL
'84 '95 '94 .95 '84 '95 '84
P ERCEN T AGE
18-24 Years 2 1 .) 2 2 1 2 1
25-34 Years 18 26 42 27 18 26 15 25
:35-49 Years -9a 49 D.-9 47 56 48 53 51
50-64 Years 26 23 23 23 23 26 31 22
65 and Over 1 1 1 1 1 1:. *
Median Years 44 40.5 44 40.5 44 39.5 46 41.7:.
BASE I um ism 523 972 240 375 309 491
*Less than 0.5%
80
71

Table 6-6 DISTRIBUTION OF TEACHERS BY HOUSEHOLD INCOME
QUESTION: {Mich of the following income categories best describes your total1994 household income? Was it (READ LIST)?
TOTAL TEACHERS
TYPE OF SCHOOL
ELEMENTARY JUNIOR HIGH HIGH SCHOOL
'95 '84 '95 '84 '95 '84 '95 '84
PER C EN T A GE
$5,000 or Less 1 4 1 4 :.: 3 ::: 3
15.001-$20,O00 1 15 1 17 2 13 1 12
$2001-s:30,0OO 11 30 14 29 12 27 10 36
$30,001410,00o 17 23 18 23 14 26 26 21
$40,00i-$50,0oo 19 14 17 13 19 16 21 13
$50,001 and Over 50 13 47 13 51 15 51 12
Median Income $50.3 $30.0 $49.0 $29.8 $51.1 $32.6 $50.9 $29.4(In 000 of Ss)
1
BASE 1011 19111 523 972 240 375 309 491
*Less than 0.5%a IT.S. Bureau of the Census, Statistical Abstract of the United States, 1984 edition, Household income of college graduates.
72
8 I

Table 6-7 DISTRIBUTION OF TEACHERS BY RACE
QUESTION: .4re you of Hispanic origin or descent, or not?
1995 1988
PERCENT AGE
Yes, Hispanic
No, Not Hispanic
BASE
5 4
95 96
1011 1208
QUESTION: Do you consider yourself white, (ROTATE black or African-American)4sian, Native American or some other race?
1995 1988
PERCENTAGE
White 89 90
Black/ 6 7
African-American
Asian 1
Native American 1 via
Other Race 3
B ASE 1011 1208
*Less than 0.5%

White 89 90 70 7-4 93 87 94 93 91 93 92 92 I
Table 6-8 DISTRIBMON OF TEACHERS BY RACE AND SIZE OF PIACE
QUESTION: Do you consi&,- yourself white, (ROTATE black or African-American), Asian, Native American or some other race?
SIZE OF PLACE
INNER CITY OTHER URBAN SMALL TOWN RURALTOTAL SUBURB
'95 '88 '95 '88 '95 '88 '95 '88 '95 '88 '95 '88
PERCENT AGE
Black/African-American 6..., 17 21 3 9 3 1 3 6 3 6
Asian or Pacific Islander 1* 3 1
* *1 * * *
Native American or 1 Wa 1 nia Wa ni(a 1 Wa 1 MtAlaskan Native
Some Other Race 3 1 7 4 1 1 1 1 3 1 1 1
BASE*Less than 0.5%
1011 1028 148 133 98 109 271 280 275 418 216 265
Table 6-9 DISTRIIII no or TEACHERS BY TYPE or SCHOOL THEIR CHILDREN ATTEND( ED)
1 9 9 5 QUESTION: Do/did your children attend publir schools. private schools.
or parochial schools.'
1 9 8 4 OUESTION: your children (Wend poodc schools. prairie schools. orparochial schools.'
TYPE OF SCI1OOL
foTAL rr u MAIN ELEMENT \ R1 JUNIOR 110.11 HIGH SCHOOL
95 54 '35 34 '95 34 '95 .84
P E R C EN T A GE
Have Children in 64 43 61 40 63 43 66 48Public School
Have Children in Private/ 11 7 12 7 11 9 8 8Parochial School
Children Not Old Enough/ 7 25 8 27 6 24 4 24Too Old for School
BASE 1011 1381 523 372 240 275 309 491
83 74

Appendix A:
METHODOLOGY
Wk.
v
444:

:riff ,AME,RIcANTOCH ER
76
METHODOLOGY
The 1995 Metropolitan Life Survey of the American Teacher was conducted by
Louis Harris and Associates for the Metropolitan Life Insurance Company between
May 4 and June 11, 1995. The survey included a total of 1,011 fifteen minute tele-
phone interviews with a nationally representative sample of current public school
teachers throughout the continental United States. Harris drew a random sample
of current public school teachers throughout the continental United States from a
list of 2.8 million teachers compiled by Market Data Retrieval of Westport,
Connecticut. Sample sizes for completed interviews were set for each state, based
on statistics of public school teachers in each state published by the U.S. National
Center of Education Statistics.Each selected teacher was contacted at his or her school by telephone and invit-
ed to participate in the survey. If the teacher was not available a message was left,
including a toll-free number to allow a return call.
Before being asked to complete the actual interview, each teacher was screened
to ensure that he or she is currently working in a public school and teaches at least
part-time in the classroom. Once a respondent passed the screen an appointment
was made to telephone at a convenient time to complete the interview.
The sampling and interviewing procedures for this report duplicate the methods
used in The American Teacher 1984, The American Teacher 1985: Strengthening
the Profession, and The American Teacher 1989: Preparing Schools for the 1990s.
All trend data relates to these previous reports from "The American Teacher" series.
Sample Disposition and Compietion Rate for Teachers
The final sample disposition for this survey is shown in Table A-1. A total of 4,483
contacts were made to yield 1,011 completed interviews.
Of all the teachers who were contacted at their schools or with whom a message
was left, 34.5% were willing to talk to a Louis Harris and Associates interviewer.
Although there are a number of different methods by which response rates can be
calculated, we arrived at this 34.5% figure by comparing the number of teachers we
were able to reach to the complete list of teachers at their schools.
Of the teachers who were contacted by Louis Harris and Associates and who
passed the screen, 78.3% completed an interview. We calculated this completion
rate by dividing the number of completed interviews by the sum of (1) the number
of completed interviews, (2) the number of interview refusals, (3) I he number of
interviews terminated within the course of the interview and (4) the number of
teachers who were left to call back at the time the survey wascompleted.

4ME-R)CANTOCHER
Table A-1
With reference to Table A-1, the response rate and the completion rate have beencalculated according to the following formulas:
A+E+F+H+I+J 1,365Response Rate = = =
A+E+F+G+H+14,1 3,951
A 1,011Completion Rate = = = 78.3%
A+E+H+J 1,290
The disposition of all 4,483 contacts is provided in Table A-2 so that interestedindividuals may make their own calculations of response rate and completion rate.
FINAL SAMPLE DISPOSITION
TOTAL
A. Completed Interviews
B. Nonworking Number
C. No Longer at School/Retired/Deceased/On Leave
I). No Answer or Busy (After Three Callbacks).
E. Interview Refused ...........
F. Noneligible Respondent
G. Left Message at School (Never Called Back)
II. To Call Back (Study Completed Before Callback was Needed)
I. Language Barrier
J. Terminated Within Interview ............ .
86
1,011
59
395
78
45
75
2,586
230
4
K. TOTAL NUMBER OF CONTACTS 4,483
77
f

Table A-2
78
DISTHIBt 'HON or THE SAMPLE O TEACHERS
1984 1995
PERCENTAGE
Sex:Male 673 :101
1Female 308 710
Experienck in Teaching:Less than 5 Years 158 955 - 9 Years 376 159
91- 1!) \ears 912 :109
29 Years or More 535 455
Type of School:Element ary 972 523Junior lligluMkIdle School 375 240High (.itool 491 309
Race:White n/a 901
Black n/a 55Hispanic n/a 51Ashn n/a 10
School Location:Inner City n/a 148Other Urban n/a 98Suburban n/a 271Small Town n/a 275Rural n/a 216
BASE 1981 1011
87

--AMERIcAN-fACtiER
CATl System Used in Interviews
The Harris CATI system computer assisted telephone interviewing wasused for this survey. This system controls complicated skip patterns based on indi-vidual responses during the course of the interview, and it also allows consistencychecks to be built in for key items. It furthermore reduces clerical error by elimi-nating the need for keypunching, since interviewers enter the respondents' answersdirectly into a computer terminal during the interview itself. For questions withprecoded responses, the system only permits answers within a specified allowablerange; for example, if a question has three possible answer choices (Yes. No, Notsure) the CATI system will only permit coded responses between one and three.
Reliability of Survey Percentages
The results from any sample survey are subject to sampling variation. The mag-nitude of this variation is measurable and is affected both by the number of inter-views involved and by the level of the percentages expressed in the results.
Table A-3 shows the range of sampling variation that applies to percentage resultsfor this survey. The chances are 95 in 100 that the survey results do not vary, plus or
minus, by more than the indicated number of percentage points from the resultsthat would have been obtained had interviews been conducted with all persons inthe universe represented by the sample.
For example, if the response for a sample size of 300 is 30%, then in 95 out of 100cases the response of the total population would be between 25% and 35%. Note thatsurvey results based on subgroups of a small size can be subject to large sampling
error.
8841,
79

Table A-3
80
APPROXIMATE SAMPLING TOLERANCES (AT 95% CONFIDENCE) TO USE IN EVALUATING
PERCEN"TAGE RESULTS APPEARING IN Tills REPORT
NUMBER OF PEOPLEASKED Ql ESTION OS
WHICH SUR% EIRESULT IS BASED
SURVEYPERCENTAGE
RESULT AT10% OR 90%
SURI:%-:PERCENTAGE
RESULT AT20% OR 80%
SURVEYPERCENTAGE
RESULT AT30% OR 70%
SURVEYPERCENTAGE
RESULT AT40% OR 60%
SURVEYPERCENTAGE
RESULT AT50%
2,000 1 2 2 2 2
1,500 9 2 2 2 3
1,000 2 2 3 3 3
900 2 3 3 3 3
800 ,) 3 3 3 3
700 2 3 3 4 4
600 2 3 4 4 4 .
500 3 4 4 4 4
400 3 4 4 5 5
300 3 5 5 6 -6 L.
"
200 4 6 6 7 7 7
100 6 8 9 10 10
50 8 11 13 14 14

1HE
AMERICANTOCHER
Sampling tolerances are also involved in the comparison of results from differ-ent parts of the sample (subgroup analysis) or from different surveys. Table A-4shows the percentage difference that must be obtained before a difference can beconsidered statistically significant. These figures, too, represent the 95% confidence
interval.For example suppose one group of 1,000 has a response of V% "yes" to a ques-
tion, and an independent group of 500 has a respoi.se of 29% "yes" to the sante ques-
tion, for an observed difference of 8 percentage points. According to the table, thisdifference is subject to a potential sampling error of 5 percentage points. Since theobserved difference is greater than t he sampling error, the observed difference isconsidered significant.
These errors account for sampling error only. Survey research is also susceptibleto other errors, such as in data handling and in interviewer recording. The proce-dures followed by Louis Harris and Associates. including the CATI system describedearlier, keep these kinds of errors to a minimum.
81

Table A-4 APPROXIMATE SAMPLING TOLERANCES (AT 95% CONFIDENCE) TO USE IN EVALUATINGDIFFERENCES BETWEEN TWO PERCENTAGE RESULTS APPEARING IN THIS REPORT
APPROXIMATESAMPLE SIZE OF TWO
GROUPS ASKEDQUESTION ON WHICH
SURVEY RESULT ISBASED
SURVEYPERCENTAGE
RESULT AT10% OR 90%
SURVEYPERCENTAGE
RESULT AT20% OR 80%
SURVEYPERCENTAGE
RESULT AT30% OR 70%
SURVEYPERCENTAGE
RESULT AT10% OR 60%
2 000 vs. 2.000 2 2 3 3
1,00 2 3 3 4
500 3 4 4 5
200 4 6 7 7
100 6 8 9 10
50 8 11 13 14
1,000 vs. 1.000 :3 4 4 4
500 :3 4 5 5
200 5 6 7 7
100 6 8 9 10
50 9 11 13 14
500 vs. 500 4 5 6 6
200 5 7 8 8
100 6 9 10 11
50 9 12 13 14.....
200 vs. 200 6 8 9 10
100 7 10 11 12
50 9 12 14 15
100 vs. 100 8 11 13 14
50 10 14 16 17.....
50 vs. 50 12 16 18 19
SURVEYPERCENTAGE
RESULT AT50%
41:45 '41=4.wlir,
12-:15
PlIrtwel
leA
91

Appendix B:
THE-QUESTIONNAIRE
92.

LOUIS HARRIS AND ASSOCIATES, INC.111 Fifth AvenueNew York, New York 10003
FOR OFFICE USE ONLY:
Questionnaire No.:(1-5)
Study. No. 952011 Card Number (6,7)(1 0 8-1 1 3)
Date: May 4, 1995 Sample Point No. / / / / / / / / /FINAL (524-530)
OLD PROBLEMS, NEW CHALLENGES
Time Started: A.M./P.M.
Interviewer I.D. NO.: Date of Interview:
Area Code: Telephone No.:(509-511) (512-518)
Hello,I'm , from Louis Harris and Associates, the national opinion polling and research firm
located in New York. We are conducting a national survey among teachers to evaluate some of their attitudes toward
the American educational system, and we would like to ask you a few questions.
(IF NECESSARY)This is the fifteenth in a series of surveys that Harris has conducted on the American teacher on behalf of the
Metroportan Life Insurance Company.
(IF NECESSARY)The survey findings will be publicly released and we hope they foster a dialogue about teachers views and concerns.
Of course, as with all Harris surveys, the results will be reported in statistical form only -- as percentages -- your
answers will remain confidential.
INTERVIEWER: ENTER FROM SAMPLE:California (115( 9 -1
Not California -2
S1. Do you teach in an elementary school, a junior high school, or a high school? (MULTIPLE RECORD)
Elementary school (Grades K-6) (116( 52 1
Junior high school (Grades 7-9) _24_ - 2High school (Grades 9-12 or 10-12) 31 - 3Not sure - - 4
SECTION A: EVALUATING SCHOOLS
SECTION a SATISFACTION WITH TEACHING
SECTION C: IMPROVING THE QUALITY OF EDUCATION
SECTION D: BUDGET/REFORM ISSUES
SECTION F: FACTUALS
9 3
Copyright 1995, Louis Harris and Associates, Inc.
85

A REPOI1 I- CARD ON TEACHING 952011
A . EVALUATING SCHOOLS
A l . As you know, there has been much discussion recently about American education and especially about our
primary and secondary public schools. Thinking about the public school in which you teach, how would you rate thequality of education in your school -- excellent, good, fair or poor?
ExcellentGocdFairPoorNot sure
(117( 47 - 1
- 23
- 4- 5
45
1
A2. I am going to read several criteria on which publicwould rate your school excellent, good, fair, or poor.
ROTATE -- START AT "X"
schools can be judged.(READ EACH ITEM)
Excellent az251
For each,
air
please tell me whether you
NotSure
( ) 1. The quality of teachers in your school (118( 55 - 1 41 - 2 4 - 3 - 4 - - 5
( ) 2. Parental and community supportfor the school (119( 22 - 1 2 28 - 3 4 - 5
( ) 3. Academic standards in your school (120L4D...- 1 _AL- 2 14 - 3
__LL-
1 - 4 - 5
( ) 4. Funds available for use by your school (121(_11.- 1 - 2 33 - 3 4 5_38
READ LAST( ) 5. The cuiriculum in general (122( 32 - 1 53 - 2 14 - 3 1 - 4 - 5
9 4se

A REPORT CARD ON TEACHINr; 952011
A 3 . I am going to read some things that some people have said are problems with the public schools. After I readeach one, please tell me if you think that problem is very serious, somewhat serious, not very serious, or not at all
serious in the public school in which you teach. (READ EACH ITEM)
ROTATE -- START AT "X"Very Somewhat
Serious Serious
35 - 2
Not VerySerious
NotAt All
SeriousNot
Sure
IF TEACHER OF GRADES K-6 (ANSWERED
(123(.__a.- 1 3 4 - - 5
"Elementary." OR "Not Sure." IN Q.S1) ASK:
) 1. Overcrowded classes
) 2. Inadequate programs for remedial students (124( 10 1 32._- 2
_21.;
30 - 3
_23_-
4 - 5
) 3. Absenteeism (125(___L- 1 29_- 2 41.- 3
_23_-
4 5
) 4, Students' lack of interest in their classes (126( 10 - 1 40 - 2 36 - 3 14 - 4 - 5
IF TEACHER OF GRADES 7-12 (ANSWERED "JuniorHigh Schoo1.1' "High School." OR "Nnt Sure"IN Q.S1). ASKz
( ) 5. The number of dropouts (127(__ :11_- 1 33 2 34.. - 3 _22_- 4 ' - 5
( ) 6. The number of teenage pregnancies (128( 20 - 1 39 - 2 25 - 3 4 - 5
( ) 7. The amount of drinking by students (129( 26 - 1 50 - 2 Ja- 3 4 _2.- 5
( ) 8. The number of students using drugs (130(__II- 1 50 - 2 3 4 5
( ) 9. The number of teenage suicides (131(___1- 1 12 - 2 36 - 3 4 - 5
( ) 10.The number of students carrying handguns,knives and other weapons to school (132( 5 - 1 20 - 2 39 - 3 36 - 4 * - 5
( ) 11. The number of students who lackbasic skills (133( 21 - 1 53 2 22 - 3 4 - 4 . 5
ASK EVERYONE( ) 12.Incidence of violence in and around schools (134(____:- 1 2 40 - 3 27 - 4 5
r:t.$
135-180Z
87

A REPORT CARD ON TEACHING 952011
B. SATISFACTION WITH TEACHING
B 1. All in all, how satisfied would you say you are with teaching as a career -- very satisfied, somewhat satisfied,
somewhat dissatisfied. or very dissatisfied?
Very satisfiedSomewhat satisfiedSomewhat dissatisfiedVery dissatisfiedNot sure
(208( 543310
2
- 1
2- 3- 4
5
82. I would like to read you some statements people have made about their jobs. For each, please tell me if you
agree strongly, agree somewhat, disagree somewhat, or disagree strongly in terms of your own job as a teacher in the
public schools. (READ EACH STATEMENT)
ROTATE -- START AT "X"Agree Agree Disagree Disagree Not
Strongly Somewhat Somewhat Strongly S_Uie
( ) 1. My job allows me the opportunity toearn a decent salary (209( 17 -1 46 -2 18 -3 19 -4 - -5
( ) 2. I am usually recognized forgood performance (210(_31_-1 40 -2 15 -3 4 - 5
( ) 3. I would advise a young person topursue a career in teaching (211(__24_-1 43 -2 21 -3 12 -4 - 5
( ) 4. I love to teach (212( 78_- 1 20 2 3 __1_- 4 - -5
( ) 5. The training and preparation thatteachers receive today does a goodjob preparing them for the classroom (213( 13 -1 43 -2 29 -3 5
( ) 6. As a teacher, feel respectedin today's society (214(___-1 44 -2 31:3 16 -4 - 5
( ) 7. I have to spend too much time onadministrative tasks (215( 32_-1 42 -2 21 -3 - 5
( ) 8. I sometimes feel pressure to promote studentseven when I know they have notmastered minimum requirements (216( 26 -1 _21.-2 20 -3 24 -4 _..2_- 5
32a. What is the one thing you like most about your job as a teacher?
Seeing children develop/progress/succeed - 29%; Working with children 25%; Interaction with the students ( )
15%; Making a difference in a child's life - 8%; Sceing the lood of joy when a child finally "gets it" -- the light bulb
factor 5%; Academic/creative freedom - 3%; I like the hours/schecjule/having the summer off - 3%; I love to ( - )
teach/teaching (not specified) - 2%; Motivating students to learn - 2%; Working with children in special education
classes - 1%. My relationship with other teachers - 1%; I enj.py the curriculum/the subjects I teach 1%: The ( )
appreciation expressed by (former) students - 1%; The variety in the teaching experience - ; All others - 3%; Don't
know/not sure/refused - 1%.
fif;
80

A REPORT CARD ON TEACHING952011
B3. Have you ever seriously considered
Yes, considered
No, not considaredNot sure
leaving teaching to go into
(217( 41
some othe: occupation?
1 (ASK Q.B4)
- 2 (SKIP TO Q.B7)3
59_
84. What were the main things that made you consider leaving teaching? Anything else? (PROBE TO THE
NEGATIVE)
Salary 41%* Lack of administrative suop_ort - 25%: Lack of discipline on part of students 18%; Lack of ( )
parental support/respect - 14%; Lack of societal respect/support - 9%; Stress (not specified) - 7%; Extracurricular
activities 7%. Student apathy 6% Lack of respect from students 6%; Too much paperwork 4%. Long ( )
hours - 4%; Burn out - 4%; Overcrowding/class size - 3%; Lack of/cut back in funds and/or supplies - 3%;
Frustration with the system - 2% Wanted to try something new - 2%: All others - 16%; Don't know/not sure/ ( )
refused - 1%.
85. What were the main things that made you decide to stay in teaching? Anything else? (PROBE TO THE
NEGATIVE)
Enjoy working with kids - 29%. I enjoy teaching/ job satisfaction - 19%; Job security/job benefits - 14%; ( )
Vacation time/having summer off - 11%; I feel I can make a difference - 10%; Seeing children progress/succeed/learn
- 10%; I like the hours/schedule - 6%; Salary increase/better pay - 5%: It is what I'm trained to do 5%; ( )
Support/friendship from fellow teachers 4%; Close to retirement/too old to start a new career - 3%; I am good at
my job/a good teacher 2%: Havino time with my_ own kids who are in school and still teach - 2%: The ( )
appreciation/love/respect of students - 1%; Transferred to another school - 1%; Greater administration support -
1%; Moved to a different grade level - 1%; Could not find another job - 1%; Greater parental support - *; Beaer
working conditions - *; All others - 17%; Don't know/not sure/refused - 2%.
89

A REPORT CARD ON TEACHING 952011
86. We'd like you to rate some of the aspects of teaching compared to the most recent job you were considering.
From what you know, is/are the (READ EACH ITEM) better in teaching or better in the other occupation?
ROTATE -- START AT "X"
BetterIn
Teaching
BetterIn Other
Occupation
Same, NoDifference
(Vol.)Not
) 1. Salary (218( 17 1 - 2 - 3 - 4
( ) 2. Intellectual challenge (219( 58 1 29_ 2 11 - 3
___2_
4
( ) 3. Personal satisfaction (220( 71_ - 1 - 2 10 - 3
___2_-
- 4
( ) 4. Equipment you have to work with (221( 17 - 1 71 - 2 __a_ - 3 4 - 4
( ) 5. Professional prestige (222(__11. - 1 _22_ - 2 - 3 Z. - 4
( ) 6. Caliber of the colleagues you work with (223( 58 - 1 20 2 - 3 _12_ - 4_11
( ) 7. Job security (224( 77 1 13 - 2 __a_ - 3 a_ - 4
( ) 8. Your control over your own work (225( 48 - 1 _112_ - 2 7 - 3 - 4
( ) 9. Retirement benefits (226( 52 - I - 2 7 - 3 J. - 4
( ) 10.Health insurance benefits (227( 52 - 1 29 - 2 14 - 3 - 4
( ) 11.Vacation benefits (228( 71 - 1 23 - 2 4 - 3 _2_ - 4
( ) 12.Total number of hours worked each week (229( 25 1 60 - 2 _j_a_ - 3 __2- - 4
( ) 13.Personal safety at the workplace (230(_a7__ 1 - 2 _11. - 3 4 - 4
ASK EVERYONEB7. Within the next 5 yecirs, how likely is it that you will leave the teaching profession to go into some different
occupation -- very likely, fairly likely, not too likely, or not at all likely?
Very likely (231( 12 - 1
Fairly likely 2 (SKIP TO O.C1)
Not too likely - 3
Not at all likely - 4 (ASK Q.B8)
Not sure - 5
AS e.B8 IF AN WERED "Not to li el " "N at all likle " OR "Not sure" IN 87.
B8. Of the following reasons, which one is the most important reason you are likely to stay in teaching? Is it
because of the job security and benefits, your love of teaching, or the difficulty in finding another job at a comparable
level?
Job security and benefitsLove of teachingDifficulty in finding another jobNot sure
(232( 23 - 1
- 2- 3- 4
724
9;90
233-280Z

A REPORT CARD ON TEACHING 952011
C. IMPROVING THE QUALITY OF EDUCATION
Cl. Based on your overall experience at your school, and whether or not your school already has such a policy,please tell me whether you think each suggestion would have a strongly positive effect, a somewhat positive effect, ason- -hat negative effect, or a strongly negative effect on education in general. (READ EACH ITEM)
ROTATE -- START AT "X"
Strongly SomewnatPositiveEffect
PositiveEffect
SomewhatNegative
Effect
StronglyNegative
Effect
No
EffectAt AllfVola
NotSure
( ) 1. Establish minimum competency testsfor students at predeterminedgrade levels (308( 31 -1 46 - 2 3 4 5 6
( ) 2. Emphasize basic skills, such as reading,
_It-
writing, and math (309( 1 26 - 2 3 - 3 1 - 4 - 5 - 6
( ) 3. Broaden the curriculum to include suchthings as computer literacy andforeign languages (310( 58 -1 36 - 2 4 - 3 1 4 1 - 5 6
) 4. Tighten graduation requirements toinclude more academically stringentsubjects (311( 38 -1 2 3 4 5 6
( ) 5. Emphasize school discipline and safety (31....; 75 -1
_2_42_-
2
_11.-
3
_a,-
4 - 5 - 6_1_-
( ) 6. Increase the amount of homeworkrequired of students (313( 14 -1 2 29 - 3 4 2; 5 6_ra,-
91

A REPORT CARD ON TEACHING 952011
C2. Again, based on your overall experience at your school, and whether or not your school already has such apolicy, please tell me whether you think each suggestion would have a strongly positive effect, a somewhat positiveeffect, a somewhat negative effect, or a strongly negative effect on the quality of teaching in America's public schools.
ROTATE -- START AT "X"
Strongly Somewhat Somewhat Strongly EffectPositive Positive Negative Negative At All Not
Effect Effect Effect Ef f ect IS9.1,1 Sure
( ) 1. Require teachers to take competencytests before certification (314( 42 -1
( ) 2. Set higher salaries for teachers whoteach in science and math or otherareas in which there are teachershortages (315( 23 -1
) 3. Allow school districts to hire talentedpeople who are not certified teachers . . . . (316( 11 -1
( ) 4. Require periodic retesting of teachersin their subject matter (317(_221
( ) 5. Provide special incentives to encourageoutstanding students to go into teaching . (318( 49 -1
( ) 6. Make it easier for incompetent teachersto be removed (319(_5_4...-1
92
44 - 2
2
8: 3
3
4 - 4 1 - 5
j_L- 4 - 5_la:
28 2 31 - 3 28 - 4 * - 5
46 - 2 3 14 - 4 1 - 5
43 - 2
_2L-
3 4 1 - 5
35 - 2 3
_I..-
3 - 4 - 5
100
- 6
- 6
1 - 6
- 6
6
- 6
1.20-80Z1

STUDY TITLE CARD 952011
D. BUDGET/REFORM ISSUES
Dl. Do you agree or disagree with the following statements?
ROTATE -- START AT "X" Agree Disagree Not Sure
( ) 1. I feel that the allocation of funds across school districtsin my state is equitable (408(__2_1_ - 1 - 2 - 3
( ) 2. The proportion of funds in my district going to servechildren with special needs is too high (409(._3_4_ - 1 - 2 3
( ) 3. The job of establishing teacher standards andcertification belongs to the individual states (410(__11. - 1 - 2 3
( ) 4. Having a national teachers' examination will provide asense that there are definable standards of excellencein teaching - 1 _ALL - 2 3
ASK TEACHERS IN CAVFORNIA ONLY (FROM SAMPLE POINT NUMBER)02. You are probably aware of California's Proposition 187, the recent legislation requiring that children must be
documented residents before being permitted to attend public schools. In your opinion, what type of effect do you thinkProposition 187 will have on your ability to teach -- a positive effect, negative effect, or no effect at all?
Positive effect - 1
Negative effect 33 - 2No effect at all 47 - 3Not sure
(SKIP TO U.R
is ti u II
NUMBER)03. California has recently passed legislation requiring that children must be documented residents before being
permitted to attend public schools. (IF NECESSARY: This legislation is commonly known as Proposition 187.) How
familiar are you with this legislation -- would you say very familiar, somewhat familiar, or not familiar at all?
Very familiar (413(._13_ 1
Somewhat familiar _at - 2
Not familiar at all 3
Not sure - 4
04. If similar legislation was passed in your state, what type of effect do you think it would have on your ability to
teach -- a positive effect, negative effect, or no effect at all?
Positive effectNegative effectNo effect at allNot sure
(414( 14 - 1
- 2- 3- 4
72
93

STUDY TITLE CARD 952011
F. FACTUALS
Fl. These last few questions are for background purposes only. In an average week, how many hours do you spend,in total, on school-related responsibilities -- including all responsibilities in the classroom, any responsibilities outside
the cla ssroom, and any work you do at home?
MEAN/ 54 / hours(415-417)Not sure . . . (415( -&
Less than 26 hours 2%; 26-30 hours 1%; 31-35 hours - 1%; 36-40 hours - 5%; 41-45 hours - 21%; 46-50hours - 30%; 51-55 hours - 14%; More than 55 hours - 35%.
F2. Of the (READ NUMBER GIVEN IN O.F1; IF "Not sure," READ "total") hours you spend in an averageweek on school-related responsibilities, how many hours would you say are on paperwork, administration, and other
tasks not directly related to teaching students in your classes?
MEAN/ 13 / hours(418-420)Not sure . .. (418( 1 -&
Less than 5 hours - 18%; 5-10 hours 35%; 11-15 hours - 18%; 16-20 hours - 14%; More than 20 hours - 15%.
F3. Almost all people have some stress in their lives, but some have a great deal of stress. In your job as a
teacher, how often do you feel under great stress -- almost every day, several days a week, once or twice a week,
less often than once a week, or never?
Almost every day (421(__ISL - 1
Several days a week - 2
Once or twice a week _511. 3
Less often than once a week - 4
Never 5
Not sure - - 6
F4. Is the area where your school is located considered inner city, urban, suburban, small town, or rural?
Inner city (422(__1_ - 1
Urban 10 - 2
Suburban 27 - 3Small town 27 - 4Rural j. 5
Not sure - 6
F5. Regardless of the types of schools you've taught in, for about how many years, in total, have you worked as a
teacher?MEAN
/ 17 / years(423-424)
Less than one year (423-424( - 00Not sure (423( - - &
Less than 5 years - 9%; 5-9 years - 16%; 10-19 hours - 30%; 20 years or more - 45%.
941 0

STUDY TITLE CARD 952011
F6. What was the last grade or level of school that you yourself completed? (READ LIST IF NECESSARY)
Four-year college graduate (425(___a_ - 1
Some graduate credits __22_ - 2Master's completed 33 - 3Credits beyond master's _22_ - 4Ph.D. completed _L. 5Not sure/refused - 6
F7. Was your undergraduate college degree in education, or not?
Yes, education (426(2_8_ - 1
Not, not education _21._ - 2Not sure 3
ASK Q.F8 IF "Some Graduate Credits." "Master's Completed? "Credits Beyond Masters." OR"PhD Completed" IN Q.F6: OTHERS SKIP TO Q.F9F8. Was your graduate training mainly in education, or not?
Yes, mainly in education (427(__52_ - 1
No, not mainly in education j2_ - 2Not sure 3
F9. How old are you?MEAN
1 43 /(428-429)
Not sure/refused . . (428( ' &
18-20 = -; 21-24 = 2%; 25-29 = 8%; 30-34 = 10%; 35-39 = 11%; 40-49 = 41%; 50-64 = 26%; 65 & over = 1%.
F10. Do you have any children?
Yes, have children (430(_15_ - 1 (ASK Q.F11)
No, do not _25_ - 2 (SKIP TO 0.F12)Not sure
F11. Do/did your children attend public schools, private schools, or parochial schools? (MULTIPLE RECORD)
Public school (431(15_ - 1
Private school 9_ - 2Parochial school 7 - 3None old enough for school (Vol.) __9_ - 4Not sure
ASK EVERYONEF12. Are you of Hispanic origin or descent, or not?
Yes, of Hispanic origin (432(___5_ - 1
No, not of Hispanic origin 95 - 2Not sure 3
10395

STUDY TITLE CARD 952011
F13. Do you consider yourself white, (ROTATE -- black or African-American), Asian, Native American orsome other race?
White (433(._ - 1
Black - 2African-American 3 3
Asian or Pacific Islander 1 - 4Native American or Alaskan native 1_ 5
Some other race - 6Not sure
F14. Which of the following income categories best describes your total 1994 household income? Was it (READ LIST)?
$15,000 or less (434(_1_ - 1 INTERVIEWER: TOTAL HOUSEHOLD$15,001 to $20,000 1 - 2 INCOME BEFORE TAXES FROM ALL$20,001 to $30,000 11 - 3 SOURCES IF UNSURE OF 1994$30,001 to $40,000 17 - 4 INCOME, PROBE FOR ESTIMATE
$40,001 to $50,000 - 5$50,001 to 60,000 16 - 6$60,001 or over 34 - 7Not sure - 8
That completes the interview. Thank you very much for your cooperation!
From observation: Respondent gender
Male (435( 30 - 1
Female 70 - 2
104
96
TIME ENDED: AM/PM
436-480Z

Mini-Surveys Teachers' Views on Current Issues in Education
a The Metropolitan Lifi' Sarvey V the American Teacher, 1991. Coming to Terms probes emerg-ing problems related to tightened school budgets. (Out of print)
The Metr6politan L;fe Survey of the American Teacher. 1992. Ready or Not: Grade LevelPreparednes examines teachers' perspectives on an issue that is key to the new national educationgoals. (Out of print)
The series also includes several reports on individual states two surveys of California teachersand one of New York teachers whose questions parallel the 1984 and 1985 nationwide studies. (Outof print)
Also Available:
a Preparing Schoolsibr the 1990s: .4n Essay Collection contains the views of distinguished edu-cation leaders such as Theodore R. Sizer, Albert Shanker, Michael W. Kirst. and Floretta DukesMcKenzie among others. who discuss recent and future directions in the efforts to improve our pub-lic schools.
For More Information
Copies of The Metropolitan Life Survey of the American Teacher are availablewhile in print, by writing to:
METLIFE
THE AMERICAN TEACHER SURVEY
P.O. Box 807
Madison Square StationNew York, New York 10159-0807

I 1,-,1 hint. el ii.1
0 Met Life(t.p..111.111 11.1,1111
sloi MiIIIII ,1111 \ \ Ilk .10 10.
106