DOCUMENT RESUME ED 291 004 Crime and …DOCUMENT RESUME ED 291 004 CG 020 536 TITLE Crime and...
188
DOCUMENT RESUME ED 291 004 CG 020 536 TITLE Crime and Delinquency in California, 1986. INSTITUTION California State Dept. of Justice, Sacramento. Bureau of Criminal Statistics and Special Services. PUB DATE Sep 87 NOTE 258p.; For the report for 1985, see CG 020 535. Portions printed on colored paper. Some illustrations may not reproduce clearly. PUB TYPE Reports Research/Technical (143) Statistical Data (110) EDRS PRICE MF01/PC11 Plus Postage. DESCRIPTORS *Correctional Institutions; Courts; *Crime; *Criminals; *Delinquency; Juvenile Courts; *Law Enforcement; *Police; Prisoners; Sentencing; Trend Analysis IDENTIFIERS *California ABSTRACT A statistical portrait of crime and deliquency in California in 1986 is presented in this document. These topics are discussed and illustrated by data tables and graphs: crimes (violent, property); arrests (felony, misdemeanor, chaflges in rates); adult felony arrest dispositions (dispositions, arrestees convicted); adult corrections (supervision, caseload, adults ct.z.nmitted to state institutions); juvenile justice system (arrests, dispositions, referrals, juvenile court); and criminal justice agency expenditures and personnel. A criminal justice glossary, an explanation of known data limitations, and notations on the Penal Code requirements concerning complaints against peace officers and the reporting of domestic violence are provided in the appendix. A concluding data section gives 67 detailed tables of crime statistics, arrests, convictions, dispositions, criminal justice agency expenditures, and number: of justice personnel, sometimes providing several years' data. Additional illustrations from "Daumier-120 Great Lithographs" are also used. (ABL) *********************************************************************** * Reproductions supplied by EDRS are the best that .:an be made * * from the original document. * *********************************************************************x*
Transcript of DOCUMENT RESUME ED 291 004 Crime and …DOCUMENT RESUME ED 291 004 CG 020 536 TITLE Crime and...

DOCUMENT RESUME
ED 291 004 CG 020 536
TITLE Crime and Delinquency in California, 1986.INSTITUTION California State Dept. of Justice, Sacramento. Bureau
of Criminal Statistics and Special Services.PUB DATE Sep 87NOTE 258p.; For the report for 1985, see CG 020 535.
Portions printed on colored paper. Some illustrationsmay not reproduce clearly.
PUB TYPE Reports Research/Technical (143) StatisticalData (110)
EDRS PRICE MF01/PC11 Plus Postage.DESCRIPTORS *Correctional Institutions; Courts; *Crime;
*Criminals; *Delinquency; Juvenile Courts; *LawEnforcement; *Police; Prisoners; Sentencing; TrendAnalysis
IDENTIFIERS *California
ABSTRACTA statistical portrait of crime and deliquency in
California in 1986 is presented in this document. These topics arediscussed and illustrated by data tables and graphs: crimes (violent,property); arrests (felony, misdemeanor, chaflges in rates); adultfelony arrest dispositions (dispositions, arrestees convicted); adultcorrections (supervision, caseload, adults ct.z.nmitted to stateinstitutions); juvenile justice system (arrests, dispositions,referrals, juvenile court); and criminal justice agency expendituresand personnel. A criminal justice glossary, an explanation of knowndata limitations, and notations on the Penal Code requirementsconcerning complaints against peace officers and the reporting ofdomestic violence are provided in the appendix. A concluding datasection gives 67 detailed tables of crime statistics, arrests,convictions, dispositions, criminal justice agency expenditures, andnumber: of justice personnel, sometimes providing several years'data. Additional illustrations from "Daumier-120 Great Lithographs"are also used. (ABL)
************************************************************************ Reproductions supplied by EDRS are the best that .:an be made *
* from the original document. **********************************************************************x*
State of California
DepaeLnent of JusticeJOHN K. VAN DE KAMP, Attorney General
CRIME AND DELINQUENCYIN CALIFORNIA, 1986
Prepared byDivi^:pn of Law Enforcement
Criminal Identification and Information BranchBUREAU oF CRIMINAL STATISTICS AND SPECIAL SERVICES
4949 BroadwayP.O. Box 903427Sacramento, CA 94203-4270
87030 W87 :)..74
Illustrations in this publication are from "DAUMIER-120
Great Lithographs", published by Dover Publications, Inc.,New York. They are used with the publishers' permission.
3

"

t,

iv
TTORNEY GENER L'S
Crime in California in 1986, as measured by the CaliforniaCrime Index (CCI), made a sharp 7.5 percent jump over theprevious year. Increases were noted in every crime categoryof the CCI except burglary. The CCi consists of the violentcrimes of willful homicide, forcible rape, aggravatedassault, robbery and the property crimes of burglary andmotor vehicle theft. By far the biggest contributor to therise was the aggravated assault rate increase of 35.6percent. This sizeable change, however, is primarily theresult of a shift in law enforcement procedures and
reporting practices in domestic violence cases. On thebright side, the burglary crime rate is down for the fifthyear in a row down 24 percent since 1981. The series ofsanctions targeting burglary offenders appear to be bearingfruit.
Increased California law enforcement action resulted in a2 percent rise in the total arrest rate. This growth
reptesents nearly 80,000 more arrestees entering theCalifornia criminal justice system over the previous year.The biggest increases again this year were in drug lawviolations, especially arrests for narcotic offenses.Narcotic arrests have increased about 200 percent since
7

: A. :;
1 " ::4144
t 0.. 4 4 Z 4W 4 :
; :41 '4 w
4Z ".
a
Z, 6.; 6 t -
16
4
.
; Z 41 Z.L4
Z Z a:
;
;
\

4

%,;,
"9.4
fu.'
"-
/l
t,1
`.`'eerr
ler
'e"e
'e,e
-
4
t4
r
t


800 0
600 0
400 0
200 0
0
VIOLENT CRIMES, 1981 -1 986Rate per 100,000 Population
EftIMIN1
Th191
Source: Table 1.
1982 1983 1984
YEAR
VIOLENT CRIMES, 1986By Offense
WILLFUL HOMICIDE
1.2%
Source: Table 2.
11, 19
1985 1386

WILLFUL HOMICIDE CRIMES, 1981-1986Rate per 100,000 Population
Source: Table 1.
11 Biwaimmirminamp am
YEAH
WILLFUL HOMICIDE CRIMES, 1986Known Type of Weapon Used
Note: Percents may not add to 100.0 because of rounding.Source: Table 3.
BLUNTOBJECT8.0%
PERSONAL.
WEAPON
7.5%01HER5.2%
20
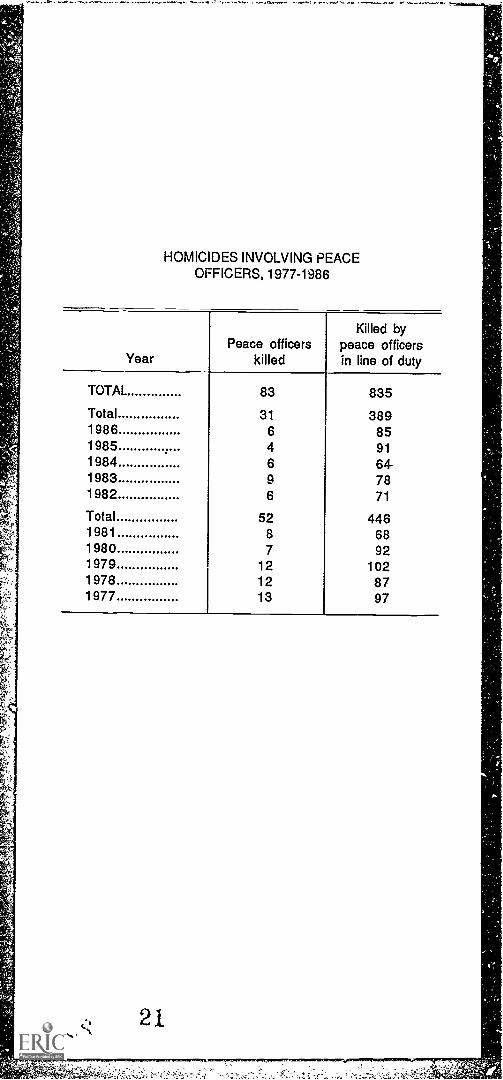
HOMICIDES INVOLVING PEACEOFFICERS, 1977-1986
YearPeace officers
killed
TOTAL 83
Total 311986 61985 41984 61983 91982 6
Total 521981 81980 71979 121978 121977 13
21
Killed bypeace officersin line of duty
835
3898591
647871
4466892
1028797

FORCIBLE RAPE CRIMES, 1981-1986Rate per 100,000 Total and At-Risk Population
120
10 00
ck 8°8
F60
40
20
IIIIAT MK POPU IN"T O al
1.1111
ELM1111.11.111111.11.11
osi fifirr"Var 986YEAR
Source: Tables 1 and 4.
FORCIBLE RAPE CRIMES, 1986
Source: Table 4.
22
808
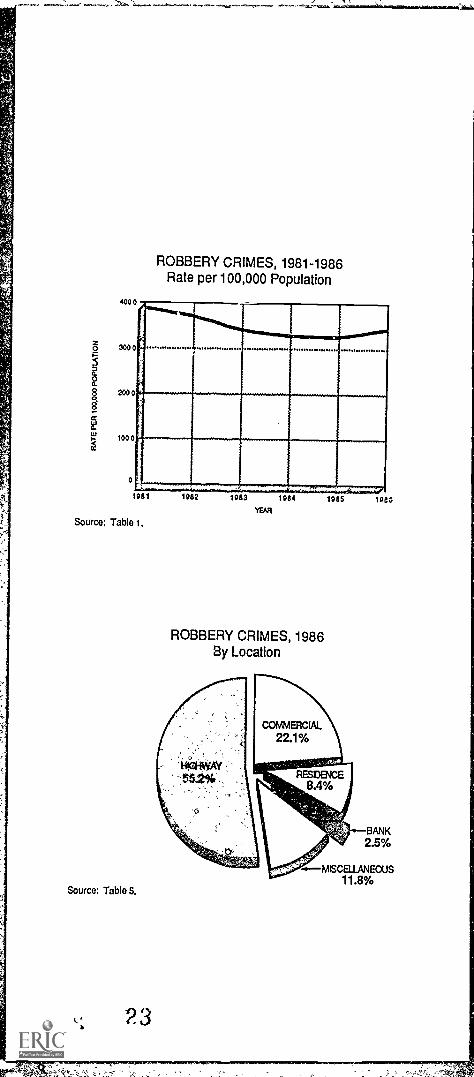
ROBBERY CRIMES, 1981-1986Rate per 100,000 Population
. mord i1 11111111111111111
M1111111081
Source: Table 1.
1082 1083 1984
YEAR
ROBBERY CRIMES, 1986By Location
1985
Source: Table S.
10-3
BANK2.5%
MISCELLANEOUS11.8%
23
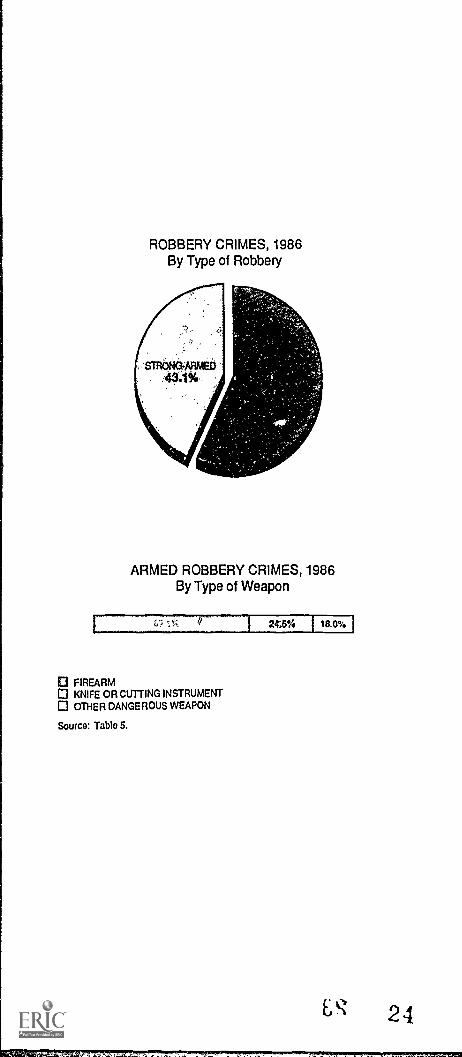
ROBBERY CRIMES, 1986By Type of Robbery
ARMED ROBBERY CRIMES, 1986By Type of Weapon
47.777"---24:5% 18.0%
FIREARMKNIFE OR CUTTING INSTRUMENTOTHER DANGEROUS WEAPON
Source: Table 5.
" 24

AGGRAVATED ASSAULT CRIMES, 1981-1986Rate per 100,000 Population
600 0
500 0
400 0
300 0
200 0
100.0
.0
19111
Source: Table 1.
1962 1083
YEAR
1984 1085 1986
AGGRAVATED ASSAULT CRIMES, 1986By Type of Weapon
Source: Table 6.
25
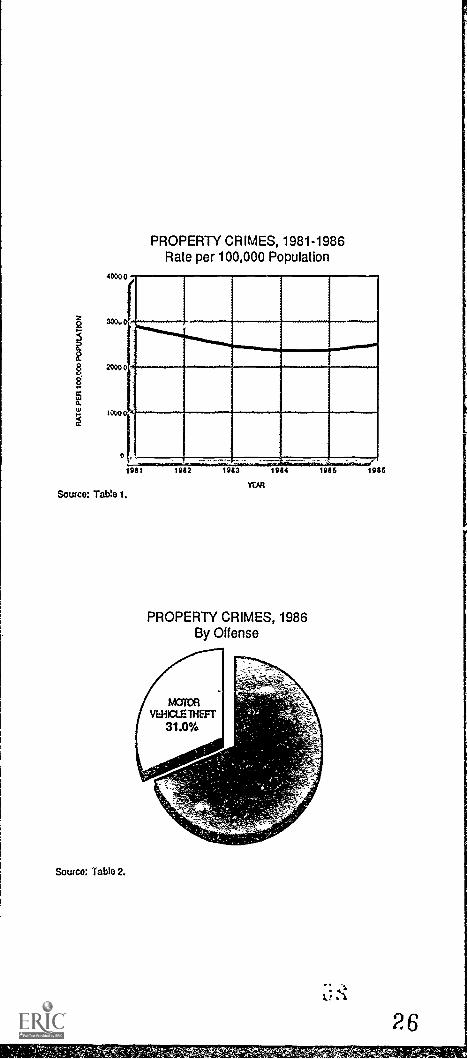
PROPERTY CRIMES, 1981-1986Rate per 100,000 Population
,wV V
300v 0
2000 0
0
1961
El111111"111111IVIN11111
IIMMIMIIIHIIIIII
NM=1000 RIM1982 1983 1984 1QAS iCE
Source: Table 1.
Source: 'fable 2.
YEAR
PROPERTY CRIMES, 1986By Offense
6
26

2500 0
2000 0
1500.0
l000 o
500 0
0
BURGLARY CRIMES, 1981-1986Rate per 100,000 Population
19C1 1982 1983 1984 1985 1986
Source: Table 1.
Source: Table 7.
YEAR
BURGLAR'( CRIMES, 1986By Type of Entry
27

BURGLARY CRIMES, 1986By Location
Source: Table 7.
BURGLARY CRIMES, 1986By Time of Day
Sour( : Table 7.
g
ii§8
c.c.
vi
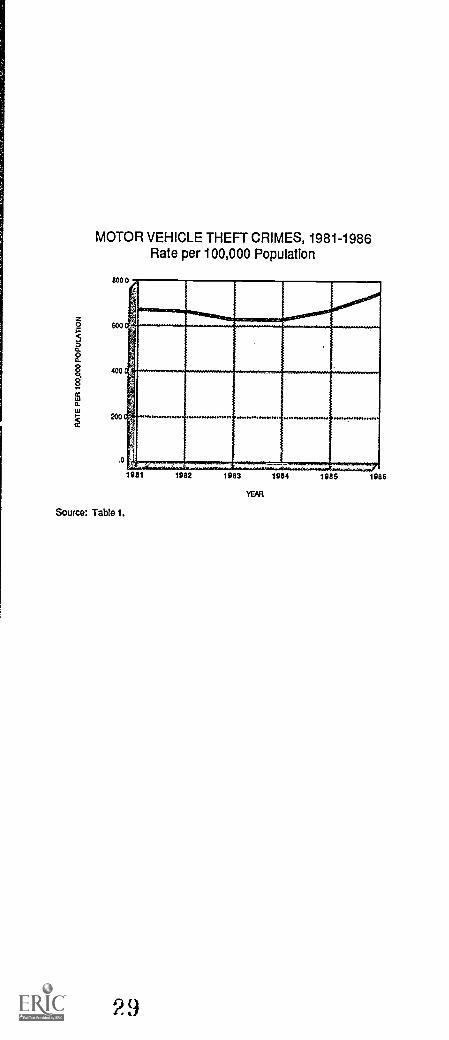
MOTOR VEHICLE THEFT CRIMES, 1981-1986Rate per 100,000 Population
1981 1982 1983 1984 1985 1986
YEAR
Source: Table 1.
29

MOTOR VEHICLE THEFT CRIMES, 1986By Type of Vehicle
Note: Percents may not add to 100.0 because of rounding.Source: Table 8.
30
0
a
5
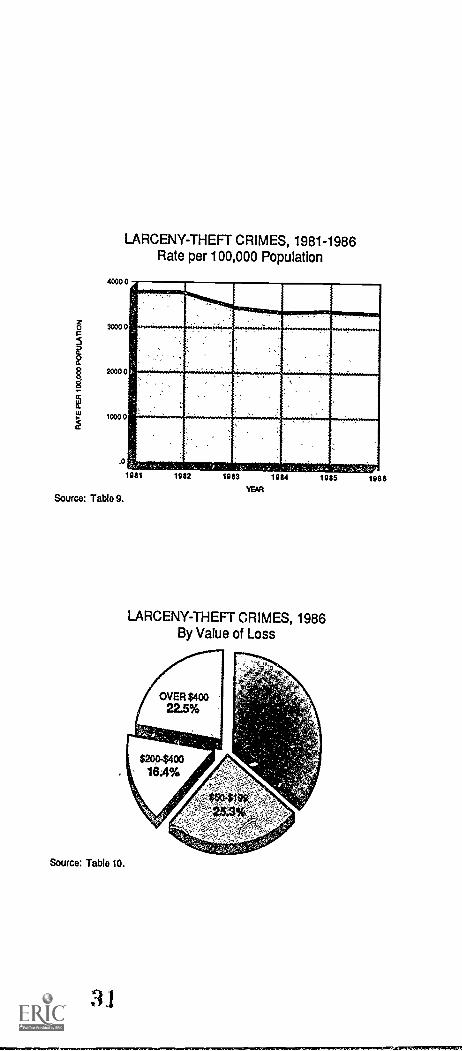
LARCENY-THEFT CRIMES, 1981-1986Rate per 100,000 Population
,IVVV ,..
...
2000 0 )
.::11111111111111111000 0
MI:%:,,-' -, ,I.,,. ,,,:.. : .. ...'? 7 , .':',. .:.,:o' ] 4 .'7,,; :'' !.:g45., ,v.,-;,,;::-I,,,P'
Source: Table 9.
1981 1082 1983 1984 1985
LARCENY-THEFT CRIMES, 1986By Value of Loss
Source: Table 10.
1986

§
LARCENY-THEFT CRIMES, 1981-1986By Value of Loss
Rate per 100,000 Population
16000
1200 0
800.0
4000
A
,....10....,
. tO.Sii)O.
UNDER
a
*: ,
«
Source: Table 9.
86
a.). ,32
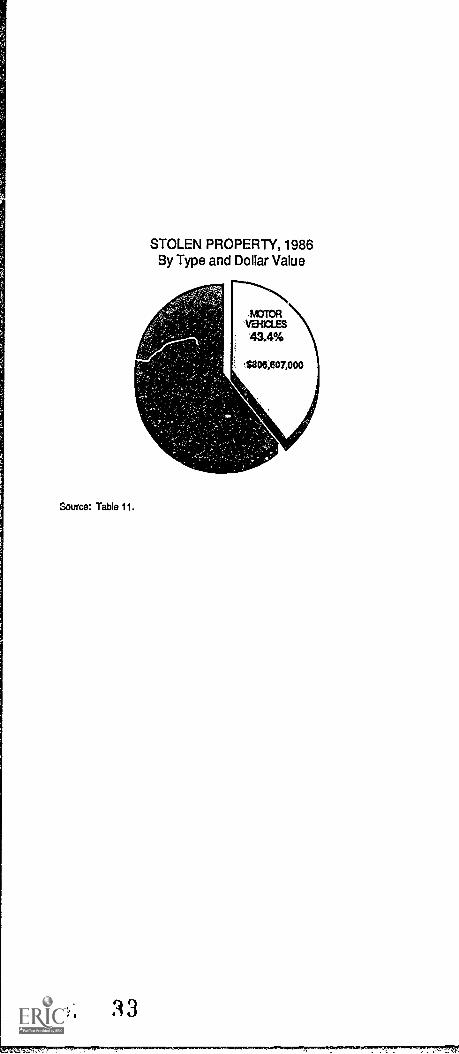
STOLEN PROPERTY, 1986By Type and Dollar Value
Source: Table 11.
3 3
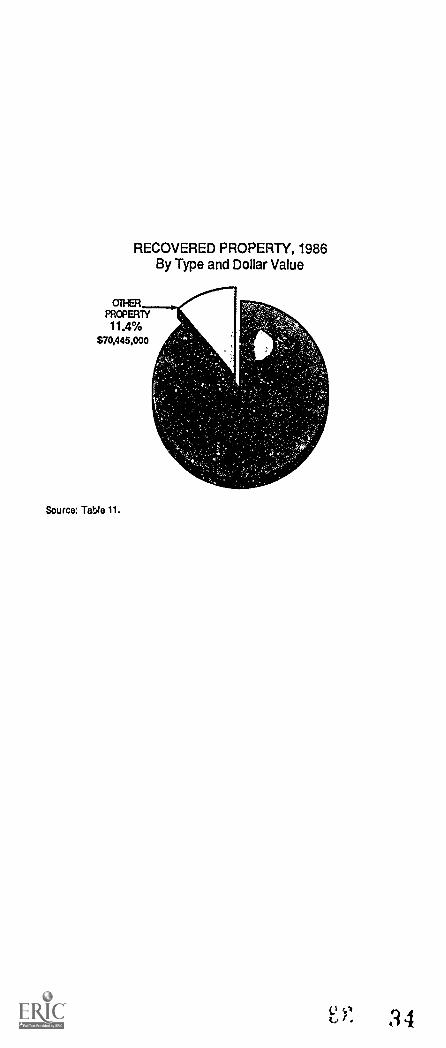
RECOVERED PROPERTY, 1986By Type and Dollar Value
MelPROPERlY11.4%
$70,445,000
Source: Table 11.
-,,' ) '. 34 4
'8.F5 80 0
2280 600
8cr
520 0
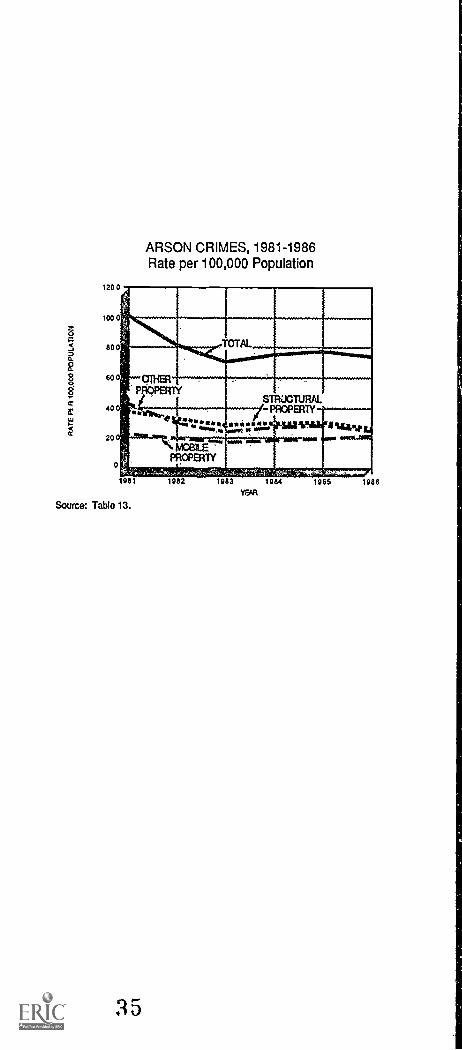
ARSON CRIMES, 1981-1986Rate per 100,000 Population
1981
Source: Table 13.
35
Source. Table 13.
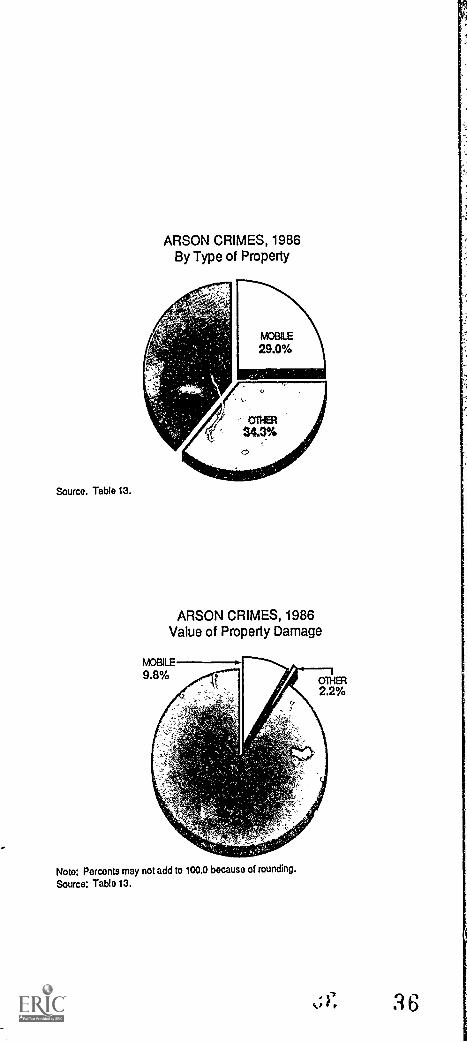
ARSON CRIMES, 1986By Type of Property
ARSON CRIMES, 1986Value of Property Damage
Note: Percents may not add to 100.0 because of rounding.Source: Table 13.

CALIFORNIA CRIME INDEX OFFENSESCLEARED, 1981-1986
Clearance Rate of Crimes Reported50
40
30
20
10
....... ..... t., ...... .ii..... .....
PROPERTYCRPAES
TOTALi,...m.....--..al
1111111YEAR
Source: Table 14.
:17
986
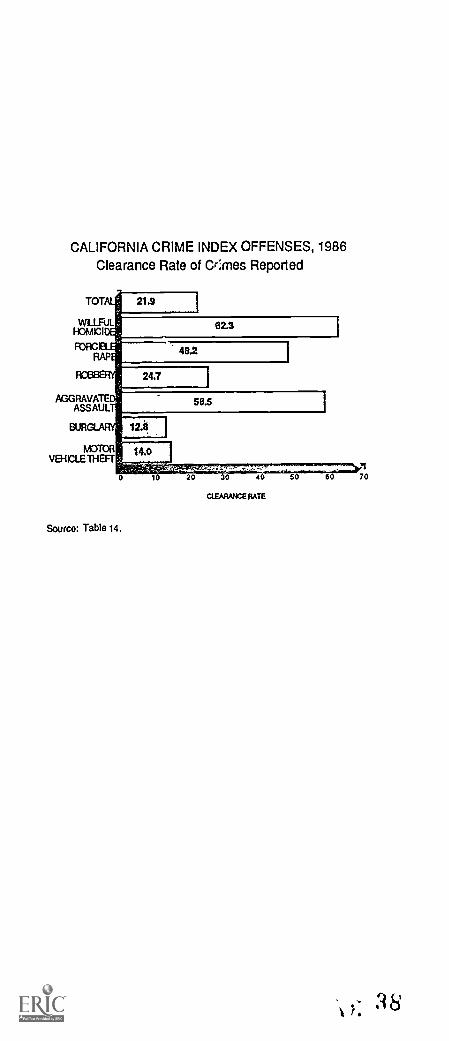
CALIFORNIA CRIME INDEX OFFENSES, 1986Clearance Rate of Cr:mes Reported
TOTAL
WHOM 1O1
FORCES FRAPE
RCGE81Y
AGGRAVATEDASSAULT
BURGLARY
MOTORVEI-93LE THEFT
21.9
62.3
48.2
24.71
12.0,
14.0
Source: Table 14.
60.5
20 30 40 50 60 70
C1F-ARANCE RATE
:4 8
ARRESTS
28 CRIME & DELINQUENCY, 1986

TOTAL ARRESTS, 1981-1986Total, Adult, and Juvenile
Rate per 100,000 Population at Risk
1981
Source: Table 15.
43
1982 1983 1984 1965 1986YEAR

Source: Table 16.
TOTAL ARRESTS, 1986By Type of Arrest
TOTAL ARRESTS, 1986By Level of Arrest
Source: Table 16.
44
(Aid Arrests (bantinu
Pe
72.4pe .244,16.
Stems offense ariestsallted.4 percent (2t,27:/).
4 47y
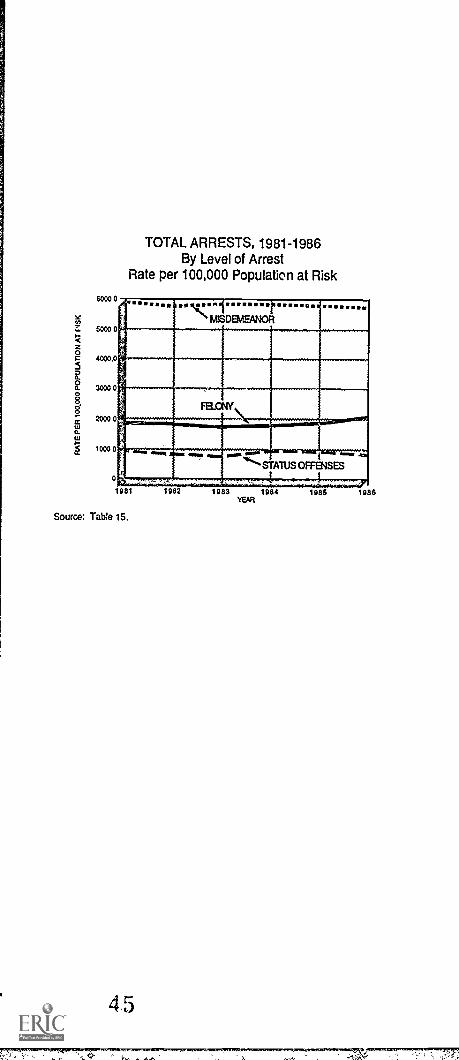
The total Format rate ,hasremained fairly stablewith the largest increaseoccurring in 1986 (upZO-percent).
A9assTs
6000 0
5000 0
4000.0
3000 0
2000 0
1000 0
0
1981 1982 1983 1984 1985 1986YEAR
TOTAL ARRESTS, 1981-1986By Level of Arrest
Rate per 100,000 Population at Risk
Source: Table 15.
4)
=r;,.k.;%
4000 0
30000
20000
10000
0
1981
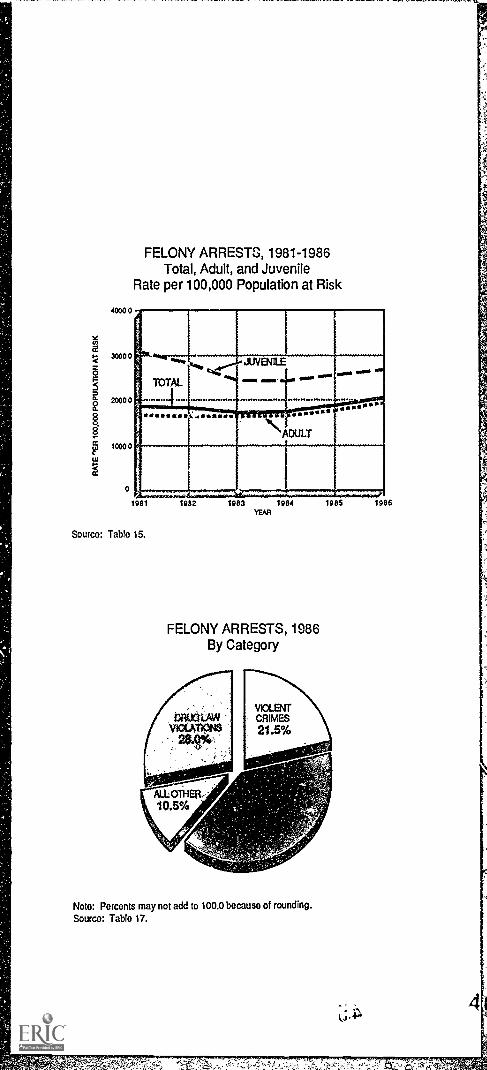
FELONY ARRESTS, 1981-1986Total, Adult, and Juvenile
Rate per 100,000 Population at Risk
...m.
TOTAL
41%, JUVENILE- MIMI
.1..
ADULT
. 0000000.......
Source: Table 15.
1982 1983 1984YEAR
FELONY ARRESTS, 1986By Category
1985
NO'
Note: Percents may not add to 100.0 because of rounding.Source: Table 17.
1986
4

TOT
VIOI ENT CRIME
PROPERTCRLME
DRUG LAt 'ION
P'1. OWE
FELONY ARRESTS, 1986Adult and Juvenile Arrests by Category
16.2%
1111=11111
124°,11024.7%
, jINIMINIIIII!er 8 8.
12.3°/
20
ADULTJUVENILE
Source: Table 17.
47
40
FERCENT
80 100

600.0
500.0cc
400 0
300 0
§.a 200.0
100 0
FELONY ARRESTS FORVIOLENT CRIMES, 1981-1986
Total, Adult, and JuvenileRate per 100,000 Population at Risk
1981
Source: Table 21.
1982 1983
YEAR
1984 1985 1985
Fran:119*o
iberOtias a25.9 ivroentiitti
trc(cift erapereentrat;Bincr
in greats a& cSparcentrgededr3ise 19 juvenile arrests. 0,)
4g
A whangift pg:09 stiltarmshe, most significant
ctordriOng the ifial,entarreot rateup
°percept

FELONY ARRESTS FORVIOLENT CRIMES, 1986
By Offense
KIDNAPPING
2.5%
Source: Table 19.
HOMICIDE3.0%
4.5%
FORCIELERAPE
FELONY ARRESTS FORVIOLENT CRIMES, 1986
Adult and Juvenile Arrests by Offense
1
1241.
f9 8%
0
ADULTE.1 JUVENILE
Source: Table 18.
49
20 40PERCENT
60 60 100

250
200
IS 0
100
5.0
0
FELONY ARRESTS FORHOMICIDE CRIMES, 1981-1986
Total, Adult, and JuvenileRate per 100,000 Population at Risk
11111111111111. MI......
111111111111IIMP
TOTAL
ADULT
...
...... 4..
JUVENILE %,
1981
Souxu Table 21.
1982 1983 1984YEAR
1985 1086
50

25
a 20
5
tS 10
tw
S
FELONY ARRESTS FORFORCIBLE RAPE CRIMES, 1981-1986
Total, Adult, and JuvenileRate per 100,000 Population at Risk
0
ADULT
%..
TOTAL JUVEIVILE---"%* gill11111111111111111111111
o
. ........ .......I5981 1982 1983 1984 1985 191
YEAR
Source: Table 21.
6
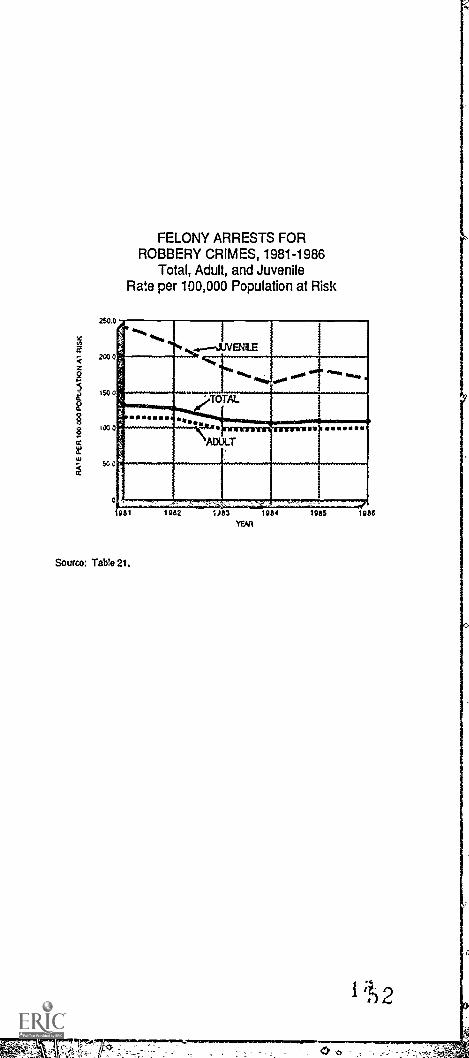
FELONY ARRESTS FORROBBERY CRIMES, 1981-1986
Total, Adult, and JuvenileRate per 100,000 Population at Risk
981 1982 1)83 1984 1985 1986
YEAR
Source: Tab lo 21.
3200
6)
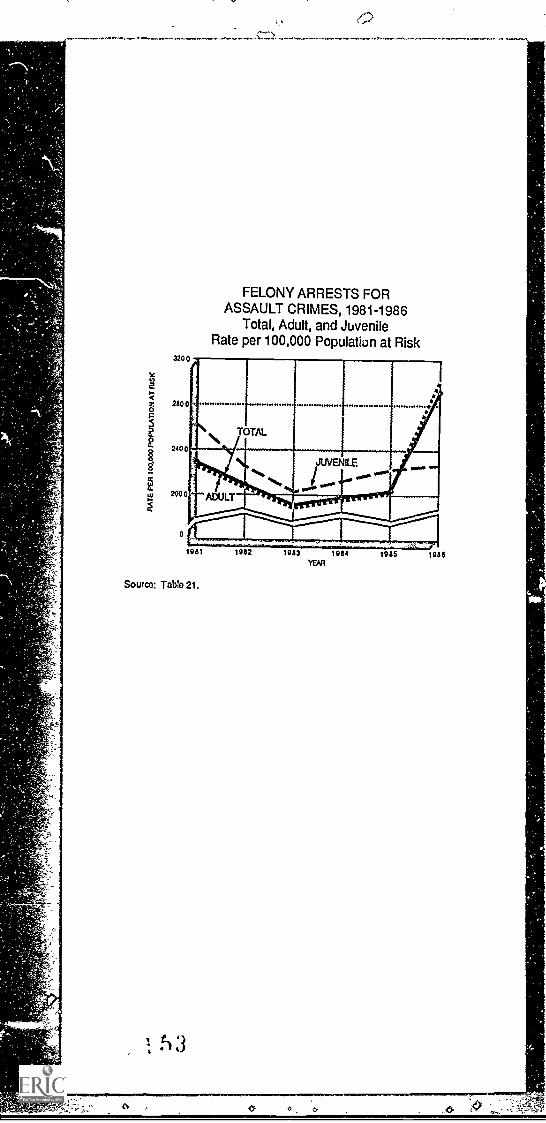
FELONY ARRESTS FORASSAULT CRIMES, 1981-1986
Total, Adult, and JuvenileRate per 100,000 Population at Risk
z 280 0
2400
200 0
0
1981
Sourco: Tablo 21.
hI
1982 1983 1984YEMI
1985 1986

FELONY ARRESTS FORKIDNAPPING CRIMES, 1981-1986
Total, Adult, and JuvenileRate per 100,000 Population at Risk
.4)
...ADULT2.0 a 0211!
/'.SIMI MINN
e111 NNNNNNN.
00 ToTAL
MilaiJUVENILE
3 o MEM1081
Source: Table 21.
1082 1084YEAST
1085 1086

29 )1
2000 0
1500 0
1000 0
500 0
0
FELONY ARRESTS FORPROPERTY CRIMES, 1981-1986
Total, Adult, and JuvenileRate per 100,000 Population at Risk
1981
Source: Table 21.
ri 5... t
1982 1983 1984
YEAR
1985 1986
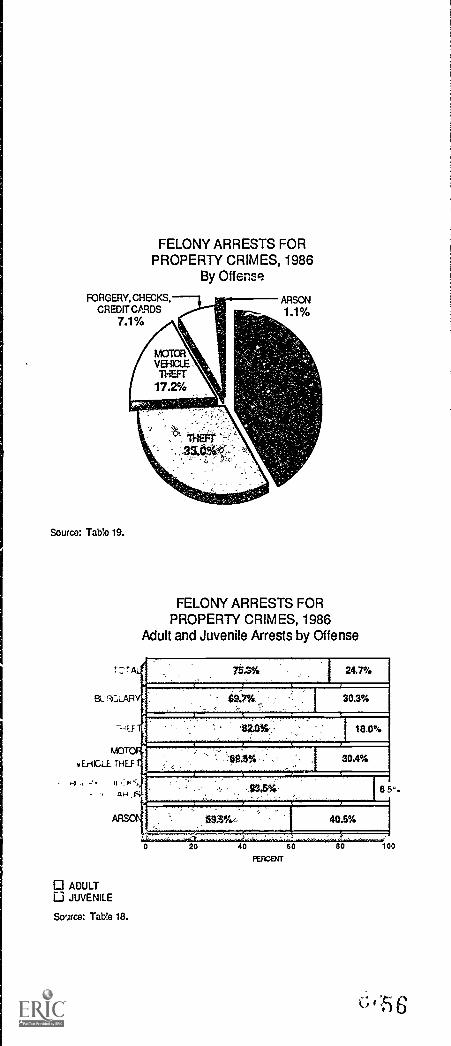
FELONY ARRESTS FORPROPERTY CRIMES, 1986
By Offense
FORGERY, CHECKS,CREDIT CORDS
7.1%
Source: Table 19.
FELONY ARRESTS FORPROPERTY CRIMES, 1986
Adult and Juvenile Arrests by Offense
0 ADULTE..1. JUVENILE
Source: Table 18.

FELONY ARRESTS FORBURGLARY CRIMES, 1981-1986
Total, Adult, and JuvenileRate per 100,000 Population at Risk
1200 0
000 0
600 0
300 0
0
am.
.*
JUVENILE
....
TOTAL
..owArm .... .111.1111.11111
ADULT
1981
Source: Table 21.
5 7
1082 1983YEAR
1984 1985 1986
600 0
E 5000-0
400 0
k 300 0
200 0
100 0
0
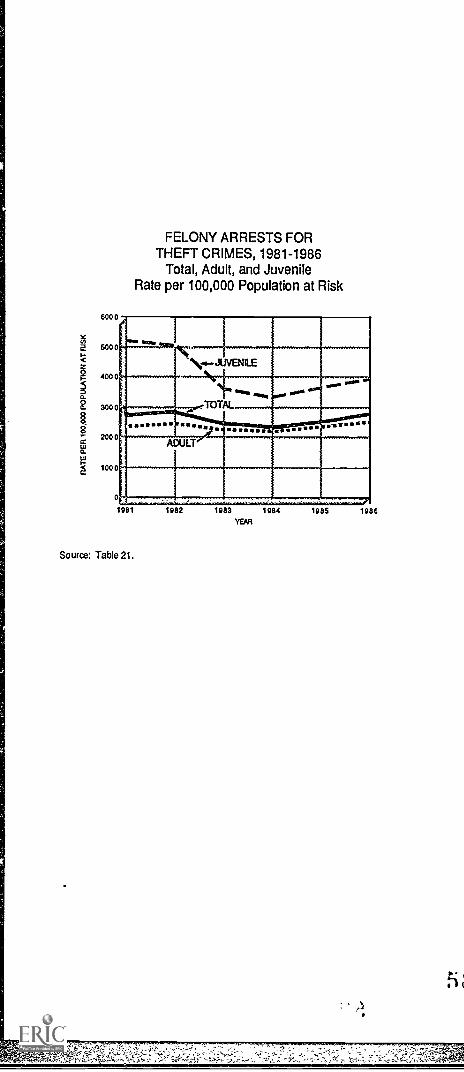
FELONY ARRESTS FORTHEFT CRIMES, 1981-1986
Total, Adult, and JuvenileRate per 100,000 Population at Risk
1111 jUVENLE 11111111grailciaggagal11111=
MI TOTAL
n::I WZISADULT
m."
1981
Source: Table 21.
1982 1983 1984
YEAR
1985 1986
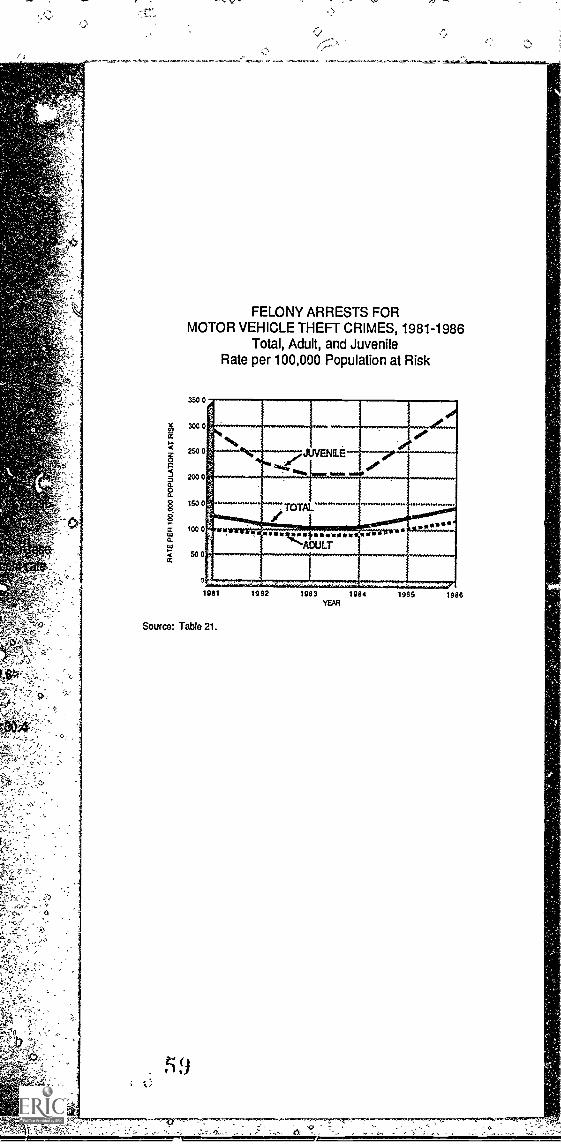
FELONY ARRESTS FORMOTOR VEHICLE THEFT CRIMES, 1981-1986
Total, Adult, and JuvenileRate per 100,000 Population at Risk
350
300
250
200
150
100
50
V
off,
o
o
o .
0
"*":TOTAC---""re"
ar op w 11a oz
ALE
a 0
0
1981
Source: Table 21.
1982 1983 1984YEAR
1985 1986
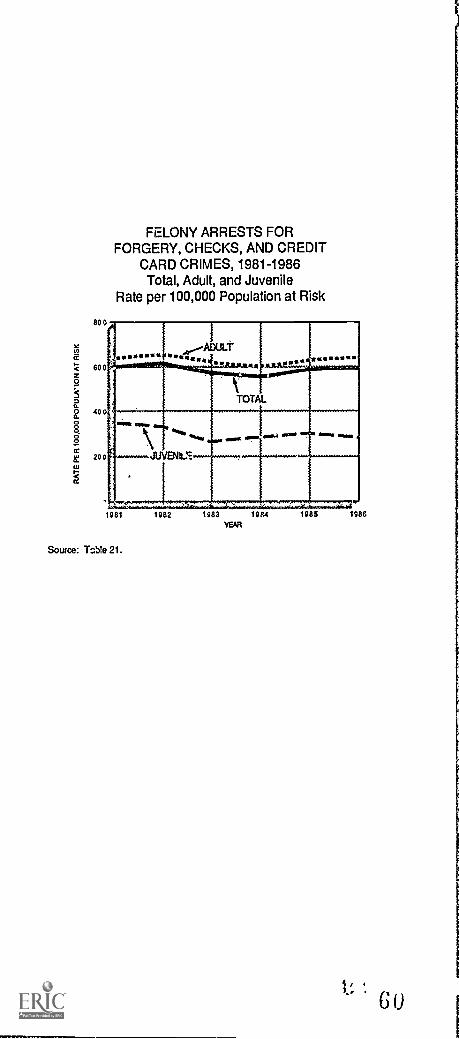
FELONY ARRESTS FORFORGERY, CHECKS, AND CREDIT
CARD CRIMES, 1981-1986Total, Adult, and Juvenile
Rate per 100,000 Population at Risk
1981
Source: Table 21.
1982 1983 1984YEAR
1985 1986

40
30
20
10
FELONY ARRESTS FORARSON CRIMES, 1981-1986
Total, Adult, and JuvenileRate per 100,000 Population at Risk
WO.
***1
- 1.11
TOTAL
~`JUVENILE
Irt-ADULT
r:. .
10 1 1082 1093 1084 1095 10i
Source: Table 21.
YEAR
6

750
z2 500
2
250cio
0
0
0
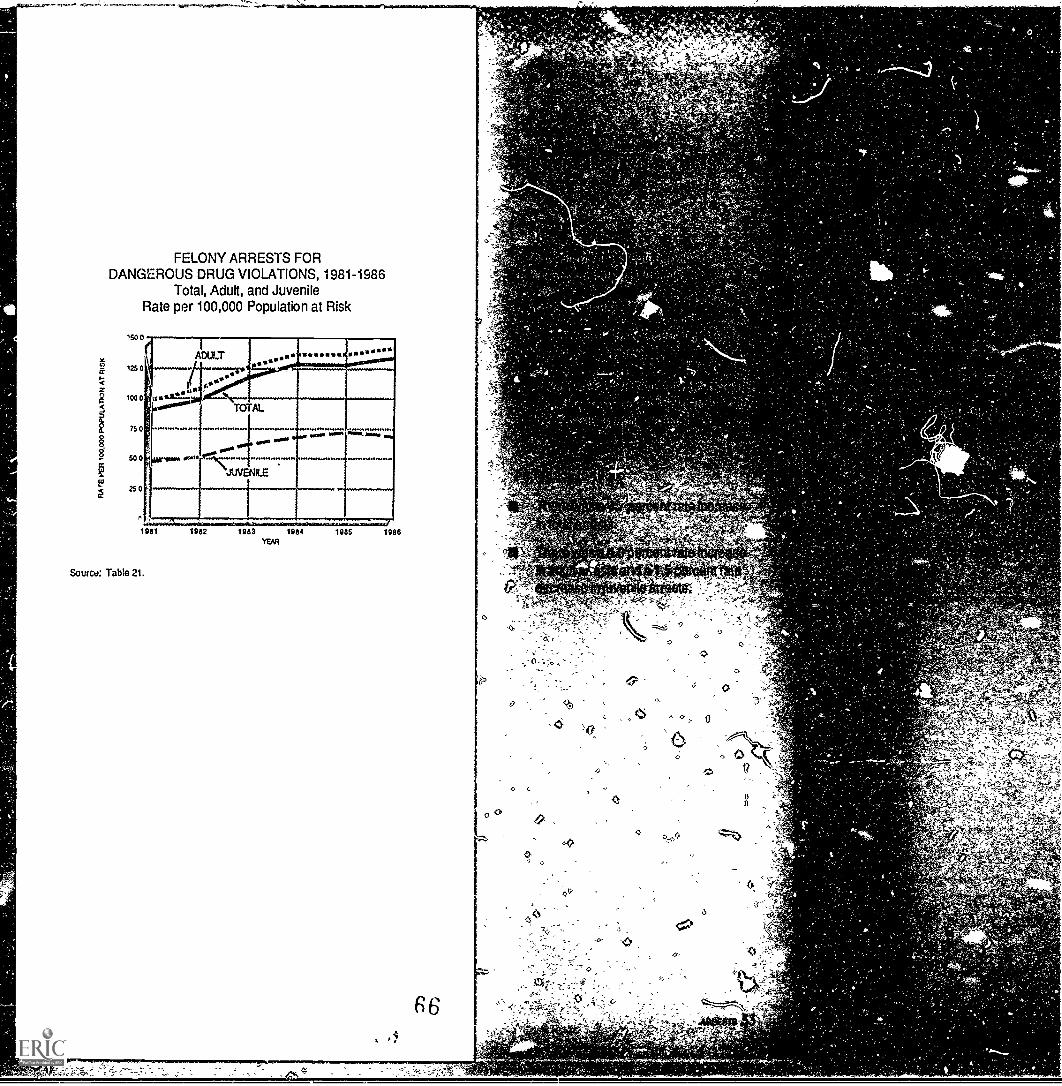
FELONY ARRESTS FOR DRUGLAW VIOLATIONS, 1981-1986
Total, Adult, and JuvenileRate per 100,000 Population at Risk
.ADULT
r . ...........****
TOTAL/
... "---
JUVENILE
I
1981
Source: Table 21.
1982 1083 1984 1995YEAR
FELONY ARRESTS FORDRUG LAW VIOLATIONS, 1986
By Offense
OTHER DRUG LAWVIOLATIONS
1.2%
Sourca: Table 19.
1986
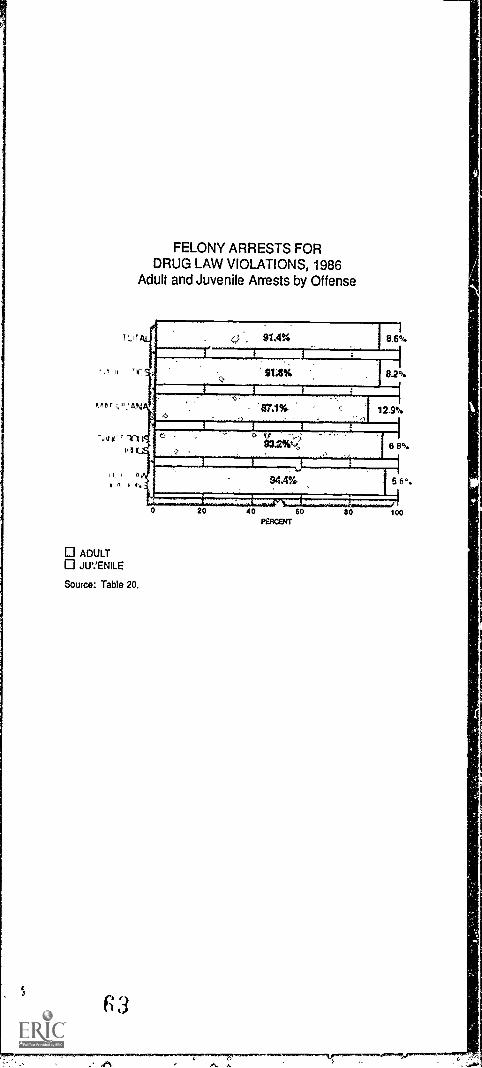
FELONY ARRESTS FORDRUG LAW VIOLATIONS, 1986
Adult and Juvenile Arrests by Offense
Tu1
,
TOW" ":AN
JVJ r rY1
ii 91
O ADULTJUVENILE
Source: Table 20.
f3
8.V
8.29
IIMMONM MENENMENNIMIN
MINMM 111111MINIMMII12.9N
93.2% 86
NINIMMINENIMIM IIINNIMMININIII
20 40 60
PERCENT
80
6°.
100
I.
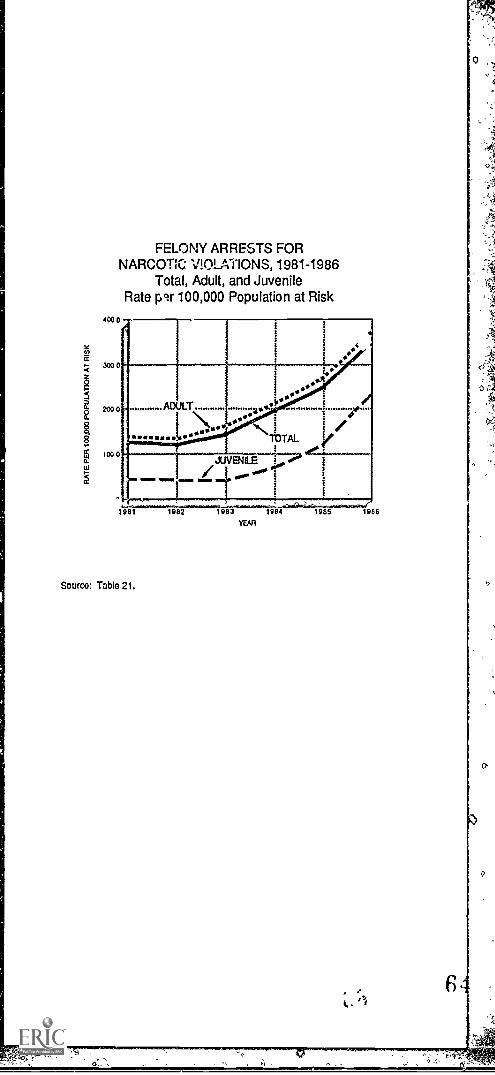
FELONY ARRESTS FORNARCOTIC: VIOLATIONS, 1981-1986
Total, Adult, and JuvenileRate pqr 100,000 Population at Risk
400 0
aaaaaaaaa °°°°°°° TOTALe
E .to,
I 4I /
'TJUVENILE r? i
I
1981
Source: Table 21.
1982 1983 1984
YEAR
1985

130
120
110
100
90
FELONY ARRESTS FORMARIJUANA VIOLATIONS, 1981-1986
Total, Adult, and JuvenileRate per 100,000 Population at Risk
NM`O
44Pricm,,gammio
o
,.,:.,
1981
Source: Table 21.
6 5
1982 1983 1984YEAR
1985 1986
El 0
'
1
e
NS
W IV
NO
0V1I1d0d 040.001 1.130 31 V
I/
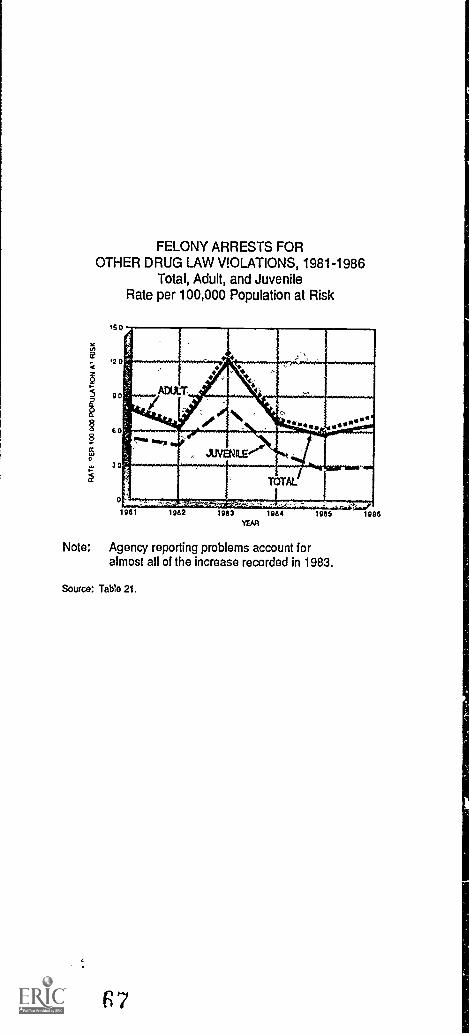
FELONY ARRESTS FOROTHER DRUG LAW V!OLATIONS, 1981-1986
Total, Adult, and JuvenileRate per 100,000 Population at Risk
Ae:-,
5'ii§8
1981 1982 1983 1984YEAR
1985
Note: Agency reporting problems account foralmost all of the increase recorded in 1983.
Source: Table 21.
67
1986

MISDEMEANOR ARRESTS, 1981-1986Total, Adult, and Juvenile
Rate per 100,000 Population at Risk
1981 1982 1983 1984
MR
Source: Table 2.?.
1985 1986
6 S
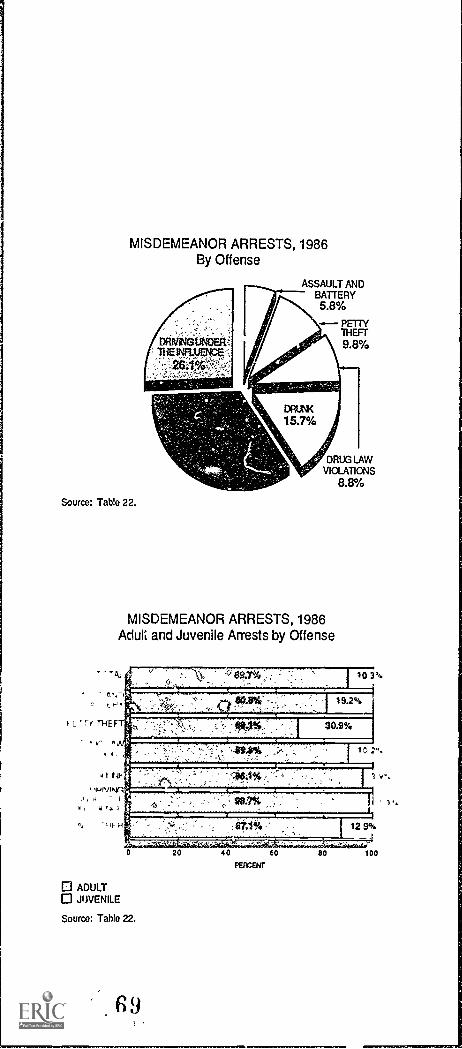
MISDEMEANOR ARRESTS, 1986By Offense
ASSAULT ANDBATTERY5.8%
PETTYTHEFT
9.8%
Source: Table 22.
MISDEMEANOR ARRESTS, 1986Adult and Juvenile Arrests by Offense
'AL
THE
it 5
--, 10 3
192%
.. 30.9%
. .. -
ADULTJUVENILE
Source: Table 22.
20 40 60 80 100
PEACINT

MISDEMEANOR ARRESTS FORASSAULT AND BATTERY, 1981-1986
Total, Adult, and JuvenileRate r er 100,000 Population at Risk
600 0
450 0
300 0
150 0
III JUVENILE RE,..
..... v.t,.....ADULT
MEM1981
Source: Table 23.
1982 1983 1984YEAR
1985 1986
7E1

N
z
8
8
MISDEMEANOR ARRESTS FORPETTY THEFT, 1981-1986Total, Adult, and Juvenile
Rate per 100,000 Population at Risk
1981
Source: Table 23.
71
1982 1983 1984 1985 1986YEN1
600 0
500
400 0
300 0
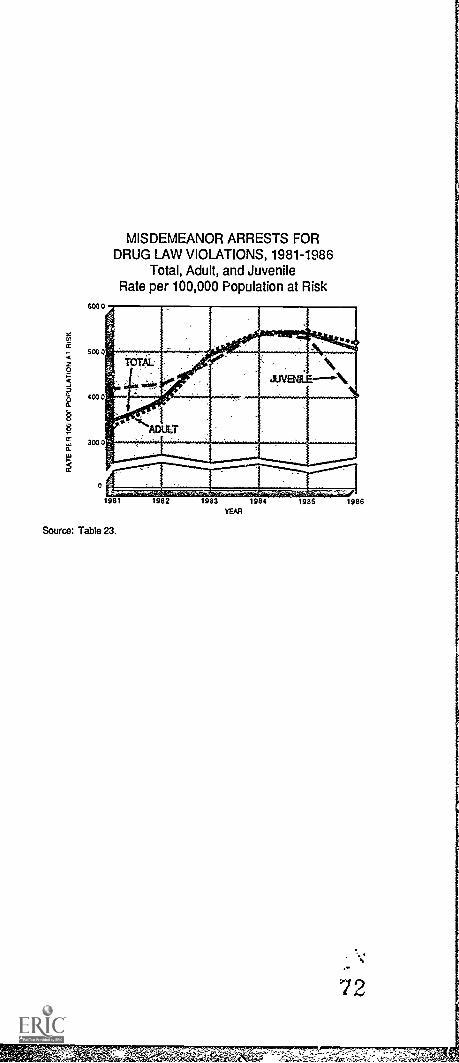
MISDEMEANOR ARRESTS FORDRUG LAW VIOLATIONS, 1981-1986
Total, Adult, and JuvenileRate per 100,000 Population at Risk
TOTAL
JtiV'EtlitIE---A
ADILT
11111111101111111111111111111.
1981
Source: Table 23.
1982YEAR
1984 1985 1986
72

MISDEMEANOR ARRESTS FOR DRUNK, 1981-1986Total, Adult, and Juvenile
Rate per 100,000 Population at Risk
1500 0
1200.0
Oz
900 0
600 0
tu300 0
0
ADULTI
w.
TOTAL
I
"7,JUVENLE
so ellINS INOOS WNW
1981
Source: Table 23.
73in
1982 1983 1984
YEAR
1985 1991

MISDEMEANOR ARRESTS FORDRIVING UNDER THE INFLUENCE, 1981-1986
Total, Adult, and JuvenileRate per 100,000 Population at Risk
2000 0
.............0 ......
_.Nouili
DuLTADULT
.
111111111111111111111
IIIIjuVENILE
.00 .....IN1981
Source: Table 23.
1982 1983 1984
YEAR
1985 1986
7 4

PERSONAL CHARACTERISTICS OFFELONY AND MISDEMEANG, t ARRESTEES, 1986
SEX
FEMALE
Source: cable 27.
FELONY AND MISDEMEANOR ARRESTS, 1986Sex :nf Arrestee
73.4%
1.11MIMMIUM11.73.0%
111111111.111.111M1111Z4.4% 75.6%
FELONYMISDEMEANOR
Source: Table 27.
7 :5
20 40 60
PERCENT
80 100

PERSONAL CHARACTERISTICS OFFELONY AND MISDEMEANOR ARRESTEES, 1986
AGE
Source: Table 27.
FELONY AND MISDEMEANOR ARRESTS, 1986Age of Arrestee
14.2771 65.8%
rn72.9%
1
.,.. 78.5%
_I
L I
FELONYMISDEMEANOR
Source: Table 27.
80 100
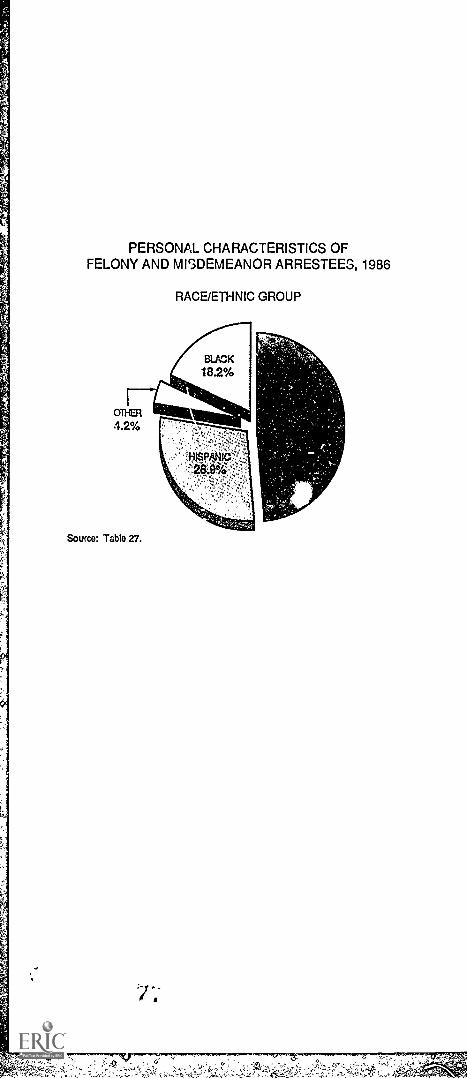
PERSONAL CHARACTERISTICS OFFELONY AND MISDEMEANOR ARRESTEES, 1986
RACE/ETHNIC GROUP
Source: Table 27.

FELONY AND MISDEMEANOR ARRESTS, 1986Race/Ethnic Group of Arrestee
VVHrTE(NOT HISPANIC)
HISPANIC
SLACK
21.3% 79.7%11
1 I i
26.0% 74.0%
i
425* 57.5%
1 1 E I
234% 77.0%
20 40 60
PERCENT
FELONYMISDEMEANOR
Source: Table 27.
80
1.
100

Discussion of changes in arrest ratesbased on different at-risk populations
An arrest rate is the ratio of the number of reported arrests to thepopulation at risk. The th;ee comparison populations used in theArrests section of this report are. adults (18 years of age and over),juveniles (10-17 years of age), and total (10 years of age and o er).If, in calculating periodic changes in arrest rates of any one of thesethree populations, the size of the population remained constant.
The arrest rate in any given year would be larger than that of aprevious year if the number of arrests reported that year waslarger than tat of the previc is year.
IIII The arrest rate in any given year would be smaller than that of aprevious year ! the number of arrests reported that year wassmallerthan that of the previous year.
However, if the number of arrests remained constant and tne size of thepopulation changed,
II The arrest rate in any given year would be smaller than that of aprevious year if the population increased.
CI The arrest rate in any given year would be larger than that of aprevious year if the population decreased.
Because both the number of arrests and the at populations uponwhich adult and juvenile arrest rates are based are .: dependent, onewould not expect any relationship betwe.ii the percent change in adultand juvenile arrest rates from one y ear to another. However, becausetotal arres' rates are based on the sums of both adult and juven;learrests and adult and juvenile at risk populations, one would expectthe percent change in the total arrest rate from one year to another toreflect percent changes in adult anti juvenile arrest rates during thesame time period. It does, but the relationship is complex. Thiscomplexity is attributed to the fact that percent change in the totalarrest rate from one year to another is the result of independentchanges in both the number of arrests and the at risk populations ofadults and juveniles in those years. Consequently, in scme instances, itis extremely difficult to relate either the magnitude or the direction(positive or negative) of the change in the total arrest rate with thoseof changes in adult and juvenile arrest rates.
For example, in the analysis of total arrests on page 30, it was statedthat from 1981 to 1986 there was a 1.0 percent increase in the totalarrest rate, and, during the same period, there was a 2.6 percentincrease in the adult arrest rate, and a 7.4 percent decrease in thejuvenile arrest rate.
The apparent inconsisterK:y between ct-ianges :tie tutu. eur care andadult and juvenile arrest rates can best De understood .'ymathematically showing exactly how each occurred.

ARRESTS
68 CRIME & DELINQUENCY. 1988
Fts
Foi
I4
Fri
+7;
ADULT FELONYARREST
DISPOSITIONS
The Offender-Based Transaction Statistics(OBTS) System in California describes theprocessing of adults arrested for felonyoffenses from arrest through finaldisposition. Data on the adjacent flow chartpertain specifically to the 258,832 adultfelony arrests which received finaldispositions in 1986.
WHAT IS A FINAL DISPOSITION?
In the OBTS system, the term "finaldisposition" is used to refer to a specificlegal action which takes place following anadult felony arrest. Final dispositions canoccur at the law enforcement, prosecutor,lower court, or superior court levels. Forexample, if an arrestee is released by a lawenforcement agency, or by a prosecutor whohas determined that there is nut enoughevidence to justify the filing of a complaint,this release is recorded as a finaldisposition. If an arrestee is referred tocourt for adjudication, the outcome, (i.e.,dismissal, acquittal, or conviction) is alsorecorded as a final disposition."Intermediate" dispositions (e.g.,placements in diversionary programs) arenot included in these annual statistics.
72 CRIME& DEUNOUENCY.19e6
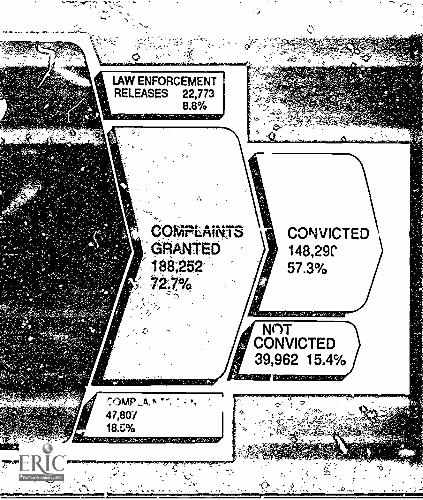
LAW ENFORCEMENTRELEASES 22,773
8.8%
CONVICTED148,29C57.3%
47,8W18.C%

PROBATION WITH JAIL - 89,394 34.5%
PROBATION - 19,273 7A%Airminsimmeassomar
STATE INSTITUTIONS4 - 25,132
JAIL- 12 396 4.8%
FINE AND OTHER - 2,095 .8%
LOWER COURT DISMISSALS, ACQUITTALS - 35,163 13.6%
SUPERIOR COURT DISMISSALS, ACQUITTALS- 1.9% )
HOW ARE OBTS DATAREPORTED?
OBTS data are taken directly from theState's Automated Criminal History System(ACHS). Most al rast information is enteredinto ACHS from fingerprint cards wh:emost dispositIon data are entered from"Disposition of Arrest and Court Action"I,JUS 8715) forms received by theDepartment of Justice from lawenforcement agencies, prosecutors' offices,and lower and superior courts. The 1986OBTS Report File contains 94 percen' of alldispositions which were available to theDepartment for processing when the annualfile was created on April 25, 987. (See"Known Data Limitations" in this report foradditional information.) Overall, these finaldispositions describe the statewideprocessing of adult felony arrestees throughCalifornia's criminal justice system in1986.
astate institutions include prison, YouthAuthority, and Califorria Rehabilitation Center.
Note: Percents may not add to 100.0 because ofrounding.
Source: Table 36.
ADULT DISPOSITIONS 73
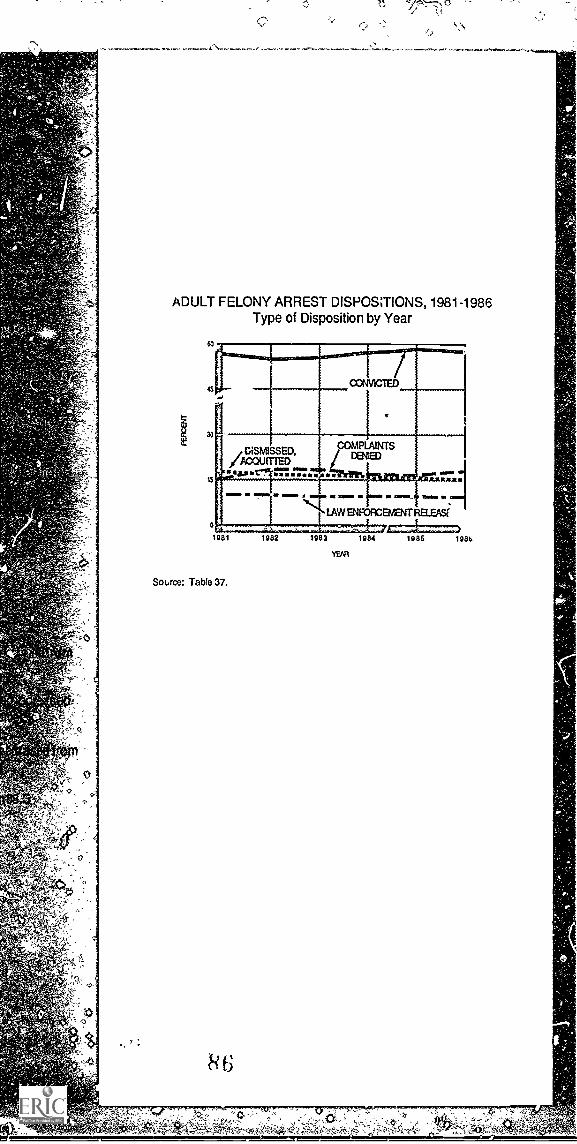
ADULT FELONY ARREST DISPOSffIONS, 1981-1986Type of Disposition by Year
COMPLAINTSIX3VIED
15 44 a-IIse maw-
JULICStAke
LAW ENFORC EMENT RELEASI0
1081
SoLrce: Table 37.
68
1082 1083 1084
YEAR
1085 bOb

ADULT FELONY ARREST Li.SPCLiTiONS, 1.;66Arrest i'tense Category y Type of
;
<11
20 40PER:ENT
60
D LAW ENFORCEMENT RELEAL:SO COMPLAINTS DENIEDEi DISMISSED, ACQUITTED1.3 CONVICTED
Note PP, cents may not aoo to Dek.dw5f3 ii iuiioSource: Table 38.
80 100
H

ADULT FELONY ARRESTEES CONVICTED, 1981-1986Type of Sentence by Year
80
iymiPROBATION
JAIL ,.............". '
.... """` ."...row
PROM
..................
*4\....... a. * ...
NSTITUTIONS
Al S..
STATE
ma a maw Is
JA11.0
1111.1111110 1110 mow .. '
Source: Tab!e 39.
8
1986YEAR

IF
.,

ADULT FELONY ARRESTEES CONVICTEDOF VIOLENT CRIMES, 1981-19E6
Type of Sentence by Year
1983 1984
YEAR
Source: Table 39.

d
ADULT FELONY ARRESTEES CONVICTEDOF VIOLENT CRIMES, 1986
By Type of Sentence
Note: Percents may not add to 100.0 because of rounding.Source: Tai310 40.
p5

t
ADULT FELONY ARRESTEES CONVICTEDOF PROPERTY CRIMES, 1981 -1 986
Type of Sentence by Year
. IIII PROBATIONWITH JAIL
i
tO
SINSTITUTIONS
...
ATE
''''''''''''''''''''iii
ii
PR3BATKN
"'I'
o
it
fry '''''" """ i".... -1.."... I. ........4 .
JAII-*' : I4..... .
- ----,1981
3ource: Table 39.
c
92
1982 1983 1984
YEAR
1985 1986

<7
ADULT FELONY ARRESTEES CONVICTEDOF PROPERTY CRIMES, 1986
By Type of Sentence
Source Table 40.
AY:
; 6 ;
C.;lrer:'
,
113
Adult felony arreqeesconvicted0
0
JO- .=-4`
< rs

ADULT FELONY ARRESTEES CONVICTEDOF DRUG LAW VIOLATIONS, 1981-1986
Type of Sentence by Year80
'1:**741*
PWITH
RATIONJAIL
4.
JAIL
( ,S T,..
...... PROBATION
TE INST IONS
" ............... .......... . 1
1981
Source: Table 39.
1982 1983 1984YEAR
f985 1986
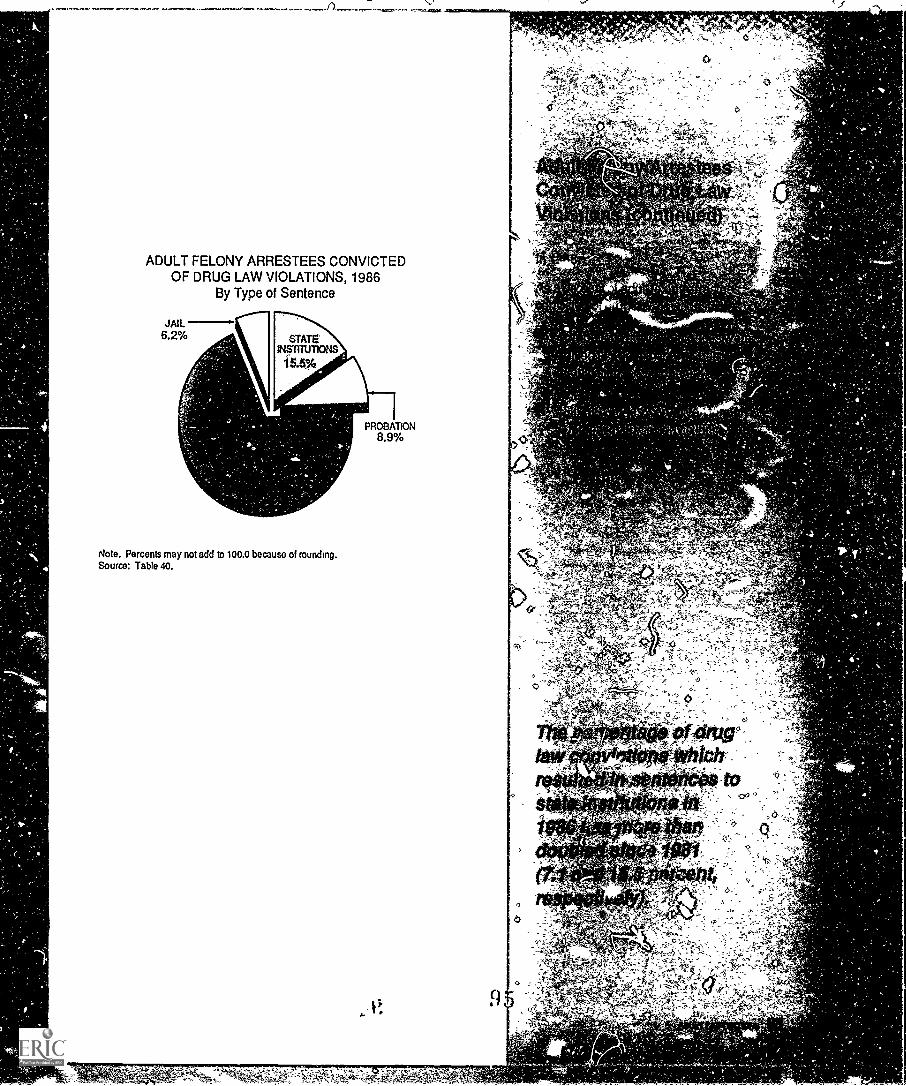
ADULT FELONY ARRESTEES CONVICTEDOF DRUG LAW VIOLATIONS, 1986
By Type of Sentence
Note. Percents may not add to 100.0 because of rounding.Source: Table 40.
PROBATION8.9%
.
9
- TA
a
Q"
,:r4'-ct
-
-
9
' r
'
r
7
rir

.,0111§.0.11011111,
DISPOSITIONS OF ADULT FELONY ARRESTS, 1986By Type of Disposition
LAW ENFORCEMBITRELEASES
8.8%
Note: Percents may not add to 100.0 because of rounding.Source: Table 36.
9 t;
ACQUI1TED
.4%

DISPOSITIONS OF COMPLAINTS GRANTEDRESULTING FROM ADULT FELONY ARRESTS, 1986
By Type of DispositionOte
DISMISSED
20.7%
ACQUITTED.5%
Source: Table 36.
wBit0e.;Wth *lie:fit:a:evaluate-1W.state, peu eindlopel:cOrptsysten s. t eerier ei*entatioti ddfP,344410iStrica.450(f9are tiandle#Ostetae'nd doti triininatjustice agencies be_;!rne,4 purpose 0.010.015TO system.:
Adults convicted in California courts are usually placed under thejurisdiction of either the state correctional system ci a correctionalsystem operated by local government. The state correctional systemprovides confinement, rehabilitation, and parole services through meCalifornia Department cf Corrections (CDC), the California YouthAuthority (CYA), the California Rehabilitation Center (CRC,, and theCalifornia Department of Mental Health (CDMH). Local correctionalagencies provide confinement, rehabilitation, and probation seNicesfor those sentenced to their care and also house persons awaitingtrial or sentencing.
Supervision data are obtained annually by a one day count of personseither in state or local institutions, or on parole, probation, oroutpatient status.
Population rates discussed in this section are based on the adultat-risk population, 18 years of age and older.

ADULTS UNDER SUPERVISION, 1981-1986Total, State, and Local SupervisionRate per 100,000 Population at Risk
Source: Table 47.
Source: Table 48.
11111111"
TOTA. Mil..., ...
SUPERVISION
PPP.
STATE SUPERVISION
.......................
1981 1982 1983 1984
YEAFI
ADULTS UNDER STATE ANDLOCAL SUPERVISION, 1986
STATESUPERVISION
25.9%
1985 1986

ADULTS UNDER STATE SUPERVISION, 1981-1986Institutions and Parole/Outpatient Caseload
Rate per 100,000 Population at Risk
1981 1902 1983 1984 1985
YUJI
Source: Table 47.
ADULTS UNDER STATE SUPERVISION, 1986
Source: Table 48.
if'

ADULTS UNDER LOCAL SUPERVISIGN, 1981-1986County and City Jails and Camps and Probation Caseload
Rate per 100,000 Population at Risk
1200 0
PROBATION CASELOAD
600 of
300
COUNTY AND CITYJAILS AND CAMPS
181 1982 I83 1984 1985 1986
YEAR
Source: Table 47.
ADULTS UNDER LOCAL SUPERVISION, 1986
COUNTY AND CITYJAILS AND CAMPS
20.7%
Source: Table 48.

ADULT PROBATION ACTIVE CASELOAD, 1986
Source: Table 49.
4

ADULTS PLACED ON PROBATION, 1981 198,Rate per 100,C00 r...pL!atIort at Fi.Lk
600 0
1981 1982 1983 1984
YEAR
Source: Table 50.
1985 1986
ADULTS REMOVED FROM PROBATION, 1986
Note. Fel 6thits may not add io 100.0 because of iounding.Source: Table 50.
(15
Aduits' Placed on, andRemoved from Probation
FrOrn.196:110198.6c
7r There was,a1.32peroer4 inOreaSe in,the rate bi,argitts,014ced on*Obatki
'thin) was*,47.9,pereentinpreasNnthe:rate efiadelfS-sente IMO)sPPeriO, rtOuit,a
. , increaSe4rpe;r0eotaclulteseritenOedfrom lower-caul.
Fibm.f6,66-io1966:
There:Watal,Olpettent raftchrdteaSe-fn- adults pface0 onprobation. -.
a Therevoe,s'al i6rOint e,rateincreasin actufts,sentenped fminsupetior cowlam an 84peroentrateincrease Inedultssentencedfromlowercourt
6
in 1966, there,Werel ;262.aduttsjalaaed.,on protionanci.,116,ViOidults removed'froinprobailon. atheacluttaremovedfrornprobation:,
TfinseWho.cenlplatecitheirierros ofprobation locounted for67.1perOent(66,263)
Ibtise`.WhoArblafed Oirprobatien:accounted rc7pe161'36 ent (42. ,-675)
111 ThosOwho were remove. reasons, such, aitrensfers
jurisdiction froinoneliotintyloanother, Oaths, ancia0peaifor 6:3 peroent,(7,302).
..Cr.2z
5RR
§g,.w
200
15.0
10.0
50
nn
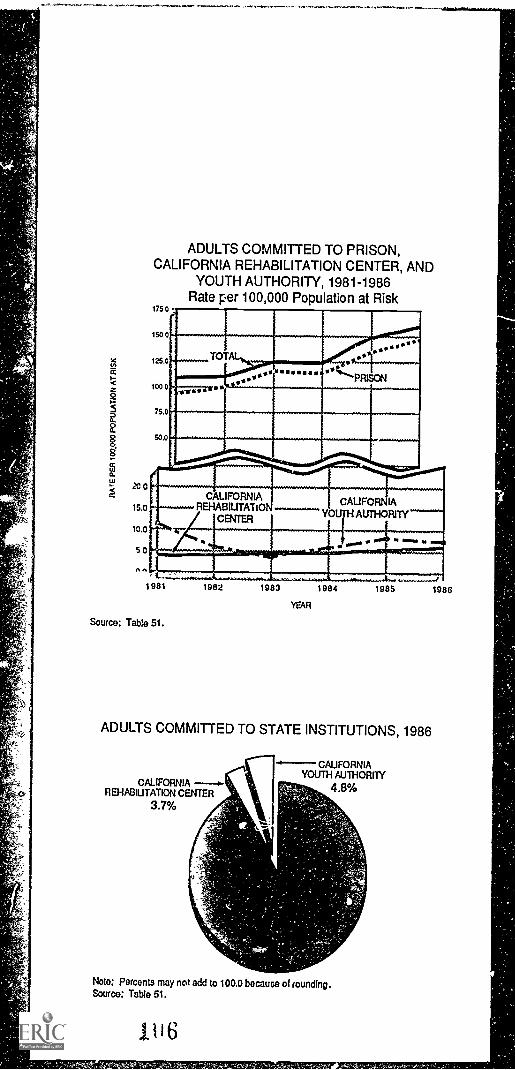
ADULTS COMMITTED TO PRISON,CALIFORNIA REHABILITATION CENTER, AND
YOUTH AUTHORITY, 1981-1986Rate per 100,000 Population at Risk
1981
Source: Table 51.
1982 1983 1984
YEAR
1985
ADULTS COMMITTED TO STATE INSTITUTIONS, 1986
CALIFORNIA ---0-RO-IABIUTATION CENTER
3.7%
1986
-4---- CALIFORNIAYOUTH AUTHORITY
4.8%
Noto: Percents may not add to 100.0 because of rounding.Source: Table 51.
106
,
JUVENILEJUSTICESYSTEM
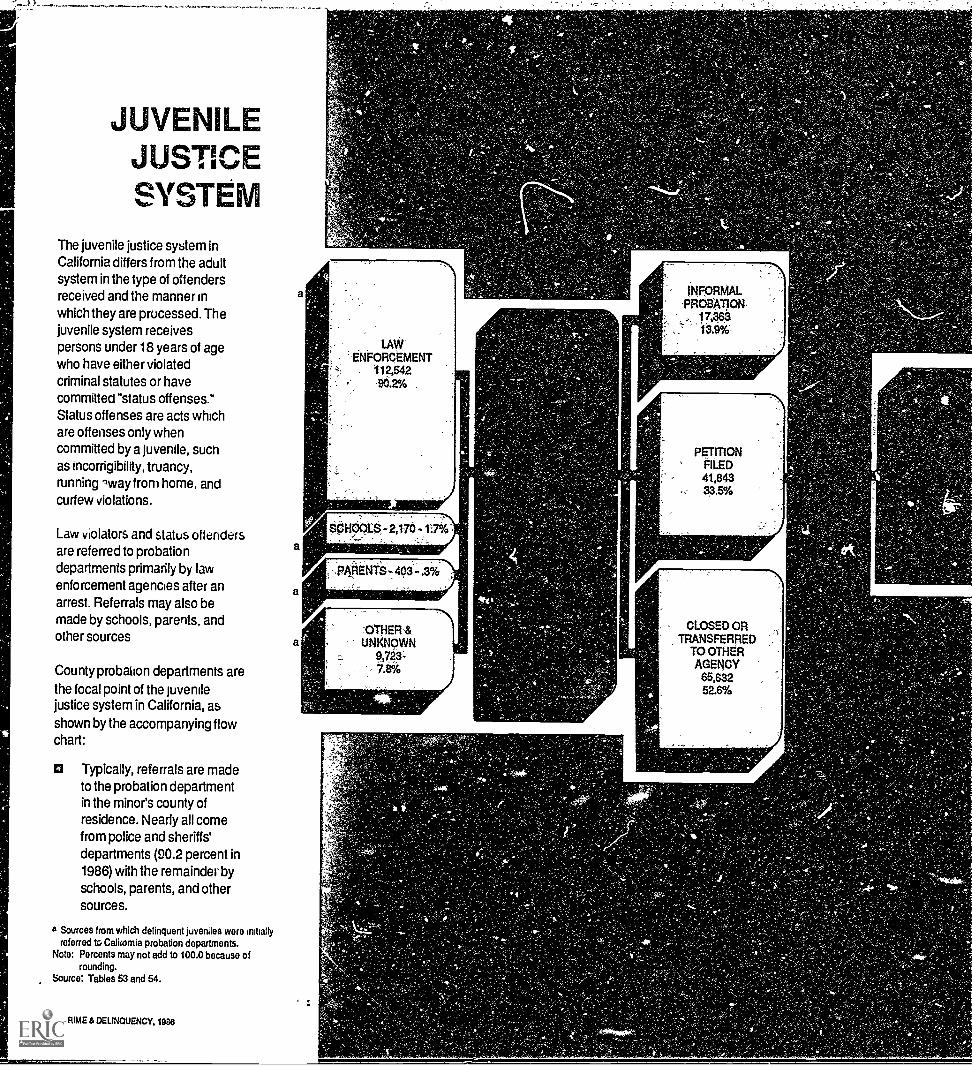
The juvenile justice system inCalifornia differs from the adultsystem in the type of offendersreceived and the manner inwhich they are processed. Thejuvenile system receivespersons under 18 years of agewho have either violatedcriminal statutes or havecommitted "status offenses."Status offenses are acts whichare offenses only whencommitted by a juvenile, suchas incorrigibility, truancy,running iway from home, andcurfew violations.
Law violators and status oftencitrsare referred to probationdepartments primarily by lawenforcement agencies after anarrest. Referrals may also bemade by schools, parents, andother sources
County probation departments are
the focal point of the juvenilejustice system in California, as
shown by the accompanying flowchart:
13 Typically, referrals are madeto the probation departmentin the minor's county ofresidence. Nearly all comefrom police and sheriffs'departments (90.2 percent in1986) with the remainder byschools, parents, and othersources.
a Sources from which delinquent juveniles were initiallyreferred to California probation departments.
Note: Percents may not add to 100.0 because ofrounding.
Source: Tables 53 and 54.
98 CRIME a DELINQUENCY, 1986
a
LAWENFORCEMENT
112,542302%
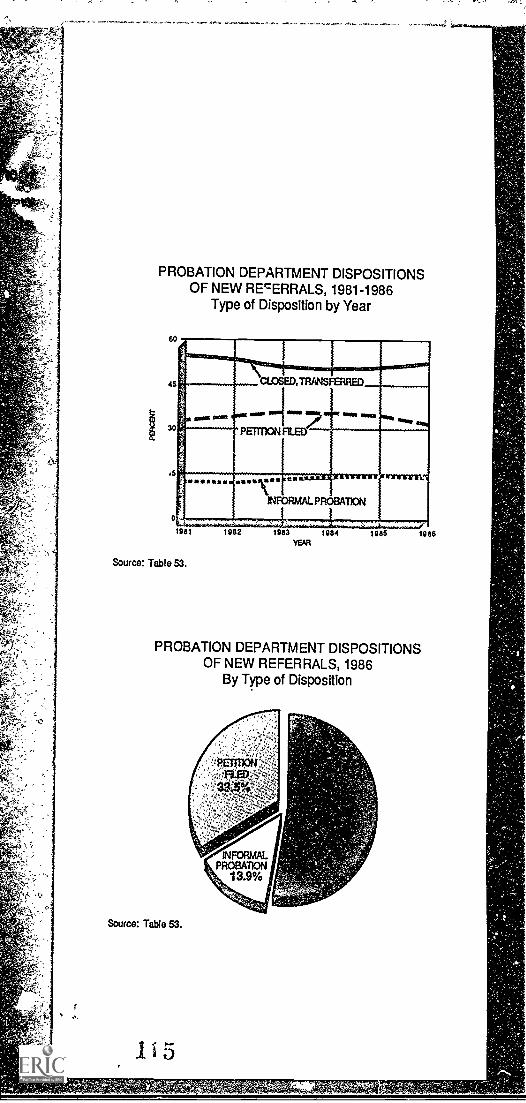
PETMONFILED41,84333.5%
S.P.1901:8 -2,170 -1 :7%
PARENTS - 403 -.3%
a
CLOSED ORTRANSFERRED
TO OTHERAGENCY
65,63252.6%

El Decisions are made by
probation departments onhow referred cases are to behandled. A case may be
closed or transferred, ajuvenile may be placed oninformal probation, or apetition may be sought for acourt hearing.
1M-WAR:1:1913A710N4;914-4.8%.
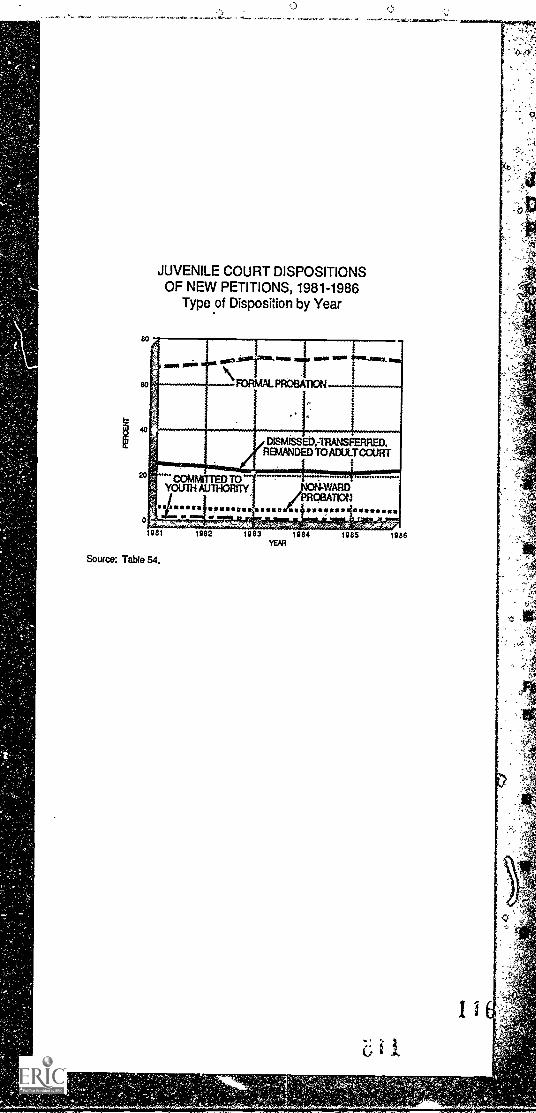
r! The juvenile court places
most new petitioned casesunder probation departmentsupervision (71.0 percentformal probation and 4.8
percent non ward probationin 1986).
Established ,n 1980, the BCSJuvenile Court and ProbationStatistical System requires thereporting of all delinquencyreferrals for both new and activecases. A1158 county probation
departments report complete newreferral data However, somedepartments were unable tomodify pre-1980 automatedreporting programs to includecertain types of subsequentreferral information. Therefore,subsequent referral data areshown for 54 counties only.
JUVENILE JUSTICE SYSTEM 99

10000.0
WOO 0
6000 0
4000 0
2000 0
t,
1981 1 982 1983 1984 1985
YEAR
JUVENILE ARRESTS, 1981-1986Offense Level by Year
Rate per 100,000 Population at Risk
Source: Table 15.
1986

Is
+V
',*
,'
,
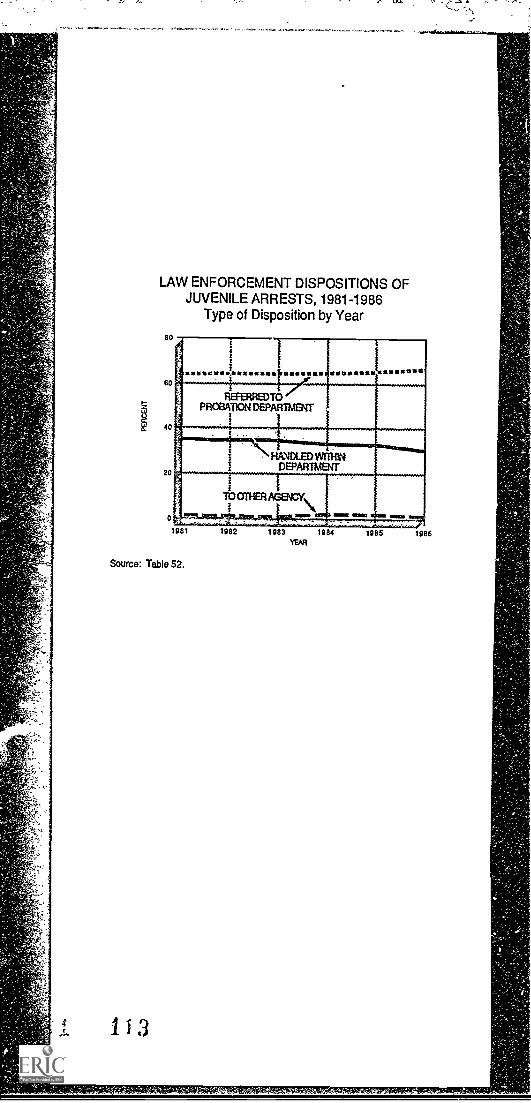
LAW ENFORCEMENT DISPOSITIONS OFJUVENILE ARRESTS, 1981-1986
Type of Disposition by Year
BO
60
40
20
0
1981
Source: Table 52.
1982 1983 1084 1985
TOT
FEL
MISDEMEANO
STATU0
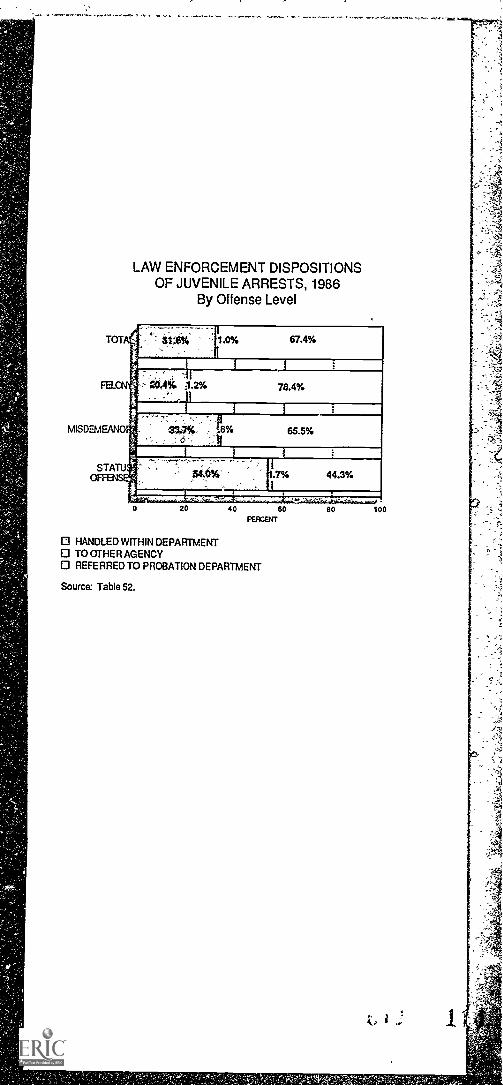
LAW ENFORCEMENT DISPOSITIONSOF JUVENILE ARRESTS, 1986
By Offense Level
. .
34% : 1.0% 67.4%
I I4,4.
_I
1.2% 78.4%41-1-1-1-65.5%
.I
1.7% 44.3%I
20 40 60FEACENT
O HANDLED WITHIN DEPARTMENTO TO OTHER AGENCYO REFERRED TO PROBATION DEPARTMENT
Source: Table 52.
80 100
r.'" "5-
PROBATION DEPARTMENT DISPOSITIONSOF NEW REFERRALS, 1981-1986
Type of Disposition by Year
60
45
30
65
0
1981 1982 1983 1984 1985YEAR
Source: Table 53.
1986
PROBATION DEPARTMENT DISPOSITIONSOF NEW REFERRALS, 1986
By Type of Disposition
Source: Table 53.
1 5
JUVENILE COURT DISPOSITIONSOF NEW PETITIONS, 1981-1986
Type of Disposition by Year
Fowl. PkoakrioN
DISMiSSED.-TRANSFERRED,REMANDED TO ADULT COURT
NON-WARDPROBATIONvtakio ********
0
1981
Source: Table 54.
1985 1986YEAR
TOT
JUVENILE COURT DISPOSITIONSOF NEW PETITIONS, 1986
Offense Level by Type of Disposition
MISDEMEANO
STATU
20 40 60
PEC811"
80 100
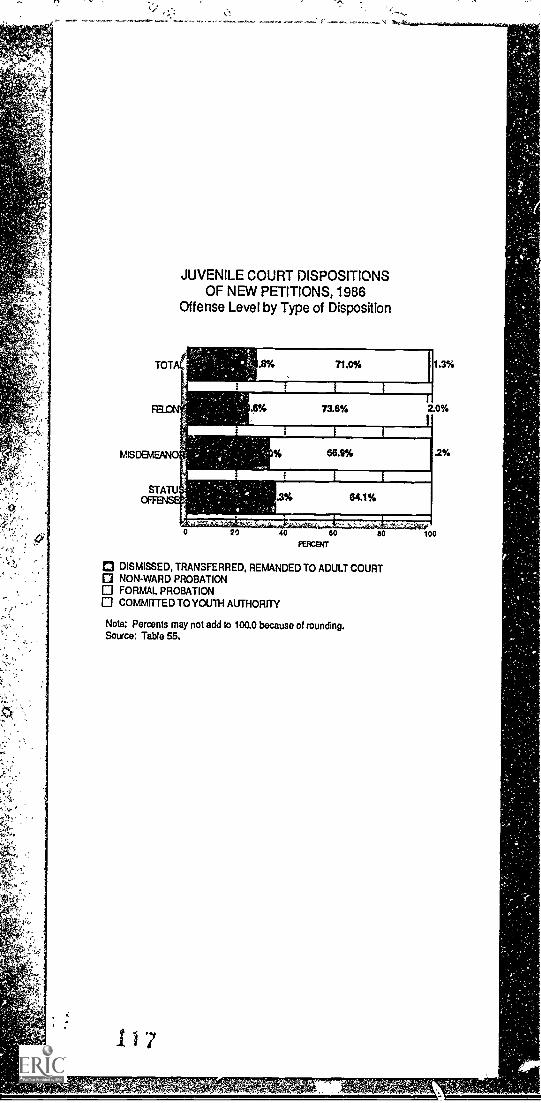
O DISMISSED, TRANSFERRED, REMANDED TO ADULT COURTO NON-WARD PROBATION
FORMAL PROBATIONCOMMITTED TO YOUTH AUTHORITY
Note: Percents may not add to 100.0 because of rounding.Source: Table 55.
r.,
1 l 7

arttifeht-101)01006S',of
a arra sinOntiaSk
Th ateierVaiibaOuent-niferrarinlanttriat1hajOatitIviy,4,Oti prObatiOn9r,
aroletat thOini01-rareitaito
kitto1888:
PROBATION DEPARTMENT DISPOSITIONS3F SUBSEQUENT REFERRALS, 1981-1986
Type of Disposition by Year 54 Counties
=MI miMt =Ns
,VETraii:-1LED
aim ag m°121
SIM\
INFORMALPROEINTION
1931
Source: Table 56.
1982 1933YEAR
1985
PROBATION DEPARTMENT DISPOSITIONSCF SUBSEQUENT REFERRALS, :.;86
By Type of Disposition 54 Counties
Source: Table 56.
1986
'PrOoOtoitoftatOoic4Oclolei),qtte0'04tcroPii.ctiioit 1?4:0-0,4,40'y
pardant..
,The. PIP ,blid MO'*aged slightly,fibt01,8:010 78.5
,peroent.
"10,30f9iPia;':
a beprdprifortoftasestilPsfi.dor= sierrecl increased Sligpttyt korn
2:0i22:8pertmnt.
IonotcaSesPprobation increa
y;InJrn .8-to :9,perce
00 oneT,
ProP)o nionofpatiliOns fl6z1y
44E°
-deeleasatItrorn78.7p '78.5.percOnt.,
In 1988, of 28;871probation cieparit9.6TA
sitions otsithsequentrelprrals:-
CiotacIOrtrangerieciaoc*nteel fbr8,068 (224 Percent),.-
Iiiton41 prObatIO'naccountectiOr254-aPe16041)6,
Pattioni filed(784 percenYi.

JUVENILE COURT DISPOSITIONSOF SUBSEQUENT PETITIONS, 1981-1986Type of Disposition by Year - 54 Counties
NON-WARDPROBATION
CON TOYOUTH
AUTHORITY
DISMISSED,TRANSFERRED,REMANDS) TO
ADULT COURT
1981 1982 1983 1984 1985 1986
Source: Table 57.
JUVENILE COURT DISPOSITIONSOF SUBSEQUENT PETITIONS, 1986
Offense Level by Type of Disposition 54 Counties
20 40 60
paCENT
80
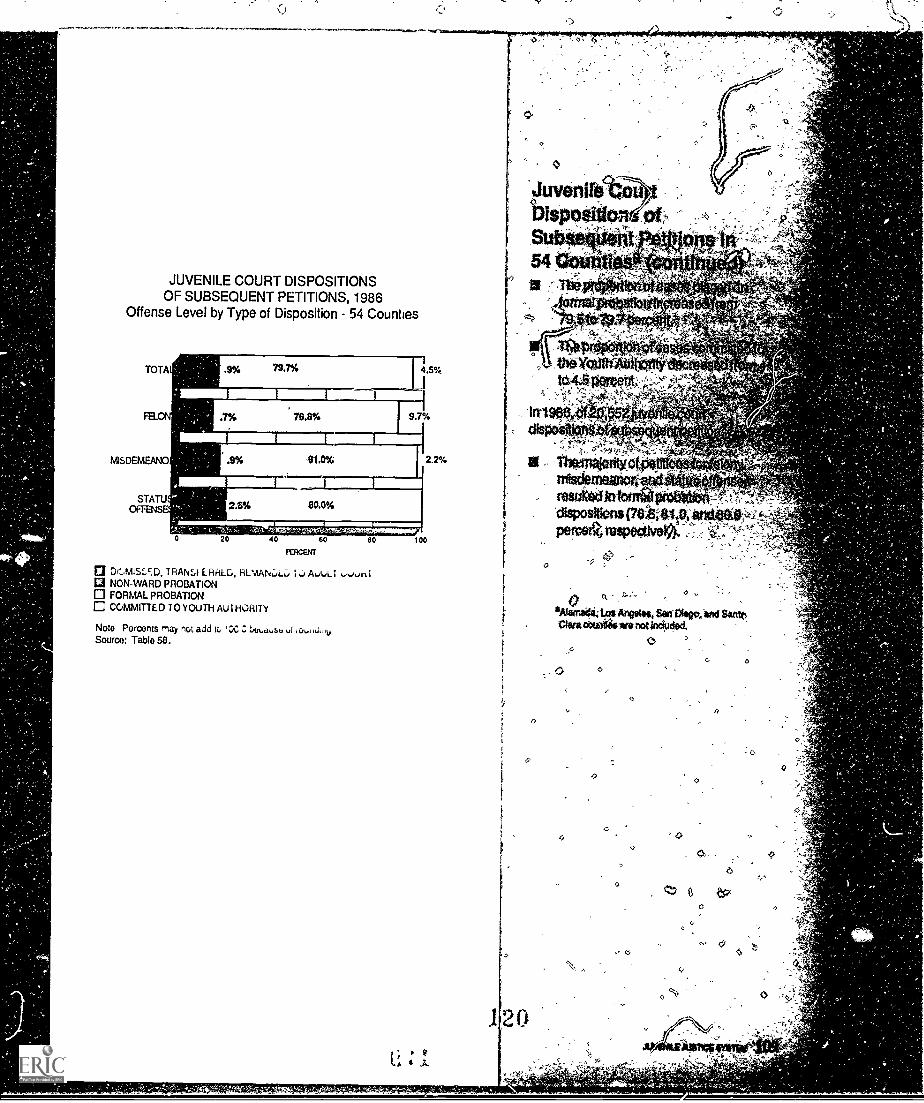
THANLF FILMANZ)LL 14-.) A4A.,L1 wuhi13 NON-WARD PROBATION
FORMAL PROBATIONCOMMITTED TO YOUTH AUTHORITY
Note Percents may not add to '3C uduSb ,1Source: Table 58.
100
Lot ArolOos, SOJI Diego, tad Senttsooth4itsisa not lociod.O.
0 O
)
0
Q
L A 6 A

14 0
JUVENILE PROBATION CASELOAD, 1981-1986Type of Probation by Year
100
80
60
40
20
0
1981 1982 1983 1984 1915 1986YEAR
Sourco: Tablo 59.
121.

JUVENILE PROBATION CASELOAD, 1986By Type of Probation
Source: Tan) 59.
ao
g'"'0
) cOuvinile Probation ,Caseload (continued)
0
Prom '1988 to 1986:4c,
00
O
Th4 proportion of Informal probcaseplerfrreased from 1024o1wrest*.
_ r
cases87:50ercent.
Of 61,644juventles on probation or!Decenter31, 1986:
Informal p ton accourOxl6,332 (104 percent)
O
I Non-war probationAcou nted for1,376(a percent).
0
it Formal probation accounted tor53,936 (67.5 percrt).
II
9 0
O 0
o ANP40.1aainc4frionat
,
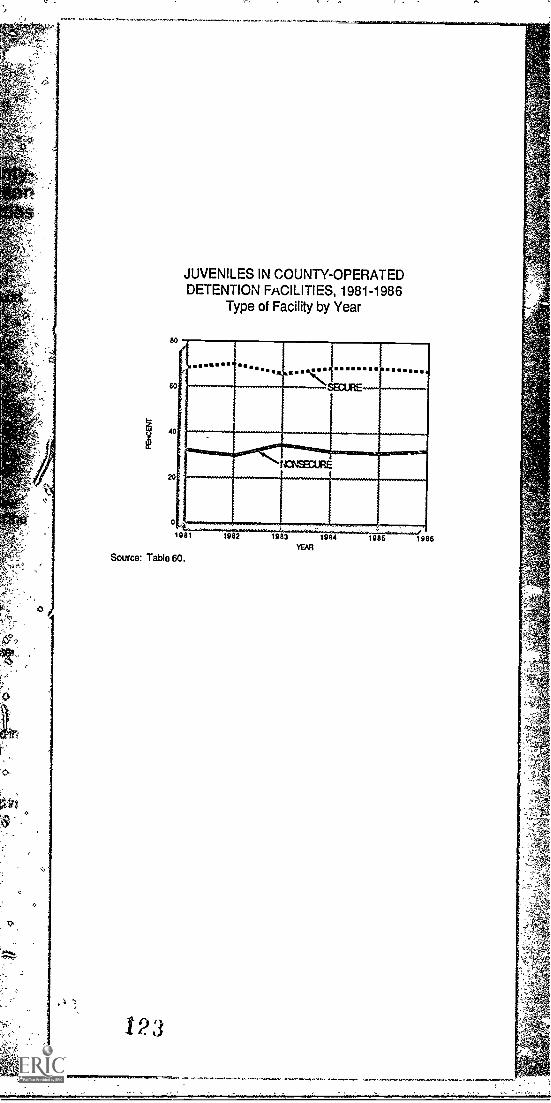
JUVENILES IN COUNTY-OPERATEDDETENTION FACILITIES, 1981-1986
Type of Facility by Year
°°"°"o" °°°""°° 0000000000
111111.1111IMECURE
MN
Source: Table 60.
If
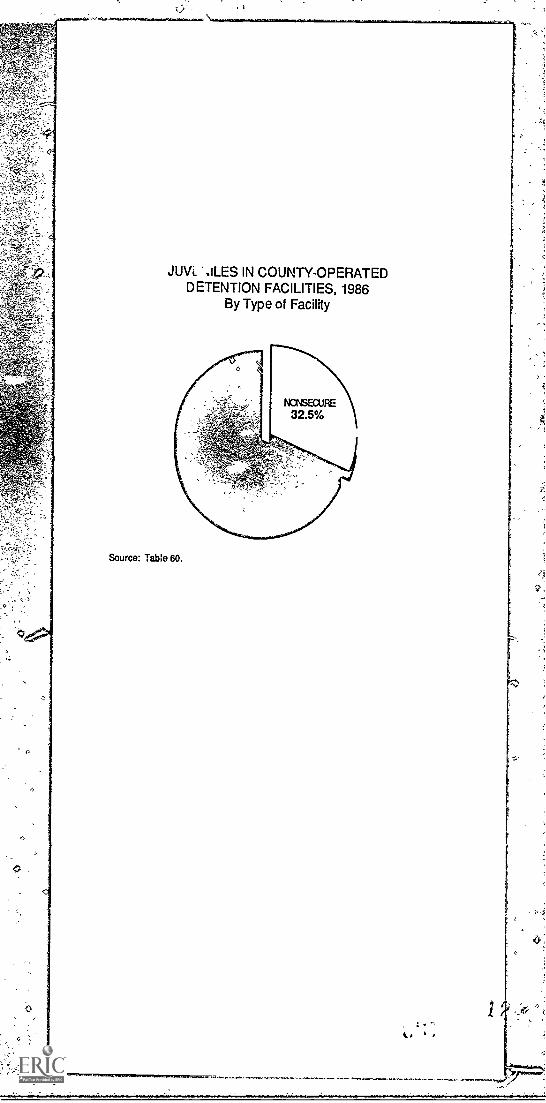
JUVL .ILES IN COUNTY-OPERATEDDETENTION FACILITIES, 1986
By Type of Facility
NCNSECURE
32.5%
Source: Table 60.
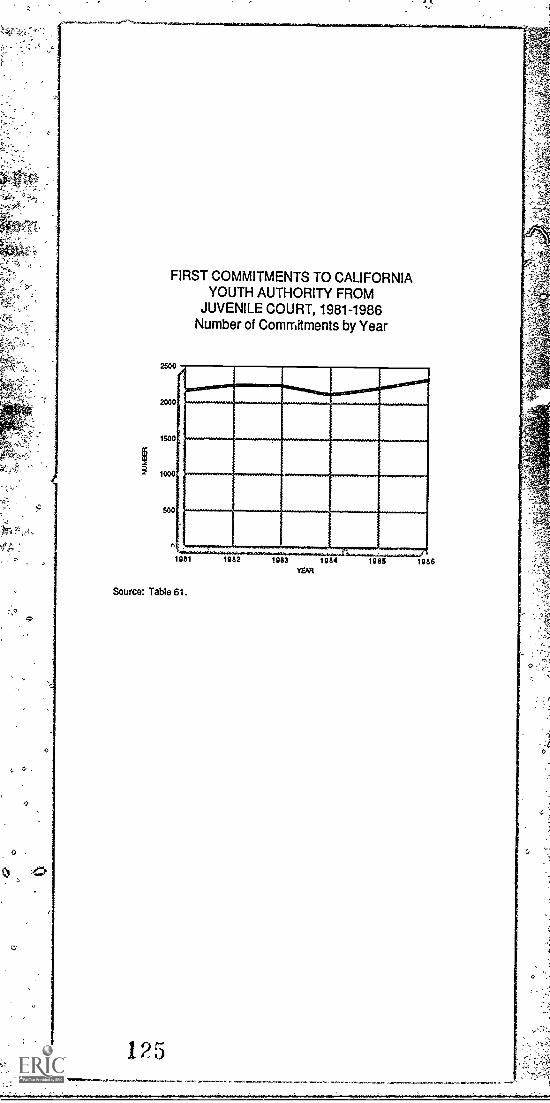
FIRST COMMITMENTS TO CALIFORNIAYOUTH AUTHORITY FROM
JUVENILE COURT, 1981-1986Number of Commitments by Year
2500
2000
1500
1000
A
1981
Source: Table 61.
125
1982 1983 1984YEAR
1985 1986
a.
C'ZIE&CD.140triV(.1=
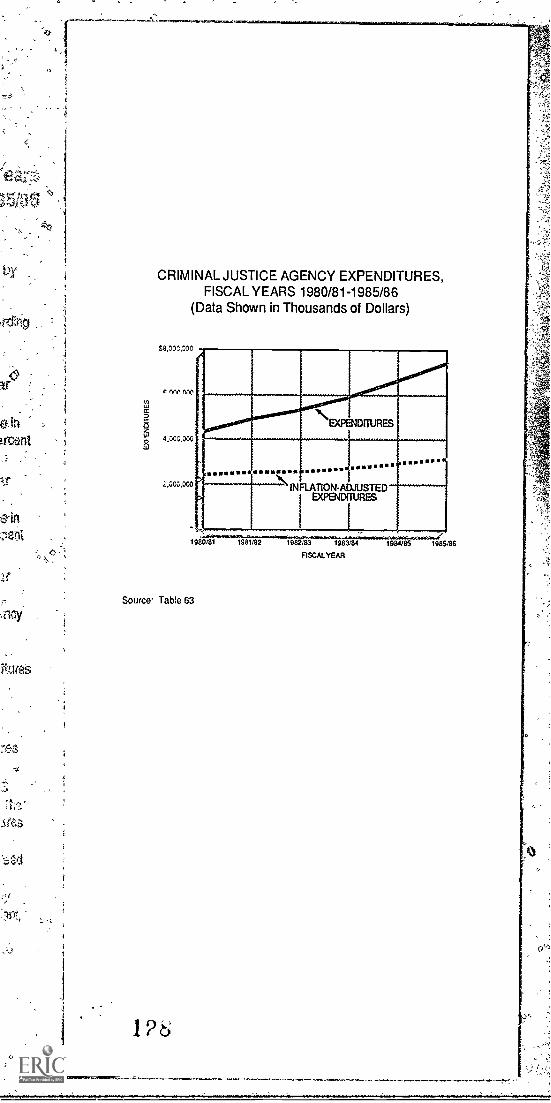
Expenditure. and. personnel data are collected by thsBureau.ofCriminal Statistics and grouped into the following criminal justide
agencfcategOries: law enforcement,,prosecutiOn, publicdefense, courts, and corrections.
Criminal justice agency expenditures are fiscal. ear dataobtained from the Governors Budget and publications by the
State Controllers Office. These data.inclucie vlaries andemployee benefits, seryicee,,and supplies. They do not include
monies derivedfrom federal and state grants or expendedfor building construction;
,c 3
56
CRIMINAL JUSTICE AGENCY EXPENDITURES,FISCAL YEARS 1980/81-1985/86
(Data Shown in Thousands of Dollars)
$8.00C,000
IIIIIIIP!E\OTENDITURES
...........................CINFLA'TION-ADJUSTEDEXPENDTIURF_S 111
Source. Tab!e 63
1983/84 1984185
FISCAL YEAR
1985/86

CRIMINAL JUSTICE AGENCY EXPENDITURES,FISCAL YEAR 1985/86
By Type of Agency
COURTS ANDCOURT-RELATED
10.1%
Source: Table 64.
Q
4r- 7
irt
cJ
r'

a 40
CRIMINAL JUSTICE AGENCY AUTHORIZEDFULL-TIME PERSONNEL, 1981-1986
125,000
100 000
75 000
50,000
?Apo()
1081
Source: Table 65.
1 3 0
1982 1983 1984
YEAR
1985 1086

CRIMINAL JUSTICE AGENCY AUTHORIZEDFULL-TIME PERSONNEL, 1986
By Type of Agency
Source: Table 66.
131
0
j
0, 0
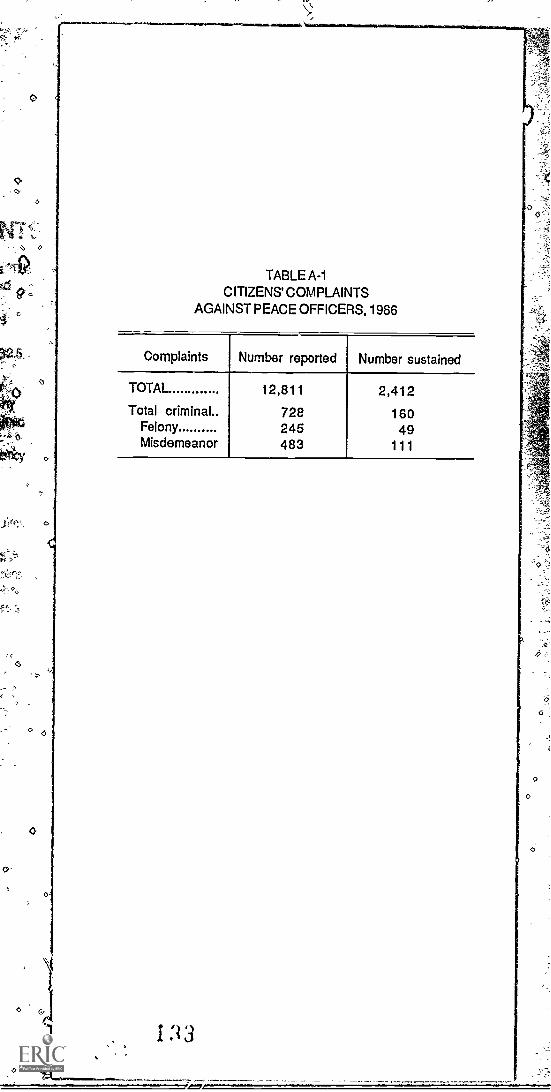
TABLE A-1
CITIZENS' COMPLAINTSAGAINST PEACE OFFICERS, 1966
Complaints Number reported Number sustained
TOTAL 12,811 2,412Total criminal 728 160
Felony 245 49Misdemeanor 483 111
1.1 3
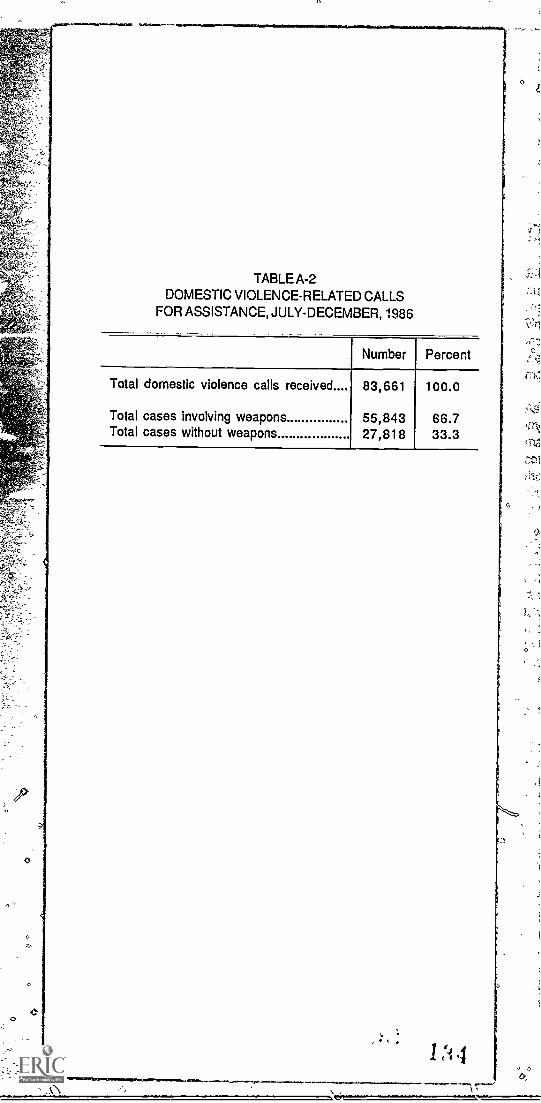
TABLE A-2DOMESTIC VIOLENCE-RELATED CALLS
FOR ASSISTANCE, JULY-DECEMBER, 1986
Number Percent
Total domestic violence calls received 83,661 100.0
Total cases involving weapons 55,843 66.7Total cases without weapons 27,818 33.3

=
KNOWN DATA LIMITATIONS
CRIMES
CI Mammoth Lakes began reporting in July 1986.
U Orinda began renorting in July 1986.
ARRESTSArrest and Citation Register
U Homicide arrests from 1981 to 1985 are inflated to somedegree. Assault with intent to commit murder is included insome cases because of a 1981 law that repealed Penal CodeSection 217.
Morgan Hiil did not report data for November and December1986.
U Mammoth Lakes began reporting in July 1986.
Orinda began reporting in July 1986.
U The analysis of race/ethnic data must be considered itlight of the subjectivity of the labeling process and recclassifications changes, such as those of the U.S. Bureauof the Census (1980).
Felony arrest counts may include some misdemeanorwarrants for felony offenses.
U Agency reporting problems account for almost all of theincrease recorded in 1983 other drug law violations.
ADULT FELONY ARREST DISPOSITIONSOffender-Based Transactl'n Statistics System
Et This file contains over 94 percent of all documentswhich were available for processing when the annualstatistical file was created on April 25,1987.
gl Caution should be used when comparing adult felony arrestdisposition data with reported arrest data. Disposition dataare based on the year of final disposition, regardless of whenthe felony arrest occurred. Arrest data are based upon theyear in which the arrest took place.
CI For multiple arrest offenses, OBTS selects only the mostserious Mime, based on the severity of possible punish-ment. For multiple court dispositions, OBTS selects the mostserious court disposition and the associated offense.
BCS disposition data on state institutional commitments arecounted differently from those of other state agencies. Forexample, the Department of Corrections counts th numberof defendants received, even though a defendant may havereceived a commitment from two or more jurisdictions. In thesame situation, BCS counts each commitment as a separatedisposition.
CI From 1985 to 1986, assault offenses Increased 41.1 percent.A significant portion of the increase can be attributed to the'Domestic Violerice" program, implemented January 1, 1986.This program required law enforcement officers to activelyintervene in complaints of violence between spouses orsexual partners. Most of the increase in assault offenses wasadjudicated in lower court.
126 CRIMEA, VtiOUENCY,12203
U The adult felony arrest disposition data base includes 232persons whose age at disposition was under 18. Theseminors were tried in adult court by provision of the Weitareand Institutions Code.
ADULT CORRECTIONSCharacteristics and Data Limitations
EI The data include adults placed on supervised probation only.
13 Persons are counted once for each jurisdictik.m. Th.., datainclude original grants of probation and do not includesubsequent grants of probation to persons already underprobation supervision ordered by the same level court in thesame county. Also, the probationers under jurisdiction of bothsuperior and lower courts and any who are jurisdictionalcases of more .han one county are counted more than onetime in statewide totals.
I:I The sources of data are county probation de:_artments'monthly reports of summary data.
JUVENILE JUSTICE SYSTEMCharacteristics and flata Limitations
O While 1982 through 1986 juvenile justice system data areshown as reported, 1981 data contain estimated totals forLos Angeles County. Because of variability in reporting bythat county's Probation Department, some underreportingoccurred prior to 1982. By agreement with that agency,estimates were developed that more fully represented thenumber of new referrals and new petitions handled by thedepartment. These annual estimates for Los Angeles Countywere added to data for the other 57 counties to producestatewide figures.
In cases where a juvenile has multiple petitions filed morethan one offense, only the petition with the most seriousoffense is recorded. This accounts for the differencesbetween BCS counts and the statistics generated by 1' eAdministrative Cdice of the Courts, which counts Ind numberof petitions processed.
13 From 1;31 through 1984, the new juvenile justice reportingsystem included 54 counties. Alameda, Los Angeles, SanDiego, and Santa Clara counties reported in the old format.In 1985, Alameda County began reporting in the new format.
In In 1986, BCS developed a new one-day survey form tocollect juvenile probation caseload counts. Prior to 1986,these data were developed programmatically fromtransactions reported by probation departments.
1:1 By agreement with the agency, type of probation forprobation caseload was estimated for Fresno County.
CITIZENS' COMPLAINTSAGAINST PEACE OFFICERS
U San Francisco Police Department reports their data inrougnthe an Francisco Poke Commissions Office of CitizensComplaints. This agency is unable to provide citizenscomplaint data by type of complaint.
tall

CRIMINAL JUSTICE GLOSSARY
ABSCOND: to leave the Judahl jurisdiction without consent.
ACQUITTAL: a judg mont of a court, based e'ller on the verdictof a jury or a judicial officer, that the defendant is vot guilty ofthe offense(s) for which he was tried.
ADJUDICATION. the formal giving or pronoun...nig of ajudgment or decree in a cause.
ADULT:a person 18 years of age or older.
AFFIDAVIT: a written summary of charges against a juvenilepresented by tho probation department to the prosecutor with arequest that a petition be filed.
APPEAL: a petition initiated by a defendant for a rot oaring in anappellate court of a previous sentence or motion.
ARREST: "... taking a person into custody, in a case and in themanner authonzed by law. An arrest may be made by a peaceofficer or by a private person: (P.C. 834)
ARREST RATE: the number of arrests per 100,000 population.See page 68 fora further explanation.
CAUFORNIA DEPARTMENT OF CORRECTIONS (CDC): thestate agency which has junsidiction over the California
Rehabilitation Center and the California pnson system.
CALIFORNIA REHABIUTATION CENTER I'CRC): aninstitution operated by the California Department of Correctionswhich is designated for the treatment of persons addicted to
narcotics or in imminent clangor of addiction. Commitment to thefacility is by civil procedure only.
CAUFORNIA YOUTH AUTHORITY (CYA): the state agencywhich has jurisc.,_ on over and maintains Institutions as
correctional schools for the reception of wards of the Juvenilecourt and other persons committed from justice, municipal, andsuperior courts.
CAMPS, RANCHES, HOMES, AND SCHOOLS : county -leveljuvenile correctional facilities for post-court treatment of
juvenile offenders. These facilities are maintained by countyprobation departments.
CASELOAD: the total number of clients or cases on probation orunder supervision with a given agency at a specified point intime.
CHARGE: a formal allegadon that a specific person hascommitted a specific offense.
CITATION: a written order, Issued by the police fora violation,to appear before a magistrate or probation officer at a laterdate.
CIVIL COMMITMENT: a typo of commitment in which criminalproceedings are suspended white a defendant undergoestreatment at the California Rehabilitation Center (CRC) as anarcotic addict.
CLEARANCE: an offense is cleared or "snlyncr for camereporting purposes when at least one person is arrested, charged
with the commission of the offense, and turned over to the courtfor prosecution or cited to juvenile authorities. In certain
situations a clearance may be counted by 'exceptional" moans
whet' the police definitely know the Identity of the offender, haveenough information to support an arrest, and know the location oftho offender but for some reason cannot take the offender intocustody.
CLEARANCE RATE: method used to determine the percentageof crimes cleared. The rate is based on the number of crimesreported.
CLOSED AT INTAKE:a case closed by the probationdepartment at the time the juvenile Is retorted to the
department, following an investigation of the juvenile'scircumstances and n To of the alleged offense. No furtheraction Is taken.
COMMITMENT: a warrant, order, or process by which the
court directs a judicial officer to take a person to a correctionalfacility.
COMPLAINT. a verified written accusation, filed by aprosecuting attorney with a local criminal court, which chargesone or more persons with the commission of one or moreoffenses.
CrINTROLLED SUBSTANC E: a drug, substance, or immediateprectnor which is included In Set modules I through V inclusive, assot forth In Health and Safety Coda Sections 11054 through
11058. These would include heroin, marijuana, amphetamines,barbiturates, yid psychedelics.
CONVICTION: ajulgment, based either on the verdict of a juryor a judicial officer °vie the guilty plea of the defendant, thatthe defendant Is guilty.
CORRECTIONS: tizsa agencies or facilities concemea with thecustody, confinement, supervision, or treatrnont of alleged oradjudicated offenders. Soo also, California Department ofCorrections.
COURT: an agency of the judicial branch of government,
authorized or ostablished by tiatite or constitution, having oneor more judk.ial officers on Its staff. A Man haS tho t.uthorityto decide upon controversies in law and disputed matters of factbrought before it
CRC: see CaMornia Rehabilitation Center.
CRIME: an act committed or omitted In violation of a lawforbidding or corianancfrig (P.C. 15)
CRIME RATE: the number of crimes per 100,000 generalpopulation.
APPoopc 127

CRIMINAL COMMITMENT: a type of commitment whichresults when a defendant is sentenced to prison or the 1.talifomiaYouth Authority.
CYA: see California YouthAtithority.
DEFENDANT: a person againstwhom acriminal proceeding is_pending.
:DELINQUENT ACTS: these acts described under WelfareandInstitutions Code Section 602 which involve violations by ajuvenile of any law or ordinande defining crime, or the virfationof a court orderof the juvenile, court
DETERMINATE SENTENCING: sentencing whicht by law,requires imposition bra term of imprisonment proportionate tothe seriousness of the crime, with sentences uniform for likecrimes.
DISMISSAL: a decision by a judicial 'after to terminatea casewithout a determinatiOn of guilt or innocence.
'DISPOSITION.- COURT: an station taken as the result of anappearance in court bya defenciantExampteswould be:adults -dismissed, acquitted; or convicted and sentenced; juveniles -dismissed, transferred; remanded to adUlt court, placed anprobation, or sentenced to the "California Youth Authority.
DISPOSITION -LAW - ENFORCEMENT: an action taken as theresult of an anast,Examples of police dispositions are: adults-released by law enfornerhent, referred to another juriscfictien,or a misdemeanor or felony complaint sought; juVenites - handledwithin the departnient, referred to another agendy, orto the probation department or juvenile court.
DISPOSITION =PROSECUTOR: an action taken as the result'of complaints which were requested by the arresting agency.Dispositions include granting'a Misdemeanor or,a felonycomplaint, or denying a complaint for such reasons as lack ofcorpus, lack of probable cause, interest of justice, victim
declines to prosecute,-witness unavailable, illegal search andseizure, combined with other courts, etc,
DRUGS: see Controlled Substance.
EMANCIPATED MINOR: a person under 18 years-of age whohas been released from parental control and supervision byeither, a) a valid marriage, b) active duty,with the mined forcesof the United State a, or c) a declaration of emanctpation (seeCivil Code Sections 62 arid 64).
FEL,1NY: `... a crime which is punishable with death or byimprisonment in the state prison.. ." (P.O. 17)
FLUNG: a docuMent filed With the municipal court Clerk orcounty clerk by.a prosecuting attorney alleging that a personcommitted or attempted to thew ita crime.
FINE: the penalty imposed upon a convicted person by a courtrequiring that he pay a specified sum of money.
GRANT: the act of placing an adult on probatiOn.
GUILTY PLEA: a defendant's forma, answer in open court tothe charge(s) in a complaint, indictment, or information, statingthat the charge(s) is true and that he has committed theoffense(s) ascharged.
INFRACTION: an offense punishable by fine or other penalty,but not by incarceration.
INITIAL PETITION: see New Petition.
INITIAL REFERRAL: see New Referral.
INTAKE DETERMINATION: the probation departmentdisposition of a new referral; these are usually "closedortransferred," informal probation,' or "petition filed."
JAIL: a county or city facility for incarceratian of sentencedand unsentencedperSons.
JURISDICTION: the territory, subject matter, or person uveiwhich lawful authority May be exercised.
JUVENILE: a person underthe age of 18.
JUVENILE GNOURT:, the court responsible for adjudicatingjuvenile offenders.
JUVENILE HALL: a county-operated facility:a-nd for
temporary detention of juvenile offenders randing their courtappearance, and in some instances, for short-term (up to 180days) poSt-adjuOcation rehabilitative purposes.
LAW VIOLATIOLS: in the juvenile system, those actsdescribed under Welfare and Institutions Code Section 602 whichinvolve violations by a juvenile of any law or ordinance definedas a crime.
LOCAL SUPERVISION: local correctional agencies provideconfinement, rehabilitation, and probation services for thosesentenced to their care and also house persons awaiting mar orsentencing.
LOWER COURT: municipal or justice court.
MANDATORY SENTENCING: sentencing mandated by lawwhich limits judicial discretion for specific convicted offenders.
MISDEMEANOR: a crime punishable by imprisonment in acounty jail, by a fine, or by boll:. tinder certain conditionsdefined by Section 17 of the Penal Code, a felony crime can betreated as a misdemeanor.
MONTHLY ARREST AND CITATION REGISTER; a reportingsystem ..sed to Collect information on adult and juvenilearrests.The Arrest Register reports details which identify as a, sex, andrace/ethnic characteristics of offenders and creates a luck tosubSequent court activity.
MUNICIPAL OR JUSTICE COURT: the court of original ortrial jurisdiction for the prosecution of persons accused of
Misdenieanor or certain felony offenses. Also, municipal andjustice courts conduct preliminary hearings to determineprobable cause in the case of felony offenders who are subject tojurisdiction of superior courts -the felony trial court.
128 DELINOPEN9Y0g66'
137

NEW PETITION:. a petition filed in juvenile court fora minor,Who:is currently not under active probation supervision or onparole from CYA, alleging that the minor has committed adelinquent act: ,
'NEW REFERRALra juvenile who is not actively beingsupervised or on OVA parole brought to the attention of the
probation department foialleged behavior under Welfare andInstitutions Code Sections 601 or 602.
NONSECURE FACILITY: shelter care, aisis resolution home,or Counseling ,andflUaitional centers.
OFFENDER=BASEGTRANSACTION STATISTICS (OBTS):a-SyStem ao sighed to collect statistical information on the
vadousproceaset within the criminal justice system that occurbetween the point of ernes:rand the point of final disposition.
,OFFOSE:lhe charged offense is the offense for which thedefendant was, arrested Or filed on by the district attorney. The
convicted offehss is the offense the defendant was convicted of
or pled'guilty to.in court.The sustained offense is the offense forwhich the juvenile court sustains a petition.
OUTPATIENT: a parson receiving treatment or care at theCalifcmia Rehabilitation Center (CRC) while no longer an inmateof the facility.
PAROLE: an added period of control following completion of thedeterminate prison sentence (P.C. 3000(a)).
PETITION: the fend presentation to the juvenile court ofinformation surrounding the alleged offense by a juvenile, similarto *Criminal complaint for an adult.
POPULATION AtRISK: that portion of the total copulation,who because of like characteriitics to the specific study group,are considered "at-risk." For example, when studying juvenile
arrestees,-all persons between 10 and 17 years of age would bethe 'at-dsk" population.
PRISON: a state correctional facility where persons areconfined follOwinj Conviction-of a felony offense.
PROBATION: alucficial requirethent that a person fulfill certain'conditions of behavior in lieu of a sentence to confinement butsometimes including a jail sentence.
'PROBATION WITH JAIL:a type of disposition rendered uponconviction which imposes afail term as a condition of probationstatus.
;PROBATION - FORMAL: a probation grant in which the minoris declared a Ward of the juvenile court and placed on formal
probation.
PROBATION - INFORMAL: supervision of a minor in lieu offifinga petition, fora period not to exceed six months. Thesupervision is based on a contractual agreement between theprobation officer and the minor's parents or guardian providedfa under Welfare and Institutions Code Section 654.
4
PROBATION - NON -WARD: a probation grant withoutwardship from juvenile court for a specific time not to ext.t..so
six months as described under Welfare and institutionsSection 725a.
PROSECUTOR: an attorney employed by a governmental ayeiwhose official duty is to initiate and maintain criminai
proceedings on behalf of the govemment against a person aL.cuscuof committing criminal offenses.
PUNISHMENT: a minimum sentence for a felony conviction issix months in state prison, maximum is death. Misdemeanor
convictions are punishable by imprisonment in the county jail toione day to one year, or by a fine, or both.
RATE: the ratio of the number of one specific group to thepopulation.
REFERRAL: in juvenile proceedings, a request (byparents, School, etc.), that the probation department or juvenile
court take appropriate action concerning a juvenile alleyeki
have committed a law violation or status offense.
REMAND TO ADULT COURT: a juvenile at least 16 years ofage is referred to adult court wider provisions of Welfare aria
Institutions Code Section 707 because he is not "amenable to metreatment available through the juvenile court.
REMOVAL: a case removed from the active caseloadand no longer under the supervision of the probation department,
or a case not removed but escalated to a more advanced level ofsupervision.
REREFERRAL: see Subsequent Referral.
REVOCATION: cancellation or suspension of paro,e ofprobation.
REVOKE: withdraw, repeal, or cancel probation or parole for anadult.
SARB (SCHOOL ATTENDANCE REVIEW BOARD).system board which provides a review process outside of andprior to the probation department referral system for juveniles
SECONDARY GRANT: a subsequent grant of probation in tilt,same court for an adult still on probation for the initial g rant.
That is, a probation sentence following conviction in a given
court on a subsequent offense when the sentence in the samecourt for the first offense was also probation.
SECURE-FACIUTY: a facility in which a juvenile is nerd oeninoa locked door, gate or fence, or in which some person is
responsible for physically preventing the juvenile's escape ordeparture from the facility.
SENTENCE: the penalty imposed by a court upon a convictedperson,

STATE INSTITUTION: a facility for housing defendants thatare under the jurisdiction of the state correctional ortreatment programs.
STATE SUPERVISION: the state correctional systemprovides confinement, rehabilitation, and parole services(prison, YA, state hospital) through California Department of
Corrections (CDC), California Youth Authority (C/A),Califomia Rehabilitation Center (CRC) and CaliforniaDepartment of Mental Health (CDMH).
STATUS OFFENDER: a juvenile who has been adjudicatedbya juicial officer of a juvenile court, as having committed a
status offense, which is an act or conduct which is an offenseonly when committed or engaged in by a juvenile.
STATUS OFFENSE: an act or conduct, described by Welfare
and Institutions Code Section 601, which is declared by statuteto be an offense, but only when committed or engaged in by ajuvenile, and which can be adjudicated only by a juvenile court.
STRAIGHT PROBATION: probation granted to adults with nocondition or stipulation that tho defendant serve time in jail asa condition of probation.
SUBSEQUENT DISPOSITION: a judicial decision or sentencegiven at the time of a court return.
SUBSEQUENT GRANT: see Secondary Grant.
SUBSEQUENT PETITION: a petition filed on behalf of ajuvenile who is already under the junsdiction of the juvenilecourt.
SUBSEQUENT REFERRAL: a juvenile who is actively underprobation supervision or on parole at the time of referralto aprobation department.
SUMMARY SYSTEM: a data collection method based on grosscounts as differentiated from one based on an individual incidentoount.
SUPERIOR COURT: the court of original or trial jurisdictionfor felony cases and all juvenile hearings. Also, the first courtof appeal for municipal or justice courtcases.
130 CRIME& DELNQUENCY.14e8
SUSTAINED: to affirm or approve, as when an appellate courtsustains the decision of a lower court.
SWORN PERSONNEL: a full-time employee of a lawenforcement agency who has sworn to carry out lawenforcement duties and has full arrest powers.
TERMINATED: completed specified term of probation.
TRANSFER: a disposition which transfers a juvenile toanother agency within the county such as a welfare
department, a health department, a legal aid society, etc. orreferral to any agency outside the county including theprobation departments of other counties.
TRIAL: a determination of guilt or innocence by a judge, jury,or by the court on the basis of testimony contained in a
transcript. There are three types of trials:
COURT: the decision is rendered by the judge.
JURY: the decision is rendered by a panel of thedefendant's peers.
TRANSCRIPT: the decision is rendereo by the court ona basis of the testimony contained in the transcript of thepreliminary hearing held in lower court.
UNIFORM CRIME REPORTS (UCR): a federal reportingsystem which provides data on crime based on police statistics
submitted by law enforcement agencies in the nation. TheBureau of Criminal Statistics administers and forwards thedata for California to the federal program.
VIOLATION: breach or infringement of the terms or conditionsof probation.
WARDS: a minor determined by the juvenile court to be inneed of court ordered supervision due to the youth's behaviorand or actions.
YA - YOUTH AUTHORITY: see California Youth Authonty.
139

OFFENSEDEFINITIONS OF CRIMESREPORTED
FBI-CRIME INDEX.OFFENSES:"... sevenoffenses were chosen to serve as an Index forgauging fluctuations in the overall, volume and rateof Crime. Known jointly as the Crime Index, theseoffenses includei'The violent crimes of murder andnonnegligent manslaughter, forcible rape, robbery,aggravated assault and the property crimes ofburglary, larceny-theft, and motor vehicle theft. -
By congressional mandate, arson was added as theeighth Index offense in 1979." These offenses werechosen on the basis of their seriousness, frequencyof occurrence, pervasiveness in all geographic areasof the Country, and likelihood of being reported tolaw enforcement. (This definition was taken from"Crime in the United States, 1985.")
LARCENY-THEFT: the unlawful taking, carrying,leading, or riding away of property from the
possession or constructive possession of another(except embezzlement, fraud, forgery, andworthless checks).
ARSON: any willful or malicious burning orattempt to bum, with or withoilt intent to defraud, adwelling house, public building, motor vehicle oraircraft, personal property of another, etc.
NONAGGRAVATED (SIMPLE) ASSAULT:assaults and attempted assaults where no weaponwas used and which did not result in serious oraggravated injury to the victim.
CALIFORNIA CRIME INDEX: offenses most likelyto be reported to the police by the public. Theseoffenses are willful homicide, forcible rape,
robbery, aggravated assault, burglary, and motorvehicle theft, and are reported according todefinitions taken from the FBI Uniform CrimeReporting Handbook.
Violent Crimes
Willful Homicide the willful(nonnegligent) killing of one human being byanother. Murder and nonnegligent manslaughterare included.
Forcible Rape --the carnal knowledge of afemale forcibly and against her will. Assaultsor attempts to commit rape by force or threatof force are included.
Robbery the taking or attempting to takeanything of value from the care, custody, orcontrol of a pc .ion or persons by force orthreat of force or violence and/or by puttingthe victim in fear.
Aggravated Assault an unlawful attack byone person upon another for the purpose ofinflicting severe or aggravated bodily injury.This type of assault is usually accompanied bythe use of a weapon or by means likely toproduce death or great bodily harm.
Property Crimes
Burglary the unlawful entry of a structureto commit a felony or a theft. Attemptedforcible entry is included.
Motor Vehicle Theft the theft orattempted theft of a motor vehicle.
1 4 0 APPENDIX 131

FELONY-LEVEL ARREST OFFENSESa
Homicide - 128, 187, 187(a), 189, 192 (except vehicularmanslaughter), 192(a), 192(b), 193(a), 193(b), 399
Forcible Raps- 220/261, 220/264.1, 261, 261(1),261(2), 261(3), 261(4), 261(5), 261(6), 261(7), 202,262(a), 264.1, 266c, 664/261
Robbery - 211, 211a, 213, 213.5, 214, 664/211
Assault - 69, 71, 76, 76.1, 148.1, 148.1(a), 148.1(b),148 1(c), 148.1(d), 148.3(b).148.4(b), 149, 151(a)(2), 203,204, 217.1(a), 217.1(b), 218, 219, 219.1 219.2, 220/203,222, 241.1, ?041 .4, 2420, 242/2430, 2430, 243(c), 243(d),243.1, 243.30, 243.50, 244, 244.5(c), 245(a)(1), 245(a)(2),245(b), 245(c), 245.2, 245.3, 245, 247, 273a(1), 273d,273.5,273.5(a), 347,368(a), 375(a)0, 375(d), 401, 405a,405b, 417(b), 417.1, 417.6, 417.6(a), 417.8, 422, 422(a),422(b) 422(c), 422(d), 588ab, 625c, 664/187, 664/189,4131.5,4500,4501,4501.5, 11413(a), 12301, 12303,12303.1, 12303.1(a), 12303.1(b), 12303.1(c), 12303.2,12303.3, 12303.6, 12304b, 12305, 12308, 12309,12310(a), 12310(b), 12312, 12355(a), 12355(b), 21464(c)VC, 23110(b) VC, 38318(b) VC, 38318.5(b) VC
Kidnapping -157, 207, 207(a), 207(b), 208, 209(a),209(b), 210, 277, 278, 278.5, 278.5(a), 278.5(b), 278.5(c),280(b), 4503
Burglary - 459, 460, 460.1, 460.2, 461, 461.1, 461.2,464, 664/459, 664/459(1), 664/459(2), 664/460,664/460(1), 664/460(2)
Theft - 72, 115(a), 116, 117,134,150, 155b, .156, 182.4,304 HN, 305 HN, 3320, 334(a)b, 337.7, 368(c)a, 424, 424.1,424.2, 424.3, 424.4, 424.5, 424.6, 424.7, 474, 481, 4840484(a)b, 484 (b)a, 4840, 484c, 4850, 487, 4137a, 487a(ai487a(b),48711, 487d, 487e, 487g, 487.1, 487.2, 487.3g,489, 495, 4960, 496a, 496a(a), 496cb, 496.1, 496.2, 496.5,497, 499c(b) 499c(b)(1), 499c(b)(2), 499c(b)(3),499c(b)(4), 499d, 50Q, 502 502(4 502(0)(1), 592(b)(2),502(c), 502(d), k02.50, 5030, 5040, 504ab, 504ba, 5050,5060, 506b, 5070, 5080, 5140, 528, 529, 5290, 529.2,529.3, 530b, 532b, 532ab, 5324(1)D, 53247(2)0,§32a(3)b,533, 534, 535, 537(a)(2), 5370, 537e(a)a, 538°, 538.5,540, 541, 542, 543, 548, 556 IC, 556(a)(1) IC, 556(aX2) IC,556(a)(3) IC, 556(b) 10,560, 560.4, 566, 577, 578, 580,581, 620, 6480, 664/487, 666, 1733 IC, 2116 UI, 3531 FC,4463(a) VC, 4463(a)(1) VC, 7026.10 BP, 10238.318P,10238 6 BP, 10238.6(c) BR 10752 VC, 10855 VC°, 10980(b)WI, 10980(c)(2) WI, 11010 BP, 11019 BR 11022 BP, 11023BP, 11482.5 WI, 11483 WI, 11483(2) WI, 11483.5 WI, 14014WI°, 14107 WI, 17410 WI, 17551 MC, 18848 FAO), 25110CC, 25401 CC, 25540 CC, 25541 CC, 27443 GC, 29610 EC,31110 CC, 31201 CC, 31410 CC
Motor Vehicle Theft -487.3°,490.1(a), 499111 (b),664/487.3, 664/10851 VC, 10851(a) VC, 10851(b) VC
Forgery, Checks, Credit Cards -366,470, 479a, 470b,471, 472, 473, 475, 475a, 476, 476a(a), 476a(b)a, 477478, 479, 480, 484e(4), 484fic1), 484f(2). 484ga, 484g(a)b,484g(b)o, 484h(ar, 484h(b) , 4641(b), 617, 664/470
Arson 451(a) 451(b), 451(c), 451(d), 452(a), 452(b),452(c), 453(a), 453(b), 454, 454(a), 454(b), 455
Other Sex Law Violations
Lewd or Lascivious - 220/288, 266j, 288,288(a), 288(b)
132 CRIME a baiNGUENcY. tree
An Other - 220/286, 220/289, 243.4(a),243.4(b), 243.4(c), 261.5, 265, 266, 266a, 266b,266d, 266e, 266f, 266g, 266h, 266i, 267, 285,286(a), 286(b)(1), 286(b)(2), 286(c), 286(d),286(e), 286(f), 286(g), 286(h), 288a(a), 288a(b)(1),288a(b)(2), 238a(c), 288a(d), 288a(e), 288a(f),288a(g), 288(h), 28p(a), 289(b), 289(c), 311.10,311.10(a), 311.2(42, 311.2(b), 311.2(c)b,3113(a)a, 311.4(a)b, 311.4(b), 311.4(0, 311.5b,311.70, 313.1(a) g, 313.1(b) g, 313.1(c)a, 314.10,647ab, 664/286(b)(1), 664/286(b)(2), 664/286(c),664/286(d), 664/286(e)
Drug Law Violations
Narcotics -11350 HS, 11350(a) HS, 11350(b) HS,11351 HS, 11352 HS, 11353 HS, 11354(a) HS
Marijuana- 11357(a) HS, 11358 HS, 11359 HS,11360(a) HS, 1.1361 HS
Dangerous Drugs - 111401-iSb, 11353.5 HS, 11375HS, 11375(a) HS, 11377 HS, 11377(a) HS, 11378HS, 11378.5 HS, 11379 HS, 11379.5 HS; 11380 HS,11380(a) HS, 11380.5 HS, 11380.5(a) HS
All Other -4234 BP, 4390 BP, 11104 HS, 11152HS, 11153(a) HS, 11154 HS, 11155 H3,111561-13,111731,3,11173(a) HS, 11173(b) HS, 11173(c) HS,11173(d) HS, 11174 HS, 11355 HS, 11363 HS,11366 HS, 11368.5 HS, 11366.5b HS, 11366.5a HS,11366.6 HS, 11366.7 HS, 11368 HS, 11371 HS,11371.1 HS,11379.6(a) HS, 11382 HS,11383(a) HS, 11383(b) HS
Weapons- 171b, 171c, 171d, 171d.1, 171d.2,626.9, 4502,8101 WI, 12001.5, 12020, 12020(a), 12020(c),12020(d)(1), 12021, 12021(a),_12021(b), 12021.1,12021.1(a), 120250, 12025(a)a, 12025(b)b, 12090, 12091,12220, 12320, 12321, 12403.7(a)(8), 12422, 12520, 12560
Driving Under the influence - 655(c) HN, 23153 VC,2315:1(a) VC, 23153(b) VC
Hit-and-Run - 20001 VC
Escape - 107, 10S, 119, 1026.4(a), 1370.5,1768.7(a) WI,2042,;.x02 WI, 4011.70, 4530(a), 4530(b), 4530(c), 4532,4532(a), 4532(b), 4533, 4534, 4535, 4536(a), 4550.1,45502, 6133, 7326 WI
Bookmaking -337a.1, 337a.2, 337a3, 337a.4, 337a.5,337a.6, 3371
All Other Felony Offenses
a Penal Code Sections unless indicated as follows: BP-Businessand Professions Code; CC-Corporations Code; EC-ElectionsCode, FAO-Food and Agriculture Code; GC-Govemment Code;HN-Harbors and Navigation Code; HS-Health and Safety Code;UI-UnemplOyment Insurance Code; VC-Vehicle Code; WI-Welfare and Institutions Code. All other felony offenses alsoinclude sections in the Financial Code, Fish and Game Code, and
bRevenue and Taxation Code.
° Code section can also be shown as a misdemeanor.c Code section can be shown as theft or theft c:4a motor
vehicle.
141

MISDEMEANOR-LEVEL ARREST OFFENSESa
Assault and Battery - 140, 147, 148, 14'n, 148.2.1,148.2.2, 148.2.3, 148.2.4, 148.3(a), 148.4(a), 151(a)(1),240, 240/P41, 240/24,2, 241(a),241(10, 241.2, 241.2(a),241.3, 241/243, 242b, 42/24°, 243°, 243(a), 243(b),243.2, 243.2(a), 243.3°, 243.5°, 243.5(a)(1), 243.5(a)(2),243.6, 244.5(b), 273a(2), 361, 368(b), 3/4c, 375(a) ,375(b), 375(c), 383, 402a, 417(a)(1), 417(a)(2),2652, 2653, 2654, 123040, 12680 HS
Petty Theft - 368(c)b, 484b, 4840,484mb. 484bb, 485b,487c, 487f, 488, 490, 490.5, 490.5(a), 4960, 50251), 530b,532°, 538°, 565, 22435.2 BP, 22435.11 BP, 22435.12 BP
Checks and credit Cards - 476a(b)b, 484e,(1), 484e(2),484e(3), 484g0, 484g(a)°, 484g (b)°, 484h(a)°, 484h(b)°,4841(a), 484j
Drug Law Violations - 377, 647(f)c, 2241 BP, 2762(e) BP,2878.5(a), 4143 BP, 414:1 BP, 4150 BP, 4151 BP, 4211 BP,4227 BP, 4227(a) BP, .4230 BP, 4390.1 BR, 4390.5 BP,11140 HSb,11150HS, 11157 HS, 11159 HS, 11161 HS,11162 HS, 11166 HS, 11170 HS, 11171 HS, 11172HS,11175 HS, 11190 HS, 11216 HS, 11217 HS, 11357(b) HS,11r.,57(c) HS, 11357(d) HS, 11357(e) HS, 11360(b) HS,11364 HS, 11364.7 HS, 11364.7(a) HS, 11364.7(b) HS,11365 HS, 11550 HS, 11550(a) HS, 11550(b) HS, 11590 HS,11594 HS, 11680 HS, 11681 HS, 23222(b) VC
Indecent Exposure - 314.1b, 314.2
Annoying Children - 647ab
Obscene Matter - 311, 311(a), 311.2(a)b, 311.2(c)b,,311 3(a)b,, 311.4(a),b, 311.5°, 311.6, 311.0, 313.1(a)b,
313.1(b)b,
313.1(c)0
Lewd Conduct -647(a), 647(d), 647(h), 653g
Prostitution - 315, 316, 647(b), 25601 BP
Drunk - 647(f)c
Disorderly Conduct - 647, 647(c), 647(e), 647(g) 647(0,647b
Disturbing the Peace - 1711, 171f.2, 302, 403, 404,404(a), 404.6, 405,406, 407, 408,409,415, 415(1),415(1,3), 415(3), 415.5, 415.5(a), 415.5(a)(1), 415.5(a)(2),415.5(a)(3), 416, 602.10, 626.2, 626.4(d), 6Z1.6, 626.8,626.8(a), 626.8(a)(1), 626.8(a)(2), 626.8(a)(3), 650, 653m,653m(a), 653m(b), 727, 9051 GC, 11460
Driving Under the Influence - 655(b) HN, 23152(a) VC,23152(b) VC, 23152(c) VC
Hit-and-Run - 20002 VC, 20002(a) VC, 20002(b) VC
Selected Traffic Violations - 23103 VC, 23104(a) VC,23109(a) VC, 23109(b) VC, 23109(c) VC, 38316 VC, 38317VC, 40508 VC, 40508(a) VC, 40508(b) VC, 40519 VC, 42005VC
Gambling - 318, 319, 320, 321, 322, 323, 324, 326, 327,330, 330a, 330b, 330b(1), 330c, 330.1, 330.4, 331, 335.336, 337s(b), 337.1, 337.2, 337.5, 11300
Nonsupport - 270b, 270a, 270c
Weapons -467, 468,626.10, 626.10(a) 653k, 12020.5,12021.5,12021.5(a), 12021.5(b), 12025°, 12025(a)°,12025(b)°, 12031, 12031(a), 12034, 12070, 12072, 12076,12093, 12094, 12403.7, 12403.7(a), 12403.8(a),12403.8(b), 12420, 12450, 12550, 12551, 12552, 12582,12651(a), 12651(b), 12651(c), 12651(d)
Glue Sniffing - 380(a), 381, 381(a), 381(b), 381b, 647(f)c
Malfclous Mischief- 555.1, 587a, 588b, 590, 592, 594,594(a)°, 594(a)(1), 594(a)(2), 594(a)(3), 594(b)(2),603,604, 605,605.1, 605.2, 605.3, 6060,607, 615, 616, 618,622,6221/2,623(a), 623(a)(1), 623(aX2), 623(a)(3),623(a)(4), 623(a)(5), 623(a)(6), 625b(a), 10750 VC,10750(a) VC, 10851.5 VC, 10852 VC, 10853 VC, 10854 VC,23110(a) VC, 38318(a) VC
Liquor Law Violations - 172a, 172b.1, 172d.1, 172g.1,1721, 303, 303a, 307, 347b, 397,398, 3356 HS, 11200,23220 VC, 23222(a) VC, 23300 BP, 23301 BP, 25351 BP,25602 BP, 25602(a) BP, 25604 BP, 25606 BP, 25607 BP,25608 BP, 25609 BP, 25617 BP, 25620 BP, 25631 BP,25632 BP, 25657(a) BP, 25657(b) BP, 25658 BP, 25658(a)BP, 25658(b) BP, 25658(c) BP, 25660.5 BP, 25661 BR25662 BP, 25663 BP, 25664 BP, 25665 BP
All Other Misdemeanor Offenses
a Penal Code sections unless indicated as follows: BP-Businessand Professions Code; EC-Education Code, GC-GovernmentCode; HS-Health and Safety Code; VC-Vehicle Code. All othermisdemeanor offenses also include: California AdministrativeCode; City or County Ordinance; Civil Procedure Code,Elections Code; Fish and Game Code; Food and AgricultureCode; Harbors and Navigation Code, Labor Code, Military andVeterans Code; Parks and Recreation Code, Public UtilityCoda; Revenue and Taxation Code, UnemploymentIns umnceCode; Welfare and Institutions Code.
°Code section can also be shown as a felony (e.g., with prior).c Code section may include those found in any public place under
the influence of intoxicating liquor, or any drug, toluene anysubstance defined as a poison in Schedule D of Section 4160BP, or any combination of the above.
142APPENDIX 133
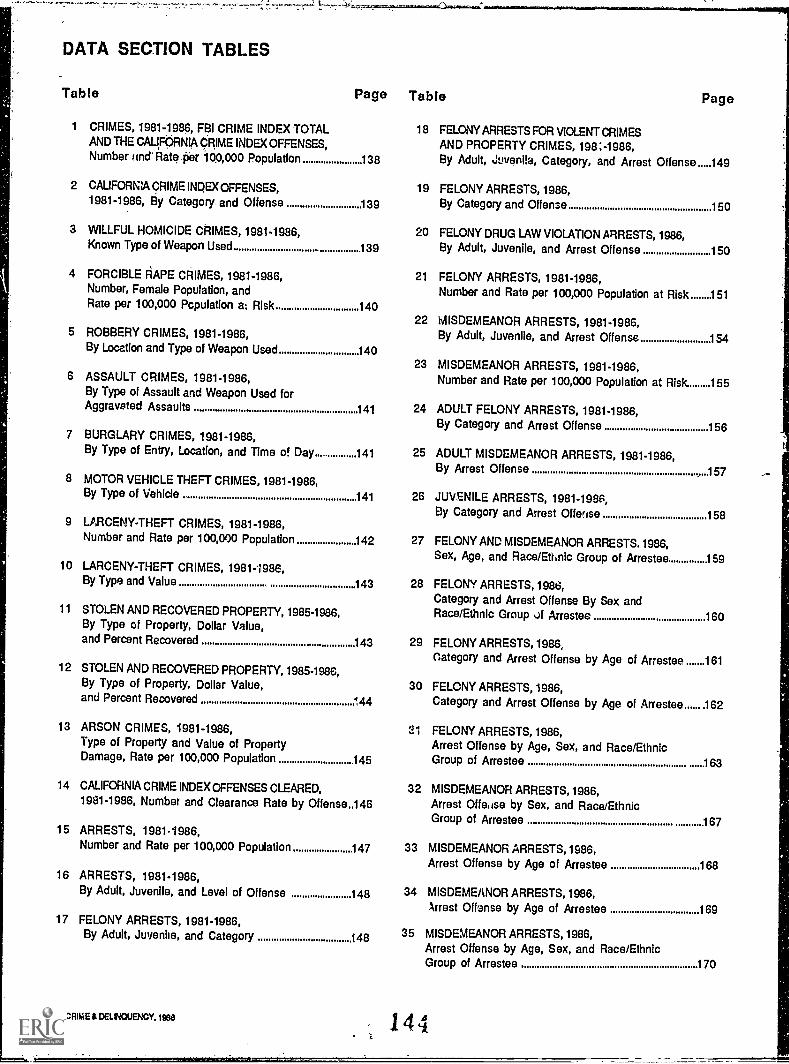
DATA SECTION TABLES
Table Page Table
1 CRIMES, 1981-1986, FBI CRIME INDEX TOTALAND THE CAUFCRNIA CRIME INDEX OFFENSES,Number und Rater 100,000 Population 138
2 CALIFORNIA CRIME INDEX OFFENSES,1981-1986, By Category and Offense 139
3 WILLFUL HOMICIDE CRIMES, 1981-1986,Known Type of Weapon Used 139
4 FORCIBLE RAPE CRIMES, 1981-1986,Number, Female Population, andRate per 100,000 Population a: Risk 140
5 ROBBERY CRIMES, 1981-1986,By Location and Type of Weapon Used 140
6 ASSAULT CRIMES, 1981-1986,By Type of Assault and Weapon Used forAggravated Assaults . 141
7 BURGLARY CRIMES, 1981-1986,By Type of Entry, Location, and Time o! Day... 141
8 MOTOR VEHICLE THEFT CRIMES, 1981-1986,By Type of Vehicle . 141
9 LARCENY-THEFT CRIMES, 1981-1986,Number and Rate per 100,000 Population 142
10 LARCENY-THEFT CRIMES, 1981-1986,By Type and Value 143
11 STOLEN AND RECOVERED PROPERTY, 1985-1986,By Type of Property, Dollar Value,and Percent Recovered 143
12 STOLEN AND RECOVERED PROPERTY, 1985-1986,By Type of Property, Dollar Value,and Percent Recovered 444
13 ARSON CRIMES, 1981-1986,Type of Property and Value of PropertyDamage, Rate per 100,000 Population 145
14 CALIFORNIA CRIME INDEX OFFENSES CLEARED,
1981-1986, Number and Clearance Rate by Offense..146
15 ARRESTS, 1981.1986,Number and Rate per 100,000 Population 147
16 ARRESTS, 1981-1986,By Adult, Juvenile, and Level of Offense 148
17 FELONY ARRESTS, 1981-1986,By Adult, Juvenile, and Category 148
1.36 CRIME & CE1.140UENCY. t&e&
18 FELONY ARRESTS FOR VIOLENT CRIMES
AND PROPERTY CRIMES, 198:4986,By Adult, Juvenile, Category, and Arrest Offense 149
19 FELONY ARRESTS, 1986,By Category and Offense 150
20 FELONY DRUG LAW VIOLATION ARRESTS, 1986,By Adult, Juvenile, and Arrest Offense 150
21 FELONY ARRESTS, 1981-1986,Number and Rate per 100,000 Population at Risk 151
22 MISDEMEANOR ARRESTS, 1981-1986,By Adult, Juvenile, and Arrest Offense 1S4
23 MISDEMEANOR ARRESTS, 1981-1986,Number and Rate per 100,000 Population at Risk. 155
24 ADULT FELONY ARRESTS, 1981-1986,By Category and Arrest Offense 156
25 ADULT MISDEMEANOR ARRESTS, 1981-1986,By Arrest Offense 157
26 JUVENILE ARRESTS, 1981-1986,By Category and Arrest Offense 158
27 FELONY ANC MISDEMEANOR ARRESTS. 1986,Sex, Age, and Race/Ethnic Group of Arrestee 159
28 FELONY ARRESTS, 1986,Category and Arrest Offense By Sex andRace/Ethnic Group .)f Arrestee 160
29 FELONY ARRESTS, 1986,Category and Arrest Offense by Age of Arrestee .......161
30 FELONY ARRESTS, 1986,Category and Arrest Offense by Age of Arrestee 162
21 FELONY ARRESTS, 1986,Arrest Offense by Age, Sex, and Race/EthnicGroup of Arrestee 163
32 MISDEMEANOR ARRESTS, 1986,Arrest °liaise by Sex, and Race/EthnicGroup of Arrestee 167
33 MISDEMEANOR ARRESTS, 1986,Arrest Offense by Age of Arrestee 168
34 MISDEMEANOR ARRESTS, 1986,Arrest Manse by Age of Arrestee 169
35 MISDEMEANOR ARRESTS, 1986,Arrest Offense by Age, Sex, and Race/EthnicGroup of Arrestee 170
144

Table.
q, ,t)istpil$if>rADcit..T F4.90Y4Ings-t$,,104fyietis, 706;ol-,Disppaition:byinofribe:'gldT44entDistrtbigiiiti
. ,
/ADULT FEUDisiYARRESTD18POSITIQNS,
198141986, 'By, Ty0,,pf.:1?ispasition
3$ Api;rp;F_ONY:ARRsrobsPOsmoris,1946,Arrest, Offensa',Categ Cry,EIAType of Disposition. ..174
30 ADULT FEtOy'xiBtsitpOrivittp,1681-086, pyteinvieted-Offehee Category`atici-TyPci
Page
40 ;ADM:t, 0,Et2)NY ARRESTEES COI\ IVICTED, lass,COnvicted,QIIOne Category by Type ,01,$entense........176
,
41 ADULT FELONYARRESTEES COisiVICTED,1981',
Coni/icted'afferise Category- by:, Type- p(SentenOe....i...176
42 SA.put.T4t.OSF#610.s CONVICTED;, oe2,.coniticteci MO so CateOcny:by:Typei. of:8entence....177
43 ADULT FELONYARRE8TEESCONVICTED,,1983,'Convicted Offense dateippnrtoSr:TyPe-otSentenoa.....178
44 'ADULT FELONYARRESTEESONVICTED, 1984,'Convicted Offerts.aCategory' by,TypworSentence........179
45 ADULT FELONY ARRESTEESCONVICTED,19EI5,
Co'nvicted-Offense Cateciory,iv'Tyneni,Santende,.......180
46 ADULT FELONY CONvIcTED,1986,Convicted Offense- Category' by-Type of,6entence. 181
47 8TATUS OF ADULT4UNDER,STATEANDLOCAL SUPERVISION, y981 =1986,Type of ,Supervision and :-Rate per 109,000PopuiStIon at Risk ........182
48 STATUS OF ADULr-S, UNDER STAWANDLOCAL.SUFERVISION, 1981-19E5,Percent-- Difstribution -Of Type, of ,Supervision. 183
49 ADULT PROBATION .ACTIVE CASELOADSON' DECEMBER 31, 1981-1986,Typal?! COurt .... ..... 184
SO ADULTS PLACED-ON-AND REMOVED FROM
PROBATION, 1981-1986, Type of, Court andReason for-Removal, ate per 1011;000PopulatfolvatAigk , 185
61 ADULTS COMMITTED TO PRISONt CALIFORNIA
'REI-IABIUTATION.CENTER,AND.YOUThAuTmorirr:, 190-1988, 'Type oft ,mmItmentand Rata ,par 100,000 Poixilation, at Risk 186
Table Page
52 LAW ENFORCEMENT DISPOSITIONS OF JUVENILEARRESTS, 1981.1986, Sex of Arrestee andDisposition by Offense Level 187
53 NEW REFERRALS TO PROBATION DEPARTMENTS,1981-1986, Source of Referral,Disposition, and Sex.. 188
54 JUVENILE COURT DISPCSITIONS OF NEW PETITIONS,1981-1986, Type of Disposition 188
55 JUVENILE COURT DISPOSITIONS OF NEW PETITIONS,1986, Offense Level by Type of Disposition 189
56 PROBATION DEPARTMENT DISPOSITIONS OFSUBSEQUENT REFERRALS, 1981-1986,Type of blsjosItisn, 54 Counties 189
57 JUVENILE COURT DISPOSITIONS OF SUBSEQUENTPETITIONS, 1981-1986,Type of Disposition, 54 Counties... 190
58 JUVENILE 47:URI DISPOSITIONS OF SUBSEQUENTOETiTIONS; 1986, Offense Level by Ty,:ci ofDisposition, 54 Counties 190
59 JUVENILE PROBATION CASELOAD, 1981-1986,Type of Probation 191
60 JUVENILES.IN COUNTY-OPERATED DETENTIONFACILITIES, 1981-1986,Type of Facility by Sex 191
61 FIRST COMMITMENTS TO CALIFORNIA YOUTHAUTHORITY FROM JUVENILE COURT,1981-1986 ................. . ..... 191
62 CRIMINAL JUSTICE AGENCY EXPENDITURES,FISCAL YEARS 1980/81-1985/86,Agency and Expenditu e; by Fiscal year .......... ..... 192
63 CRIMINAL JUSTICE AGENCY EXi-ENDITURE S,FISCAL YEARS 1980/81-1985/86,Dollar and Inflation-Adjusted Expendituresby Fiscal Year 193
64 CRIMINAL JUSTICE AGENCY EXPENDITURES,FISCAL YEARS 1980/81-1985/E5,By Type of Agency 193
65 CRIMINAL JUSTICE AGENCY AUTHORIZEDFULL-TIME PERSONNEL 1981-1986,By Agency 194
66 CRIMINAL JUSTICE AGENCY AUTHORIZEDFULL-TIME PERSONNEL, 1981-1986,By Typo of Agency 195
67 POPULATION ESTIMATES, 1981-1986 195
145DATA SECTION 137

it
TABLE 1CRIMES, 1981-1986
FBI CRIME INDEX TOTAL AND THE CALIFOPNIA CRIME INDEX OFFENSESNumber and Rate per 100,000 Population
homarrassiossioszakswasmatassailllinat
Year
FBICrimeIndextotala
CaliforniaCrimeIndextotal
Violent crimes Property crimes
Larceny-theftTotal
Willfulhomicide
Forciblerape Robbery
Aggravatedassault Total Burglary
Motnrvehicletheft
1986 1,824,754 911,697 248,352 3,030 12,118 92,513 140,691 663,345 457,743 205,602 913,0571985 1,721,107 823,461 202,066 2,781 11,442 86,464 101,379 626,395 449,065 177,330 892,6461984 1,658,332 800,615 195,650 2,724 11,702 84,015 97,209 604,965 443,624 161,341 857,7171983 1,680,781 813,789 194,489 2,640 12,092 85,824 93,933 619,300 460,401 158,899 866,9921982 1,801,262 865,431 201,433 2,778 12,529 91,988 94,138 663,998 499,468 164,530 935,8311981 1,830,288 910,241 208,165 3,140 13,545 93,638 97,842 702,076 539,809 162,267 920,047
Percent change innumber from
1985 to 1986 6.0 10.0 22.9 9.0 5.0 7.0 38.8 5.9 1.9 15.9 2.31984 to 1985 3.8 3.5 3.3 2.1 -2.2 2.9 4.3 3.5 1.2 9.9 4.11983 to 1984 -1.3 -1.6 .6 3.2 -3.2 -2.1 3.5 -2.3 -3.6 1.5 -1.11982 to 1983 -6.7 -6.0 -3.4 -5.0 -3.5 -6.7 -.2 -6.7 -7.8 -3.4 -7.41981 to 1982 -1.6 -4.9 -3.2 -11.5 -7.5 -1.8 -3.8 -5.4 -7.5 1.4 1.7
1981 to 1986 -.3 .2 19.3 -3.5 -10.5 -1.2 43.8 -5.5 -15.2 26.7 -.8
Rate por 100,000popuiationb
1986 6,763.2 3,379.1 920.5 11.2 44.9 342.9 521.4 2,458.6 1,696.6 762.0 3,384.11985 6,528.0 3,142.3 766.4 10.5 43.4 327.9 384.5 2,375.8 1,703.3 672.6 3,385.71984. 6,472.3 3,124.7 763.6 10.6 45.7 327.9 379.4 2,361.1 1,731.4 629.7 3,347.61983 6,676.1 3,232.7 772.6 10.5 48.0 340.9 373.1 2,460.1 1,828.9 631.2 3,444.01982 7,285.5 3,500.I 814.7 11.2 50.7 372.1 380.8 2,685.6 2,020.2 665.5 3,78.11,171' 7,534.4 ..,761 -; 860.3 18.0 56.0 387.0 404.4 2,901.6 2,231.0 670.6 3,802.5
Percent change Inrate (rum
1085 to 1288_ 3.6 7.5 20.1 6.7 3.5 4.6 35.6 3.5 -.4 13.3 .01084 tt. 1985 .9 .6 .4 -.9 -5.0 .0 1.3 .6 -1.6 6.8 1.11983 to 1984 -3.1 -3,3 -1.2 1.0 -4.8 -3.8 1.7 -4.0 -5.3 -.2 -2.81981 ti. 1983 -8.4 -7.6 -5.2 -6,2 -5.3 -8.4 -2.0 -8.4 -9.5 -5.2 -9.01981 to 198c -3.7 -7.0 -5.3 -18.8 -9.5 -3.8 -5.8 -7.4 -9.4 -.8 -.5
1981 to 1986 -10.6 -10.2 7.0 -13.8 -19.8 -11.4 28.9 -15.3 -24.0 13.6 -11.9 4 ..aThe FBI Crime Index otal includes larceny-theft; the FBI modiiied Grin) Index (not shown) also includes arson.
14 (3 bRalos are based on annual population estimates provided by the Population Resoarch Unit, Department of Franco.
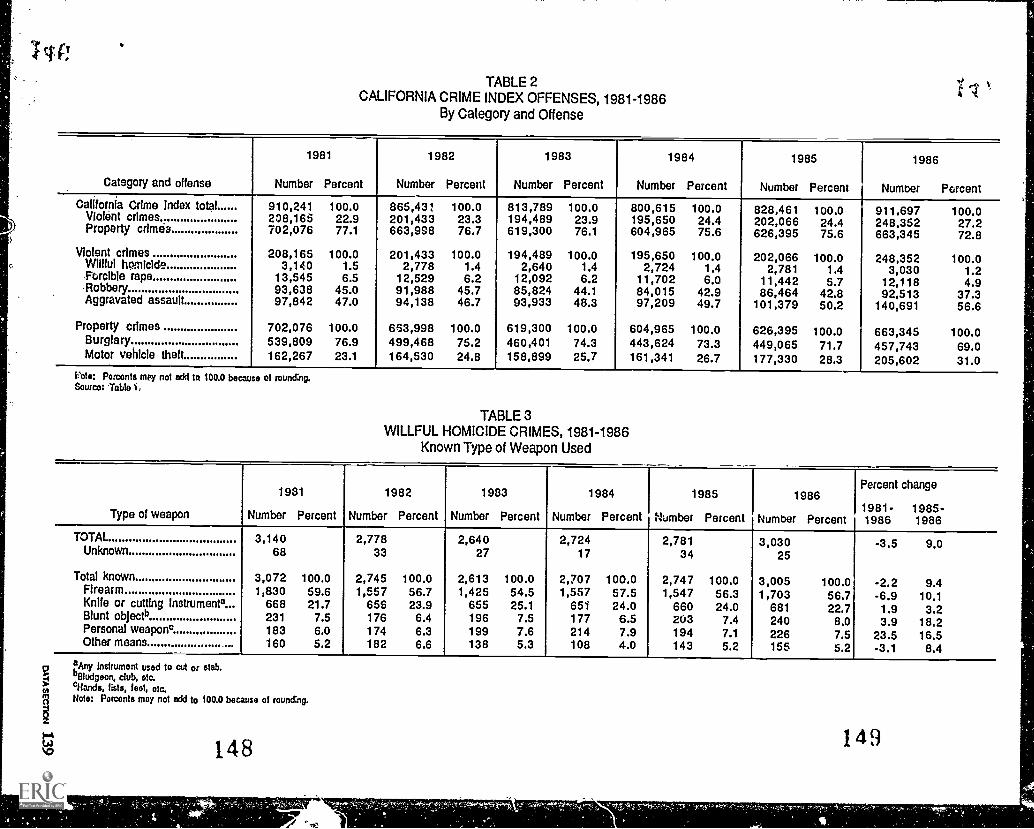
TABLE 2CALIFORNIA CRIME INDEX OFFENSES, 1981-1986
By Category and Offense
Category and offense
1981
Number Percent
1982
Number Percent
1983
Number Percent
1984
Number Percent
1985
Number Percent
1986
Number PercentCalifornia Crime Index total 910,241 100.0 865,431 100.0 813,789 100.0 800,615 100.0 828,461 100.0 911,697 100.0Violent crimes 208,166 22.9 201,433 23.3 194,489 23.9 195,650 24.4 202,066 24.4 248.352 27.2Property crimes 702,076 77.1 663,998 76.7 619,300 76.1 604,965 75.6 626,395 75.6 663,345 72.8
Violent crimes 208,165 100.0 201,433 100.0 194,489 100.0 195,650 100.0 202,066 100.0 248,352 100.0Willful horalcIde 3,140 1.5 2,778 1.4 2,640 1.4 2,724 1.4 2,781 1.4 3,030 1.2Florclble rape 13,545 6.5 12,529 6.2 12,092 6.2 11,702 6.0 11,442 5.7 12,118 4.9Robbery 93,638 45.0 91,988 45.7 85,824 44.1 84,015 42.9 86,464 42.8 92,513 37.3Aggravated assault 97,842 47.0 94,138 46.7 93,933 48.3 97,209 49.7 101,379 50.2 140,691 56.6
Property crimes 702,076 100.0 663,998 100.0 619,300 100.0 604,965 100.0 626,395 100.0 663,345 100.0Burglary 539,809 76.9 499,468 75.2 460,401 74.3 443,624 73.3 449,065 71.7 457,743 69.0Motor vehicle theft 162,267 23.1 164,530 24.8 158,899 25.7 161,341 26.7 177,330 28.3 205,602 31.0
Vote: Percents mey not add to 100.0 because of roundng.Source: Table 1,
TABLE 3WILLFUL HOMICIDE CRIMES, 1981-1986
Known Type of Weapon Used
Type of weapon
1931
Number Percent
1982
Number Percent
1983
Number Percent
1984
Number Percent
1985
Number Percent
1986
Number Percent
Percent change
1981- 1985 -1986 1986
TOTAL 3,140 2,778 2,640 2,724 2,781 3,030 -3.5 9.0Unknown 68 33 27 17 34 25
Total known 3,072 100.0 2,745 100.0 2,613 100.0 2,707 100.0 2,747 100.0 3,005 100.0 -2.2 9.4Firearm 1,830 59.6 1,557 56.7 1,425 54.5 1,557 57.5 1,547 56.3 1,703 56.7 -6.9 10.1Knife or cutting Instrumenta 668 21.7 656 23.9 655 25.1 651 24.0 660 24.0 681 22.7 1.9 3.2Blunt obJectb 231 7.5 176 6.4 196 7.5 177 6.5 203 7.4 240 8.0 3.9 18.2Personal weapons 183 6.0 174 6.3 199 7.6 214 7.9 194 7.1 226 7.5 23.5 16.5Other means 160 5.2 182 6.6 138 5.3 108 4.0 143 5.2 155 5.2 -3.1 8.4
,aAny Instrument used to cut or stab.°Bludgeon, club, etc.cHands, lists, loot, etc.Note: Portents may not add to 100.0 because of rouncEng.
148 149

a
4.)
TABLE 4FORCIBLE RAPE CRIMES, 1981-1986
Number, Female Population, and Rate per 100,000 Population at Risk
1981 1982 1983 1984 1985 1986Percent change
1981- 1985 -Number Percent Number Percent Number Percent Number Percent Number Percent Number Percent 1986 1986TOTAL 13,545 100.0 12,529 100.0 12,0.2 100.v 11,702 100.0 11,442 100.0 12,118 100.0 -10.5 5.9Rapes by force. 8,902 65.7 8,274 66.0 8,176 67.6 8,067 68.9 8,324 72.7 8,733 72.1 -1.9 4.9Attempts to commit
forcible rape 4,643 34.3 4,255 34.0 3,916 32.4 3,635 31.1 3,118 27.3 3,385 27.9 -27.1 8.6Female Population 12,200.285 12,533,093 12,751,635 12,967,882 13,183,284 13,619,432Rate per 100,000population, at risk 110.3 100.0 94.8 90.2 86.8 89.0 -19.3 2.5
TABLE 5ROBBERY CRIMES, 1981-1986
By Location and. Type of Weapon Used
LoCation end type of Weapon
1981
Number Percent
1982
Number Percent
1983
Number Percent
984Nureber Percent
1985
Number Percent
1986
Number Percent
Percent change
1981- 1985-1986 1986
TOTAL 0:08 100.0 91,988 100.0 85;024 '100:0 84,015 100.0 86,464 100.0 92,513 100.0 -1.2 7.0Location
fliblitkiaya 46,706 49.9 46;942 5110 45,669 53.2 43,806 52.1 45,193 52.3 51,022 55.2 9.2 12.9,Commercialb 25,377 27.1 23;295 25.3 19,075 22.2 19,085 22.7 20,337 23.5 20,458 22:1 -19.4 .6Residence 8,768 9.4 8,604 9:4 8,666 9:7 7,997 9.5 8,003 9.3 7,759 8.4 -11.5 -3.0'Bank. 2,722 2.9 2,514 2.7 2,837 3.3 2,328 2.8 2,029 2.9 2,331 2.5 -14.4 14.9Miscelleneouec 10,065 10:7 10,633 11.6 9,878 11.5 10,799 12.9 10,902 12.6 10,943 11.8 8.7 .4Ty,pe-of. Weapti,i
Armed' 58,772 62.8' 57,127 62.1 51,308 59.8 49,449 58.9 49,806 57.6 52,644 56.9 -10.4 5.7Strorig,erni, , 34,866 37.2 34,861 37.9 34,;16 40.2 34,566 41.1 36,658 42.4 39,869 43.1 14.3 8.8Armed,by,Iyeapon type 58,772 100.0 57,127 100.0 51,308 10b.0 49,449 100.0 49;806 100.0 52,644 100.0 -10.4 5,7Firearm..... . , 39;945 66.3: 37,948 66.4 32,060 62.5 29,900 60.5 29,829 59.9 30,256 57.5 -22.4 1.4Knife. oa.r-otting Anstriimentd 1-!,846 20.2 11,809 20.7 11,491 22.4 11,872 24.0 12,293 24.7 12,904 24.5 8.9 5.0Othelci .angerous weapeit.'.
. .. ,7;941 13.5 7,370 12.9 7,757 15.1 7,677 15.5 7,684 15.4 9,484 18.0 19.4 23.4
aereici0,,tiiuks.1341liqiCf'tots.-cita'statIon,,converdence store, etc.
hurckqs, 'echo* 4diernmeitubuildIng3, trains, wooded 'areas, etc.vuAny Insteuinent uced.to cut.oi. stab.NOtet: Percents** hot add te i00.0 because of rounding. 151
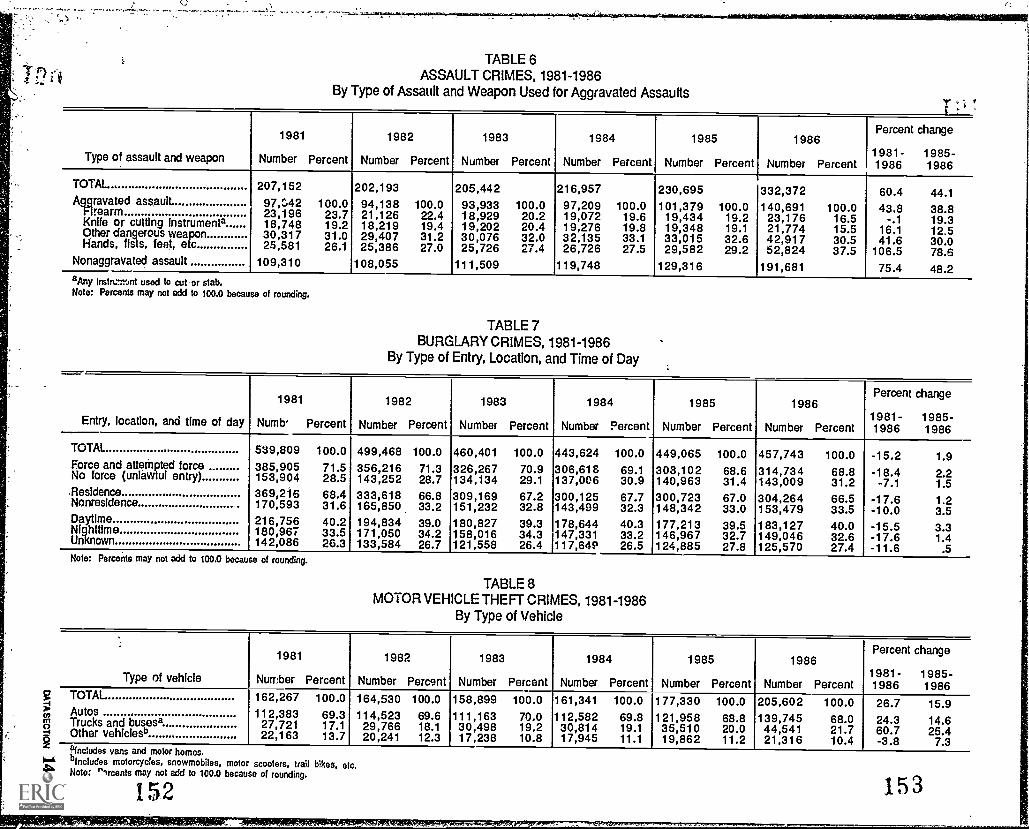
TABLE 6ASSAULT CRIMES, 1981-1986
By Type of Assault and Weapon Used for Aggravated Assaults
1981 1982 1983 1984 1985 1986Percent change
1981- 1985 -Type of assault and weapon Number Percent Number Percent Number Percent Number Percent Number Percent Number Percent 1986 1986
TOTAL 207,152 202,193 205,442 216,957 230,695 332,372 60.4 44.1Aggravated assault 97,42 100.0 94,138 100.0 93,933 100.0 97,209 100.0 101,379 100.0 140,691 100.0 43.8 38.8Firearm 23,196 23.7 21,126 22.4 18,929 20.2 19,072 19.6 19,434 19.2 23,176 16.5 -.1 19.3Knife or cutting instrumenta 18,748 19.2 18,219 19.4 19,202 20.4 19,276 19.8 19,348 19.1 21,774 15.5 16.1 12.5Other dangerous weapon 30,317 31.0 29,407 31.2 30,076 32.0 32,135 33.1 33,015 32.6 42,917 30.5 41.6 30.0Hands, fists, feet, etc 25,581 26.1 25,386 27.0 25,726 27.4 26,726 27.5 29,582 29.2 52,824 37.5 106.5 78.6Nonaggravated assault 109,310 108,055 111,509 119,748 129,316 191,681 75.4 48.2aMy instn...-nalt used to cuter stab.Note: Percents may not add to 100.0 because of rounding.
TABLE 7BURGLARY CRIMES, 1981-1986
By Type of Entry, Location, and Time of Day
1981 1982 1983 1984 1985 1986Percent change
1981- 1985 -Entry, location, and time of day Numb Percent Number Percent Number Percent Number Percent Number Percent Number Percent 1986 1986
TOTAL 539,809 100.0 499,468 100.0 460,401 100.0 443,624 100.0 449,065 100.0 457,743 100.0 -15.2 1.9Force and attempted force 385,905 71.5 356,216 71.3 326,267 70.9 306,618 69.1 308,102 68.6 314,734 68.8 -18.4 2.2No force (unlawful entry) 153,904 28.5 143,252 28.7 134,134 29.1 137,006 30.9 140,963 31.4 143,009 31.2 -7.1 1.5Residence 369,216 68.4 333,618 66.8 309,169 67.2 300,125 67.7 300,723 67.0 304,264 66.5 -17.6 1.2Nonresidence 170,593 31.6 165,850 33.2 151,232 32.8 143,499 32.3 148,342 33.0 153,479 33.5 -10.0 3.5Daytime 216,756 40.2 194,834 39.0 180,827 39.3 178,644 40.3 177,213 39.5 183,127 40.0 -15.5 3.3Nighttime 180,967 33.5 171,050 34.2 158,016 34.3 147,331 33.2 146,967 32.7 149,046 32.6 -17.6 1.4Unknown 142,086 26.3 133,584 26.7 121,558 26.4 117,649 26.5 124,885 27.8 125,570 27.4 -11.6 .5Note: Percents may not add to 100.0 because of rounding.
TABLE 8MOTOR VEHICLE THEFT CRIMES, 1981-1986
By Type of Vehicle
1981 1982 1983 1984 1985 1986Percent change
1981- 1985 -Type of vehicle Number Percent Number Percent Number Percent Number Percent Number Percent Number Percent 1986 1986TOTAL 162,267 100.0 164,530 100.0 158,899 100.0 161,341 100.0 177,330 100.0 205,602 100.0 26.7 15.9Autos 112,383 69.3 114,523 69.6 111,163 70,0 112,582 69.8 121,958 68.8 139,745 68.0 24.3 14.6Trucks and busesa 27,721 17.1 29,766 18.1 30,498 19.2 30,814 19.1 35,510 20.0 44,541 21.7 60.7 25.4Other vehlclesb 22,163 13.7 20,241 12.3 17,238 10.8 17,945 11.1 19,862 11.2 21,316 10.4 -3.8 7.3,ItIncludes vans and motor homes.°Includes motorcycles, snowmobiles, moto scooters, trail bikes, etc.Note: ^'Ircents may not add to 100.0 because of rounding.
15.2 153
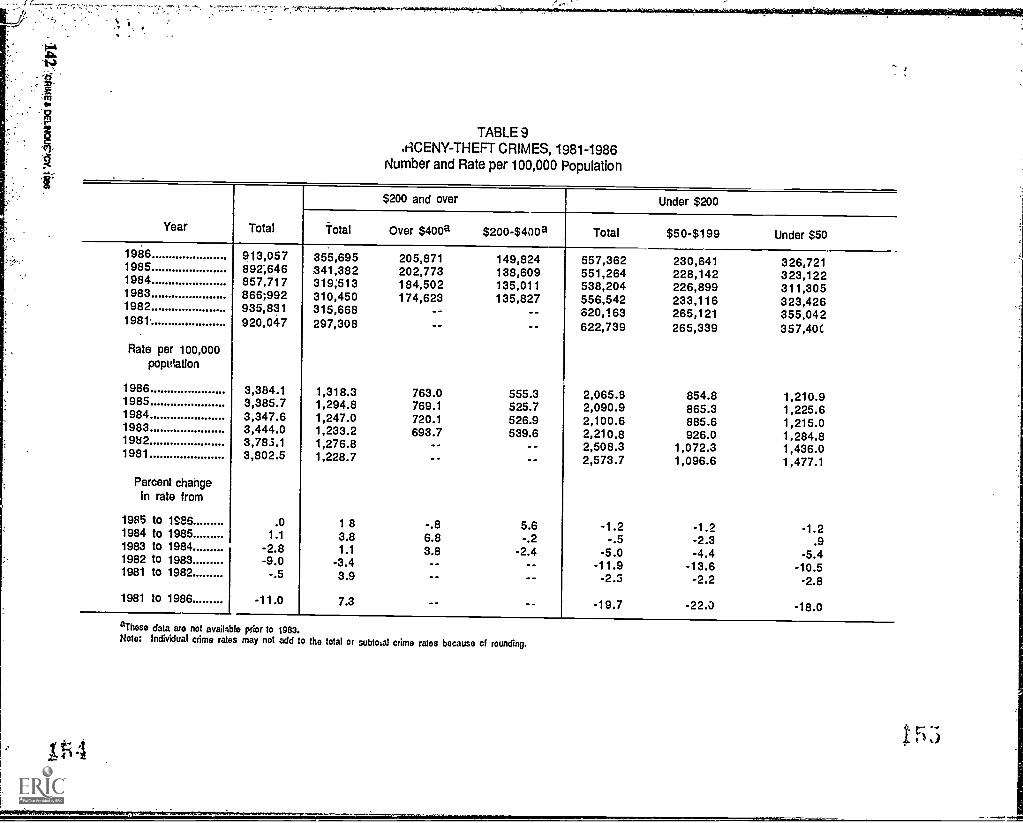
ni
TABLE 9ACENY-THEFT CRIMES, 1981-1986
Number and Rate per 100,000 Population
Year Total
$200 and over Under $200
Total Over $400a $200-$400a Total $50-$199 Under $50
1986 913,057 355,695 205,871 149,824 557,362 230,641 326,7211985 892;646 341,382 202,773 138,609 551,264 228,142 323,1221984 857,717 319;513 184,502 135,011 538,204 226,899 311,3051983 866;992 310,450 174,623 135,827 556,542 233,116 323,4261982 935,831 315,668 -- -- 620,163 265,121 355,0421981 920,047 297,308 -- -- 622,739 265,339 357,40C
Rate per 100,000population
1986 3,384.1 1,318.3 763.0 555.3 2,065.8 854.8 1,210.91985 3,385.7 1,294.8 769.1 525.7 2,090.9 865.3 1,225.61984 3,347.6 1,247.0 720.1 526.9 2,100.6 885.6 1,215.01983 3,444.0 1,233.2 693.7 539.6 2,210.8 926.0 1,284.81982 3,783.1 1,276.8 -- -- 2,508.3 1,072.3 1,436.01981 3,802.5 1,228.7 -- -- 2,573.7 1,096.6 1,477.1
Percent changeIn rate from
1985 to ten .0 1 8 -.8 5.6 -1.2 -1.2 -1.21984 to 1985 1.1 3.8 6.8 -.2 -.5 -2.3 .91983 to 1984 -2.8 1.1 3.8 -2.4 -5.0 -4.4 -5.41982 to 1983 -9.0 -3.4 -- -- -11.9 -13.6 -10.51981 to 1982 -.5 3.9 -- -- -2.5 -2.2 -2.81981 to 1986 -11.0 7.3 -- -- -19.7 -22.0 -18.0
aThese data are not available prior to 1983.Note: Individual crime rates may not add to tho total or subtotal crime rates because of rounding.
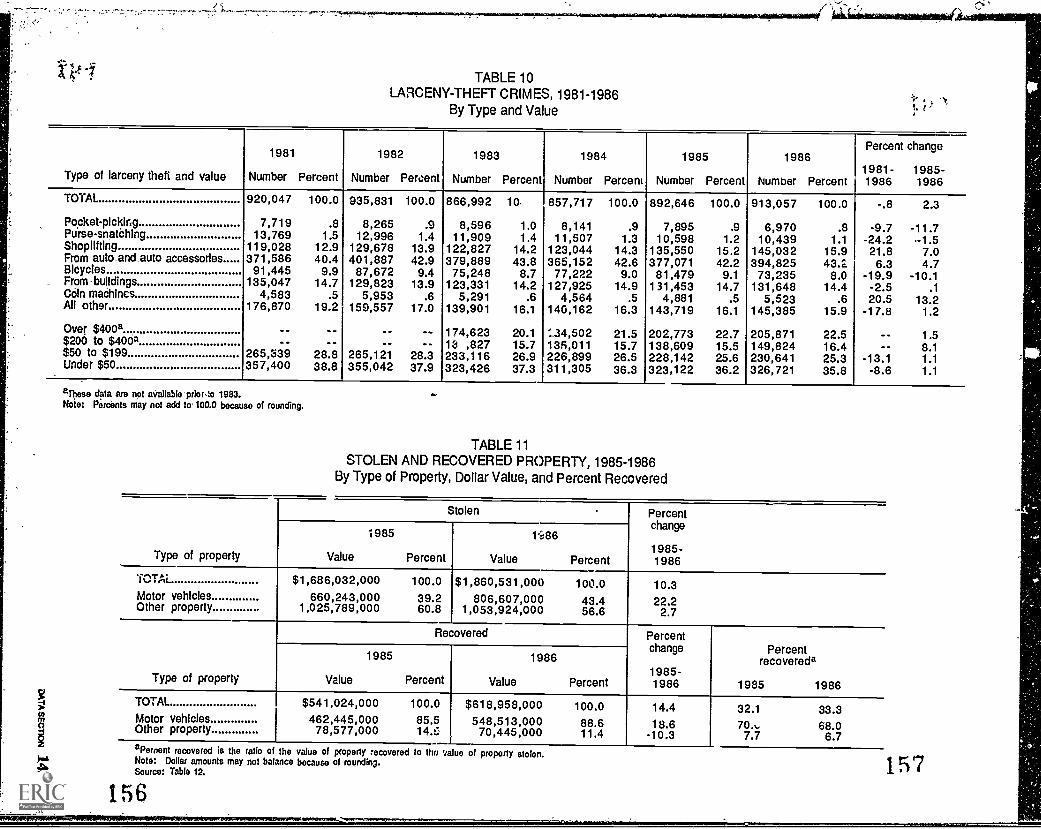
TABLE 10LARCENY-THEFT CRIMES, 1981-1986
By Type and Value t. t
Type of larceny theft and value
1981
Number Percent
1982
Number Percent
1983
Number Percent
1984
Number Percent
1985
Number Percent
1986
Number Percent
Percent change
1981- 1985 -1986 1986
TOTAL 920,047 100.0 935,831 100.0 866,992 1( 857,717 100.0 892,646 100.0 913,057 100.0 -.8 2.3
Pocket - picking 7,719 .8 8,265 .9 8,596 1.0 8,141 .9 7,895 .9 6,970 .8 -9.7 -11.7Purse-snatching 13,769 1.5 12,996 1.4 11,909 1.4 11,507 1.3 10,598 1.2 10,439 1.1 -24.2 -1.5Shoplifting 119,028 12.9 129,678 13.9 122,827 14.2 123,044 14.3 135,550 15.2 145,032 15.9 21.8 7.0From auto and auto accessories 371,586 40.4 401,887 42.9 379,889 43.8 365,152 42.6 377,071 42.2 394,825 43.2 6.3 4.7Bicycles 91,445 9.9 87,672 9.4 75,248 8.7 77,222 9.0 81,479 9.1 73,235 8.0 -19.9 -10.1From buildings 135,047 14.7 129,823 13.9 123,331 14.2 127,925 14.9 131,453 14.7 131,648 14.4 -2.5 .1Coln machines 4,583 .5 5,953 .6 5,291 .6 4,564 .5 4,881 .5 5,523 .6 20.5 13.2AU other 176,870 19.2 159,557 17.0 139,901 16.1 140,162 16.3 143,719 16.1 145,385 15.9 -17.8 1.2
Over $400a -- -- -- -- 174,623 20.1 4..34,502 21.5 202,773 22.7 205,871 22.5 -- 1.5$200 to $400a -- -- -- -- 13 ,827 15.7 135,011 15.7 138,609 15.5 149,824 16.4 -- 8.1$50 to $199 265,339 28.8 265,121 28.3 233,116 26.9 226,899 26.5 228,142 25.6 230,641 25.3 -13.1 1.1Under $50 357,400 38.8 355,042 37.9 323,426 37.3 311,305 36.3 323,122 36.2 326,721 35.8 -8.6 1.1
These data are not available -prior to 1983.Note: Percents may not add to 100.0 because of rounding.
TABLE 11STOLEN AND RECOVERED PROPERTY, 1985-1986
By Type of Property, Dollar Value, and Percent Recovered
0
Type of property
Stolen Percentchange
1985-1986
1985
Value Percent
1G86
Value Percent
TOTAL
Motor vehiclesOther property
$1,686,032,000660,243,000
1,025,789,000
100.039.260.8
$1,860,531,00()806,607,000
1,053,924,000
100.0
43.456.6
10.3
22.22.7
Type of property
Recovered Percentchange
1985-1986
Percentrecovereda
1985 1986
1985
Value Percent
1986
Value Percent
TOTAL
Motor vehiclesOther property
$541,024,000462,445,00078,577,000
100.085.5
$618,958,000548,513,000
70,445,000
100.0
88.611.4
14.418.6
-10.3
32.1
70.,7.7
33.368.0
6.7
tr,)
aPercent recovered is the ratio of the value of property recovered to the value of property stolen.Note: Dollar amounts may not balance because of rounding.Source: Table 12.
156157

lS
TABLE 12STOLEN AND RECOVERED PROPERTY, 1985-1986
By Type of Property, Dollar Value, and Percent Recovered
Type of property
Stolen Percentchange
1985-1986
1985
Value Percent
1986
Value PercentTOTAL
Currency, notes; etcJewelry and precious metalsClothing and furs'Motor vehicle'sMice equipmentTelevisions, radios, stereos, etc,FirearmsHousehold goodsConsumable goodsLivestockother
$1,685,032,000114,616;000224,006,00045,121,000
660;243,00035,749,000
147,409,00013,614,00030,812;0009,175,0001,531,000
403,756,000
100.06.8
13.32.7
39.22.18.7
.81.8
.5
.123.9
$1,860,531,000137,072,000225,057,00043,589,000
806,607,00039,659,000
212,476,00022,554,00033,091,00010,058,0001,710,000
328;658,000
100.0
7.412.1
.3432.4
2.111.4
1.21.8
.5
.117.7
10.319.6
.5-3.422.210.944.165.77.4
191.7.6
-18.6
Type of property
Recovered Percentchange
1985-1986
Percentrecovereda
1985 1986
1985
Value Percent
1986
Value PercentTOTAL $541,024,000 100.0 $618,958,000 100.0 14.4 32,1 33.3Currency, notes, etc 7,944,000 1.5 6,112,000 1.0 -23.1 6.9 4.5Jewelry and precious metals 13,310,000 2.5 12,443,000 2.0 -6.5 5.9 5.5Clothing and furs 5,752,000 1.1 4,742,000 .8 -17.6 12.7 10.9Motor vehiclesOffice equipment
462,445,0002,805,000
85.5.5
548,513,0002,004,000
88.6.3
18.6-28,6
70.07.8
68.05.1Televisions, radios, stereos, etc 6,947,000 1.3 6,818,000 1.1 -1.9 4.7 3.2Firearms
Household goods1,223,0002,536,000
.2
.51,158,0002,314,000
.2
.4-5.3-8.8
9.08.2
5.17.0Consumable goods 2,149,000 .4 1,643,000 .3 -23.5 23.4 16.3Livestock 308,000 .1 325,000 ,1 5.5 20.1 19.0Other 35,603,000 6.6 32,886,000 5.3 -7.6 8.8 10.0
°Percent recovered Is the ratio of the value of property recovered to the value of propertyHole: Dollar amounts may not balance and percents may not add to 100.0 because of rounding.

TABLE 13ARSON CRIMES, 1981-1986
Type of Property ?-tr,d. Value of. Property DamageRate per 100,000 Population
Type of property.
1981 1982 1983 T
Offenses
Number Percent
Properly damage
Value Percent
Offenses
Number Percent
Property damage
Value Percent
Offenses
Number Percent
Property damage
Value Percent
100 088.7
28.5
8.7
5.5
5.3
31.0
7.8
4.010.4
9.3
1.1
.9
TOTALTotal'strudurat properly. ..
ResidentietSingle occupancy (houses,
tovmhotates, duptexersetC.)Oter(aparments, tenements,
hotelsmotals, etc.).. -Storapeqberts, garages,
Warehouses, etC.)..Cernmerciar
Industrial, matiulaMbring ......-Other (storee, restaurants,-offices, etc.)... ........ .... . :
Community/public (churches, Ws._schoels, hospitals,etc.)....... .......
Other (oukbolidingsbuklingsunder cOnstnlotion, ete.)
Total mobile:m*01Y.Motetwerk-Hs" (aulas, trucf3,
buses .std.) ,Other_ (trailers, recreational
Vehicles, airplanes, boats, etc).-Other, prepay (crops, timber,
fences, etc.) ..Rate per 100,170u t'ipulatiort
Total..,Structural, properly -Itilebile property.. ,Other property
24,6349,058
3,255
1,869
759
234
1,382
1;160
4296,373
5,047
328
10,103
101.437.422.241.8
100.038.9
13.3
7.8
3.1
1.0
6.8
4.7
1.721.9
20.6
1.3
41.2
3177,334,000124,211,000
36,249,000
19,760,000
9,571,000
12,760,000
32,602,000
0.662,000
3,338,00012,782,000
10,580,000
2,202,000
40,341,000
100.070.0
20.4
11.1
6.4
7.2
18.4
5.6
1.97.2
8.0
1.2
22.7
.20,2748,026
2,918
1,400
761
184
1,318
955
4104,900
4,633
262
7,348
82.032.619.829.7
100.039.6
14.4
7.3
3.8
.9
8.5
4.7
2.024.2
22.9
1.3
36.2
$159,305,000 100.0144,119,000 90.5
44,713,000 28.1
13,207,000 8.3
9,130,000 6.7
10,900,000 8.8
42,045,000 27.0
18,678,000 11.7
4,647,000 2.913,656,000 8.6
10,757,000 8.8
2,899,000 1.8
1,530,000 1.0
17,7057,163
2;612
1,402
813
144
1,053
921
4184;423
4,195
228
8,119
70.328.517.624.3
100.040.5
14.8
7,g
3.5
.8
6.9
6.2
2.425.0
23.7
1.3
34.8
$123,517.000109,503,000
32,774,000
10,7o,000
8,843,000
8,531,000
38,294,000
9,403,000
4,904,00012,849,000
11,491,000
1,358,000
1,165,000
Type of properly
1984 1985 1968
Percent chango
1981 -1986 l 1985.1988Offenses
Number Percent
Property damage
Value Percent
Offenses
Number Percent
Propirty damage
Value Percent
Offenses
Number Percent
Properly damage
Value Percent Offenses
Value ofpropertydamage
Value ofproperty
Offenses damageTOTALTotal structural properly
ResidentialSingle occUpancy (houses,
townhouses, duplexes. etc.)Other (Apartments, tenements,
hotels, motels, etc.)Storage (hams, garages,
warehrcialouses, etc.).Comm e
Industrial, manufacturingOther (stores, restaurants,
offices, etc.)Community/public (churches, Jails,
schools hospitals, etc.)Other (oulbuiWi"-s. buildings
under conshdctlon, etc.)Total mobile property...-.
Motor vehicles (autos, trucks,buses, etc. )
Other Madre, recreationalvehicles, al arms, boats, etc.)
Other property ((crepe, timber,fences, etc.)
Rale per 100,000 populationTotal
Structural properlyMobile properlyOther property
19,4077,718
2,588
1,476
872
160
1,098
1,154
5714,585
4,279
306
7,104
76.730.117.927.7
100 009.8
13.3
7.8
3.5
.8
6.7
5.9
2.923.6
22.0
1.6
36.6
$153,317,000138,159,000
34,440,000
14,102,000
15,156,000
10,427,010
35,111,000
11,838,000
17,086,00013,929,000
12,237,000
1,892,000
1,230,000
100.090.1
22.5
9.2
9.9
8.8
22.9
7.7
11.19.1
8.0
1.1
.8
20,4557,954
2,031
1,500
759
165
1,221
1,132
6485,127
4,827
300
7,374
77.630.219.428.0
100.038.9
12.9
7.3
3.7
.3
8.0
5.5
2.725.1
23.6
1.5
36.0
$190,080,000 100.0172,851,000 90.9
47,540,000 26.0
17,561,000 9.2
12,673,000 6.7
21,188,000 11.1
48,877,000 24.6
23,180,000 12.2
4,033,000 2.115,933,000 8.4
14,198,000 7.6
1,735,000 .9
1,298,000 .7
19,7227,234
2,471
1,412
659
118
1,079
941
5545,720
6,424
296
6,768
73.126.821.225.1
100.036.7
12.6
7.2
3.3
.8
5.5
4.8
2.829.0
27.5
1.5
04.3
$1Pd,888,000148,746,000
29,548,000
22,844,000
11,585,000
7,133,000
30,816,000
36,309,000
8.712,00016,427,000
13,851,000
2,578,000
3,715,000
100 087.9
17.7
13.8
6.9
4.3
18.5
21.8
5.29.8
8.3
1.5
2.2
.19.6-20.1
-24.1
-24.5
-13.2
-49.6
-20.8
-18.2
29.16.6
7.5
-9.2
-33.0
I -27.9-28.3-4.5
-40.0
-5.918.1
-18.0
14.6
21.0
-44.1
-5.7
268.6
181.028.6
30.9
17.0
-90.8
-3.8 -12.2-9.1 -15.1
-6.1 -37.8
e.9 28.9
-13.2 -8.8
-28.5 -66.3
-11.8 -34.0
-16.9 66.8
1 5 116.011.3 3.1
,2.4 -2.4
-1.3 48.5
-8.2 186.7
-5.8-11.3
9.3-10.4
WO,: Dan amounts may not beano and parcan't may not add to tOO.O or to subtotats bacausa of mincing.Rates may not add to two total booboo of foundry.
160 1 -6 1
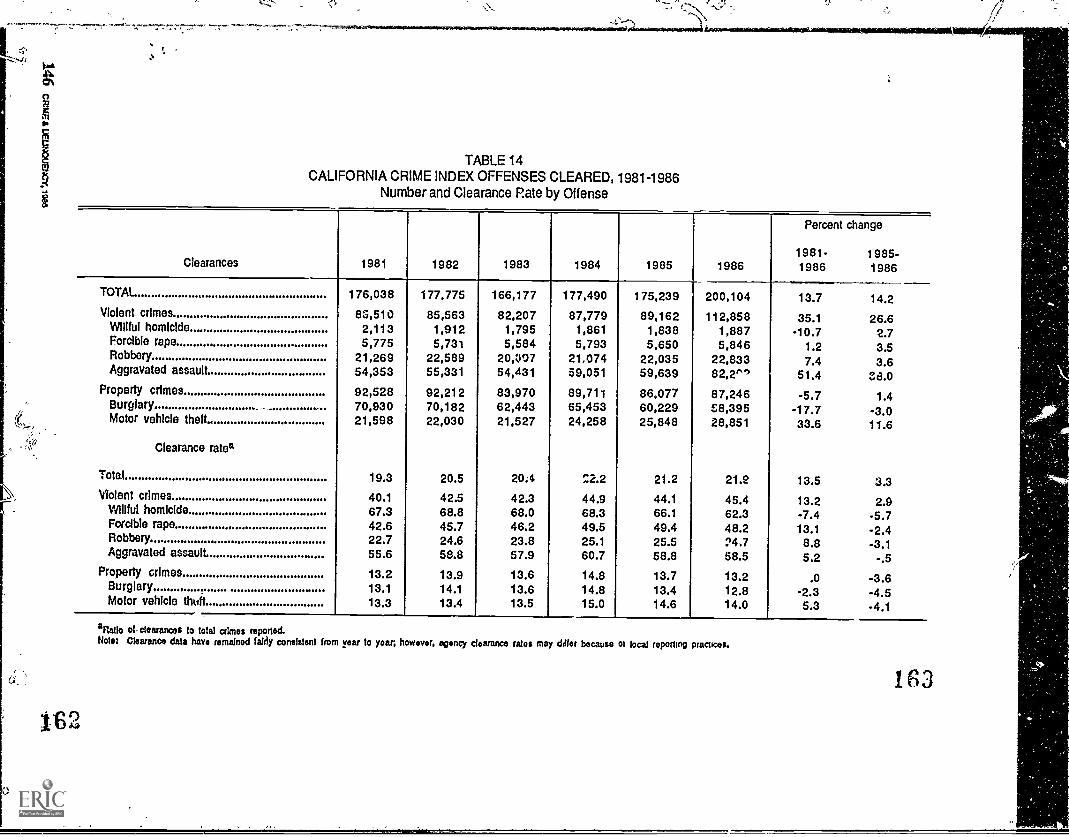
TABLE 14CALIFORNIA CRIME INDEX OFFENSES CLEARED, 1981-1986
Number and Clearance Rate by Offense
Clearances 1981 1982 1983 1984 1985 1986
Percent change
1981- 1985 -1986 1986
TOTAL 176,038 177,775 166,177 177,490 175,239 200,104 13.7 14.2Violent crimes 83,510 85,563 82,207 87,779 89,162 112,858 35.1 26.6
Willful homicide 2,113 1,912 1,795 1,861 1,838 1,887 -10.7 2.7Forcible rape 5,775 5,731 5,584 5,793 5,650 5,846 1.2 3.5Robbery 21,269 22,589 20,407 21,074 22,035 22,833 7.4 3.6Aggravated assault 54,353 55,331 54,431 59,051 59,639 82,2" 51.4 38.0
Property crImes 92,528 92,212 83,970 89,711 86,077 87,246 -5.7 1.4Burglary 70,930 70,182 62,443 65,453 60,229 58,395 -17.7 -3.0Motor vehicle theft 21,598 22,030 21,527 24,258 25,848 28,851 33.6 11.6
Clearance rates
Total 19.3 20.5 20.4 '..:2.2 21.2 21.e. 13.5 3.3Violent crimes 40.1 42.5 42.3 44.9 44.1 45.4 13.2 2.9
Willful homicide 67.3 68.8 68.0 68.3 66.1 62.3 -7.4 -5.7Forcible rape 42.6 45.7 46.2 49.5 49.4 48.2 13.1 -2.4Robbery 22.7 24.6 23.8 25.1 25.5 ?4,7 8.8 -3.1Aggravated assault. 55.6 58.8 57.9 60.7 58.8 58.5 5.2 -.5
Property crimes 13.2 13.9 13.6 14.8 13.7 13.2 .0 -3.6Burglary 13.1 14.1 13.6 14.8 13.4 12.8 -2.3 -4.5Motor vehicle thttlt 13.3 13.4 13.5 15.0 14.6 14.0 5.3 -4.1
anatto of- clearances to total climes reported.Note: Clearance data have remained Islay consistent from year to year, however, agency clearance rates may differ because of local reporting practices.
1f3
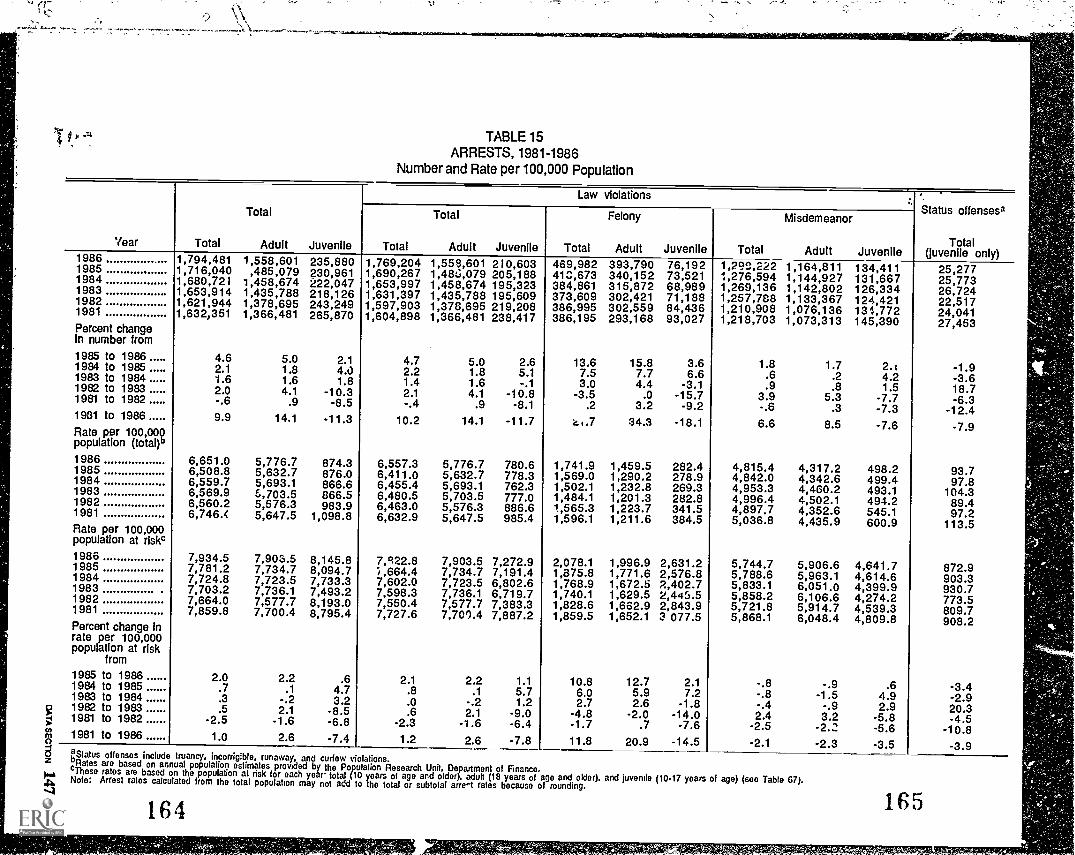
TABLE 15ARRESTS, 1981-1986
Number and Rate per 100,000 Population
Year Total
Total
Adult Juvenile
Law violationsStatus offensesa
Total(juvenile only)
Total
Total
Adult Juvenile Total
Felony
Adult Juvenile Total
Misdemeanor
Adult Juvenile1986 1,794,481 1,558,601 235,880 1,769,204 1,553,601 210,603 469,982 393,790 76,192 1,298,222 1,164,811 134,411 25,2771985 1,716,040 ,485,079 230,961 1,690,267 1,480,079 205,188 41C,673 340,152 73,521 1,276,594 1,144,927 131,667 25,7731984 1,680,721 1,458,674 222,047 1,653,997 1,458,674 195,323 384,861 315,872 68,989 1,269,136 1,142,802 126,334 26,7241983 1,653,914 1,435,788 218,126 1,631,397 1,435,788 195,609 373,609 302,421 71,188 1,257,788 1,133,367 124,421 22,5171982 1,621,944 1,378,695 243,249 1,597,903 1,378,695 219,208 386,995 302,559 84,436 1,210,908 1,076,136 131,772 24,0411981 1,632,351 1,366,481 265,870 1,604,898 1,366,481 238,417 386,195 293,168 93,027 1,218,703 1,073,313 145,390 27,453Percent changeIn number from1985 to 1986 4.6 5.0 2.1 4.7 5.0 2.6 13.6 15.8 3.6 1.8 1.7 2.t -1.91984 to 1985 2.1 1.8 4.0 2.2 1.8 5.1 7.5 7.7 6.6 .6 .2 4.2 -3.61983 to 1984 1.6 1.6 1.8 1.4 1.6 -.1 3.0 4.4 -3.1 .9 .8 1.5 18.71982 to 1983 2.0 4.1 -10.3 2.1 4.1 -10.8 -3.5 .0 -15.7 3.9 5.3 -7.7 -6.31981 to 1982 -.6 .9 -8.5 -.4 .9 -8.1 .2 3.2 -9.2 -.6 .3 -7.3 -12.41981 to 1986 9.9 14.1 -11.3 10.2 14.1 -11.7 .,.7 34.3 -18.1 6.6 8.5 -7.6 -7.9Rate per 100,00ppopulation (total) D
1986 6,651.0 5,776.7 874.3 6,557.3 5,776.7 780.6 1,741.9 1,459.5 282.4 4,815.4 4,317.2 498.2 93.71985 6,508.8 5,632.7 876.0 6,411.0 5,632.7 778.3 1,569.0 1,290.2 278.9 4,842.0 4,342.6 499.4 97.81984 6,559.7 5,693.1 866.6 6,455.4 5,693.1 762.3 1,502.1 1,232.8 269.3 4,953.3 4,460.2 493.1 104.31983 6,569.9 6,703.5 866.5 6,480.5 5,703.5 777.0 1,484.1 1,201.3 282.8 4,996.4 4,502.1 494.2 89.41982 6,560.2 5,576.3 983.9 6,463.0 5,576.3 886.6 1,565.3 1,223.7 341.5 4,897.7 4,352.6 545.1 97.21981 6,746.4 5,647.5 1,098.8 6,632.9 5,647.5 985.4 1,596.1 1,211.6 384.5 5,036.8 4,435.9 600.9 113.5Rate per 100,000population at risk°1986 7,934.5 7,903.5 8,145.8 7,322.8 7,903.5 7,272.9 2,078.1 1,996.9 2,631.2 5,744.7 5,906.6 4,641.7 872.91985 7,781.2 7,734.7 8,094.7 1,664.4 7,734.7 7,191.4 1,875.8 1,771.6 2,576.8 5,788.6 5,963.1 4,614.6 903.31984 7,724.8 7,723.5 7,733.3 7,602.0 7,723.5 6,802.6 1,768.9 1,672.5 2,402.7 5,833.1 6,051.0 4,399.9 930.71983 7,703.2 7,736.1 7,493.2 7,598.3 7,736.1 6,719.7 1,740.1 1,629.5 2,445.5 5,858.2 6,106.6 4,274.2 773.51982 7,664.0 7,577.7 8,193.0 7,550.4 7,577.7 7,383.3 1,828.6 1,662.9 2,843.9 5,721.8 5,914.7 4,539.3 809.71981 7,859.8 7,700.4 8,795.4 7,727.6 7,700.4 7,887.2 1,859.5 1,652.1 3 077.5 5,868.1 6,048.4 4,809.8 908.2Percent change inrate per 100,000population at risk
from
1985 to 1986 2.0 2.2 .6 2.1 2.2 1.1 10.8 12.7 2.1 -.8 -.9 .6 -3.41984 to 1985 .7 .1 4.7 .8 .1 5.7 6.0 5.9 7.2 -.8 -1.5 4.9 -2.91983 to 1984 .3 -.2 3.2 .0 -.2 1.2 2.7 2.6 -1.8 -.4 -.9 2.9 20.31982 to 1983 .5 2.1 -8.5 .6 2.1 -9.0 -4.8 -2.0 -14.0 2.4 3.2 -5.8 -4.51981 to 1982 -2.5 -1.6 -6.8 -2.3 -1.6 -6.4 -1.7 .7 -7.6 -2.5 -2.2 -5.6 -10.81981 to 1986 1.0 2.6 -7.4 1.2 2.6 -7.8 11.8 20.9 -14.5 -2.1 -2.3 -3.5 -3.9gStatus offenses include truancy, incorrigible, runaway, and curfew v'olations..Rates are based on annual population estimates provided by the Population Research Unit, Department of Finance.'These rates are based on the population at risk for each year total ( 0 years of age and older), adult (18 years of age and older), and juvenile (10.17 years of age) (soo Table 67).Note: Arrest rates calculated from the total population may not add a the total or subtotal arrel rates because of rounding.
164 165
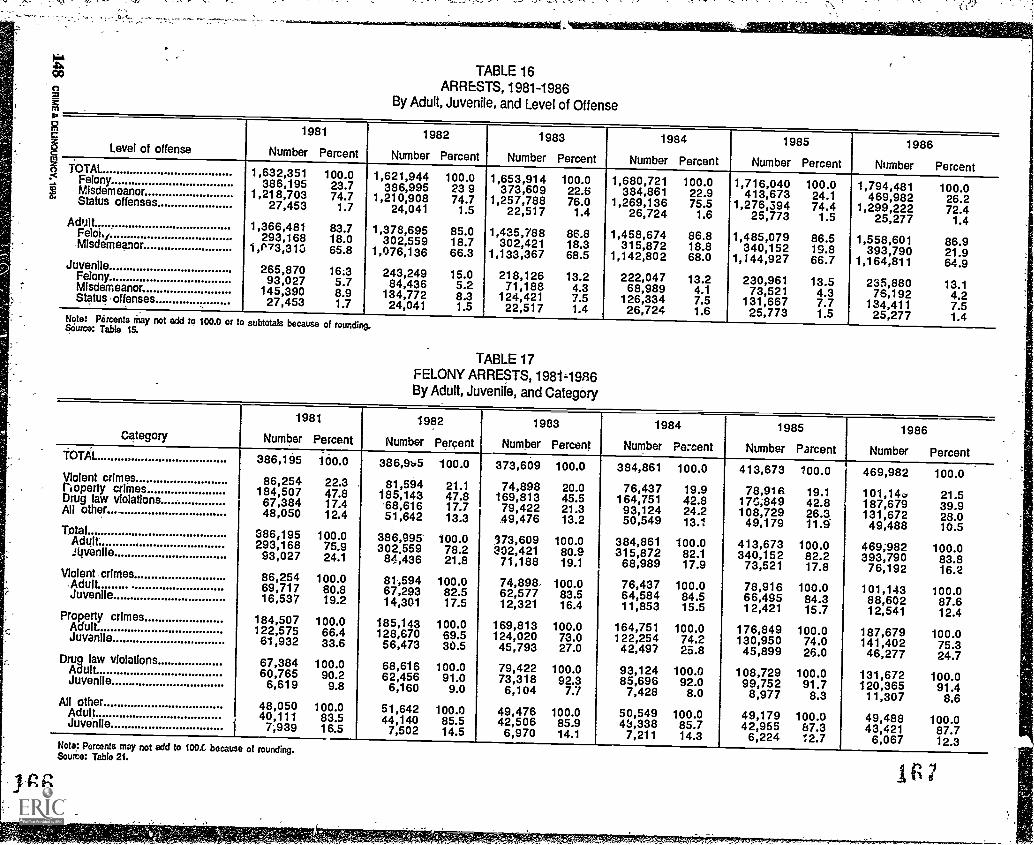
0arein
;*
TABLE 16ARRESTS, 1981-1986
By Adult, Juvenile, and Level of Offense
Level of offense
1981
Number Percent
1982
Number Percent
1983
Number Percent
1984
Number Percent
1985
Number Percent
1986
Number PercentTOTAL 1,632,351 100.0 1,621,944 100.0 1,653,914 100.0 1,680,721 100.0 1,716,040 100.0 1,794,481 100.0Felony 386,195 23.7 386,995 23 9 373,609 22.6 384,861 22.9 413,673 24.1 469,982 26.2Misdemeanor 1,218,703 74.7 1,210,908 74.7 1,257,788 76.0 1,269,136 75.5 1,276,394 74.4 1,299,222 72.4Status offenses 27,453 1.7 24,041 1.5 22,517 1.4 26,724 1.6 25,773 1.5 25,277 1.4Adult 1,366,481 83.7 1,378,695 85.0 1,435,788 86.8 1,458,674 86.8 1,485,079 86.5 1,558,601 86.9Fe loi,1 293,168 18.0 302,559 18.7 302,421 18.3 315,872 18.8 340,152 19.8 393,790 21.9Misdemeanor 1,P73,313 65.8 1,076,136 66.3 1,133,367 68.5 1,142,802 68.0 1,144,927 66.7 1,164,811 64.9Juvenile 265,870 16.3 243,249 15.0 218,126 13.2 222,047 13.2 230,961 13.5 235,880 13.1Felony 93,027 5.7 84,436 5.2 71,188 4.3 68,989 4.1 73,521 4.3 76,192 4.2Misdemeanor 145,390 8.9 134,772 8.3 124,421 7.5 126,334 7.5 131,667 7.7 134,411 7.5Status offenses 27,453 1.7 24,041 1.5 22,517 1.4 26,724 1.6 25,773 1.5 25,277 1.4Note: Percents may not add to 100.0 or to subtotals because of rounding.Seurce: Table 15.
TABLE 17FELONY ARRESTS, 1981-1986By Adult, Juvenile, and Category
category
1981
Number Percent
1982
Number Percent
1983
Number Percent
1984
Number Percent
1985
Number Percent
1986
Number PercentTOTAL 386,195 100.0 386,9b5 100.0 373,609 100.0 384,861 100.0 413,673 100.0 469,982 100.0Violent crimesnoperty crimes 86,254
184,50722.347.8
81,594185,143
21.147.8
74,898169,813
20.045.5
76,437164,751
19.942.8
78,91817G;849
19.142.8
101,14,187,679
21.539.9Drug law violations 67,384 17.4 68,616 17.7 79,422 21.3 93,124 24.2 108,729 26.3 131,672 28.0All other.. 48,050 12.4 51,642 13.3 49,476 13.2 50,549 13.1 49,179 11.1 49,488 10.5Total 386,195 100.0 386,995 i00.0 373,609 100.0 384,861 100.0 413,673 100.0 469;982 100.0
Adult 293,168 75.9 302.559 78.2 332,421 80.9 315,872 82.1 340,152 82.2 393,790 83.8Jtpienlle 93,027 24.1 84,436 21.8 71,188 19.1 68,989 17.9 73,521 17.8 76,192 16.2Violent crimes 86,254 100.0 81,594 100.0 74,898 100.0 76,437 100.0 78,916 100.0 101,143 100.0Adult 69,717 80.8 67,293 82.5 62,577 83.5 64,584 84.5 66,495 84.3 88,602 87.6Juvenile 16,537 19.2 14,301 17.5 12,321 16.4 11,853 15.5 12,421 15.7 12,541 12AProperty crimes 184,507 100.0 185,143 100.0 169,813 100.0 164,751 100.0 176,849 100.0 187,679 100.0Adult 122,575 66.4 128,670 69.5 124,020 73.0 122,254 74.2 130,950 74.0 141,402 75.3Juvenile 61,932 33.6 56,473 30.5 45,793 27.0 42,497 25.8 45,899 26.0 46,277 24.7law violations 67,384 100.0 68,616 100.0 79,422 100.0 93,124 100.0 108,729 100.0 131,672 100.060,765 90.2 62,456 91.0 73,318 92.3 85,696 92.0 99,752 91.7 120,365 91.4Juvenile 6,619 9.8 6,160 9.0 6,104 7.7 7,428 8.0 8,977 8.3 11,307 8.6All other 48,050 100.0 51,642 100.0 49,476 100.0 50,549 100.0 49,179 100.0 49,488 100.0Adult 40,111 83.5 44,140 85.5 42,506 85.9 48,338 85.7 42,955 87.3 43,421 87.7Juvenile 7,939 16.5 7,502 14.5 6,970 14.1 7,211 14.3 6,224 12.7 6,067 12.3Note: Percents may not add to 100.0 because of rounding.
Source: Table 21.
166
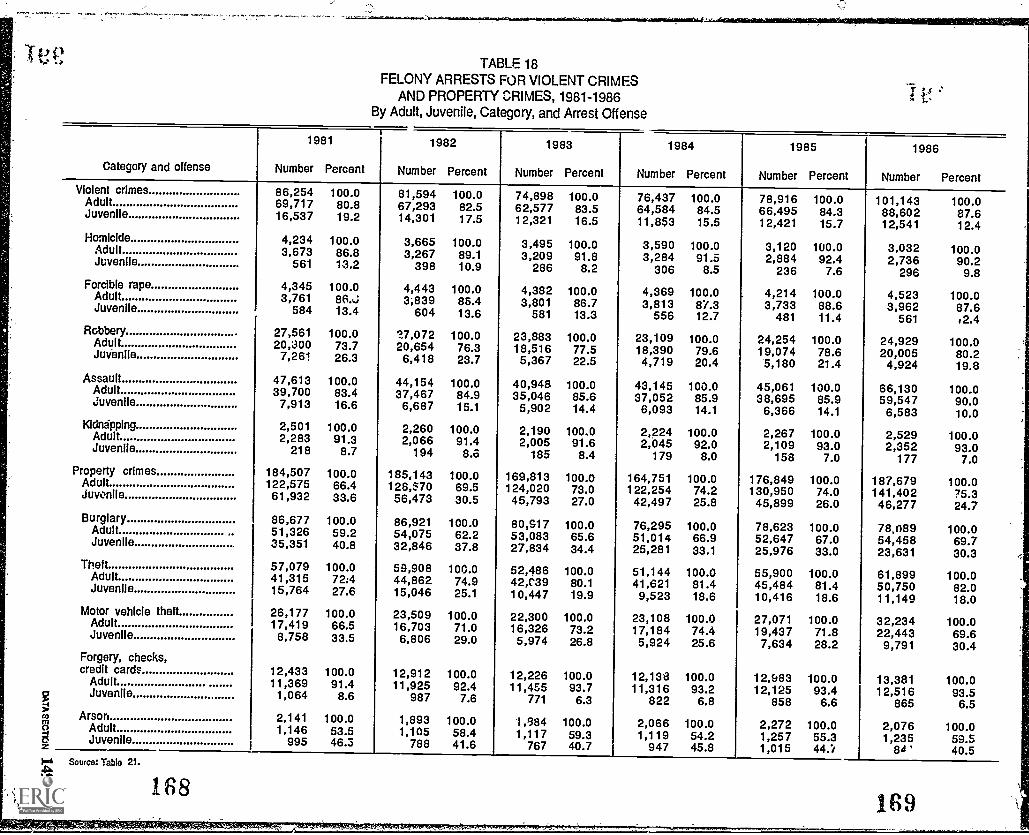
TABLE 18FELONY ARRESTS FOR VIOLENT CRIMES
AND PROPERTY CRIMES, 1981-1986By Adult, Juvenile, Category, and Arrest Offense
Category and offense
1981
Number Percent
1982
Number Percent
1983
Number Percent
1984
Number Percent
1985
Number Percent
1986
Number PercentViolent crimes 86,254 100.0 81,594 100.0 74,898 100.0 76,437 100.0 78,916 100.0 101,143 100.0Adult 69,717 80.8 67,293 82.5 62,577 83.5 64,584 84.5 66,495 84.3 88,602 87.6Juvenile 16,537 19.2 14,301 17.5 12,321 16.5 11,853 15.5 12,421 15.7 12,541 12.4
Homicide 4,234 100.0 3,665 100.0 3,495 100.0 3,590 100.0 3,120 100.0 3,032 100.0Adult 3,673 86.8 3,267 89.1 3,209 91.8 3,284 91.5 2,884 92.4 2,736 90.2Juvenile 561 13.2 398 10.9 286 8.2 306 8.5 236 7.6 296 9.8Forcible rape 4,345 100.0 4,443 100.0 4,382 100.0 4,369 100.0 . 4,214 100.0 4,523 100.0Adult 3,761 86.,.; 3,839 86.4 3,801 86.7 3,813 87.3 3,733 88.6 3,962 87.6Juvenile 584 13.4 604 13.6 581 13.3 556 12.7 481 11.4 561 .2.4Rcbbery 27,561 100.0 '17,072 100.0 23,883 100.0 23,109 100.0 24,254 100.0 24,929 100.0Adult 20,300 73.7 20,654 76.3 18,516 77.5 18,390 79.6 19,074 78.6 20,005 80.2Juvenile 7,261 26.3 6,418 23.7 5,367 22.5 4,719 20.4 5,180 21.4 4,924 19.8Assault 47,613 100.0 44,154 100.0 40,948 100.0 43,145 100.0 45,061 100.0 66,130 100.0Adult 39,700 83.4 37,467 84.9 35,046 85.6 37,052 85.9 38,695 85.9 59,547 90.0Juvenile 7,913 16.6 6,687 15.1 5,902 14.4 6,093 14.1 6,366 14.1 6,583 10.0KidndppIng 2,501 100.0 2,260 100.0 2,190 100.0 2,224 100.0 2,267 100.0 2,529 100.0Adult 2,283 91.3 2,066 91.4 2,005 91.6 2,045 92.0 2,109 93.0 2,352 93.0Juvenile 218 8.7 194 8.6 185 8.4 179 8.0 158 7.0 177 7.0
Property crimes 184,507 100.0 185,143 100.0 169,813 100.0 164,751 100.0 176,849 100.0 187,679 100.0Adult 122,575 66.4 128,670 69.5 124,020 73.0 122,254 74.2 130,950 74.0 141,402 75.3Juvenile 61,932 33.6 56,473 30.5 45,793 27.0 42,497 25.8 45,899 26.0 46,277 24.7Burglary 86,677 100.0 86,921 100.0 80,917 100.0 76,295 100.0 78,623 100.0 78,089 100.0Adult 51,326 59.2 54,075 62.2 53,083 65.6 51,014 66.9 52,647 67.0 54,458 69.7Juvenile 35,351 40.8 32,846 37.8 27,834 34.4 25,281 33.1 25,976 33.0 23,631 30.3Theft 57,079 100.0 59,908 100.0 52,486 100.0 51,144 100.0 55,900 100.0 61,899 100.0Adult 41,315 72:4 44,862 74.9 42,09 80.1 41,621 81.4 45,484 81.4 50,750 82.0Juvenile 15,764 27.6 15,046 25.1 10,447 19.9 9,523 18.6 10,416 18.6 11,149 18.0Motor vehicle theft 26,177 100.0 23,509 100.0 22,300 100.0 23,108 100.0 27,071 100.0 32,234 100.0Adult 17,419 66.5 16,703 71.0 16,326 73.2 17,184 74.4 19,437 71.8 22,443 69.6Juvenile 8,758 33.5 6,806 29.0 5,974 26.8 5,924 25.6 7,634 28.2 9,791 30.4Forgery, checks,credit cards 12,433 100.0 12,912 100.0 12,226 100.0 12,138 100.0 12,583 100.0 13,381 100.0Adult 11,369 91.4 11,925 92.4 11,455 93.7 11,316 93.2 12,125 93.4 12,516 93.5Juvenile 1,064 8.6 987 7.6 771 6.3 822 6.8 858 6.6 865 6.5Arson 2,141 100.0 1,893 100.0 1,884 100.0 2,066 100.0 2,272 100.0 2,076 100.0Adult 1,146 53.5 1,105 58.4 1,117 59.3 1,119 54.2 1,257 55.3 1,235 59.5Juvenile 995 46.3 788 41.6 767 40.7 947 45.8 1,015 44.7 84 ' 40.5
Source: Table 21.
169

TABLE 19FELONY ARRESTS, 1986By Category and Offense
Category and offense Number Percent
TOTAL 469,982
Violent crimes 101,143 100.0Homicide 3,032 3.0Forcible rape 4,523 4.5Robbery 24,929 24.6Assault 66,130 65.4Kidnapping 2,529 2.5
Properly crimes 187,679 100.0Burglary 78,089 41.6Theft 61,899 33.0Motor vehicle theft 32,234 17.2Forgery, checks, credit cards 13,381 7.1Arson 2,076 1.1
Drug law violations 131,672 100.0Narcotics 80,256 61.0Marijuana 19,938 15.1Dangerous drugs 29,915 22.7Other 1,563 1.2
All other 49,488 100.0
-Source: Table 21.
TABLE 20FELONY DRUG LAW VIOLATION ARRESTS, 1986
By Adult, Juvenile and Arrest Offense
Offense Number Percent
TOTAL 131,672 100.0Adult 120,365 91.4Juvenile 11,307 8.6
Narcotics 80,256 100.0Adult 73,640 91.8Juvenile 6,616 8.2
Marijuana 19,938 100.0Adult 17,367 87.1Juvenile 2,571 12.9
Dangerous drugs 29,915 100.0Adult 27,883 93.2Juvenile 2,032 6.8
Other 1,563 100.0Adult 1,475 9$.4Juvenile 88 5.6
Source: Table 21.

Year
Total
Juve-Total Adult vile
198619851984198319821981
Percent changehi number from
1985 to 19861984 to 1985. .... .1983 to 19841982 to 19831981 to 1982
1981 to 1986
Rate per 100,000population at risk*
198619851984198319821981
Percent changeIn rate from
1985 to 19861984 to 19851983 to 19841982 to 19831981 to 1982
1981 to 1986
to
TABLE 21FELONY ARRESTS, 1981-1986
Number and Rate per 100,000 Population at Risk
Violent crimes
469,982 393,790 76,192413,673 340,152 73,521384,861 315,872 68,989373,609 302,421 71,188386;995 302,559 84,436386,195 293,168 93,027
13.6 15.8 3.67.5 7.7 6.63.0 4.4 -3.1
-3.5 .0 -15.7.2 3.2 -9.2
21.7 34.3 -18.1
2,078.1 1,996.9 2,631.21,875.8 1,771.6 2,576.81,768.9 1,672.5 2,402.71,740.1 1,629.5 2,445.51,828.6 1,662.9 2,843.91,859.5 1,652.1 3,077.5
10.8 12.7 2.16.0 5.9 7.21.7 2.6 -,.8
-4.8 -2.0 -14.0-1.7 .7 -7.6
11.8 20.9 -14.5
171
Total
Total
AdultJuve-
nile Total
Homicide
AdultJuve-
nile
Forcible rape
Juve-Total Adult nile Total
Robbery
Adult'uve-nile Total
Assault
AdultJuve-
nile Total
Kidnapping
AdultJuve-nile
101,143 88,602 12,541 3,032 2,736 296 4,523 3,962 561 '4,929 20,005 4,924 66,130 59,547 6,583 2,529 2,352 17778,916 66,495 12,421 3,120 2,884 236 4,214 3,733 481 4,254 19,074 5,180 45,061 38,695 6,366 2,267 2,109 15876,437 54,584 11,853 3,590 3,284 306 4,369 3,813 556 23,109 18,390 4,719 43,145 37,052 6,093 2,224 2,045 17974,898 62,577 12,321 3,495 3,209 286 4,382 3,801 581 :0,883 18,516 5,367 40,948 35,046 5,902 2,190 2,005 18581,594 67,293 14,301 3,665 3,267 398 4,443 3,839 604 27,072 20,654 6,418 44,154 37,467 6,687 2,260 2,066 19486,254 69,717 16,537 4,234 3,673 561 4,345 3,761 584 27,561 20,300 7,261 47,613 39,700 7,913 2,501 2,283 218
28.2 33.2 1.0 -2.8 -5.1 25.4 7.3 6.1 16.6 2.8 4.9 -4.9 46.8 53.9 3.4 11.6 11.5 12.03.2 3.0 4.8 -13.1 -12.2 -22.9 -3.5 -2.1 -13.5 5.0 3.7 9.8 4.4 4.4 4.5 1.9 3.1 -11.72.1 3.2 -3.8 2.7 2.3 7.0 -.3 .3 -4.3 -3.2 -.7 -12.1 5.4 5.7 3.2 1.6 2.0 -3.2-8.2 -7.0 -13.8 -4.6 -1.8 -28.1 -1.4 -1.0 -3.8 -11.8 -10.4 -16.4 -7.3 -6.5 -11.7 -3.1 -3.0 -4.6
-5.4 -3.5 -13.5 -13.4 -11.1 -29.1 2.3 2.1 3.4 -1.8 1.7 -11.6 -7.3 -5.6 -15.5 -9.6 -9.5 11.017.3 27.1 -24.2 -28.4 -25.5 -47.2 4.1 5.3 -3.9 -9.5 -1.5 -32.2 38.9 50.0 -16.8 1.1 3.0 -18.8
447.2 449.3 433.1 13.4 13.9 10.2 20.0 20 19.4 110.2 101.4 170.0 292.4 302.0 227.3 11.2 11.9 6.1357.8 346.3 435.3 14.1 15.0 8.3 19.1 19.4 16.9 110.0 99.3 181.5 204.3 201.5 223.1 10.3 11.0 5.5351.3 342.0 412.8 16.5 17.4 10.7 20.1 20.2 19.4 106.2 97.4 164.3 198.3 196.2 212.2 10.2 10.8 6.2348.3 337.2 423.3 16.3 17.3 9.8 20.4 20.5 20.0 111.2 99.8 184.4 190.7 188.8 202.8 10.2 10.8 6.4385.5 369.9 481.7 17.3 18.0 13.4 21.0 21.1 20.3 127.9 113.5 216.2 208.6 205.9 225.2 10.7 11.4 6.5415.3 392.9 547.1 20.4 20.7 18.6 20.9 21.2 19.3 132.7 114.4 240.2 229.3 223.7 261.8 12.0 12.9 7.2
25.0 29.7 -.5 -5.0 -7.3 22.9 4.7 3.6 44.8 .2 2.1 -6.3 43.1 49.9 1.9 8.7 8.2 10.91.9 1.3 5.5 -14.5 -13.8 -22.4 -5.0 -4.0 - 2.9 3.6 2.0 10.5 3.0 2.7 5.1 1.0 1.9 -11.3
.7 1.4 -2.5 1.2 .6 9.2 -1.5 -1.5 -3.0 -4.5 -2.4 -10.9 4.0 3.9 4.6 .0 .0 -3.1-3.5 -8.8 -12.1 -5.8 -3.9 -26.9 -2.9 -2.8 -1.5 -13.1 -12.1 -14.7 -8.6 -8.3 -9.9 -4.7 -5.3 -1.5-7.2 -5.9 -12.0 -15.2 -13.0 -28.0 .5 -.5 5.2 -3.6 -.8 -10.0 -9.0 -8.0 -14.0 -10.8 -11.6 -9.77.7 14.4 -20.8 -34.3 -3c Q -45.2 -4.3 -5.2 .5 -17.0 -11.4 -29.2 27.5 35.0 -13.2 -6.7 -7.8 -15.3
172
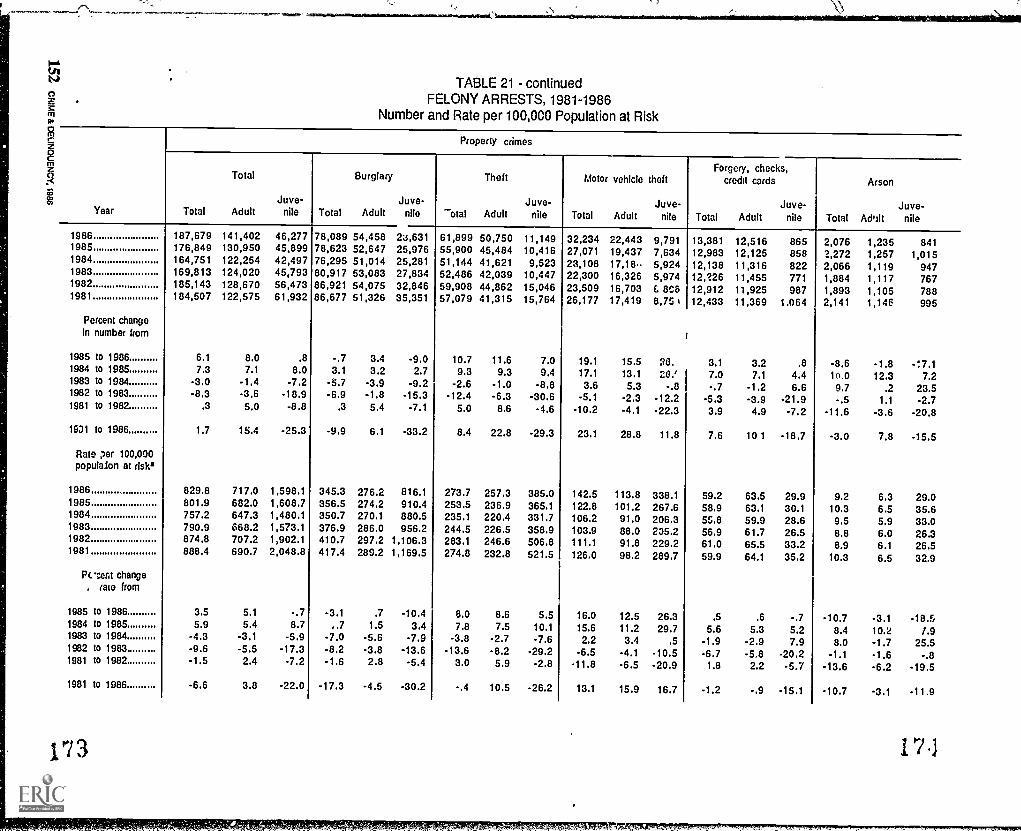
0
m
TABLE 21 - continuedFELONY ARRESTS, 1981-1986
Number and Rate per 100,000 Population at Risk
Property crimes
.7
inYear Total
Total
AdultJuve-
nile Total
Burglary
AdultJuve-
nile -otal
Theft
AdultJuve-
nile
Motor vehicle theft
JuveTotal Adult nile
Forgery, checks,credit cards
JuveTotal Adult nile Total
Arson
Ad'iltJuve-
nile
1986 187,679 141,402 46,277 78,089 54,458 2s,631 61,899 50,750 11,149 32,234 22,443 9,791 13,381 12,516 865 2,076 1,235 8411985 176,849 130,950 45,899 78,623 52,647 25,976 55,900 45,484 10,416 27,071 19,437 7,634 12,983 12,125 858 2,272 1,257 1,0151984 164,751 122,254 42,497 76,295 51,014 25,281 51,144 41,621 9,523 23,108 17,18, 5,924 12,138 11,316 822 2,066 1,119 9471983 169,813 124,020 45,793 80,917 53,083 27,834 52,486 42,039 10,447 22,300 16,326 5,974 12,?26 11,455 771 1,884 1,117 7671982 185,143 128,670 56,473 86,921 54,075 32,846 59,908 44,862 15,046 23,509 16,703 8C& 12,912 11,925 987 1,893 1,105 7881981 184,507 122,575 61,932 86,677 51,326 35,351 57,079 41,315 15,764 26,177 17,419 8,75 12,433 11,369 1.064 2,141 1,146 995
Percent changeIn number from
1985 to 1986 6.1 8.0 .8 -.7 3.4 -9.0 10.7 11.6 7.0 19.1 15.5 28.. 3.1 3.2 .8 -8.6 -1.8 -17.11984 to 1985 7.3 7.1 8.0 3.1 3.2 2.7 9.3 9.3 9.4 17.1 13.1 28.t 7.0 7.1 4.4 10.0 12.3 7.21983 to 1984 -3.0 -1.4 -7.2 -5.7 -3.9 -9.2 -2.6 -1.0 -8.8 3.6 5.3 -.8 -.7 -1.2 6.6 9.7 .2 23.51982 to 1983 -8.3 -3.6 -18.9 -6.9 -1.8 -15.3 -12.4 -6.3 -30.6 -5.1 -2.3 -12.2 -5.3 -3.9 -21.9 -.5 1.1 -2.71981 to 1982 .3 5.0 -8.8 .3 5.4 -7.1 5.0 8.6 -4.6 -10.2 -4.1 -22.3 3.9 4.9 -7.2 -11.6 -3.6 -20.8
1931 to 1986 1.7 15.4 -25.3 -9.9 6.1 -33.2 8.4 22.8 -29.3 23.1 28.8 11.8 7.6 10 1 -18.7 1 -3.0 7.8 -15.5
Rate per 100,000populdon at risk'
1986 829.8 717.0 1,598.1 345.3 276.2 816.1 273.7 257.3 385.0 142.5 113.8 338.1 59.2 63.5 29.9 9.2 6.3 29.01985 801.9 682.0 1,608.7 356.5 274.2 910.4 253.5 236.9 365.1 122.8 101.2 267.6 58.9 63.1 30.1 10.3 6.5 35.619841983
757.2790.9
647.3368.2
1,480.11,573.1
350.7376.9
270.1286.0
880.5956.2
235.1244.5
220.4226.5
331.7358.9
106.2103.9
91.088.0
206.3235.2
55.856.9
59.961.7
28.626.5
9.58.8 56.90 3236..031982 874.8 707.2 1,902.1 410.7 297.2 1,106.3 283,1 246.6 506.8 111.1 91.8 229.2 61.0 65.5 33.2 8.9 6.1 26.51981 888.4 690.7 2,048.8 417.4 289.2 1,169.5 274.8 232.8 521.5 126.0 98.2 289.7 59.9 64.1 35.2 10.3 6.5 32.9
Pccerd change. rate from
1985 to 1986 3.5 5.1 -.7 -3.1 .7 -10.4 8.0 8.6 5.5 16.0 12.5 26.3 .5 .6 -.7 -10.7 -3.1 -18.51984 to 1985 5.9 5.4 8.7 ..7 1.5 3.4 7.8 7.5 10.1 15.6 11.2 29.7 5.6 5.3 5.2 8.4 10.2 1.91983 to 1984 -4.3 -3.1 -5.9 -7.0 -5.6 -7.9 -3.8 -2.7 -7.6 2.2 3.4 .5 -1.9 -2.9 7.9 8.0 -1.7 25.51982 to 1983 -9.6 -5.5 -17.3 -8.2 -3.8 -13.6 -13.6 -8.2 -29.2 -6.5 -4.1 -10.5 -6.7 -5.8 -20.2 -1.1 -1.6 -.81981 to 1982 -1.5 2.4 -7.2 -1.6 2.8 -5.4 3.0 5.9 -2.8 -11.8 -6.5 -20.9 1.8 2.2 -5.7 -13.6 -6.2 -19.5
1981 to 1986 -6.6 3.8 -22.0 -17.3 -4.5 -30.2 -.4 10.5 -26.2 13.1 15.9 16.7 -1.2 -.9 -15.1 -10.7 -3.1 -11.9
rl 3 17.3

TABLE 21 continuedFELONY ARRESTS, 1981-1986
Number and Rate per 100,000 Population at Risk
Year
Drug law violations
Total
Total
AdultJuve-
nile Total
Parcotics
AdultJuve-nlle Total
Marijuana
AdultJuve-nile
Dangerous drugs
Juve-Total Adult nile Total
Otherb
AdultJuve-
nee
1986 131,672 120,365 11,307 80,256 73,640 6,616 19,938 17,367 2,571 29.915 27,883 2,032 1,563 1,475 881985 108,729 99,752 8,977 55,155 51,687 3,468 24,182 20,784 3,398 28,139 26,106 2,033 1,253 1,175 781984 93,124 85,696 7,428 42,479 40,430 2,049 21,350 18,020 3,330 27,820 25,892 1,928 1,475 1,354 1211983 79,422 73,318 6,104 31,588 C0,373 1,215 19,920 17,074 2,846 25,302 23,491 1,811 2,612 2,380 2321982 88,616 62,456 6,160 25,540 24,255 1,285 20,737 17,517 3,220 21,005 19,492 1,513 1,334 1,192 1421981 67,384 60,765 6,619 26,090 24,707 1,383 20,771 17,143 3,628 ,18,900 17,455 1,445 1,623 1,460 163
Percent changeIn number from
198a to 1986 21.1 20.7 26.0 45.5 42.5 90.8 -17.6 -16.4 -24.3 6.3 6.8 .0 24.7 25.5 12.81984 to 1985 16.8 16.4 20.9 29.8 27.8 69.3 13.3 15.3 2.0 1.1 .8 5.4 -15.1 -13.2 -35.51983 to 1984 17.3 16.9 21.7 34.5 33.1 68.6 7.2 5.5 17.0 10.0 10.2 6.5 -43.5 -43.1 -47.81982 to 1983 15.7 17.4 -.9 23.7 25.2 -5.4 -3.9 -2.5 -11.6 20.5 20.5 19 7 95.8 99.7 63.41981 to 1982 1.8 2.8 -6 9 -2.1 -1.8 -7.1 -.2 2.2 -11.2 11.1 11.7 4.7 17.0 -13.4 -12.91981 to 1986 95.4 98.1 70.8 207.6 198.1 378.4 -4.0 1.3 -29.1 58.3 59.7 40.6 -3.7 1.0 -46.0
Rate per 100,000population at risk'
1986 582.2 610.4 390.5 354.9 373.4 228.5 88.2 88.1 98.8 132.3 141.4 70.2 6.9 7.5 3.01985 493.0 519.5 314.6 250.1 269.2 121.5 109.7 108.2 119.1 127.6 136.0 71.3 5.7 6.1 2.71984 428.0 453.8 258.7 195.2 214.1 71.' 98.1 95.4 116.0 127.9 137.1 67.1 6.8 7.2 4.21983 369.9 395.0 209.7 147.1 163.7 41.7 92.8 92.0 97.8 117.8 126.6 62.2 12.2 12.8 8.01982 324.2 343.3 207.5 120.7 133.3 43.3 98.0 96.3 108.5 99.3 107.1 51.0 6.3 6.6 4.81981 324.5 342.4 219.0 125.6 139.2 45.8 100.0 96.6 120.0 91.0 98.4 47.8 7.8 8.2 5.4
Percent changeIn rate from
1985 to 1986 18.1 17.5 24.1 41.9 38.7 88.1 -19.6 -18.6 -25.4 3,7 4.0 -1.5 21.1 23.0 11.11984 to 1985 15.2 14.5 21.6 28.1 25.7 70.2 11.8 13.4 2.7 -.2 -.8 6.3 -16.2 -15.3 -35.71983 to 1984 15.7 14.9 23.4 32.7 30.8 71.2 5.7 3.7 18.6 8.6 8.3 7.9 -44.3 -43.8 -47.51982 to 1983 14.1 15.1 1.1 21.9 22.8 -3.7 -5.3 -4.5 -9.9 18.6 18.2 22.0 93.6 93.9 66.71981 to 1982 -.1 ,3 -5.3 -3.9 -4.2 -5.5 -2.0 -.3 -9.6 9.1 8.8 6.7 -19.2 -19.5 -11,11981 to 1986 /9.4 78,3 78.3 182.6 168.2 398.9 -11.3 -8.8 -26.0 45.4 43.7 46.9 11.5 -8.5 -44.4
these rates are based on the poputtfon it risk tor each year. total (tO years of rig, and olir), adult (18 virus of age and and juvenile (10.17 years of ago) (sae 74.0. 67).bAgency reporting problems account for almost all of the increase ,cordd in 1083.
175
All other
Juve-Total Adult rule
49,488 43,42149,179 42,95550,549 43.33849,476 42,50651,642 44,14048.050 40,111
6,0676.2247,2116,9707,5027,939
.6 t.1 -2.5-2.7 -.9 13.72.2 2.0 3.5
-4.2 -3.7 -7.17.5 10.0 .5.5
3.0 8.3 -23.6
218.8 220.2 209.5223.0 223.7 218.1232.3 229.5 251.1230.4 229.0 239.4244.0 242.6 252.7231.4 226.0 262.6
-1.9 -1.6 -3.9-4.0 -2.5 -13.1
.8 .2 4.9-5.6 -5.6 -5.35.4 7.3 -3.8
-5,4 -2.6 -20.2
176
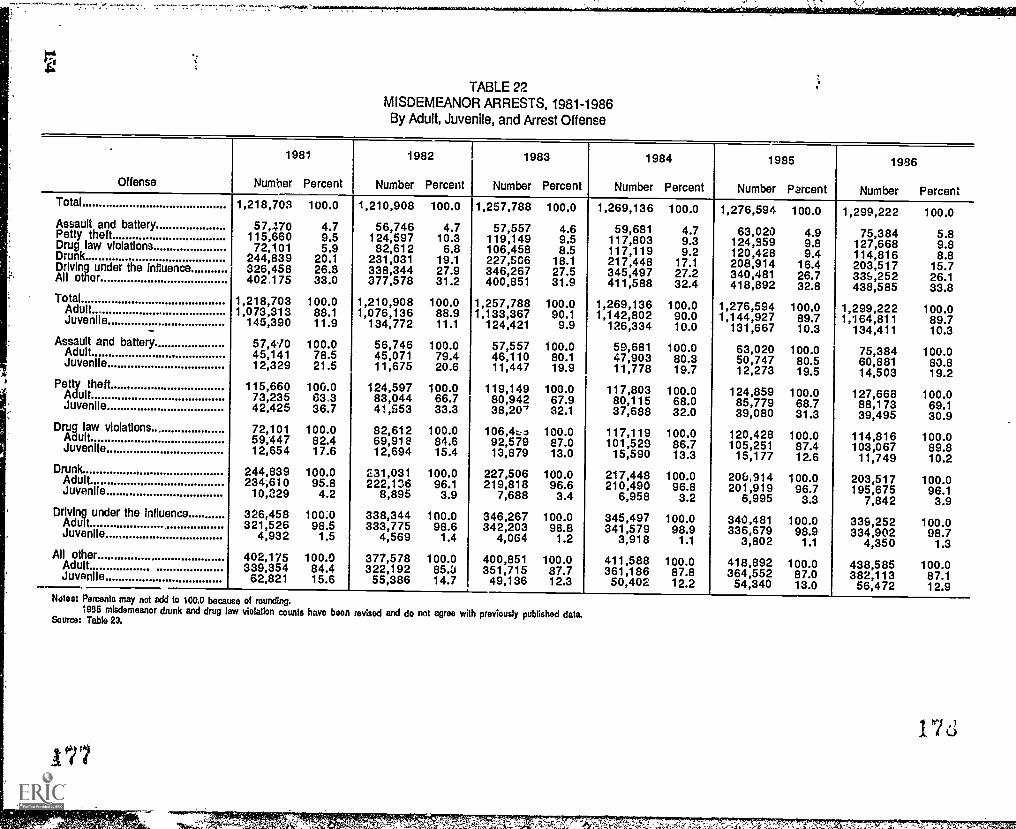
Total
Assault and batteryPetty theftDrug law violationsDrunkDriving under the InfluenceAll other
TotalAdultJuvenile
Assault and batteryAdultJuvenile
Pettyult
theftAdJuvenile
Drug law violations..AltJuvenile
DrunkAdultJuvenile
Driving under the InfluenceAdultJuvenile
All otherAdultJuvenile
TABLE 22MISDEMEANOR ARRESTS, 1981-1986By Adult, Juvenile, and Arrest Offense
1981
Number Percent
1982
Number Percent
1983
Number Percent
1984
Number Percent
1985
Number Percent
1986
Number Percent1,218,703 100.0 1,210,908 100.0 1,257,788 100.0 1,269,136 100.0 1,276,594 100.0 1,299,222 100.0
57,470 4.7 56,746 4.7 57,557 4.6 59,681 4.7 63,020 4.9 75,384 5.8115,660 9.5 124,597 10.3 119,149 9.5 117,803 9.3 124,359 9.8 127,668 9.872,101 5.9 82,612 6.8 106,458 8.5 117,119 9.2 120,428 9.4 114,816 8.8244,839 20.1 231,031 19.1 227,506 18.1 217,448 17.1 208,914 16.4 203,517 15.7326,458 26.8 338,344 27.9 346,267 27.5 345,497 27.2 340,481 26.7 336,252 26.1402.175 33.0 377,578 31.2 400,851 31.9 411,588 32.4 418,892 32.8 438,585 33.81,218,703 100.0 1,210,908 100.0 1,257,788 100.0 1,269,136 100.0 1,276,594 100.0 1,299,222 100.01,073,313 88.1 1,076,136 88.9 1,133,367 90.1 1,142,802 90.0 1,144,927 89.7 1,164,811 89.7145,390 11.9 134,772 11.1 124,421 9.9 126,334 10.0 131,667 10.3 134,411 10.3
57,4-70 100.0 56,746 100.0 57,557 100.0 59,681 100.0 63,020 100.0 75,384 100.045,141 78.5 45,071 79.4 46,110 80.1 47,903 80.3 50,747 80.5 60,881 83.812,329 21.5 11,675 20.6 11,447 19.9 11,778 19.7 12,273 19.5 14,503 19.2115,660 100.0 124,597 100.0 119,149 100.0 117,803 100.0 124,859 100.0 127,668 100.073,235 63.3 83,044 66.7 80,942 67.9 80,115 68.0 85,779 68.7 88,173 69.142,425 36.7 41,553 33.3 38,20' 32.1 37,688 32.0 39,080 31.3 39,495 30.9
72,101 100.0 82,612 100.0 106,4 *.1 100.0 117,119 100.0 120,428 100.0 114,816 100.059,447 82.4 69,918 84.6 92,579 87.0 101,529 86.7 105,251 87.4 103,067 89.812,654 17.6 12,694 15.4 13,879 13.0 15,590 13.3 15,177 12.6 11,749 10.2244,839 100.0 231,031 100.0 227,506 100.0 217,448 100.0 206,914 100.0 203,517 100.0234;610 95.8 222,136 96.1 219,818 96.6 210,490 96.8 201,919 96.7 195,675 96.110,229 4.2 8,895 3.9 7,688 3.4 6,958 3.2 6,995 3.3 7,842 3.9326,458 100.0 338,344 100.0 346,267 100.0 345,497 100.0 340,481 100.0 339,252 100.0321,526 98.5 333,775 98.6 342,203 98.8 341,579 98.9 336,679 98.9 334,902 98.74,932 1.5 4,569 1.4 4,064 1.2 3,918 1.1 3,802 1.1 4,350 1.3402,175 100.0 377,578 100.0 400,851 100.0 411,588 100.0 418,892 100.0 438,585 100.0339,354 84.4 322,192 85.3 351,715 87.7 361,186 87.8 364,552 87.0 382,113 87.162,821 15.6 55,386 14.7 49,136 12.3 50,402 12.2 54,340 13.0 56,472 12.9
Notes: Percents may not add to 100.0 because of rounding.1985 misdemeanor drunk and drug law violation counts have been revised and do not agree with previously published data.
Source: Table 23.
178
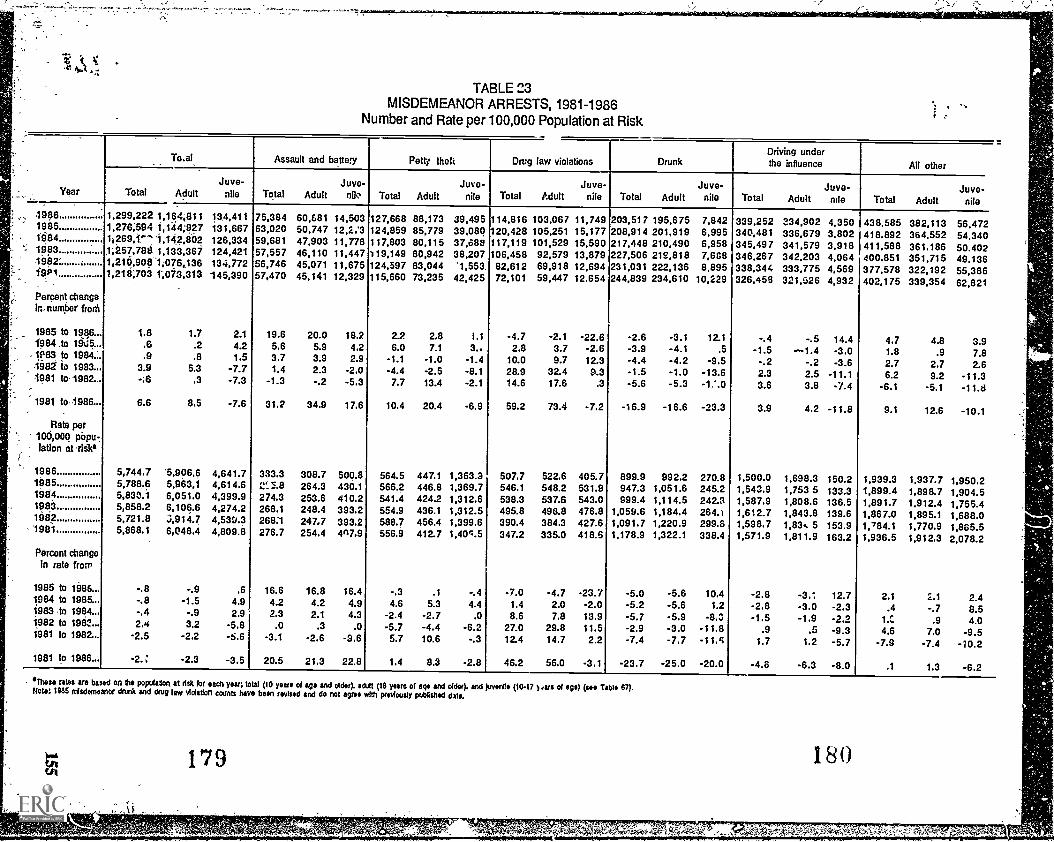
NA.
TABLE 23MISDEMEANOR ARRESTS, 1981-1986
Number and Rate per 100,000 Population at Risk
Year
To.al Assault and battery Petty theft Drug law violations DrunkDriving underthe influence All other
Total AdultJuve-
nile Total AdultJuve-
nik' Total AdultJuve-
nile Total AdultJuve-
nile Total AdultJuve-
nile Total AdultJuve-
nile Total AdultJuve-
nile
1986 1,299,222 1,164,811 13.4.411 75,384 60,681 14,503 127,668 88,173 39,495 114,816 103,067 11,749 203,517 195,675 7,842 339,252 234,902 4,350 438,585 382,113 56.4721985 1,276;594 1,144;927 131,667 63,020 50,747 12,2.'3 124,859 85,779 39,080 120,428 105,251 15.177 208,914 201,919 6,995 340,481 336,679 3.802 418.892 364,552 54,3401984 1;269,1" 1,142.802 126,334 59,681 47,903 11,778 117.803 80,115 37,688 117,119 101,529 15,590 217,448 210,490 6,958 345,497 341,579 3,918 411,588 361.186 50.4021983 1;257,788 1,133,367 124,421 57,557 46,110 11,447 119.149 80,942 38,207 106.458 92,579 13,879 227,506 219,818 7,688 346,267 342,203 4,064 400,851 351.715 49.1361982' 1,210,9081;076,,136 134,772 56,746 45,071 11,675 124,397 83,044 '1,553. 82,612 69,918 12,694 231,031 222,136 8,895 338,344 333,775 4.569 377,578 322.192 55,3861f9P1 1,218;703 1;03,313 145,390 57,470 45,141 12,329 115,660 73,235 42,425 72,101 59,447 12.654 244,839 234,610 10,229 326,458 321,526 4,932 402,175 339,354 62,821
Percent changein, number from
1985 tO 1986 1.8 1.7 2.1 19.6 20.0 18.2 2.2 2.8 1.1 -4.7 -2.1 -22.6 -2.6 -3.1 12.1 -.4 -.5 14.4 4.7 4.8 3.91984 to 19a .6 .2 4.2 5.6 5.9 4.2 6.0 7.1 3.. 2.8 3.7 -2.6 -3.9 -4.1 .5 -1.5 -1.4 -3.0 1.8 .9 7.8,1P83 to 1984 .9 .8 1.5 3.7 3.9 2.9 -1.1 -1.0 -1.4 10.0 9.7 12.3 -4.4 -4.2 -9.5 -.2 -.2 -3.6 2.7 2.7 2.61982 to 1983 3.9 5.3 -7.7 1.4 2.3 -2.0 -4.4 -2.5 -8.1 28.9 32.4 9.3 -1.5 -1.0 -13.6 2.3 2.5 -11.1 6.2 9.2 -11.31981 to 1982 -:6 .3 -7.3 -1.3 -.2 -5.3 7.7 13.4 -2.1 14.6 17.6 .3 -5.6 -5.3 -1,'.0 3.6 3.8 -7.4 -6.1 -5.1 -11.81981 to 1586 6.6 8.5 -7.6 31.2 34.9 17.6 10.4 20.4 -6.9 59.2 73.4 -7.2 -16.9 -16.6 -23.3 3.9 4.2 -11.8 9.1 12.6 -10.1
Rate per100,000 popu-lation at risk'
1986 5,744.7 5,906.6 4,641.7 333.3 308.7 500.8 564.5 447.1 1,363.3 507.7 522.6 405.7 899.9 992.2 270.8 1,500.0 1,698.3 150.2 1,939.3 1,937.7 1,950.21985 5,788.6 5,963.1 4,614.6 V.`..3.8 264.3 430.1 566.2 446.8 1,369.7 546.1 548.2 531.9 947.3 1,051.6 245.2 1,543.9 1,753 5 133.3 1,899.4 1,898.7 1,904.51984.. 5,833.1 6,051.0 4,399.9 274.3 253.6 410.2 541.4 424.2 1,312.6 538.3 537.6 543.0 999.4 1,114.5 242.3 1,587.9 1,808.6 136.5 1,891.7 1,912.4 1,755.41983 5,858.2 6,109.6 4,274.2 268.1 248.4 393.2 554.9 436.1 1,312.5 495.8 498.8 476.8 1,059.6 1,184.4 264.1 1,612.7 1,843.8 139.6 1,867.0 1,895.1 1,688.01982 5,721.8 .3,914.7 4,530.3 268.1 247.7 393.2 588.7 456.4 1,399.6 390.4 384.3 427.6 1,091.7 1,220.9 299.6 1,598.7 1,83, 5 153.9 1,784.1 1,770.9 1,865.51981 5,868.1 6,048.4 4,809.8 276.7 254.4 4n7,9 556.9 412.7 1,40'1.5 347.2 335.0 418.6 1,178.9 1,322.1 338.4 1,571.9 1,811.9 163.2 1,936.5 1,912.3 2,078.2Percent changeIn rate from
1985 to 1986 -.8 -.9 .6 16.6 16.8 16.4 -.3 .1 -.4 -7.0 -4.7 -23.7 -5.0 -5.6 10.4 -2.8 -3.1 12.7 2.1 2.1 2.41984 to 1985 -.8 -1.5 4,9 4.2 4.2 4.9 4.6 5.3 4.4 1.4 2.0 -2.0 -5.2 -5.6 1.2 -2.8 -3.0 -2.3 .4 -.7 8.51983 to 1984 -.4 -.9 2.9 2.3 2.1 4.3 -2.4 -2.7 .0 8.6 7.8 13.9 -5.7 -5.9 -8.3 -1.5 -1.9 -2.2 1.2 .9 4.01982 to 1982 2.4 3.2 -5.8 .0 .3 .0 -5.7 -4.4 -6.2 27.0 29.8 11.5 -2.9 -3.0 -11.8 .9 .5 -9.3 4.6 7.0 -9.51981 to 1982 -2.5 -2.2 -5.6 -3.1 -2.6 -3.6 5.7 10.6 -.3 12.4 14.7 2.2 -7.4 -7.7 -Mc 1.7 1.2 -5.7 -7.9 -7.4 -10.21981 to 1986 -2.: -2.3 -3.5 20.5 21.3 22.8 1.4 8.3 -2.8 46.2 56.0 -3.1 -23.7 -25.0 -20.0 -4.8 -6.3 -8.0 .1 1.3 -6.2
*These rates are based on the population at Ask lot each year; total (10 years of age and order). adult (t8 years of ago and older). end Overdo (1047 ).us of age) (see Table 67).Note: 1985 misdemeanor dna* and drug law vfclation counts have been revised and do notagree with prevfousfy published data.
179 180
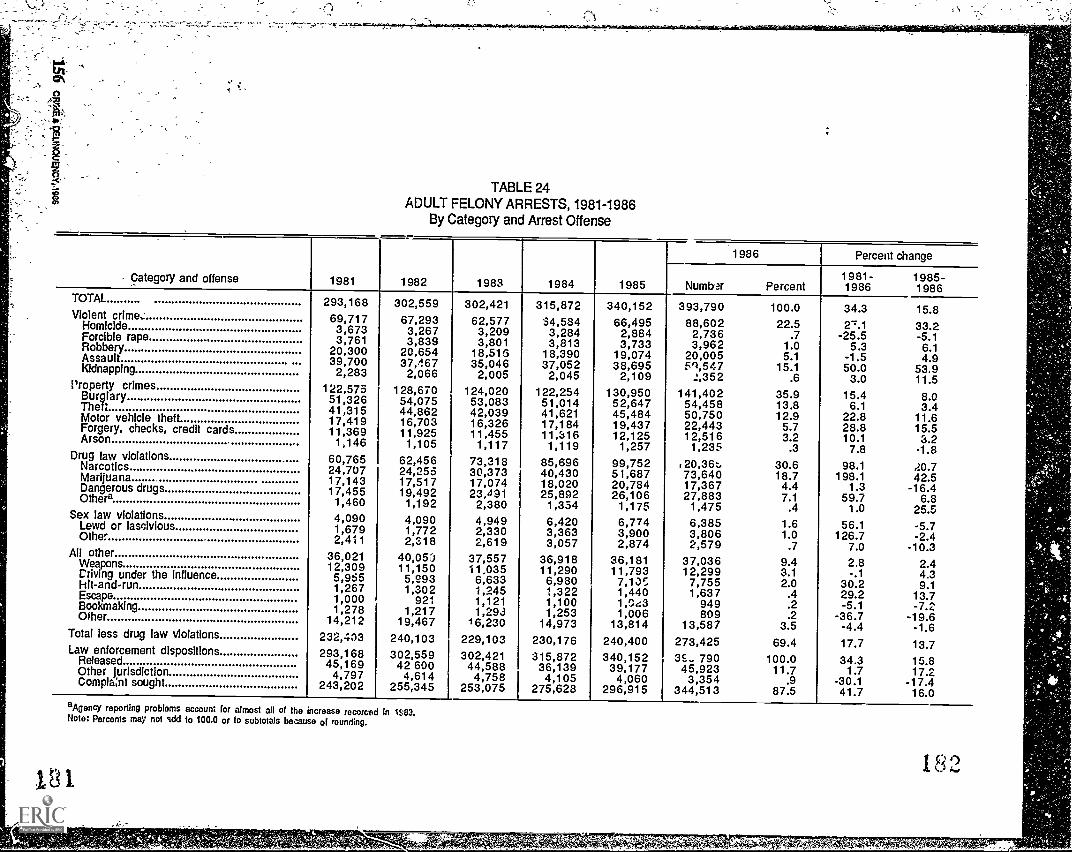
TABLE 24ADULT FELONY ARRESTS, 1981-1986
By Category and Arrest Offense
Category and offense 1981 1982 1983 1984 1985
1986 Percent change
Numb ar Percent1981- 1985-1986 1986
TOTAL 293,168 302,559 302,421 315,872 340,152 393,790 100.0 34.3 15.8Violent crime, 69,717 67,293 62,577 34,584 66,495 88,602 22.5 2'.1 33.2Homicide 3,673 3,267 3,209 3,284 2,884 2,736 .7 -25.5 -5.1Forcible rape 3,761 3,839 3,801 3,813 3,733 3,962 1.0 5.3 6.1Robbery 20,300 20,654 18,516 18,390 19,074 20,005 5.1 -1.5 4.9Assault 39,700 37,467 35,046 37,052 38,695 51,547 15.1 50.0 53.9Kidnapping 2,283 2,066 2,005 2,045 2,109 2,352 .6 3.0 11.5Property crimes 122,573 128,670 124,020 122,254 130,950 141,402 35.9 15.4 8.0Burglary 51,326 54,075 53,083 51,014 52,647 54,458 13.8 6.1 3.4Theft 41,315 44,862 42,039 41,621 45,484 50,750 12.9 22.8 11.6Motor vehicle theft 17,419 16,703 16,326 17,184 19,437 22,443 5.7 28.8 15.5Forgery, checks, credit cards 11,369 11,925 11,455 11,316 12,125 12,516 3.2 10.1 3.2Arson 1;146 1,105 1,117 1,119 1,257 1,235 .3 7.8 -1.8Drug law violations 60,765 62,456 73,318 85,696 99,752 ,20,36:. 30.6 98.1 20.7Narcotics 24,707 24,255 30,373 40,430 51,687 73,640 18.7 198.1 42.5Marijuana 17,143 17,517 17,074 18,020 20,784 17,367 4.4 1.3 -16.4Dangerous drugs 17,455 19,492 23,491 25,892 26,106 27,883 7.1 59.7 6.8Othera 1,460 1,192 2,380 1,334 1,175 1,475 .4 1.0 25.5Sex law violations 4,090 4,090 4,949 6,420 6,774 6,385 1.6 56.1 -5.7Lewd or lascivious 1,679 1,772 2,330 3,363 3,900 3,806 1.0 126.7 -2.4()the, 2,411 2,318 2,619 3,057 2,874 2,579 .7 7.0 -10.3All other 36,021 40,053 37,557 36,918 36,181 37,036 9.4 2.8 2.4Weapons 12,309 11,150 11,035 11,290 11,793 12,299 3.1 -.1 4.3Caving under the influence 5,955 5,993 6,633 6,980 7,10: 7,755 2.0 30.2 9.1Hit- and -run 1,267 1,302 1,245 1,322 1,440 1,637 .4 29.2 13.7Escape 1,000 921 1,121 1,100 1,f.143 949 .2 -5.1 -7.2Bookmaking 1,278 1,217 1,293 1,253 1,006 809 .2 -36.7 -19.6Other 14,212 19,467 16,230 14,973 13,814 13,587 3.5 -4.4 -1.6Total less drug law violations 232,403 240,103 229,103 230,176 240,400 273,425 69.4 17.7 13.7Law enforcement dispositions 293,168 302,559 302,421 315,872 340,152 35... 790 100.0 34.3 15.8Released 45,169 42 600 44,588 36,139 39,177 45,923 11.7 1.7 17.2Other jurisdiction 4,797 4,614 4,758 4,105 4,060 3,354 .9 -30.1 -17.4Compla:nt sought 243,202 255,345 253,075 275,628 296,915 344,513 87.5 41.7 16.0aAgency reporting problems account for almost all of the increase rocorced MNote: Percents may not add to 100.0 or to subtotals begmuse of rounding.
182181

TABLE 25ADULT MISDEMEANOR ARRESTS, 1981-1986
By Arrest Offense
Offense 1981 1982 1983 1984 1985
1986 Percent change
Number Percent1981- 1985 -1986 1986
TOTAL 1,073,313 1,076,136 1,133,367 1,142,802 1,144,927 1.164,811 100.0 8.5 1.7Assault and'ba,7 45,141 45,071 46,110 47,903 50,747 60,881 5.2 34.9 20.0Petty theft 73,235 83,044 80,942 80,115 85,779 88,173 7.5 20.4 2.8CheckS:and ctedit Cara 2,058 1,960 2,089 1,738 4,661 1,335 .1 -35.1 -19.6.Drug le* violations 59,447 69,918 92,579 101,529 105,251 103,067 8.8 73.4 -2.1.
Indecent exposute 2,687 2,822 3,013 2,830 2,534 2,443 .2 -9.1 -3.6Annoying children 1,042 671 599 539 797 583 .1 -44.0 -26.9Otiicene'rhatter 87 33 56 41 42 66 .0 -24.1 57.1'Le*cl conduct:- 5,344 6,175 7,171 7,189 7,360 8,315 .7 55.' 13.0ProstWition 14,702 15,929 16,562 19,570 19,363 20,825 1.8 41.6 7.6Drunk- 234,610 222,136 219,818 210,490 201,919 195,675 16.8 -16.6 -3.1DisOrderly Conduct 12,061 10,546 10,322 11,489 7,683 10,566 .9 -12.4 37.5Disturbinglhe peace 13,423 11,411 10,956 10,837 10,34t4 9,924 .9 -26.1 -4.1DrIVIng.under.the inflUence 321,526 333,775 342,203 341,579 336,679 -14,902 28.8 4.2 -.5Hit-and-41in 4,787 5,329 6,053 5,963 6,171 6,773 .6 41.5 9.8Selected traffic violations 105,310 84,792 102,985 97,942 83,707 84,796 7.3 -19.5 1.3Gambling 3,691 2,627 2,174 1,864 883 1,673 .1 -54.7 89.5Nonsupport 1,022 805 790 778 882 852 .1 -16.6 4.4All 'other 173,140 179,092 188,945 200,406 223,423 233,962 20.1 35.1 4.9Law enforcement dispositions 1,073,313 1,076,136 1,133,367 1,142 802 1,144,927 1,164,811 100.0 8.5 1.7Released 134,513 149,351 146,039 132,711 132,156 135,064 11.6 .4 2.2Other jurisdiction 18,309 13,173 '4,811 14,687 12,908 21,206 1.8 15.8 64.3Complaint Wight 920,491 913,612 972;517 996,004 999,863 1,008,541 86.6 9.6 .9Nettie: Percents may not add to 100.0 because of rounding.
1985 misdemeanor drunt and drug law violation counts have been revised and do not agree with j.eviously published data.
1831F4
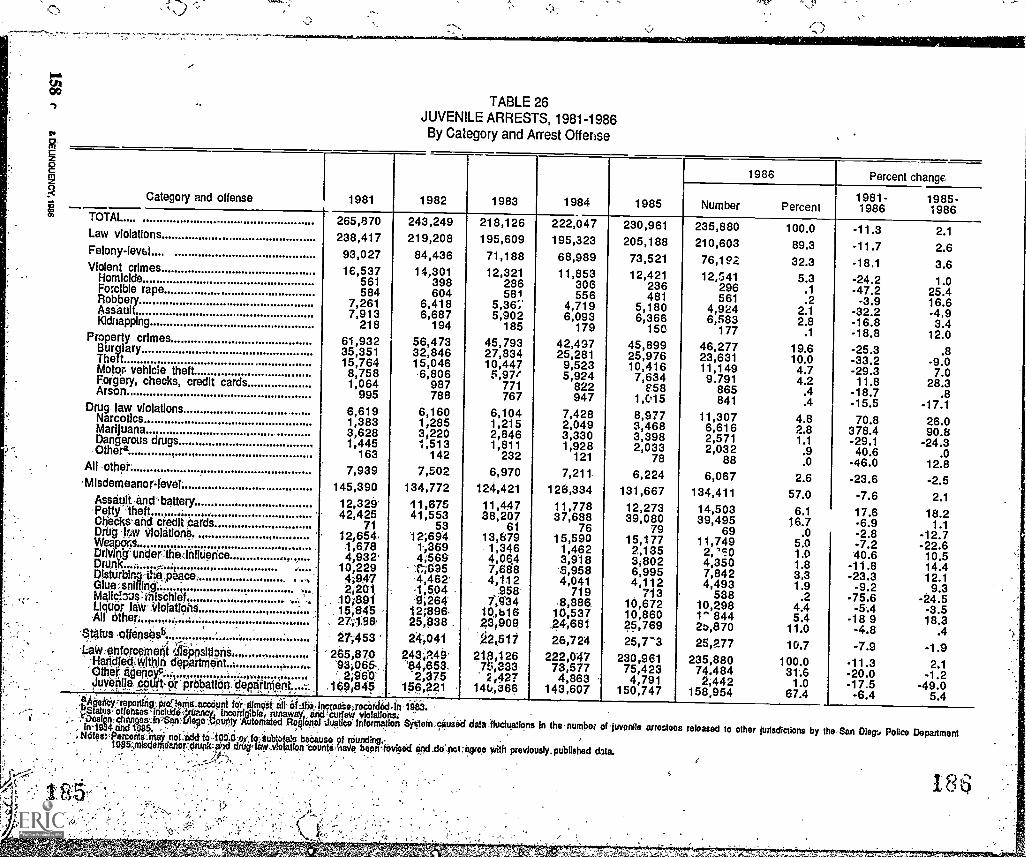
"-kr -oo
TABLE 26JUVENILE ARRESTS, 1981-1986By Category and Arrest Offense
Category and offense 1981 1982 1983 1984 1985
1986 Percent change
Number Percent1981-1986
1985 -1986
TOTAL....
Law violations
Felony-lev61.
Violent crimesHomicideForcible rapeRobberyAssaultKidnapping
Property crimesBurglaryTheftMotor vehicle theftForgery, checks, credit cardsArson
Drug law violationsNarcoticsMarijuanaDangerous drugs
- Others
An ,other
-Misdemeanor1eVel.
Assault ,and' batteryPettyAheff. ,.Checlis'and credltpards.. .pito rm Oolitic:0,WeapapDrIvItg'UntierthadhtluanceDrank.. ii ,,...,... ,,DlsturbIng-the,peace,)GluersnIflirl .Mallesus-ialsthlafLiquor iditifloi6tiO111-All Other . , ,
-WO Igfepsast*i if.`1.-ai+v efforcamen i spositIons...
-Hari,dfailNilttiln dapartalein1'OHIO ageOPYc;.,...Juvenile .cpuit K prObatIon Cle..,
,
.
.
o,
"ilnient.
,..,-
'.;
265,870238,41793,02716,537
561584
7,2617,913
21861,93235,35115,7648,7581,064
995
6,6191,3833,6281,445
163
7,939145,390
12,329-42,425
7112,6541,6784,932'
10,2294,9472;201
10,891.15,8027416527;453
265,870'93;06S,''. 2;958
, 169,845
243,249219,20884,43614,301
398604
6,4186,687
194
56,47332,84615,0466,806
987788
6,1601,2853,2201,513
142
7,602134,7721,67541,553
5312;694
1,3694;5651%8954,461,5,04:9;264
12;89825,838.24,041
243,249'"84,653.
2,375156,221.
218,126195,60971,18812,321
286581
5,36";5,902
185
45,79327,83410,4475,971
771767
6,1041,2152,8461,811
232
6,970124,421
11,44738,207
6113,6791,3464,0647,6884,112
958-7',134
10,,b1623;909'.2517
21,9,12675,2352,427
14(066
222,047195,32368,98911,853
306556
4,7196,093
179
42,49725,2819,5235,924
822947
7,4282,0493,3301,928
121
7,211.
126,33411,77837,688
7615,5901,4623,918'5,9584,041
719.8,886,
10,537.44,68126,724
222,04773,5774,863
143,607
230,961205,188
73,52112,421
236481
5,1806,366
15045,89925,97610,4167,634
F581,0158,9773,4683,3982,033
78
6,224131,66712,27339,080
7915,1772,1353,8026,9954,112, 713
10,67210,86025,76925,7-3
230,96175,4234,791
150,747
235,880210,60376,19212,541
296561
4,9246,583
17746,27723,63111,1499,791
865841
11,3076,6162,5712,032
886,067
134,411
14,50339,495
6911,7492,'F04,3507,8424,493
53810,2981- 84425,87025,277
235,88074.4842;442
158,954
100.0
89.3
32.35.3
.1
.22.12.8
.1
19.610.04.74.2
.4
.4
4.82.81.1
.9
.0
2.6
57.0
6.116.7
.05.01.01.83.31.9
.24.45.4
11.0
10.7
100.031.6
1.067.4
-11.3-11.7-18.1
-24.2-47.2-3.9
-32.2-16.8-18.8-25.3-33.2-29.311.8
-18.7-15.570.8
378.4-29.140.6
-46.0-23.6-7.617.6-6.9-2.8-7.240.6
-11.8-23.3
-9.2-75.6
-5-.4-18 9-4.8-7.9
-11.3-20.0-17.5-6.4
2.1
2.63.61.0
25.416.6-4.93.4
12.0
.8-9.07.0
28.3.8
-17.126.090.8
-24.3.0
12.8-2.52.1
18.21.1
-12.7-22.6
10.514.412.1, 9.3
-24.5-3.518.3
.4-1.92.1
-1.2-49.0
5.4,r)AdenClepontriT.Patkinicacceuni tiJmO,S1-. it11 Of itio 1 ea:scdrecarciacl 4n 1913.
Statns- olfehset-inchide,4rOancy, Incoirtulble, runaway,',aricV deity vlelatIons: ,.`,. 7'00$110,01-0n9eallf=Setrtilego',D,ountrAOtomated Regional ikratIcoilntOrmation SyStein;causichiatalluctnations in the number orjuvonite arrer.tees released to other jurisdictions by the-San Map Police Departmentini9a4 and 1984... ' , _.- . ,
;.t4OtedvPerceittctnay notaitld to-I01.31a,/,10-,,tubtbiele because et niund'ang.-190:,misdernaanor.4runlvMd drufrlaw,Votation tounte,baVe, beprvrOvieed gpd.do:,not:agree with previously. published data.,, ,
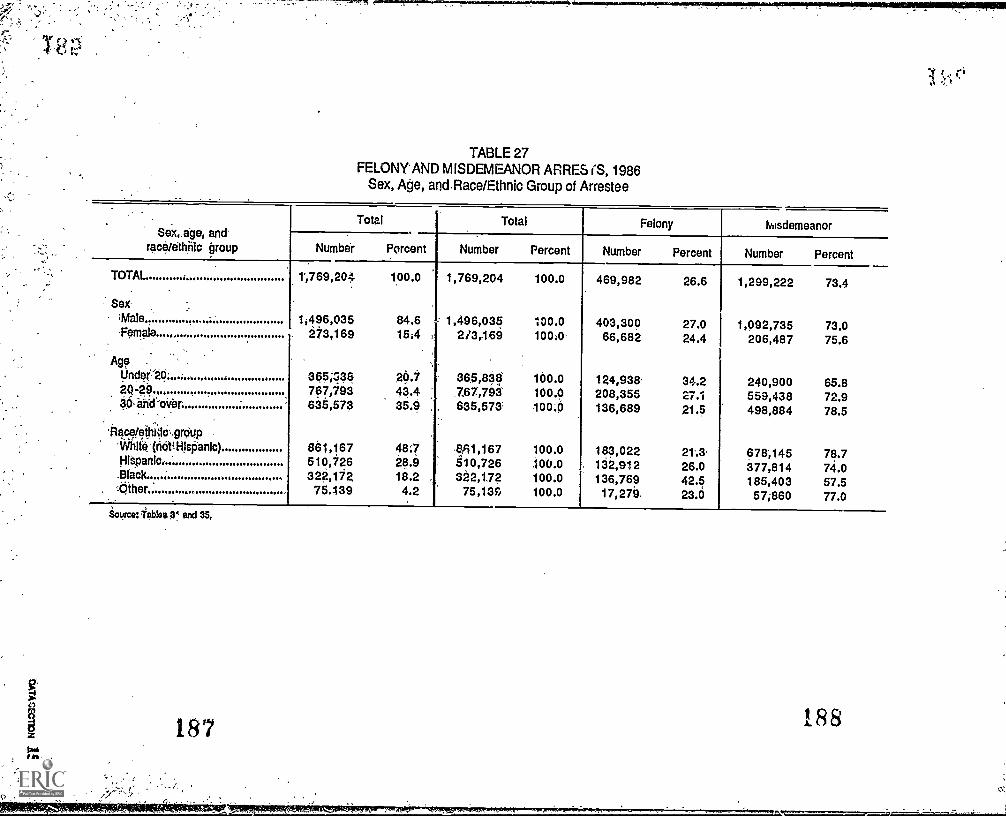
TABLE 27FELONY AND MISDEMEANOR ARRES CS, 1986
Sex, Age, anct Race/Ethnic Group of Arrestee
Sexr.age, and-race/ethnic group
Total Total Felony Misdemeanor
Number Percent Number Percent Number Percent Number Percent
TOTAL i
Sex
,Matefemale
Age ,
1.1100-0'20 -29
s , ,. ,- , :
p.aild-over
lacqieth;16..,grOup -
'MO '(nOttlijsi5anIc)HISpanle,.Brack
. ,-Other
1',769,204
1;496,035273,169
3PPir.!44,767.793635,573
861,167510,726322,11275.139
100.0
84.615:4 ,
.20.43.4
,
35.9
48:728.918.24.2
1,769,204
1,496,0352/3,169
30,00.767,793635,573`
,a61,167510,726322,172
75,13F,
100.0
100.0100:0
100.0100.0100.0
100.0100.0100.0100.0
469,982
403,30066,682
124,938208,355136,689
1'83,022132,912136,769
17,279.
26.6
27.024.4
34.227.121.5
21.326.042.523.6
1,299,222
1,092,735206,487
240,900559,438498,884
678;145377,814185,40357;860
73.4
73.075.6
65.872.978.5
78.774.057.577.0
Source: Tables 3! and 35,
187 188

TABLE 28FELONY ARRESTS, 1986
Catevri and Arrest Offense by Sex and Race/Ethnic Group of Arrestee
Category and offense
Number Percent
Total
Sex Ram/ethnic group
Total
Sex Race/ethnic group
Male FemaleWhite
(not Hispanic) Hispanic Black Other Male FemaleWhite
(not Hispanic) Hispanic Black OtherTOTAL 469,982 403,300 66,682 183,022 132,912 136,769 17,279 100.0 85.8 14.2 38.9 28.3 29.1 3.7Violent crimes 101,143 90,795 10,348 33,552 29,361 33,590 4,640 100.0 89.8 10.2 33.2 29.0 33.2 4.6Homicide 3,032 2,727 305 908 957 1,009 158 100.0 89.9 10.1 29.9 31.6 33.3 5.2Forcible rape 4,523 4,503 20 1,344 1,379 1,583 217 100.0 99.6 .4 29.7 30.5 35.0 4.8Robbery 24,929 22,843 2,086 5,330 6,367 12,240 992 100.0 91.6 8.4 21.4 25.5 49.1 4.0Assault 66,130 58,502 7,628 25,055 19,802 18,106 3,167 100.0 68.5 11.5 37.9 29.9 27.4 4.8Kidnapping 2,529 2,220 309 S.,15 856 652 106 100.0 87.8 12.2 36.2 33.8 25.8 4.2Property crimes 187,679 157,308 30,371 77,571 53,313 48,794 8,002 100.0 83.8 16.2 41.3 28.4 26.0 4.3Burglary 78,089 66,949 11,140 32,944 24,301 17,511 3,333 100.0 85.7 14.3 42.2 31.1 22.4 4.3Theft 61,899 51,135 10,764 25,198 17,034 17,066 2,601 100.0 82.6 17.4 40.7 27.5 27.6 4.2Motor vehicle theft 32,234 29,085 3,149 11,384 9,565 9,905 1,390 100.0 90.2 9.8 35.3 29.6 30.7 4.3Forgery, checks, credit
cards 13,381 8,318 5,063 6,922 2,042 3,823 594 100.0 62.2 37.8 51.7 15.3 28.6 4.4Arson 2,076 1,821 255 1,122 381 489 84 100.0 87.7 12.3 54.0 18.4 23.6 4.0Drug law vioiaeons 131,672 110,978 20,694 46,677 37,151 45,037 2,807 100.0 84.3 15.7 35.4 28.2 34.2 2.1Narcotics 80,256 68,224 12,032 21,188 21,050 36,054 1,964 100.0 85.0 15.0 26.4 26.2 44.9 2.4Marijuana 19,938 18,038 1,900 7,388 7,139 5,082 329 100.0 90.5 9.5 37.1 35.8 25.5 1.7Dangerous drugs 29,915 23,571 6,344 17,371 8,787 3,27 7 480 100.0 78.8 21.2 58.1 29.4 11.0 1.6Other 1,563 1,145 418 730 175 624 34 100.0 73.3 26.7 46.7 11.2 39.9 2.2SeX law violations 8,038 7,738 300 4,1 3 2,265 1,317 333 100.0 96.3 3.7 51.3 28.2 16.4 4.1Lewd or lascivious 4,953 4,811 142 2,636 1,482 636 199 100.0 97.1 2.9 53.2 29.9 12.8 4.0Other 3,085 2,927 158 1,487 783 681 134 100.0 94.9 5.1 48.2 25.4 22.1 4.3Driving offenses 9,873 8,663 1,210 5,471 3,319 763 320 100.0 87.7 12.3 55.4 33.6 7.7 3.2Driving under the Influence. 8,034 7,013 1,021 4,697 2,503 590 244 100.0 87.3 12.7 58.5 31.2 7.3 3.0Hit-and-run 1,839 1,650 189 774 816 173 76 100.0 89.7 10.3 42.1 44.4 9.4 4.1All other 31,577 27,818 3,759 15,629 7,503 7,268 1,177 100.0 88.1 11.9 49.5 23.8 23.0 1.7Weapons.. 14,915 14,201 714 7,087 4,213 2,984 631 100.0 95.2 4.8 47.5 28.2 20.0 4.2Escape 1,078 142 584 321 141 32 100.0 86 8 13.2 54.2 29.8 13.1 3.0Bookmaking 810 628 182 243 72 467 28 100.0 77.5 22.5 30.0 8.9 57.7 3.5Other 14,774 12,053 2,721 7,715 2,897 3,676 486 100.0 81.6 18.4 52.2 19.6 24.9 3.3Note: Percents may not add to 100.0 because of rounding.Sourco: Table 31.
189 I'
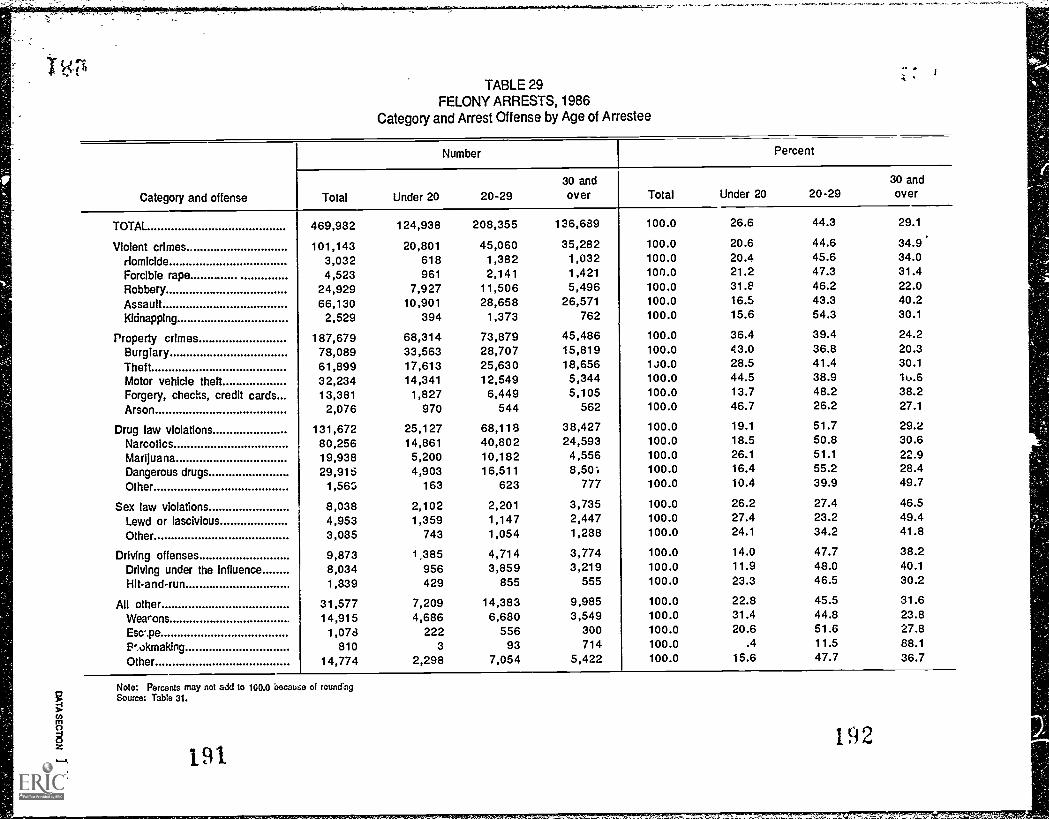
TABLE 29FELONY ARRESTS, 1986
Category and Arrest Offense by Age of Arrestee
Category and offense
Number Percent
Total Under 20 20-2930 andover Total Under 20 20-29
30 andover
TOTAL 469,982 124,938 208,355 136,689 100.0 26.6 44.3 29.1
Violent crimes 101,143 20,801 45,060 35,282 100.0 20.6 44.6 34.9
Homicide 3,032 618 1,382 1,032 100.0 20.4 45.6 34.0
Forcible rape 4,523 961 2,141 1,421 100.0 21.2 47.3 31.4
Robbery 24,929 7,927 11,506 5,496 100.0 31.8 46.2 22.0
Assault 66,130 10,901 28,658 26,571 100.0 16.5 43.3 40.2
Kidnapping 2,529 394 1,373 762 100.0 15.6 54.3 30.1
Property crimes 187,679 68,314 73,879 45,486 100.0 36.4 39.4 24.2
Burglary 78,089 33,563 28,707 15,819 100.0 43.0 36.8 20.3
Theft 61,899 17,613 25,630 18,656 130.0 28.5 41.4 30.1
Motor vehicle theft 32,234 14,341 12,549 5,344 100.0 44.5 38.9 1o.6
Forgery, checks, credit cards 13,381 1,827 6,449 5,105 100.0 13.7 48.2 38.2
Arson 2,076 970 544 562 100.0 46.7 26.2 27.1
Drug law violations 131,672 25,127 68,118 38,427 100.0 19.1 51.7 29.2
Narcotics 80,256 14,861 40,802 24,593 100.0 18.5 50.8 30.6
Marijuana 19,938 5,200 10,182 4,556 100.0 26.1 51.1 22.9
Dangerous drugs 29,915 4,903 16,511 8,50-, 100.0 16.4 55.2 28.4
Other 1,563 163 623 777 100.0 10.4 39.9 49.7
Sex law violations 8,038 2,102 2,201 3,735 100.0 26.2 27.4 46.5
Lewd or lascivious 4,953 1,359 1,147 2,447 100.0 27.4 23.2 49.4
Other 3,085 743 1,054 1,288 100.0 24.1 34.2 41.8
Driving offenses 9,873 1,385 4,714 3,774 100.0 14.0 47.7 38.2
Driving under the influence 8,034 956 3,859 3,219 100.0 11.9 48.0 40.1
Hit-and-run 1,839 429 855 555 100.0 23.3 46.5 30.2
All other 31,577 7,209 14,383 9,985 100.0 22.8 45.5 31.6
Wearons 14,915 4,686 6,680 3,549 100.0 31.4 44.8 23.8
Escape 1,078 222 556 300 100.0 20.6 51.6 27.8
P'.okmaking 810 3 93 714 100.0 .4 11.5 88.1
Other 14,774 2,298 7,054 5,422 100.0 15.6 47.7 36.7
Note: Percents may not add to 100.0 because of roundingSource: Table 31.
1.91.192

*A, TABLE 30b) FELONY ARRESTS, 1986
Category and Arrest Offense by Age of Arresteeto
Catagoy and offense
Number Percent
Total Under 10 10-19 20-29 30-3940 and
over Iota: Under 10 10-19 20-29 30-3940 andover
TOTAL 469,982 935 124,003 208,355 98,701 37,988 100.0 .2 26.4 44.3 21.0 8.1
Violent crimes 101,143 97 20,704 45,060 24,120 11,162 100.0 .1 20.5 44.6 23.8 11.0
Homicide 3,032 0 618 1,382 645 387 100.0 .0 20.4 45.6 21.3 12.8
Forcible rape 4,523 4 957 2,141 990 431 100.0 .1 21.2 47.3 21.9 9.5
'Robbery 24,929 22 7,905 11,506 4,372 1,124 100.0 .1 31.7 46.2 17.5 4.5
Assault 66,130 69 10,832 28,658 17,554 9,017 100.0 .1 16.4 43.3 26.5 13.6
Kidnapping 2,529 2 392 1,373 559 203 100.0 .1 15.5 54.3 22.1 8.0
Property crimes 187,679 760 67,554 73,879 33,962 11,524 100.0 .4 36.0 34.4 18.1 6.1
Purgiary 78,089 573 32,990 28,707 12,358 3,461 100.0 .7 42.2 36.8 15.8 4.4
Theft 61,899 84 17,529 25,630 13,372 5,284 100.0 .1 28.3 41.4 21.6 8.5
Motor vehicle theft. 32,234 18 14,323 12,549 4,112 1,232 100.0 .1 44.4 38.9 12.8 3.8
Forgery, checks, creditcards 13,381 0 1,827 6,449 3,773 1,332 100.0 .0 13.7 48.2 28.2 10.0
Arson 2,076 85 885 544 347 215 100.0 4.1 42.6 26.2 16.7 10.4
Drug law violations 131,672 6 25,121 68,118 29,522 8,905 100.0 .0 19.1 51.7 22.4 6.8
Narcotics 80,256 5 14,856 40,802 18,659 5,934 100.0 .0 18.5 50.8 23.2 7.4
Marijuana 19,938 1 5,199 10,182 3,555 1,001 100.0 .0 26.1 51.1 17.8 5.0
Dangerous drugs 29,915 0 4,803 16,511 6,762 1,739 100.0 .0 16.4 55.2 22.6 5.8
Other 1,563 0 163 623 546 231 100.0 .0 10.4 39.9 34.9 14.8
gex law violations 8,038 48 2,054 2,201 2,006 1,729 100.0 .6 25.6 27.4 25.0 21.5
Lewd or lascivious 4,953 39 1,320 1,147 1,248 1,199 100.0 .8 26.7 23.2 25.2 24.2
Other 3,085 9 734 1,054 758 530 100.0 .3 23.8 34.2 24.6 17.2
Driving Offenses 9,873 0 1,385 4,714 2,303 1,471 100.0 .0 14.0 47.7 23.3 14.9
'Driving under theInfluence 8,1134 0 956 3,859 1,960 1,259 100.0 .0 11.9 48.0 24.4 15.7
Hit-and-run 1,839 0 429 855 343 212 100.0 .0 23.3 46.5 18.7 11.5
All other.., 31,577 24 7,185 14,383 6,788 3,197 100.0 .1 22.8 45.5 21.5 10.1
Weapons 14,915 5 4,681 6,680 2,561 988 100.0 .0 31.4 44.8 17.2 6.6
Escape 1,078 0 222 555 239 61 100.0 .0 20.6 51.6 22.2 5.7
Bookmaking 810 0 3 93 153 561 100.0 .0 .4 11.5 18.9 69.3
Other 14,774 19 2,279 7,054 3,835 1,587 100.0 .1 15.4 47.7 26.0 10.7
Note: Percents nay not add to 100.0 because of rounding.Source: Table 31.
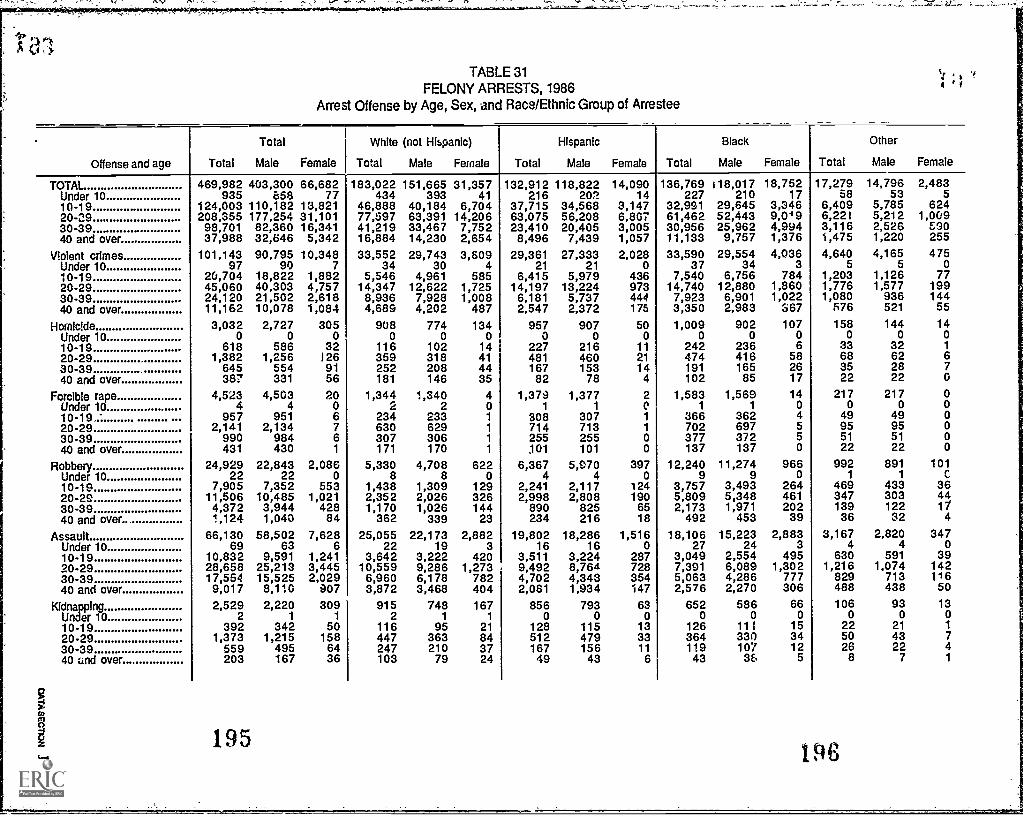
1
TABLE 31FELONY ARRESTS, 1986
Arrest Offense by Age, Sex, and Race /Ethnic Group of Arrestee
Offense and age Total
Total
Male Female
White (not Hispanic)
Total Male Female Total
Hispanic
Male Female Total
Black
Male Female Total
Other
Male Female
TOTAL 469,982 403,300 66,682 183,022 151,665 31,357 132,912 118,822 14,090 136,769 118,017 18,752 17,279 14,796 2,483Under 10 935 658 77 434 393 41 216 202 14 227 210 17 58 53 510-19 124,003 110,182 13,821 46,888 40,184 6,704 37,715 34,568 3,147 32,991 29,645 3,346 6,409 5,785 62420-29 208,355 177,254 31,101 77,597 63,391 14,206 63,075 56,208 6,867 61,462 52,443 9,019 6,221 5,212 1,00930-39 98,701 82,360 16,341 41,219 33,467 7,752 23,410 20,405 3,005 30,956 25,962 4,994 3,116 2,526 59040 and over 37,988 32,646 5,342 16,884 14,230 2,654 8,496 7,439 1,057 11,133 9,757 1,376 1,475 1,220 255
Violent crimes 101,143 90,795 10,348 33,552 29,743 3,809 29,361 27,333 2,028 33,590 29,554 4,036 4,640 4,165 475Under 10 97 99 7 34 30 4 21 21 0 37 34 3 5 5 010-19 20,704 18,822 1,882 5,546 4,961 585 6,415 5,979 436 7,540 6,756 784 1,203 1,126 7720-29 45,060 40,303 4,757 14,347 12,622 1,725 14,197 13,224 973 14,740 12,880 1,860 1,776 1,577 19930-39 24,120 21,502 2,618 8,936 7,928 1,008 6,181 5,737 444 7,923 6,901 1,022 1,080 936 14440 and over 11,162 10,078 1,084 4,689 4,202 487 2,547 2,372 175 3,350 2,983 S67 576 521 55
Homicide 3,032 2,727 305 908 774 134 957 907 50 1,009 902 107 158 144 14Under 10 0 0 0 0 0 0 0 0 0 0 0 0 0 0 010-19 618 586 32 116 102 14 227 216 11 242 236 6 33 32 1
20-29 1,382 1,256 126 359 318 41 481 460 21 474 416 58 68 62 630-39 645 554 91 252 208 44 167 153 14 191 165 26 35 28 740 and over 387 331 56 181 146 35 82 78 4 102 85 17 22 22 0
Forcible rape 4,523 4,503 20 1,344 1,340 4 1,379 1,377 2 1,583 1,569 14 217 217 0Under 10 4 4 0 2 2 0 1 1 e 1 1 0 0 0 0
10-19 957 951 6 234 233 1 308 307 1 366 362 4 49 49 020-29 2,141 2,134 7 630 629 1 714 713 1 702 697 5 95 95 030-39 990 984 6 307 306 1 255 255 0 377 372 5 51 51 040 and over 431 430 1 171 170 1 101 101 0 137 137 0 22 22 0
Robbery 24,929 22,843 2,086 5,330 4,708 622 6,367 5,970 397 12,240 11,274 966 992 891 101Under 10 22 22 0 8 8 0 4 4 0 9 9 0 1 1
r10-1Q 7,905 7,352 553 1,438 1,309 129 2,241 2,117 124 3,757 3,493 264 469 433 3620-29 11,506 10,485 1,021 2,352 2,026 326 2,998 2,808 190 5,809 5,348 461 347 303 4430-39 4,372 3,944 428 1,170 1,026 144 890 825 65 2,173 1,971 202 139 122 1740 and over.. 1,124 1,040 84 362 339 23 234 216 18 492 453 39 36 32 4
Assault 66,130 58,502 7,628 25,055 22,173 2,882 19,802 18,286 1,516 18,106 15,223 2,883 3,167 2,820 347Under 10 69 63 6 22 19 3 16 16 0 27 24 3 4 4 0
10-19 10,832 9,591 1,241 3,642 3,222 420 3,511 3,224 287 3,049 2,554 495 630 591 3920-29 28,658 25,213 3,445 10,559 9,286 1,273 9,492 8,764 728 7,391 6,089 1,302 1,216 1,074 14230-39 17,554 15,525 2,029 6,960 6,178 782 4,702 4,343 354 5,063 4,286 777 829 713 11640 and over 9,017 8,110 907 3,872 3,468 404 2,081 1,934 147 2,576 2,270 306 488 438 50
Kidnapping 2,529 2,220 309 915 748 167 856 793 63 652 586 66 106 93 13Under 10 2 1 1 2 1 1 0 0 0 0 0 0 0 0 010-19 392 342 50 116 95 21 128 115 13 126 111 15 22 21 1
20-29 1,373 1,215 158 447 363 84 512 479 33 364 330 34 50 43 730-39 559 495 64 247 210 37 167 156 11 119 107 12 26 22 440 and over 203 167 36 103 79 24 49 43 6 43 36 5 8 7 1
195196
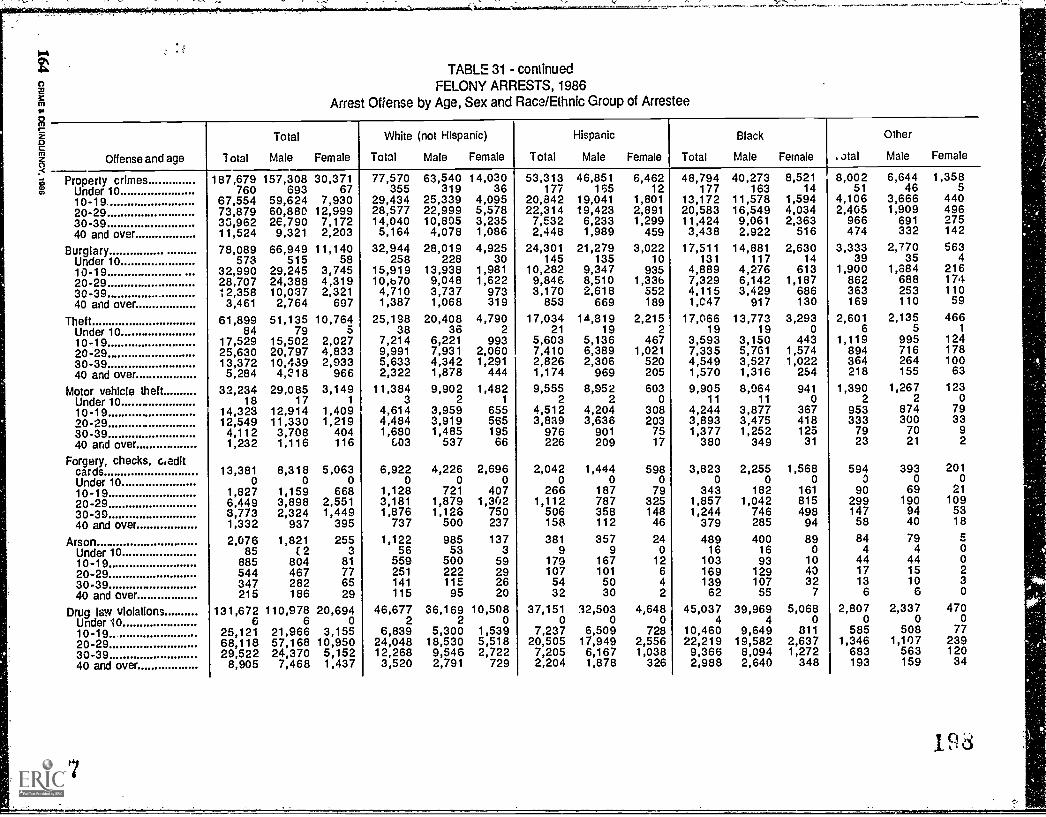
TABLE 31 - continuedFELONY ARRESTS, 1986
Arrest Offense by Age, Sex and Race/Ethnic Group of Arrestee
Offense and age Total
Total
Male Female
White (not Hispanic)
Total Male Female Total
Hispanic
Male Female Total
Black
Male Female . otal
Other
Male Female
Property crimes 187,679 157,308 30,371 77,570 63,540 14,030 53,313 46,851 6,462 48,794 40,273 8,521 8,002 6,644 1,358Under 10 760 693 67 355 319 36 177 165 12 177 163 14 51 46 5
10-19 67,554 59,624 7,930 29,434 25,339 4,095 20,842 19,041 1,801 13,172 11,578 1,594 4,106 3,666 44020-29 73,879 60,880 12,999 28,577 22,999 5,578 22,314 19,423 2,891 20,583 16,549 4,034 2,405 1,909 49630-39 33,962 26,790 7,172 14,040 10,805 3,235 7,532 6,233 1,299 11,424 9,061 2,363 966 691 27540 and over 11,524 9,321 2,203 5,164 4,078 1,086 2,448 1,989 459 3,438 2.922 516 474 332 142
Burglary 78,089 66,949 11,140 32,944 28,019 4,925 24,301 21,279 3,022 17,511 14,881 2,630 3,333 2,770 563Under 10 573 515 58 258 228 30 145 135 10 131 117 14 39 35 4
10-19 32,990 29,245 3,745 15,919 13,938 1,981 10,282 9,347 935 4,889 4,276 613 1,900 1,684 21620-29 28,707 24,388 4,319 10,b70 9,048 1,622 9,846 8,510 1,336 7,329 6,142 1,187 862 688 17430-39 12,358 10,037 2,321 4,710 3,737 973 3,170 2,618 552 4,115 3,429 686 363 253 11040 and over 3,461 2,764 697 1,387 1,068 319 853 669 189 1,047 917 130 169 110 59
Theft 61,899 51,135 10,764 25,198 20,408 4,790 17,034 1,1,819 2,215 17,066 13,773 3,293 2,601 2,135 466Under 10 84 79 5 38 36 2 21 19 2 19 19 0 6 5 1
10-19 17,529 15,502 2,027 7,214 6,221 993 5,603 5,136 467 3,593 3,150 443 1,119 995 12420-29 25,630 20,797 4,833 9,991 7,931 2,060 7,410 6,389 1,021 7,335 5,761 1,574 894 716 17830-39 13,372 10,439 2,933 5,633 4,342 1,291 2,826 2,306 520 4,549 3,527 1,022 364 264 10040 and over 5,284 4,218 966 2,322 1,878 444 1,174 969 205 1,570 1,316 254 218 155 63
Motor vehicle theft 32,234 29,085 3,149 11,384 9,902 1,482 9,555 8,952 603 9,905 8,064 941 1,390 1,267 123Under 10 18 17 1 3 2 1 2 2 0 11 11 0 2 2 0
10-19 14,323 12,914 1,409 4,614 3,959 655 4,512 4,204 308 4,244 3,877 367 953 874 7920-29 12,549 11,330 1,219 4,484 3,919 565 3,839 3,636 203 3,893 3,475 418 333 300 3330-39 4,112 3,708 404 1,680 1,485 195 976 901 75 1,377 1,252 125 79 70 9
40 and over 1,232 1,116 116 603 537 66 226 209 17 380 349 31 23 21 2
Forgery, checks, cieditcards 13,381 8,318 5,063 6,922 4,226 2,696 2,042 1,444 598 3,823 2,255 1,568 594 393 201Under 10 0 0 0 0 0 0 0 0 0 0 0 0 3 0 0
10-19 1,827 1,159 668 1,128 721 407 266 187 79 343 182 161 90 69 21
20-29 6,449 3,898 2,551 3,181 1,879 1,302 1,112 787 325 1,857 1,042 815 299 190 10930-30 3,773 2,324 1,449 1,876 1,126 750 506 358 148 1,244 746 498 147 94 5340 and over 1,332 937 395 737 500 237 158 112 46 379 285 94 58 40 18
Arson 2,076 1,821 255 1,122 985 137 381 357 24 489 400 89 84 79 e
Under 10 85 (2 3 56 53 3 9 9 0 16 16 0 4 4 0
10-19 885 804 81 559 500 59 179 167 12 103 93 10 44 44 0
20-29 544 467 77 251 222 29 107 101 6 169 129 40 17 15 2
30-39 347 282 65 141 115 26 54 50 4 139 107 32 13 10 340 and over 215 186 29 115 95 20 32 30 2 62 55 7 6 6 0
Drug law Violations 131,672 110,978 20,694 46,677 36,169 10,508 37,151 32,503 4,648 45,037 39,969 5,068 2,807 2,337 470Under 10 6 6 0 2 2 0 0 0 0 4 4 0 0 0 0
10-19. 25,121 21,966 3,155 6,839 5,300 1,539 7,237 6,509 728 10,460 9,649 811 585 508 7720-29 68,118 57,168 10,950 24,048 18,530 5,518 20,505 17,949 2,556 22,219 19,582 2,637 1,346 1,107 23930-39 29,522 24,370 5,152 12,268 9,546 2,722 7,205 6,167 1,038 9,366 8,094 1,272 683 563 12040 and over 8,905 7,468 1,437 3,520 2,791 729 2,204 1,878 326 2,988 2,640 348 193 159 34
197

TABLE 31 continuedFELONY ARRESTS, 1986
Arrest Offense by Aoe, Sex, and Race/Ethnic Group of Arrestee
Offense and age Total
Total
Male Female
White (not Hispanic)
Total Male Female Total
Hispanic
Male Female Total
Black
Male Female Total
Other
Male Female
Narcotics 80,256 68,224 12,032 21,188 16,298 4,890 21,050 18,367 2,683 36,054 31,907 4,147 1,964 1,652 312Under 10 5 5 0 1 1 0 0 0 0 4 4 0 0 0 010-19 14,856 13,129 1,727 2,572 1,930 642 3,083 2,741 342 8,805 8,108 697 396 350 4620-29 40,802 34,451 q,351 10,886 8,256 2,630 11,323 9,936 1,387 17,654 15,484 2,170 939 775 16430-39 18,659 15,549 3,110 5,975 4,669 1,306 4,924 4,208 716 7,269 6,261 1,008 491 '411 8040 and over 5,934 5,090 844 1,754 1,442 312 1,720 1,482 238 2,322 2,050 272 138 116 22
Marijuana 19,938 18,038 1,900 7,388 6,200 1,188 7,139 6,822 317 5,082 4,727 355 329 289 40Under 10 1 1 0 1 1 0 0 0 0 0 0 0 0 0 010-19 5,199 4,805 394 1,740 1,513 227 2,119 2,026 93 1,236 1,169 67 104 97 720-29 10,182 9,298 884 3,523 2,982 541 3,892 3,756 136 2,622 2,437 185 145 123 2230-39 3,555 3,092 463 1,599 1,300 299 918 850 68 980 892 88 58 50 840 and over 1,001 842 159 525 404 121 210 190 20 244 229 15 22 19 3
Dangerous drugs 29,915 23,571 6,344 17,371 13,201 4,170 8,787 7,180 1,607 3,277 2,823 454 480 367 113Under 10 0 0 0 0 0 0 0 0 0 0 0 0 0 0 010-19 4,903 3,905 998 2,462 1,814 648 2,001 1,710 e91 358 322 36 82 59 2320-29 16,511 12,953 3,558 9,378 7,130 2,248 5,220 4,203 1,017 1,664 1,423 241 249 197 5230-39 6,762 5,329 1,433 4,404 3,380 1,024 1,312 1,074 238 923 783 140 123 92 3140 and over 1,739 1,384 355 1,127 877 250 254 193 61 332 295 37 26 19 7
Other drug law violations 1,563 1,145 418 730 470 260 175 134 41 5 2 4 512 112 34 29 5Under 10 0 0 0 0 0 0 0 0 0 0 0 0 0 0 010-19 163 127 36 65 43 22 34 32 2 61 50 11 3 2 1
20-29 623 466 157 261 162 99 70 54 16 279 238 41 13 12 1
30-39 546 400 146 290 197 93 51 35 16 194 158 36 11 10 1
40 and over 231 152 79 114 68 46 20 13 7 90 66 24 7 5 2
Sex law violations 8,038 7,738 300 4,123 3,957 166 2,265 2,210 55 1,317 1,256 61 333 315 18Under 10 48 46 2 28 28 0 12 10 2 7 7 0 1 1 010-19 2,054 1,965 89 978 931 47 591 569 22 415 397 18 70 68 220-29 2,201 2,094 107 987 921 66 702 691 11 418 389 29 94 93 1
30-39 , 2,006 1,944 62 1,085 1,054 31 525 511 14 304 293 11 92 86 640 and over 1,729 1,689 40 1,045 1,023 22 435 429 G 173 170 3 76 67 9
Lewd or lascivious 4,953 4,811 142 2,636 2,559 77 1,482 1,449 33 636 610 26 199 193 6Under 10 39 37 2 23 23 0 10 8 2 6 6 0 0 0 010-19 1,320 1,258 62 666 633 33 371 355 16 240 229 11 43 41 220-29 1,147 1,107 40 534 508 26 422 417 5 142 134 8 49 48 1
30-39 1,248 1,225 23 683 674 9 366 359 7 142 137 5 57 55 240 and over 1,199 1,184 15 730 721 9 313 310 3 106 104 2 50 49 1
Other sex law violations 3,085 2,927 158 1,487 1,398 89 783 761 22 681 646 35 134 122 12Under 10 9 9 0 5 5 0 2 2 0 1 1 0 1 1 010-19 734 707 27 312 298 14 220 214 6 175 168 7 27 27 020-29 1,054 987 67 453 413 40 280 274 6 276 255 21 45 45 030-39 758 719 39 402 380 22 159 152 7 162 156 6 35 31 440 and over 530 505 25 315 302 13 122 119 3 67 66 1 26 18 8
199
200
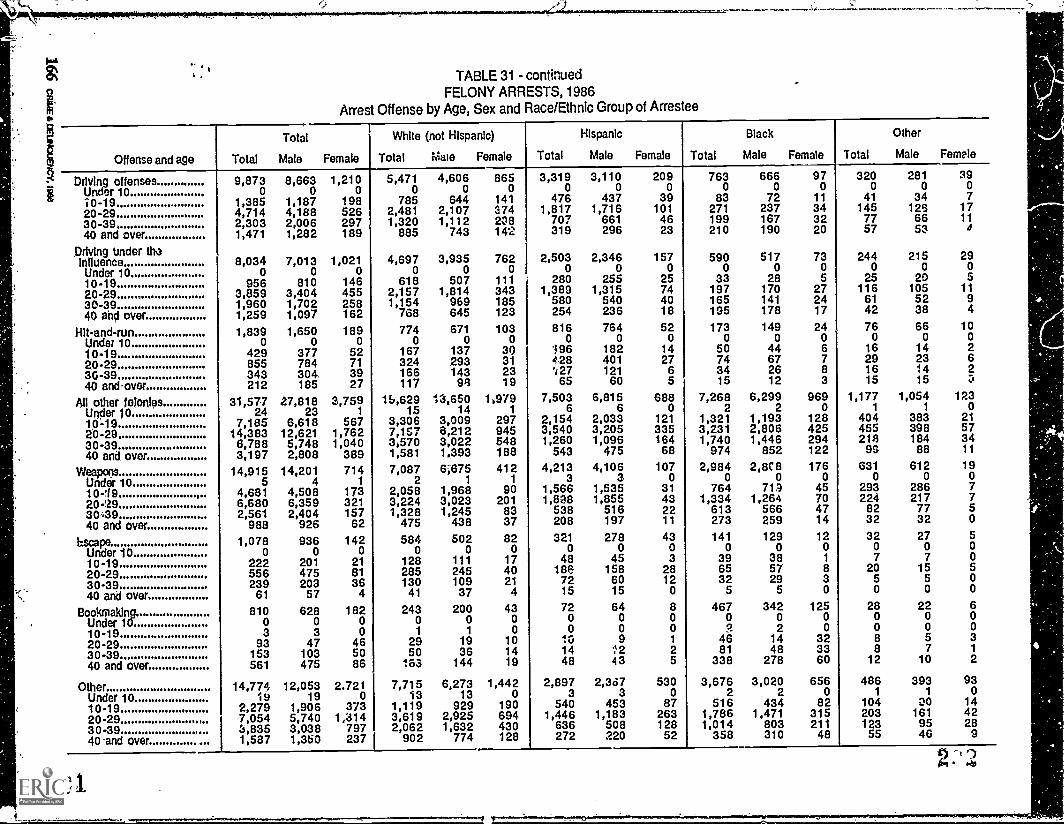
TABLE 31 - continuedFELONY ARRESTS, 1986
Arrest Offense by Age, Sex and Race/Ethnic Group of Arrestee
Offense and age Total
Total
Male Female
White (not Hispanic)
Total Male Female Total
Hispanic
Male Female Total
Black
Male Female Total
Other
Male Female
Driving offenses 9,873 8,663 1,210 5,471 4,606 865 3,319 3,110 209 763 666 97 320 281 39
Under 10 0 0 0 0 0 0 0 0 0 0 0 0 0 0 0
10-19 1,385 1,187 198 785 644 141 476 437 39 83 72 11 41 34 7
20.29 4,714 4,188 526 2,481 2,107 374 1,817 1,716 101 271 237 34 145 125 17
30-39 2,303 2,006 297 1,320 1,112 208 707 661 46 199 167 32 77 66 11
40 and over 1,471 1,282 189 885 743 14 319 296 23 210 190 20 57 53 4
,Driving tinder thaInfluence 8,034 7,013 1,021 4,697 3,935 762 2,503 2,346 157 590 517 73 244 215 29
Under 10 0 0 0 0 0 0 0 0 0 0 0 0 0 0 0
10-19 956 810 146 618 507 111 280 255 25 33 28 5 25 20 5
20-29 3,859 3,404 455 2,157 1,814 343 1,389 1,315 74 197 170 27 116 105 11
30.39 1,960 1,702 258 1,154 969 185 580 540 40 165 141 24 61 52 9
40 and over 1,259 1,097 162 768 645 123 254 236 18 195 178 17 42 38 4
Hit- and -nun 1,839 1,650 189 774 671 103 816 764 52 173 149 24 76 66 10
Under 10 0 0 0 0 0 0 0 0 0 0 0 0 0 0 0
10.19 429 377 52 167 137 30 196 182 14 50 44 6 16 14 2
20.29 855 784 71 324 293 31 428 401 27 74 67 7 29 23 6
3G -39 343 304. 39 166 143 23 ',27 121 6 34 26 8 16 14 2
40 and-over 212 185 27 117 9% 19 65 60 5 15 12 3 15 15 Z:4
All other Monies 31,577 27,818 3,759 15,629 3,650 1)979 7,503 6,815 688 7,268 6,299 969 1,177 1,054 123
Under 10 24 23 1 15 14 1 6 6 0 2 2 0 1 1 0
10-19 7,185 6,618 567 3,306 3,009 297 2,154 2,033 121 1,321 1,193 128 404 383 21
20-29 14,383 12,621 1,762 7,157 6,212 945 3,540 3,205 335 3,231 2,806 425 455 398 57
30.39 6,788 5,748 1,040 3,570 3,022 548 1,260 1,096 164 1,740 1,446 294 218 184 34
40 and over 3,197 2,808 389 1,581 1,393 188 543 475 68 974 852 122 93 88 11
Weapons 14,915 14,201 714 7,087 6;675 412 4,213 4,106 107 2,984 2,8C8 176 631 612 19
Under 10 5 4 1 2 1 1 3 3 0 0 0 0 0 0 0
10-19 4,681 4,508 173 2,058 1,968 90 1,566 1,535 31 764 719 45 293 286 7
20-29 6,680 6,359 321 3,224 3,023 201 1,838 1,855 43 1,334 1,264 70 224 217 7
3039 2,561 2,404 157 1,328 1,245 83 538 516 22 613 566 47 82 77 5
40 and over 988 926 62 475 438 37 208 197 11 273 259 14 32 32 0
Escape 1,078 936 142 584 502 82 321 278 43 141 129 12 32 27 5
Under 10 0 0 0 0 0 0 0 0 0 0 0 0 0 0 0
10.19 222 201 21 128 111 17 48 45 3 39 38 1 7 7 0
20-29 556 475 81 285 245 40 18e 158 28 65 57 8 20 15 5
30-39 239 203 36 130 109 21 72 60 12 32 29 3 5 5 0
40 and over 61 57 4 41 37 4 15 15 0 5 5 0 0 0 0
BookrilakIng 810 628 182 243 200 43 72 64 8 467 342 125 28 22 6
Under 10 0 0 0 0 0 0 0 0 0 0 0 0 0 0 0
10-19 3 3 0 1 1 0 0 0 0 ?. 2 0 0 0 0
20.29 93 47 46 29 19 10 13 9 1 46 14 32 8 5 3
30.39 153 103 50 50 36 14 14 12 2 81 48 33 8 7 1
40 and over 561 475 86 163 i44 19 48 43 5 338 278 60 12 10 2
Other 14,774 12,053 2.721 7,715 6,273 1,442 2,897 2,367 530 3,676 3,020 656 486 393 93
Under 10 19 19 0 13 13 0 3 3 0 2 2 0 1 1 0
10-19 2,279 1,906 373 1,119 929 190 540 453 87 516 434 82 104 30 14
20-29 7,054 5,740 1,314 3,619 2,925 694 1,446 1,183 263 1,786 1,471 315 203 161 42
30-39 3,835 3,038 797 2,062 1,632 430 636 508 128 1,014 803 211 123 95 28
40 and over 1,587 1,350 237 902 774 128 272 220 52 358 310 48 55 46 9

TABLE 32MISDEMEANOR ARRESTS, 1986
Arrest Offense by Sex and Race/Ethnic Group of Arrestee
Offense
Wilber
Total
Sex Race/ethnic group
TotalMale FemaleWhite
(not Hispanic) Hispanic Black Other
TOTAL 1,299,222 1,092,735 206,487 678,145 377,814 185,403 57,860 100.0
Assault and battery 75,384 64,065 11,319 36,868 17,647 17,422 3,447 100.0
Petty theft 127,668 82,343 45.325 59,315 36,264 22,207 9,882 100.0
Checks and credit cards 1,404 829 575 917 133 293 61 100.0
Drug law violations 114,816 93,135 21,681 42,084 51,740 18,307 2,685 100.0
Marijuana 30,105 26,362 3,243 17,416 6,030 5,553 1,106 100.0
Other 84,711 66,273 18,438 24,668 45,710 12,754 1,579 100.0
Indecent exposure 2,796 2,592 204 1,677 582 414 123 100.0
Annoying children 636 534 102 333 136 131 36 100.0
Obscene matter 72 56 16 48 7 10 7 100.0
Lewd conduct 9,279 7,382 1,897 4,817 2,163 1,666 633 100.0
Prostitution 21,190 9,149 12,041 9,004 3,871 6,677 1,638 100.0
Drunk 203,517 184,156 19,361 104,528 63,339 26,731 8,869 100.0
Liquor laws 51,522 42,222 9,300 35,320 9,884 3,979 2,339 100.0
Disturbing the peace 14,417 11,853 2,564 7,305 3,542 2,871 699 100.0
Malicious mischief 21,010 19,043 2,267 11,869 4,829 3,523 1,089 100.0
Trespassing 27,886 24,728 3,158 12,410 10,602 3,889 985 100.0
Weapons. 13,175 12,160 1,015 5,621 3,915 3,103 536 100.0
Driving under the influence 339,252 301,413 37,839 199,489 110,715 19,407 9,641 100.0
Hit-and-run 7,721 6,460 1,261 4,506 2,316 493 406 100.0
Selected traffic violations 87,080 76,600 10,480 48,468 17,285 17,914 3,413 100.0
Gambling 1,780 1,660 120 128 696 741 215 100.0
All other 178,317 152,355 25,962 93,438 38,098 35,625 11,156 100.0
Note: Percents may not add to 100.0 because of rounding.Source: Table 35.
2 n 3
Percent
Male Female
84.1 15.9
85.0 15.064.5 35.559.0 41.081.1 18.989.2 10.878.2 21.8
92.7 7.384.0 16.077.8 22.279.6 20.443.2 56.8
90.5 9.581.9 18.182.2 17.8E3.4 10.688.7 11.392.3 7.7
88.8 11.283.7 16.388.0 12.093.3 6.785.4 14.6
Race/ethnic group
White(not Hispanic) Hispanic Black Other
52.2 29.1 14.3 4.5
.8.9 23.4 23.1 4.846.5 28.4 17.4 7.765.3 9.5 20.9 4.336.7 45.1 15.9 2.357.9 20.0 18.4 3.729.1 54.0 15.1 1.9
60.0 20.8 14.8 4.452.4 21.4 20.6 5.766.7 9.7 13.9 '3.751.9 23.3 18.0 6.842.5 18.3 31.5 7.7
51.4 31.1 13.1 4.46J.6 19.2 7.7 4.550.7 24.6 19.9 4.855.7 22.7 16.5 5.144.5 38.0 13.9 3.542.7 29.7 23.6 4.1
58.8 32.6 5.7 2.858.4 30.0 6.4 5.355.7 19.8 20.6 3.9
7.2 39.1 41.6 12.152.4 21.4 20.0 6.3
2 n 4
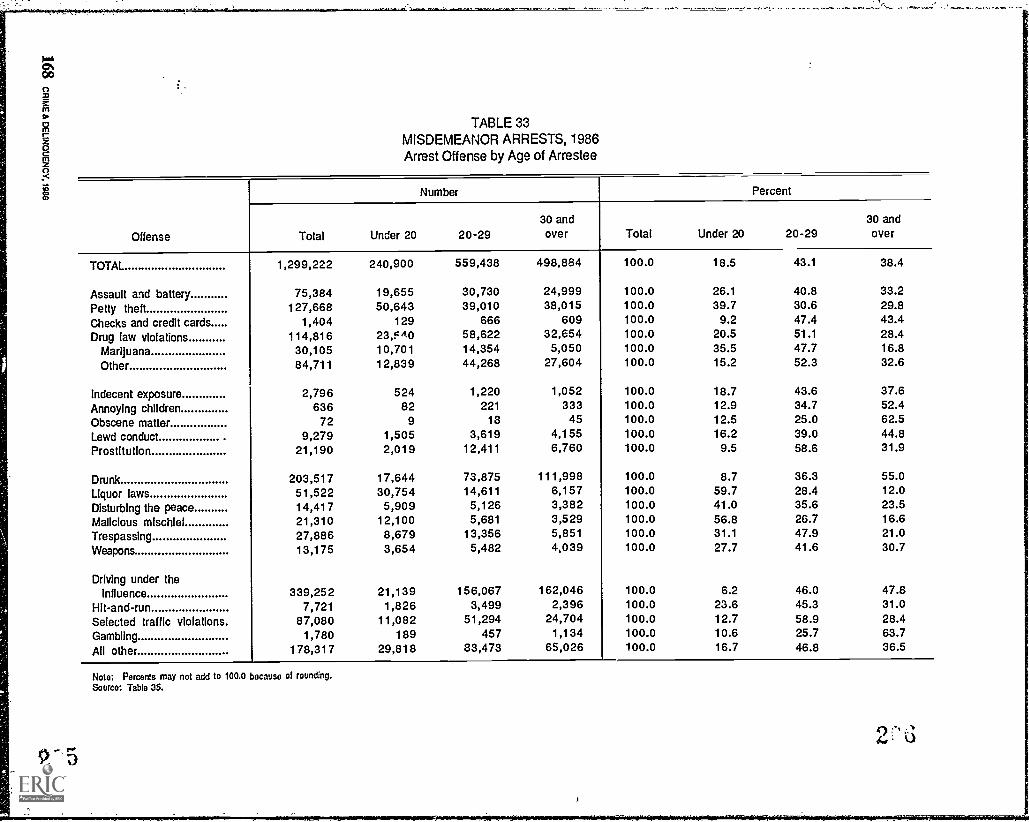
g
TABLE 33MISDEMEANOR ARRESTS, 1986Arrest Offense by Age of Arrestee
Offense
Number Percent
Total Under 20 20-2930 andover Total Under 20 20-29
30 andover
TOTAL 1,299,222 240,900 559,438 498,884 100.0 18.5 43.1 38.4
Assault and battery 75,384 19,655 30,730 24,999 100.0 26.1 40.8 33.2
Petty theft 127,668 50,643 39,010 38,015 100.0 39.7 30.6 29.8
Checks and credit cards 1,404 129 666 609 100.0 9.2 47.4 43.4
Drug law violations 114,816 23,F40 58,622 32,654 100.0 20.5 51.1 28.4
Marijuana 30,105 10,701 14,354 5,050 100.0 35.5 47.7 16.8
Other 84,711 12,839 44,268 27,604 100.0 15.2 52.3 32.6
Indecent exposure 2,796 524 1,220 1,052 100.0 18.7 43.6 37.6
Annoying children 636 82 221 333 100.0 12.9 34.7 52.4
Obscene matter 72 9 18 45 100.0 12.5 25.0 62.5
Lewd conduct 9,279 1,505 3,619 4,155 100.0 16.2 39.0 44.8
Prostitution 21,190 2,019 12,411 6,760 100.0 9.5 58.6 31.9
Drunk 203,517 17,644 73,875 111,998 100.0 8.7 36.3 55.0
Liquor laws 51,522 30,754 14,611 6,157 100.0 59.7 28.4 12.0
Disturbing the peace 14,417 5,909 5,126 3,382 100.0 41.0 35.6 23.5
Malicious mischief 21,310 12,100 5,681 3,529 100.0 56.8 26.7 16.6
Trespassing 27,886 8,679 13,356 5,851 100.0 31.1 47.9 21.0
Weapons 13,175 3,654 5,482 4.039 100.0 27.7 41.6 30.7
Driving under theinfluence 339,252 21,139 156,067 162,046 100.0 6.2 46.0 47.8
Hit-and-run 7,721 1,826 3,499 2,396 100.0 23.6 45.3 31.0
Selected traffic violations. 87,080 11,082 51,294 24,704 100.0 12.7 58.9 28.4
Gambling 1,780 189 457 1,134 100.0 10.6 25.7 63.7
All other 178,317 29,818 83,473 65,026 100.0 16.7 46.8 36.5
Note: Percents may not add to 100.0 because of rounding.Source: Table 35.
0 -'A., 0
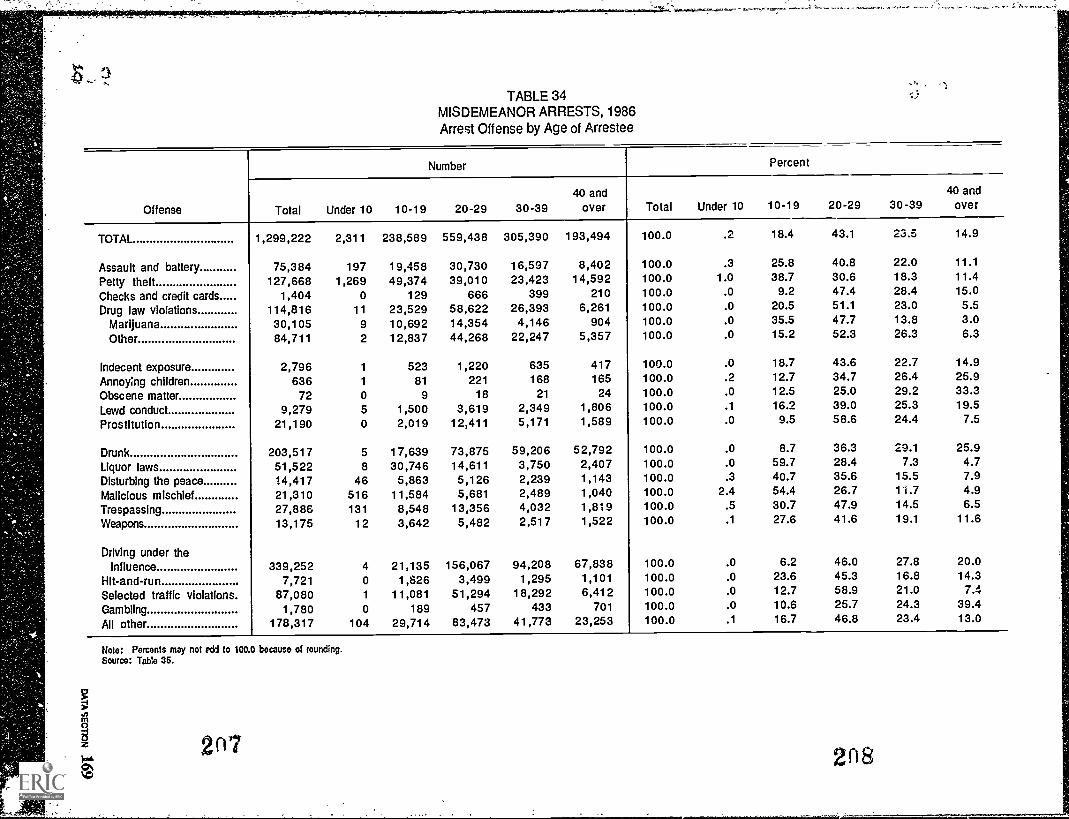
,v
TABLE 34MISDEMEANOR ARRESTS, 1986Arrest Offense by Age of Arrestee
Offense
Number Percent
Total Under 10 10-19 20-29 30-3940 and
over Total Under 10 10-19 20-29 30-3940 and
over
TOTAL 1,299,222 2,311 238,589 559,438 305,390 193,494 100.0 .2 18.4 43.1 23.5 14.9
Assault and battery 75,384 197 19,458 30,730 16,597 8,402 100.0 .3 25.8 40.8 22M 11.1
Petty theft 127,668 1,269 49,374 39,010 23,423 14,592 100.0 1.0 38.7 30.6 18.3 11.4
Checks and credit cards 1,404 0 129 666 399 210 100.0 .0 9.2 47.4 28.4 15.0
Drug law violations 114,816 11 23,529 58,622 26,393 6,261 100.0 .0 20.5 51.1 23.0 5.5
Marijuana 30,105 9 10,692 14,354 4,146 904 100.0 .0 35.5 47.7 13.8 3.0
Other 84,711 2 12,837 44,268 22,247 5,357 100.0 .0 15.2 52.3 26.3 6.3
Indecent exposure 2,796 1 523 1,220 635 417 100.0 .0 18.7 43.6 22.7 14.9
Annoying children 636 1 81 221 168 165 100.0 .2 12.7 34.7 26.4 25.9
Obscene matter 72 0 9 18 21 24 100.0 .0 12.5 25.0 29.2 33.3
Lewd conduct 9,279 5 1,500 3,619 2,349 1,806 100.0 .1 16.2 39.0 25.3 19.5
Prostitution 21,190 0 2,019 12,411 5,171 1,589 100.0 .0 9.5 58.6 24.4 7.5
Drunk 203,517 5 17,639 73,875 59,206 52,792 100.0 .0 8.7 36.3 29.1 25.9
Liquor laws 51,522 8 30,746 14,611 3,750 2,407 100.0 .0 59.7 28.4 7.3 4.7
Disturbing the peace 14,417 46 5,863 5,126 2,239 1,143 100.0 .3 40.7 35.6 15.5 7.9
Malicious mischief 21,310 516 11,584 5,681 2,489 1,040 100.0 2.4 54.4 26.7 11.7 4.9
Trespassing 27,886 131 8,548 13,356 4,032 1,819 100.0 .5 30.7 47.9 14.5 6.5
Weapons 13,175 12 3,642 5,482 2,517 1,522 100.0 .1 27.6 41.6 19.1 11.6
Driving under theInfluence 339,252 4 21,135 156,067 94,208 67,838 100.0 .0 6.2 46.0 27.8 20.0
Hit-and-run 7,721 0 1,826 3,499 1,295 1,101 100.0 .0 23.6 45.3 16.8 14.3
Selected traffic violations. 87,080 1 11,081 51,294 18,292 6,412 100.0 .0 12.7 58.9 21.0 7.4
Gambling 1,780 0 189 457 433 701 100.0 .0 10.6 25.7 24.3 39.4
All other 178,317 104 29,714 83,473 41,773 23,253 100.0 .1 16.7 46.8 23.4 13.0
Note: Percents may not nil to 100.0 because of rounding.Source: Table 35.
2012 n8

TABLE 35MISDEMEANOR ARRESTS, 1986
Arrest Offense by Age, Sex, and Race/Ethnic Group of Arrestee
Offense and age
Total White (not Hispanic) Hispanic Black Other
Total Male Female Total Male Female Total Male Female Total Male Female Total Male Female
TOTAL 1,299,222 1,092,735 206,487 678,145 558,573 119,572 377,814 337,408 40,406 185,403 149 555 35,848 57,860 47,199 10,661Under 10 2,311 2,025 286 1,096 964 132 517 449 68 526 459 67 172 153 1910-19 238,589 191,990 46,599 132,027 104,140 27,887 65,856 56,029 9,827 29,270 22,614 6,656 11,436 9,207 2,22920-29 559,438 472,907 86,531 275,424 228,678 46,746 184,944 166,907 18,037 77,053 59,203 17,850 22,017 18,119 3,89830-39 305,390 258,149 47,241 157,663 130,329 27,334 82,621 74,075 8,546 50,332 41,747 8,585 14,774 11,998 2,77640 and over 193,494 167,664 25,830 111,935 94,462 17,473 43,876 39,948 3,928 28,222 25,532 2,690 9,461 7,722 1,739
Assault and battery 75,384 64,065 11,319 36,868 31,045 5,823 17,647 15,475 2,172 17,422 14,592 2,830 3,447 2,953 494Under 10 197 175 22 104 92 12 29 27 2 60 53 7 4 3 1
10-19 19,458 15,398 4,060 9,226 7,218 2,008 4,781 3,892 889 4,563 3,538 1,025 888 750 13820-29 30,730 26,690 4,040 14,628 12,600 2,028 7,730 6,967 763 7,093 6,023 1,070 1,279 1,100 17930-39 16,597 14,482 2,115 8,190 7,074 1,116 3,501 3,160 341 4,076 3,532 544 830 716 11440 and over 8,402 7,320 1,082 4,720 4,061 659 1,606 1,429 177 1,630 1,446 184 446 384 62
Petty theft 127,668 82,343 45,325 59,315 Z8,106 21,209 36,264 24,369 11,895 22,207 13,928 8,279 9,882 5,940 3,942Under 10 1,269 1,079 190 510 435 75 296 248 48 329 277 52 134 119 15
10-19 49,374 33,223 16,151 24,880 16,600 8,280 13,060 9,164 3,896 7,453 4,707 2,746 3,981 2,752 1,22920-29 39,010 24,574 14,436 15,541 9,920 5,621 13,546 9,102 4,444 7,332 4,139 3,193 2,591 1,413 1,17830.39 23,423 14,926 8,497 10,359 6,657 3,702 6,041 3,867 2,174 5,162 3,425 1,737 1,861 977 88440 and over 14,592 8,541 6,051 8,025 4,494 3,531 3,321 1,988 1,333 1,931 1,380 551 1,315 679 636
Checks and creditcards 1,404 829 575 917 538 379 133 89 44 293 165 128 61 37 24Under 10 0 0 0 0 0 0 0 0 0 0 0 0 0 0 0
10.19 129 83 46 82 46 36 23 19 4 17 12 5 7 6 1
20-29 666 371 295 450 246 204 54 30 24 131 80 51 31 15 16
30.39 399 235 164 232 145 87 40 29 11 113 51 62 14 10 440 and over 210 140 70 153 101 52 16 11 5 32 22 10 9 6 3
Drug law violations 114,816 93,135 21,681 42,084 32,013 10,071 51,740 43,558 8,182 18,307 15,378 2,929 2,685 2,186 499Under 10 11 9 2 5 4 1 3 3 0 2 2 0 1 0 1
10-19 23,529 19,444 4,085 9,169 7,234 1,935 11,310 9,571 1,739 2,529 2,216 313 521 423 9820-29 58;622 46,738 11,884 20,615 15,254 5,361 27,887 23,196 4,691 8,790 7,213 1,577 1,330 1,075 25530-39 26,393 21,394 4,999 10,388 7,931 2,457 9,909 8,377 1,532 5,426 4,544 882 670 542 12840 and'over 6,261 5,550 711 1,907 1,590 317 2,631 2,411 220 1,560 1,403 157 163 146 17
Marijuana 30,105 26,862 3,243 17,416 15,147 2,269 6,030 5,627 403 5,553 5,083 470 1,106 1,005 101
Under 10 9 7 2 4 3 1 2 2 0 2 2 0 1 0 1
10-19 10,692 9,377 1,315 6,239 5,316 923 2,494 2,271 223 1,635 1,501 134 324 289 3520.29 14,354 12,996 1,358 8,206 7,271 935 2,781 2,850 131 2,824 2,578 246 543 497 4630.39 4,146 3,679 467 2,470 2,127 343 623 584 39 866 795 71 187 173 14
40,and over 904 803 101 497 430 67 130 120 10 226 207 19 51 46 5
Other thug lawviolations 84,711 66,273 18,438 24,668 16,866 '7,802 45,710 37,931 7,779 12,754 10,205 2,459 1,579 1,181 398Under 10 2 2 0 1 1 0 1 1 0 0 0 o 0 0 0
10-19 12,837 10,067 2,770 2,930 1,918 1,012 8,816 7,300 1,516 894 715 179 197 134 6320.29 44,268 33,742 10,526 12,409 7,983 4,426 25,106 20,546 4,560 5,966 4,635 1,331 787 578 20930-39 22,247 17,715 4,532 7,918 5,804 2,114 9,286 7,793 1,493 46660 3,749 811 483 369 11440 and over 5,357 4,747 610 1,410 1,160 250 2,501 2,291 210 1,334 1,196 138 112 100 12
Indecent exposure 2,796 2,592 204 1,677 1,577 100 582 567 15 414 326 88 123 122 1
Under 10 1 1 0 1 1 0 0 0 0 0 0 0 0 0 0
10-19 523 488 35 347 321 26 90 88 2 61 55 6 25 24 1
20-29 1,220 1,091 129 690 638 52 274 j 267 7 204 134 70 52 52 0
30-39 635 601 34 369 351 18 140 ' 135 5 102 91 11 24 24 0
40.and over 417 411 6 270 266 4 78 77 1 47 46 1 22 22 0

TABLE 35 - continuedMISDEMEANOR ARRESTS, 1986
Arrest Offense by Age, Sex, and Race/Ethnic Group of Arrestee
t
. -,Offense and age,
Total White (not Hispanic) Hispanic Black Other
Total Male Female Total Male Female Total Male Female Total Male Female Total M.-Je Female
-'iknfioYing,cChiliiren 636 534 102, 333 297 36 136 128 8 131 79 52 36 30 6Under -10 1 1 0 1 1 0 0 0 0 0 0 0 0 0 01p-19- , 81 69 12 40 36 4 15 15 0 22 15 7 4 3 1
''20T29 221 161 60 86 69 17 56 52 4 69 32 37 10 3 2'30-39., 168, 143 25 92 80 12 35 32 3 28 21 7 13 10 3
-40. arid:tyer 165 16G 5 114' 111 3 30 29 1 12 11 1 9 9 0
. Obscene: matter 72 56 16 48 40 8 7 5 2 10 8 2 7 3 4`,Under 10 0 ,0 0 0 0 0 0 0 0 0 0 0 0 0 0
l'046 , 9 8 1 5 5 0 2 2 0 1 1 0 I 0 1
20,49' 18 11 7 10 6 4 2 2 0 4 3 1 2 0 2
30.39 16 5 14 12 2 3 1 2 3 2 1 1 1 0
40:end:over 24 21 3 19 17 2 0 0 0 2 2 0 3 2 1
_Lewd:Conduct 9,279 7,382 1,897 4,817 3,963 854 2,163 1,943 220 1,666 934 732 633 542 91
Under 10' 5 4 1 2 1 1 1 1 0 2 2 0 0 0 01,0;19' 1,50k) 1,212 288 576 449 127 437 388 49 349 245 104 138 130 8
20.29 3,619 2,504 1,115 1,668 1,209 459 920 808 112 817 318 499 214 169 4530.39 2,349 1,941 408 1,286 1,068 218 529 483 46 363 247 116 171 143 2840-and oVer 1,806 1,721 85 1,285 1,236 49 276 263 13 135 122 13 110 100 10
Prostitution 21,190 9,149 12,041 9,004 3,803 5,201 3;871 2,602 1,269 6,677 1,668 5,009 1,638 1,076 562Uhder io 0 0 0 0 0 0 0 0 0 0 0 0 0 0 0
10-19 2,019 700 1,319' 921 274 647 347 252 95 667 125 542 84 49 35'20-29 12,411 4,774 7;637 4,905 '1,738 3,167 2,352 1,542 810 4,334 954 3,380 820 540 28030.39' 5,171 2,429 2,742 2,268 1,027 1,241 948 624 324 1,432 445 9C7 523 333 19040 and, over 1,589 1,246 343 910 764 146 224 184 40 244 144 100 211 154 57
Drunk -203,517 184,156 19,361 104;528 92;351 12,177 63,389 60,296 3,093 20,731 23,679 3,052 8,869 7,830 1,039,Under 10 5 4 1 2 2 0 3 2 1 0 0 0 0 0 0
10A9 17;639 15;386 2,253 9,629 8,090 1,539 6,414 5,933 481 926 791 135 670 572 98,20-29 73,875 67,089 6,786 35,127 31,173 3,954 27,234 26,069 1,165 8,254 6,960 1,294 3,260 2,887 37330- 39..., 59,206 53,193 6,013 30,582 26,895 3,687 16,198 15,358 84C 9,600 8,459 1,141 2,826 2,481 34540, and over '52,792 48,484 4,308 29,1E8 26,191 2,997 13,540 12,934 606 7,951 7,469 482 2,113 1,890 223
Liquor la./s - 51,522 42,222 9,300 35,320 28,127 7,193 9,884 8,669 1,215 3,979 3,525 454 2,339 1,901 438Under 10 8 4 4 7 3 4 1 1 0 0 0 0 0 0 0
10-19 30,746 24,755 5,991 23,370 18,252 5,118 5,082 4,522 560 1,218 1,081 137 1,076 900 17620.29* 14,611 12,417 2,194 9,008 7,514 1,494 3,311 2,915 396 1,679 1,477 202 613 511 102
' 30-39 3,750 3,096 654 1,686 1,368 318 993 816 177 711 633 78 360 279 81
40 and over 2,407 1,95(' 457 1,249 990 259 497 415 82 371 334 37 290 211 79
Disturbing the,peace 14,417 11,853 2,564 7,305 5,982 1,323 3,542 3,000 542 2,871 2,296 575 699 575 124Under 10 46 34 12 23 18 5 15 8 7 8 8 0 0 0 0
10.19 5,863 4,700 1,163 2,748 2,190 558 1,633 1,323 310 1,170 920 250 312 267 4520.29 5,126 4,367 759 2,676 2,295 381 1,233 1,088 145 1,003 805 198 214 179 3530-39 2,239 1,839 400 1,157 930 227 476 423 53 480 393 87 126 93 3340 and over 1,143 913 230 701 549 152 185 158 27 210 170 40 47 36 11
Malicious mischief 21,310 19,043 2,267 11,869 10,589 1,280 4,829 4,441 388 3,523 3,042 481 1,089 971 118Under 10 516 487 29 315 301 14 110 101 9 68 62 6 ,.3 23 010-19 11,584 10,420 1,164 6,731 5,971 760 2,812 2,593 219 1,443 1,309 134 :08 547 51
20.29 5,681 5,066 615 2,95G 2,659 291 1,282 1,197 85 1,174 971 203 275 239 3630-39 2,489 2,177 312 1,263 1,128 135 470 419 51 632 527 105 124 103 21
40 and over 1,040 893 147 610 530 80 155 131 24 206 173 33 69 59 10
ps 211. 212

TABLE 36 - continuedMISDEMEANOR ARRESTS, 1986
Arrest Offense by Age, Sex, and Race/Ethnic Group of Arrestee
Offense and age
Total White (not Hispanic) Hispanic Black Other
Total Male Female Total Male Female Total Male Female Total Male Female Total Male Female
Trespassing 27,886 24,728 3,158 12,410 10,360 2,050 10,602 10,135 467 3,889 3,403 486 985 830 159
Under 10 131 117 14 49 38 11 41 40 1 37 35 2 4 4 0
10-19 8,548 7,242 1,306 5,493 4,546 947 1,619 1,402 217 1,110 1,006 104 326 288 38
20-29 13,356 12,360 996 4,010 3,477 533 7,360 7,195 165 1,603 1,372 231 383 316 67
30-39 4,032 3,540 492 1,699 1,400 299 1,340 1,230 60 812 704 108 181 156 25
40 and over 1,819 1,469 350 1,159 899 260 242 218 24 327 286 41 91 66 25
Weapons 13,175 12,160 1,015 5,621 5,107 514 3,915 3,747 168 3,103 2,794 309 536 512 24
Under 10 12 12 0 6 6 0 1 1 0 5 5 0 0 0 0
10-19 3,642 3,376 266 1,391 1,274 117 1,120 1,066 54 961 872 89 170 164 6
20-29 5,482 5,087 395 2,242 2,049 193 1,732 1,662 70 1,285 1,167 118 223 209 14
30-39 2,517 2,280 237 1,234 1,094 140 718 689 29 471 406 65 94 91 3
40 and over 1,522 1,405 117 748 684 64 344 329 15 381 344 37 49 48 1
Driving under theInfluence 339,252 301,413 37,839 199,489 169,823 29,666 110,715 105,277 5,438 19,407 17,550 1,857 9,641 8,763 878
Under 10 4 4 0 2 2 0 1 1 0 1 1 0 0 0 0
10-19 21,135 18,930 2,205 12,602 10,818 1,784 7,693 7,333 360 453 427 26 387 352 35
20-29 156,067 140,006 16,061 87,200 74,651 12,549 58,401 55,90P 2,495 6,354 5,688 666 4,112 3,761 351
30.39 94,208 82,738 11,470 55,240 46,502 8,738 29,608 27,904 1,704 6,272 5,545 727 3,088 2,787 301
40 and over 67,838 59,735 8,103 44,445 37,850 6,595 15,012 14,133 879 6,327 5,889 438 2,054 1,863 191
Hlt-and-run 7,721 6,460 1,261 4,506 3,622 884 2,316 2,086 230 493 415 78 406 337 69
Under 10 0 0 0 0 0 0 0 0 0 0 0 0 0 0 0
10-19 1,826 1,504 322 1,017 791 226 579 512 67 132 116 16 98 85 13
20-29 3,499 3,039 460 1,919 1,610 309 1,214 1,118 96 201 169 32 165 142 23
30-39 1,295 1,061 234 784 629 155 338 294 44 98 80 18 75 58 17
40 and over 1,101 856 245 786 592 194 185 162 23 62 50 12 68 52 16
Selected trafficviolations 87,080 76,600 10,480 48,468 42,515 5,953 17,285 15,7' 0 1,525 17,914 15,300 2,614 3,413 3,025 388
Under 10 1 1 0 0 0 0 1 1 0 0 0 0 0 0 0
10-19 11,081 10,232 849 7,090 6,540 550 2,155 2,051 104 1,440 1,270 170 396 371 25
20-29 51,294 44,903 6,391 28,504 24,955 3,549 10,881 9,958 923 9,951 8,259 1,694 1,956 1,731 225
30-39 18,292 15,738 2,554 9,577 8,117 1,460 3,159 2,774 385 4,798, 4,184 608 764 663 101
40 and over 6,412 5,726 686 3,297 2,903 394 1,089 976 113 1,729 1,587 142 297 260 37
Gambling 1,780 1,660 120 128 94 34 696 679 17 741 724 17 215 163 52
Under 10 0 0 0 0 0 0 0 0 0 0 0 0 0 0 0
10-19 189 185 4 6 6 0 22 20 2 133 131 2 28 28 0
20.29 457 439 18 19 13 6 215 213 2 183 179 4 40 34 6
30-39 433 401 32 35 27 8 253 246 7 86 83 3 59 45 14
40 and over 701 635 66 68 48 20 206 200 6 339 331 8 88 56 32
All other 178,317 152,355 25,962 93,438 78,621 14,817 38,098 34,582 3,516 35,625 29,749 5,876 11,156 9,403 1,753
Under 10 104 91: 11 69 60 9 15 15 0 14 14 0 6 4 2
10-19 29,714 24,635 5,079 16,704 13,479 3,225 6,662 5,883 779 4,622 3,777 845 1,726 1,496 230
20-29 83,473 71,220 12,253 43,176 36,602 6,574 19,260 17,620 1,640 16,590 13,260 3,330 4,447 3,738 709
30-39 41,773 35,919 5,854 21,208 17,894 3,314 7,922 7,164 758 9,673 8,375 1,298 2,970 2,486 484
40 and over 23,253 20,488 2,765 12,281 10,586 1,695 4,239 3,900 339 4,726 4,323 403 2,007 1,679 328
213 2-
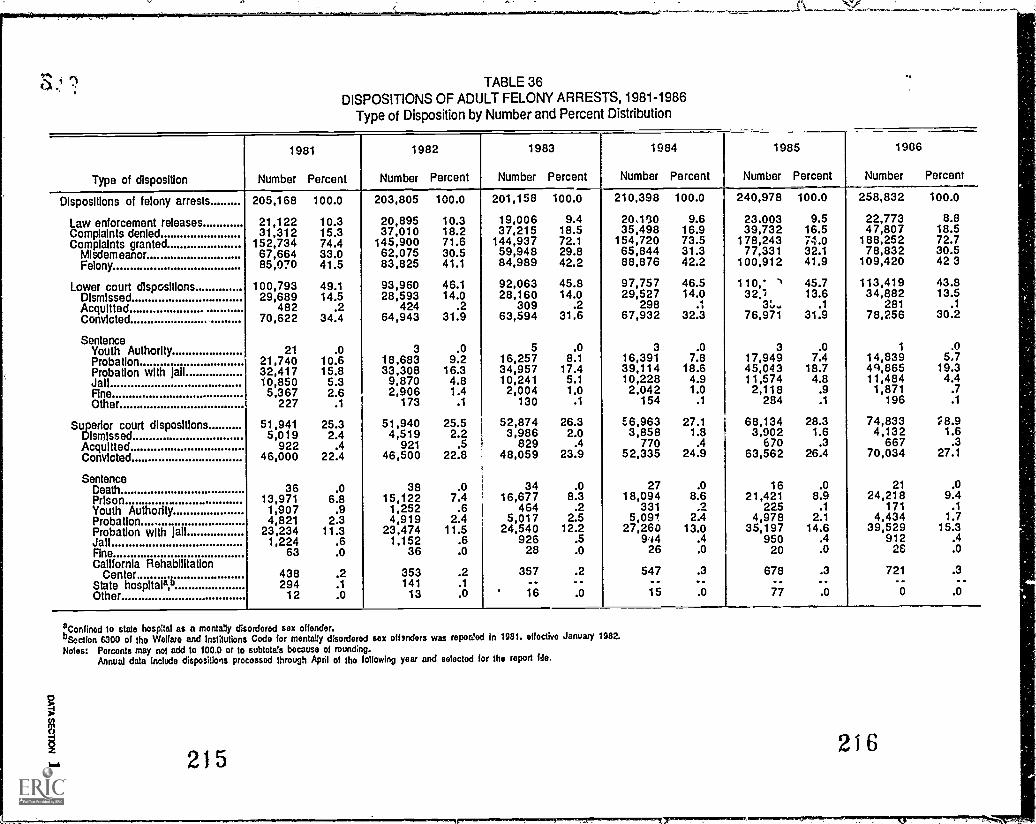
TABLE 36DISPOSITIONS OF ADULT FELONY ARRESTS, 1981-1986
Type of Disposition by Number and Percent Distribution
4
Type of disposition
1981
Number Percent
1982
Number Percent
1983
Number Percent
1984
Number Percent
1985
Number Percent
1906
Number Percent
Dispositions of felony arrests 205,168 100.0 203,805 100.0 201,158 100.0 210,398 100.0 240,978 100.0 258,832 100.0
Law enforcement releases 21,122 10.3 20,895 10.3 19,006 9.4 20,190 9.6 23.003 9.5 22,773 8.8Complaints denied 31,312 15.3 37,010 18.2 37,215 18.5 35,498 16.9 39,732 16.5 47,807 18.5Complaints granted 152,734 74.4 145,900 71.6 144,937 72.1 154,720 73.5 178,243 74.0 188,252 72.7
Misdemeanor 67,664 33.0 62,075 30.5 59,948 29.8 65,844 31.3 77,331 32.1 78,832 30.5Felony 85,070 41.5 83,825 41.1 84,989 42.2 88,876 42.2 100,912 41.9 109,420 42 3
Lower court dispositions 100,793 49.1 93,960 46.1 92,063 45.8 97,757 46.5 110, 45.7 113,419 43.8Dismissed 29,689 14.5 28,593 14.0 28,160 14.0 29,527 14.0 32,1 13.6 34,882 13.5Acquitted 482 .2 424 .2 309 .2 298 .1 3t." .1 281 .1
Convicted 70,622 34.4 64,943 31.9 63,594 31.6 67,932 32.3 76,971 31.9 78,256 30.2
SentenceYouth Authority 21 .0 3 .0 5 .0 3 .0 3 .0 1 .0
Probation 21,740 10.6 18,683 9.2 16,257 8.1 16,391 7.8 17,949 7.4 14,839 5.7Probation with Jail 32,417 15.8 33,308 16.3 34,957 17.4 39,114 18.6 45,043 18.7 0,865 19.3Jail 10,850 5.3 9,870 4.8 10,241 5.1 10,228 4.9 11,574 4.8 11,484 4.4Fine 5,367 2.6 2,906 1.4 2,004 1.0 2,042 1.0 2,118 .9 1,871 .7
Other 227 .1 173 .1 130 .1 154 .1 284 .1 196 .1
Superior court dispositions 51,941 25.3 51,940 25.5 52,874 26.3 6,963 27.1 68,134 28.3 74,833 ;8.9Dismissed 5,019 2.4 4,519 2.2 3,986 2.0 3,858 1.8 3,902 1.6 4,132 1.6Acquitted 922 .4 921 .5 829 .4 770 .4 670 .3 667 .3
Convicted 46,000 22.4 46,500 22.8 48,059 23.9 52,335 24.9 63,562 26.4 70,034 27.1
SentenceDeath 36 .0 38 .0 34 .0 27 .0 16 .0 21 .0
Prison.... 13,971 6.8 15,122 7.4 16,677 8.3 18,094 8.6 21,421 8.9 24,218 9.4Youth Authority 1,907 .9 1,252 .6 464 .2 331 .0 225 .1 171 .1
Probation 4,821 2.3 4,919 2.4 5,017 2.5 5,091 2.4 4,978 2.1 4,434 1.7
Probation with Jail 23,234 11.3 23,474 11.5 24,540 12.2 27,260 13.0 35,197 14.6 39,529 15.3Jail 1,224 .6 1,152 .6 926 .5 9,44 .4 950 .4 912 .4
Fine 63 .0 36 .0 28 .0 26 .0 20 .0 28 .0
California RehabilitationCenter 438 .2 353 .2 357 .2 547 .3 678 .3 721 .3
State hospitala,6 294 .1 141 .1 -- -- -- -- -- -- -- --Other 12 .0 13 .0 16 .0 15 .0 77 .0 0 .0
a,Confined to state hospital as a mentally disordered sox offender.uSection 6300 of the Welfare and Institutions Code for mentally disordered sox offenders was reporied In 1981. effective January 1982.Notes: Percents may not add to 100.0 or to subtotals because of rounding.
Annual data Include dispositions processed through April of the following year and selected for tho ropon Lie.
215216

TABLE 37ADULT FELONY ARREST DISPOSITIONS, 19814986
By Type of Disposition
Type of disposition1981
Number Percent1982
Number Percent1983
Number Percent1984
Number Percent1985
Number Percent1986
Number Percent
TOTAL 205,168 100.0 203,805 100.0 201,158 100.0 210,398 100.0 240,978 100.0 258,832 100.0
Law enforcement releases 21,122 10.3 20,895 10.3 19,006 9.4 20,180 9.6 23,003 9.5 22,773 8.8
Complaints denied 31,312 15.3 37,010 18.2 37,215 18.5 35,498 16.9 39,732 16.5 47,807 18.5
Disn1ssed, acquitted 36,112 17.6 34,457 16.9 33,284 16.5 34,453 16.4 37,710 15.6 39,362 15.4
Convicted 116,622 56.8 111,443 54.7 111,653 55.5 120,267 57.2 140,533 58.3 148,290 57.3
Notes: Percents may not add to 100.0 because of rounding.Annual data Include dispositions processed through April of the following year and selected for the report file.
Source: Table 36.
TABLE 38ADULT FELONY ARREST DISPOSITIONS, 1986
Arrest Offense Category by Type of Disposition
Type of disposition
Arrest offend) category
Total
Number Percent
Violent crimes
Number Percent
Property crimes
Number Percent
Drug law violations
Number Percent
All other
Number Percent
TOTAL 258,832 100.0 62,221 100.0 97,463 100.0 75,056 100.0 24,092 100.0
Law enforcement releases 22,773 8.8 6,992 11.2 9,023 9.3 5,655 7.5 1,103 4.6
Complaints denied 47,807 18.5 15,943 25.6 11,650 12.0 15,581 20.8 4,633 19.2
Dismiss3d, acquitted 39,962 15.4 9,632 15.5 11,776 12.1 15,571 20.7 2,983 12.4
Convicted 148,290 57.3 29,654 47.7 65,014 66.7 38,249 51.0 15,373 63.8
Notes: Percents may not add to 100.0 bemuse of rounding.Annual.,datauinclude dispositions processed through April of the following year and selected for the report filo.
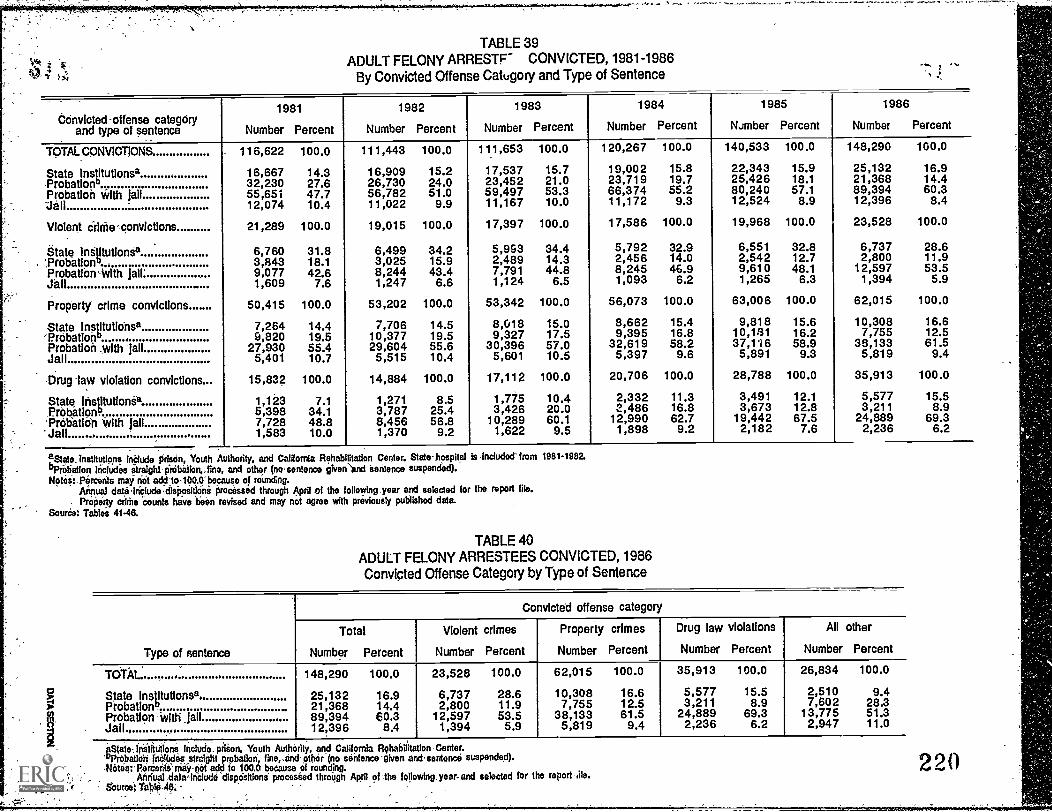
TABLE 39ADULT FELONY ARRESTP" CONVICTED, 1981-1986
By Convicted Offense Catugory and Type of Sentence
Y.`
Convicted-offense categoryand type of sentence
1981
Number Percent
1982
Number Percent
1983
Number Percent
1984
Number Percent
1985
Number Percent
1986
Number Percent
TOTAL CONVICTIONS 116,622 100.0 111,443 100.0 111,653 100.0 120,267 100.0 140,533 100.0 148,290 100.0
State institutions° 16,667 14.3 16,909 15.2 17,537 15.7 19,002 15.8 22,343 15.9 25,132 16.9Probation0 32,230 27.6 26,730 24.0 23,452 21.0 23,719 19.7 25,426 18.1 21,368 14.4Probation With jail 55,651 47.7 56,782 51.0 59,497 53.3 66,374 55.2 80,240 57.1 89,394 60.3Jail 12,074 10.4 11,022 9.9 11,167 10.0 11,172 9.3 12,524 8.9 12,396 8.4
Violent crime -convictions 21,289 100.0 19,015 100.0 17,397 100.0 17,586 100.0 19,968 100.0 23,528 100.0
State lnatutionsa 6,760 31.8 6,499 34.2 5,993 34.4 5,792 32.9 6,551 32.8 6,737 28.6'Probation° 3,843 18.1 3,025 15.9 2,489 14.3 2,456 14.0 2,542 12.7 2,800 11.9Probation with jai 9,077 42.6 8,244 43.4 7,791 44.8 8,245 46.9 9,610 48.1 12,597 53.5Jail 1,609 7.6 1,247 6.6 1,124 6.5 1,093 6.2 1,265 6.3 1,394 5.9
Property crime convictions 50,415 100.0 53,202 100.0 53,342 100.0 56,073 100.0 63,006 100.0 62,015 100.0
State institutions° 7,264 14.4 7,706 14.5 8,018 15.0 8,662 15.4 9,818 15.6 10,308 16.6Probation° 9,820 19.5 10,377 19.5 9,327 17.5 9,395 16.8 10,131 16.2 7,755 12.5
Probation with jail 27,930 55.4 29,604 55.6 30,396 57.0 32,619 58.2 37,116 58.9 39,133 61.5Jail 5,401 10.7 5,515 10.4 5,601 10.5 5,397 9.6 5,891 9.3 5,819 9.4
Drug 'law violation convictions 15,832 100.0 14,884 100.0 17,112 100.0 20,706 100.0 28,788 100.0 35,913 100.0
State institutionSa 1,123 7.1 1,271 8.5 1,775 10.4 2,332 11.3 3,491 12.1 5,577 15.5ProbatIonD 5,398 34.1 3,787 25.4 3,426 20.0 2,486 16.8 3,673 12.8 3,211 8.9ProbatiOn with Jail 7,728 48.8 8,456 56.8 10,289 60.1 12,990 62.7 19,442 67.5 24,889 69.3
`Jail 1,583 10.0 1,370 9.2 1,622 9.5 1,898 9.2 2,182 7.6 2,236 6.2
eState.lnstitutions include Youth Authority, and California Reheinfitation Center. State-hospital is included' from 1981-1982.
uPrdiation Includes straight-Pitibalion,,fina, and other (no sentence given'and sentence suspended).Notest.Percerits may not addlo-100.0"because of rounding.
Annual datalriciude:disposigene processed through April of the following year and selected for the report file.Properly clime counts have been revised and may not agree with previously published data.
Soothe: Tables 41-46.
TABLE 40ADULT FELONY ARRESTEES CONVICTED, 1986Convicted Offense Category by Type of Sentence
Type of sentence
Convicted offense category
Total
Number Percent
Violent crimes
Number Percent
Property crimes
Number Percent
Drug law violations
Number Percent
All other
Number Percent
TOTAL 148,290 100.0 23,528 100.0 62,015 100.0 35,913 100.0 26,834 100.0
State inslitutionSa . 25,132 16.9 6,737 28.6 10,308 16.6 5,577 15.5 2,510 9.4Probationn 21,368 14.4 2,800 11.9 7,755 12.5 3,211 8.9 7,602 28.3Probation 'With 89,394 60.3 12,597 53.5 38,133 61.5 24,889 69.3 13,775 51.3,jallJail 12,396 8.4 1,394 5.9 5,819 9.4 2,236 6.2 2,947 11.0
OState-iithailone Include. prison, Youth Authority, and California Rehabilitation Center.PrObailon.ladades straight probation, fine,,rind,ptherino sentence-given and,sentence suspended).
-14otest'fternenti.rnaY-riat add fo 100.0 because of rounding.AnnualAlaia-include 'dispoSitiona processed throUgh April of -the following, year-and selected for the reportAle.
So tara Table

TABLE 41ADULT FELONY ARRESTEES CONVICTED, 1931Convicted Offense Category by Type of Sentence
Type of sentence
Convicted offense category
Total
Number Percent
Violent crimes
Number Percent
Property crimes
Number Percent
Drug law violations
Number Percent
All other
Number Percent
TOTAL 116,622 100.0 21,289 100.0 50,415 100.0 15,832 100.0 29,086 100.0
Lower court 70,622 60.6 9,678 45.5 28,675 56.9 8,342 52.7 23,927 82.3
Youth Authority 21 .0 2 .0 18 .0 0 .0 1 .0
Probation 21,740 18.6 2,770 13.0 7,079 14.0 2,143 13.5 9,748 33.5
Probation with jail 32,417 27.8 5,188 24.4 16,130 32.0 2,862 18.1 8,237 28.3
Jail 10,850 9.3 1,376 6.5 4,795 9.5 1,453 9.2 3,226 11.1
Fine 5,367 4.6 333 4 1.6 623 1.2 1,811 11.4 2,600 8.9
Other 227 .2 9 .0 30 .1 73 .5 115 .4
Superior court 46,000 39.4 11,611 54.5 21,740 43.1 7,490 47.3 5,159 17.7
Death 36 .0 36 .2 0 .0 0 .0 0 .0
Prison 13,971 12.0 5,718 26.9 6,062 12.0 987 6.2 1,204 4.1
Youth Authority 1,907 1.6 925 4.3 858 1.7 63 .4 61 .2
Probation 4,821 4.1 724 3.4 2,070 4.1 1,340 8.5 687 2.4
Probation with Jall 23,234 19.9 3,889 18.3 11,800 23.4 4,866 30.7 2,679 9.2
Jail 1,224 1.0 233 1.1 606 1.2 130 .8 255 .9
Fine 63 .1 4 10 .0 31 .2 18 .1
California Rehabilitation Center 438 .4 29 .1 315 .6 72 .5 22 .1
State hospitala 294 .3 50 .2 11 .0 1 .0 232 .8
Other 12 .0 3 .0 8 .0 0 .0 1 .o
aConfined to state hospital as a mentally disordered sox offender.Notes: Percents may not add to 100.0 or subtotals because of rounding.
Annual data include dispositions processed through April of the following year and selected for the report file.Property crime and all other counts have been revised and may not agree with previously published data.
221

TABLE 42ADULT FELONY ARRESTEES CONVICTED, 1982Convicted Offense Category by Type of Sentence
Type of sentence
Convicted offense category
Total
Number Percent
Violent crimes
Number Percent
Property crimes
Number Percent
Drug law violations
Number Percent
All other
Number Percent
TOTAL 111,443 100.0 19,015 100.0 53,202 100.0 14,884 100.0 24,342 100.0
Lower court 64,943 58.3 7,967 41.9 31,043 58.3 6,397 43.0 19,536 80.3
Youth Authority 3 .0 1 .0 2 .0 0 .0 0 .0
Probation 18,683 16.8 2,171 11.4 7,602 14.3 1,711 11.5 7,199 29.6
Probation with Jail 33,308 29.9 4,540 23.9 17,858 33.6 2,914 19.6 7,996 32.8
Jail 9,870 8.9 1,049 5.5 4,965 9.3 1,198 8.0 2,658 10.9
Fine 2,906 2.6 193 1.0 581 1.1 546 3.7 1,586 6.5
Other 173 .2 13 .1 35 .1 28 .2 97 .4
Superior court 46,500 41.7 11,048 58.1 22,159 41.7 8,487 57.0 4,806 19.7
Death 38 .0 38 .2 0 .0 0 .0 0 .0
Prison 15,122 13.6 5,839 30.7 6,85b 12.9 1,166 7.8 1,261 5.2
Youth Authority 1,252 1.1 563 3.0 599 1.1 35 .2 55 .2
Probation 4,919 4.4 644 3.4 2,142 4.0 1,485 10.0 648 2.7
Probation with Jail 23,474 21.1 3,704 19.5 11,746 22.1 5,542 37.2 2,482 10.2
Jail 1,152 1.0 198 1.0 550 1.0 172 1.2 232 1.0
Fine 36 .0 2 .0 11 .0 15 .1 8 .0
California Rehabilitation Center 353 .3 28 .1 247 .5 70 .5 8 .0
State hospitala 141 .1 30 .2 2 .0 0 .0 109 .4
Other 13 .0 2 .0 6 .0 2 .0 3 .0
aConfined to state hospital as a mentally disordered sex offender.Notes: Percents may not add to 100.0 or subtotals because of rounding.
Annual data Include dispositions processed through April of the following year and selected for the report file.Property crime and all other counts have been revised and may not agree with previously published data.
224223

TOTAL
"Lower Court,Yet lik:Atithotity'Probationf?t004tIPO' Ath.11111
'FineOther-,
SuperfOr
Prism ;
Y,eitth.AuthOrityProbation.Probation with 'On'
FineCenter....
Other.,
Type' of sentence
TABLE 43ADULT FELONY ARRESTEES CONVICTED, 1983Convicted Offense Category by Type of Sentence
Convicted offense category
Total
Number Percent
Violent crimes
Number Percent
Property crimes
Number Percent
Drug law violations
Number Percent
All other
Number Percent
111,653 100:0 17;397 100.0 53,342 100.0 17,112 100.0 23,802 100.0
'63;594' 57.0 7,100 42.0 31,280 58.6 6,568 38.4 18,446 77.5.0 0 .0 5 :0 0 .0 0 .0
16,257 14.6 1,806 10.4 6,654 12.5 1,480 8.6 6,317 26.534,957 31.3 4,418 25.4 18,888 35.4 3,443 20.1 8,208 34.510,241. 9.2 946 5.4 5,220 9.8 1,446 8.5 2,629 11.02,004 1.8 120 .7 483 .9 186 1.1 1,215 5.1
130 .1 10 .1 30 .1 13 .1 77 .3
48,059 43.0 10,097 58.0 22,062 41.4 10,544 61.6 5,356 22.534 .0 34 ,2 0 .0 0 .0 0 .0
16;677 1k9 5,757 33.1 7,550 14.2 1,652 9.7 1,718 7.2464' .4 175 1.0 241 ,5 23 .1 25 .1
5;017 4;5 543 3.1 2,149 4.0 1,735 10.1 590 2.524,540 22.0 3,373 19.4 11,508 21.6 6,846 40.0 2,813 11.8
926 .8 178 1.0 '381 .7 176 1.0 191 .828 .0 6 .0 6 .0 10 .1 6 .0
357 .3 27 .2 222 .4 100 .6 8 .016 .0 4 .0 5 .0 2 .0 5 .0
Holes: PsrOints:ritsty,not add to.100.0 or subto is because of rour3ing.Anhpal,ditirlaclude.diepOsitioius promised through April of.tho following.year and selected for the report fits.Peopeity Orttne.snd-all'other-Counts live boon revised andsmay not agree with previously published data.
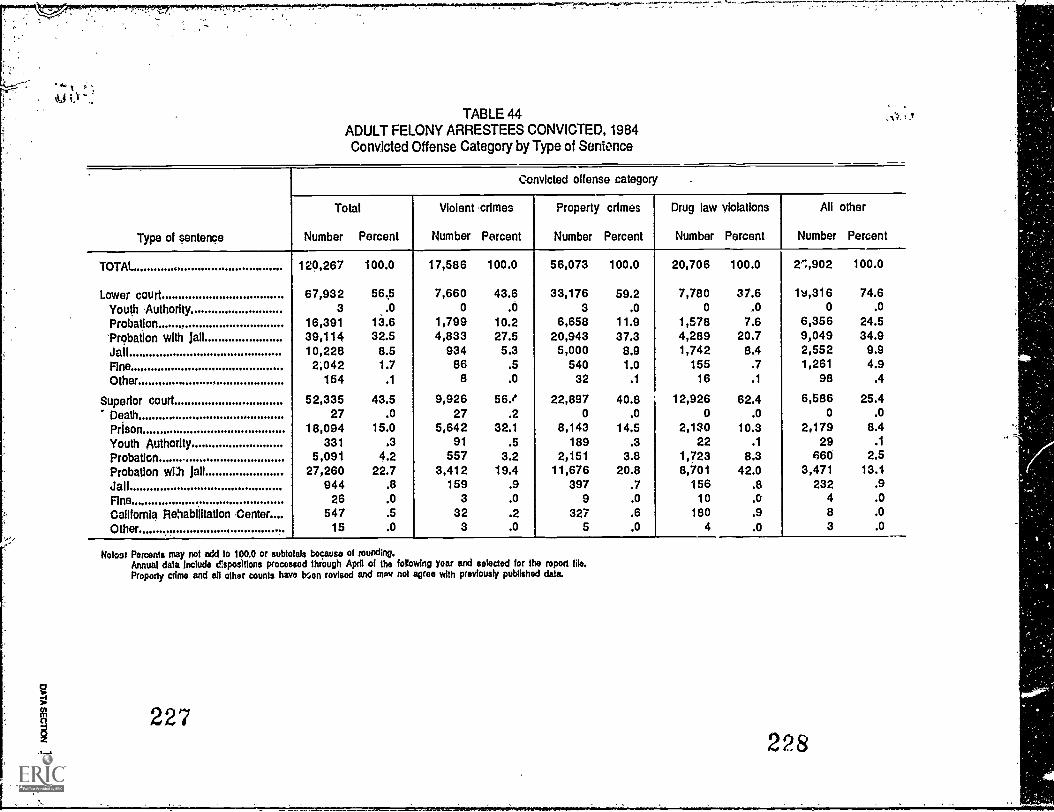
+mot o.4,1
TABLE 44ADULT FELONY ARRESTEES CONVICTED, 1984Convicted Offense Category by Type of Sentence
Type of sentence
Convicted offense category
Total
Number Percent
Violent crimes
Number Percent
Property crimes
Number Percent
Drug law violations
Number Percent
All other
Number Percent
TOTAL. 120,267 100.0 17,586 100.0 56,073 100.0 20,706 100.0 2S,902 100.0
Lower court 67,932 56.5 7,660 43.6 33,176 59.2 7,780 37.6 1u,316 74.6
Youth Authority 3 .0 0 .0 3 .0 0 .0 0 .0
Probation 16,391 13.6 1,799 10.2 6,658 11.9 1,578 7.6 6,356 24.5'Probation with Jail 39,114 32.5 4,833 27.5 20,943 37.3 4,289 20.7 9,049 34.9Jail 10,228 8.5 934 5.3 5,000 8.9 1,742 8.4 2,552 9.9
Fine 2,042 1.7 86 .5 540 1.0 155 .7 1,261 4.9Other 154 .1 8 .0 32 .1 16 .1 98 .4
Superior court 52,335 43.5 9,926 56, 22,897 40.8 12,926 62.4 6,586 25.4
Death 27 .0 27 .2 0 .0 0 .0 0 .0
Prison 18,094 15.0 5,642 32.1 8,143 14.5 2,130 10.3 2,179 8.4
Youth Authority 331 .3 91 .5 189 .3 22 .1 29 .1
Probation 5,091 4.2 557 3.2 2,151 3.8 1,723 8.3 660 2.5
Probation wilt Jail 27,260 22.7 3,412 19.4 11,676 20.8 8,701 42.0 3,471 13.4
Jail 944 .8 159 .9 397 .7 156 .8 232 .9
Fine 26 .0 3 .0 9 .0 10 .0 4 .0
California Rehabilitation Center 547 .5 32 .2 327 .6 180 .9 8 .0
Other 15 .0 3 .0 5 .0 4 .0 3 .0
Not Percents may not red to 100.0 or subto ale because of rounding.Annual data include dispositions processed through April of the following year and seteded for the report file.Properly crime and all other counts have ben revised and may not agree with previously published data.
227228
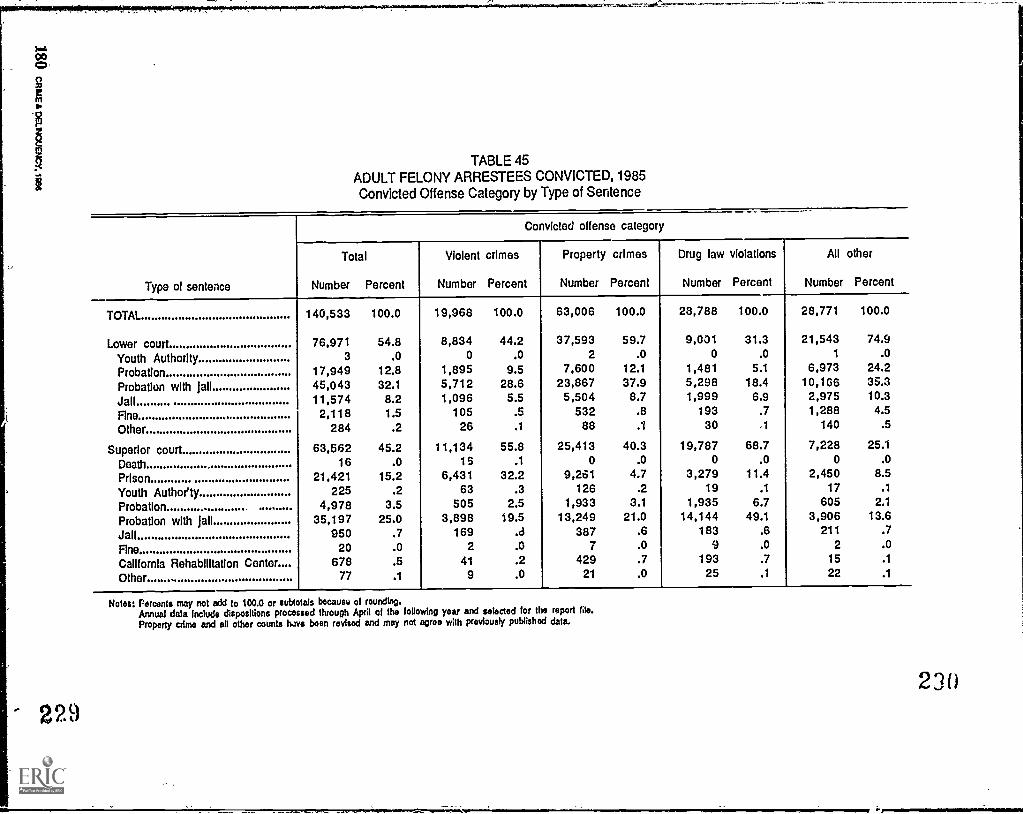
229
TABLE 45ADULT FELONY ARRESTEES CONVICTED, 1985Convicted Offense Category by Type of Sentence
Type of sentence
Convicted offense category
Total
Number Percent
Violent crimes
Number Percent
Property crimes
Number Percent
Drug law violations
Number Percent
All other
Number Percent
TOTAL 140,533 100.0 19,968 100.0 63,006 100.0 28,788 100.0 28,771 100.0
Lower court 76,971 54.8 8,834 44.2 37,593 59.7 9,031 31.3 21,543 74.9
Youth Authority 3 .0 0 .0 2 .0 0 .0 1 .0
Probation 17,949 12.8 1,895 9.5 7,600 12.1 1,481 5.1 6,973 24.2
Probation with ja II 45,043 32.1 5,712 28.6 23,867 37.9 5,298 18.4 10,166 35.3
Jail 11,574 8.2 1,096 5.5 5,504 8.7 1,999 6.9 2,975 10.3
Fine 2,118 1.5 105 .5 532 .8 193 .7 1,288 4.5
Other 284 .2 26 .1 88 .1 30 .1 140 .5
Superior court 63,562 45.2 11,134 55.8 25,413 40.3 19,787 68.7 7,228 25.1
Death 16 .0 15 .1 0 .0 0 .0 0 .0
Prison 21,421 15.2 6,431 32.2 9,261 4.7 3,279 11.4 2,450 8.5
Youth Authority 225 .2 63 .3 126 .2 19 .1 17 .1
Probation 4,978 3.5 505 2.5 1,933 3.1 1,935 6.7 605 2.1
Probation with Jail 35,197 25.0 3,898 19.5 13,249 21.0 14,144 49.1 3,906 13.6
Jail 950 .7 169 .d 387 .6 183 .6 211 .7
Fine 20 .0 2 .0 7 .0 9 .0 2 .0
California Rehabilitation Center 678 .5 41 .2 429 .7 193 .7 15 .1
Other 77 .1 9 .0 21 .0 25 .1 22 .1
Notes: Percents may not odd to 100.0 or subtotals because of rounding.Annual data Include dispositions processed through April of the following year and selected for the report file.
Property alma and at other counts h.vs boon revised and may not agree with previously published data
23(
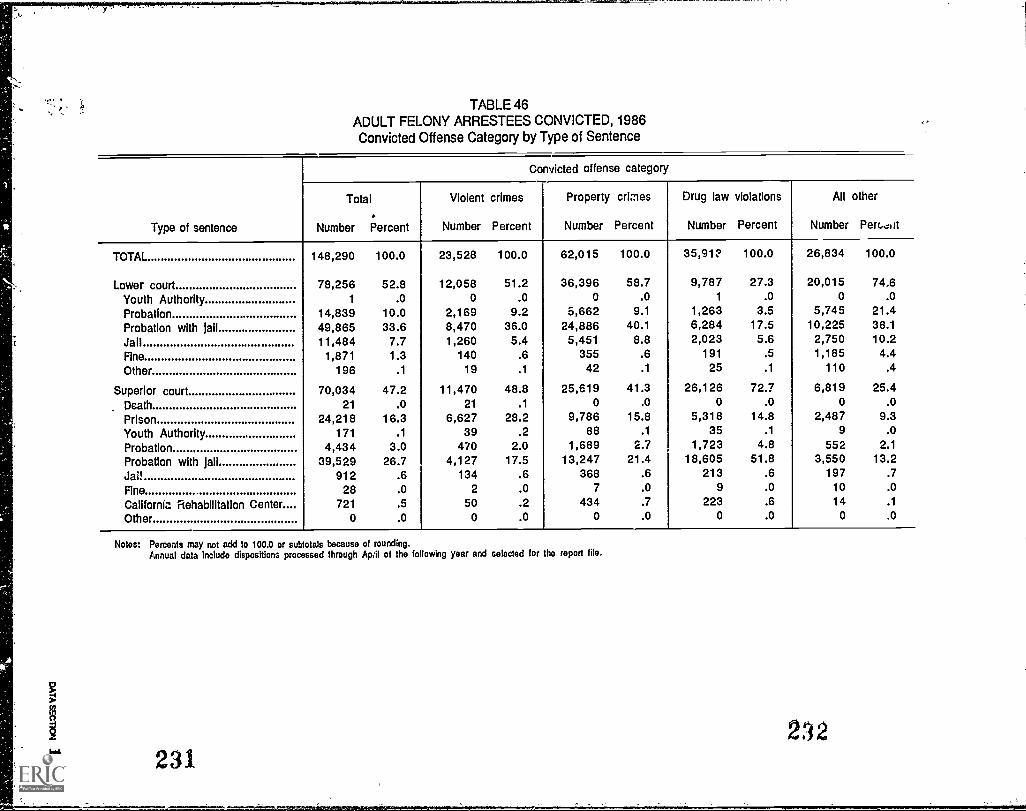
TABLE 46ADULT FELONY ARRESTEES CONVICTED, 1986Convicted Offense Category by Type of Sentence
Type of sentence
Convicted offense category
Total
Number Percent
Violent crimes
Number Percent
Property crimes
Number Percent
Drug law violations
Number Percent
All other
Number PerGlit
TOTAL 148,290 100.0 23,528 100.0 62,015 100.0 35,91? 100.0 26,834 100.0
Lower court 78,256 52.8 12,058 51.2 36,396 58.7 9,787 27.3 20,015 74.6
Youth Authority 1 .0 0 .0 0 .0 1 .0 0 .0
Probation 14,839 10.0 2,169 9.2 5,662 9.1 1,263 3.5 5,745 21.4
Probation with jail 49,865 33.6 8,470 36.0 24,886 40.1 6,284 17.5 10,225 38.1
Jail 11,484 7.7 1,260 5.4 5,451 8.8 2,023 5.6 2,750 10.2
Fine 1,871 1.3 140 .6 355 .6 191 .5 1,185 4.4
Other 196 .1 19 .1 42 .1 25 .1 110 .4
Superior court 70,034 47.2 11,470 48.8 25,619 41.3 26,126 72.7 6,819 25.4
Death 21 .0 21 .1 0 .0 0 .0 0 .0
Prison 24,218 16.3 6,627 28.2 9,786 15.8 5,318 14.8 2,487 9.3
Youth Authority 171 .1 39 .2 88 .1 35 .1 9 .0
Probation 4,434 3.0 470 2.0 1,689 2.7 1,723 4.8 552 2.1
Probation with Jail 39,529 26.7 4,127 17.5 13,247 21.4 18,605 51.8 3,550 13.2
Jai! 912 .6 134 .6 368 .6 213 .6 197 .7
Fine 28 .0 2 .0 7 .0 9 .0 10 .0
California Rehabilitation Center 721 .5 50 .2 434 .7 223 .6 14 .1
Other 0 .0 0 .0 0 .0 0 .0 0 .0
Notes: Percents may not add to 100.0 or sub otals because of rounding.Annual data include dispositions processed through April of tho following year and selected for the report file.
232231
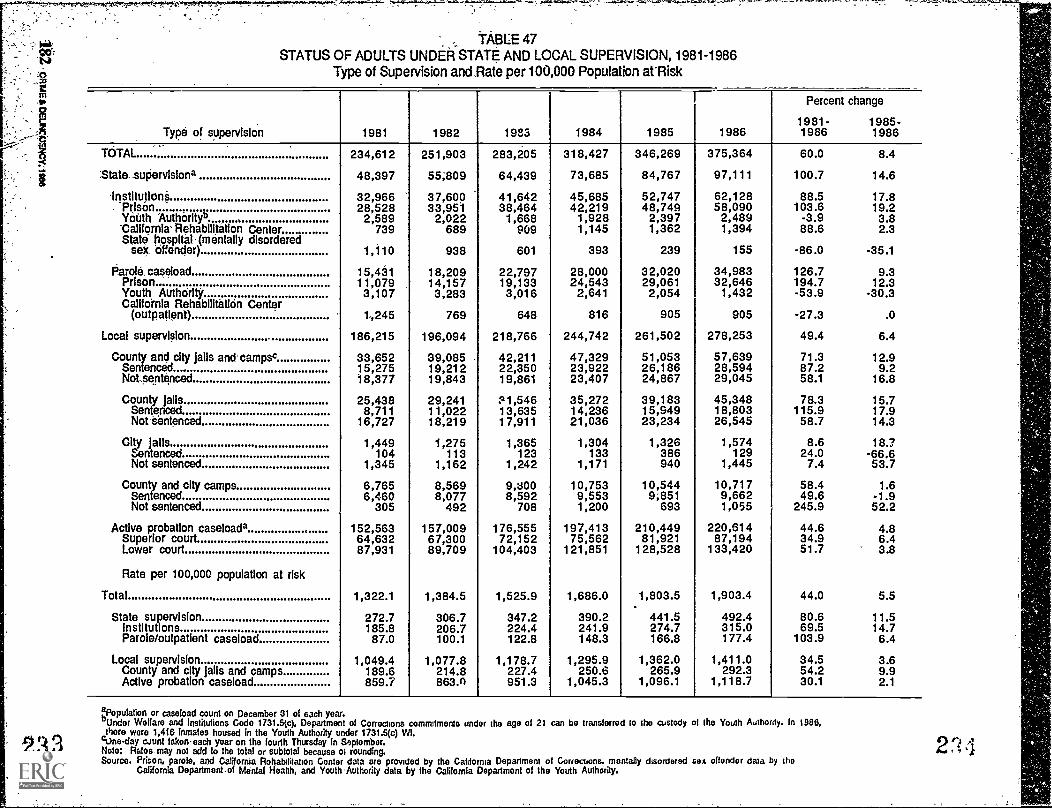
mso
33
TABLE 47STATUS OF ADULTS UNDER STATE AND LOCAL SUPERVISION, 1981-1986
Type of Supervision and. Rate per 100,000 Population arRisk
Type of supervision 1981 1982 1983 1984 1985 1986
Percent change
1981- 1985 -1986 1986
TOTAL 234,612 251,903 283,205 318,427 346,269 375,364 60.0 8.4
*State zupervisiona 48,397 55,809 64,439 73,685 84,767 97,111 100.7 14.6
InstitutIonS 32,966 37,600 41,642 45,685 52,747 62,128 88.5 17.8'Prison , 28,528 33,951 38,464 42,219 48,749 58,090 103.6 19.2YOUth Authoritya 2,589 2,022 1,668 1,928 2,397 2,489 -3.9 3.8-California' Rehabilitation Center 739 689 909 1,145 1,362 1,394 88.6 2.3State hospital (mentally disordered
Sex Offender) 1,110 938 601 393 239 155 -86.0 -35.1
Parole. caseload 15,431 18,209 22,797 28,000 32,020 34,983 126.7 9.3Prison 11,079 14,157 19,133 24,543 29,061 32,646 194.7 12.3Youth AUthority 3,107 3,283 3,016 2,641 2,054 1,432 -53.9 -30.3California Rehabilitation Center
(outpatient) 1.,245 769 648 816 905 905 -27.3 .0
Local supervision 186,215 196,094 218,766 244,742 261,502 278,253 49.4 6.4
County and city jails and campsc 33,652 39,085 42,211 47,329 51,053 57,639 71.3 12.9Sentenced 15,275 19,212 22,350 23,922 26,186 28,594 87.2 9.2Not.sentenced 18,377 19,843 19,861 23,407 24,867 29,045 58.1 16.8
County Jails 25,438 29,241 P1,546 35,272 39,183 45,348 78.3 15.7Sentenced 8,711 11,022 13,635 14,236 15,949 18,803 115.9 17.9Not sentenced 16,727 18,219 17,911 21,036 23,234 26,545 58.7 14.3
City jells 1,449 1,275 1,365 1,304 1,326 1,574 8.6 18.7Sentenced 104 113 123 133 386 129 24.0 -66.6Not sentenced 1,345 1,162 1,242 1,171 940 1,445 7.4 53.7
County and city camps 6,765 8,569 9,300 10,753 10,544 10,717 58.4 1.6Sentenced 6,460 8,077 8,592 9,553 9;851 9,662 49.6 -1.9Not sentenced 305 492 708 1,200 693 1,055 245.9 52.2
Active probation caseloada 152,563 157,009 176,555 197,413 210,449 220,614 44.6 4.8Superior court 64,632 67,300 72,152 75,562 81,921 87,194 34.9 6.4Lower court 87,931 89,709 104,403 121,851 128,528 133,420 51.7 3.8
Rate per 100,000 population at risk
Total 1,322.1 1,384.5 1,525.9 1,686.0 1,803.5 1,903.4 44.0 5.5
State supervision 272.7 306.7 347.2 390.2 441.5 492.4 80.6 11.5Institutions 185.8 206.7 224.4 241.9 274.7 315.0 69.5 14.7Parole/outpatient caseload 87.0 100.1 122.8 148.3 166.8 177.4 103.9 6.4
Local supervision 1,049.4 1,077.8 1,178.7 1,295.9 1,362.0 1,411.0 34.5 3.6County and city jails and camps 189.6 214.8 227.4 250.6 265.9 292.3 54.2 9.9Active probation caseload 859.7 863.n 951.3 1,045.3 1,096.1 1,118.7 30.1 2.1
:Population or caseload count on December 31 of each year.Under Welfare and Institutions Code 1731.6(c), Department of Corrections commitments under the age of 21 can be transferred to the custody of the Youth Authority. In 1988,there were 1,416 inmates housed in the Youth Authority under 1731.5(c) WI.
cUne-day wunt taken each year on the fourth Thursday in September.Note: Rates may not add to the total or subtotal because et rounding.Source. Prison, parole, and California Rehabilitation Center data are provided by the California Department of Corrections. mentally disordered sex offender data by the
California Departmentof Mental Health, and Youth Authority data by the California Department of the Youth Authority.

TABLE-48STATUS.OF ADULTS .UNDER sTATg AND LOCAL SUPERVISION, 1981-1986
OproOnt, Oistributigrt gt Type 0.$001ervision
Type cittSulieTvision 1981 1982 1983 1984 1985 .. 1986 -:
tot,k.Statetot ,k.'6)6'0 00tvItiqii
-:'0-bat`40firt4103''00.,*sup0A441Ona
-111011tutit:;#:Orion8.0161, Authcitity , ,
`.411fointiik011abJilititiop c'entet.. :S1410.4)0011511fmeritally
ci4sbrcerect fmk, offeildel,
-Pato*Osoloacf.. .
Iiiison- ..NctiO Ag koftty901, Sfilla 'fOritiontiation. center .,
{outpatient)
1:964- siipeiVisittri Y =
Oimilfy.laldttty. Jails ncIciainp4b..
4ehtsi*d': .3sl3vokii060d.,, ,
,
CoutifYlails. ,-.
ten14666:c1t40t4tente ...,
. .,
tyy 'fails', , ...tail*: -, =. ..
NOV*. Vne9c! ,, . .,
dtipiy..4pdioIty..e.cimps,.,6.siiiit0054 , .Ncit ..teht3ticei''_
ActIvoy:fabOari,paspioada'§415P119r -dOtirt., .Linifer .0tirt
160326376.4
100.0
68156.6
6:31.5
331:026.e
6.4
2.6106:0
18.13;2
:9.9
ii.7. 4.7
0:0
..3:1.7
3:6',3:5..2
61:034.747:2
1 pm:0377:8
100567.4603
PA1.2 .
1.7
326OA
5:9,
1.4 ,
103:6
14:99$
10.1- .
_ .
141965-4-4
.6'..t .
..e.
4.4.44,
.2
80.134.345.7
10034077.2
100.0
-64.606.72.61.4
.9
354 ,
'4j.41-
1.0100:9
19.310.694
14.46.? .
83.0
.. i.6
4.335
. , .3
80333.0'47:7
1032,3A'76:9
100.0
42.05732.61.6
.938.0
, 6334:6
,
141
100.9
19:2-939.6'
14140.6-'8.6
.5.
.1
.5.
013.0
.5
80;7'30.043.8
100324r$755
100.0
62.2.57.5ttr-1:5
337-.034,5
-24..
1.1 t.
10:916$ .
10.09:5
15.0'6A:3.0
.6
.1.4
4.03$
.3
80431.3 ,
49.1
.
466.0: 25.9:`,
14;1;109m,,
',04;0 ,,,004,::,O.s.,1:4,,
. .,:Z.,.:
96:0'33'5 t-.1i5:r .. '
, 5190.0 ''
, 20.7 :.:103 .-:-'10.416:9 '1,03. .,
-03
.3`.9-3.6 ,.
:4
16.331.347.0'
iPopulation=ar $*.,stotoitiPsctunt'o11.,Doeiipinr. 31-of 7each
Driaiftiy,;tounCtakiii oah :ireai, on, th*.fourth Thuriday, IntSeptember,-Notes; -Percent= dletrihutlons wara, caltufated fromdiga,presented: In labia 47.
- Portant* MaY not aria to 160.0. of to-siejetafe: bataueirof.; rounding.Source: Prison and.talilornia Rehabilitation Denter,data are provided by the California Department of Corrections.
miintallpalsOrdered,sex °treader data,hy5th*California Department pf Mental Health. and Youth Authoritydata by the DalUomta.:Depaitinent ifthe YOutli.Aothoiity.

TABLE 49ADULT PROBATION ACTIVE CASELOADS ON DECEMBER 31, 1381-1986
type olCourt. .
. . .
, - Year .-
.. .. .. . .
Total :
.
Superior court. , . ...
Lower cburt,, '..:. -= :Number -fiercent. Number Oercent-,-
_ ....Number
. .
,Percerit.
1986,16061664...,.., . ...., ..... .itrdg. .--i,.,...1962 ,,
. it:id'f.
-tietheet4lieifge$,',-16,1411464r-
1021 -te'106,0.i..,4.4.198$ 46 1936 ...... ;., ,"
:
-. .
-
: ':
:
20;614,.210e440.
,.."-1eio4-1 i-itstdd '.,15t609:1:60;666
-' -
I .446,.'-..,. CB _.
.. 1,00'4-1600 .1900idd.o, ,
400,d, ;
loct,d-
.
. .,0,194,81,921
- 75,56272,102
' 67,300000
.
. 34.9-6.4
3,9 6.0,8`.2.36,3 *,
40.94.9, ,
424,4 ,
: .
12.,3,420; 128528; 121;81'104i40
66,7dd'87,031
. ,
,
. ..., .
, '51.7,,3.8
; 60 ,6. ...
Oi'...t ,.,..
di,*: :51..' ''..
- 'tr:-.1, 2 '
St e'. .
, -
.. .
. .. ,
236

TABLE 50ADULTS PLACED ON AND REMOVED FROM PROBATION, 1981-1986
Type of Court and Reason-for RemovalRate per 100,000 Population at Risk
.
- Typeof: cOurt.and-. reason. for removal.-. -...._
.
1981,
Number Percent,
'. .1.981.
Number Percent
. . , .
1983
_ Number Percent
1984
Nuinber Percent
1985
tdumber Percent
1986
'Number Percent
Percent change
1981- 1985-1986 1986
Placed ort:OrobatiOn-Tote4, ,',..,-
SOperree,ebbit.:.-,IpPw9r.'401,41.,.4..- . .
erii0Nkfc9itiii'Pr0b4t1Pa ''Toter:: ...,,...,.._ ;
84110a0(P014.-ft,,Lower .0;4 .
, . Terrnin4teit..., Sttpattettat...... .-..01,1:0,,,c0
-ViCititeiti...''.`4.,.....;. ..,. 'SpOtiOrtbtirt..i;.,
Lovoreourr ' .. ,
,..1-4., .'ll-,14,,,',..,`',.:...' 41 #0.4uP10F14-. :.,
, -, 400,09 ''. ...,s
'' ':-,,' : 100;00.0.;,'' ''' '... 0 4.*;
Ilitatalitie.-Ft9c04.1" .,..-..-. ,,1;,.-;,f,.'
60ericr..COUrt....«....'', r..,t,ewer:,oditit, '''' ,:.. ." -, ,,,, . ,.,.
92,207 100.033015 95.9 ',-.59,092 , 14.1-
-' '90,691 100.0 ,30,103 -.23,3
-60;609, %,66.7 '
59,664, 4ii..:;,;$04918;261: '', 2011 ,,4-0,746....;::44A.-
- 27;657--=_-',66.5,- 16,114 ; A'ir:a'' 4.74546 ---;19.6:-
-4;0$3' :''',..'-44.;_1)00 ,', ., -24-1.22 ":-2:5--,
-: .' ,, ...'-,,
, .
.
, '-. 5464: , :.
- f 103i0;'''';66.0n._ ,
. ,.. . .
58,925 100:024,429- 35.1,63590. .,54.9, .
-43,712 100;0 :31.,572 .: a3.7
;:02i149;:. , -.00
-- '-54;2'-' .19i10 '-'20.4.:,.41.00- :. :464 _
.:20-,741-:;tAn-; ..
'-10-,M : ,..
...-16902;i ', . '-
,- '6-#01.2,7. r's -.,--,
'' ',:1,565; :, ,_'-',, 24147; ):
':.,'--..,,,,'.
,
..
103,622 100.038,089 36.8,65,ssa 53;2.
04,700, 10114. 0;734 05:51 60,966-. 04,4
59,403 . 52:72%040- 21:2.3060. .. 41,6,: .
60;62:1 0:6 -01107,1 -124 ',-,ipiosiit,. L,0.0 , .:.-`,17;010.,
:-:,-:- 4,976 - '5-.6-'-t024:- . ;245:.-- 24$1,.-; . 24,-
-:.,
.
..,...,
, ., .
, .
-103,575.42,01461,561,
,80,6$6,30;009,49,747'
48;654,io,624n
-29030 .
22,253.45,240
-6;720,2;025
, ., .794
543..4. -".222,5
0261
100.040.6
. 59.4
i60:11.42.6.
.,;97,4
50.222-.700.5
37.2 .17.519.9
6.a2.341
,
. ..
11152947,053
''64,476
g6;94440,72756;21:7.
55,27221,27s63;0436,20847,261
,.15,907
5,46420973,267
,
,
580:9245,1:1511
100:042.2-57.8"
100:042:050.0
57.0,21.9'30.1
. ,. .
$7.3.47:8-19.6,
.
,5-.6, .2.3 -
3.4.. .
.
126,26254,40371,849
116,140,49,12057429
60,20320;90642,357
.. - , ,42,575,21,45121,324
- 7662 ,
, 3,7633,39-
.
-,
..,.
040.2275.9,364.3
.
100:043.156:9
100.042.3'5.7.7
'57.120.5 ,
06.5
36.7-155-18.2'
5.33.2
.
36.964.321..6
28.i'62.7
, 10.8,
12:300,9,4:0 .
63,-.5112.1254
01.1108:1
1
,
23.247.99.4
13.215.611.4
19.820.6,152
19.912.324.6
17524.311.4
03.671.3
53,
,
.
. . .
10,212.0
8.5
04 iltsF4fari,70:0-1400'. ' :fa'cii161.134- 4404. gep1a4olii0facgigOdi
1:11.1tiMIP;41-14".,th*PaVItirritu0:41ou4-044.1(",:
",.
,

TABLE 51ADULTS COMMITTED TO PRISON, CALIFORNIA REHABILITATION CENTER,
AND YOUTH AUTHORITY, 1081-1986Type of Commitment and Rate per 100,000 Population at Risk
Percent change.
Number 'Percent'.
1981- 1985-. . . , . .
. Type, of coriimillitpnt : 1981 1982 1983 1984 1986 1986 .1981 1982 1983 1984 1985 1986 1986 1986
TOTAL 19,290. 20,023 23,078 23,544 28,555 .32,028 '100.0 100.0 100.0 100.0 100.0. 100.0 66.0 12.2.
,Newly received 'from, Court .. , . ....... ..... ,....., , 17;482 1779 19,861 19,515 23,475 26,217 . .90.6 88.6 .86.1 .82.9, 82.2 819 50.0 11.7Pareleei/oUtpAtlents 'rettirnc4 With ,new
:coMniitinent .. 4 1,808 2;284 3,217 4,029 5;080. 5;811 9,4 11.4 13:9 17.1 17.8 18.1 , 221.4 14.4, . .
'Prieen
.
, 16,601 18,166 21,659. 21;532 25,906 29,922. 86.t 90'.7- 93.4 91.5 937, 91:6 76.6 132NekVIY, roCeNetl from court. . _,.. 14,901 t 5;932 18,401 17;552 20,864 23;532 77.2 79.6 797 74.4 73.1 73.5 579 12.8ParoleretUrned-witi..noiv Coitfm1tinerit. , 1,700. 2;231 3,168 3;980 '5;042 5,790 4:8 11.1 16:7 16,9 17.7 18.1 240.6 14:8'
,. , .
callfOrn*Rebabil(tatlenfeenteri . 4; 695 744 815 . 876 1075 1,101 3.6, 3.7 3.5 9.7 3.8 3.7 69.9 9.9Newly, reciihkd' 061111:60 568 , 722 '800 875 1,068, 1.,176 : 3.5 3.6 3.5 6:7 37 '3.7 76.0 10:1Outeatieoft .feturhed ..witty,nevir.,
camenittnent: :27 22 16 1 7 '5 , .1 :1, .1 .0 .0 i0' - --
Youth, AtAttority . ,.., " :,. .: : . . . . . 1,694 1 ,16- 704. 1,136 '1,574 1;525 '10:3 5.8 3:0. 4.8 5.5 4.2 -23,5 -3.1'NeVilY. rocehred',frOrn cout1, 1i913 1,085. ,660 -425 308. 247 99 5.4. 2.9 1.8 1.1 .8 -87.1 -1948 . .
Neiviy tee-61%4410m cetirt, , . :' %,..:_
1731.-.5(0 wic , A'5 ''"' ' ' -- 662 1,235 1282 -- -- -- 4.0 4:3 3.9 - 2.2'
PP,tulevilretumed With rtinv-COMmitreentd;', al 31 44 . 49 31 16, ' A .2 .2 .2 .1 .0. -00:2 -- ., .
. ,
.flate por'106,4004po putatiOn*rick, ,-_ : ' ,. , .
. .
..
.
Total..m ; 4. 'IN:it 1 io.t 1244 124.7 148.7 162:4' 49.4 9:2'Par) . :, ,,,. . .. .., . , . ......, -..919 9916: 116 2 114:0 1349 149;7 c .58'.9 i0:2Cit1ifernia'RehabIlitatien Zenbit...,...,, . 3.9 . at.t 4;4- 4.5 5.5 . 9.0 53.9 7 ..1
YOUth,,Autholity ,,, 4 .:.,,,. ... .. -4. 11.2 6.1., 3-9 6.0 . 8.2 1f7t . -31.9 .6.1.
!Includes ,c14 narcotk.addlO neisirrecetiedlimit,colnt. vitih:ic felony tharg s. and reternetVfnenvompaflant atatutrvitircohow eilorlir oharae,Fiticlijdoi:ilrst.ifiinicilintents.'61adults.fltiTt =What 'Courts., . . .
'cunderVellate tnd histItutIonster0171.1140.1finerto-fiefewl0d1olho OfrPfuttnett of terrailloWalid4faInforrod to :14 .cuattxly..ef' the -Youth Authorlq.olniductee*commttmordslot achilte.froni criminal OcOrt,wholuittpto,vioea Youth AUthorltylOotnmarnents.and who may have.been ,under Youth Authorttilurtsdictien,at the lure ofl'e new_cernrniurei 'Note's: 'Percents iiiatnel'aird,to 190.0-4% $1,40.#10 fogs may notittrd,lo the tetatticause ofrounding,
Sailrforifeates elthernot, epplIceille or percent dlanostufrore,one ,ilven year to 4 sUffsliPfeet:year ant not calcute.f.0 When the glvert taut year:ntn*sr is toss,thao SO;Un'orUnt,for Pilsen and CUtomIti:Rehatitiatfort. Canierlii!porsene,rateked4:7.1tie Ctilito"rnla Department or ,Sorrectiens.Unit of O tnt for Youth Authority la pereeni.Oorifing,tiniiet-thek kfilidlMferi;trom '91(0:14.0;10M
Sources: Solifornlift,Department elpirrecdenso.OffentlevInformailon'ServIceir. Fogy and Plarmlnir Dtvlston; and. Callfornta Department of titeNvath -Authortiy.
2 3 9
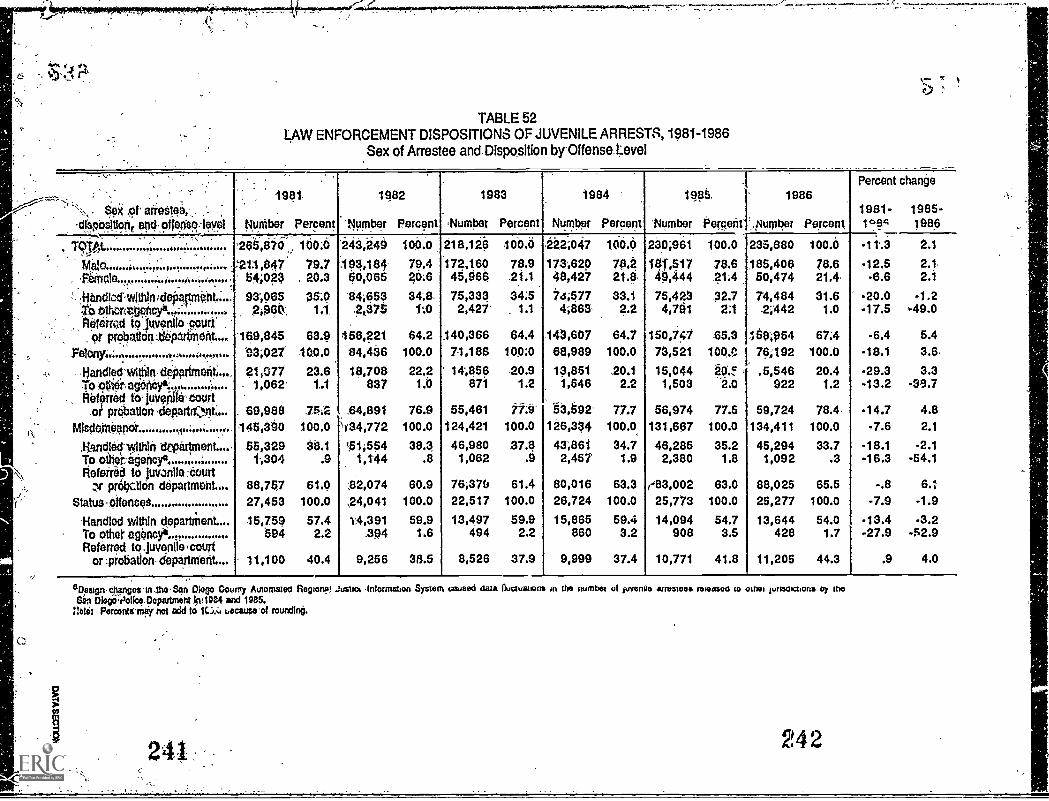
TABLE 52LAW ENFORCEMENT DISPOSITIONS OF JUVENILE ARRESTS,1981-1986
Sex of Arrestee and Disposition by Offense Level
. ,
, Sex at arreatee,-,. ',. .;.dirbstifon; and,offertscrieyel
. 1981.
Number Percent
1982
',Number Percent
1983
,Number Percent
1984
Number Percent
19 85,,
'Number Percerit'
.
1986
Number Percent,
Percent change
1981- 1985-1° 8g 1986
1py,t.. ',. :, -
. Male. , , . f."11,1,047. ,Veliulle i.
-', ,Riandloti-w)thirvdeMtment.,'.:.. le bthrof.46onoyil
,Refeircd telttvenile-petirtor prOatIci rthn*,-,-,rfniOnt:.
reloni.....,.......... ,..... ... ..,..,
-118/10..4wittiln11801free4 ,
To '.91gOr ageOey*:.,, '
- . Referred kr juvenile' Wertor prOatIon,depatincvit
(480011044 ,13.'. 4, ,
.1:Landfed-1,y1thlit department....-To other*encyaReferred to ,juvanlle,-Court
r pr*tlon department....Statue ',dances
Handled within departmentTo other agencyReferred to,juvenlle f court
orprobatlon- deparinfent
265,810
64;02393,065.gise(1:,
'169,8451.13;021
21,0771,062
. 69,988145,390
55,3291-,304
88,75,727,453
15,759"594
11,100
100079.7
. 20,3
35:0ti,
63.910.0.0
23.61.1
:751100.0
38.1.9
61.0100.0
57.42.2
40.4
243,249
399,184-60,066
84,653.2,31t
156,22184,43618,708
837
.64,891'3'34,772
61;5541,144
02,07424,04114,391
394
9,256
100.0
79,426:6
34.8.1..0
64.2100.0
22.2°Lb
76.9100.0
38.9.8
60.9100.0
59.91.6
33.6
218,125172,16045,966
75,3332,427'
140,3661,188
14,866871
65,461124,421
46,9801,062
76;37822,51713,497
494
8,526
_,
100.078.9.21.1
34:51.1
64.4100:0 ,
20.91.2
7t.8100.0
37.8.9
61.4100.0
59.92:2
37.9
,222;047
173;62048,427:..74;577
4;863,
143,60768,98913,8511,546
66,892'126,334
43,8612,457
80,01626,724
15,865860
9,999
100.0
78,221.633.12.2
64.1100.0
.20.12.2
777100.0.
34.71.9
63.3100.0
59.43.2
37.4
230,961
191,51749,44475,423
4,761
150,74773,521
15,0441,603
56,974131,667
46,2852,380
(483,00225,713
14,094908
10,771
100.0
78.6.21:4
32.72:1
65.310(1.0
gq..! ,2.0
77.5100.0
35.21.8
63.0100.0
54.73.5
41.8
235,880
185,40650,474
74,484,2;442
16695476;192.5,546
922
59,724134,411
45,2941,092
88,02525,277
13,644428
11,205
100.0
78.621,431.6
1.0
67:4100.0
20.41.2
78.4,100.0
33.7.3
65.5100.0
54.01.7
44.3
.11.3
-12.5-6.6
.20.0-17.5
-6.4-18.1
-29.3-13.2
-14.7-7.6
-18.1-16.3
-.8-7.9
-13.4-27.9
.9
2.1
2.1,2.i
.1.2-49.0
5.43.6,
3.349.7
4.82.1
-2.1-64.1
6.1-1.9
-3.2-52.9
4.0
aDesign.chengetrinlho-S4n Clop County Automated Region?! -*Ilona ,Intormation System taaosed data iluctuanotre in the numbest of juvenile eintetues rammed to othei ionsoocoons o) theSin DlociO,OoUce,Depiutinent Ip1ile4 and 1985.
not*: PorconttrOOy not odd to 1C.i. uocausgrot rounding.
242

TABLE 53NEW-REFERRALS TO PROBATION DEPARTMENTS, 1981--1986
Source of Referral, disposition, ant1Sex
,
6e8reci- 8rOfertal,',PfTdispeSitteri,'
3riat 4.4
,1181
Number percen;
,1932
'Number 'percent
i 981
Nunifxr !Percent
. ,196f1-.
Nurnber Percent
1985
f`4,1febk Fercent'
1086-
Ninnber "Per Cent-.
.Percent change
1981- 1985-1966 1986
totikt.: ..... ,.i, .; ..,Sotirce .or solgriAt '
:.. 'Lacy 'tiotormnonl *-_, Schenie....,..1. . ..
.- Penrt0.4.y.tn,,........ . ;.'. f.....' Otler-and11,16renk,.., i....
Clos0,- fiengiic.d.,........,.-- tnrc pl'Obatien ,enet
F;$1114err tiiPtt .kos
. Itele......../....... ;,........Fcirntfes. '..,,,,. ; . ..
.10.290
1280271-i215
6649;199
76,14017,44145;624
8916330,142
140
12.0-.,
'.5.5'6.6
54.712:6321
78.321.7
1'2.0,181,
115;5955_ .1,201
, 7056,680
67,60115,41143,163
.96 24627,935
160.0
01.11.0
.66.0
Me12.2
. 24;2
77122.1
116;e93
107;1581,214
-6657 ;856.
69,72016,31341,852
90,40026,493
100.0
91.711
.65.7
$1,110,135.8
77.322.7
113;522
103,5991,466
5557100
67,44415,76940,309
87,440/4082
104.0,
bto11
, 17.0 .
-50:6-^ 13.9
351,
711. 23,0
120;46V
109,702L803.
4878,3136.
61;02217,65441,792
92,69927,769
1801
01.11.6..4
7.0
11.71 .7l34.7
76.923.1
-124,538
142,6422,170
403,'60723
65,63217,36341,643
9610126.837
1801
10.2,1.7
.37,8
52.613.933.5
76.923.1
-10.3
-12.278:6
-39.35.7
-13;8-.4
-81
;12.1-4.3
3.6
2.614,6
-17.215.9
7.6-1.6
.1
3-.63,8
gref404 ton beigx44:91 Dunaj
TABLE 54JUVENILE COURT DISPOSITIONS OF NEW PETITIONS, 1981-1986
Type of Disposition
Type of disposition
1981
Number Percent
1982
NuMber Percent
1983
Number Percent
1984
Number Percent
1985
Number Percent
1986
Number Percent
Percent change
1981- 1905 -1986 me.
TOTAL
Dismissed, transferred,remanded to adult court.Dismissed, transferredRemanded to adult court.
Nen-ward probationaFormal probationCommitted to Youth Authority
46,624 100.0
11,42811,053
3752,770
30,805621
25.024.2
.86.1
67.51.4
43,163 100.0
10,376 24.010,063 23.3
313 .72,337 5.4
29,890 69.2560 1.3
41,852
9,1338,921
2122,122
30,097500
100.0
21.821.3
.55.1
71.91.2
40,309 100.0
9,011 22.48,861 22.0
150 .42,047 5.1
28,785 71.4466 1.2
41,792 100.0
8,970 21.58,807 21.1
163 .42,178 5.2
L0,231 72.3413 1.0
41,843
9,5939,4'1
1532,012
29,698540
100.0
22.922.6
.44.8
71.01.3
-8.3
-16.1-14.6-59.2-27.4-3.6
-13.0
.1
6.97.2
-6.-7.6-1.830.8
Sincludes both 654 and 725a Wetfaro and Institutkms Codes.Note: Percents may not add to 100.0 or to subtotals because of rounding.
24324.1
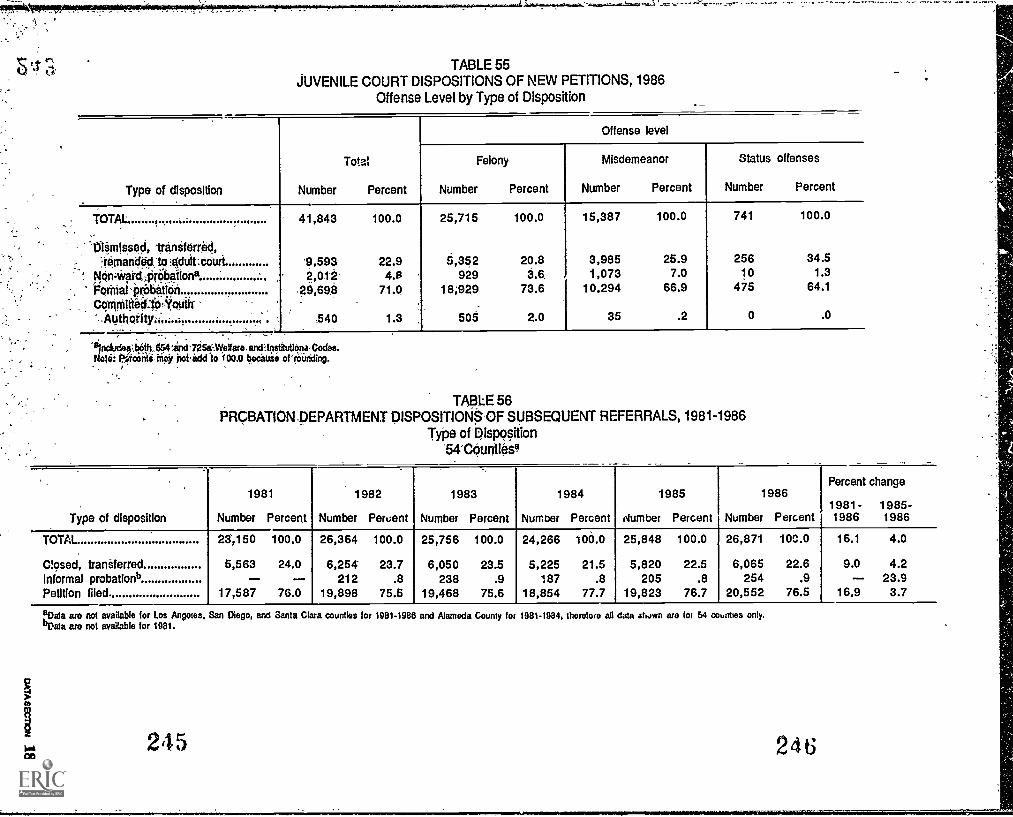
TABLE 55JUVENILE COURT DISPOSITIONS OF NEW PETITIONS, 1986
Offense Level by Type of Disposition
Type of disposition Number
Total
Percent
Offense level
Felony
Number Percent
Misdemeanor
Number Percent
Status offenses
Number Percent
TOTAL. 41,843 100.0 25,715 100.0 15,387 100.0 741 100.0
1.11emisseci, -transferred,'t8Mangfiglo, igdUlt cciurL 9,593 22.9 5,352 20.8 3,985 25.9 256 34.5
140nA48i3100.8iiona 2,012 4.8 929 3.6. 1,073 7.0 10 1.3
'0001Ell'Ocr515411bri' 29,698 71.0 18,929 73.6 10,294 66.9 475 64.1
CPIT011000, 4.001-.-Atittmelty Z40 1.3 505 2.0 35 .2 o .o
:ncludea :. both.854 isx1' 7i5d..Welfere , and: Institutlana, Codes.oto: Piricantiii* 031.1dd lo 600.0 becalie of 'Min:ding.
TABLE 56PRCBATION DEPARTMENT DISPOSITIONS OF SUBSEQUENT REFERRALS, 1981-1986
Type of Disposition54 Couotiesa
1981 1982 1983 1984 1985 1986Percent change
1981- 1985 -Type of disposition Number Percent Number Percent Number Percent Number Percent dumber Percent Number Percent 1986 1986
TOTAL 23,150 100.0 26,364 100.0 25,756 100.0 24,266 100.0 25,848 100.0 26,871 100.0 16.1 4.0
aosed, transferred 5,563 24.0 6,254 23.7 6,050 23.5 5,225 21.5 5,820 22.5 6,065 22.6 9.0 4.2Informal probationb - - 212 .8 238 .9 187 .8 205 .8 254 .9 - 23.9Petition filed. 17,587 76.0 19,898 75.5 19,468 75.6 18,854 77.7 19,823 76.7 20,552 76.5 16.9 3.7
a, D alit are not available for Los Angeles. San Diego, and Santa Clara counties for 1981-1988 and Alameda County for 1981-1984, therefore all data shown are for 54 counties only.°Data are not available for 1981.

TABLE 57JUVENILE COURT DISPOSITIONS OF SUBSEQUENT PETITIONS, 1981-1986
Type of Disposition54 Countiesa
Type of disposition
1981
Number Percent
1982
Numbe, Percent
1983
Number Percent
1984
Number Percent
1985
Number ,Percent-
1986
Number Percent
Percent change
1981- 1985 -1986 1986
TOTAL 17,587 100.0 19,598 100.0 19,468 100.0 18,854 100.0 19,823 100.0 20,552 100.0 16.9 3.7
Dismissed, transferred,remancled,to aduff,court 2;870 16.3 2,856 14A 2,888 14.8 2,646 14.0 2,914 14.7 3,068 14.9 6.9 5.3
Dismissed, transferred 2,754 15.7 2,744 13:8 2,804 14.4 2;574 13.7 2,870 14.5 3,019 14..7 9.6 5.2Remanded tiladultcourt 116 .7 112 .6 84 .4 72 .4 44 .2 49 .2 -57.8 11.4
Non-wardlptobationb 130 .7 241 1.2 225 1.2 181 1.0 14 1.0 177 .9 36.2 4:8orinal,piobe1ion 13,615 77.4 15,810 79.5 15,300 78.6 15,173 80.5 15,757 79.5 16,386 79.7 20.4 4.0
Committed-tb Youth Authority 972 5.5 991 5.0 1,055 5.4 854 4.5 958 4.8 921 4.5 -5:2 -3.9
ciD, ala are not available for. Los-Angeles, San-Diego, anu Santa Clara countles.for 1981-1988 and Alameda County for 1981-1984. therefore all data shown are for 54 counties only.
'Includes both 654 and 725a-Welfare and Institutions Codes.Note: Percent; may notadcfto 100.0 or to subtcrtats because of rounding.
247
TABLE 58JUVENILE COURT DISPOSITIONS OF SUBSEQUENT PETITIONS, 1986
Offense Level by Type of Disposition54 Counties
Type of disposition
Total
Number Percent
Offense level
Felony
Number Percent
Misdemeanor
Number Percent
Status offer-es
Number Percent
TOTAL 20,552 100.0 6,176 100.0 14,221 100.0 155 100.0
Dismissed, transferred,remanded to adult court 3,068 14.9 787 12.7 2,254 15.8 27 17.4
Non-ward probationb 177 .9 46 .7 127 .9 4 2.6
Formai probation 16,386 79.7 4,741 76.8 11,521 81.0 124 80.0
Committed to YouthAuthority 921 4.5 602 9.7 319 2.2 0 .0
11,.baia for Alameda, Los Angeles, San Diego. and Santa Clara counties are not Included.°Includes both 654 and 725a Welfare and Institutions Codos.Note: Percents may not add to 100.0 because of rounding.
24t-3

TABLE 59JUVENILE PROBATION CASELOAD, 1981-1986
Type of Probation
. .
.
Type of probation_ . . .
,
1981
.der Percent
1982
'Number rercent-
_. .
1983
Number Percent
1984
Number Percent.
.
.' 1985
Number Percent.. . .
1986 .
Nurnber PEircent,
, Percent change.
1981- 19851986, 1986
TOTALS
InformalNon-wardFormal
. .. . . . . . ,
54,609
6,7421,142
46,725
130.6
'12.3 ..-21 '
85:9
60;612
7,4301;106
,52;977
in icy12:8
1.8 :85.6
67,236
6,999-1,132
59,105
ico.o10.4
1.787.9
71,386
, 7,2911,132
62;963
viti.o10-.2
1.0-56:2
78,812 .160.0 -
W-8;544 10:0'-1;242 116
59,61.. .87-.6 ...
5.1:544
:6,362 .1,376.
, .63;636,..
' i60.010.322
. 87,5
/2.9:6.126.5.i6.4
-21:8
-25'.6iiLt
-21:9
aCasis periding;coull-a-liona aio.not inClucle4.0no-cfriy count tskert-on December 31-of each year.'Notes: Percents May- riet-addito-100.0:because.af rounding.,
in-1936,a-newiturvey,Thrin was doVeloPed bylICS to collect luvsnite probation caseloacVdelaisee'Datg,Lysitations).
TABLE60:JUVENILES.1N COUNTY-OPERATEDbEtENtiONTACILME8, 100-190
Type , -.-
.
Type of facility by sex
1981
Number Percent
1982
Number Percent
_ . . . ,
19833
Number Percent
.,
1984.
,
Number Percent
1985. . - 1985-
Number -Percent
: .1980-
, Ntgriber. 'Percent
Percent-change
1981- 1985-1986 1986
TOTAL 7,092 100.0 7,508 100.0 7,542 lob A =8,262 10.0 , 5;04 ititt.o. : 1:4565 166:6 21 .1 1.6
Nonsecure 4,276 32.1 2,252 30.0 2,605 34.6 2,600 31.6 2,675 31-.6 .2,791 32.5 22.7 4:3
Secure 4,817 67.9 5,256 70.0 4,937 65-.5 5,652 . 68.5 6,769' ,66.4 5;807- 67.5 20.6 .1
Male 6,283 88.6 6,759 90.0 :6,672. 88:6 7,216 '87.5 7,494- .88:3 , 7;624- -88.7', 21.3 1.9
Female 809 11.4 749 10.0 870 11.5 ; 1,033. 12 5 990: 41.7 ; 974 11 A 20.4 -1.6
Nonsecure 2,275 100.0 2,252 100.0 2,605 100.0 . 2600 1000 2,675 100.0' , 2,791 100.0 22.7 4.3
Male 2,164 95.1 2,169 96.3 2,501 96.0 2,456 94.5, 2,516 ' 94.1' 2,537 '909 172 .8
Female 111 4.9 83 3.7 104 4.0 144 1'3.5 159' = -'5.9 , 254 9:1 128.8 59.7
Secure 4,817 100.0 5,256 100.0 4,937 100.0 5,652 10:0 6,796 100.1), 5,807 -100.0 20.6 .1
Vale 4,119 85.5 4,590 87.3 4,171 84.5 4,763 84.3 4;968 85.7 : 6;087 d7.6 23.5 24
Female 698 14.5 666 12.7 766 15.5 .889. 15.7 831 14.3 . 720 12.4 3.2 -13.4
Note: One-clay count taken on the fourth Thursday in September.
TABLE 61FIRST COMMITMENTS TO CALIFORNIA YOUTH AUTHORITY'FROM JUVENILF COURT, 1981-1986
1981 1982 1983 1984 1985 1986
TOTALS 2,170 2;231 2,231 2,128 2;213 2;326
Percent change
1981- 1985-1986 1986
7.2 5.1
alncludes-iwoniles committed to OVA for the first time-and uveniles who, after-discharge, have.received another commitment Mr-asubsequent offense.
Source: California Department of the Youth Authority. 250
1t

TABLE 62CRIMINAL JUSTICE AGENCY EXPENDITURES, FISCAL YEARS 1980/81-1985/86
Agency and Expenditures by Fiscal Year(Data Shown in Thousands of Dollars)
Agency
Fiscal year Percent change
1980/81- 1984/85 -1985/86 1085/861980/81 1981/82 1982/83 1983/84 1984/85 1985/86
TOTALa $4,362,811 $4,954,317 $5,355,311 $5,878,081 $6,679,904 $7,486,696 71.6 12.1
Law enforcement 2,400,827 2,741,479 2,981,519 3,256,388 3,591,614 3,888,570 62.0 8.3
California Highway Patrol 295,087 408,135 305,840 345,922 402,971 432,520 46.6 7.3
Police; departments 1,530,328 1,798,388 1,969917 2,140,203 2,380,733 2,582,084 68.7 8.5
SheriffS' departments 565,706 623,688 693,159 754,452 790,189 853,411 50.9 8.0
California State Police 9,706 11,268 12,603 15,811 17,721 20,555 111.8 16.0
Prosecution 231,873 260,176 280,884 307,483 343,968 383,142 65.2 11.4
Public-defense 84,066 96,737 111,941 119,569 138,085 157,113 86.9 13.8
Courts 274,266 316,690 349,700 374,582 435,454 487,530 77.8 12.0
Superior. 111,509 131\039 146,439 156,194 164,298 188,057 68.6 14.5
Municipal 15 ',276 174,065 190,079 204,914 255,924 283,663 86.3 10.8
Justice 10,481 12,586 13,182 13,474 15,232 15,810 50.8 3.8
Court=related 131,561 151,848 166,324 176,512 227,007 265,463 101.8 16.9
Constablesand marshals 44,602 52,524 57,979 62,834 118,394 134,585 201.7 13.7
Court reporters. and transcripts 1,710 2,130 1,849 1,729 8,936 16,172 845.7 81.0
County clerks 62,552 70,524 75,227 75,489 85,074s 89,138 42.5 4.8
Grand, juries 2,240 2,479 2,559 2,661 3,134 3,321 48.3 6.0
Law illirarles 216 132 177 156 44 0 -100.0 -
All, other', 20,241 24,059 28,533 33,643 11,421 22,247 9.9 94.8
Corrections 1,240,218 1,387,387 1,464,943 1,643,557 1,943,786 2,304,878 85.8 19.6
Jail and rehabilitation 262,392 309,547 346,363 387,353 461,347 536,707 104.5 16.3
Probation departments 354,931 380,006 390,493 408,482 453,196 476,602 34.3 10.0
Department of Corrections 400,813 463,274 496,387 604,271 778,317 '990,064 147.0 27.2
Youth Authority 222,082 234,560 231,700 243,451 270,926 301,505 35.8 11.3
a,EsPonditures- Includa,salaries and employee benefits, services, and supplies. Monies spent for building construction or derived from federal and state grants are not included,ulncludea<cost for Juvenile ,JustiCe Commission, Delinquency Preiention Comrhsslon, juron., and Interpreters, examination of the insane, juvenile court reforets, jury urommIssioners, and other court related expenses
Noteitrin Fiscal'Year 1984/85Ahe State Controllers Office revised its method of data coilectrcn which impacted various subcategories.As a result of,,additional Information, 19011/85 California State Police, prosecution, supenor court, municipal court, constables anti marshals, court (openers and hanscripts, and ceunty clerks have boor revised 'rem
previously published data.Expenditure.dala'for the Department of Justice and other regulatory agencies are not includedDash indicates that the percent has not been calculated because the base number is less than 50.
Sources: 'Stale of California Governors Budget.Anntial Report of Financial Transactions Concerning Cities and Counties In California, State Ce3trollers Office. 2

TABLE 63CRIMINAL JUSTICE AGENCY EXPENDITURES, FISCAL YEARS 1980/81-1985/86
Dollar and Inflation-Adjusted Expenditures by Fiscal Year(Data Shown in Thousands of Dollars)
Agency
Fiscal year Percent change
1980/81- 1984/85-1985/86 1985/861980/81 1981/82 1982/83 1983/84 1984/85 1985/86
Dollar expenditures
inflation-adjusted expenditures
$4,362,811
$2,418,936
$4,954,317
$2,553,930
$5,355,311
$2,602,045
$5,878,081
$2,723,456
$6,679,904
$2,934,218
$1,486,696
3,160,627
71.6 12.1
30.7 7.7
Note: Inflation-adjusted expenditures have been calculated according I) tho State and Local replica Price Deflator. Fiscal fear 1973174 was used as the base year.
TABLE 64CRIMINAL JUSTICE AGENCY EXPENDITURES, FISCAL YEARS 1980/81-1985/86
By Type of Agency
Type of agency
1980/81
Number Percent
1981/82
Number Percent
1982/83
Number Percent
1983/84
Number Percent
1984/85
Number Percent
1985/86
Number Percent
TOTAL $4,362,811 100.0 $4,954,317 100.0 $5,355.311 100.0 $5,878,081 100.0 $6,679,004 100.0 $7,486,696 100.0
Law enforcement 2,400,827 55.0 2,741,479 55.3 2,981,519 55.7 3,256,388 55.4 3,591,614 53.8 3,888,570 51.9
Prosecution 231,873 5.3 260,176 5.3 280,884 5.2 307,483 5.2 343,958 5.1 383,142 5.1
Pubilo defense 84,066 1.9 96,737 2.0 111,941 2.1 119,559 2.0 138,085 2.1 157,113 2.1
Courts and court-related 405,827 9.3 468,538 r.5 516,024 9.6 551 ,oe4 9.4 662,461 9.9 752,993 10.1
Courts 274,266 6.3 316,690 6.4 349,700 6.5 174,582 6.4 435,454 6.5 487,530 6.5
Court-related 131,561 3.0 151,848 3.1 166,324 3.1 176,512 3.0 227,007 3.4 265,463 3.5
Corrections 1,240,218 28.4 1,387,387 28.0 1,464,943 27.4 1,643,557 28.0 1,9'3,786 29.1 2,304,873 30.8
Fr
1
Notes: Data shown in thousands of dollars.Percents may not add to 100.0 because of rounding.
Source: Table M.
253254

255
TABLE' 65CRIMINAL JUSTICE AGENCY AUTHORIZED.FULL-TIME PERS1NNEL, 1981-1986
ByAgency
Agency and personnel
Year `slrcent change1981- 1985-1986 19861981 I 1982 1983 1984 1985, 1986
TOTAL
Laws enforcementSworn,
Number'Percent.,
CivilianNumberPercent.
Police departmentsSwornCivilian
Sheriffs' departments.
SwornCivilian
California Highway PatrolSworn,Civilian
Other lavrenforcement agenciesaSwornCivilian
ProsecutionAttorneysInvestigatorsClerical and,all other
Public defehseAttorneysInvestigatorsClerical and all other
CourtsSuperior
JudgeshipAuxiliaryb
MunicipalJudgeshipAuxiliary!)
Justice - JudgeshipCorreCtions
Prubaton-ditpartmentsProbation officersAll other
Department of CorrectionsCorrectional officersParole officersGuidance, counseling, and all other
Youth AuthorityCorrectional officersParole officersGuidance, counseling, and all other
102,35069,420
49,98572.0
19,43528.0
38,31028,10310,20722,90916,3056,6047,0524,9162,1361,149
661488
7,1842,068
8754,2411,4291,212
4761,303
726628
98569487
8298
22,4249,4606,0463,4148,4624,405
4413,6164,502
714448
3,340
104,93171,352
51,19471.7
20,15828.3
39,37528,86910,60623,45316,584*6,8697,3065,0442,2621,218
697521
7,407
2'8964,4091,021,235
500247
1,410731641
90
499584
8595
22,7909,0315,2133,7889,2154,906
4143,8954,544
753445
3,346
107,05772,618
52'01171.8
20,60728.2'
39,57028,84610,72424,30517,2117;0947,4805,3082,1721,263
746617
7,4602,144'
94,4181,9921,255
241496
1,451755655100
515609
9487
23,5369,0255,3593,666
10,1365,484
4084,2444,375
715425
3;235
110,56874,536
53,04471.2
21,49228.8
40,34829,11311,23525,34517,630
7,7157,5806,6222,0581,263
778484
7,686288,282
34;5212,0131,262
243608
1,655610264532318211
24,8609,6875,5354,152
10,9656,064'
5084,39s4,208
682373
3,153
115,31;9
74;629
52,18969.9
22;44030.1
41,6C829,77811,86023,98516,026
7,9597,6605,6092,0511,346
776570
8,0722,420
9174,7352,1791,361
256562
1,502'777'67710064252911383
28,96711,8035,4366,367
12,8277,206
619'5,0024,337
754371
3,212
119,69875,576
53'606'70.0
22,97030.0
42,38930,42111,96825;15316,8858,2687,6876,5312,156
1 "769578
8,4742,540
9574,9772,286
275581
1.540"789,687102
647668
12183
30,82212,1225,6706,452
14,2927,709
6795,9044,408
747347
3,314
16.9 3.810.3 2.6
7.2 2.7
18.2 2.4
10.6 1,88.2 2.2
17.3 .99.8 4.93.6 5.4
25.2 3.9.4
12.5.5 -1.4.9 1
17.25.
.116.3
.4 1..418918.0 5.022.8 6.0
9.4 4,417.4 5.1
18.5 4.9,18. 6.114.1 422.01 3
7..4
10.6 2.58: 1.59.. 14 .54.1 2.0
174 43..4
012..347.6 7..1
-15.3 o
37.5 6.428.1 2.7-6. 4.89.20 1.368.9 11.4
54.050 7.0
9.751.6 18.04.1 1.6
4.6 -.0-22.5 -6.5
-.3 3.2
!rho Carton:la State Police. UnNoralty q1..Calitornia, Lawrence Radiation Laboratory, and 13ay Area Rapid Tian* am included In the 'Other law 'alinement agenciescatcgory.bin order-to pomet meant Mut comparisons of workload,-fun-ilme court commissioners and referees employed by courts were included as auxiliary ludicial positions. This treatmentassumes that thesecourtcflicors wero..avallable to handle matters which would have otherwise required the fulkimo.ciffort of an equiwaint number-of fudges,
Notes: 'One-day count of personnel liken June 30 with the eiception of police departments, sheriffs' departments. CallforntiLtlighway Patrol. and University. of'Califomia Policewhich:more taken October 31.
'Personnel in Department of Justice and other regulatory agencies are not includedIn 1985. a now aurvey,form was developed by 808 to collect.probation (sPartment data. Because of the new daurcollaction method,,adri.tional cLissIfications may beincluded in the 'All other' category.'Ace reault.ofaddltional.information, 1982 and 1983 prosecution data, 1064- prosecution and probation-deputmont data. and 1985 law enfo..:ement,frostytloi, public-tiefense..end probation department data have been revised froM previously. published data,
Sources: 'State of,CalifomialCeVernore Budget. Annual Report of:the Administrative soffIce,olihe California Courts, Ca9fOrnlat Judicia1Councli....Saivrtituvey of Calmat Probation '
D.. merits. Deoartmint..of .the Wirth, Authori" C.arfornta Publicr,Dofindok District Attorney. andLaw,,EnforcementPersonnel anc1440sttion:personnel (1284,995. and
2 S

TABLE 66
CRIMINAL JUSTICE AGENCY AUTHORIZED FULL-TIt ": PERSONNEL, 1981-1986By Tree of Agency
Type of agency
1981
Number Percent
1982
Number Percent
1983
Number Purr A
1984
Number Percent
1985
Number Percent
1986
Number Percent
TOTAL_ 102,350 100.0 104,931 100.0 107,057 100.0 110,588 100.0 115,348 100.0 119,698 100.0
Law/enforcement 69,420 67.8 71,352 68.0 72,Zt 9. 67.8 74,536 67.4 74,629 64.7 76,576 64.0
Prosecution 7,184 7.0 7,407 7.1 7,460 7.0 7,686 7.0 8,072 7.0 8,474 7.1
Public defense 1,929 1.9 1,972 1.9 i,092 1.9 2,013 1.8 2,179 1.9 2,286 1.9
Courts 1,393 1.4 1,410 1.3 1,451 1.4 1,4i3 1.3 1,502 1.3 1,540 1.3
Corrections 22,424 21.9 22,790 21.7 23,536 22.0 24,C60 22.5 28,967 25.1 30,822 25.7
Note; Percents marnot add to 100,0 because-ofioundng.Source: Table 85.
TABLE 67
POPULATION ESTIMATES, 1981-1986
Year Total
Population at risk
Totals
1986 26,980,800 22,616,101 19,720,387 2,895,714
1985 26,3E5,100 22,053,576 19,200,335 2,853,241
1984 26,622,000 21,757,477 18,886,160 2,871,317
1983 25,174,000 21,470,619 18,559,647 2,910,972
1982 24,724,000 21,163,158 18,194,173 2,P68,985
1981 24,196,000 20,768,326 17,745,509 3,022,817
!Total popufrdion at risk, 10 years of age and older.'Adult popultdion 18 years of ago and older.cJuvonge population, 10.17 years of ago.Notes: These population estimates are provided Dy the Population Research Unit of the California Department of Finance.
Each year. minor adjustments are made in the population estimates. The adjustmoms have a minimal effect on crime and arrest rates.Crime rates are based on the total popula1lon; arrest rates we based on the populatio at risk.