Document of The World Bank · 2010 US$1.00 RMB6.770269 Information received from - World Bank...
121
Document of The World Bank Report No.: 97052 PROJECT PERFORMANCE ASSESSMENT REPORT PEOPLE’S REPUBLIC OF CHINA IRRIGATED AGRICULTURE INTENSIFICATION III PROJECT (IBRD-48030, TF-92393) MAINSTREAMING CLIMATE CHANGE ADAPTATION IN IRRIGATED AGRICULTURE PROJECT (IBRD-48030, TF- 92393) HAI BASIN INTEGRATED WATER AND ENVIRONMENT MANAGEMENT PROJECT (TF-53183) June 19, 2015 IEG Public Sector Evaluation Independent Evaluation Group
Transcript of Document of The World Bank · 2010 US$1.00 RMB6.770269 Information received from - World Bank...

Document of
The World Bank
Report No.: 97052
PROJECT PERFORMANCE ASSESSMENT REPORT
PEOPLE’S REPUBLIC OF CHINA
IRRIGATED AGRICULTURE INTENSIFICATION III PROJECT
(IBRD-48030, TF-92393)
MAINSTREAMING CLIMATE CHANGE ADAPTATION IN IRRIGATED
AGRICULTURE PROJECT (IBRD-48030, TF- 92393)
HAI BASIN INTEGRATED WATER AND ENVIRONMENT MANAGEMENT
PROJECT (TF-53183)
June 19, 2015
IEG Public Sector Evaluation
Independent Evaluation Group

ii
Currency Equivalents (annual averages)
Currency Unit = Renminbi (RMB)
2004 US$1.00 RMB8.276801
2005 US$1.00 RMB8.194317
2006 US$1.00 RMB7.973438
2007 US$1.00 RMB7.607533
2008 US$1.00 RMB6.948655
2009 US$1.00 RMB6.831416
2010 US$1.00 RMB6.770269
Information received from http://databank.worldbank.org - World Bank Indicators
Abbreviations and Acronyms
CAD Comprehensive Agriculture Development
CAS Country Assistance Strategy
COCAD County Office for Comprehensive Agriculture Development
CDD Community Driven Development
COD Chemical Oxygen Demand
CPMO Central Project Management Office
CPS Country Partnership Strategy
ET Evapotranspiration
ERR Economic Rate of Return
FA Farmers’ Association
FB Finance Bureau
FC Farmers’ Cooperative
GEO Global Environmental Objective
HBC Hai Basin Commission
HBP Hai Basin Integrated Water and Environment Management Project
IAIL2 Second Irrigated Agriculture Intensification Project
IAIL3 Third Irrigated Agriculture Intensification Project
ICR Implementation Completion Report
IEG Independent Evaluation Group
IEGPS IEG Public Sector Evaluation
IWEMP Integrated Water and Environment Management Plan
IPM Integrated Pest Management
IRSA Institute of Remote Sensing Applications
KM Knowledge Management
MEP Ministry of Environment Protection
MIS Management Information Systems
MOC Ministry of Construction
MTR Mid Term Review
MWR Ministry of Water Resources
MCCA Mainstreaming Climate Change Adaptation in Irrigated Agriculture
NDRC National Development and Reform Commission
O&M Operations and Maintenance
PAD Project Appraisal Document
PMO Project Management Office
PLG Project Leading Group
POCAD Provincial Office of Comprehensive Agricultural Development
PPAR Project Performance Assessment Report
PPMO Provincial Project Management Office
iii
RS Remote Sensing
SAP Strategic Action Plan
SEBAL Surface Energy Balance Algorithm for Land
SEPA State Environment Protection Administration
SOCAD State Office of Comprehensive Agricultural Development
SWAT Soil and Water Assessment Tool
TUDEPII Tianjin Urban Development and Environment II Project
WCP Water Conservation Project
WUA Water User Association
WRB Water Resource Bureau
3H Basin Huang- Hua- Hai River Basin
Fiscal Year
Government: July 1 – June 30
Director-General, Independent Evaluation : Ms. Caroline Heider
Director, IEG Public Sector Evaluation : Mr. Nicholas David York (Acting)
Manager, IEG Public Sector Evaluation : Ms. Midori Makino (Acting)
Task Manager : Mr. Kenneth M. Chomitz


v
Contents
Principal Ratings ................................................................................................................ ix
Key Staff Responsible......................................................................................................... x
Preface.............................................................................................................................. xiii
Summary ........................................................................................................................... xv
1. Background and Context................................................................................................. 1
2. Irrigated Agriculture Intensification III Project and Mainstreaming Climate Change
Adaptation in Irrigated Agriculture Project ........................................................................ 6
Objectives, Design, and Relevance ................................................................................. 6
Implementation ............................................................................................................. 12
Achievement of the Objectives ..................................................................................... 23
Objective 1: Increase agricultural and water productivity ........................................ 23
Objective 2: Raise farmers’ incomes and competitiveness ....................................... 29
Objective 3: Promote sustainable and participatory water resources and agro-
ecological management ............................................................................................. 33
Objective 4: Enhancing and mainstreaming adaptation to climate change .............. 35
Efficiency ...................................................................................................................... 38
Outcome .................................................................................................................... 39
Risk to Development Outcome ................................................................................. 40
Bank Performance ..................................................................................................... 41
Borrower Performance .............................................................................................. 42
3. Hai Basin Integrated Water and Environment Management Project ............................ 43
Objectives, Design, and Relevance ............................................................................... 43
Implementation ............................................................................................................. 50
Achievement of the Sub-Objectives ............................................................................. 53
Objective 1: Develop an integrated approach to water resource management and
pollution control in the Hai Basin ............................................................................. 55
Objective 2: Reduce pollution in the bohai sea ........................................................ 66
Efficiency ...................................................................................................................... 68
Outcome .................................................................................................................... 70
Risk to Development Outcome ................................................................................. 71
Bank Performance ..................................................................................................... 72
This report was prepared by Keith Robert A. Oblitas and Kenneth M. Chomitz, who assessed the project in
September 2014. The report was peer reviewed by Scott Douglas Rozelle and panel reviewed by Monika
Huppi. Vibhuti Narang Khanna provided administrative support.

vi
Borrower Performance .............................................................................................. 73
4. Lessons on Three Themes ............................................................................................. 74
Promoting sustainable management of water and agriculture .................................. 74
Climate change adaptation ........................................................................................ 77
Learning: knowledge creation and dissemination..................................................... 78
5. Summary of main observations and lessons ................................................................. 82
References ......................................................................................................................... 85
Annex A. Basic Data Sheet for the Irrigated Agriculture Intensification III Project and the
Mainstreaming Climate Change Adaptation in Irrigated Agriculture Project .................. 87
Annex B. Basic Data Sheet for the Hai Basin Integrated Water and Environment Project
........................................................................................................................................... 91
Annex C. List of Persons Met or Contacted ..................................................................... 94
Annex D. Borrower Comment .......................................................................................... 99
Boxes
Box 1.1. Evapotranspiration and Water Use Efficiency ..................................................... 4
Box 2.1. Third Irrigated Agriculture Intensification Loan: Project Components and Costs
............................................................................................................................................. 9
Box 2.2. Mainstreaming Climate Change Adaptation in Irrigated Agriculture: Project
Components and Costs ...................................................................................................... 10
Box 3.1. Measuring Evapotranspiration (ET) ................................................................... 46
Box 3.2. HBP Components and Costs .............................................................................. 47
Tables
Table 2.1. Improving Irrigation: Main Implementation Achievements ............................ 17
Table 2.2. Improving Agricultural Practices: Achievements............................................ 18
Table 2.3. Main Agro Ecological and Water Resources Management Actions ............... 20
Table 2.4. Development of Farmer Associations and Higher Value Crops ...................... 21
Table 2.5. Development of Agro ecological Cropping ..................................................... 22
Table 2.6. Main Climate Change Adaptation Actions ...................................................... 22
Table 2.7. Yields of Major Crops ..................................................................................... 25
Table 2.8. Comparison of Changes in Cereal Yields (kg/hectare) under the Project with
Overall Province Level Yield Changes............................................................................. 26
Table 3.1. HBP – Main Project Outputs ........................................................................... 54
Table 3.2. Pollution Loads to Rivers and to Bohai Sea .................................................... 61
Table 3.3. Output and outcome Indicators Related to Reduced Pollution of the Bohai Sea
........................................................................................................................................... 67

vii
Figures
Figure 2.1. Logical Framework of IAIL3 ......................................................................... 11
Figure 2.2. Nominal and Real Land Value of Production/ha by Year .............................. 24
Figure 2.3. Rice Yield, Wheat Yield, and Water Productivity by Province ..................... 26
Figure 2.4. Comparing Changes in Project Cereal Yields with Changes in Province
Yields (2004 to 2009) ....................................................................................................... 27
Figure 2.5. Real Income Trends of Project Households by Year and Province ............... 31
Figure 2.6. Trends in Project Area per Capita Income Relative to Province Average
Incomes ............................................................................................................................. 32
Figure 3.1. Groundwater Overexploitation by Area and Year.......................................... 59
Figure 3.2. Trends in Actual Minus Target ET by County ............................................... 60
Figure 3.3. Amount of Contaminant Discharged to Rivers – 2004 to 2010 ..................... 62
Figure 3.4. Trends in COD Pollution, by County (normalized by target level of discharge)
........................................................................................................................................... 63
Figure 3.5. Trends in Sewage, by County (normalized by target level of discharge) ...... 64
Figure 3.6. Trends in Inorganic Nitrogen Pollution, by County (normalized by target level
of discharge)...................................................................................................................... 65
The graphics in this report are best viewed in color.


ix
Principal Ratings
Irrigated Agriculture Intensification III Project (IBRD-48030, TF-92393)
ICR* ICR Review* PPAR
Outcome Highly Satisfactory Satisfactory Highly Satisfactory
Risk to
Development
Outcome
Negligible to Low Negligible to Low Negligible to Low
Bank Performance Satisfactory Satisfactory Highly Satisfactory
Borrower
Performance Highly Satisfactory Highly Satisfactory Highly Satisfactory
* The Implementation Completion Report (ICR) is a self-evaluation by the responsible Bank department. The ICR
Review is an intermediate IEGWB product that seeks to independently verify the findings of the ICR.
Mainstreaming Climate Change Adaptation in Irrigated Agriculture Project
(IBRD-48030, TF 92393)
ICR* ICR Review* PPAR
Outcome Highly Satisfactory Satisfactory Highly Satisfactory
Risk to
Development
Outcome
Negligible to Low Negligible to Low Negligible to Low
Bank Performance Satisfactory Satisfactory Highly Satisfactory
Borrower
Performance Highly Satisfactory Highly Satisfactory Highly Satisfactory
* The Implementation Completion Report (ICR) is a self-evaluation by the responsible Bank department. The ICR
Review is an intermediate IEGWB product that seeks to independently verify the findings of the ICR.
Hai Basin Integrated Water and Environment Management Project (TF-53183)
ICR* ICR Review* PPAR
Outcome Satisfactory Moderately Satisfactory Satisfactory
Risk to
Development
Outcome
Negligible to Low
Negligible to Low
Significant
Bank Performance Satisfactory Satisfactory Satisfactory
Borrower
Performance
Highly Satisfactory
Moderately Satisfactory
Satisfactory
* The Implementation Completion Report (ICR) is a self-evaluation by the responsible Bank department. The ICR
Review is an intermediate IEGWB product that seeks to independently verify the findings of the ICR.

x
Key Staff Responsible
Irrigated Agriculture Intensification III Project (IBRD-48030, TF-92393)
Project Task Manager/Leader
Division Chief/
Sector Director Country Director
Appraisal Qun Li Mark D. Wilson David R. Dollar
Completion Qun Li Mark R. Lundell Klaus Rohland
Mainstreaming Climate Change Adaptation in Irrigated Agriculture Project
(IBRD-48030, TF 92393)
Project Task Manager/Leader
Division Chief/
Sector Director Country Director
Appraisal Qun Li Rahul Raturi David R. Dollar
Completion Qun Li Mark R. Lundell Klaus Rohland
Hai Basin Integrated Water and Environment Management Project (TF-53183)
Project Task Manager/Leader
Division Chief/
Sector Director Country Director
Appraisal Douglas Olsson Mark D. Wilson Yukon Huang
Completion Liping Jiang Paul Kriss Klaus Rohland
xi
IEG Mission: Improving World Bank Group development results through excellence in evaluation.
About this Report
The Independent Evaluation Group assesses the programs and activities of the World Bank for two purposes: first, to ensure the integrity of the Bank’s self-evaluation process and to verify that the Bank’s work is producing the expected results, and second, to help develop improved directions, policies, and procedures through the dissemination of lessons drawn from experience. As part of this work, IEG annually assesses 20-25 percent of the Bank’s lending operations through field work. In selecting operations for assessment, preference is given to those that are innovative, large, or complex; those that are relevant to upcoming studies or country evaluations; those for which Executive Directors or Bank management have requested assessments; and those that are likely to generate important lessons.
To prepare a Project Performance Assessment Report (PPAR), IEG staff examine project files and other documents, visit the borrowing country to discuss the operation with the government, and other in-country stakeholders, and interview Bank staff and other donor agency staff both at headquarters and in local offices as appropriate.
Each PPAR is subject to internal IEG peer review, Panel review, and management approval. Once cleared internally, the PPAR is commented on by the responsible Bank department. The PPAR is also sent to the borrower for review. IEG incorporates both Bank and borrower comments as appropriate, and the borrowers' comments are attached to the document that is sent to the Bank's Board of Executive Directors. After an assessment report has been sent to the Board, it is disclosed to the public.
About the IEG Rating System for Public Sector Evaluations
IEG’s use of multiple evaluation methods offers both rigor and a necessary level of flexibility to adapt to lending instrument, project design, or sectoral approach. IEG evaluators all apply the same basic method to arrive at their project ratings. Following is the definition and rating scale used for each evaluation criterion (additional information is available on the IEG website: http://worldbank.org/ieg).
Outcome: The extent to which the operation’s major relevant objectives were achieved, or are expected to be achieved, efficiently. The rating has three dimensions: relevance, efficacy, and efficiency. Relevance includes relevance of objectives and relevance of design. Relevance of objectives is the extent to which the project’s objectives are consistent with the country’s current development priorities and with current Bank country and sectoral assistance strategies and corporate goals (expressed in Poverty Reduction Strategy Papers, Country Assistance Strategies, Sector Strategy Papers, Operational Policies). Relevance of design is the extent to which the project’s design is consistent with the stated objectives. Efficacy is the extent to which the project’s objectives were achieved, or are expected to be achieved, taking into account their relative importance. Efficiency is the extent to which the project achieved, or is expected to achieve, a return higher than the opportunity cost of capital and benefits at least cost compared to alternatives. The efficiency dimension generally is not applied to adjustment operations. Possible ratings for Outcome: Highly Satisfactory, Satisfactory, Moderately Satisfactory, Moderately Unsatisfactory, Unsatisfactory, Highly Unsatisfactory.
Risk to Development Outcome: The risk, at the time of evaluation, that development outcomes (or expected outcomes) will not be maintained (or realized). Possible ratings for Risk to Development Outcome: High, Significant, Moderate, Negligible to Low, Not Evaluable.
Bank Performance: The extent to which services provided by the Bank ensured quality at entry of the operation and supported effective implementation through appropriate supervision (including ensuring adequate transition arrangements for regular operation of supported activities after loan/credit closing, toward the achievement of development outcomes. The rating has two dimensions: quality at entry and quality of supervision. Possible ratings for Bank Performance: Highly Satisfactory, Satisfactory, Moderately Satisfactory, Moderately Unsatisfactory, Unsatisfactory, Highly Unsatisfactory.
Borrower Performance: The extent to which the borrower (including the government and implementing agency or agencies) ensured quality of preparation and implementation, and complied with covenants and agreements, toward the achievement of development outcomes. The rating has two dimensions: government performance and implementing agency(ies) performance. Possible ratings for Borrower Performance: Highly Satisfactory, Satisfactory, Moderately Satisfactory, Moderately Unsatisfactory, Unsatisfactory, Highly Unsatisfactory.

xiii
Preface
This is the Project Performance Assessment Report for three projects in the People’s
Republic of China: the Third Irrigated Agriculture Intensification (IAIL3) Loan; the
Mainstreaming Climate Change Adaptation in Irrigated Agriculture (MCCA) Global
Environment Facility Grant; and the Hai Basin Integrated Water and Environment
Management Project (HBP). The MCCA was blended with IAIL3.
IAIL3 was approved on October 11, 2005 for a loan of $200 million (IBRD-48030), and
closed as scheduled on December 31, 2010, with the Loan fully disbursed. MCCA was
approved on April 17, 2008, about 2 ½ years after approval of IAIL3. It received a Grant
from the Global Environment Facility of $5 million which was also fully disbursed. The
project closed as scheduled on June 30, 2012. HBP was approved on April 15, 2004 for a
Global Environment Facility (GEF) Grant of $17 million, of which nearly all ($16.96
million) was disbursed. It closed on June 30, 2010, one year after the original planned
date.
Together, the projects tackled many of China’s water issues – from the macro and multi-
sectoral picture under the HBP to the farm-level actions under IAIL3 and MCCA,
providing perspectives of possible relevance to future water management in China, and in
other countries.
The report was prepared by Keith Oblitas, Consultant, and Kenneth Chomitz, Senior
Advisor and Task Team Leader, Independent Evaluation Group. It was based on a
mission to China in September 2014 to visit field sites and discuss the projects with
Government officials, academics, World Bank staff and other knowledgeable persons;
and review of project documents, research papers and other sources.
The Assessment is a “Learning” PPAR, with the objective of more in-depth review to
garner lessons from the assessment.
Following standard IEG procedures, a copy of the draft PPAR was sent to the relevant
government officials and agencies for their review and feedback, and comments received
from the Government have been included in Annex D.


xv
Summary
This Project Performance Assessment Review assesses three projects which between
them have addressed a spectrum of issues facing China’s water and agriculture sectors:
the Third Irrigated Agriculture Intensification Project (“IAIL3,” FY06, IBRD Loan of
$200 million); the Mainstreaming Climate Change Adaptation in Irrigated Agriculture
Project (“MCCA,” FY08, GEF Grant of $5 million); and the Hai Basin Integrated Water
and Environment Management Project (“HBP,”FY04, GEF Grant of $17 million). All
three operations have been innovative, have helped advance China’s capability for
tackling its increasingly difficult water resource and productivity issues, and have been
learning experiences for replication in other water and agriculture projects in China. The
impacts of the projects, how these impacts were achieved, and how learning was
generated and disseminated from project experience, are germane to future development
of the water and agriculture sectors, and to the mainstreaming of changes piloted and
found effective through these operations.
China’s Water Sector Issues
China faces tremendous challenges in sustainably managing water and agriculture.
Precipitation in the north is decreasing and will probably become more variable, so water
supply is declining. At the same time, there is increasing demand for food – and
therefore for water, since agriculture is the main user. Hence many rivers run seasonally
dry and groundwater is unsustainably drawn down. At the same time, overuse of
fertilizer and pesticides poses downstream environmental hazards, including
eutrophication and red tides. Industrial and domestic pollution exacerbates the problem.
This situation raises the difficult institutional problem of managing finite water resources
within a river basin – a problem which requires understanding and dealing with trade-offs
among water uses and users. China faced three obstacles in addressing this problem.
First, river basin boundaries do not coincide with the established provincial and county
level governments. Second the environmental and water authorities have had overlapping
and inconsistent mandates, and yet did not coordinate with one another. And third, there
has been a lack of integrated knowledge of water use and water quality, and a lack of
understanding on how different scenarios would affect water flows and economic
conditions.
These problems are particularly severe in the Huang-Huai-Hai rivers basin, where all
three projects were situated. The “3H” Basin is China’s prime agricultural area - the
“breadbasket” of the country, producing about half of national grain output. It is also the
source of one-third of the nation’s industrial output. Yet the basin is particularly water
stressed and polluted.
To confront these challenges, the three projects introduced a set of innovations in
irrigated agriculture and water resources management. In IAIL3, it fixed dilapidated
irrigation canals, introduced productivity-enhancing and water-saving agricultural
practices, and supported farmer organizations to better manage water and to boost
profitability. It also supported integrated pest management and reduced fertilizer

xvi
application. MCCA reinforced IAIL3 by emphasizing activities that were adaptive to
current climate variability and future climate change.
In contrast to the farm and community-level interventions, the HBP addressed the
institutional coordination issues at the county, province, and basin level. The project’s
contribution was in finding a pragmatic way to operate effectively within the government
structure and to bring the key agencies involved with water together to work jointly on
comprehensive water management. It also introduced technical tools for planning and for
monitoring actual consumptive water use.
IAIL3 and MCCA
The objectives of IAIL3 were “to increase water and agricultural productivity in low and
medium yield farm land areas; raise farmers’ income and strengthen their competitive
capacity under post-WTO conditions; and promote sustainable and participatory water
resources management and agro-ecological environmental management in the Huang-
Huai-Hai Basin Area.” MCCA’s added objective was to: “enhance adaptation to climate
change in agriculture and irrigation water management practices through awareness
raising, institutional and capacity strengthening and demonstration activities in the 3-H
Basin.” The projects are evaluated together as they were blended to be a combined
operation.
These objectives were highly relevant. They recognized that improved agricultural
productivity was a necessary base for better use of the nation’s water, and also
recognized that to be sustainable, water and land management needed to help protect the
environment. They addressed China’s goals of feeding a growing population and
boosting rural incomes. The additional climate change adaptation objective responded to
increasing concerns about trends toward higher temperatures and more frequent extreme
weather events. IAIL3/MCCA was the first comprehensive program in China to
introduce climate change adaptation in agricultural development, hence responding to a
potentially critical need. These objectives fit well with the Bank’s Country Partnership
Strategy (2006-2011) and with the Government’s 11th Five Year Plan (2006-2010). While
agricultural productivity remained a fundamental target, water related environmental
issues, climatic impacts and “greener” agricultural growth have assumed greater
importance.
IAIL3’s design relevance was high, in that it directly addressed the objectives with an
effective combination of investments - improving irrigation systems; establishing water
user associations as a base for water saving irrigation, and a major intensification of
agricultural extension (a doubling in the extension staff/farmer density). MCCA’s design
relevance was also high. It was well suited to mainstreaming climate change adaptation
actions - the measures to be taken were practical and could be expected to have an
impact, and nesting within IAIL3’s existing institutional structure ensured
implementation capacity and an expeditious start.
IAIL3/MCCA’s efficacy was high for three objectives and substantial for one.
Agricultural productivity (kg/ha) increased by about 24 to 39 percent; the productivity of
water increased by 55 percent; and real farm incomes increased substantially. The

xvii
efficacy of the productivity and income increase objectives were both high. Amongst the
agro-ecological outputs that the project promoted, the largest (with achievements above
appraisal targets) were the establishment of 390,000 hectares of water saving irrigation
under water user associations; land grading of 155,000 hectares (at appraisal only a pilot
exercise had been planned); and achieving near-universal coverage of integrated pest
management, which increased from 70 percent to 96 percent of land area. Due to a lack
of data on agroecological outcomes, efficacy for this objective is rated as substantial.
Under the climate change adaptation program, efficacy was high. A menu of field
activities was drawn up and integrated in the IAIL3 program, eventually reaching half of
the project area. Adaptation measures – such as shelterbelts of trees, water retention
ponds in irrigation schemes, more drought and flood resistant crop varieties and straw
mulching - were practical and in general improved productivity, hence were attractive to
farmers.
Project efficiency was high. The economic rate of return was high, and project
implementation was as scheduled, within projected costs, and with nearly all
implementation targets achieved or exceeded. Given the high ratings for relevance,
efficacy and efficiency, IAIL3/MCCA’s Outcome was Highly Satisfactory. Risk to
Development Outcome is rated Negligible to Low.
The Bank’s and Borrower’s performances were both Highly Satisfactory. For the Bank,
quality at entry was strong, both in strategic and innovative qualities; while proactive
supervision enabled practically all targets to be met, including the added climate change
adaptation program which had little Chinese experience to draw on. Government
provided full support to the project, the main implementing agency – the State Office for
Comprehensive Agriculture Development – was a highly effective coordinator, and the
technical agencies performed to good standard.
HBP
The Objectives of the Hai Basin Integrated Water and Environment Management Project,
as stated in the Grant Agreement, were to: “to assist the recipient in reducing pollution in
the Bohai Sea by developing an integrated approach to water resource management and
pollution control in the Hai Basin”. These objectives were highly relevant. Finding ways
to manage water and pollution in an integrated way and to reduce pollution to the Bohai
Sea were critical needs, yet China had made only limited progress towards holistic water
resources management.
The design was substantially relevant. It understood that achieving integrated water-
environment management would require significant conceptual, technical and
institutional innovation. On the conceptual side, the project design recognized the need
to restrict agricultural water demand to sustainable levels. It introduced a revolutionary
paradigm shift away from traditional views of irrigation efficiency. It focused instead on
the need to put a hard cap on the consumptive use of water (evapotranspiration or ET).
On the technical side, this meant that the project needed to develop a tool for tracking
and managing ET. In addition, optimizing the complex interplay of quality and quantity
required spatially explicit computer models that could trace flows of water and pollutants,
including nonpoint source pollution from agriculture. With respect to institutions, it
xviii
proposed to create cooperation and data-sharing between the environmental and water
authorities, and to sponsor the creation of integrated water-environment management
plans (IWEMPs) at the county and basin levels. There was a disconnect, however,
between the ambition of the objective to reduce pollution in the Bohai Sea and the
project’s modest scale.
The HBP had substantial efficacy in each of its two sub-objectives:
First, significant steps were taken towards integration of water and environmental
management – the Ministries of Water Resources and Environmental Management
planned and implemented the project jointly and shared data on water quality and
quantity for the first time; all participating counties and provinces prepared and began
implementing multi-sectorial water and environmental management plans; a strategic
action plan was prepared for the whole Hai Basin, and a knowledge management center
was established for basin-wide hydrological data and basin and sub-basin modeling; and
sophisticated technical capacity was fostered in remote sensing measurement of ET and
in hydrological-economic modeling. The new paradigm on water conservation gained
widespread traction. However, sharing of hydrological and ET data diminished after the
project closed, and the successful demonstration of cooperation between the
environmental and water authorities, while continuing, did not spark the anticipated
replication and scale-up elsewhere.
These institutional achievements had physical impacts on water. Improved management
of water pollution was incorporated in the IWEMPs, supplemented by technical support
for clean-up of a polluted canal and for operation of two wastewater treatment plants.
There were substantial reductions in emissions of COD, inorganic nitrogen and sewage.
There was a large project-wide decrease in groundwater over-extraction. However, this
was not accompanied by an overall decrease in ET, suggesting that the improvement may
largely be due to a fortuitous and temporary increase in precipitation. Water use
decreased in some counties.
Second, there was a small but measurable reduction in pollution inflows into the Bohai
Sea, exceeding targets. The direct impact was limited by the fact that the Hai accounts
for only a small part of the overall pollution inflow. However, the project demonstrated
approaches that are replicable throughout the Sea’s watershed area.
The project’s efficiency was High, based on its accomplishments in introducing
integrated water management to more counties than anticipated, effectiveness in reducing
pollution, and the high economic returns to even small water savings.
The project’s outcome was Satisfactory. This rating balances some exemplary
achievements with some shortcomings. On one hand, its signal accomplishments
included gaining acceptance for a wholly new paradigm for water management,
supporting the development and application of global state-of-the-art remote sensing
techniques for water monitoring, setting up integrated water resource management based
on sophisticated hydrological monitoring, and breaking institutional silos between the
environment and water ministries. On the other hand the faltering of data-sharing, the
lack of expansion of environment-water agency cooperation, and the lack of anticipated

xix
replication, are factored into the rating. The same considerations lead to a rating of
Significant Risk to Development Outcome. Evapotranspiration maps are still being
assembled by the Hai Basin Commission, but this information is no longer being shared
with all of the pilot counties, impeding the goal of operationalizing the use of ET for
monitoring and water allocation. The Bank’s performance is rated Satisfactory, in
particular because of the diversely specialized and innovative task teams both at entry
and during supervision, and the willingness to take risks introducing new concepts. The
borrower’s approach was Satisfactory overall. After initial skepticism about the new
approaches, Government performance was satisfactory. Performance of the implementing
agencies (the two ministries, the Project Management Offices and technical staff from
county and provincial governments) was Satisfactory. While it took time initially to
adjust to the new concepts, unfamiliar activities were then implemented expeditiously
and to high standard. The performance rating for Government and for the implementing
agencies was affected by the shortcomings in data-sharing and replication.
Cross-cutting issues
Sustainable management of agriculture and water
The field-level interventions of IAIL3/MCCA were complementary to the Hai Basin
support for integrated watershed planning. This combination is generalizable: integrated
water planning needs to be able to draw on field-level tools.
However, in China as elsewhere, the ‘silos’ of sectorial and provincial authority conflict
with the logic of integrated water basin management. The HBP showed that it was
possible to undertake improved planning and implementation even within existing
bureaucratic structures. Further progress may be possible through expanded interim
ministerial cooperation and by strengthening the coordinating role of the Hai Basin
Commission. The introduction of the concept of ET has succeeded in changing, for the
better, perspectives on water management. The technical success in timely and accurate
measurements of ET is also noteworthy. Operational application of these measurements
is less evident. Partly this is due to the complexity of the task. Separating ET reduction
signals from “noise” is harder in the Hai Basin than it is in the arid areas covered by the
follow-on Xinjiang Turpan project.
The challenges of ET management are compounded when data are not freely shared,
though it could be done over the internet at little or no cost. The joint World Bank-
Government of China report, China 2030, emphasizes the value of public disclosure of
environmental information. Wider distribution of ET and other monitoring data to
stakeholders would be consistent with this strategy and with the ‘bottom-up’ planning
orientation of the Hai Basin project, and would complement the strong technical
capabilities of Chinese academics and researchers. Further research could help to resolve
the inconsistencies between reportedly strong reductions in groundwater exploitation and
weak reductions in ET or water use.

xx
Mainstreaming climate change
A challenge in assessing the success of adaptation mainstreaming, in general, is the
strong overlap between what is good for adaptation and what is good for development –
the domain of ‘no-regrets’ or ‘win-win’ options. The success of MCCA stems largely
from identifying and implementing practices that already constitute good farming, and
will be increasingly important in an uncertain future.
The climate change adaptation measures brought in under the IAIL3/MCCA program
were in most cases technologies already known, a number of which were already being
practiced under IAIL3 (e.gs. tree shelter belts, increasing water conveyance efficiency,
mulching). There were some measures, such as developing seed better able to withstand
droughts and floods that required actions specific to the climate change adaptation
agenda, but much of the climate change technologies were familiar, in practice or in
concept, to agriculture and irrigation extension staff. Nearly all IAIL3/MCCA’s climate
change adaptation measures increased average farm yields as well as reduced climatic
risks, and farmers, once they understood the climate change agenda, and witnessed
demonstrations, adopted most of the practices enthusiastically. A particular effort,
however, had to be put in to familiarize civil society, the extension staff themselves, and
farmers with the concept of climate change and the adaptations feasible to counter such
changes. And even before that, Government decision makers and senior and middle-level
extension staff from the various agencies involved with the project needed themselves to
understand and embrace the climate change agenda. The MCCA project also supported
sophisticated climate modeling efforts, but findings often had a generic flavor, a common
experience with such exercises, reflecting fundamental scientific uncertainties, especially
with regard to precipitation trends and to the effect of increasing carbon dioxide on plant
growth.
Learning
Several aspects of learning stand out. A notable feature of all the projects, and a
significant factor in the projects’ performance, was the substantial use, and integration
within the institutions, of academics and consultants in research, training and the work
program generally. They included experts from the Chinese Academy of Sciences, from
nationally prominent and provincial universities, and international and local expert
consultants.
Second, World Bank and project staff played a crucial role in introducing new ideas and
technology, particularly the concept and measurement of ET, and developing “water
saving” irrigation technology. Bank TTLs brought expert knowledge and evangelistic
fervor to promoting these ideas. Their counterparts in the executing agencies also
showed dynamism and enthusiasm. They, together with Chinese experts who embraced
these ideas, have succeeded in beginning a diffusion of these approaches to follow-on
projects in China and internationally. However, these concepts have not spread widely
between Bank teams concerned with water.
Finally, IAIL3 missed an opportunity to contribute to better learning about how to
improve land and water productivity. The project introduced a diverse range of

xxi
approaches and technologies in engineering, agronomy and management. It would be
desirable to understand which worked best under which conditions, so as to guide future
scale-up. While the project did gather voluminous data and produce reports at province
and county levels, rigorous impact evaluation was not undertaken.
Lessons
Generalizable findings and lessons from the projects’ experiences include:
The concept of evapotranspiration management can underpin sustainable
water management. Three simple but powerful ideas - that water is only used up
by evapotranspiration, that allowable evapotranspiration has to be capped at a
sustainable level, and that the goal is to minimize non-beneficial
evapotranspiration - can transform the way water is managed.
Water-saving agricultural projects could in principle provide immense
economic benefits. In water-scarce regions such as north China, there is a
substantial economic value to water savings. Savings on the scale envisioned by
the projects, if evaluated at conservation shadow prices, would imply
extraordinary economic returns to investment. In these projects, unfortunately,
data are not adequate to verify whether there was net water saving.
It is possible to simultaneously boost water productivity and land
productivity. Usually, more productivity requires more water. Here, intensive
agricultural extension, community management of irrigation, environmental
improvements, and promotion of higher value crops and commercialization
managed to conserve water while boosting crop quantity and quality. This was
done in significant part by reducing non-beneficial evapotranspiration.
Multi-agency, technically based, integrated water management is possible.
Under the HBP, environment and water authorities worked together, in
consultation with stakeholders to develop plans. The plans were informed by
hydrological models that helped prioritize ways to meet water quality and
quantity goals. They were incorporated in operational county investment plans.
Field-level and basin level approaches are complementary. Holistic
management at the basin level depended on the ability to deploy field level
techniques for increasing water efficiency. But promoting irrigation efficiency
can lead to continued groundwater depletion unless total consumption is capped.
Sharing of data is a key to success. Progress was made when the Environment
and Water ministries pooled information from their formerly separate monitoring
stations and worked together to solve problems, and when Basin authorities
shared information with counties. Coordination was hindered when counties
found it hard to share information with upstream or downstream neighbors, and
when information flows from the center diminished. Globally, there is a growing
realization among public agencies that by making data open – freely accessible,

xxii
machine readable and unrestricted in use – both public and private sectors are able
to make better and more informed decisions.
Climate adaptation interventions are easily assimilated when they bring
immediate benefits under current climate conditions and variability.
Measures introduced were resilient to future conditions, but already made good
farming sense given current risks. Substantial outreach to farmers and
policymakers helped with adoption, as did incorporation of the innovations in a
larger project.
Climate modeling is best used to test adaptation policies for robustness
against different scenarios, rather than to predict ‘what will be.’ There are
limits to the ability of climate models to predict future cropping conditions,
because of fundamental uncertainties about the effect of-more carbon dioxide on
crop growth, and inability of the models to accurately predict precipitation.
The Bank can be a driving force for technology transfer. Innovations in
integrated water management, and the ET paradigm, were introduced by Bank
TTLs who combined expertise with persuasive leadership, supported by
international and local experts.
Caroline Heider
Director-General
Evaluation

1
1. Background and Context
1.1 The three projects evaluated in this Project Performance Assessment Review
addressed a central issue facing China’s water and agriculture sectors: water scarcity. The
projects were: the Third Irrigated Agriculture Intensification Project (IAIL3); the Hai
Basin Integrated Water and Environment Management Project (HBP); and the
Mainstreaming Climate Change Adaptation in Irrigated Agriculture Project (MCCA).
The projects incorporated innovative approaches to tackling the increasingly difficult
resource and productivity issues that China confronts. The projects provide lessons for
future design and implementation of the larger programs that have succeeded them, with
possible relevance also for other countries facing land and water scarcity.
Land and Water Scarcity
1.2 On a per capita basis, China’s land and water resources compare poorly with most
other nations. With a population of 1.36 billion, China has over 20 percent of the world’s
population. Yet it has only 6 percent of the world’s land area, 7 percent of farm land area,
and 6 percent of renewable water resources. Scarcity is compounded by pollution: in
2009, 43% of rivers were classified as posing health risks from direct use1 – over half of
the country’s water is estimated to be “polluted,” with rapid growth of industry and urban
centers adding pressures both as sources of pollution and as additional demand for water
supplies. China’s GDP growth rate has slowed somewhat since the 10 percent per annum
growth rates of the 1990s, but at about 8 percent per annum (2013) is still a structural
driver of greater demand for both food and water.2
1.3 Unsustainable water use is of particular concern in the Huang-Huai-Hai rivers
basin, China’s bread basket and the site of all three projects. The “3H” Basin has a
population of over 425 million, and accounts for about one-third of national industrial
output, thus making it a hub of China’s economy. The Basin is China’s prime agricultural
area and produces about half of national grain output. Yet the basin is particularly water
stressed. It has less than one-third of China’s average water availability, overexploitation
is causing groundwater tables to decline, and the combination of agricultural, urban and
industrial pollution severely degrades most surface water.
1.4 Climate risks to Chinese agriculture have long been known (Smit and Cai, 1996).
Rising temperatures, increased rainfall variability, and changing seasonality could imperil
farm yields, especially in the already dry north and west. Over the last 30 years, rising
temperatures are estimated to have already depressed potential yields of maize, soy and
wheat (Lobell, Schlenker and Costa-Roberts. 2011). However, uncertainties about
precipitation trends, the degree to which increasing CO2 levels will benefit crops, and
nonlinearities in temperature impact on yield, complicate efforts to forecast climate
change impacts (Chavas, Izaurralde et al 2009; Wei, Declan et al. 2009; Piao, Ciais et al.
2010). These impacts add to the stresses posed by growing demand for food and water.
1 World Bank and Development Research Center of the State Council. 2013. p. 236.
2 World Development Indicators, World Bank; and PADs and ICRs of IAIL3, HBP, and MCCA.
2
Government and Bank Water Strategy
1.5 Water scarcity and low productivity have been longstanding concerns in China,
but until the 1990s the Chinese Government was primarily oriented to supply-side
solutions, such as infrastructure construction. This orientation has changed over time and
the water sector has also become more prominent in Government decision making. But it
is only quite recently that the concepts of water resources management (to better allocate
water between sectors, to make water more productive, and to control overexploitation),
and management of water pollution, have received priority attention. Gathering pace in
the 11th Five Year Plan (2006-2010), and with heightened emphasis in the 12th Five Year
Plan (2011-2015), water resources management, water saving, efficiency of agricultural
water, and management of pollution have become policy priorities. In 2012, the State
Council established the landmark “Three Red Lines,” establishing a national cap on water
use, and targets for irrigation efficiency and for water quality. But the broad precedents
to the more recent strategies of Government and the Bank go back at least a dozen years.
The FY03 to FY05 CAS emphasized in its “Thematic Framework” the goal of an
environmentally sustainable development process, another major theme being poverty
alleviation for the disadvantaged and China’s poorer areas.
1.6 Concern with agricultural adaptation to climate change has progressively gained
attention. The Country Partnership Strategy (CPS) for FY 2006 to FY 2010 raised climate
change as an issue, and climate change is discussed more specifically in the CPS for
FY13 to FY16. Other concerns increasingly referred to by both Government and the
Bank are the need to conserve natural resources and reduce pollution. Knowledge transfer
and a “knowledge agenda”, an interest of both Government and the Bank, is also referred
to, going back to the FY03 to FY05 CAS.
1.7 The Bank’s strategy supported Government’s changing priorities, and the projects
themselves provided a means of piloting new technical and institutional approaches. A
strong “Green” Agenda is put forward in the FY13 to FY16 CPS, and “Greener Growth”
is one of the report’s strategic themes. Emphasizing this, the CPS comments that
“addressing the Country’s environmental deficit is an ongoing challenge,’ noting that 300
million of China’s population use contaminated water. Climate change is also addressed
in the CPS. Raising agricultural productivity is also targeted, with both the Government
and the Bank seeing a need to make agriculture more competitive, especially after China
joined the World Trade Organization in 2001. To this end, Government is focusing on
moving up the values chain to access higher quality markets. Agricultural productivity
and food self-sufficiency still remain priority features in the 12th Plan. This necessarily
implies a higher productivity of land and water, and the conservation, both in quantity
and quality, of both resources
The Projects
1.8 The three projects reviewed in this report, though small relative to the Chinese
agriculture sector, tried to pioneer new approaches to water management.
1.9 The Third Irrigated Agriculture Intensification Loan (IAIL3, IBRD Loan of $200
million) addressed the need to substantially increase the agricultural productivity and

3
environmental sustainability of both land and water. IAIL3 had three main thrusts to
introduce water saving and increase agricultural productivity: (i) engineering – by
rehabilitating and modernizing, using water saving technology, the lower levels of
irrigation schemes (where the greatest water losses occur); (ii) agronomy - by improving
agricultural practices both for enhancing yields and conserving water and land; and (iii)
organizational improvements - through empowering water user associations. The project
also promoted, through farmer associations, higher value crops and commercialized
marketing. Throughout implementation, technical assistance to farmers was intensive,
through existing government structures supplemented by widespread use of China’s
academia.
1.10 At around midterm, IAIL3 was blended with a small ($5 million) GEF Grant for
a Mainstreaming Climate Change Adaptation in Irrigated Agriculture Project (MCCA),
reflecting greater attention to this issue by both the Bank and Government. Until then,
little had been done by Government to mainstream climate change adaptation activities in
the rural sector. Hence, MCCA’s agenda was largely the piloting of an array of activities
to test technologies for wider implementation.
1.11 The Hai Basin Integrated Water and Environment Management Project HBP,
GEF Grant of $17 million) is the third project examined. HBP pilots an innovative
approach to multi-sectorial management of water and water-based pollution, including a
number of experimental features. The hub of the project was the preparation by counties
of Integrated Water and Environment Management Plans (IWEMPs). HBP placed as
much emphasis on pollution management as it did on water resources management, the
two – water quantity and quality – being managed as an integrated whole. This was an
unusual concept for China, which had water resources and environment in different
ministries, with little communication between them.
1.12 As an integrated water management effort, the HBP was the broadest in scope of
the three operations. A number of river basin projects, including projects financed by the
Bank, had been implemented earlier. However, the HBP was the most advanced in
several institutional features. It pioneered a number of advanced technologies, including a
computerized knowledge management system, and piloting of remote sensing-based
evapotranspiration measurement. This could be used for managing water use, with
significant potential for boosting China’s water savings and improving water resources
management.
Three issues of broad interest
1.13 Three themes link these projects and are of broad interest. First and most
importantly, all three projects are centrally concerned with sustainable water
management. In the past, water savings from irrigation efficiency have often been used to
expand cultivation, so that water was not really saved. This leads to continued
unsustainable drawdown of surface and groundwater. In response, the projects
introduced a paradigm shift from ‘irrigation efficiency’ to ‘real water savings’. That is,
they recognize the need to cap total water consumption at sustainable levels, and
introduced planning and operational tools to do this. The concept of evapotranspiration
(ET) is central to this paradigm shift (Box 1.1).

4
1.14 Second, the projects are among the first to confront the question: how does
explicit consideration of climate change impacts affect land and water management for
agriculture?
1.15 Third, these projects are noteworthy for their emphasis on learning, within and
between projects, and for their incorporation of academia into planning and operations.
1.16 The reader who is interested primarily in lessons regarding these issues, rather
than project details, may focus on Box 1.1 and section 4, which are self-standing.
Report Structure
1.17 This report is structured as follows. Succeeding this chapter there are two chapters
providing detailed reviews, including ratings of performance, of the projects. Chapter 2
reviews IAIL3 and its blended MCCA operation. Chapter 3 reviews the Hai Basin
IWEMP. A broader discussion, involving all three projects, follows in Chapter 4, focused
on general issues that have emerged in the review.
Box 1.1. Evapotranspiration and Water Use Efficiency
Through the Hai Basin and associated projects, the World Bank introduced a paradigm for
thinking about water efficiency that is quite different from the way irrigation engineers, in China
and elsewhere, have traditionally thought about efficient use of water.
The new paradigm focuses on
evapotranspiration (ET) as the focus of water
management. ET consists of water that
evaporates from the soil or from leaves, plus
the water that plants take up from the ground
and transpire (‘exhale’) as water vapor. The
ET paradigm has the following elements.
1. ET represents the water that is actually
used up and lost to a water basin. So ET=real
water consumption. (Of course, flows to the
sea are also lost to the basin.)
2. For sustainable water management – to
avoid drawing down groundwater – average
annual ET should equal average annual
precipitation in a basin.
3. ET = beneficial ET + non-beneficial ET. Beneficial ET is the transpiration of crops and of
desired natural vegetation such as forests. Non-beneficial ET includes evaporation from the soil
and from open canals, and transpiration from weeds and undesirable vegetation.
4. The goal of water management is to minimize non-beneficial ET while capping total basin ET
at a level that is less than average precipitation, thus allowing adequate river flows for navigation
and aquatic life. So at the basin level, on average:
Average Precipitation = target beneficial ET + non beneficial ET +required river flow to sea.
The idea is to reallocate as much non beneficial ET as possible to beneficial ET or to required
river flow (if that is inadequate).

5
This paradigm has implications that are counterintuitive to many irrigation practitioners and
planners. Irrigation specialists think in terms of water withdrawals – how much is going from the
river into the canal. The traditional view has two serious flaws in the context of the Hai Basin, or
other places where groundwater is being unsustainably drawn down. First the traditional view
prizes ‘crop per drop’ (of water), but pays no attention to total water consumption. So, for
instance, introduction of drip irrigation may save water at the plot level, but if the saved water is
used to expand cultivation, the Basin as a whole sees no savings. Second, the traditional view
mischaracterizes losses. It sees leakages from irrigation as losses, when in fact this water
recharges groundwater and can be used by other crops, or can contribute to environmental flows.
So the new and old paradigms lead farmers and planners to favor different actions (see below).
Traditional irrigation and water managers may resist the new paradigm because it is
counterintuitive, because it is inconsistent with the technical specifications of existing
regulations, or because, in overdrawn basins, it highlights the unpopular message that total water
consumption needs to be curbed. An important achievement of the HBP was to gain wide
acceptance of the new paradigm.
Action Does it contribute to ET
efficiency?
Does it contribute
to irrigation
efficiency?
Line an
irrigation canal
to prevent
leakage
No Yes
Replace lined
canals with
pipes
Yes Yes
Land leveling
Partly; reductions in percolation
are not truly water-saving,
reductions in evaporation are
Yes
Weeding Yes Yes
Drip irrigation
To the extent that it reduces
evaporation. But gains are lost
if water that formerly went to
groundwater is now used to
expand irrigation
Yes
Surface
mulching Yes
Not for post-harvest
mulching with
straw residue
Source: draws on Perry and others 2009.

6
2. Irrigated Agriculture Intensification III Project and
Mainstreaming Climate Change Adaptation in
Irrigated Agriculture Project
Objectives, Design, and Relevance
2.1 The Irrigated Agriculture Intensification III Project (IAIL3) and the
Mainstreaming Climate Change Adaptation in Irrigated Agriculture Project (MCCA) are
evaluated jointly rather than sequentially because MCCA was blended with IAIL3 to
adjust the IAIL3 program, during its implementation, to include a climate change
adaptation agenda. The two operations are closely interlinked.
2.2 The objectives of the Irrigated Agriculture Intensification III Project (IAIL3)
were:
“To increase water and agricultural productivity in low and medium yield farm land
areas; raise farmers’ income and strengthen their competitive capacity under post-WTO
conditions; and promote sustainable and participatory water resources management and
agro-ecological environmental management in the Huang-Huai-Hai Basin Area.”
Source: Loan Agreement, December 9, 2005 (The PAD version is similar except that it includes the word
“demonstrate” before “promote”)
2.3 The objectives of the Mainstreaming Climate Change Adaptation in Irrigated
Agriculture Project (MCCA) (a GEF Special Climate Change Fund) were:
“To enhance adaptation to climate change in agriculture and irrigation water management
practices through awareness raising, institutional and capacity strengthening and
demonstration activities in the 3-H Basin.”
Source: Grant Agreement; Special Climate Change Fund for the Mainstreaming Climate Change Adaptation in Irrigated Agriculture Project, February 25, 2008.
Relevance of objectives
2.4 The IAIL3 directly addressed core needs in China’s development and
environmental conservation strategy. Notwithstanding China’s buoyant overall GDP
growth rate (10 percent per annum in most of the 2000s, and still 8 percent in 2013), rural
income growth has lagged behind the urban sector, partly a result of inefficient use of
land and water. Growth faces constraints of land and water availability. Nearly all
productive land is already cultivated. Groundwater tables are falling, water is polluted,
and overexploited rivers run dry.
2.5 These constraints are an increasing concern for China. First, improving
productivity is important for raising the incomes and welfare of the rural population.
Second, food security is a perennial issue given the growth in demand due to population
growth and increasing incomes. And finally, unsustainable use of land and water threaten
agricultural productivity and environmental health. These issues are especially pertinent
7
to the Huang/Huai/Hai Basin, source of half of national cereal production. To relieve this
situation, the productivity of agriculture, both per unit of land and per unit of water, must
increase.
2.6 These concerns are reflected in the “World Bank-China Country Partnership
Strategy, 2006-2010” and China’s 11th (2006-2010) Five Year Plan. The CPS includes a
“Supporting Greener Growth” theme, promoting sustainable agricultural practices and
natural resources management. The Strategy notes that the Bank has placed increasing
attention to environmental issues, but also refers to the need to increase agricultural
productivity. The Eleventh Plan emphasized increasing agricultural productivity,
improving irrigation efficiency, and protecting the agriculture related environment.
2.7 The 12th Plan (2011-2015) elaborates the focus of the 11th Plan in more detail.
The 12th Plan aimed to enhance agricultural productivity via increased mechanization,
more advanced agricultural practices, improved irrigation, and commercialized produce
markets. Conservation of irrigation water is also emphasized. And agro-ecological
farming to protect the quantity and quality of soils and water, including protecting
groundwater from overexploitation, brings in the environmental agenda. Lastly, self-
sufficiency in foodstuffs remains a perennial objective in China. The Bank’s CPS for
FY06 to FY10 refers to agricultural growth and management of water and land resources.
2.8 IAIL3’s objectives were directly responsive to these concerns. They furthered the
Bank’s rural and water sector strategy, and addressed the critical challenges of China’s
rural and water sectors. The additional objective brought in through the GEF Grant to
“enhance adaptation to climate change in agricultural practices and irrigation water
management” was a strategically positive addition to the relevance of IAIL3’s original
objectives.3 There was a need for irrigated agriculture to be more resilient to the more
difficult conditions and extreme events such as floods and droughts that were occurring.
The Relevance of IAIL3’s and MCCA’s Objectives was High.
Design
2.9 AIL3 continued the basic approach of its predecessor, the Second Irrigated
Agriculture Intensification Project (IAIL2), which had been largely successful in its goals
of both increasing agricultural production and increasing farm incomes.4 Significant
adjustments were, however, made. In particular, IAIL3 introduced the concept of “real
water-saving.” Secondly, a greater focus was placed on upgrading the quality of
agricultural advisory services through a major intensification of extension staff and
training activities. Third, product quality and value added were promoted as much as the
quantity of production. Fourth, it made more rigorous the expansion of the Water User
Associations (WUAs). These local groups promote more rational and coordinated use of
3 The objective was not in IAIL3 originally as climate change was not receiving priority attention
from Government. However, when Government policy shifted at mid-point of IAIL3’s
implementation, the opportunity was taken to add this objective to the program using a GEF
Grant – the MCCA.
4 IAIL2 received a Loan of $300 million, was approved in June 1998 and closed in June 2005
with Outcome rated by IEG as Satisfactory.

8
water, including through the imposition of water use fees. And fifth, a more
comprehensive agro-ecological program was introduced including actions to improve
groundwater management.
2.10 IAIL3 was implemented over a large area comprising 107 counties in five
“project” provinces engaged in all sponsored activities. In another five “participating”
provinces, the only activity was establishment of new WUAs. The project provinces
represented varied agricultural conditions – water abundant and tropical in the southern
rice-growing provinces of Jiangsu and Anhui, and more water-scarce in the wheat-
growing northern provinces.
2.11 IAIL3’s two main thrusts were modernization of the lower reaches (secondary
and tertiary levels) of irrigation systems coupled with an agricultural research and
extension program (Box 2.1). Environmental protection measures related to irrigated
agriculture were also included. Water saving and enhancing agricultural productivity
were fundamental goals behind most of the irrigation and agricultural actions. Water
savings were to be through three integrated and mutually supportive activities:
engineering by modernizing conveyance systems and installing water control and
measurement devices so as to reduce losses; agronomic through improved seed, better
cultivation practices, and crop diversification; and organizational, through establishment
of WUAs, better water management practices, and by applying water quotas.
2.12 Enhancement of product quality (and hence increased value added) was primarily
pioneered through introducing support to establishment of Farmer Associations or Farmer
Cooperatives, for diversifying crop production and establishing standardized brands and
market linkages. Additionally, “green” (organic and other low pollution cultivation) crops
were to be grown, inspected for quality, and marketed, fetching higher prices.
2.13 The MCCA grant supported climate change mainstreaming by adding studies,
planning, and demonstration activities to the IAIL3 program (Box 2.2).
2.14 For the entire IAIL3/MCCA program, a general feature in design was the
provision in project costing and in the project’s implementation program, for major use of
consultants, and national and international study tours5. This included extensive use of
academics, who proved to be the main source of the project’s technical assistance, and
played a key role in the project’s innovations.
5 Significant spending on training, demonstrations and consultancies were included in each
project component, on top of which was the $54 million (12 percent of project costs) planned for
Institutional Strengthening and Project Management Support, which was mostly for domestic and
international training, consultancies and academics and study tours.
9
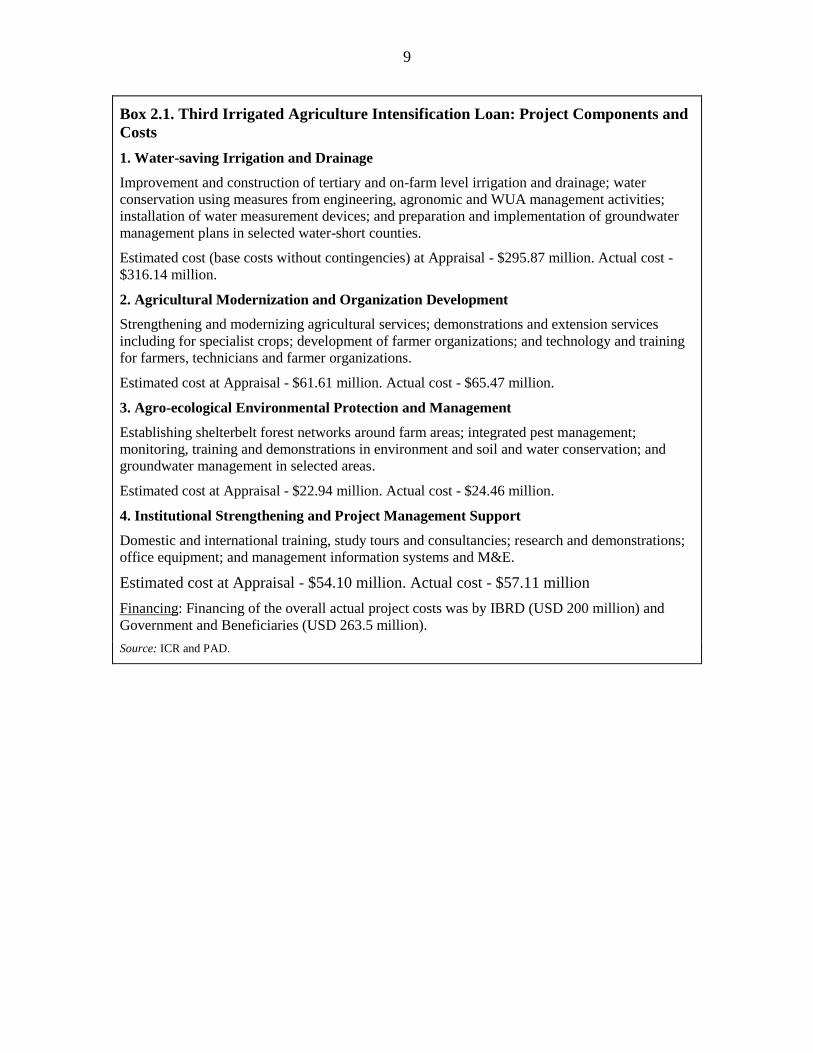
Box 2.1. Third Irrigated Agriculture Intensification Loan: Project Components and
Costs
1. Water-saving Irrigation and Drainage
Improvement and construction of tertiary and on-farm level irrigation and drainage; water
conservation using measures from engineering, agronomic and WUA management activities;
installation of water measurement devices; and preparation and implementation of groundwater
management plans in selected water-short counties.
Estimated cost (base costs without contingencies) at Appraisal - $295.87 million. Actual cost -
$316.14 million.
2. Agricultural Modernization and Organization Development
Strengthening and modernizing agricultural services; demonstrations and extension services
including for specialist crops; development of farmer organizations; and technology and training
for farmers, technicians and farmer organizations.
Estimated cost at Appraisal - $61.61 million. Actual cost - $65.47 million.
3. Agro-ecological Environmental Protection and Management
Establishing shelterbelt forest networks around farm areas; integrated pest management;
monitoring, training and demonstrations in environment and soil and water conservation; and
groundwater management in selected areas.
Estimated cost at Appraisal - $22.94 million. Actual cost - $24.46 million.
4. Institutional Strengthening and Project Management Support
Domestic and international training, study tours and consultancies; research and demonstrations;
office equipment; and management information systems and M&E.
Estimated cost at Appraisal - $54.10 million. Actual cost - $57.11 million
Financing: Financing of the overall actual project costs was by IBRD (USD 200 million) and
Government and Beneficiaries (USD 263.5 million).
Source: ICR and PAD.

10
Box 2.2. Mainstreaming Climate Change Adaptation in Irrigated Agriculture:
Project Components and Costs
1. Identification and Prioritization of Adaptation Options
(i) Assessing the impact of climate change in the 3-H basin and project area; (ii) a study to
identify needed adaptation measures and help integrate them into IAIL3 and the ongoing national
Comprehensive Agriculture Development program; and (iii) prioritizing and selecting adaptation
measures and demonstrations, including consultations with farmers and local officials, to help
incorporate empirical experiences during project implementation.
Estimated cost (base costs without contingencies) at Appraisal - $0.50 million. Actual cost -
$0.49 million.
2. Demonstration and Implementation of Adaptation Measures
(i) Introducing, implementing and demonstrating specific climate change adaptation measures;
and (ii) integrating appropriate adaptation measures into implementation of IAIL3 to help reduce
vulnerability to climate change, focusing primarily on agricultural practices and irrigation water
management.
Estimated cost at Appraisal - $48.43 million. Actual cost - $50.88 million.
3. Mainstreaming Adaptation into National Comprehensive Agriculture Development
Program and Institutional Strengthening
(i) Integrating and mainstreaming climate change adaptation into the Comprehensive Agriculture
Development Program, through capacity building, technical assistance, knowledge sharing and
public awareness activities; and (ii) preparation of a National Climate Change Adaptation Plan
for the Program.
Estimated cost at Appraisal - $6.57 million. Actual cost - $6.25 million.
Financing: Contributions to the overall actual project costs of $57.62 million were: GEF $5.00
million; IBRD (estimated share of IAIL3’s IBRD Loan that was used for climate change
adaptation activities) $20.00 million; and Government $32.62 million.
Source: ICR.
Relevance of Design
2.15 Figure 2.1 shows the implicit logical framework for IAIL3 (excluding the
MCCA). Individual activities often contribute to multiple objectives, and functional
classifications cut across the components.
2.16 Raising the productivity of land and water required synergistic action to upgrade
irrigation systems and improve agricultural practices. Improved irrigation would provide
the base for a higher level production function, and improved agricultural practices would
enable this potential to be realized. Better water management via Water Users
Associations (WUAs) complements efficiency improvements in irrigation and enables
higher yields in water-scarce areas. Higher physical yields, combined with shifts to
higher value varieties or crops, boosts farmers’ income and competitiveness. Thus,
irrigation improvement and improvement of agricultural practices formed the core of the
project, accounting for over 80 percent of project costs. A notable feature of the project’s
design was the degree to which the agricultural extension program was intensified, with a

11
planned reduction in farmers per extension staff from 57 farmers per extension worker at
appraisal to 25. IAIL3 was as much an agricultural program as an irrigation program, in
contrast to many irrigation projects where the first emphasis is infrastructure.
Figure 2.1. Logical Framework of IAIL3
Source: IEG based on IAIL3 PAD. Note: Objectives shown in gray.
2.17 There were also investments in shelter belts and integrated pest management to
improved agro ecology. These typically contributed to productivity as well as ecological
balance – shelter belts can be expected to reduce soil erosion, integrated pest
management reduced the need for pesticides, increased mulching and, to some degree,
increased use of organic fertilizer, reduced farmers’ need for chemical fertilizers.
2.18 The added objective under the GEF Grant to enhance adaptability to climate
change also provided a clear logical path from the objective to the components.
Deliberate adaptations to climate change in the agriculture sector were uncommon and
not well understood. Hence, by undertaking research and demonstrations using the
IAIL3’s field activities as a base for adjustments to enable more resilience to climate
change and extreme weather events, MCCA could pilot innovations. In contrast to free-
standing demonstration projects, the MCCA provided for the mainstreaming into a larger
program of adaptations that were found to be working and practical. This was done
largely from scratch, as, until MCCA, there had been no comprehensive program in
China’s agriculture sector promoting climate adaption measures.
2.19 MCCA’s results chain and components (PAD Annex 3) were highly relevant to
the Grant’s objectives and how they would fit within the IAIL3 objectives and design.
First, and supported by MCCA’s first component, as climate change adaptation was a
largely unknown, and certainly untested, concept, there was need to identify and
Irrigation
infrastructure
improvements
WUAs Agronomy: Land
leveling, deep plowing,
crop residue use
Agricultural
modernization:
Farmers’ Associations,
high quality seeds,
high quality crops,
mechanization,
extension
Agroecology:
IPM, shelter belts,
organic crops
Higher yields
(land
productivity),
kg/ha
Higher water
productivity
Higher value
crops (¥/kg)
Reduced
fertilizer and
pesticide
expenditure
Higher incomes (¥/ha),
greater competitiveness
Improved ecological conditions; lower use
of pesticide, lower erosion, higher tree
cover, water savings

12
prioritize adaptation options through significant research, modeling and development of a
menu of options and field activities. Then, these options needed major and widespread
demonstrations for farmers and officials to gain interest in applying the options on the
farms. Farmer confidence was the key, and this stage included widespread exchanges of
experience as the options were put into practice. Finally, MCCA’s design culminated in a
mainstreaming stage to integrate climate change adaptation more broadly within the
IAIL3 program, and ultimately within the national Comprehensive Agriculture
Development program. To promote this, it was recognized that major outreach would be
needed to farmers, civil society and government officials, including workshops, media,
consultations and policy recommendations.
2.20 For IAIL3, innovation was incremental, building on the predecessor IAIL2.
IAIL3 was China’s main pioneer of the breakthrough water saving irrigation concept. It
promoted a major intensification of agricultural extension, and, in contrast to most other
irrigation projects which were infrastructure oriented, placed as much weight on
agriculture as on the irrigation service. The project also emphasized product quality as
well as product quantity, and brought in commercialized marketing through farmer
associations and cooperatives (until two years before the project, there was no legislation
for cooperatives), and promoted “green” and “organic” crops. The project was also
designed to integrate agro-ecological management with agricultural production.
2.21 In summary, IAIL3’s design responded closely to the project’s objectives, and
MCCA’s addition further enhanced the utility of the operation by introducing a set of
activities that made agricultural intensification more resilient to weather events. There
were innovative features in the combined IAIL3/MCCA program that stood the chance of
significantly enhancing productivity and climatic resilience; and project design was
practical, providing a good base for implementation. The Relevance of Design, both for
the original IAIL3 and the subsequently blended operation including MCCA was High.
Implementation
2.22 IAIL3 was approved on October 11, 2005 and closed on schedule on December
31, 2010. It received an IBRD Loan of $200 million which was fully disbursed. MCCA
was approved for a GEF Grant of $5.00 million on April 17, 2008, some 2 ½ years after
approval of IAIL3, and closed as scheduled on June 30, 2012, 18 months after closure of
IAIL3. MCCA’s implementation period was 4 years and 3 months, and the Grant was
fully disbursed. There were no changes in the objectives of either project. Two minor
adjustments to disbursement allocations were made via restructurings.6 Project costs and
financing were essentially identical to Appraisal intentions.7
6 (i) to IAIL3 on December 18, 2008 as part of a downsizing of some components to
accommodate an appreciation of the Yuan against the dollar; and (ii) on December 7, 2011, when
some of the GEF grant intended for study tours and incremental operating costs was shifted to
study tours and climate change activities.
7 IAIL3’s costs at completion were $463.5 million compared with $463.7 million estimated at
appraisal, and the $5 million GEF Grant was fully utilized. Financing of IAIL3 was: by the Bank
(the $200 million Loan); local governments ($136.8 million planned and $137.4 million actual);

13
2.23 IAIL3 and MCCA were implemented through a Project Management Office
(PMO) in the State Office of Comprehensive Agricultural Development (SOCAD) under
the Ministry of Finance. Project activities were highly decentralized, using the existing
Government structure in the Provinces and Counties, and giving them substantial
independence. At Provincial level there was a POCAD (Provincial Office of
Comprehensive Agricultural Development) which coordinated the activities of the
various Government Departments entrusted with the function concerned – the provincial
Bureaus of water, agriculture, forestry, environment and others. The Ministry of Finance
was also represented through the Provincial Finance Bureau. This pattern was repeated at
county level, with a COCAD coordinating the activities of the relevant county level
bureaus. An additional feature was that each level in the project’s structure - the
POCADs, COCADs, and SOCAD itself - had a committee of experts – the “Project
Leading Groups” – from academia, retired Government staff, and other sources,
providing technical and general advice.
2.24 When MCCA commenced, the same administrative structure was used, largely
through absorbing the climate change project’s activities into the IAIL3 program. Based
on the MCCA’s outcome, this appears to have worked. As pointed out in IEG interviews
with POCAD and COCAD staff, the climate change actions were practical (as were the
IAIL3 actions), enabling relatively smooth integration into the IAIL3 program.
Monitoring and Evaluation
2.25 Design: Using experience gained through IAIL2, three complementary
monitoring systems were established; (i) a Management Information System for
monitoring project progress and other data relevant to the project; (ii) an M&E system for
monitoring delivery of project outputs and achievement of outcomes, reported at both
province and overall project levels (this provided most of the data for the project’s
monitorable indicators, and for the project’s provincial and overall project completion
reports); and (iii) a specific M&E system for management and output monitoring of the
WUA program. The entire system was computerized, internet based, and interconnected.
The MIS system was well set up for routine reports but not for analysis. When MCCA
was brought into the IAIL3 program, its M&E program was set up and integrated into
this structure. Very little information was collected on the five ‘participating’ provinces,
where activities were limited to setup of water user associations.
and beneficiaries ($126.9 million planned and 126.1 million actual). For MCCA, the $5 million
Grant was used as part of IAIL3’s regular program, which was adjusted to incorporate climate
change adaptation activities in its technical and development activities. As a means of indicating
the degree to which the IAIL3 program was adjusted to reflect the GEF program’s promotion of
climate change adaptation, project costs for the GEF program were presented in the ICR at about
$50 million of IAIL3 project costs. However, such an assessment will involve some subjective
judgment and also result in double counting. Hence, for project costing purposes, this PPAR
includes only the $5 million GEF Grant. The broader impacts of the Grant are, however,
discussed elsewhere in this report.

14
2.26 Attempts were made to use “controls” (counterfactual comparisons of changes in
project areas with changes in non-project areas) for the WUA program and, in some
localities, for groundwater drawdown, but controls were not always devoid of project
influence, and were not well matched, making interpretation difficult. The very limited
use of controls is the weakest part of the M&E design (and implementation), and the
efficacy section of this evaluation illustrates the kind of difficulties encountered when
evaluating project impacts without non-project comparisons. Monitoring of WUAs was
in SOCAD’s view excessively time consuming and unnecessary for operational
management; yet the data were not utilized to determine the impact of WUAs on water
user and productivity. Overall, there was a missed opportunity to use the voluminous
monitoring data for rigorous learning about the relative impacts of the project’s many
interventions.
2.27 The MCCA outcome indicators, as set out in its PAD, redundantly included pre-
existing targets for income per capita, water productivity, and ET productivity that had
been set for IAIL3. This was inconsistent with the idea that MCCA should enhance
IAIL3 by bringing new adaptation-related considerations. In fact, the MCAA income
indicator is labeled “increase in per capita income of typical farm households due to
adaptation measures applied” (emphasis added) – in essence, double counting the
original IAIL3 impact. In practice, while the M&E system tracked output and some
outcomes of the added component, it did not attempt to track the marginal impact on
productivity or income. To do so would require extended monitoring since adaptation
benefits would be largest in drought or flood years. However, the M&E framework could
have better documented precisely which adaptation innovations were most widely used.
2.28 Implementation: The M&E program was managed overall by the Central
Project Management office of SOCAD, which reviewed and compiled aggregate data in
periodic reports and provided back-up as needed to the provinces. But hands-on
supervision and quality control of the counties’ M&E programs was primarily handled by
the POCADs. Each POCAD and every COCAD had a small M&E unit, and the M&E
staff also received specialist inputs from the technical agencies (such as the bureaus of
water resources and agriculture). As needed, advice from local universities was obtained.
To increase transparency, broad-based county-level committees were also established,
typically comprising local government, POCAD and COCAD staff, technical bureau
staff, and village committee representatives. A baseline survey was conducted at the
beginning of the project, and comprehensive training provided for staff throughout the
SOCAD/POCAD/COCAD hierarchy. From the briefing provided to IEG, measurement
and data analysis appears to have followed acceptable practices. For measuring yields,
random placement sub-plots were used, with harvesting by a village representative and
COCAD. Quality control may have been a weakness in some counties and might have
been the source of some data discrepancies noted in aggregate figures. But overall, other
than its limited use of controls, the M&E/MIS system developed to be both a useful
management tool and a means of tracking progress against most of the project’s
monitorable indicators.
2.29 Utilization: The M&E/MIS system was used extensively, at central, province
and county levels. The system’s multi-dimensional character provided both for
management use (mainly the MIS system), and for tracking progress towards project

15
outputs and outcomes (the main M&E system). M&E for the WUA program was
particularly comprehensive, with mixed utility. There was little information on the
participating provinces and a missed opportunity to assess program impact.
2.30 Balancing the strengths and weaknesses of the entire M&E/MIS system, the
Overall Quality of M&E was Substantial.
Safeguards
2.31 IAIL3 was an Environmental Category B project and triggered the following
safeguards: Involuntary Resettlement (OP 4.12); Indigenous Peoples (OP 4.10); Dam
Safety (OP 4.37); and Pest Management (OP 4.09). (MCCA fell within the existing scope
and safeguards of IAIL3.) An Environmental Management Plan was prepared for each
province, and implementation of the Plan was monitored by an independent province-
level Environmental Management Team. Most actual monitoring was carried out by
institutions specialized in the respective technical field.8 There were also environmental
requirements for larger sub-projects - each feasibility study had an environmental section,
and the Provincial Environmental Bureau had to approve the study.9 A Resettlement
Policy Framework was prepared as a guide in case resettlement was needed. Due to the
small-scale nature of modernization works, generally following the existing canal
alignments, one would not expect relocation impacts. SOCAD reports that there were no
“disputes” about land.
Fiduciary
2.32 The Project Management Offices of SOCAD and the POCADs checked for
fiduciary compliance during their supervision activities, and through the MIS system.
Annual financial reports were prepared by the POCADs and SOCAD. Audits, by
independent auditors, were on time and without substantive qualifications. Regular Bank
missions also reviewed the project’s financial management and fiduciary compliance.
The project’s last Implementation Status Report (December 15, 2011) rated financial
management and procurement as satisfactory.
Achievement of Outputs
2.33 For evaluative purposes, this chapter begins with an assessment of
IAIL3/MCCA’s achievement of planned outputs. Subsequently, the degree to which the
project achieved its Objectives (Efficacy) will be reviewed based on IAIL3/MCCA’s sub-
objectives. In summary form, these were: (i) increasing water and agricultural
productivity; (ii) raising farmers’ incomes; (iii) promoting sustainable and participatory
rural water resources and agro-ecological environmental management; and (iv) (the
8 Specializations in, for instance: groundwater management, and measurement of groundwater
levels and quality, soil fertility, surface water quality and quantities, pest monitoring, resettlement
and indigenous peoples; and dam safety.
9 For the Dam Safety safeguard, annual inspections were done and a Dam Safety Report
submitted to the Bank annually. Integrated Pest Management was a large part of IAIL3’s
agronomic improvement program, covering most of the project area.

16
added objective for MCCA) enhancing adaptation to climate change in agriculture and
irrigation water management.
2.34 The projects’ outputs (implementation achievements) largely met or exceeded
appraisal targets, and also any revised targets if changes were made at Mid-Term-Review
(Tables 2.1 to 2.6). All revised targets were, like the appraisal targets, exceeded, except
for two exceptions. The number of agricultural extension service stations was 64 percent
of the appraisal target (111 percent of the revised target). Agricultural demonstrations
were increased (116 percent of the appraisal target). The other shortfall was the number
of study tours. In response to the financial crisis, Government restricted study tours as
part of general policy austerity measures. The number of international study tours fell to
45 percent of the target at appraisal (from 235 tours planned at appraisal to an actual
number of 105 tours); and the number of domestic study tours fell to 81 percent of
appraisal intentions – from 4445 to 3626 persons. There was a small amount of
international training (longer duration studies) which increased by 500 percent - from 8 to
40 courses. Thus, apart from the two exceptions above, all project targets were met,
whether original or revised (and revised targets always exceeded appraisal targets). The
targets at appraisal will be used in the evaluation of outputs as they represent the goals set
at appraisal rather than updates based on project progress, of any revisions made in
project targets during implementation.
Irrigation expansion, Improvements, and Management
2.35 Irrigation improvements were the modernization of the lower (mostly tertiary)
reaches of the existing irrigation schemes. This primarily comprised the re-sectioning and
lining of the existing channels and water courses, and modernization of small diversion
and other small structures within the irrigation schemes. These improvements reduced
conveyance losses caused by seepage from dilapidated channels and enabled better
control of water. The modernization program (Table 2.1)10 resulted in “water saving
irrigated land” (modernized irrigation systems) increasing from 16,000 hectares in 2004
(the year before project approval or “base year”), to 393,000 ha by 2009, the year before
project closure (data to 2010, the last year of IAIL3, is not available).11 This was a large
increase on the small area of water saving irrigation before the project, and about three
percent above the modernized area targeted at appraisal. A major campaign to promote
WUAs resulted in the establishment of 1022 WUAs (compared with an appraisal target
of 993 WUAs), covering an area of 225,000 ha – three percent more than the 204,000 ha
targeted at appraisal.
10 Specific data items can vary by source. Where this occurs, and throughout the evaluation, the
data from the ICR Monitorable Indicators is used to better enable the consistency of comparisons
between actual achievements and targets.
11 Most monitoring stopped in 2009 meaning that some output data will understate actual
achievements.
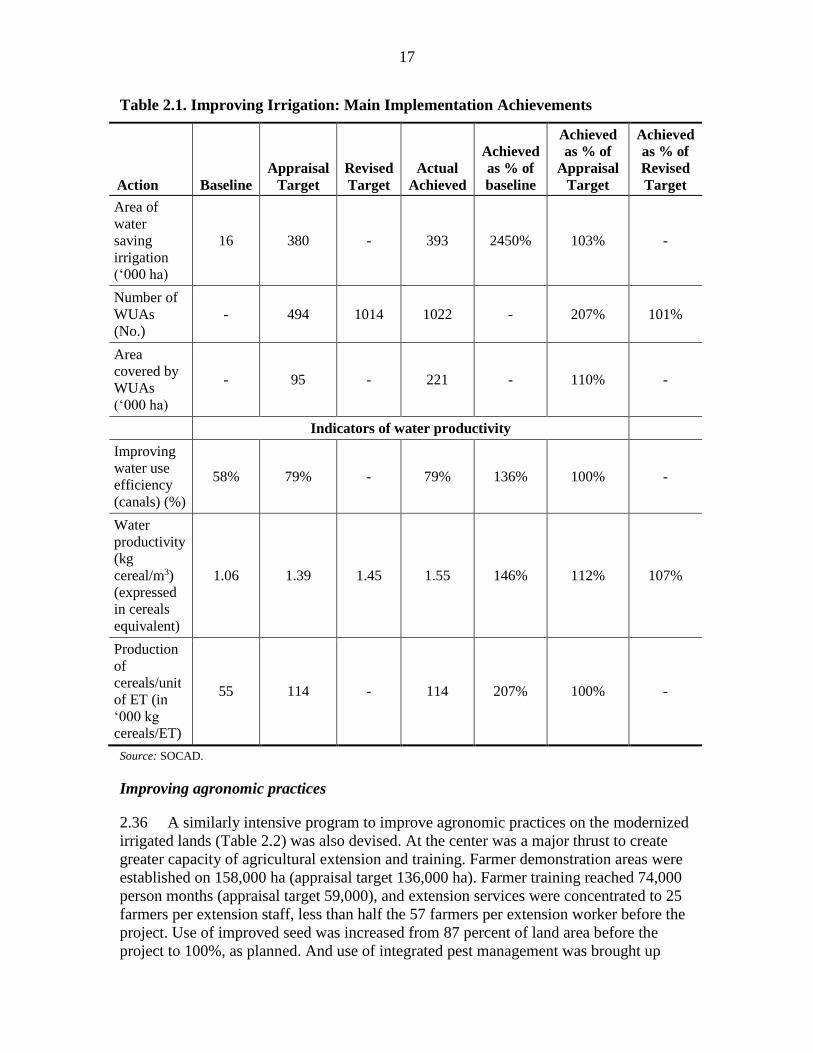
17
Table 2.1. Improving Irrigation: Main Implementation Achievements
Action Baseline
Appraisal
Target
Revised
Target
Actual
Achieved
Achieved
as % of
baseline
Achieved
as % of
Appraisal
Target
Achieved
as % of
Revised
Target
Area of
water
saving
irrigation
(‘000 ha)
16 380 - 393 2450% 103% -
Number of
WUAs
(No.)
- 494 1014 1022 - 207% 101%
Area
covered by
WUAs
(‘000 ha)
- 95 - 221 - 110% -
Indicators of water productivity
Improving
water use
efficiency
(canals) (%)
58% 79% - 79% 136% 100% -
Water
productivity
(kg
cereal/m3)
(expressed
in cereals
equivalent)
1.06 1.39 1.45 1.55 146% 112% 107%
Production
of
cereals/unit
of ET (in
‘000 kg
cereals/ET)
55 114 - 114 207% 100% -
Source: SOCAD.
Improving agronomic practices
2.36 A similarly intensive program to improve agronomic practices on the modernized
irrigated lands (Table 2.2) was also devised. At the center was a major thrust to create
greater capacity of agricultural extension and training. Farmer demonstration areas were
established on 158,000 ha (appraisal target 136,000 ha). Farmer training reached 74,000
person months (appraisal target 59,000), and extension services were concentrated to 25
farmers per extension staff, less than half the 57 farmers per extension worker before the
project. Use of improved seed was increased from 87 percent of land area before the
project to 100%, as planned. And use of integrated pest management was brought up

18
from 70 percent baseline to 96 percent (the appraisal target was 93%). The use of
machinery also increased during the project period: mechanized plowing from 80% of
farmed area to 93%, sowing from 56% to 74%, and harvesting from 58% to 77%.
Table 2.2. Improving Agricultural Practices: Achievements
Action Base-
line
Appra-
isal
Target
Revised
Target
Actual
Achieved
Achieved
as % of
baseline
Achieved
as % of
Appraisal
Target
Achieved
as % of
Revised
Target
Main Agricultural Actions
Demonstrations and extension
Seed coverage
(percentage of
project area sown
with high quality
seed)
87% 100% - 100% 114% 100% -
IPM coverage
(percentage of
project area where
integrated pest
management is
employed)
70% 93% - 96% 137% 103% -
Balanced fertilizer
use (‘000 Ha) n.a. 105 106 n.a. 101% -
Land leveling (‘000
Ha) n.a. (pilot) - 155 n.a. 109% -
Degree of mechanization (percent of land that uses mechanized equipment for:
Ploughing 80% 89% - 93% 116% 104% -
Sowing 56% 68% - 74% 132% 132% -
Harvesting 58% 71% 76% 78% 133% 133% 103%
Other agronomic
improvements
(as per extension advice, pamphlets and training -
unquantified)
Agricultural extension and training
Agricultural
extension/service
stations (No.)
- 516 296 329 n.a. 64% 111%
Ratio of
technicians/extension
staff to farmers
57 20 - 20 228% 228% -
Agricultural
demonstrations area
(‘000 ha)
- 136 - 158 n.a. 116% -
Extension training (person months)
Training of
technicians - 12469 - 14290 n.a. 115% -

19
Training of farmer
technicians - 22599 - 22825 n.a. 101% -
Training of farmers - 59239 66036 74455 n.a. 116% 113%
Of which women - 14995 - 24621 n.a. 164% -
Institutional capacity building and training
International training
(person months) - 8 27 40 n.a. 500% 148%
International study
tours (person
months)
- 235 - 105 n.a. 45% -
Domestic training
(person months) - 17035 13586 13638 n.a. 80% 100%
Domestic study tours
(person months) - 4445 4053 3626 n.a. 81% 89%
Source: SOCAD and ICR.
Promoting sustainable water and agro-ecological management
2.37 A concerted effort was mounted to establish a sustainable water and agro
ecological management program, the main elements of which are at Table 2.3. Several
activities were at large scale. The area under water-conserving irrigation (through
improved management by WUAs, and by applying water use quotas) reached 392,000 ha,
near the target set at appraisal of 380,000 ha. Land grading (which increases retention of
surface water, increases groundwater recharge and reduces soil erosion) was originally a
small piloting activity but was ramped up to a major program, eventually covering
155,000 hectares. Shelterbelt forestry covered 31,000 hectares, 11 percent above the
appraisal target. Integrated Pest Management expanded to near universal coverage – from
70 percent of total project area at the beginning of the project to 96 percent coverage at
completion. A pilot program to prepare groundwater management plans in 19 counties
was carried out as intended. About 18,000 hectares of green crops exceeded the appraisal
target of 17,000 ha and while still relatively small (5 percent of the project’s water saving
irrigated area), is growing rapidly (refer below).

20
Table 2.3. Main Agro Ecological and Water Resources Management Actions
Action Baseline Appraisal
Target
Revised
Target
Actual
Achieved
Achieved
as % of
baseline
Achieved
as % of
Appraisal
Target
Achieved
as % of
Revised
Target
Water saving
irrigated area
(‘000 ha) 16 380 - 392 n.a. 103% -
Land Leveling
(‘000 ha) - (pilot) - 155 n.a. n.a. -
Integrated pest
management
(coverage of
cropped area in
percent)
70% 93% - 96% 137% 103% -
Use of Deep
plowing (‘000
Ha) - 177 - 184 n.a. 104% -
Use of Crop
residues (000’
Ha) - 121 - 125 n.a. 103% -
Other Agro-
ecological
agronomic
actions
as based on extension advice, training and pamphlets
Counties
prepare
groundwater
management
plans (No.)
- 19 - 19 n.a. 100% -
Tree shelter
belts (‘000 ha) 9 28 - 31 344% 111% -
Area of green,
non-polluting
and organic
crops (‘000 ha)
- 17 - 18 - 106% -
Sources: ICR and SOCAD.
Piloting Farmers’ Associations and “Green” Crops
2.38 Two partly interlinked project initiatives piloted higher value agricultural
production: first, IAIL3’s introduction of farmer agricultural and marketing
organizations; and second, the project’s lead role in piloting “green crops.” Most farmer
organizations were “Associations” with statutes that enabled business autonomy, and
with by-laws to protect members’ rights and participation. A few “Cooperatives” were
also established which undertook the same activities as the Associations under more
formal regulations. By project end, 207 Farmer Associations and 20 Cooperatives, both
exceeding appraisal targets (Table 2.4) had been established. Virtually all of these
organizations were involved in production of a high-demand product or a number of
products, and/or in standardization and marketing, with their own brands and logos.

21
Produce went primarily to markets in small to large cities and, in one case visited by IEG,
to international markets. While this was a relatively small program – the area was greater
than targeted but was still less than two percent of improved irrigated area – the success
of the program is likely to have provided the experience and demonstrations to back-stop
future expansion.
2.39 These organizations also contributed to Government’s “Green” campaign. This
initiative promoted ecological improvements in agricultural production using three grades
which had to be earned through an inspection and rating process (Table 2.5). “Pollutant
Free” production requires no use of pesticides. “Green” food has more rigorous standards
in production and the production environment. And “Organic” food has more stringent
definition of what is allowed or prohibited, including no fertilizer, hormones or other
synthetic substances. These green products typically command a price premium. With the
exception of the area of certified/green label agro-products, for which the appraisal target
was 16,800 ha and achievement was 18,000 ha, there were no appraisal or revised targets
for green and organic cropping.
Table 2.4. Development of Farmer Associations and Higher Value Crops
Indicator Baseline
(2004)
Appraisal
target
Revised
Target
Actual
Achievement
Achievement
as percent
baseline
Achieve-
ment as
percent
Appraisal
Target
Achieve-
ment as
%
Revised
target
Farmer
Associa-
tions (No.) - 166 193 207 - 125% 107%
Farmers
Coopera-
tives (No.) - 12 19 20 - 167% 105%
Area of
high
quality
products
(‘000 ha)
0.7 499 - 563 807% 113% -
Number of
registered
brands
(No.)
- 86 - 93 n.a. 108% -
Value of
output
(million
Yuan)
66 918 - 773 1171% 84% -
Per capita
income of
Green
Crop
producers
(yuan per
annum)
- 1853 - 4418 - 238% -
Source: SOCAD and ICR.

22
Table 2.5. Development of Agro ecological Cropping
“Non-polluting” agro-products
Number of certified agro-products (No.) 250
Area of certified Agro-products (‘000 Ha) 59
“Green” Agro-products
Certifications & green labeling provided (No.) 210
Area covered by certified/green label Agro-products (‘000 Ha) 18
“Organic” Agro-products
Number of certified Agro-products (No.) 18
Area covered by Certified Agro-product (Ha) 3
Source: SOCAD.
Note: with the exception of the area of certified/green label agro-products, for which the appraisal target was 16,800 ha and achievement was 18,000 ha, there were no appraisal or revised targets for agro-cropping.
Introducing an Agricultural Climate Change Adaptation Program
2.40 The final main project activity was the GEF funded MCCA. A broad array of
activities (Table 2.6) was implemented, including research and simulations for climate
change; development of a menu of climate change adaptation actions for field
implementation; preparation of extension material; training and demonstrations;
implementation of climate change actions by farmers with guidance from the extension
service, and mainstreaming a climate change adaptation agenda into the overall IAIL3
program.
Table 2.6. Main Climate Change Adaptation Actions
Action
Appraisal
Target
Actual
Achieved
Achieved as %
of Appraisal
Target
Build climate change scenarios and models undertake done 100%
Develop menu of climate change adaptation
measures undertake done 100%
Number of different documents related to climate
change adaptation issued by SOCAD, POCADs
and COCADs
326 331 102%
Climate Change Adaptation demonstrations (ha) 32000 35000 112%
Number of IAIL3 sites where CCA measures have
been included 154347 172868 112%
WUAs and Farmer Associations incorporating
CCA 183 183 100%
Greenhouse area for adaptation to warming (in ha) - 124 n.a.
Percentage of farmers & technical staff who are
aware of climate change adaptation actions 47% 56% 119%
Source: SOCAD.
NB: No revisions to the targets were made.
23
Achievement of the Objectives
OBJECTIVE 1: INCREASE AGRICULTURAL AND WATER PRODUCTIVITY
Agricultural productivity and income per hectare
2.41 The project sought to increase farmers’ incomes via a sustainable increase in
agricultural productivity. The increase would be accomplished through a combination of
higher physical yields, higher cropping intensity, and shifts to higher-value varieties and
crops, leading to higher incomes per hectare12.
2.42 Over the project period the nominal value of output per hectare increased 81%.
Annual price inflation was 13% or higher during 2003-4 and 2006-8. So, adjusting for
price inflation, real productivity rose by 19% (Figure 2.2). However, the national price
deflator may understate the gains, which were driven by two main factors:
Increase in physical yields of 22% to 35% among major crops (see below),
A large shift from low quality to good quality varieties, which fetch premium
prices. The proportion of area devoted to good-quality wheat increased from 31%
to 76%; for corn, from 43% to 75%; for rice, from 9% to 67%; and for melons
and vegetables, from 35% to 65%.
2.43 Smaller factors included:
A 9% increase in cropping intensity (see below)
A slight increase in the proportion of area planted to cash crops (up from 26% to
28%).
12 The total area under cultivation grew by less than 2% from base year to 2009, but there was a
large dip in 2005 with recovery thereafter.

24
Figure 2.2. Nominal and Real Land Value of Production/ha by Year
Source: IEG based on IAIL3 project data and China Statistical Yearbook. Denominator is actual farmed land area, and
so does not double count in case of multiple cropping. The price deflator is the national agricultural producer price index.
2.44 Yields. For the three major cereals there has been a distinct increase in yields per
hectare over the project period, ranging from a 22 percent increase for rice, a 30 percent
increase for maize, and a 35 percent increase for wheat (Table 2.7). For the cash crops
listed in the table, yields also increased - typically by between 20 to 30 percent. The yield
increases were about the level targeted at Appraisal. Yields increased in all provinces
(Figure 2.2). Yield increases in the project significantly outpaced province-wide and
national increases.(Table 2.8 and Figure 2.4)13
2.45 Cropping intensity also increased, going from 167% to 187% (above the appraisal
and revised targets, Table 2.6), reflecting a more prolonged and reliable growing season
under irrigation. IAIL3’s program to upgrade the irrigation systems enabled a surer base
13 Over 2004-9, based on the China Statistical Yearbook, cereal yield averages by province
increased 3% in Jiangsu, 8% in Anhui and Shandong, 11% in Hebei, and 17% in Henan.

25
for a second crop during, in particular, the drier months. The increased cropping
intensity would approximately add a further 10 percent to crop yields per hectare
including multiple cropping, thus giving an effective yield increase of 24 to 39 percent
for the cereals.
2.46 Crop Diversification and Higher Value Farm Produce. The project’s program to
establish Farmer Associations and cooperatives (the number of Farmer’s Associations
and Cooperatives that were established exceeded both appraisal and revised targets, Table
2.4) resulted in the associations/cooperatives choosing to grow higher value crops and
develop market channels to more lucrative markets. This was only a pilot program so its
impact on the overall value of agricultural production was relatively small, but prospects
for the future appear buoyant. Green crop area reached 18,000 ha (Table 2.3), slightly
exceeding (by 6 percent) the appraisal target (the target was not revised). Green crop
development was from zero at the beginning of the project. The much larger change,
however, was the above-mentioned within-crop shift to higher quality varieties, fetching
premium prices.
Table 2.7. Yields of Major Crops
Source: SOCAD.
NB: No revisions were made to the appraisal targets.
Crop
Baseline
Yield
(Kg/ha)
(2004)
Appraisal
Target
(Kg/ha)
Actual Yield
Achieved
(2009)
(Kg/ha)
Achieved as
% of baseline
(%)
Achieved as
% of
Appraisal
Target (%)
Cropping
Intensity
(multiple
cropping index)
167 183 187 112% 102%
Major cereals
Wheat 4362 5540 5900 135% 106%
Maize 5511 6946 7137 130% 103%
Rice 6782 7977 8260 122% 104%
Selected Major cash crops
Soybean 2081 2531 2565 123% 101%
Potato 5958 7535 7399 124% 98%
Rapeseed 1953 2486 2548 130% 102%
Peanuts 3133 3845 4134 124% 132%
Cotton 965 1183 1194 123% 101%
Melon and
vegetables 34770 40643 40551 117% 100%

26
Figure 2.3. Rice Yield, Wheat Yield, and Water Productivity by Province
Source: IAIL3 project data (2004 to 2009).
Table 2.8. Comparison of Changes in Cereal Yields (kg/hectare) under the Project
with Overall Province Level Yield Changes
PROVINCE
PROVINCE
(GRAIN)
(Overall grain yield
changes by province.
In % increase, 2004
to 2009)
PROJECT
RICE
(Changes in yields of
rice under the project.
In % increase from
2004 to 2009)
PROJECT
WHEAT
(Changes in yields of rice
and wheat under the
project. In % increase
from 2004 to 2009)
Hebei 12% - 21%
Jiangsu 3% 23% 44%
Anhui 8% 20% 39%
Shandong 8% - 33%
Henan 17% 20% 35%
Note: Province data includes project areas.
Source: SOCAD and China Statistical Yearbook.
Yield growth compared to a counterfactual
2.47 Table 2.8 shows that cereal yields grew much more rapidly in the project areas
than the overall rate in the corresponding province.14 Average grain yields for the five
14 It should be noted, however, that this is not a fully “controlled” comparison; project areas were
selected because they were low-yielding and thus had more scope for improvement than other
lands. But the differences between project and provincial growth rates is large and is consistent
with a causal impact on productivity. Provincial data includes data from IAIL3 areas, so that the
difference between project and provincial averages understates the difference between project and
non-project areas.
66
32
69
38
69
72
81548322 8392
47
92
48
91
38
16
37
54
44
80
58
19
64
96
54
90
52
06
60
70
1.16
0.98 1.030.95
1.14
0.460.73
0.53
0.32
0.47
0
0.5
1
1.5
2
3000
4000
5000
6000
7000
8000
9000
Hebei Shandong Jiangsu Anhui Henan
Wat
er p
rod
uct
ivit
y (
m3
)
Ric
e/W
hea
t Y
ield
(K
g/h
a)
Rice 2004 Rice 2009
Wheat 2004 Wheat 2009
Water 2004 Water 2009

27
provinces (un-weighted averages) grew by 9 percent between 2004 and 2009 spanning
most of the IAIL3 project period.15 By contrast, rice yields in the project area increased
by an average of 22 percent, and project wheat yields increased by 35 percent. These
comparisons indicate that IAIL3 has substantially outpaced provincial and national yield
growth. There are also the other impacts of IAIL3, such as within-crop shifts to higher
value products, and, although it is still at small scale, the market commercialization
program.
Figure 2.4. Comparing Changes in Project Cereal Yields with Changes in Province
Yields (2004 to 2009)
Source: SOCAD and China Statistical Yearbook.
2.48 In the absence of IAIL3, some of its interventions might have diffused, but more
slowly. Some of these would have been dependent on support by other projects. For
instance, SOCAD considers that, absent IAIL3, farmers would not have received
rehabilitated/modernized irrigation, training, extension advice and access to improved
seed. But thanks to other initiatives, there was an increase in nationwide irrigated area.16
WUAs have also been increasing. Other innovations might have developed
spontaneously. Mechanization has been increasing rapidly as rural wages have begun to
rise. Relatively low-cost innovations, such as straw mulching, might diffuse as farmers
emulate neighbors.
2.49 Nevertheless, IAIL3 greatly outpaced provincial gains in yield and crop value
(Figure 2.4), which is unlikely to have been achieved without the specific investments in
infrastructure, agronomy and management that the project provided.
15 IAIL3 was approved in October 2005 and closed in December 2010, but data for 2010 was not
collected by SOCAD.
16 China National Statistical Yearbook.
11%8%
3%8%
17%
na na
23%20% 20%
21%
33%
44%
39%
35%
0%
5%
10%
15%
20%
25%
30%
35%
40%
45%
50%
Hebei Shandong Jiangsu Anhui Henan
Province Grain Project Rice Project Wheat

28
Water Productivity and Water Saving
2.50 The productivity of water increased considerably. As noted, this reflected a
combination of ‘hardware’ – such as improved irrigation infrastructure and land-
leveling, and ‘software’ – improved management practices, including quotas and fees for
water use and better timing of irrigation, in part due to the proliferation of WUAs. These
had the following effects.
Water conveyance efficiency increased by over one-third - from a baseline
average at time of appraisal of 58 percent, to 79 percent by project completion.
This was primarily due to re-sectioning and lining of water channels or
replacement with low- pressure pipes. The increase to 79 percent is the same as
the appraisal target (there was no revised target).
Water productivity increased by 46 percent - from its baseline average at appraisal
of 1.06 kg equivalent of cereals per cubic meter of irrigation water, to 1.55 kg
cereals/m3 of water by project completion. The achievement in water productivity
of 1.55 kg cereals/m3 exceeds both the original target of 1.39 kg/m3 and the
revised target of 1.45 kg cereals/m3 of water. (See Table 2.1)
Estimated in terms of evapotranspiration, cereal production per unit of ET
reportedly doubled (Table 2.1) - from a project average of 55,000 kg cereal/unit
of ET (baseline), to 114,000 kg/unit of ET by project completion, the same as the
targeted increase at appraisal (the target was not revised).17
2.51 The increase in water productivity (kg cereals/m3 of water) of 55 percent
accompanied the average increase in agricultural productivity of between 22 to 35
percent.
2.52 Did the project achieve ‘real water saving’? The project acted both to reduce and
to increase water consumption. Some of its innovations truly reduced evaporation (water
loss): straw mulching, deep plowing, and drip irrigation. Canal lining, on the other hand,
increases irrigation efficiency but does not really save water to the extent that it reduces
groundwater recharge. And the increase in cropping intensity and in productivity
increases water demands. In Hebei, for instance, planting of winter wheat is discouraged
because it is water-intensive and only marginally profitable. Shifts in crop mix can have
major impacts. For instance, cotton has an evapotranspiration rate 200 mm more than
maize. So the question is whether increased efficiency of water use was counterbalanced
by increased demands for water.
2.53 Evidence on overall impacts is inconsistent. A rough calculation18 suggests that a
63% increase in crop tonnage at the project level was accompanied by a 9% increase in
17 However, measurement is difficult, and values are quite variable by location. For instance,
measurements in Hebei of actual evapotranspiration in wheat, maize, and cotton fields found
reductions of just 2% to 3% against control plots with the same crop.
18 Based on kg of production in cereal equivalents/m3 water used, at the aggregate project level.
Water use is not exactly equivalent to ET, and may include, for instance, canal leakage that
recharged groundwater.
29
overall water consumption. In other words, increased efficiency allowed water
consumption to increase only slightly while crop production increased substantially. On
the other hand, there were reported improvements in groundwater depth in Shandong and
Hebei (see below). In Hebei, field monitoring showed a reduction of 8, 12, and 21 mm of
ET in wheat, maize, and cotton respectively. The bottom line is that the project resulted
in a substantial increase in water productivity, without greatly increasing water
consumption and possibly while reducing it. A province-wide ET monitoring system of
the kind pioneered by the HBP, if perfected and deployed on a large scale, would allow
more accurate determination of impacts on real water savings.
2.54 Summarizing, as concerns IAIL3 agricultural productivity, crop yields
(kg/hectare) increased by between 25 to 35 percent over the project period and cropping
intensity increased from 167 to 187 percent, resulting between them in a 24 to 39 percent
increase in productivity. Both yield and cropping intensity increases exceeded appraisal
targets (targets were not revised). A relevant counterfactual is the difference between
cereal yield increases on project areas of the five participating Provinces, and the average
yields of each Province as a whole (Table 2.8). Increases in grain yields in the provinces
from 2004 to 2009 ranged from 3 to 17 percent, whereas increases in the project areas
ranged from 20 to 23 percent for rice and from 33 to 44 percent for wheat, thus
substantially outpacing other areas in the project provinces. A shift to high value crop
varieties added to economic impact. Water productivity also improved substantially –
irrigation conveyance efficiency increased from 58 to 79 percent, and water productivity
(in kg of cereal equivalent/m3 of water) increased by 55 percent. The project also
primarily benefitted disadvantaged farmers. As an irrigated agriculture project, with
primary focus on rehabilitating and modernizing irrigated areas, the targeted areas were
all considered to be “low and medium yield farm land areas” – the systems were too
dilapidated for higher yielding farming. An unknown is the degree to which “real water
saving” was achieved (see discussion under Objective 3. Nevertheless, in terms of the
project objective to “increase water and agricultural productivity in low and medium
yield farmland areas” achievements were considerable and above targets, and IAIL3’s
Efficacy was High.
OBJECTIVE 2: RAISE FARMERS’ INCOMES AND COMPETITIVENESS
Farm Incomes and Reaching low income areas and excluded groups
2.55 A little more than a third of the 107 IAIL3 project counties were officially
classified as poor: 11 as National Poverty Alleviation and Development Focus counties,
and another 27 as Provincial Economic Underdevelopment Counties. About one-third of
the person-months of farmer training went to women, who play an important farming
role.
2.56 In current terms, average per capita incomes increased from Yuan 1,100 baseline
to Yuan 3,290 at project completion. This increase was 119 percent more than the
appraisal target of Yuan 1,505, and 50 percent more than the revised target of Yuan
2,207.

30
2.57 What matters, though, is real income. Real incomes grew for project households,
both on average and for those initially identified as low income. These gains are
consistent with the improvements in land productivity, shifts to higher-value varieties of
crops, increased value-added from Farmers’ Associations and Cooperatives, and off-farm
employment of labor freed up by mechanization. Figure 2.4 shows income gains in real
terms in net total per capita income (including non-farm income) by Province. Incomes
increased in all provinces, with very large gains for poor households in the three
provinces with the lowest initial incomes (Jiangsu, Henan, Anhui). In these provinces,
poor households gained by 61 to 90 percent, and average households did nearly as well.
But, for unidentified reasons, gains were modest in Hebei.
2.58 This was a period of dynamic change in China, with rapid changes in the off-farm
economy and growth in wages. To rule out the hypothesis that income gains in the
project area were driven largely by national growth, it would be desirable to compare
trends in project areas with those in a matched set of control areas. However, no such
areas were identified at project outset. As an imperfect alternative approach to
constructing a counterfactual, Figure 2.6 shows the ratio, by province, of mean incomes
in project areas to mean rural incomes in the counties containing project areas.19 This
comparison was incorporated in the IAIL3 monitoring framework. Figure 2.6 shows that
by this measure, low income project households in Anhui, Jiangsu, and Shandong closed
the gap with peers, while households in Hebei and Henan fell behind. In making these
comparisons it is important to keep in mind that the project areas (except in Shandong)
were poorer than the project counties. (Figure 2.4, top panel). It is plausible that the
project areas faced more severe constraints to growth – such as lower educational levels
or greater distance from employment centers – and therefore would be expected to fall
even further behind comparators in the absence of the project. This consideration makes
the relative gains in Jiangsu and Anhui more remarkable.
2.59 To sum up, real income gains were substantial and were consistent with a causal
impact of the project via improved land and labor productivity and shifts to higher value
crops. Incomes of project households gained against local non project households in
three of five provinces, with greater relative gains for poorer households. In two
provinces, absolute incomes rose but relative incomes declined. This evidence suggests a
causal contribution of the project to incomes.
19 Project areas covered only part of a county. Coverage data were not available, but staff
indicated that a typical project area would cover about a third of its county. Thus the difference
between average income in the project area and in the county as a whole understates the
difference between average income in project vs. non project areas of the county. The method of
aggregation from county to province was not documented.

31
Figure 2.5. Real Income Trends of Project Households by Year and Province
Note: top panel shows average net per capita income in project area. Bottom panel shows corresponding statistic for
households initially classified as ‘low income’ households. Scales are logarithmic.
Source: IEG based on income data from SOCAD; deflated by nationwide rural consumer price index from China Statistical Yearbook.

32
Figure 2.6. Trends in Project Area per Capita Income Relative to Province Average
Incomes
Source: SOCAD.
Note: Top panel shows ratio of average per capita income in project areas to average per capita rural income in project
counties. Bottom panel shows ratio of average per capita income of initially-classified low income families in project areas to average per capita income in project counties.
Strengthening Farmers’ Competitive Capacity
2.60 The income-enhancing objective also aimed to “strengthen (farmers’) competitive
capacity under post-WTO conditions.” In cereal production, the increase in yields and
farm incomes under the project can be expected to be reflected in generally more
competitive agricultural production. As concerns diversification to higher value
production (“green crops,” horticulture and other diversification crops) the main project
intervention has been the program to support growth of Farmers Associations and
Cooperatives. This program is small relative to the rest of the project, and is in effect a
pilot rather than a mainstream program. However, in this role the program was valuable.
In launching the farmer associations and participating in the drive to diversify to green
crops, IAIL3 encouraged the growth of production of higher quality – higher value crops,
and the progressive professionalization of marketing. For green crops, total value of

33
output grew from 66 million Yuan ($11 million) at the beginning of the project to 773
million Yuan ($127 million) by closure. As noted earlier, there has been rapid expansion
in the share of “high quality” cereals, fruits and vegetables. Based on IEG interviews and
field visits, potential for medium and high-end marketing of green and higher value crops
is substantial. Farmer associations were found expanding their businesses, had developed
effective produce grading, standardization, market brands and packaging, and had
developed market niches in various urban centers (and in one association visited,
internationally).
Summary
2.61 The project boosted annual yield per hectare by 24 to 39 percent. Yield increases
were faster in project areas than in the corresponding provinces as a whole. The project
also succeeded in piloting viable means of diversifying to more remunerative crops and
marketing processes, so as to further enhance incomes and the agriculture sector’s
competitiveness. These gains plausibly drove the observed gains in income, and would
have contributed to increased competitiveness. Thus, the efficacy of the objective to
increase farm incomes and competitiveness is rated as High.
OBJECTIVE 3: PROMOTE SUSTAINABLE AND PARTICIPATORY WATER RESOURCES AND
AGRO-ECOLOGICAL MANAGEMENT
2.62 The two main productivity-enhancing activities of the project – modernizing
irrigation and improving agricultural practices – can be expected in themselves to have
had agro-ecological benefits. Improved irrigation efficiency could be used to reduce the
drawdown of groundwater. And improved agricultural practices (such as integrated pest
management, more straw mulching and other actions) could enable ecological as well as
agricultural production benefits.
2.63 An array of other measures were also undertaken which can be expected to have
improved the management of water resources and the agro-ecological environment
(Table 2.3). All of the activities exceeded appraisal targets (targets were not revised). A
number of the activities were at large scale. The land levelling program (initially intended
to be a small pilot program) covered 155,000 ha or 39 percent of the water saving
irrigated area; use of deep plowing and crop residues covered areas of 47 and 32 percent
respectively of irrigated area; and the percentage of project lands under integrated pest
management increased from 70 percent to 96 percent. Most of the actions (including
integrated pest management, green cropping, land leveling, and the bulk of agronomic
improvements) also benefited agricultural productivity. The project also supported
planting of 31,000 ha of shelterbelts. These were intended to increase tree cover and
protect crops and top soil while improving microclimates. Based on international
experience, such impacts are likely. SOCAD also considers that they may promote water
retention, although trees can be large consumers of ET so their net impact on
groundwater is indeterminate. An achievement that, based on the experience under the
HBP, may be an important source of better soil and water management was the
preparation by each project county of a Groundwater Management Plan. With several
exceptions discussed below, most of these actions do not have empirically based
measures of agro-ecological impacts, but all are based on international experience where

34
impacts have been positive and farmers and environmentalists continue to practice such
actions.
2.64 Under IAIL3’s Environmental Management Plan a number of key environmental
and productivity variables were monitored, including groundwater levels, soil fertility,
inorganic fertilizer levels, pesticide content and water and soil pollution levels. Some of
these are noted below. Measurement was through an extensive network of monitoring
stations, and use of professional monitoring agencies hired by the POCADs. The agencies
were adequately qualified and capable of producing technically sound and accurate
results.20
Groundwater Recharge
2.65 SOCAD reports generally favorable impacts in reducing groundwater extraction,
though with considerable variation between regions. In Shandong, groundwater levels
improved in five monitoring areas, held steady in 11, and dropped in 10. In some of the
latter, a declining water table was considered beneficial because it ameliorated problems
with water-logging and salinity. In water-scarce Hebei, the decline in the water table was
slower in project areas than in comparison areas, by 0.14 to 0.75 meters/year. Total
groundwater extraction in 2009 was reported to be 449 million m3 lower than 2005.
Different sources of project data on water productivity and tons of crop production give
inconsistent estimates on the implied total water consumption of crops in the project area,
ranging from an increase in consumption of 111 million m3 to a decrease of 16 million.
In Henan, groundwater levels rose by 4 to 73 centimeters over 2005-2009 in three areas
where rainfall was approximately constant, declined by 2.3 meters in Luhun, where
rainfall during the project averaged 94 mm/year lower than normal; and fell 73 cm in
Sanyiza, where rainfall was average. Measurements were not reported for the less water-
constrained provinces of Anhui and Jiangsu.
2.66 It is difficult to reconcile and generalize these data. Spot measurements of
groundwater depth may not convey a comprehensive picture of water use over a large and
heterogeneous area. Comparisons of groundwater levels between project and non-project
areas could be problematic if they draw on common groundwater resources. Calculations
based on water productivity may not fully account for reflows or leakages back into the
system (yielding an upward bias on water use), but on the other hand do not factor in the
positive or negative impacts of shelterbelt planting (likely a downward bias).
2.67 This underlines the potential complementarity between the efficiency innovations
of IAIL3 and the basin-wide perspective on water conservation of the Hai Basin project.
IAIL3 was designed with a small pilot component on evapotranspiration (ET)
20 As examples, Anhui Province hired the Environmental Monitoring Center in Anhui and the
Soil and Fertilizer Station. Hebei hired the China Academy of Geological Sciences, and the
Province’s Institute of Hydrogeology and Environmental Geology and Fertilizer Association.
Henan used the Province’s Agricultural Environmental Protection Monitoring Station. Jiangsu
employed the Agricultural Environmental Monitoring and Protection Station, and the National
Environment Protection Agency. And Shandong hired the Province’s Agricultural Environment
Protection Station, Fertilizer Testing Station and the Institute of Hydrology and Water Resources.

35
measurement (Error! Reference source not found. and discussion under Hai Basin).
This was undertaken independently of the ET component of the HBP, with fewer
resources. It measured production/ET at the plot level but did not consider overall
consumptive use of water. As noted, the ability to comprehensively measure water
consumption over a large area would be helpful in tracking the environmental and
economic impacts of programs such as IAIL3.
Soil Organic Matter, and Pesticide and Fertilizer Pollutants
2.68 Other impacts are also reported by SOCAD’s monitoring agencies. In Hebei
Province, during the project period pesticide residues in soil decreased by 22 percent, and
pesticide residues in water diminished by 15 percent. Soil sampling in Jiangsu Province
indicates a small increase in soil organic matter (from 19.0 grams/kg of soil in 2005 to
20.3 grams/kg by project completion), and SOCAD asserts that use of chemical fertilizer
has declined, quality of both groundwater and surface water has improved, and that the
shelterbelt trees have improved water storage capacity, reduced soil erosion, helped
create moister air, and attracted bird species. People’s participation was integral to water
user association management, but also applied to varying degree to other activities such
as producing and marketing green crops, pest management, and the training and
demonstration program generally.
2.69 Summarizing, a number of interventions were undertaken that might be expected
to confer agro-ecological benefits. There are some indications of favorable outcomes –
notably reduced pesticide residues in Hebei -- but others are not well documented. With
regard to impacts on groundwater, there are measurements suggesting favorable impacts
in some regions. However, data on cropping and water efficiency suggest that the project
may have slightly increased total water consumption. In view of the presumed favorable
but suboptimally documented outcomes, the Efficacy of promoting sustainable and
participatory rural water resources management and agro-ecological environmental
management was Substantial.
OBJECTIVE 4: ENHANCING AND MAINSTREAMING ADAPTATION TO CLIMATE CHANGE21
2.70 This objective, added specifically for the MCCA, had the goal of enhancing
adaptation to climate change in agriculture and irrigation management, and had two sub-
objectives: (i) enhancing awareness, capacity building and demonstrations; and (ii)
assisting the mainstreaming of adaptation measures into the national irrigated agriculture
development program.
2.71 The grant supported analyses that would inform adaptation strategy for the IAIL3
and for SOCAD in general; field implementation of adaptation practices in specific pilot
areas and the IAIL3 implementation program; and dissemination and awareness-raising
activities.
21 The full wording of this objective was: “to Enhance adaptation to climate change in
agricultural practices and irrigation water management through awareness raising, institutional
and capacity strengthening and demonstration activities in the project area and to assist in
mainstreaming climate change adaptation measures, techniques and activities into the
Comprehensive Agriculture Development Program of the recipient.”
36
2.72 The project sponsored, with only a modest budget, a range of scientific analyses
to support adaptation planning. These were important in building capacity of Chinese
scientists and economists to address climate change issues in a rigorous fashion, and
contributed to a stronger empirical and theoretical basis for future work. The work
included sophisticated integration of climate, hydrology, water allocation, and economic
models; altogether 27 studies were undertaken. Several project-sponsored papers have
been published in international journals, and many in Chinese journals. And perhaps the
most influential outreach medium towards mainstreaming climate change adaptation was
a sizeable group of media modules ranging from webpages, booklets, and radio and TV
coverage. 331 of such modules were applied, slightly above the appraisal target of 326
(the target was not revised).
2.73 Due to inherent limitations on climate forecasting (see Section 4), the climate
analyses reach useful but rather generic conclusions:
temperatures will definitely rise;
precipitation will probably rise, but will become more variable, with more
droughts and floods, and less synchrony with traditional planting schedules;
higher temperature will lead to more demand for water by crops (higher
evapotranspiration), exacerbated by increasing nonagricultural demand, leading to
water scarcity;
rain fed areas will be hardest hit;
market effects will tend to reduce the economic impact of climate change, as
farmers and international trade react to changing prices; and
overall impacts on yields may be modest, but there are many ‘wild cards’ such as
the impacts of pests, floods and droughts.
2.74 Some of the main implications of these studies are fully consistent with the
original goals and design of IAIL3. Most important is the focus on irrigation efficiency
and real water savings. IAIL3’s emphasis on farmer organizations is also consistent with
the need for farmers to identify locally relevant adaptive actions.
2.75 SOCAD points to the following as areas where MCCA insights resulted in course
corrections or increased emphasis during IAIL3 implementation: rainwater harvesting,
low-pressure pipelines, land-leveling, selection of crop varieties that are resilient to
drought, waterlogging, pests and temperature; pest-monitoring; greater use of pumps to
provide water to marginal irrigated areas, collection ponds for water storage at the ends
of irrigation networks; rainwater harvesting, retention of straw, mulching and using dung
for reduced evaporation and improved soil fertility, drainage, and pest-monitoring. There
was increased emphasis on greenhouses. Bio digesters were introduced, though in some
project areas it is still too cold for them to function in the winter.
2.76 The sub-objective to enhance climate change adaptation awareness and capacity
was primarily through training and demonstrations for farmers. This was also a base,
together with learning by doing and association with specialists, for building capacity of
project field staff. Another channel was through pamphlets and other literature. This was
on a large scale – some 170 different publications for various audiences – farmers, the
general public and academics - were issued with coordination or funding through

37
IAIL3/MCCA. By the end of the project, 57 percent of project farmers were aware of
climate change; 35,000 ha of climate change adaptation demonstrations measures had
been established; and the climate change concept had become a standard feature in
IAIL3’s irrigation modernization program. All of the actions above exceeded project
targets at appraisal, which were not revised (Table 2.6).
2.77 For the second sub-objective, mainstreaming, activities included: development of
long-term agricultural climate change scenarios; holding consultations and meetings on
climate change adaptation; mounting of an awareness campaign; training for scientists
and technicians; a comprehensive media campaign including radio, television,
newspapers, and a web site; and use of advisory booklets and other documents. Also,
MCCA’s attachment to IAIL3 enabled a substantial influence on the IAIL3 program as a
whole. By the end of IAIL3, adaptation measures were being applied on 173,000
hectares (112% of the MCCA target at appraisal) – about 44 percent of the project’s total
irrigated area of 393,000 hectares.
2.78 A quantitative assessment of MCCA’s impacts on farmers’ productivity and
welfare, in particular in mitigating extreme events such as droughts and floods, would be
difficult to interpret as IAIL3/MCCA was a fully integrated blended program, and
reliable statistics on extreme events would require a long time-series. Some inferences
can, nevertheless be drawn from several observations. First, farmers were found
enthusiastic to take up the adaptation measures –hence the rapid adoption of climate
change adaptation noted above. Second, IEG found a virtually uniform view amongst all
field staff and managers of the POCADs and COCAD’s that integrating MCCA-type
actions was beneficial.22 Most of the adaptation measures, as well as providing greater
crop security, are generally recognized by agriculturalists as having potential to increase
yields. Third, as indicated below, national decision makers, witnessing what
IAIL3/MCCA was achieving, have shown strong interest in further expansion of the
program. To provide guidance, SOCAD, and the project POCADs issued in 2012 a
“Circulations to Strengthen Climate Change Adaptation in CAD.” Finally, over 30
consultation meetings have been held for Government leaders and officials, another
mainstreaming activity for the climate change adaptation agenda.
2.79 Thus, an impactful start towards adapting agriculture to climate change was made.
Climate change adaptation measures became embedded in the IAIL3 program as an
integral part of its development approach. And the IAIL3/MCCA climate adaptation
approach was subsequently integrated by SOCAD into China’s national Comprehensive
22 In Huaiyuan County in Anhui Province, IEG was advised of the following climate adaptations.
From October 2008 to February 2009 there was a severe (1 in 50 years) drought. Crops in non-
project irrigated areas did not survive. In the IAIL3/MCCA irrigated areas, the wheat crop
survived. COCAD staff advised of the following MCCA actions. The likely most influential
action was the adaptation of the irrigation system to include water retention ponds, increased
canal lining and other measures. Another was to introduce new more heat resistant seed, which
was also less susceptibility to wind induced lodging. Other agronomic measures had also been
promoted by COCAD.

38
Agriculture Development program, hence providing the prospect of impact on a far larger
scale than the IAIL3/MCCA program alone.
Summary
2.80 GEF’s MCCA Project, and in particular, the blended IAIL3/MCCA program,
leveraged a much larger climate adaptation program than if the MCCA project had been
stand-alone. All implementation targets were met or exceeded. Farmers and Government
alike are committed to adapting agriculture to climate change and are taking the program
forward. The Efficacy of Enhancing adaptation to climate change in agriculture and
irrigation water management, and mainstreaming such activities into the national
Comprehensive Agriculture Development program was High.
Efficiency
2.81 As concerns IAIL3/MCCA’s implementation and costs there was little that could
have been improved: the project was implemented as scheduled and without extensions;
there were no changes to the project objectives, and no significant changes in the
components; both the Bank Loan and GEF Grant were fully disbursed; and actual project
costs ($463.5 million) were very close to the appraisal estimate of $463.2 million. With
the exception of part of the domestic training and study tours program, the result of a
general reduction in training imposed by Government in response to the financial crisis,
all physical targets were achieved or exceeded; and for some programs, achievements
were considerably above targets. Thus, 1022 WUAs were established compared with a
target of 494 WUAs. And 155,000 hectares of land was graded compared with the 667
hectare pilot exercise originally intended.
2.82 The combined IAIL3/MCCA project’s Economic Rate of Return estimated in the
ICR was 25.3 percent, marginally higher than the PAD estimates. The ICR did not report
sensitivity analyses to assumptions. However, the without-project scenario, against which
benefits are computed, is based on assumptions that are open to question. The economic
analysis represents without-project farming to be loss-making (uneconomic), suggesting
that market forces or policy changes would have propelled it to greater profitability over
time. And indeed there is dynamism as rising rural wages impel mechanization. If we
assume (arbitrarily, as an example) that, without the project, farms would break even
from year 6, the ERR drops to 17.8 percent.
2.83 On the other hand, the economic analysis does not attach value to the project’s
environmental benefits. Its reductions in pesticide application would have health
benefits, and reductions in fertilizer would reduce harmful eutrophication of freshwater
bodies. Information is lacking to quantify these benefits. The ERR is also conservative in
disregarding possible spillover effects to neighboring areas from technology
demonstrations. Net reductions in water use have a clear economic benefit, given water
scarcity and the costs of unsustainable groundwater extraction. If the reported
groundwater savings in Hebei of 446 million m3 is assumed to carry forward annually,
and is valued at the urban household tariff of 5 yuan/m3 (an underestimate of the shadow
price of water), it would dwarf the net benefits from farm production and lead to an

39
astronomical rate of return. As noted earlier, though, it is hard to make a definitive
estimate of the net project impacts on water consumption.
2.84 Because IAIL3/MCCA were unified, their efficiency is assessed jointly. The
costs and benefits of counterpart contributions to the MCCA are included in the ERR
calculation. However, the $5 million in expenditure supported by the GEF grant are not.
Those funds went to studies, training, awareness raising, and demonstration plots that
influenced IAIL3 activities, but also may have had nationwide, hard-to-quantify impacts
on agriculture, policy, and capacity. These costs were small relative to overall
IAIL3/MCCA costs, so their exclusion biases the ERR by only about 0.2% at most.
While it would be of interest to assess the efficiency associated with the marginal impact
of MCCA on IAIL3, data does not permit this. Nor is it possible to calculate the
benefits associated with outside-the-project awareness impacts of MCCA. Diffusion
effects into neighboring counties or provinces would boost the overall IAIL3/MCCA
ERR.
2.85 Taking these positive and negative biases into account, it is likely that the
project’s returns are well above the 12% social discount rate applied by SOCAD in the
analysis, indicating an efficient use of funds.
2.86 Taking account of the project’s economic viability; its efficient implementation;
the timely achievement of targets within costs; and the integration of the IAIL3 approach
within the national agricultural development program, adding considerably to the longer
term economic value of the project; the Efficiency of IAIL3/MCCA is rated High.
OUTCOME
2.87 IAIL3’s objectives were highly relevant to China’s need to increase agricultural
productivity in the face of its limited water and land resources which were confronting an
expanding demand for foodstuffs and for a more diversified agricultural output. The
project could also contribute to improving rural incomes, and the thrust on productivity
needed to be environmentally sustainable. The project’s design was also highly relevant,
distinguished by a sharp, practical focus on attaining the objectives. The addition of the
climate change operation enhanced the relevance of the project to China’s increasing
concerns with extreme weather events, and its design was responsive to that need.
2.88 The efficacy of three of IAIL3/MCCA’s four objectives was high. As concerns
the first objective, efficacy was high. Agricultural yields (quantity/hectare) increased by
about 22 to 35 percent, which, taking account also of an improved cropping intensity
results in an increase in agricultural productivity of about 24 to 39 percent. Areas under
high value crops also increased and are likely to take an increasing share of agricultural
value added. Water productivity increased by even more than the productivity of land.
Starting with a yield of 1.06 kg cereal equivalent per m3 of water, water productivity
became 1.55 kg/m3 of water – a 55 percent increase. What may have happened with non-
project (control) farmers is not known precisely, but, for instance, without the
modernization of the irrigation systems (which were also specifically designed as “water
saving” schemes), water productivity would not be expected to improve. And average

40
yield increases for project farmers during the project period were much above their
provinces’ average grain yield increases of 9 percent (Table 2.8).23
2.89 Farmer incomes also increased (the second objective), and the efficacy of this
objective was also high Adjusting for inflation, real incomes increased by an average
across provinces of 50 percent, with larger increases for poorer farmers. And through the
farmer association pilots, a model for agricultural diversification to higher value crops
and modernized marketing was established.
2.90 There was substantial effort related to the third objective to promote sustainable
water and agro-ecological environmental management. Some actions – such as the entire
“water saving” irrigation modernization program, land leveling, and shelter belt trees –
were at large scale. However, systematic evidence regarding the results of the program is
limited, and the objective’s efficacy is rated substantial. Finally, concerning the fourth
objective – climate change adaptation – efficacy was high. The adaptation program was
carried out as planned, and comments from farmers, and the involved Ministries,
POCADs and COCADs, indicate a general view that the adaptation measures have
provided greater protection from droughts and other events, and have also helped
increase yields. EG field visits found that farmers were enthusiastic to adopt the
adaptation measures.
2.91 IAIL3’s Efficiency was High. Operationally, the project implemented the full
intended project program within appraisal estimated costs, met or exceeded
implementation targets, and was completed as scheduled without any extensions. While
the ERR is difficult to compute, it is well above any reasonable discount rate.
2.92 A more complete consideration of IAIL3/MCCA’s value is the influence of the
project on China’s agricultural development as a whole. This is major. Central
Government has taken the IAIL3/MCCA program as a model and is integrating the
approach into the irrigated agriculture part of the National Comprehensive Agricultural
Development Program which covers all of China’s Provinces and which in 2014 received
a budget of about 36 billion Yuan (about $6 billion).
2.93 Given that the ratings for relevance and efficiency are high, and three out of four
objectives were rated high on efficacy (and the fourth substantial), IAIL3/MCCA’s
overall Outcome is rated Highly Satisfactory, and the more so given the project’s further
influence on China’s overall agriculture development program.
RISK TO DEVELOPMENT OUTCOME
2.94 Now mainstreamed into China’s Comprehensive Agriculture Development, the
IAIL3/MCCA program is unlikely to be abandoned. As a central part of Government’s
agricultural development strategy and budget, and strongly prioritized by policy makers,
insufficient ownership is not an issue. Institutionally, the project found an effective way
of operating within the Government system and of harnessing the capabilities of the line
23 Yield growth in the Provinces will have some bias upwards, as the project areas are included in
Province-wide averages.

41
agencies, both centrally and at provincial and county levels. If this continues, and the
arrangements have every chance to do so if Government commitment is maintained,
sufficient executive capacity to handle the field development activities would be
maintained. At the behavioral level, farmers have found ways to boost income and are
likely to continue these behaviors. At the physical level, interventions such as land
leveling will be enduring. So Risk to Development Outcome is rated Negligible to Low.
BANK PERFORMANCE
Quality at Entry
2.95 The Bank was strategically well focused in recognizing and addressing the critical
need to increase the productivity of rural water for greater agricultural output, water
saving and higher farmer incomes. The project was innovative in a number of ways,
amongst them, promoting the concept of “water savings” rather than irrigation efficiency
alone, a new emphasis on diversification to higher value products, new grassroots farmer
institutions, and significant integration of Chinese academics to enhance Government
expertise. A senior government official described the Bank’s most significant role as
bringing in “new concepts and specialists.”
2.96 Preparation was practical, and the institutional structure of the project enabled
timely implementation. The Task Team worked to make the project ready for immediate
implementation after signature24. The team was not short of ingenuity. Faced with a
limited operational budget, it drew on the cooperation established between the Bank and
DFID (UK) through the Pro-poor Rural Water Reform Project. The arrangements were
informal but enabled DFID financing of specialist consultants for IAIL3 beyond what
would have been possible using only the Bank’s budget. This proved important to the
technical strength of preparation, and ultimately of project implementation. There was a
close collegial partnership between the Bank and Borrower throughout the preparation
process. Quality at Entry is rated Highly Satisfactory.
Supervision
2.97 The Task Team maintained a close partnership with Government and the
implementing agencies, and tackled bottlenecks practically. The team was an effective
resolver of implementation issues, enabling an ambitious project to be implemented on
schedule and with practically all targets achieved. Two strengths particularly stand out.
First, as during project preparation, the team maintained a good balance between
implementers and technical specialists, in part through the informal arrangement with
DfID noted above.25 Without proactively searching for outside resources there would
have been minimal scope to afford such expertise.26 Second, the Bank was outstanding in
24 The flip side of the quality and innovation achieved during project preparation is that
preparation to approval took about 2 ½ years, which SOCAD feels was too long.
25 Between FY06 and FY11 the average Bank budget provided for supervision was
$61,000/annum.
26 For instance, technical specialists were hired for WUAs, water saving techniques, farmer
associations, green crops, gender, climate change, and other skill areas.

42
the design, blending and supervision of the added MCCA GEF Grant. It required
initiative and acceptance of the possibility of failure to add a sub-project to IAIL3 when
IAIL3’s closure was only 2 ½ years away, and an agricultural climate change agenda had
hardly been tried in China. But strong performance in design and supervision of MCCA,
coupled with similarly strong performance by Government and the project implementing
agencies, made this innovation succeed. The Bank’s Supervision Performance was
Highly Satisfactory.
2.98 Overall Bank Performance: Highly Satisfactory.
BORROWER PERFORMANCE
Government
2.99 Government ownership and commitment for IAIL3 was strong from the start. By
IAIL3’s Board approval, core leadership staff in SOCAD and other agencies had already
been appointed and necessary implementation measures had been established. This
enabled the project to get off to a fast start. Provision of counterpart funds was
consistently timely and to the amounts required. The decision to have SOCAD under the
Ministry of Finance was a considerable help in providing coordination, in a back-up role,
of the different technical institutions involved – the Ministries of Water Resources,
Agriculture, Environment, and other agencies27. Facilitated by this arrangement, SOCAD
and these institutions were able to quickly resolve implementation constraints. Finally,
Government, providing that key persons were kept informed, was near ideal in its
overview support for the project’s innovations. Thus, a full package of facilitating
institutional arrangements, ready intervention to solve interagency issues, financial
support, and willingness to experiment was provided. Government’s Performance was
Highly Satisfactory.
Implementing Agencies
2.100 The most noteworthy performance was that of SOCAD itself, and more
specifically, SOCAD’s Central Project Management Office and its regionally based staff
– the POCADs and COCADs. They had to cover five project provinces and 107 counties,
plus the additional five participating provinces and 16 counties where the project’s WUA
program was extended. Other key implementers were the provincial and county Bureaus
of the Ministries of Water Resources, Agriculture, Environment and Forestry, plus other
Bureaus as needed. Academics were significant partners and were particularly valuable in
innovatory areas. This extensive administrative structure might seem unwieldy, but it had
the merit, especially considering the subsequent scale-up to a national program, of
operating, except for SOCAD itself, within the existing Government structure and
agencies. In the event, the management system worked, despite the number of agencies
27 The unusual arrangement whereby SOCAD and the Comprehensive program are housed under
the Ministry of Finance has been a significant facilitator between ministries. On several occasions
government staff commented to IEG their view that the arrangements had been a key factor
enabling efficient project implementation and should stay.

43
and offices involved. In general, the technical bureaus did a good job – each agency’s
responsibilities were carried out. But SOCAD’s (including provincial and county staff)
performance was outstanding. The Performance of the Implementing Agencies was
Highly Satisfactory.
2.101 Considering both the performance of Government and the implementing agencies,
the Overall Performance of the Borrower was Highly Satisfactory.
3. Hai Basin Integrated Water and Environment
Management Project
Objectives, Design, and Relevance
Project Objectives
3.1 The Objectives of the Hai Basin Integrated Water and Environment Management
Project (HBP), as defined in the Global Environment Facility Trust Fund Grant
Agreement, were:
To assist the recipient in reducing pollution in the Bohai Sea by developing an
integrated approach to water resource management and pollution control in the Hai
Basin.
(The objectives described in the PAD are broadly consistent with these objectives,
although water and pollution management are more prominent.)28
3.2 The Project Objectives (Grant Agreement) can be considered as comprising two
sub-objectives: (i) developing an integrated approach to water resource management and
pollution control in the Hai Basin; and (ii) reducing pollution in the Bohai Sea. These
sub-objectives will be used for evaluation purposes in this review, in particular in the
Efficacy section.
Relevance of Objectives
3.3 Water is acutely scarce in northern China, and made more so by the high pollution
of both land and off-shore water resources. As indicated in Chapter 1, the Nation’s annual
305 m3/person of water is only 14 percent of the world average, and in the Hai Basin, the
project’s location, water scarcity is even more acute. Pollution is also a major problem
28 In accordance with standard IEG practices, HBP’s objectives as defined in the legal document
are taken as the project objectives and the base for evaluating the project. The PAD gives a
slightly different emphasis. According to the PAD’s Logical Framework (page 35) - the project
would: “Improve integrated water and environmental management in terms of water quantity and
water quality in the Hai Basin and reduce land-based sources of pollution to the coastal and
marine environment of the Bohai Sea.”
44
affecting most waterways, and is particularly high in China’s Northern Plains where most
of the Hai Basin is situated. Some 68 percent of the total river length in the North China
Plains is classified as “polluted” (unsuitable as raw water sources for drinking), and for
the Hai River, 80 percent of river length is polluted.
3.4 This situation is made more critical by the Hai Basin’s crucial role in China’s
development. In 2005, the Hai Basin accounted for 10% of China’s population, 12% of
its grain production, and 15% of its GDP.
3.5 Much of China’s coastal and off-shore waters are also under pressure due to land-
based pollution. The Bohai Sea – a shallow, mostly enclosed body of water fed by some
40 rivers of which the Hai and Huang (Yellow) rivers are amongst the larger rivers - is
one of the most affected. Discharge of wastewater and pollutants into the Bohai Sea may
be as high as one third, and a half, respectively, of China’s total pollutant discharge. This
has put pressure on fish species and fish stock, as well as the livelihoods of fishermen,
and has particular significance because of the Bohai Sea’s role as a seasonal spawning
and nursery ground for fish which then migrate to the Yellow Sea, and to Korean and
Japanese waters. The interlinked problems of water scarcity and pollution of water, both
inland and coastal, are critical issues confronting China, and are appropriately
categorized as relating to international waters under the Global Environmental Facility’s
financing criteria.
3.6 At the time when the HBP was being prepared, and even in many respects today,
the conceptual and technical skills, and the institutional base for better water resources
and pollution management, were severely underdeveloped. Water was used rather than
managed; there was little knowledge and use of modern water savings technology; water
resources and pollution issues were handled by separate institutions; and water planning
was limited, seldom multi-sectorial, and top down rather than also including local
governments and other stakeholders.
3.7 These issues have not gone unheeded. Water and pollution issues have become
more prominent in China’s Five Year Plans, and, the Nation’s strategy documents have
increasingly reflected this. China’s 11th Five Year Plan (2006-2010) aimed to achieve
higher water savings; to significantly increase water use efficiency, especially for
irrigation; to improve monitoring of water use and pollution; to strengthen pollution
regulations; and to reduce water pollution, especially of major rivers. A Bank study,
“Agenda for Water Sector Strategy for North China” (2001), highlighted the developing
problems of water scarcity and pollution. Improving the management of water resources
and the environment has been featured in the last several Country Assistance Strategies.
Thus, the China Country Partnership Strategy for 2006-2010 (May 23, 2006) - the
Strategy current for most of the project period - cites water availability and quality as
critical issues under its Pillar Three: “Managing Resource Scarcity and Environmental
Challenges.” The Strategy notes the increasing difficulty meeting the growing demand
for water, and mounting problems with water pollution. It includes recommendations to
reduce water use, especially of agriculture, including more productive irrigation and less
water using crops; better regulation of industrial water; and expanding waste water
treatment for urban areas.

45
3.8 The current Country Partnership Strategy for China (issued in October 2012)
further sharpens understanding of key issues in the water sector. It emphasizes the need
to tackle the issues of water scarcity, overexploitation, and water pollution; and calls for
implementing integrated water resources management at the river basin level; and
addressing multiple uses including: water scarcity, flooding, pollution, water demands,
economic instruments and institutional aspects. Thus, from all angles – water quantity
and quality, pollution of the Bohai Sea, and the strategies of both Government and the
Bank, the Relevance of HBP’s Objectives was High.
Project Design
3.9 Box 3.2 shows the HBP’s components and costs. The project focused on studies,
pilots, and consultants rather than physical infrastructure. Its core was the first
component – Integrated Water and Environment Management - which incorporated the
central concept in the project’s objectives of the inclusion and integration of both the
quantity of water resources and the quality of water and the water environment. This was
to be implemented through county and province level Integrated Water and Environment
Management Plans (IWEMPs). The component also included strategic studies and pilot
demonstrations to prepare for future policy and technical initiatives in integrated water
and environment management planning.
3.10 Three key innovations were to be piloted under the project’s second component,
Knowledge Management. First, the component supported the development and
application of models used to construct the IWEMPs. A sophisticated “Dualistic Model”
combined hydrological and socioeconomic components and was to be applied at the basin
level. SWAT (Soil and Water Assessment Tool), a public-domain software package, was
adapted to model water flows, evapotranspiration (ET), erosion, and nonpoint source
pollution at the county level. Second, a Remote Sensing ET Management System was to
be developed to measure ET – actual consumptive water use – at the county and basin
level. (Box 3.1). These measurements were to be used for target setting and for allocation
and management of water. Third, the component developed hardware and software for
sharing data with planners; notably including, for the first time, data sharing between the
Ministry of Water Resources (MWR) and the Ministry of Environment Protection (MEP).
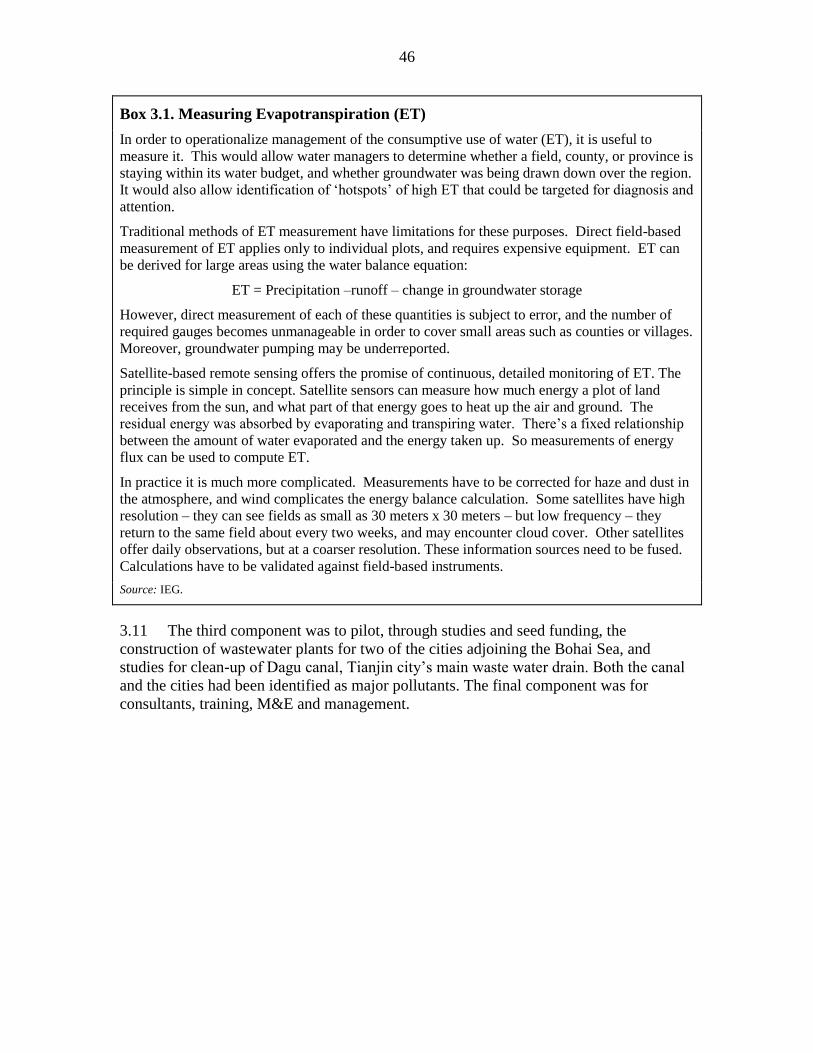
46
Box 3.1. Measuring Evapotranspiration (ET)
In order to operationalize management of the consumptive use of water (ET), it is useful to
measure it. This would allow water managers to determine whether a field, county, or province is
staying within its water budget, and whether groundwater was being drawn down over the region.
It would also allow identification of ‘hotspots’ of high ET that could be targeted for diagnosis and
attention.
Traditional methods of ET measurement have limitations for these purposes. Direct field-based
measurement of ET applies only to individual plots, and requires expensive equipment. ET can
be derived for large areas using the water balance equation:
ET = Precipitation –runoff – change in groundwater storage
However, direct measurement of each of these quantities is subject to error, and the number of
required gauges becomes unmanageable in order to cover small areas such as counties or villages.
Moreover, groundwater pumping may be underreported.
Satellite-based remote sensing offers the promise of continuous, detailed monitoring of ET. The
principle is simple in concept. Satellite sensors can measure how much energy a plot of land
receives from the sun, and what part of that energy goes to heat up the air and ground. The
residual energy was absorbed by evaporating and transpiring water. There’s a fixed relationship
between the amount of water evaporated and the energy taken up. So measurements of energy
flux can be used to compute ET.
In practice it is much more complicated. Measurements have to be corrected for haze and dust in
the atmosphere, and wind complicates the energy balance calculation. Some satellites have high
resolution – they can see fields as small as 30 meters x 30 meters – but low frequency – they
return to the same field about every two weeks, and may encounter cloud cover. Other satellites
offer daily observations, but at a coarser resolution. These information sources need to be fused.
Calculations have to be validated against field-based instruments.
Source: IEG.
3.11 The third component was to pilot, through studies and seed funding, the
construction of wastewater plants for two of the cities adjoining the Bohai Sea, and
studies for clean-up of Dagu canal, Tianjin city’s main waste water drain. Both the canal
and the cities had been identified as major pollutants. The final component was for
consultants, training, M&E and management.

47
Box 3.2. HBP Components and Costs
Integrated Water and Environment Management (Appraisal cost US$13.9 million; actual
cost US$14.8 million)
Comprising: (i) 8 Strategic Studies covering: institutional, political and legal aspects of water
resources management; environmental needs; and management of water quantity and pollution;
(ii) Integrated Water and Environment Management Planning: Preparation of Integrated Water
and Environment Management Plans at county and provincial levels, and a sub-basin Strategic
Action Plan for Zhangweinan sub-basin. Each IWEMP would be prepared over about a two year
period, with implementation beginning during the project period. IWEMPs would be multi-
sectoral, and concerned with all water resources, uses of water and pollution; and (iii)
Demonstration Projects to pilot activities that might be relevant for the IWEMPs in areas such as:
control of wastewater discharge, pollution control and environmental improvement; use of
evapotranspiration monitoring and remote sensing to improve water allocation and saving; and
effective management of water rights and well permits.
2. Knowledge Management (Appraisal cost US$5.8 million; actual cost US$6.3 million)
Comprising: (i) Knowledge Management by developing the software and communication
network to collect, keep, track, provide and analyze data covering the whole Hai Basin as well as
counties and provinces. Data collected would progressively be used in a decision support role and
planning covering water use, pollution discharges, reservoir management, groundwater, multi-
sector allocation and the water environment. Developing and using knowledge management
would be a facilitating process for increased collaboration between the Ministries of Water
Resources and Environmental Protection (which would jointly manage the Knowledge
Management system), between counties and other counties and provinces, and for the basin as a
whole; and (ii) Piloting a Remote Sensing Evapotranspiration (ET) Management System.
Improving conservation of water through use of evapotranspiration measurement and monitoring
by remote sensing, and adjustments in water delivery to achieve a better water balance and more
rational allocation. ET measurement would be accompanied by improved water delivery
efficiency, administration of water rights and well permits, and administration such as through
water user associations.
3. Tianjin Coastal Wastewater Management (Appraisal cost US$4.1 million; actual cost
US$4.5 million)
Comprising: (i) Studies to improve waste-water management for small cities. Two cities were to
be chosen. The project also provided financial incentives for initial operations of the cities’
waste-water treatment plants; and (ii) technical assistance and studies for the clean-up of Dagu
canal – Tianjin’s main waste-water canal which had become severely silted and contaminated.29
4. Project Management, Monitoring and Evaluation, and Training Management (Appraisal
cost US$8.6 million; actual cost US$9.0 million)
Comprising: consultancy services, “expert groups’ supporting all Project Management Offices,
training and study tours, and management information.
Financing: Financing was by Government and GEF in the following amounts: Government -
planned (at appraisal) allocation $16.32 million; actual contribution $17.58 million); and GEF
Planned allocation $17.00 million and actual allocation $16.96 million.
Source: PAD and ICR.
29 For both sub-components, the Hai Basin project’s role was provision of technical assistance.
The works were implemented under another Bank project the Tianjin Urban Development and
Environment II Project.
48
Relevance of Design
3.12 The HBP’s logical framework (Annex 1 of the PAD) presents a clear linkage
between the project components and institutional structure and the project Objectives.
Design responded well to all four aspects of the objectives: (i) developing an integrated
approach to water resources management and pollution control; (ii) better conservation
and use of water: (iii) better management and control of water pollution, and (iv) reduced
pollution into the water systems and the Bohai Sea.
3.13 Integrated water resources management was at the heart of project design. This
addressed the fundamental need to integrate management of both water quality and
quantity in order to meet environmental, social and economic goals. Reducing
unsustainable water use and harmful pollution required comprehensive planning and
management across sectors, and between provinces and counties. And in order to reduce
the environmental impact of pollution, it was necessary not only to reduce the pollution
load (in tons), but also to decrease its concentration. That is, more water is needed to
dilute the pollutants down to acceptable levels. Higher flows are also needed to support
freshwater biodiversity and to counteract the increasing salinity of the Bohai Sea. On the
other hand, it was recognized that greater flows in the Hai Basin Rivers – which are now
often seasonally dry -- could have the perverse effect of delivering more pollutants to the
Sea. So close coordination is needed between pollution management and flow
management.
3.14 The design understood that achieving integrated water-environment management
would require significant conceptual, technical and institutional innovation. On the
conceptual side, the project design recognized the need to restrict water demand to
sustainable levels, through attention to agriculture, the largest water using sector. It
introduced a revolutionary paradigm shift away from traditional views of irrigation
efficiency. The project focused instead on the need to put a hard cap on the consumptive
use of water (ET), and within that cap to shift from non-beneficial to beneficial uses. On
the technical side, this meant that the project needed to develop a tool for tracking and
managing ET. In addition, optimizing the complex interplay of quality and quantity
required spatially explicit computer models that could trace flows of water and pollutants
including nonpoint source pollution from agriculture.
3.15 The PAD frankly described the strong institutional barriers to integrated water
management. First, there was no coordination in regulations or enforcement between
MWR and the State Environmental Protection Administration (later promoted to Ministry
level, becoming the MEP) and other vertical ministries affecting water use and pollution.
The lack of coordination between the MWR and MEP was particularly problematic,
because they did not share monitoring data and their regulations were sometimes
inconsistent. Second, there was little or no coordination across county or province
boundaries between upstream and downstream water users. Consequently there are cases
of interprovincial disputes about water. Third, the Hai Basin Commission and other river
basin commissions engaged in planning have little actual authority and do not bring
stakeholders together.
49
3.16 These institutional barriers are deeply rooted in Chinese law and government
structure, so that comprehensively addressing them would be far beyond the scope of a
modest GEF grant. The project adopted a pragmatic approach to these issues that
focused on piloting better coordination through the creation and implementation of
IWEMPs. It proposed to create coordinating mechanisms at the county and basin level,
linking the MEP, MWR and other agencies; to incorporate ‘bottom-up’ and cross-
sectorial consultation in the creation of IWEMPs, and to improve the policy framework
for controlling groundwater over-extraction. So there would be direct effects through
implementation, and demonstration that could lead to replication outside the project and
to policy reform.
3.17 Eight “Strategic Studies” were included in the project, and in broad terms were of
two kinds. First, the more strategic and policy related studies such as the policy, legal and
institutional framework, and water rights and sustainable groundwater exploitation.
Second, on specific issues such as wastewater reuse, and Bohai Sea-river linkages
3.18 In addition, there were engineering studies and technical assistance related to two
investments that could be expected to reduce pollution into the Bohai Sea (refer Efficacy
Section): (i) removal of silt from the Dagu canal, Tianjin city’s main conduit of pollution;
and (ii) design and operation of two wastewater plants to pilot wastewater management
plants, sorely lacking in coastal areas. Both studies underpinned successful investments
financed under the Second Tianjin Urban Development and Environment Project (World
Bank FY03)
3.19 While the project would be expected to directly and significantly improve water
management in the project counties, its immediate direct effect on the Bohai Sea is
limited, because the Hai River and its tributaries account for only a small fraction of
Bohai’s pollution; most comes from the Yellow and Liao Rivers. Greater impact would
come over time from replication of this small ($34 million) project’s technical and
institutional innovations.
3.20 In summary, HBP’s design was well aligned to achieving its objectives. Its
strikingly innovative conceptual, technical, and institutional interventions dovetailed well
with each other and were adapted pragmatically to the existing institutional structures in
China. A priori this was a risky project given its innovativeness, ambition, and lack of
funding for infrastructure. However, these risks were mitigated by a phased structure of
implementation and by the practical institutional structure and implementation processes
chosen. Nevertheless, the minor degree to which the project could influence pollution
load to the Bohai Sea could have been better elaborated at project design stage.
However, in other respects design was strong and well aligned to the project’s objectives.
HBP’s Relevance of Design was Substantial.

50
Implementation
3.21 HBP was approved on April 15, 2004 with intended project closure on June 30,
2010.30 Actual closure was one year later – on June 30, 2011. There were two project
extensions of six months each. The first extension was made after the December 2007
Mid-Term Review. According to the MWR and MEP, progress was delayed by staff
unfamiliarity with concepts and technologies. This was a difficulty throughout the first
several years of the project. A second extension of six months was made to: (i) put in
place incentives for operations and maintenance of the wastewater treatment plant
financed under the Tianjin Urban Development and Environment II Project, for which
construction had been delayed; and (ii) to provide more time for consolidating actions to
better assure the project’s sustainability, and to hold workshops to consider extending the
project approach beyond the HBP area.
3.22 There were no project restructurings or additional financing. Total project costs at
completion ($34.5 million) were close to the appraisal estimate of $33.3 million. The
$17.0 million GEF Grant was virtually fully used, with disbursements of $16.96 million.
Government financed the increase in project costs.
3.23 There were no revisions in targets in the monitorable indicators. Output targets
were met or exceeded. The project components remained virtually unchanged, although
the scope of some components was expanded, notably: (i) the knowledge management
system was extended to cover Tianjin and Beijing Municipalities; (ii) six additional
County Integrated Water and Environment Management Plans were carried out compared
with 10 targeted; (iii) the WUA program achieved 407 WUAs against a targeted 65
WUAs.; and (iv) a study on non-point source pollution was added. While these increases
substantially expanded the project’s achievements, they did not change the project’s basic
design.
3.24 The project was implemented jointly by the Ministry of Water Resources (MWR)
and the Ministry of Environment Protection (MEP). This joint-responsibility extended
through the entire implementation chain: from the center, to the provinces, to the
counties, and, where relevant, to sub-entities such as the waste-water plants and water
user associations. Academics were significantly involved and the impact of their
specialist expertise was enhanced by informally integrating them into project work
programs. The project also made major recourse to international consultants in areas
where domestic experience was limited.
3.25 Other actors included the Ministry of Agriculture, Ministry of Construction,
Ministry of Finance, and provincial and county governments. The Hai Basin Commission
was made responsible for the basin-wide Knowledge Management System. The primary
project coordinating role was through the Project Management Offices. There was a Joint
Project Management Office (PMO) at the center, supported by a “Joint Expert Group” of
specialists. Joint PMOs and Joint Expert Groups were also established in each province
30 It was implemented in parallel with two other Bank financed projects which had some activities
complementing the Hai Basin Project: The Tianjin Urban Development and Environment II
Project, and the Water Conservation Project.

51
sub-basin or extended municipality, and in each of the 16 counties. The local staff of the
Bureaus of water resources and environmental protection, plus other relevant agencies,
joined the PMOs in implementing the project. Technical assistance and training was a
major thrust under the project. Consultant services were projected at appraisal to be 42
percent of total project costs,31 and by project completion 164 training sessions and 57
study tours had been conducted.
Safeguards, Fiduciary Performance and M&E
Safeguards
3.26 The HBP was classified an Environmental Category C project (no environmental
assessment required). As a project targeted on improving the water environment, without
any intended major infrastructure, and with works confined to small structures such as
measuring stations; deleterious environmental impact could be expected to be minimal.
(The Dagu canal and the wastewater treatment plants, funded under the TUDEP 2 project
had individual environmental assessments and management plans). Nevertheless, to
provide for any eventuality, two safeguards were considered triggered at appraisal:
Environmental Assessment (OP 4.01); and Involuntary Resettlement (OP 4.12). An
Environmental Impact Assessment, an Environmental Management Plan and a
Resettlement Policy Framework were prepared for the HBP (all issued in January 2004),
and a screening process was put in place. These frameworks and screening processes
followed Bank guidelines at the time of appraisal. More recently (January 2014) a policy
change regarding indirect effects of technical assistance (such as investments stemming
from IWEMPs) has been issued.32 The guidelines are not relevant to HBP as it was
appraised before they were issued. However, for the benefit of future, similar, projects
the IWEMPs provide an interesting example of the potential for technical assistance to
have indirect social impacts. It may be useful to review the ways in which unforeseen
indirect effects of technical assistance would be relevant in future projects.33
31 A cost breakdown at completion is not included in the ICR, but as project components did not
significantly change during implementation, the actual consultancy costs would likely be in the
same range as the appraisal estimate.
32 “Interim Guidelines on the Application of Safeguard Policies to Technical Assistance
(TA) Activities in Bank-Financed Projects and Trust Funds Administered by the Bank”
(Jan 2014). The guidelines specifically refer to ‘water resources management/planning
studies,” “river basin management studies,” and “agricultural and rural development
planning” as examples. 33 As an example of such impacts, the Tianjin IWEMP identified a pollution threat to the city’s
main reservoir and it was decided to relocate 30,000 people in order to reduce domestic and farm
runoff. Under the new Guidelines, the welfare of the displaced persons would need to be part of
the planning exercise.

52
Fiduciary Management
3.27 According to the ICR, financial management was of good quality and reporting
was regular and timely, and reviewed by Bank staff. Annual auditing was also timely and
no substantive fiduciary issues had arisen. The financial and procurement staff of the
project received training at the beginning of the project which had provided a good
grounding in Bank processes, although it took time for project staff to master
procurement, which was initially slow. The financial manager of the former central PMO
advised IEG that the project had had no problems with disbursement processes. A real-
time management information system tracked procurement and (once staff were familiar
with the procurement and tracking system), resulted in efficient and rapid procurement
processes, despite the large number (23 in all) of province and county PMOs involved
with the project. No cases of misprocurement were reported.
Monitoring and Evaluation
3.28 Design. The activities and outcomes to be monitored were established at the
beginning of the HBP, and included the project’s Monitorable Indicators. There was a
large number of indicators – 12 on outcomes and 17 on outputs. Some covered critical
quantitative measures of water quality and quantity impacts, while others were check-offs
of institutional or organizational achievements. Given the technical sophistication of the
Knowledge Management system, it would have been useful to combine data on ET and
groundwater overdraft with statistics on agricultural cropping and production, so as to
assess the impacts of tightening water allocations. Monitoring was restricted to the 16
project counties. Each county, prior to commencing its project activities, undertook a
baseline survey to serve as the platform for measuring future impacts.
3.29 Implementation. Each province, county and major city had its own M&E team.
For coordination, supervision and compilation of overall project data, an M&E unit was
established in the Central Project Management Office. Most data was collected first by
the county teams, passed on to the provincial teams, and then passed on to the central unit
which compiled the data. A report was prepared every year with consolidated results. An
issue, however, reviewed under efficacy, was the Government clearances and time
required to access some of the data.
3.30 Utilization. Information on project activities was a useful management tool for
assessing project progress, both in terms of outputs and outcomes. The M&E work also
interacted with a number of project activities, notably: for the Knowledge Management
data base, which used part of the M&E data for its data platform and modeling work; and
for (ii) data relevant to preparing each county’s and province’s Integrated Water and
Environment Management Plan.34 In conclusion, the project’s M&E system was
34 Since project closure, the project’s Central Project Management Office has been disbanded,
disrupting the M&E program. However, a number of functions are continuing under different
institutions. Project data for Tianjin City is continuing in the city’s Environment Monitoring
System; and the Knowledge Management Unit has taken on part of the data collection. Also,
some provinces, such as Tianjin, have maintained their M&E program. But since project
completion, comprehensive monitoring of key indicators is either not undertaken or not reported
widely to stakeholders.

53
effective at gathering and processing project output and outcome information, and the
work of the Knowledge Management unit added further sophistication to the overall
M&E capacity. Although data sharing needed improvement, taken overall, M&E
performance during the project period is assessed as Substantial.
Achievement of the Sub-Objectives
3.31 This section reviews first the achievement of project outputs and then turns to
HBP’s efficacy-- the degree to which the project achieved each of its two sub-objectives:
(i) Developing an Integrated approach to water management and improving water
management and pollution control; and (ii) reducing pollution in the Bohai Sea.
Main Project Actions
3.32 Table 3.1 summarizes the main outputs under the project. All of the Appraisal
targets were reached or exceeded. The main actions were related to establishing capacity
in the Counties for preparing the County Integrated Water and Environment Management
Plans. Ten such IWEMPs were to be created, but in the event, the program was expanded
to 16 counties. Backstopping the IWEMPs were a combination of measures: in particular,
revision of the current policies and mechanisms to create an enabling institutional
environment; establishment of an expert group in each county to provide technical
advice; establishment of field-based Project Management Offices for management and
technical support; creation of an interagency committee in each county and province; and
the agreement between MWR and MEP to work as joint implementers of the program.
3.33 The IWEMP program and broader basin objectives were boosted by development
of a Knowledge Management System; an ET management system; and the establishment
of WUAs to implement water savings at field level. The 407 WUAs that were established
greatly exceeded the original intention of 65 WUAs. HBP also provided technical
assistance for two investments financed by another project: removal of contaminated silt
from Dagu canal; and creation of two waste-water treatment plants. As intended, two
Strategic Action Plans were prepared – for the Hai Basin and the Zhangweinan sub-basin.
Twelve studies were also carried out amounting to an array of topics that contributed to
the program (for instance, groundwater management, well permits, wastewater reuse, and
water and pollution management policy). Together, the actions above provided for
achieving the project’s objectives.

54
Table 3.1. HBP – Main Project Outputs
Baseline
(pre-
project
situation
Appraisal
Target Achievement
Achievement as
% Appraisal
Target
Create Inter-agency
Committees for WRM and
Pollution Management
- 10 16 160%
IWEMPs Prepared - 10 16 160%
Coordination structure for
IWEMPs established:
High level Expert Groups
- 25 45 180%
Joint Project Management
Offices Established - 13 23 177%
Policies, Mechanisms and
Instruments for IWEM
developed - Prepare
Prepared and
findings applied to
IWEMPs, SAPs, ET
and KM
n.a
Prepare Strategic Action
Plans (SAPs) for:
Hai Basin
Zhangweinan
- Do Achieved 100%
Establish Knowledge
Management System - Do Achieved 100%
Establish Joint Decision
Making Conference System - Do Achieved 100%
Establish ET Management
System - Do Achieved 100%
Establish WUAs for water
management - 65 407 626%
Strategic Studies - 12 12 100%
Disposal of 2.2 million m3 of
contaminated silt from Dagu
(HBP’s role was technical
assistance
- 2.2 million
m3 6.3 million m3 286%
Technical assistance and
studies for developing
incentives for establishing
and operating waste water
plants in 2 small cities
- Do achieved
Training, workshops and
study tours - -
164 training courses,
57 study tours
Source: ICR.

55
OBJECTIVE 1: DEVELOP AN INTEGRATED APPROACH TO WATER RESOURCE
MANAGEMENT AND POLLUTION CONTROL IN THE HAI BASIN
3.34 An integrated approach to water and pollution management was sorely
lacking when HBP was being prepared. The embodiment of the ‘integrated
approach’ is the creation and implementation of IWEMPS – the integrated plans.
The integrated approach is composed of interacting technical, conceptual,
institutional, and capacity improvements that are reviewed below. Next, the
efficacy of the integrated approach is further evaluated by reference to its impacts
on water quality and quantity.
Conceptual achievements
3.35 The project succeeded in introducing the novel and critically useful
paradigm of consumptive water use (ET) as the focus of concern for water
management and the cornerstone of an integrated approach. After initial early
resistance to the paradigm35, the idea that there should be a cap on ET, and that
efforts should focus on reducing non-beneficial or low value ET, has taken strong
hold with water managers at the pilot county, pilot province and basin levels. The
Hai Basin Master plan 2010-2020, which was endorsed by the State Council,
includes a goal of capping Basin ET. This unprecedented provision is most likely
attributable to the project. At the national level, the State Council’s landmark
“Opinions on Implementing the Strictest Water Resources Management System”
(12 January 2012) sets forth three Red Lines governing water use, the first of
which is to cap water consumption at 700 billion m3 by 2030. This is consistent in
spirit with the idea of capping ET, and it is also likely that the HBP informed the
drafting of the Red Line.
Capacity-building for integrated planning
3.36 The project supported successful development of Chinese capacity to undertake
remote-sensing based measurement of ET. The starting point was a proprietary model,
SEBAL, which dates back at least to 1989. The Institute of Remote Sensing Applications
(IRSA) at the Chinese National Academy determined that this was not accurately
representing local conditions. So, going back to the basic science, they developed their
own algorithms, through a long series of iterative improvements. A validation of the
model was published in an international peer-reviewed journal36, and it is considered to
have advanced the global state of the art. IRSA continues to develop the model, and it is
being applied in a follow-on Bank project in Turpan, Xinjiang.
3.37 Capacity was also developed in the construction and use of hydrological models.
Again this was facilitated by the high level of competence in participating research and
academic institutions. The China Institute of Water Resources and Hydropower Research
developed the basin-level “Dualistic Model,” a highly sophisticated model that combined
economics and hydrology. This model could be adapted for use in China’s many other
35 Noted in interviews with project and government staff.
36 Wu and others (2012).
56
Basin Management Conservancies. The public-domain SWAT model was adapted for
use at the county level and applied by several academic and research units.
Knowledge Management and Data Sharing
3.38 A necessary, and achieved, condition for project success was the formal
agreement between the MWR and MEP to share data and cooperate in the
implementation of IWEMPs. As noted earlier, historically the ministries had maintained
separate water monitoring stations, promulgated mutually inconsistent regulations, and
did not share data. The project succeeded, in the pilot provinces, in breaking down the
silos that separated these and other concerned ministries. At the Basin level, this was
manifest in the creation of Strategic Action Plans for the Hai Basin and Zhangweinan
sub-basin. As an example of how cooperation made a difference at the county level,
Pinggu district personnel cited permitting for new local development projects. Before
cooperation, the petitioner would have to visit each department sequentially. Currently, a
joint meeting of the water, environment, planning, local DRC, agriculture, and land
resources agencies considers the proposal together.
3.39 While the project significantly advanced the sharing of data within counties,
bottlenecks remain and there has been some backsliding. Obtaining data from outside a
county would need to pass through the provincial government and could take weeks or
months. In some counties visited, IEG found that they had ceased to receive ET maps via
the Knowledge Management system after the project closed. Some interviewees
suggested that this was because the financial or staffing requirements for ET data
distribution and use were not mainstreamed. ET maps are not published on the HBC
website. The 2014 concept note (PID) for a follow-on project notes the continued lack of
data-sharing between MEP and MWR as an issue.
Implementation of the IWEMPs
3.40 Based on IEG’s field visits, IWEMPs appear to have been successfully
implemented. While the PAD only planned for ten, 16 were undertaken. Modelling was
not an academic, desk-based exercise. Modelers spent a month in the field interacting
with stakeholders and tuning the model. Model recommendations were specific and were
incorporated in the counties’ five year plans. Thus they were not mere studies, but
guided investments and policies. For instance, Tianjin Municipality created an integrated
Water Resource Bureau, promulgated stricter pollution and groundwater regulations, and
launched a program to renew and construct sewage plants. In practice, though,
adjustments were necessary. For instance, in Pinggu County, a plan to eliminate high-ET
fishponds ran afoul of long leases and had to be deferred.
3.41 The project also supported the completion of Strategic Action Plans for the
Hai Basin as a whole and for the Zhangweinan sub-basin. These are indicative
rather than prescriptive. However, drafting of the more prescriptive Basin Master
Plan is likely to have incorporated ideas from the Hai Basin SAP.

57
ET planning, monitoring and allocation
3.42 ET measurements were important to the formulation of the IWEMPs.
Allocation of ET, at the county level, was set at average precipitation. (So wet
years would recharge groundwater, to be drawn down in dry years.) Measuring
average ET therefore gives counties an idea of how much work needs to be done in
order to reduce water consumption to sustainable levels. ET maps also provide
information on ET requirements of different land uses.
3.43 The sustained contribution of ET monitoring to water management and allocation
is less clear. The Hai Basin Commission, using technology developed by the IRSA,
continued to produce monthly maps of ET in pilot counties. This was available to the
counties during the project’s term. IEG did not find examples of this information’s use
for management. ET is very variable from year to year (see Figure 3.1), complicating its
use as a monitoring tool. In Guantao County, under the pilot for plot-level allocation of
ET, each farming household was assigned an ET quota (translated into a water
withdrawal right). But remote sensing was not used to monitor actual ET at the field
level. Officials of water user associations said that they would be reluctant to enforce
hard quotas. It is worth noting, however, that county level managers can and did take
many actions to reduce ET without directly applying quotas at the household level.
These included expanding the scope of volumetric charges for water, encouraging shifts
to cropping patterns with lower ET demands, and setting and monitoring limits on water
usage by industries and towns.
Strategic Studies
3.44 The eight strategic studies,37 all of which were completed, appear to have had
significant impact. Although quantification of benefits is not possible, in the combined
view of MWR and MEP, each has served a purpose. As examples: the Review of How to
Apply Water Rights and Well Permits for Sustainable Groundwater Management was
directly relevant to water and pollution planning and management by IWEMPs, as was
the Review of Water Savings and Efficient Water Utilization. The Study of Water and
Pollution Planning and Management was also useful. The Study of Wastewater Reuse
had direct bearing on urban water planning. And there was a more policy related Study
on Water Policy, the Legal Framework and Institutional Arrangements. The ICR
comments (page 26) that the studies also informed: National policy and water laws; the
State Council’s “Number One Document for 2011;” and the “Three Red Lines” water
policy. The Studies also provided background for the Hai Basin Master Plan, and the 12th
Plan proposals at basin, provincial and county levels.
37 The Strategic Studies were: (i) Policy and Legal Framework and Institutional Arrangements;
(ii) Bohai Sea Linkage; (iii) Countermeasures for the Protection and Measurement of the Water
Ecological System; (iv) Water Savings and High Efficiency Water Utilization; (v) Administration
of Water Rights and Well Permits, and Sustainable Groundwater Exploitation; (vi) Wastewater
Reuse; (vii) Water Pollution Planning and Management; and (viii) Rationalization of Beijing
Water Resources.

58
Impact on water management
3.45 Although the outcome relates to the development of an integrated approach – as
manifested in the creation of processes that resulted in IWEMPs – it is possible to go
further and look at the impacts of that approach. The project reported impacts on water
management and on pollution. These impacts are the result of the project-sponsored
planning process together with the physical investments and policy changes sparked by
those plans.
3.46 The key water management need was to reduce the unsustainable consumption of
water and to improve its effectiveness. The former would reduce the rate of drawdown of
groundwater resources which had depleted water tables in the Hai Basin at an alarming
rate over the last two decades. The IWEMPs were the basis for most water-saving
activities attributable to the project, and their impact would primarily have been from a
combination of measures decided on in the planning process and as the IWEMPs were
put into implementation. Typical measures taken under the IWEMPs which could be
expected to have had impact included:
Establishment of Water User Associations (some including community driven
development features), including imposition of volumetric water charges,
sometimes together with remote metering of pumps and prepaid card access to
pumped water.
Reducing irrigation conveyance losses by changing from channel to piped
conveyance.
Conserving domestic water use through encouraging households to install new
water conserving taps, toilets and washing machines.
Conserving industrial water use through setting targets for large companies to
reduce water consumption.
Preparation of groundwater allocation plans.
Tariffs reform for water savings.
Crop shifting, including shifts away from winter wheat, from open-field
vegetables to greenhouses, and from wheat/maize to cotton.
3.47 In addition, a study and a demonstration on administration of water rights, well
permits and sustainable groundwater exploitation contributed to the knowledge base for
reducing overexploitation, and another study focused on water savings and high
efficiency water utilization
3.48 Reported overexploitation of groundwater dropped dramatically. The PAD had
targeted a reduction in the overdraft of 10%. The reported reductions were much
steeper: a 63% reduction in overexploitation of shallow groundwater and a 46% reduction
for deep groundwater, for an overall reduction of 390 million cubic meters (see Figure
3.1.) The biggest reductions were for shallow groundwater in Beijing and Hebei, and
deep groundwater in Tianjin.

59
Figure 3.1. Groundwater Overexploitation by Area and Year
Note: water exploitation in units of 104 cubic meters; Zhangweinan is not a province but a sub basin under which some
counties are grouped.
Source: IEG based on project M&E data.
3.49 There is inconsistency between data on groundwater exploitation and ET data.
According to the project’s logical framework, the reduction in groundwater extraction
should have been accompanied by a reduction in ET. While there was a drop in overall
ET from 2004 (the baseline year) to 2005, there was no subsequent trend in ET
(measured either by remote sensing or via traditional water balance calculations.)38
Figure 3.2 shows the evolution of ET over time by county. It shows, for each year, the
difference between that year’s ET and the target ET level set for 2010. Positive numbers
indicate water consumption above the target. In Beijing, Hebei, and Tianjin there was a
drop in ET from 2004 to 2005. Because the IWEMPs were not yet formulated and
implemented, it is difficult to attribute this drop to the project. However, the picture is
not entirely uniform. In Dezhou County, there was a substantial drop in ET over the
whole period.
38 A linear regression of county ET on time, with dummies for counties, did not find a statistically
significant relationship after 2005 either with project M&E data for 2004-2010 or for an extended
ET data series covering 2002-2012. Nor was there a time trend for agricultural ET.

60
3.50 In part, the overall reduction in groundwater over extraction may be explained by
a trend over the period 2006-10 for increased rainfall. A regression of county-level
precipitation on time, with county-level dummies, showed an increase of 24.6 mm/year, a
substantial amount. Given a lack of trend in ET, this would generate a favorable water
balance and would permit a reduction in groundwater overdraft. Conceivably, constant
ET and reduced groundwater extraction could be consistent with reduced outflows to the
sea, or increased water transfers from other basins. Finally, each source of water
information – groundwater pumping, remote-sensing ET, and water-balance ET -- is
subject to measurement errors of different kinds. Some groundwater use may be
unreported. Remote-sensing ET is novel and depends on complex assumptions and
interpolations. Water-balance ET is derived from possibly inaccurate stream and rainfall
measurement. The bottom line is that while it is plausible that the project reduced
groundwater over extraction, the inconsistency with ET data makes it impossible to
confirm this impact.
Figure 3.2. Trends in Actual Minus Target ET by County
Note: Graphed quantity is actual ET (year) – target ET (2010) based on remote sensing measure of ET. Positive values represent
excess consumption, negative values represent reduction of water consumption below the target. Zhangweinan is not a province.
Target is for 2010. Source: IEG calculations based on M&E data.

61
Impact on county-level pollution
3.51 Pollution control was one of the “three red lines” established by Government in
2012, and received significant attention. The IWEMPs and preparation of the Hai and
Zhangweinan Basin SAPs prioritized control of pollution as well as better management
and allocation of the overall water resources. The IWEMP approach was essential
because the type, source and mix of pollutants varied greatly between counties.
3.52 Project-wide there were large reductions, in absolute and relative terms. (Table
3.2.) The reductions greatly exceeded targets, and there was a progressive decline over
the project period of all three commonly measured contaminants: sewage, COD and
NH3-N. Figure 3.3 presents the data for contaminants discharged to rivers. Sewage
discharge in 2010 was 70 percent of discharge in 2005; COD discharge was 38 percent of
2005 discharge; and NH3-N discharge was 41 percent of the 2005 level.
Table 3.2. Pollution Loads to Rivers and to Bohai Sea
Baseline
Amount of Contaminant Discharged
to Rivers
Amount of Contaminant Discharged to
Bohai Sea
AMOUNT OF
SEWAGE
(104 TON)
COD
(TON)
NH3-N
(TON)
AMOUNT OF
SEWAGE
(104 TON)
COD
(TON)
NH3-N
(TON)
38701.4 108372.7 12152.9 6244.1 18661.4 1821.6
2005 36829.8 101790.3 11196.6 6634.8 20096.0 1399.6
2006 29902.1 83728.3 9453.1 3595.1 8523.0 913.2
2007 27792.2 64143.5 8256.2 3379.4 8927.6 923.8
2008 27623.5 59998.7 7380.5 3343.8 7968.6 855.0
2009 24960.9 40133.1 5562.9 2676.7 6613.4 750.0
2010 25767.3 38614.8 4665.3 5531.0 6951.0 804.7
Reduction 12934.0 69757.9 7487.6 713.1 11710.4 1016.9
2010
target
35229.1 91727.3 10508.0 5143.5 8468.3 820.5
Source: Project M&E data.

62
Figure 3.3. Amount of Contaminant Discharged to Rivers – 2004 to 2010
Source: HBP M&E data.
3.53 This success was widely shared among the counties. (Figures 3.4-3.6) The graphs
show the ratio of the pollution in each year to the target level for 2010. For most
counties, targets were set about 10% below the initial level, so that ratio for 2004 was 1.1
By 2010, most counties were polluting at levels well below their target (a ratio less than
1), indicating a successful reduction. For instance, Xinxiang’s nitrogen ratio for 2010 was
.209, indicating a reduction of 80.1% below the target. A few counties, such as Hangu,
stand out for achieving large absolute and relative reductions. Unfortunately comparison
data are not available for counties outside the project area, so it is not possible to rule out
the possibility that reductions are due in part to some contemporaneous national policy.
39 37 30 28 28 25 26
108 102
84
64 60
40 39
12 11 9 8 7 6 5 0
20
40
60
80
100
120
Baseline 2005 2006 2007 2008 2009 2010
Am
ount
of
Co
nta
min
atnt
Dis
char
ged
to R
iver
s (t
ho
usa
nd
to
n)
Amount of sewage COD NH3-N
N Target 10.5
Sewage Target
35.2
COD Target
91.7

63
Figure 3.4. Trends in COD Pollution, by County (normalized by target level of
discharge)
Note: logarithmic scale. Graphed quantity for each year is pollution (year)/pollution target (2010). E.g. a ratio of 1.1 indicates
pollution discharge 10% above target levels; a ratio of 1.0 indicates achievement of target; a ratio of 0.9 indicates a reduction
of pollution by10% below target. Thickness of line proportional to absolute quantity. Source: IEG based on project M&E data.

64
Figure 3.5. Trends in Sewage, by County (normalized by target level of discharge)
Note: logarithmic scale. Graphed quantity for each year is sewage (year)/sewage target (2010). E.g. a ratio of 1.1 indicates
pollution discharge 10% above target levels; a ratio of 1.0 indicates achievement of target; a ratio of 0.9 indicates a
reduction of pollution by10% below target. Thickness of line proportional to absolute quantity. Source: IEG based on project M&E data.
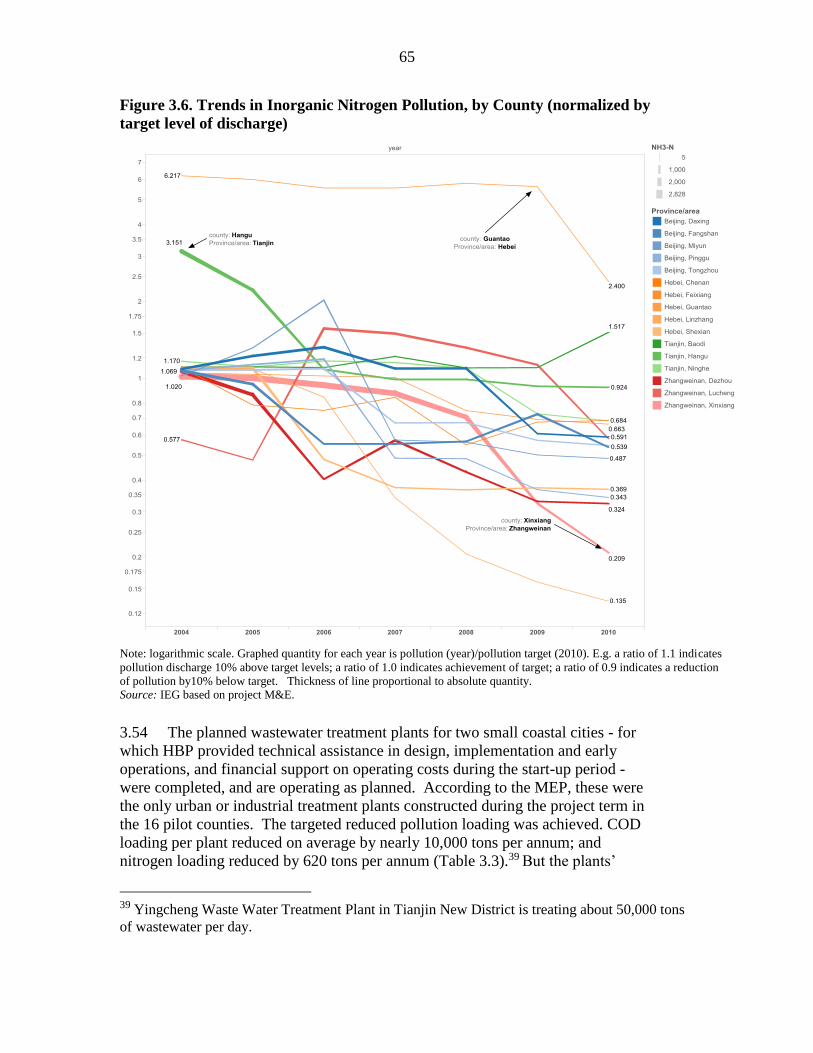
65
Figure 3.6. Trends in Inorganic Nitrogen Pollution, by County (normalized by
target level of discharge)
Note: logarithmic scale. Graphed quantity for each year is pollution (year)/pollution target (2010). E.g. a ratio of 1.1 indicates
pollution discharge 10% above target levels; a ratio of 1.0 indicates achievement of target; a ratio of 0.9 indicates a reduction
of pollution by10% below target. Thickness of line proportional to absolute quantity. Source: IEG based on project M&E.
3.54 The planned wastewater treatment plants for two small coastal cities - for
which HBP provided technical assistance in design, implementation and early
operations, and financial support on operating costs during the start-up period -
were completed, and are operating as planned. According to the MEP, these were
the only urban or industrial treatment plants constructed during the project term in
the 16 pilot counties. The targeted reduced pollution loading was achieved. COD
loading per plant reduced on average by nearly 10,000 tons per annum; and
nitrogen loading reduced by 620 tons per annum (Table 3.3).39 But the plants’
39
Yingcheng Waste Water Treatment Plant in Tianjin New District is treating about 50,000 tons
of wastewater per day.

66
significance goes beyond their direct impact. Their main utility may be in piloting,
as intended, the introduction of incentives for investors to build, operate and
maintain such plants. Towns had found a lack of interest from investors as charges
for wastewater removal were too low. Under the project, subsidies on O&M were
provided to investors until treatment charges had increased. Initial experience
appears positive. According to government officials, the treatment plants are
serving as demonstrations for other cities, many of which do not have such
facilities.
Achieving Integrated Water and Pollution Management
3.55 HBP set in place and guided initial implementation of an entirely different
form of water and pollution management based on close and synergistic interaction
both at central level and in the counties. This was accompanied by innovations in
key technical areas, a number of which were state-of-the-art. Pollution control
appears to have benefitted considerably, although results for water savings are
complicated by conflicting data. Performance in modelling, and knowledge
management was excellent, but ease of access to data is variable, and needs
improvement. The data problems bring an otherwise high performance to
Substantial Efficacy.
OBJECTIVE 2: REDUCE POLLUTION IN THE BOHAI SEA
Actions
3.56 The project reduced inflows to the Bohai via actions under the county and city
based IWEMPs and via technical assistance for constructing the two waste water plants
and de-silting the Dagu canal (see below), both of which were successfully completed.
The main impacts on Bohai Sea inflows are assumed to follow from the overall pollution
reductions stemming from the IWEMPs.
3.57 The excavation of Dagu canal got rid of three times more contaminated silt than
anticipated. The operation removed a major source of pollution - based on comparing
nitrogen levels, the contaminated sediment removed from Dagu canal on a one-time basis
was equivalent to about 27 times the target annual contaminant removal rate of a small-
city waste water treatment plant).40 However, there is no information on the extent to
which the cleanup affected ongoing flows of pollution from the Dagu into the Sea.
Impacts of the wastewater plants and the Dagu canal cleanup cannot be fully attributed to
the HBP, which provided only technical assistance.
Impacts
40 From the “Outcomes and Applications of Hai River Basin Integrated Water and Environment
Management Project, 2012, China Government: Foreign Economic Cooperation Office, Ministry
of Environmental Protection; Irrigation and Drainage Development Center; and Hai Water
Conservancy Commission, Ministry of Water Resources.

67
3.58 The project substantially exceeded the targets set out at appraisal as shown for the
monitorable indicators in Table 3.3. The reduction of COD and nitrogen pollution loads
into the Bohai Sea was 240 percent more than appraisal targets. The reduction in
nitrogen inflows of about 1000 tons/year is a reduction of about 3% in annual flows into
the Bohai, and represents a reduction of about 9% in the excess of flows over assimilative
capacity.41 The COD reduction represents about 3% of the total assimilative capacity for
this pollutant. Table 3.3 shows reduction of contaminants discharged to the Bohai Sea
over time.
3.59 Of the total reductions in pollution inflows, about a quarter of the COD reductions
and an eighth of the nitrogen reductions are associated with the two small wastewater
plants. Since the plants were financed outside the HBP, this portion of the reduction
cannot be fully attributed to the HBP.
Table 3.3. Output and outcome Indicators Related to Reduced Pollution of the
Bohai Sea
Indicator Appraisal
Target
Achievement
/Percent of Target
Reduce discharge pollution load to
Bohai sea from pilot counties by
10% (in ‘000 tons/annum) (As
measured by chemical oxygen
demand (COD) and all nitrogen
(Baseline: NH3-N.) COD 164 NH3-
N 19)
By 10% i.e.
COD reduced by
16,400
tons/annum
NH3-N by 1,900
tons per annum
Achieved: COD: 38,615 tons/annum
(reduction 235 % greater than target
reduction)
NH3-N: 4665 tons/annum (reduction
245% greater than target reduction)
Reduced annual pollution loading to
Bohai Sea from two Tianjin small
wastewater plants
Reduction of
COD 10,000
tons/annum per
city NH3-N 500
tons/annum per
city
Achieved: Waste water treatment
plants were established in two small
cities and average pollutant discharge
was: COD 9,855 tons (98% of target);
and NH3-N 620 tons (124% of target)
Disposal of 2.2 million m3 of
contaminated sediment in Dagu
canal, and achieve a one-time
reduction of 10,000 tons of oil, 2,000
tons of Zinc, and 5,000 tons of total
nitrogen.
As indicated
Achieved: Removal of: Sediment 6.3
million m3 (286% greater than target;
oil 28,670 t (186% more than target);
Zinc 1,822 tons (91% more than
target); and total nitrogen 13,379 tons
(168% more than target)
Note: HBP provided technical assistance during design and implementation of both the wastewater plants
and Dagu canal desilting and provided TA to the two wastewater plants at their completion to devise
financing and operating plans. HBP also provided some financial support to the wastewater plants during
early operations. Civil works for both the Dagu canal and wastewater plants was financed under the TUDEP
II Project. Source: ICR.
3.60 The project’s direct impact on the overall condition of the Bohai Sea itself is
necessarily limited. First, a declining portion of river pollutants - between 18 and 31
41 Based on Special Study 2, as cited in the Outcomes and Applications.

68
percent depending on contaminant – actually reach the sea. This is because increasing
water demands have reduced the flows of the rivers leading to the Bohai Sea.42 Of seven
major rivers leading to the Sea most are dry or seasonal. As noted earlier, flows into the
Sea have drastically declined since the 1950s. With reduced flow, pollutants tend to be
trapped as contaminated silt on river banks or shallows. Thus, ironically, long-term
success in capping water demand in the Hai Basin, which is essential for sustainability of
supply, will tend to increase pollutant flows into the Sea unless there is further mitigatory
action. Second, as noted earlier, most of the pollution entering the Bohai Sea comes from
rivers other than the Hai.43
3.61 In summary, the HBP effected a small but measurable relative reduction in
pollutants entering the Bohai Sea, surpassing its reduction targets several fold. As a pilot
project working on just one of the rivers entering the sea, it could not be expected to have
a large direct impact. The main value of the project is that it demonstrated practical and
replicable ways to incorporate pollution management as a key part of an integrated water
and environment management project. However, no significant scale-up has yet taken
place. A follow-on GEF project, currently in the planning stage, seeks to upscale the
approaches demonstrated in HBP. Based on achievements so far, the efficacy of HBP’s
objective of reducing pollution in the Bohai Sea was Substantial.
Efficiency
3.62 An economic rate of return for the HBP was not calculated in the ICR (or PAD)
on the grounds that benefits could not be quantified. In principle it would be possible to
attach economic value to the pollution reductions, based either on alternative abatement
costs or on marginal values of health or other damages, but such parameters are debatable
and were not found. It is slightly easier to assign shadow values to water. The value of
water in northern China is evidenced by the huge investments in the South-to-North
water transfer scheme. Since water is fungible between sectors, it is reasonable to take
the value of urban water as a shadow price. The urban household tariff of 5 yuan/m3 is
subsidized, and can be taken as a lower bound to the shadow price. China introduced in
2004 a tariff for large commercial users of 160 yuan/cubic meter, which might be taken
as an upper bound to the marginal value of water.
3.63 As an illustrative calculation, let us suppose that the only water savings
attributable to the project were in Dezhou County, where ET declined 100 mm during the
course of the project. If this decline is entirely attributed to the project, it means that 53.9
million m3 were saved annually. Valued conservatively at the subsidized household tariff
rate, this represents an annual benefit of more than $43.1 million. The commercial tariff
42 In the Hai basin, discharge from the river to the Bohai Sea dwindled from an annual average of
24 m3 in the 1950s to 1 billion m3 in 2001 Y Jiang (2009). China’s Water Scarcity. April 2009.
43 Source, all data: Outcomes and Applications of Hai River Basin Integrated Water and
Environment Management Project, 2012, China Government: Foreign Economic Cooperation
Office, Ministry of Environmental Protection; Irrigation and Drainage Development Center; and
Hai Water Conservancy Commission, Ministry of Water Resources.

69
implies a valuation of $1.4 billion/year –the amount is not credible, but emphasizes the
value attached to the marginal consumption of water and underlines that the true value
would be much higher than $43 million. Against these benefits would be set the cost of
the HBP ($34.5 million) together with the costs of implementing the actions, such as
improving irrigation or abandoning fishponds that caused ET to decline. This illustrative
calculation suggests that even modest water savings, together with modest values
attached to pollution reduction, would imply a very high economic rate of return to the
project. This would especially be true if benefits were achieved at low economic cost (or
with net benefits), for instance by closing uneconomic polluting businesses or by
instituting volumetric water charges that reduced wasted water.
3.64 Another indicator of project efficiency was the overachievement of key targets.
Most importantly, IWEMPS were conducted for 16 rather than 10 counties, representing
a greater than planned uptake of the ‘integrated approach’. In addition, the projects
established 407 WUAs against the planned 65.
3.65 It is also possible to comment on the efficiency of management and
implementation.
Costs. The total project costs at project completion of $34.5 million were only 3
percent above the costs estimated at appraisal. Costs by component were also
close to original estimates.44
Management. Financial management and procurement were effective
(Procurement involved 23 Project Management Offices requiring a close overall
management).
Implementation. The project was implemented largely as planned; with no
changes in objectives, components and monitorable indicators.
Outputs. All planned activities were implemented, and monitorable indicators
were achieved (the number of participating communities and WUAs greatly
exceeded targets).
Implementation period. Half of the one-year extension was due to factors outside
the control of the project: technical assistance for operationalizing the wastewater
plants was delayed because plant construction was behind schedule.
3.66 In summary: The HBP was implemented as planned with no changes in
objectives and no substantive changes in components. It achieved or exceeded all
implementation targets, including overachievement of IWEMP implementation. Costs
were only marginally above appraisal estimates, and financial management and
procurement were tightly managed. While it is not possible to compute a precise
economic rate of return to tangible gains in water quality and quantity, under plausible
assumptions the return is high. The project introduced significant institutional changes
that would improve overall efficiency, including a paradigm shift on water management.
HBP’s efficiency is assessed High.
44 The implied efficiency of expenditures assumes that project costs themselves were efficient at
time of appraisal.

70
OUTCOME
3.67 HBP’s objectives were highly relevant to China’s critical need to better manage
and conserve its water and protect the water environment. Water availability per capita
was well below other countries, demand for water was growing rapidly, and pollution of
groundwater, rivers and other sources for domestic and agricultural needs was increasing
apace. The objectives were also relevant to ensuring the health of the Bohai Sea, a shared
international resource on which fishers depend.
3.68 The project was not sized to meet the ambitious goal of reducing pollution in the
Bohai Sea. Rather, it was tailored towards the goal of demonstrating approaches, which,
if replicated, could meet that objective. The design was appropriate for the goal of
developing an integrated approach to water/environment management. At the core was a
change in the concept of water management, to water savings rather than water supply;
and the planning and management of water and pollution together in an integrated
approach. The various measures to manage water at county and community levels were
more responsive than the traditional centralized system. And, as a pilot project, there
were significant studies, demonstrations and pilot activities, including state-of-the-art
innovations such as the project’s knowledge management and evapotranspiration
initiatives.
3.69 With regard to the first objective, an integrated approach to water and pollution
management was adopted and institutionalized via county Integrated Water and
Environment Management Plans and basin level Strategic Action Plans. Important
strides were made in inter-ministerial cooperation and in knowledge management.
However, advances in knowledge management were partially reversed after project
closure and inter-ministerial cooperation has not continued to expand. In terms of
impacts of the integrated process, pollution discharges declined dramatically and
groundwater over-extraction reportedly declined. The latter report is however
inconsistent with a lack of reduction in ET, and a counterfactual is not available for the
former. The mostly high quality of HBP’s performance with integrated water and
pollution management is reduced by the project’s uneven performance in sustained
sharing of data. Based on HBP’s performance overall, the project’s Efficacy in
developing an integrated approach to water and pollution management was Substantial.
3.70 Concerning the second objective, Efficacy was also Substantial. The absolute
reduction in pollutant discharge to rivers and to the Bohai Sea exceeded plans, in most
cases by a large degree. However, the relative impact on the Sea is small – to be
expected from a small project compared with a large body of water such as the Bohai
Sea. The more important benefit of the project is in demonstrating approaches that could
be scaled up throughout the area that drains in to the Sea. A planned follow-on project
proposes to do this.
3.71 The broader worth of HBP is its developing impact on Chinese water policy and
investments – and its potential impact beyond China. The new paradigms introduced by
the project -- in water savings rather than water supply; the integrated, model-based
approach to water and pollution management; and knowledge-based planning -- are
significant changes from the past, with potential to substantially improve water

71
conservation, control groundwater exploitation, and reduce pollution. And the
introduction of remote-sensing based monitoring of ET has the potential to facilitate
sustainable management of water resources.
3.72 The Ministries of Water Resources and Environmental Management advised the
IEG mission that these practices, or variants of these practices, are being integrated in a
number of projects including the government-financed Wei River Rehabilitation Project.
Management of ET is central to three newer Bank projects in China: the planned follow-
on Phase II of the HBP (Mainstreaming Integrated Water and Environment
Management), the $160 million Water Conservation Project II (FY12-17), and the $204
million Xinjiang Turpan Water Conservation Project (FY11-17). The ET management
and monitoring concept has also been introduced by the Bank to projects in the Middle
East and North Africa. Moreover, the Ministries also advised IEG that they are working
to include the Hai Basin Project’s approach in China’s 13th Plan (2016-2020). And, in
the view of a senior manager in the Ministry of Environment Management, out of 30
internationally financed water projects covering all of China’s major basins, the Hai
Basin Project has “had the greatest learning impact.”
3.73 Summarizing, HBP’s ratings are: Relevance of Objectives – High; Relevance of
Design-Substantial; Efficacy in developing an integrated approach to water resources
management in the Hai Basin-Substantial; Efficacy in reducing pollution in the Bohai
Sea-Substantial; and Efficiency-High.
3.74 On the basis of the ratings for relevance, efficacy and efficiency, the Outcome of
the HBP was Satisfactory.
RISK TO DEVELOPMENT OUTCOME
3.75 The project has had a number of impacts that are likely to be enduring.
It has contributed to building high-level capacity in remote sensing of ET and in
hydrological-economic modeling of river basins. Organizations with these
capacities are able to seek funds for continued elaboration and application of this
work.
It has set up MEP-MWR cooperation in the pilot counties.
It has introduced the concept of ‘real water savings’ and ET management,
changing the way that water management is regarded at least in the Hai Basin and
probably to a wider set of practitioners.
3.76 However, as noted, some operational aspects of the program have deteriorated
since project closure. Evapotranspiration maps are still being assembled by the Hai Basin
Commission, but this information is no longer being shared with all of the pilot counties,
let alone expanded to others. This is inconsistent with the goal of operationalizing the use
of ET for monitoring and water allocation.
3.77 The issue appears to reflect a lack of mainstreaming and operational financing of
the project’s innovations. Some operations were undertaken by project management staff
or funded by the project. With the close of the project, functions and staffing have not

72
always been continued. Likewise, it is not clear that there are resources to revise
IWEMPs as conditions change and new planning horizons kick in.
3.78 Finally, while MEP and MWR continue to cooperate in the pilot areas, the gulf
between them persists elsewhere. Demonstration of real benefits to cooperation in the
pilot counties was not sufficient to spark replication.
3.79 At this writing, a follow on project on “Mainstreaming Integrated Water and
Environment Management” is under preparation. Nevertheless, based on the current
situation, the Hai Basin Project Risk to Development Outcome is rated Significant.
BANK PERFORMANCE
Quality at Entry
3.80 The Bank conceived a project of major strategic significance to China’s critical
need for more productive and environmentally sustainable water management. The Bank
brought to China a new “water saving” concept and technologies, starting a fundamental
change in how water was managed. A variety of innovations were brought in, with
support from a strong task team and recourse to specialists as needed. Preparation was
thorough and marked by a close engagement with Government on the new concepts,
technologies and institutional arrangements. In difficult aspects such as the joint-
responsibilities of two agencies, and government through administrative rather than
hydrological boundaries, practical alternatives were found. Quality at Entry was strong in
conceptual, technical and innovatory features. However, the design of the project was
not consonant with the ambitious stated goal of reducing pollution into the Bohai Sea,
given that the Hai Basin is a small contributor to the overall pollution load. Quality at
Entry was Satisfactory overall.
Supervision
3.81 Regular supervision activities were fully satisfactory: implementation difficulties
were handled expeditiously and practically; supervision missions were regular and about
twice a year; and reporting was thorough, including of fiduciary, safeguards and other
matters.
3.82 The Task Team contained a good balance between project administration
experience and technical specialists, supplemented with consultants as needed. The team
was thereby able to provide the detailed guidance required to get the project’s new
approaches and technologies underway. Learning for government, implementation staff
and visitors from other countries was encouraged and is continuing. This includes
organization of study tours for delegations from Morocco and Latin America, and follow-
on projects in Egypt. Data sharing issues were brought up with Government and the
implementing agencies, but structural disincentives limited sharing achievements.
Nevertheless, the team established a good partnership with Government, promoting
cooperation between agencies, joint reporting by MWR and MEP, and building
“ownership” in the project. A particularly difficult area was to change mind-sets amongst
engineers and others about the new approaches to water and environmental management.
Through workshops, arrangement of study tours and other means, the team effectively

73
helped Government to change such attitudes. In particular, the team excelled in
promoting an ambitious and innovative program to ultimate success, despite the
challenges that this entailed. For the Bank, the project provides an example of “Learning
through Lending.” Recognizing that the Bank had limited leverage on data sharing
shortfalls that were interlinked with governance, the Quality of Supervision was Highly
Satisfactory.
3.83 Taking account of both Quality at Entry and Supervision, the overall Performance
of the Bank was Satisfactory.
BORROWER PERFORMANCE
Government
3.84 Although there was some initial skepticism about the new concepts for water
resources and pollution management that the project would introduce, the Central
Government was an active participant during project preparation despite a relatively long
project preparation process and the uncertainties regarding project results. Confidence
grew over time including at provincial and county levels, and commitment grew and
became strong as implementation proceeded. The uncertainties at the outset of the project
were to be expected, and overcoming them – through intensive training and technical
assistance both for regional Government staff and for the regional representatives of the
involved technical ministries – was a difficult but ultimately successful endeavor.
Interestingly, both Government and the Bank Task Team advised IEG that convincing the
regional staff who would be the hands-on project implementers of the new paradigms,
was possibly the project’s most significant achievement.
3.85 Government commitment was strong throughout the project and a close working
relationship was established with the Bank. Provision of counterpart funds was timely
from the center. It was delayed in the first six months of the project at provincial
government levels and this was one of the reasons for the slow project start-up. MWR
and MEP, which were effective managers and were jointly responsible for the project,
worked together closely, an important break from the past when the two ministries had
little contact with each other. However there is still need for more effective data sharing
between the counties and provinces, and ultimately, the central, provincial and county
governments have the means to make this happen. The Ministry of Finance provided an
important bridging role between the agencies.
3.86 In summary, although counterpart funding from the provinces was initially
delayed, and data sharing difficulties were not resolved, the larger picture is
Government’s achievement in driving a complex project forward, to become by
completion a new approach and national policy for one of China’s most essential
resources. Nevertheless, more have been done to resolve data sharing constraints and
Government’s Performance is rated Satisfactory.
Implementing Agencies
3.87 The two Joint Directorate teams from MWR and MEP who jointly managed the
project, and the Central Project Management Office (CPMO), were highly effective in

74
coordinating and motivating the regional governments and the field staff of the entities
involved. This included setting up and training the provincial and county Project
Management Offices, and bringing, with associated training, staff of the technical
agencies into the work programs, in particular for preparing the IWEMPs. Partnership
with the Bank team and consultants was strong.
3.88 Building confidence in the new approaches was particularly needed at the
provincial and county levels, requiring significant outreach by the CPMO at both political
and field implementer levels. The CPMO, the provincial and county PMOs, the province
and county based agencies (MWR, MEP, urban and others), and stakeholders such as the
cities, did well in achieving this transformation, and in completing a particularly
ambitious project, mostly within the intended time-frame. However, the MWR and MEP
as implementing agencies could have done better in ensuring sustained and expanded
data-sharing, an important element of the Knowledge Management program. The
Performance of the Implementing Agencies was Satisfactory.
3.89 The overall rating for Borrower Performance is Satisfactory.
4. Lessons on Three Themes
4.1 This chapter reviews three cross-cutting aspects of the projects: (i) promoting
sustainable management of water and agriculture; (ii) climate change adaptation, and (iii)
learning through lending. It discusses what worked well, what could have been improved,
and lessons for the future. It concludes with a summary of lessons.
PROMOTING SUSTAINABLE MANAGEMENT OF WATER AND AGRICULTURE
Challenges
4.2 China faces tremendous challenges in sustainably managing water and
agriculture. Precipitation in the north is decreasing and will probably become more
variable, so water supply is declining. At the same time, there is increasing demand for
food – and therefore for water, since agriculture is the main user. Many rivers are running
dry to the sea and groundwater is being unsustainably drawn down. Overuse of fertilizer
and pesticides poses downstream environmental hazards, including eutrophication and
red tides and Industrial and domestic pollution exacerbate these problems.
4.3 This situation raises the difficult institutional challenge of managing finite water
resources within a river basin – a problem which requires understanding and dealing with
trade-offs among water uses and users. There were three severe obstacles to solving this
problem. First, river basin boundaries do not coincide with the established provincial and
county level governments. Moreover, efforts to establish river basin commissions in most
of the other major river basins in China had run up against the classic difficulty of limited
recognition of the commission as an authoritative body.45 Second the environmental and
45 For instance, comments such as this: “Although China has established basin
commissions for major rivers and lakes to promote integrated basin management, these

75
water authorities had overlapping and inconsistent mandates, and yet did not coordinate
with one another. Third, there was a lack of integrated knowledge of water use and water
quality, and a lack of understanding on how different scenarios would affect water flows
and economic conditions
Interventions
4.4 To confront these challenges, the three projects introduced a set of
complementary innovations. IAIL3 fixed dilapidated irrigation canals, introduced
productivity-enhancing and water-saving agricultural practices, and supported farmer
organizations to better manage water and to boost profitability. It also supported
integrated pest management and reduced fertilizer application. MCCA reinforced IAIL3
by emphasizing activities that not only saved water, but were more resilient to
temperature changes and extreme events such as drought and floods to changes in
precipitation timing.
4.5 In contrast to the farm and community-level interventions of IAIL3/MCCA, the
Hai Basin IWEMP addressed the institutional coordination issues at the county, province,
and basin level. The project’s contribution was in finding a pragmatic way to operate
effectively within the government structure and to bring the key agencies involved with
water together to work jointly on comprehensive water management. It also introduced
technical tools for planning and for monitoring actual consumptive water use.
What worked well
4.6 The IAIL3 interventions succeeded in boosting physical yield, water productivity,
crop value/kg, and irrigation efficiency, with the result that farmer incomes increased
substantially without significantly boosting total water demand. There was success in
implementing purely technical improvements, such as irrigation repair and land-leveling,
as well as changes in farm practice and community organization, such as WUA
management of water (via rationing or fees) and farmer association/cooperative efforts to
commercialized agriculture. MCCA smoothly integrated a number of climate change
adaptation practices, including greater resilience to floods and droughts.
4.7 At the institutional level, HBP succeeded in introducing meaningful, technically
rigorous and integrated planning, informed by consultation. These were not mere paper
plans, but documents that informed policy and implementation. A key element of this
success was the initiation of cooperation and data-sharing between environmental and
water authorities. The Hai Basin Commission’s capacity was improved with respect to
modeling and data collection and management.
basin commissions have limited power to allocate water resource, coordinate water
resource exploitation and conservation, and enforce water resource planning at the basin
level.” (Yong Jiang, April 2009. “China’s Water Scarcity.” In Journal of Environmental
Management).

76
4.8 Together the projects succeeded in introducing a new paradigm for thinking about
water management. It focuses managers’ attention on actual, rather than apparent water
consumption, and on the need to restrict total consumption to sustainable levels. This
paradigm is an essential tool for water-scarce regions such as the 3H Basin.
Areas for further attention
4.9 To achieve sustainability of land and water use, it is necessary to combine the
field-level interventions of IAIL3/MCCA with the watershed level interventions of HBP.
Most of the water savings from irrigation efficiency under IAIL3 were used to support
increased output, so that absolute water savings may have been small. On the other hand,
the IWEMPs developed under the HBP were often predicated on the kinds of actions
undertaken by IAIL3, so further coordination is desirable.
4.10 At the watershed level, there remain obstacles to cooperation among
administrative units and between ministries. While data-sharing between MEP and
MWR has been institutionalized within pilot counties, it does not always occur smoothly
elsewhere. ET data is not always transmitted to counties. Downstream counties and
provinces may not have easy access to data from upstream neighbors. It may be useful to
explore ways of boosting incentives for wider data sharing at the Hai Basin Commission,
MEP and MWR.
4.11 The technical success in timely and accurate measurements of ET is noteworthy.
Operational application of these measurements is less evident. Partly this is due to the
complexity of the task. In many ways the application of ET measurement in the ongoing
Xinjiang Turpan project is easier because of the simpler hydrology. In Turpan, there is
essentially no precipitation, with water coming from runoff from distant mountains, and
fields are larger and thus more easily monitorable. In the Hai Basin, in contrast, it is
much more difficult to separate the signal of ET management from the noise of changing
weather conditions. In these conditions it may not be realistic to aim for operational use
of ET for monitoring water use at the WUA or plot level.
4.12 ET measurement could play a critical role however at larger scales. One of the
important lessons of this evaluation is that, if reasonable shadow prices are applied to
water savings, the benefit/cost ratio of successfully executed water conservation projects
could be astronomical. Existing monitoring techniques are not adequate to provide
comprehensive, reliable measures of net water savings. Better ET measurement,
combined with ground-based data, could solve this problem.
4.13 The challenges are compounded when data are not freely shared. The joint
World Bank-Government of China report, China 2030, emphasizes the value of public
disclosure of environmental information. Wider distribution of ET and other monitoring
data would be consistent with the ‘bottom-up’ planning orientation of the HBP and would
complement the strong technical capabilities of Chinese academics and researchers.
Further research could help to resolve the inconsistencies between reportedly strong
reductions in groundwater exploitation (or rises in groundwater level) with weak
reductions in ET or water use.

77
CLIMATE CHANGE ADAPTATION
Challenges
4.14 Climate change adaptation presents challenges. First is promoting awareness of
climate change and motivating action. Second is determining what actions, in fact, are
indicated. While the broad direction of climate change is clear, the precise evolution of
climate at any locality is subject to uncertainty. The third is mainstreaming. If adaptive
actions are already beneficial or ‘win-win’, why are they not already part of practice? If
they promote long-term resilience but are currently costly, why should farmers adopt
them?
Awareness
4.15 China had gone through a conceptual journey before espousing a climate change
adaptation program. Until the 2000’s, interest in climate change adaptation was primarily
in China’s research community rather than in the political domain. At the time of
approval of IAIL3 in October 2005, Government’s climate change concerns were not
prominent.
4.16 Interest in climate change adaptation gradually increased in the early to mid-
2000s, with several policy papers likely to have helped stimulate this. Interest mounted
as a series of poor harvests drew attention to the need to mitigate the effects of climatic
extremes: droughts, floods, and high temperatures. In 2007, Government issued a
National Plan for Coping with Climate Change, which included an emphasis on
developing capability in measuring and dealing with climate change, with increased
scientific research to support this. By mid-term Review of IAIL3 (September 2008) the
adjustment to include a targeted climate change adaptation agenda through the addition of
MCCA (approved in September 2008), was made. The Chinese Academy of Agricultural
Science, and World Bank sponsored specialists, were brought in to help conceptualize
and design a climate change adaptation agenda. This was important to MCCA’s
subsequent success as the project was the first comprehensive agricultural climate change
adaptation project in China, requiring a high level of expertise in its formulation.
4.17 A particular effort, however, had to be put in to familiarize civil society, the
extension staff themselves, and farmers with the concept of climate change and the
adaptations feasible to counter such changes. And even before that, Government decision
makers and senior and middle-level extension staff from the various agencies involved
with the project needed themselves to understand and embrace the climate change
agenda.46 47
Planning
46 For instance, as commented in the MCCA PAD (page 34) “The need for climate change
adaptation has been widely recognized only recently.”
47 As advised to IEG, climate change adaptation had not received much policy attention before
the early 2000s, and it was not surprising, therefore, that IAIL3 did not contain a specific climate
change focus at its conception.
78
4.18 The project supported sophisticated climate modeling efforts. These were
important for boosting Chinese capacity to model and understand climate processes.
However, these efforts tended to yield only generic implications for specific, localized
agronomic interventions. This experience is common to such exercises48 and reflects
fundamental scientific uncertainties. First, there is no consensus on the degree to which
higher CO2 levels in the atmosphere will fertilize plant growth, counteracting negative
impacts from temperature rise. Chinese grain yields could go up or down, depending on
the strength of this effect. Second, while climate models yield confident projections of
temperature change, they are much less consistent on precipitation trends for smaller
geographic areas, and on quantifying flood and drought trends. Third, it is very plausible
that pests will increase with temperature, but it is difficult to project their impact.
4.19 For this reason, scientists and policy analysts are increasingly skeptical of a
‘predict and prescribe’ approach to adaptation (Schindler and Hilborn 2015).49 Given the
uncertainties, they advocate designing policies that are robust to a wide range of possible
futures. This would apply also to further on-the-ground adaptation activities under the
National Comprehensive Agriculture Development Program.
Mainstreaming
4.20 MCCA mostly supported interventions that already made sense under current
conditions of climate vulnerability, and would be resilient to further changes. These
include, for instance, the development and diffusion of drought and flood resistant seeds,
and techniques for water conservation. Some – for instance, tree shelter belts - were
already being practiced under IAIL3 but were expanded. Many of the climate change
technologies were familiar, in practice or in concept, to agriculture and irrigation
extension staff. Technical feasibility was, thus, not a major constraint. Nor, after initial
concern as to whether it would work, were farmers’ incentives. Nearly all
IAIL3/MCCA’s climate change adaptation measures increased farm yields as well as
reduced climatic risks, and farmers, once they understood the climate change agenda, and
witnessed demonstrations, adopted most of the practices enthusiastically.
LEARNING: KNOWLEDGE CREATION AND DISSEMINATION
4.21 Both IAIL3/MCCA and the Hai Basin Project brought in substantial innovation,
as described earlier in this chapter. In both projects, policy makers, implementers and
householders had much to learn in order to implement the projects. In turn, these
participants would potentially become resources for possible replication of project
approaches, although the degree of such outreach varied.
Accomplishments
4.22 In terms of knowledge creation, HBP was exemplary in boosting the global state-
of-the-art in remote sensing of evapotranspiration and the national state-of-the-art in
48 See IEG’s Climate Adaptation Evaluation (2012) for a review. 49 Schindler, Daniel E., and Ray Hilborn. “Prediction, precaution, and policy under global
change.” Science 347, no. 6225 (2015): 953-954.

79
integrated economic-hydrological modeling of water resources. As noted above, MCCA
supported advances in climate modeling and in development of climate-resilient
agricultural technologies.
4.23 Under both IAIL3/MCCA and HBP, the training programs and related activities
such as demonstrations and study tours were large. IAIL3/MCCA undertook 37,000
person months of training for extension staff, 74,000 months for farmers, 158
demonstration sites, 145 international and 3,600 domestic study tours, and 330 extension
or public outreach publications. HBP included 9 international and 155 domestic training
sessions, and 43 domestic and 14 international study tours. For both projects, “Joint
Expert Groups” were also formed at all institutional levels, to provide higher level
advice.
4.24 Particularly for the MCCA climate change adaptation program and, though
probably to a lesser extent, HBP, public outreach is reported to have been a major effort.
Public outreach was part of the mainstreaming climate change adaptation objective of
MCCA, and appears to have been significant – some 330 outreach media (booklets,
webpages, newspapers, and TV presentations) were undertaken under the MCCA, and,
while no numbers are available, HBP staff advised IEG that they had also had a
significant outreach effort.
4.25 Dissemination of project results grew in the last years of the projects as project
impacts began to be apparent, attracting increasing interest. The projects responded in
various ways including distribution of brochures, some workshops at local and national
levels, farmer events, and organizing field visits for Government officials. Study visits
from other provinces have also been facilitated. SOCAD has also advised that informal
visits of technicians from neighboring counties was another form of dissemination.
Presentations at conferences, and international exchanges, provided a forum for
international contact.
4.26 One of the most noteworthy aspects of the projects is the way in which Bank staff
and local experts have supported the diffusion of ET as a concept and as a monitoring
technology. There are follow-on Bank projects in China and the Middle East. Study
tours from Morocco and from Latin America have further disseminated the approach.
What worked – the role of innovators
4.27 World Bank Task Team Leaders and other Bank specialist staff were key catalysts
of innovation during project preparation and implementation, according to government
staff. They were critical to the introduction of the new paradigm of focusing on ET.
There were three commonly shared qualities of these TTLs. First, all had extensive
experience in Bank operations and were able to take on a Bank team leadership role.
Second, they had expertise in innovations related to the projects, in particular for the HBP
which introduced several state-of-the-art technologies. Third, they combined expertise
with a passionate championship of new ideas. During preparation, HBP involved multiple
missions by an experienced and relevantly specialized Task Team Leader, and was then
supervised by a locally based Task Team leader, also highly experienced and qualified.
The first TTL continued to be involved with the project as a technical specialist during

80
project implementation. IAIL3/MCCA was both appraised and supervised, with hands-on
involvement, from a Task Team Leader with extensive field experience who brought in
consultants to bring particular expertise for specific needs.
4.28 There is substantial consistency between these observations and the findings of a
survey about the Bank undertaken in 2011-2012 in preparation for the 2013-2016
Country Partnership Strategy.50 The CPS comments that “Respondents indicated that the
Bank’s greatest value to China was in bringing new concepts and innovation, transferring
international best practices, and piloting innovations to be scaled up.” and: ”The Bank
must offer innovative knowledge products.”
4.29 The second group of innovators were academics and consultants. They were
engaged in research and training and were a significant factor in the projects’
performance. They ranged in expertise from the National Academy of Sciences and
China’s top universities and specialist international consultants advising on new
technologies, to more junior consultants to extend staff capacities in specific
implementation areas.
4.30 In IAIL3, academics were used extensively by the counties, provinces, and at the
center. The academics’ roles were diverse ranging from advice or actual implementation
of the new activities that the projects were taking on; to training; and even to “staff type”
roles to provide extra persons in standard project implementation. Academics hired by
counties were mostly from local universities or research institutes.51 At province level,
local institutions were also used but higher level specialists, such as from China’s elite
Chinese Academy of Agricultural Science, were also engaged. International consultants
were also hired in some specialized areas, although hiring of academics and consultants
at this level was more often at central level – SOCAD itself.
4.31 Whether at county, province or central levels, persons interviewed by the IEG
mission were unanimously positive on the value that the academics and consultants had
brought to the operations. “Hiring experts” had greatly enhanced the ability to take on
new technologies; “they helped a lot;” and they were “needed” … “to show us” how to
do the new activities, were typical remarks.
4.32 Part of the reason why the three projects had largely successful experiences with
academics was that a common practice was to integrate them within the work programs
and staffing. Many became, in effect, staff, visiting frequently, and had ready access to
data and the field. Thus, trust and teamwork made the consultants skills’ more effective.
50 Survey of Ministries, local governments, local project management officers, academics, the
media, and NGOs.
51 For instance, in Sihhong and Huaiyuan counties in Anhui, the IAIL3 project team had hired
professors from the County Agricultural Institute and Anhui Agricultural University, and had also
been visited by a more specialized consultant hired by Anhui Province. The generally positive
views from the counties on training and academia also show in decision making since the project.
Thus, the level of training in both counties has increased since project closure, and government
funding of the training budgets has also continued.
81
4.33 Notwithstanding the mostly positive appreciation of the help that had been
provided by the academic community, there were some weaknesses in how well the
highest-level academics and international consultants were able to relate to local
conditions. A complaint to IEG was that some of these needed better familiarization with
local agricultural conditions and governance practices. Advice was sometimes generic –
one size fits all – and insufficiently adapted to China’s quite variable socio-agricultural
conditions. Similar comments were made about some consultants and academics hired
directly by the Bank.
4.34 Nevertheless, the overall benefit from the academics has been high, and, based on
IEG’s observations, it is likely that, without the academics, the projects would have been
significantly less successful in the rapid transformation of the technologies that they all
promoted.
4.35 Innovation was facilitated by a receptive culture. In the course of the projects,
national participants showed an appreciation of potential new technologies, and the
capacity and propensity to rapidly disseminate and implement such knowledge if seen to
be successful. Perseverance is also evident. Project preparation of the HBP, for example,
was a detailed and lengthy process in unknown terrain for activities such as ET, the
institutional structure, and the knowledge management system. The IEG mission was
informed that there was some frustration with the length of the process, but the Chinese
preparation team and policy makers persevered, with no indication that the innovations
would succeed. Government was also prepared to rapidly mainstream the projects’
approaches, as evidenced by the integration of the IAIL3/MCCA into the national
Comprehensive Agricultural Development program, and use of the HBP as a model for
successor water resources management projects.
4.36 However, resistance to change was present in some quarters. For instance, HBP’s
holistic water resources management approach was initially resisted by the engineering
community, who were used to construction of irrigation infrastructure, and considerable
effort was needed to change this mind-set. Indeed, according to some involved senior
staff from the Ministries of Water and Environmental Management, achieving the change
in culture was possibly the project’s most difficult achievement.
Areas for further attention
4.37 IAIL3 missed an opportunity to contribute to better learning about how to
improve land and water productivity. The project introduced a diverse range of
approaches and technologies in engineering, agronomy and management. It would be
desirable to understand which worked best under which conditions. This is especially
true for actions with water conservation benefits, given the potential size of those
benefits. While the project did gather voluminous data and produce reports at province
and county levels, rigorous impact evaluation was not undertaken. The cost of doing so
would have been relatively small, and this could have provided guidance that would
increase the effectiveness of efforts to replicate and scale-up IAIL3.
4.38 The Bank has been more of a transmitter of knowledge than itself a significant
learner. As noted above, involved staff have played a proactive role in disseminating the
82
concept of ET-based water management, including through follow-on Bank projects.
However, this has been driven largely by the individuals involved, rather than being
institutionalized in strategy or approach to water-scarce regions.
5. Summary of main observations and lessons
5.1 Concluding this report, following are some lessons and observations which may
be of general relevance in China and beyond:
The concept of evapotranspiration management can underpin sustainable
water management. Three simple but powerful ideas - that water is only used up by
evapotranspiration, that allowable evapotranspiration has to be capped at a sustainable
level, and that the goal is to minimize non-beneficial evapotranspiration -- can transform
the way water is managed.
Water-saving agricultural projects could in principle provide immense
economic benefits. In water-scarce regions such as north China, there is a substantial
economic value to water savings. Savings on the scale envisioned by the projects, if
evaluated at conservation shadow prices, would imply extraordinary economic returns to
investment. In these projects, unfortunately, data are not adequate to verify whether there
was net water saving.
It is possible to simultaneously boost water productivity and land
productivity. Usually, more productivity requires more water. Here, intensive
agricultural extension, community management of irrigation, environmental
improvements, and promotion of higher value crops and commercialization managed to
conserve water while boosting crop quantity and quality. This was done in significant
part by reducing non beneficial evapotranspiration.
Multi-agency, technically based, integrated water management is possible.
Under the HBP, environment and water authorities worked together, in consultation with
stakeholders to develop plans. The plans were informed by hydrological models that
helped prioritize ways to meet water quality and quantity goals. They were incorporated
in operational county investment plans.
Field-level and basin level approaches are complementary. Holistic
management at the basin level depended on the ability to deploy field level techniques for
increasing water efficiency. But promoting irrigation efficiency can lead to continued
groundwater depletion unless total consumption is capped.
Sharing of data is a key to success. Progress was made when the Environment
and Water ministries pooled information from their formerly separate monitoring stations
and worked together to solve problems, and when Basin authorities shared information
with counties. Coordination was hindered when counties found it hard to share
information with upstream or downstream neighbors, and when information flows from
the center diminished. Globally, there is a growing realization among public agencies that
by making data open – freely accessible, machine readable, and unrestricted in use – both
public and private sectors are able to make better and more informed decisions.

83
Climate adaptation interventions are easily assimilated when they bring
immediate benefits under current climate conditions and variability. Measures
introduced were resilient to future conditions, but already made good farming sense given
current risks. Substantial outreach to farmers and policymakers helped with adoption, as
did incorporation of the innovations in a larger project.
Climate modeling is best used to test adaptation policies for robustness
against different scenarios, rather than to predict ‘what will be’. There are limits to
the ability of climate models to predict future cropping conditions, because of
fundamental uncertainties about the effect of-more carbon dioxide on crop growth, and
inability of the models to accurately predict precipitation.
The Bank can be a driving force for technology transfer. Innovations in
integrated water management, and the ET paradigm, were introduced by a Bank TTL
who combined state of the art, agriculture with irrigation expertise with persuasive
leadership, supported by international and local experts, and by dynamic successor TTLs.

85
References
Chavas, Daniel R., R. Cesar Izaurralde, Allison M. Thomson, and Xuejie Gao. 2009. “Long-term climate
change impacts on agricultural productivity in eastern China.” Agricultural and Forest
Meteorology 149(6): 1118-1128.
China Irrigation and Drainage Development Center. 2012. “The Outcomes and Applications of Hai River
Basin Integrated Water and Environment Management Project.” Foreign Economic Cooperation
Office, Ministry of Environmental Protection. Hai Water Conservancy Commission, Ministry of
Water Resource. China.
Lobell, David B., Wolfram Schlenker, and Justin Costa-Roberts. 2011. “Climate trends and global crop
production since 1980.” Science 333(6042): 616-620.
Perry, Chris, Pasquale Steduto, Richard G. Allen, and Charles M. Burt. 2009. “Increasing productivity in
irrigated agriculture: agronomic constraints and hydrological realities.” Agricultural Water
Management 96(11): 1517-1524.
Piao, Shilong, Philippe Ciais, Yao Huang, Zehao Shen, Shushi Peng, Junsheng Li, Liping Zhou et al. 2010.
“The impacts of climate change on water resources and agriculture in China.” Nature 467(7311):
43-51.
Schindler, Daniel E., and Ray Hilborn. 2015. “Prediction, precaution, and policy under global change.”
Science 347(6225): 953-954.
Smit, Barry, and Yunlong Cai. 1996. “Climate change and agriculture in China.” Global Environmental
Change 6(3): 205-214.
Wang, Lanying, and Qun Li. 2013. “Adaptation to Climate Change in Action in China’s Agricultural
Development.” World Resources Report Case Study.” World Resources Institute, Washington,
DC.
Wei, Xiong, Conway Declan, Lin Erda, Xu Yinlong, Ju Hui, Jiang Jinhe, Holman Ian, and Li Yan. 2009.
“Future cereal production in China: the interaction of climate change, water availability and socio-
economic scenarios.” Global Environmental Change 19(1): 34-44.
Wu, Bingfang, Nana Yan, Jun Xiong, W. G. M. Bastiaanssen, Weiwei Zhu, and Alfred Stein. 2012.
“Validation of ETWatch using field measurements at diverse landscapes: A case study in Hai
Basin of China.” Journal of Hydrology 436: 67-80.
World Bank and Water Partnership Program. 2013. “Design of ET-Based Water Rights Administration
System for Turpan Prefecture of Xinjiang China.” Washington, DC.
World Bank. 2005. “Project Appraisal Document on a Proposed Loan in the Amount of US$200 million to
the People's Republic of China for an Irrigated Agriculture Intensification III project.” Report
31817-CN.
World Bank. 2010. “AAA document on China: Measuring and Coping with Climate Change and its
Impacts on Water and Agriculture in the 3H (Huang-Huaihe- Haihe) Region by 2030.”
Washington, DC (unpublished).
_________. 2011. “Implementation Completion and Results Report for China - Third Irrigated Agriculture
Intensification Project and Mainstreaming Climate Change Adaptation in Irrigated Agriculture
Project.” Report No: ICR500. Washington, DC.
________. 2012. “IBRD, IFC and MIGA Country Partnership Strategy for the People’s Republic of China
for the Period FY2013-FY2016.” Report no. 67566-CN. Washington, DC.
World Bank and Development Research Center of the State Council. 2013. “China 2030: Building a
Modern, Harmonious and Creative Society.” Washington, DC.
Yong, Jiang. 2009. “China’s water scarcity.” Journal of Environmental Management 90: 3185-3196.

86
Wu, Bingfang, Nana Yan, Jun Xiong, W. G. M. Bastiaanssen, Weiwei Zhu, and Alfred Stein. 2012.
“Validation of ETWatch using field measurements at diverse landscapes: A case study in Hai Basin of
China.” Journal of hydrology 436: 67-80.

87 ANNEX A
Annex A. Basic Data Sheet for the Irrigated Agriculture
Intensification III Project and the Mainstreaming Climate
Change Adaptation in Irrigated Agriculture Project
Key Project Data (amounts in US$ million)
Appraisal
estimate
Actual or
current estimate
Actual as % of
appraisal estimate
Total project costs 463.18 463.00 99.96
Loan amount 200.00 200.00 100.00
Cofinancing (GEF) 5.00 5.00 100.00
Borrower 136.79 137.40 100.00
Beneficiaries 126.89 126.10 99.38
Cumulative Estimated and Actual Disbursements
FY06 FY07 FY08 FY09 FY10 FY11 FY12
Appraisal estimate (US$M) 30.19 73.86 118.07 160.55 189.55 199.55 200.00
Actual (US$M) 20.50 57.12 130.18 170.66 200.00 200.00 200.00
Actual as % of appraisal 67.90 77.33 110.25 106.29 105.51 100.22 100.00
Date of final disbursement: 10/16/2009
Project Dates for the Irrigated Agriculture Intensification III Project
Original Actual
Initiating memorandum 12/15/2003 03/16/2004
Negotiations 09/01/2005 09/01/2005
Board approval 04/27/2005 10/11/2005
Signing 12/12/2005 12/09/2005
Effectiveness 02/17/2006 02/17/2006
Closing date 12/31/2010 12/31/2010

ANNEX A 88
Project Dates for the Mainstreaming Climate Change Adaptation in Irrigated
Agriculture Project
Original Actual
Initiating memorandum 03/06/2007 03/29/2007
Negotiations 02/25/2008 02/20/2008
Board approval 01/22/2008 04/17/2008
Signing 08/22/2008 08/15/2008
Effectiveness 10/15/2008 1/13/2008
Closing date 06/29/2012 06/30/2012
Staff Time and Cost
Stage of Project Cycle Staff Time and Cost (Bank Budget Only)
Lending No. of staff weeks
US$ Thousands (including
travel and consultants costs)
FY04 25.82 184.91
FY05 52.01 520.37
FY06 8.72 42.96
Total: 86.55 748.24
Supervision/ICR
FY06 8.39 37.48
FY07 16.64 82.46
FY08 14.44 68.25
FY09 6.33 49.69
FY10 5.47 68.91
FY11 7.89 58.94
Total: 59.16 365.73

89 ANNEX A
Task Team Members
Names Title Unit
Responsibility/
Specialty
Lending
Qun Li Team Leader Sr. Operations Officer EASER Team Leader
Arlene D. Reyes Sr. Program Assistant GSDPR Administrative
Chongwu Sun Sr. Environmental Spec. EASCS Environment
Hongwei Zhao Program Assistant EACSQ Administrative
Houbin Liu Consultant EASCS Water Resources
Management
Jinan Shi Sr. Procurement Specialist EAPPR Procurement
Lang Seng Tay Consultant EASRE HIS Irrigation
Engineer
Li Ouyang Program Assistant EACCF Administrative
Margaret Png Lead Counsel LEGEM Legal
Marie Claire M. Li Tin
Yue
Sr. Program Assistant AFTUW Administrative
Minhnguyet Le
Khorami
Program Assistant EASER Administrative
Patria Consuelo M.
Morente
Program Assistant MDM Administrative
Qingtao Xie Consultant EASCS Environment
R. Cynthia Dharmajaya Program Assistant EASER Administrative
Richard B. Reidinger Consultant EASER Water Users’
Robert Leonard
O'Leary
Sr. Finance Officer CTRFC Financial Management
Shaojun Li Project Coordinator EASCS DFID Project
Coordinator
Wen Poh Ting
Consultant EASRE –
HIS
Agronomist
Xiuzhen Zhang Interpreter/ Translator GSDTI Translator
Yi Dong
Sr. Financial Management Specialist EAPFM Financial Management
Zong-Cheng Lin Sr. Social Development Specialist EASCS Social Aspects
Supervision/ICR
Qun Li
Sr. Operations Officer/Task Team
Leader for both supervision and ICR
missions
EASER Team Leader
Chongwu Sun Sr. Environmental Spec. EASCS Environment
Chunxiang Zhang Sr. Program Assistant EACCF Administrative

ANNEX A 90
Names Title Unit
Responsibility/
Specialty
Geoffrey Spencer Consultant EASCS Irrigation Engineer
Jinan Shi Sr. Procurement Specialist EAPPR Procurement
Harideep Singh Senior Rural Development
Specialist
EASER ICR Author
M. Salah Darghouth
Consultant AFTWR Agriculture and
Water Resources
Minhnguyet Le
Khorami
Program Assistant EASER Administrative
Patria Consuelo M.
Morente
Program Assistant MDM Administrative
Richard B. Reidenger
Consultant EASER Water Users
Associations
Specialist
Sukanya Venkataraman Program Assistant HDNDE Administrative
Usaid I. El-Hanbali Consultant AFTWR Irrigation Engineer
Yi Dong Sr. Financial Management Specialist EAPFM Financial Management
Yuan Wang
Procurement
Analyst EAPPR Procurement
Yunqing Tian Team Assistant EACCF Administrative
Zong-Cheng Lin Sr. Social Development Specialist EASCS Social Aspects

91 ANNEX B
Annex B. Basic Data Sheet for the Hai Basin Integrated
Water and Environment Project
Key Project Data (amounts in US$ million)
Appraisal
estimate
Actual or
current estimate
Actual as % of
appraisal estimate
Total project costs 33.32 34.53 103.60
Loan amount 17.00 16.96 99.76
Cancellation 0.00 0.40 0.00
Cumulative Estimated and Actual Disbursements
FY05 FY06 FY07 FY08 FY09 FY10 FY11 FY12
Appraisal estimate (US$M) 2.88 6.20 9.77 13.04 15.57 17.00 17.00 17.00
Actual (US$M) 1.47 3.42 5.48 7.61 8.79 11.34 13.97 16.96
Actual as % of appraisal 51.04 51.16 56.09 58.35 56.45 66.70 82.17 99.76
Date of final disbursement: 10/27/2011
Project Dates
Original Actual
Initiating memorandum 11/21/2003 11/17/2003
Negotiations 2/16/2004 2/17/2004
Board approval 4/15/2004 4/15/2004
Signing 7/30/2004 2/17/2004
Effectiveness 9/29/2004 9/22/2004
Closing date 6/30/2010 6/30/2011

ANNEX B 92
Staff Inputs (staff weeks)
Stage of Project Cycle Staff Time and Cost (Bank Budget Only)
Lending No. of staff weeks
US$ Thousands (including
travel and consultants costs)
FY02 20 33.33
FY3 35 102.05
FY04 40 189.88
FY 05 10 1.78
Total: 105 327.04
Supervision/ICR
FY04 2 0.13
FY05 35 100.50
FY06 20 64.67
FY07 20 64.84
FY08 22 78.88
FY09 15 35.00
FY10 15 30.00
FY11 20 42.00
Total: 149 416.02
Task Team Members
Names Title
Lending
Olson, Douglas Task Team Leader, Principal Water, Resources Engineer
Jiang, Liping Task Team Leader, Sr. Irrigation Engineer
Braedt, Oliver Natural Resource Management Specialist
Broadfield, Robin Sr. Regional Coordinator
Browder, Greg Sr. Water Resources Specialist
Dong, Yi Financial Management Specialist
Lin, Zong-Cheng Social Development Specialist
Nguyen, Hoi-Chan Sr. Counsel
Jostein, Nygard Sr. Environmental Specialist
O'Leary, Robert Sr. Finance Officer
Png, Margaret Sr. Counsel
Reyes, Arlene Program Assistant
Sun, Chongwu Sr. Environmental Specialist
Yang, Dawei Procurement Specialist

93 ANNEX B
Zhou, Weiguo Operations Officer
Supervision/ICR
Jiang, Liping Task Team Leader, Sr. Irrigation Engineer
Lyle, Clive Consultant, Water Resources
Zhang, Kaiping Consultant, Project Management
Liu, Xueming Economist, FAO
Su, Yibing Consultant, Environment
Li, Ou Consultant, Social Assessment
Olson, Douglas Principal Water Resource Engineer
Browder, Greg Lead Water and Sanitation Specialist
Dong, Yi Sr. Finance Management Specialist
Guo, Xiaowei Sr. Procurement Specialist
Lin, Zong- Cheng Sr. Social Development Specialist
Wang, Yuan Procurement Specialist
Zhou, Weiguo Operations Officer
Chen, Xin Sr. Program Assistant
Chen, Jianxin Interpreter

ANNEX C 94
Annex C. List of Persons Met or Contacted
Tianjin City - September 12, 2014
Name Organization Title
BAI Xiaohong Tianjin City Construction Commission Consultant
HE Yunya Tianjin City Water Affairs Bureau Deputy Director
HOU Xiaomin Tianjin Academy of Environmental Sciences Staff
JIA Liquan Tianjin City Environmental Protection Bureau Director
LI Haoting GEF Hai Basin IWEM Project Office, Ministry of
Environmental Protection
Staff
LI Li Tianjin Academy of Environmental Sciences Staff
LI Wanqin Tianjin City Environmental Protection Bureau Consultant
LIU Bin GEF Hai Basin IWEM Project Office, Ministry of Water
Resources
Deputy Director
LU Xueqiang Tianjin Academy of Environmental Sciences Vice President
MA Fengju Tianjin City Finance Bureau Staff
SHAO Xiaolong Tianjin Academy of Environmental Sciences Staff
SUN Yanqing Tianjin Environmental Assessment Center Staff
XING Rong Tianjin City Water Affairs Bureau Staff
YAN Li Tianjin City Construction Commission Deputy Director
YAN Yeduan Tianjin City Water Affairs Bureau Consultant
YUE Lin Tianjin City Construction Commission Staff
ZHANG Xiaolan GEF Hai Basin IWEM Project Office, Ministry of
Environmental Protection
Deputy Director
Pinggu County - September 16, 2014
Name Organization Title
DONG Chunyu Pinggu GEF Hai Basin IWEM PMO Staff
GUO Jianhua Pinggu GEF Hai Basin IWEM PMO Director
HE Hao Beijing GEF Hai Basin IWEM PMO Deputy Director
LI Chunmei Pinggu GEF Hai Basin IWEM PMO Staff
LI Qianxiang Beijing GEF Hai Basin IWEM PMO Staff
MA Ming China Institute of Water Resources and Hydropower
Research
IWEMP Writer
WANG Guoquan Pinggu Water Affairs Bureau Deputy Director
WANG Jianzhong Dahua Town, Dahuashang Village WUA Chairman
WANG Youcai Pinggu GEF Hai Basin IWEM PMO Staff
XU Wei Pinggu GEF Hai Basin IWEM PMO Staff
ZHANG Guangming Pinggu Environmental Protection Bureau Director

95 ANNEX C
ZHOU Haibin Shandongzhuang Town, Shandongzhuang Village Water Manager
Guantao County - September 14, 2014
Name Organization Title
GU Junfang Handan City Water Resources Bureau Department
Head
LI Huichang Expert Group Consultant
LI Nan Handan City Water Resources Bureau Staff
LIU Wengang Handan City Water Resources Bureau Deputy Director
PENG Junling Hebei Provincial Water Resources Department
WANG Yinhu Hebei Provincial Water Resources Department Deputy Director
ZHANG Yanhong Handan City Water Resources Bureau Section Chief
Cangzhou County- September 18 2014
Name Organization Title
JIN Shulin Hebei Provincial IAIL3 PMO Deputy Director
FAN Guofeng Hebei Provincial IAIL3 PMO Section Chief
BEN Yu Provincial Office of Comprehensive Agriculture
Development
Section Chief
GUO Yongchen Water resources expert
LIN Wenjing Water resources expert
XU Zhiyong Cangzhou City IAIL3 PMO Director
JI Jianyong Cangzhou City IAIL3 PMO Deputy Director
WANG Jigui Agriculture expert
LIU Wengang Cangxian County Office Vice Mayor
YU Guodong Cangxian County Office Director
YANG Shide Cangxian Finance Bureau Deputy Director
Jiangsu and Anhui
Name Title Sihong Suqian Jiangsu
Haifeng Zhao Deputy ombudsman at POCAD Jiangsu
Shijun Sun Deputy director at the Foreign Capital Utilization
Division of POCAD
Jiangsu
Xilin Wang deputy division chief at POCAD Jiangsu
Linzhi Bao MOCAD deputy director Suqian Jiangsu
Guangjun He COCAD director Sihong Suqian Jiangsu
Cunshan Liu MOCAD director Xuzhou Jiangsu
Xuelun Wang COCAD director Xinyi Xuzhou Jiangsu
Bin Lu COCAD staff Xinyi Xuzhou Jiangsu

ANNEX C 96
Wenyi Xu COCAD staff Xinyi Xuzhou Jiangsu
Ke Xu COCAD staff Xinyi Xuzhou Jiangsu
Jun Chen POCAD deputy director Anhui
Wenjian
Guan
division chief at POCAD Anhui
Jun Zheng deputy division chief at POCAD Anhui
Meng Wang POCAD cadre Anhui
Ping Yan POCAD professor Anhui
Bo Zhou Deputy director at city finance bureau Bengbu Anhui
Wei Yang MOCAD director Bengbu Anhui
Changkui Xu County Governor Huaiyuan Bengbu Anhui
Shouben
Wang
Director of County Finance Bureau Huaiyuan Bengbu Anhui
Guifang Shi Deputy Director at County Finance Bureau Huaiyuan Bengbu Anhui
Yi Shang COCAD staff Huaiyuan Bengbu Anhui
Bin Gu COCAD staff Huaiyuan Bengbu Anhui
Laibin Zhong Deputy Director of City Finance Bureau Chuzhou Anhui
Ning Hu MOCAD director Chuzhou Anhui
Zhihua Cao Deputy County Governor Quanjiao Chuzhou Anhui
Zhishan Jiang Director of County Finance Bureau Quanjiao Chuzhou Anhui
Heping Zhao Deputy Director of County Finance Bureau Quanjiao Chuzhou Anhui
Yong Gao COCAD Director Quanjiao Chuzhou Anhui
Maohua
Wang
COCAD Deputy Director Quanjiao Chuzhou Anhui
ZHONG
Laibin
Deputy Director, Finance Bureau Chuzhou Anhui
HE Guangjun Director COCAD Sihong Jiangsu
WANG
Xuelun
Director COCAD Xinyi Jiangsu
Others
Name Organization Title
Ahmed el Bouari Association of Rural Engineers, Rabat President
Bastiaanssen,
Wim
HBP Global Expert Group; Chair, Global Water
Accounting, Unesco
Chair
Din Ping SOCAD Senior Monitoring
Officer
Droogers, Peter HBP Global Expert Group; Futurewater
DONG Chunyu Pinggu GEF Hai Basin IWEM PMO Staff
Guo Bao Li Baodi Water Authority Deputy Director

97 ANNEX C
GUO Jianhua
GUO Yongchen
Pinggu GEF Hai Basin IWEM PMO
Hebei Provincial Academy of Water Resources
Director
HE Hao Beijing GEF Hai Basin IWEM PMO Deputy Director
Huang, Jikun Centre for Chinese Agriculture Policy Director
Hadani El Driss Royal Center for Remote Sensing Director
Jun Jin You Department of Water Resources China Institute of Water
Resources & Hydro Power Research
Senior Engineer
LI Chunmei Pinggu GEF Hai Basin IWEM PMO Staff
Li Haoting Foreign Economic Cooperation Office, Ministry of
Environment Protection
Program Officer
Li Jian Xin Hai Water Conservation Committee Deputy Director
Li Jian Xin Hai Basin Water Conservation Commission Deputy Director
Li Pei Ministry of Environment and Protection Deputy Director
General
LI Qianxiang Beijing GEF Hai Basin IWEM PMO Staff
Liping Jiang Beijing Office, World Bank Senior Water
Specialist
Liu Cunshan Municipal Office of Comprehensive Agricultural
Development, Xuzhou City
Deputy Director
Liu Hanfu Water Resources Department, Baodi District Director
Liu Harfu Water Resources Department, Baodi District Director
Liu Suxia Hydrology and Water Resources Professor
Lou Xiao Hui SOCAD Deputy Director
MA Ming China Institute of Water Resources and Hydropower
Research
IWEMP Writer
Ongley, Ed HBP Global Expert Group
WANG Guoquan Pinggu Water Affairs Bureau Deputy Director
WANG Jianzhong Dahua Town, Dahuashang Village WUA Chairman
Wang Xilin Provincial Office of Comprehensive Agricultural
Development, Jiangsu Province
Deputy Chief
Wang Xue Lun Office for Comprehensive Agriculture Development, Xinyi
County
Director
Wang Xue Lun Xinyi COCAD Director
Wang Youcai Pinggu GEF Hai Basin IWEM PMO Staff
Wang Jinxia Center for Chinese Agricultural Policy Chinese Academy
Sciences
Professor
Wu Bingfang Institute of Remote Sensing and Digital Earth, Chinese
Academy of Sciences
Professor
Wu Xiaopu Oceanic Department for Bohai Sea, Tianjin Research Fellow
And M&E
specialist

ANNEX C 98
Xiaopu Wu Institute of Environmental Ecology, Chinese Research
Academy of Environmental Science
Researcher
Xin Wenli Production Department, Baodi District Agricultural
Committee
Director
XU Wei Pinggu GEF Hai Basin IWEM PMO Staff
Xueqiang Lu Tianjin Academy of Environmental Sciences Professor
Yan Ping Anhui University of Agriculture Resources and
Environment
Professor
Yang Yuchuan Foreign Economic Cooperation Office, Ministry of
Environmental Protection
Team Leader
Yuan Xin Atmospheric Physics Research Institute, Chinese Academy
of Science
Research Fellow
Yangwen Jia China Institute of Water Resources and Hydro Power
Research
Professor
Zhang
Guangming
Pinggu Environmental Protection Bureau Director
Zhou Haibin Shandongzhuang Town, Shandongzhuang Village Water Manager
Zhou Zuhao
State Key Laboratory of Simulation and Regulation of
Water Cycle in River Basin Professor

99 ANNEX E
Annex D. Borrower Comment
Comments received from the Ministry of Finance
From: socad_wly [mailto:[email protected]]
Sent: Wednesday, June 03, 2015 9:25 AM
To: Dan Xie
Subject: Re: For your attention and comments on draft PPAR for CHINA - Third Irrigated Agric.
Intensification Project, Mainstreaming Climate Change Adaptation in Irrigated Agric. Project , and
Hai Basin Integrated Water and Envir. Management Project.
Dear Ms. Xie,
Thanks for sending us the draft PPAR. What we implemented are Irrigated Agriculture
Intensification III Project and Mainstreaming Climate Change Project. We roughly go
through the draft report and found in Page ix “principal ratings,” the PPAR rating for Risk
to Development Outcome is Moderate, but in the text of Page 41, the risk to development outcome is
rated Negligible to Low. Except the above doubt, we have no other comments. Thanks!
Best Regards,
Lanying Wang from SOCAD, MOF