Document 1. Supplemental methods and tables (PDF, 236 KB) - Blood
38
Transfusion Medicine Specialized Center of Clinically Oriented Research (SCCOR) TRALI Study Group Steering Committee: Pearl Toy MD (Principal Investigator), Ognjen Gajic MD, Mark R. Looney MD, Rolf Hubmayr MD, Michael A. Gropper MD, PhD, Michael A. Matthay MD, Richard B. Weiskopf MD, Edward L. Murphy MD, MPH, and Clifford A. Lowell MD, PhD Advisors: Steve Kleinman MD, David Stroncek MD, Ram Kakaiya MD, Thomas H. Price MD, Michael Busch MD, PhD, Dean Sheppard MD Statistics: Peter Bacchetti PhD, Barbara Grimes PhD Clinical Site Coordinators and Research Assistants: University of California San Francisco (UCSF): Monique Koenigsberg RN, Kelly Lang RN, Christopher Chin, Deanna Lee PhD, Lynda Bartek RN, Heather Finlay Mayo Clinic: Gregory Wilson C.C.R.C., Tami Krpata, Deborah Rasmussen, Cindy Medcalfe Blood Bank investigators: Blood Centers of the Pacific: Nora Hirschler MD Blood Services Research Institute: Rosa Sanchez Rosen MD, Philip J. Norris MD, Dan Hindes University of California San Francisco: Pearl Toy MD Mayo Clinic: the late S. Breanndan Moore MD, Jeffrey L. Winters MD, Manish J. Gandhi MD American Red Cross National Neutrophil Reference Laboratory: David Mair MD, Randy Schuller HLA typing and HLA antibody testing (Mayo Clinic): the late S. Breanndan Moore MD, Manish J. Gandhi MD, Steven DeGoey, Nancy Ploeger Neutrophil priming and cytokine testing (UCSF): Clifford A. Lowell MD, PhD, Yong Mei Hu, Ping Wu Lysophosphatidylcholine testing (Mayo Clinic): Joseph McConnell, PhD SCCOR Administrator: Charlene Anderson
Transcript of Document 1. Supplemental methods and tables (PDF, 236 KB) - Blood
Transfusion Medicine Specialized Center of Clinically Oriented Research (SCCOR)
TRALI Study Group Steering Committee: Pearl Toy MD (Principal Investigator), Ognjen Gajic MD, Mark R. Looney MD, Rolf Hubmayr MD, Michael A. Gropper MD, PhD, Michael A. Matthay MD, Richard B. Weiskopf MD, Edward L. Murphy MD, MPH, and Clifford A. Lowell MD, PhD Advisors: Steve Kleinman MD, David Stroncek MD, Ram Kakaiya MD, Thomas H. Price MD, Michael Busch MD, PhD, Dean Sheppard MD Statistics: Peter Bacchetti PhD, Barbara Grimes PhD Clinical Site Coordinators and Research Assistants: University of California San Francisco (UCSF): Monique Koenigsberg RN, Kelly Lang RN, Christopher Chin, Deanna Lee PhD, Lynda Bartek RN, Heather Finlay Mayo Clinic: Gregory Wilson C.C.R.C., Tami Krpata, Deborah Rasmussen, Cindy Medcalfe Blood Bank investigators: Blood Centers of the Pacific: Nora Hirschler MD Blood Services Research Institute: Rosa Sanchez Rosen MD, Philip J. Norris MD, Dan Hindes University of California San Francisco: Pearl Toy MD Mayo Clinic: the late S. Breanndan Moore MD, Jeffrey L. Winters MD, Manish J. Gandhi MD American Red Cross National Neutrophil Reference Laboratory: David Mair MD, Randy Schuller HLA typing and HLA antibody testing (Mayo Clinic): the late S. Breanndan Moore MD, Manish J. Gandhi MD, Steven DeGoey, Nancy Ploeger Neutrophil priming and cytokine testing (UCSF): Clifford A. Lowell MD, PhD, Yong Mei Hu, Ping Wu Lysophosphatidylcholine testing (Mayo Clinic): Joseph McConnell, PhD SCCOR Administrator: Charlene Anderson
Abbreviations: anti–HLA-Class I = HLA class I antibody anti–HLA-Class II = HLA class II antibody anti-HNA = antibody to human neutrophil alloantigen AMFIR = average mean fluorescent intensity ratio in GIFT assay for HNA antibody CD11b, CD66b = markers of neutrophil priming activity GMCSF = granulocyte macrophage colony-stimulating factor GAT = granulocyte agglutination test for antibody to HNA GIFT = granulocyte immunofluoresence test by flow cytometry for antibody to HNA HNA = human neutrophil alloantigens IFNγ = interferon gamma IL1ra = Interleukin-1 receptor antagonist IL1β = Interleukin-1 beta IL2 = Interleukin-2 IL4 = Interleukin-4 IL6 = Interleukin-6 IL8 = Interleukin-8 IL10 = Interleukin-10 LysoPC = lysophosphatidylcholine MAINA = monoclonal antibody immobilization of neutrophil antigen assay MICA = MHC (HLA) class I chain-related gene A MFI = mean fluorescent intensity for specific HLA antibody determined by SAB assay MPPC = mean percentage of positive cells in GIFT assay for HNA antibody NBG = normalized background ratio for HLA antibody screening test PF4 = platelet factor 4 SAB = single antigen bead assay for HLA antibody specificity sCD40L = soluble CD40 ligand TNFα = tumor necrosis factor alpha VEGF = vascular endothelial growth factor
Study design A case control study of TRALI was conducted at two tertiary care medical centers, the University of California San Francisco (UCSF), San Francisco, CA and the Mayo Clinic, Rochester, MN. Enrolment began on March 1, 2006 at UCSF and on April 1, 2006 at Mayo Clinic, ending on August 31, 2009 at both sites. Cases of possible TRALI were detected through an electronic surveillance system (Oztech Systems Inc, Burlingame, CA) that monitored blood oxygenation test results in the hospital laboratory information systems and compared these results to transfusion data within the same systems. When patients aged 6 months or older became hypoxic within twelve hours of a transfusion, the system alerted project staff by display pager and email. Additional eligibility and risk factor data were gathered from medical records by study coordinators and were entered into a Web-based database designed by Quesgen Systems Inc, Burlingame, CA. Residual blood samples from the transfused patient and from the transfused blood product were collected and entered into the study repository. Potential cases of TRALI were adjudicated by a panel of expert physicians. Controls were concurrent patients who were transfused but did not develop hypoxemia or pulmonary distress. Controls were enrolled into transfusion-volume strata in a distribution defined by the transfusion volumes administered in the cases. TRALI mitigation policies during the study period to reduce high-risk donors were determined by the blood supplier of each institution. While the case-control study ended on August 31, 2009, surveillance for TRALI cases continued until December 31, 2009. Because the study involved the low risk collection of observational data and existing specimens, a waiver of written consent was obtained for both cases and controls. The protocol was approved by the institutional review board at each institution. Reduction of high-risk plasma transfused at UCSF The following TRALI mitigation measures were implemented starting in February 26, 2007 and high-risk plasma was believed to be completely removed from inventory by September 13, 2007. Two questions were added to the donor history questionnaire: 1. Have you ever been pregnant? If yes, how many times? 2. Have you ever received anyone else’s blood? If the answer was “Yes” to either question, no fresh frozen plasma, plasma frozen within 24 hours, and plasma, cryoprecipitate reduced were made from their donation. Whole blood donors who had never been pregnant or transfused, apheresis platelet donors and blood group AB plasmapheresis donors were accepted as donors. Red blood cells from whole blood and automated red blood cell donation, platelets from plateletpheresis donations, and cryoprecipitate from whole blood donations was used for transfusion. In the fall of 2007, history of transfusion did not exclude the use of plasma from donors. Data from REDS II LAPS Study1 showed that transfusion did not correlate with increased prevalence of anti-HLA antibodies. Because of this, plasma from donors with history of transfusion was accepted for transfusion.
In November 2008, TRALI mitigation was extended to group AB plasmapheresis donors. Group AB plasmapheresis donors with four or more pregnancies were tested for HLA antibodies as described below for platelet donors. Reduction of high-risk platelets transfused at UCSF All platelets transfused at UCSF during the study period were leukoreduced single donor platelets (SDP) collected by apheresis. Implemented on November 1, 2008, platelet donors who have been pregnant four or more times were tested for HLA Class I and II antibodies by the LABScreen Mixed test (One Lambda, Canoga Park, CA) on Luminex platform performed at Blood Systems Laboratory (BSL) in Arizona. Only the screening test was performed; no confirmatory specificity assay was done on positive results. The cutoff for a positive result was five standard deviations above the negative control to minimize loss of platelet donors. Negative controls for HLA I and HLA II were provided with reagent kit; BSL developed an additional internal control of known negative untransfused male plasma samples. The test was not a release test and therefore platelets were distributed if results had not yet been received with results most often being available after platelets had already been distributed or expired. Donors who tested positive were diverted to red cell donation and their plasma to recovered plasma for future donations though cryoprecipitate was made from these donors. No recipient tracing, lookback, or component retrieval of distributed components was done for current or past donations from donors found to be positive on testing. Donors who tested negative were allowed to donate platelets and plasma. Donors who tested negative were re-tested upon subsequent pregnancies. Only 1.1% of platelet donors were deferred for increased TRALI risk during the period November 1, 2008 to December 31, 2009. Reduction of high-risk plasma transfused at Mayo Clinic Reduction of high-risk plasma was implemented for blood transfused at Mayo Clinic, beginning on November 1, 2007 and high-risk plasma was believed not to be in inventory by June 5, 2008. During this intervention period, whole blood donations from all female donors were excluded from manufacture of plasma components (fresh frozen plasma, plasma frozen within 24 hours, and plasma, cryoprecipitate reduced). Females were similarly excluded from plasmapheresis donations except for AB donors and IgA deficient donors. In these circumstances, female donors were allowed to continue donating plasma by apheresis. Red cells, platelets and cryoprecipitate were not included in this policy. Plasma from excluded donations was used to manufacture cryoprecipitate. Reduction of high-risk platelets transfused at Mayo Clinic All platelets transfused at the Mayo Clinic were apheresis platelets from single donors. Reduction of high-risk platelets was implemented for platelets transfused at Mayo Clinic beginning on November 1, 2008. The secondary blood supplier to the Mayo Clinic, American Red Cross (ARC), implemented a policy of male predominant platelet donations. Males were targeted for apheresis platelet donation and females were no longer recruited to donate platelets by apheresis, with a goal of a 100% male apheresis platelet supply. Because the Mayo Clinic purchases approximately half of its apheresis platelet inventory from the ARC, the decision was made to follow the same strategy. However, due to limitations in platelet supply, males remained at 65% (monthly range 58% – 69%) of the platelet donations (November 1, 2008 – December 31, 2009).
Surveillance of all transfusions An electronic surveillance system screened for post-transfusion hypoxemia as previously described.2, 3. UCSF employed a system designed by Oztech Systems Inc, Burlingame, CA, and the Mayo Clinic used an equivalent system designed by internal staff. In brief, electronically recorded arterial blood gas results and information on blood units issued from the Blood Bank for patients over six months of age were monitored by the hospital computer system on a continuous 24 hour, 7 days a week basis. Orders for the blood gas test were made by the patient’s physician as part of patient care and were not initiated by the study investigators. The computer system generated an automatic alert to the study coordinator when it detected a patient who developed severe hypoxemia (PaO2/FiO2 ratio ≤ 300 mg/Hg) within 12 hours after any blood component was issued for that patient from the Blood Bank. The 12 hour surveillance interval post-issue of blood products from the blood bank was arbitrary, but was considered long enough to detect TRALI during or within 6 hours of transfusion, which is the consensus definition. Cases without a FiO2 in their ABG reports would be missed if not reported as a transfusion reaction. If a possible case was on nasal oxygen, and not on mechanical ventilation, a FiO2 was estimated by Table S1. At both sites, the nursing and physician staff was encouraged to report respiratory distress that occurred during or after transfusion to the Blood Bank according to standard operating procedures for monitoring for transfusion reactions. After receipt of an alert, two levels of review determined whether the alerted patient had TRALI. First, study coordinators applied screening criteria to exclude patients who clearly did not have new or worse pulmonary edema after transfusion, and second, an Expert Panel of critical care physicians determined whether the change in chest radiograph appearance after transfusion was likely caused by TRALI, as opposed to other mechanisms: circulatory overload, or acute lung injury (ALI) associated with other known risk factors such as pneumonia, aspiration and sepsis. Post-transfusion hypoxemia was used exclusively as a screening tool and no data were collected on non-transfused patients or patients transfused >6 hours preceding onset of edema. In some cases, reports of TRALI did not trigger the automated surveillance system due to the fact that blood gas measurements were ordered after 12 hours post-issue of blood products, or a FiO2 was not included in the ABG order. These were, however, reported to the Blood Bank of each institution as transfusion reactions through normal processes. In these circumstances, the Blood Bank collected patient identifiers and information concerning the timing of the reactions and notified the study coordinators by telephone or email. These cases were then evaluated in a manner identical to those identified through the surveillance system. If an arterial blood gas measurement was not obtained, the criterion for consideration as a possible TRALI case was an SpO2/FiO2 ratio of ≤315, which is equivalent to a PaO2/FiO2 ratio ≤300 mg/Hg.4 Case selection by surveillance of arterial blood gas results Using arterial blood gas (ABG) results for surveillance for TRALI should not bias case selection. We recognized that the requirement for an ABG for an alert potentially caused bias in case selection favoring ICU and OR cases of TRALI over cases in other areas of the hospital. ICU and OR cases may be diagnosed earlier than cases in other hospital areas, because ICU and OR patients are more likely to already have an arterial line, making it easy to obtain an ABG. However, pulse oximetry is widely used in all areas of the hospitals, and severely hypoxemic patients will be detected by pulse oximetry, and sooner or later, will get an ABG, especially if mechanical ventilation is required The diagnosis of TRALI may be made earlier in ICU and OR
patients, but sooner or later, the diagnosis will be made on all TRALI patients no matter what service they are on. Regarding thrombocytopenic patients, thrombocytopenia is not a contraindication to ABG if the test is required for management of hypoxemia. Thus, using ABG results for surveillance should not bias case selection on services where ABGs are easier to obtain. Any TRALI cases missed due to ABG not having been done would be small in number. Coordinator evaluation of patients identified by the surveillance system After receiving an alert, study coordinators gathered additional eligibility data. Inclusion criteria were documented transfusion of blood product(s) within 6 hours of onset of hypoxia accompanied by a radiologist report of new or worsening bilateral infiltrates on the post-transfusion chest radiograph. Exclusion criteria were no edema on post-transfusion chest radiograph, no blood products given (blood was issued but not transfused), improvement or no change in pre-existing pulmonary edema on chest radiograph, no post-transfusion chest radiograph performed, no increase in supplementary oxygen given, or the presence of conditions that could be mistaken for acute lung injury. Expert panel review in real time In order to collect study samples as soon as possible in patients with the diagnosis of TRALI, the expert panel members’ diagnoses of TRALI had to occur in real time upon receipt of data sent by email from the study coordinators (within 72 hours of pulmonary edema). This prospective nature of the study allowed the expert panel members to clarify any data points by contacting the study coordinator while the patient was still in the hospital and bedside providers could remember the details of the care provided. For expert panel review of patients selected on the basis of the inclusion and exclusion criteria, coordinators prepared electronic narrative reports, chest radiograph and flow charts, and entered clinical data into a Web-based database designed by Quesgen Systems Inc, Burlingame, CA. Whenever available, coordinators included the opinion of the patient’s physician regarding the cause of the pulmonary edema. To avoid reviewer bias, case presentations to the Expert Panel did not include donor gender or parity, antibody information, nor component age or type for units transfused within six hours of the hypoxic episode. Study coordinators sent case information by email in a random order to two critical care physicians on the Expert Panel (O.G., R.H., M.R.L., and M.A.G.). Each of the two experts independently classified each case as TRALI, acute lung injury (ALI), transfusion associated circulatory overload (TACO), TACO/TRALI, or other. A systematic integrated evaluation of the clinical context, chest radiographic imaging, hemodynamic monitoring data, echocardiography, and laboratory findings was used to determine the likelihood of TRALI vs. other causes of bilateral pulmonary opacities.5 If the two experts independently agreed on a diagnosis, the diagnosis was final. If the two experts did not agree, another expert was consulted. The diagnosis was based on the agreement of at least two experts. For quality assurance, all four members of the Expert Panel re-reviewed by conference call, any case considered by only one reviewer as TRALI, any case considered as “other”, and any TRALI case that had another ALI risk factor present.
Quality control of case ascertainment The original study design was predicated on a prospectively designed TRALI case recognition system that included regularly scheduled monthly conference calls among the coordinators and investigators at both sites. When there were changes in coordinator staffing at one site (UCSF), extra efforts were made to train the new coordinator to be sure there was no lapse in the system for identifying potential TRALI patients. After TRALI mitigation, we recognized that there was risk of potential bias in TRALI case ascertainment. On the one hand, the coordinators and the expert panel could be biased because some individuals may have expected a decrease in TRALI incidence with mitigation. On the other hand, there was a desire to maximize TRALI case identification in order to increase power and precision for the study of risk factors. In the initial phase after both sites completed implementation of mitigation (last half of 2008), there appeared to be greater reduction in TRALI cases at one site (Mayo). Because of this, we instituted weekly random audits of one alert at each site that was not referred to the expert panel (January 25, 2009 to December 27, 2009). The database provider randomly selected an alert at each site once a week. The two alerts were then presented for review at a weekly conference call that included all site coordinators and two site investigators (P.T., O.G.). The appropriateness of the alert disposition was reviewed. None of the approximately 90 audited alerts were reclassified as TRALI cases. Further, these weekly calls did not bring to light any need for change in the methodology for how case ascertainment was carried out. Definition of TRALI TRALI was defined as new ALI that developed during or within 6 hours of transfusion.6 In a case that had other ALI risk factors, the case was designated ALI if the patient’s clinical course was consistent with progression of underlying ALI; a case was designated TRALI only if the patient had been stable or improving until the transfusion precipitated the acute lung injury syndrome. Definition of "stable" meant that clinical respiratory parameters (oxygen saturation, FIO2 requirements, respiratory rate, chest radiographic infiltrates, ventilator requirements, ABGs) were stable or improving during the 12 hours prior to transfusion. Major ALI risk factors were pneumonia, sepsis, aspiration, multiple fractures, and pancreatitis. Other ALI risk factors were acute central nervous system injury or stroke, disseminated intravascular coagulation, post-lung resection, lung radiation, near drowning, heat stroke, lung contusion, drug overdose, burn, exposure to high altitude, or receiving Amiodorone. Massive transfusion was not considered an ALI risk factor, as the transfusions could cause TRALI. Hemorrhagic shock was not considered an ALI risk factor for the same reason. Cases designated “transfused ALI” in this study were patients in whom the Expert Panel thought the underlying ALI risk factor was more likely to have caused the lung injury rather than the transfusion. These transfused ALI cases are considered “possible TRALI” by the Canadian Consensus Conference definition.7 Cases were coded separately and excluded from the study in those instances where the cause of new ALI within six hours of post-transfusion was known, e.g. ALI associated with an anaphylactic/anaphylactoid transfusion reaction, and ALI associated with sepsis due to bacterial contamination of the transfused blood product.
Controls: inclusion criteria Control patients were transfusion recipients over six months of age, who had no pulmonary signs and symptoms during or within 12 hours after transfusion of the last unit. Their PaO2/FiO2 ratio, if measured, was required to be 300 or higher, and any chest radiograph had to be devoid of bilateral infiltrates; i.e., there was no evidence of TRALI, transfusion associated circulatory overload (TACO) or ALI. If no pre-transfusion and/or post-transfusion chest radiograph was available and no comments of respiratory distress or oxygen desaturation were noted during or after transfusion, it was assumed that there was no respiratory compromise before and/or after transfusion. If pleural effusion(s) or a unilateral infiltrate were present on the chest radiograph, coordinators used clinical judgment to rule out congestive heart failure or fluid overload. If a recipient had only one alert for a PaO2/FiO2 ratio <300 mg/Hg, coordinators investigated whether the low PaO2/FiO2 ratio was in error, due to mucous plugging, or was transiently associated with extubation. If no pre- or post-transfusion blood gas measurements were made, coordinators assumed the PaO2/FiO2 ratio was >300 mm/Hg. For analysis of controls, two hours after transfusion of the last unit was selected as the estimated date and time of “no edema.” Units transfused Each transfused bag was considered one unit for WB, RBC, plasma (there were no jumbo plasma), and plateletpheresis (even for split units). Each pooled cryoprecipitate was considered one unit (e.g. a cryopool from 5 donors was considered one unit). Each transfused bag to pediatric patients was considered one unit. All platelets were apheresis platelets at both sites. All platelets and RBCs were leukoreduced. Collection of samples for patients (cases and controls) Residual routine pre- and post-transfusion recipient blood samples were collected from the clinical laboratory for both cases and controls, and stored at 4˚ C prior to processing. Whole blood for patient HLA typing was sent overnight at ambient temperature to Mayo Clinic Tissue Typing Laboratory for processing. Collection of samples from transfused units and donors Study units were those transfused within 6 hours of edema (in cases), or no edema (in controls). For bioreactive marker testing,8 cytokines, soluble CD40 ligand (sCD40L), platelet factor 4 (PF4), lysophosphatidylcholine (LysoPC), neutrophil priming activity, plasma was obtained and prepared from blood in the bag or segments of the involved units (variable time points before plasma separated). We recognized that this system would not capture all of the residual transfused blood bags because it depended on the transfusion personnel returning all the blood bags to the Blood Bank. For antibody testing, a sample from the donor pilot tube obtained at the time of the donation was used, or if not available, the donor was requested to provide an additional sample. If neither were available, frozen samples from segments or bags were used if available (19%). Donor pilot tubes and blood bags specimens were stored at 4˚ C until processing. Bags transfused to TRALI patients were stored approximately three days longer than those transfused to controls because of
the time needed to make the diagnosis. Samples from units of whole blood and blood components were centrifuged at 2000 × g for 10 min at 4˚ C. The supernatant was collected, aliquoted, and frozen at −70˚ C. Lookback and co-components: local policies not part of study protocol In accordance with local blood center policies, the components from other TRALI cases were not tracked and the recipients were not investigated (“lookback”). Lookback was beyond the scope of the study. In addition, lookback is not a good way to assess TRALI risk factors (our study goal), because diagnoses of TRALI would be made by retrospective chart review and the HLA type of the recipient is usually not available Co-components from involved units in a reported TRALI case were quarantined. Laboratory Tests LysoPC assay LysoPC was assayed in the laboratory of Dr. J. P. McConnell at the Mayo Clinic.9 The 16:0 and 18:0 refer to the fatty acid moieties attached to the SN1 carbon of the glycerol backbone. Many other fatty acids could be attached in that position, but we only measured lysoPC with these two saturated fatty acids. They do give a good representation of the overall concentration of lysoPC and they do tend to be elevated or decreased in unison with one another. Thus, the sum of 16:0 and 18:0 was used to assess lysoPC concentration. LysoPC was measured with liquid chromatography tandem mass spectrometry with an electrospray triple quadruple mass spectrometer (SCIEX API 3000, AME Bioscience, Concord, Ontario, Canada). Plasma was extracted with butanol after the addition of 17:0 lysoPC as internal standard. The dried-down extract was reconstituted in methanol for analysis with a triple quadruple mass spectrometry (SCIEX API 3000) with a Turbo Ion Spray Source. Chromatographic separation was achieved with a Phenomenex C8 column. Mobile phase consisted of a mixture of methanol (90%), 100 mmol/L ammonium acetate (10%), and formic acid (0.05%). Complete analysis time was 3 minutes with lysoPC eluting at approximately 1.5 minutes. Selective reaction monitoring was used to determine 16:0 lysoPC. Inter-assay CVs were 2.0% at 131 mol/L and 12.0% at 45 mol/L. Plasma cytokine and bioreactive substances assays The cytokines measured in recipient samples and in returned transfused blood units were: IL-1ra, IL-1b, IL-2, IL-4, IL-6, IL-8, IL-10, GM-CSF, IFNγ, TNFα, PF4, and VEGF. Samples tested were those that were the closest to the time of transfusion, both before and after. These cytokines were chosen because simple panels were available for the Luminex machine and all are known to be involved in inflammation in a general fashion.10 We also included testing for sCD40L in plasma of platelet units, because it may be important in TRALI pathogenesis,11 although this needs to be confirmed.12 Cytokine levels in plasma of patients and donor units were determined at UCSF using Luminex multi-plex bead assays as described by the manufacturer (Bio-Rad Laboratories, Hercules, CA).
Briefly, plasma samples were stored at −80°C prior to use, then quick thawed the day of assay. Plasma was spun at 1000 × g for 10 min, then 30 µl was diluted 4× with commercial diluent (Bio-Rad Laboratories, Hercules, CA). Assays were performed in 96 well filtration plates using 50 µl of bead mix, and 50 µl of diluted plasma. Samples were incubated for 1 hr at room temperature with shaking, then washed three times by filtration, then incubated with 25 µl of the supplied biotin-conjugated detecting antibody for one additional hour with shaking. Beads were washed 3 times, then incubated with 50 µl of supplied streptavidin PE for 30 min, washed again and diluted to 125 µl for reading on a Bio-Plex 200 (Bio-Rad Laboratories, Hercules, CA.). Each run contained standards for quantitation, which was performed using BioPlex Manager Software (v4.1). All samples were run in duplicate on each assay and those with detectable cytokine levels were repeated in separate assays for validation. Each run contained samples from cases and controls, which were purposely done together to mitigate the potential of assay variability differentially affecting the results. The levels of sCD40L and PF4 in plasma samples were determined using standard plate bound ELISA format assays. Methods were used as described by the manufacturer (sCD40L kit from Bender MedSystems, Vienna, Austria; PF4 kit from R&D Systems, Minneapolis, MN). Samples were compared to standards provided in each kit. Samples from cases and controls were tested together in most runs to reduce inter-assay variability. CD11b/CD66 upregulation assay (neutrophil priming activity) We chose the CD11b/CD66 upregulation assay because it was much faster and amenable to high through-put screening than traditional priming assays. Also, there was much less variability with this assay. Previous studies haven shown that lysoPC upregulates CD11b on neutrophils,13and that neutrophil priming or activation is associated with upregulation of CD11b,13 CD66b,14or both.15, 16 Neutrophil priming activity of patient and donor unit plasma was determined in the laboratory of Dr. Lowell at UCSF. Human neutrophils from two separate donors were incubated with test plasma samples to screen for priming/activating factors by upregulation of surface expression of CD11b and CD66. Peripheral blood neutrophils were prepared by single step gradient centrifugation using Polymorphprep (Axis-Shield Poc, Oslo, Norway). Cells were washed twice in HBSS buffer (with 0.2% HSA), suspended to 2 × 10⁶/involved. 25µl of cells were incubated with 100 µl of the test plasma for 1 hour at 37oC, washed twice then stained for CD11b, CD66b and CD15 expression (CD11b-PE, clone ICRF44; CD66b-FITC, clone G10F5; CD15-PerCP Cy5.5 clone H198; BD Pharmingen) following manufacturers instructions. Samples were run on a dual laser flow cytometer (FACscan Flow Cytometer Becton-Dickson, San Jose, CA, USA) and analyzed using FloJo software (Tree Star Inc., Ashland, OR). Neutrophils were gated by FSC/SSC and CD15 expression (which was not affected by activation). Each assay run contained neutrophils from a normal donor incubated with his/her own plasma as a negative stimulation control. The degree of upregulation of CD11b/CD66b induced by the various plasma samples was standardized to the control plasma from the neutrophil donor. The data were read out as the percentage of donor neutrophils that showed upregulation of either CD11b or CD66b following incubation with test plasma over the expression level of the donor neutrophils incubated with the donor plasma. Some samples were incubated with fMLF (N-formyl-methionine-leucine-
phenyalanine) peptide (1 nM) to provide a positive stimulus control. Samples from cases and controls were tested together to reduce inter-assay variability. Plasma induced CD11b/CD66 upregulation: Donor neutrophils were incubated with test plasma then stained for CD11b/CD66b as described in Methods. (A) Donor neutrophils incubated with donor plasma – negative control. (B) Donor neutrophils incubated with 1 nM fMLF/BSA – positive control. (C) Donor neutrophils incubated with plasma test sample, showing lack of reactivity. (D) Donor neutrophils incubated with plasma test sample, showing significant upregulation of CD11b/CD66b. Numbers in each quadrant designate percent positive cells based on negative control. HLA antibody screening test The Mayo Clinic Division of Transfusion Medicine tested for antibody to HLA class I and class II antigens. Samples from cases and controls were tested together to reduce inter-assay variability. LABScreen™ Mixed LSM12 (One Lambda Inc., Canoga Park, CA) is an antibody detection test that uses a panel of color-coded beads, which are coated with purified HLA antigens. Eleven different beads are combined in one suspension for a Class I/II antibody screening test. Test serum was first incubated with LABScreen Mixed LSM12 beads (One Lambda Inc., Canoga Park, CA). Any HLA antibodies present in the test serum bound to the antigens and then were labeled with R-Phycoerythrin (PE)-conjugated Goat anti-human IgG. The LABScan 100™ flow analyzer (Luminex Corp., Austin TX) detected the fluorescent emission of PE from each bead. Washing was manual. Dedicated software (Luminex 100 IS to xMAP Technology, Version 2.3 Luminex Corp., Austin TX) acquires data in real-time. An accompanying analysis program (HLA Visual version 1.0, One Lambda Inc., Canoga Park, CA) assists in detecting the presence or absence of HLA Class I and Class II antibodies. Serum samples that demonstrated a high degree of non-specific binding (negative control fluorescence of greater than 1500 and/or positive Control/negative Control ratio less than 2.0) were treated with Adsorb Out beads (One Lambda Inc., Canoga Park CA) to remove the non-specific binding. Once treated, the samples were re-tested. The analysis program determined a normalized background (NBG) ratio for each bead used in the test. This consists of the ratio of the signal for the bead to the background for each bead set. In the context of the HLA Class I/Class II antibody screen, this does not represent the strength of individual antibodies, but rather of all the antibodies present. An NBG ratio >2.2 was considered a positive result and the positive samples were further tested for antibody specificity. HLA single antigen bead (SAB) assay for antibody specificity Each sample that tested positive on the HLA Class I/Class II antibody screen was subsequently evaluated using the LABScreen™ Single Antigen Bead assay (One Lambda Inc., Canoga Park CA) to identify antibody specificity for either HLA Class I and/or Class II antibodies. The test uses a panel of color-coded beads each coated with purified single HLA Class I and Class II antigens. Up to 100 different beads were combined in one suspension for a single test. Test serum was first incubated with LABScreen Single Antigen Class I and/or Class II beads (One Lambda Inc., Canoga Park CA). Any HLA antibodies present in the test serum bound to the antigens and then were labeled with R-Phycoerythrin (PE)-conjugated Goat anti-human IgG. The LABScan 100™ flow analyzer (Luminex Corp., Austin TX) detected the fluorescent emission of

PE from each bead. Dedicated software (Luminex 100 IS to xMAP Technology, Version 2.3 Luminex Corp., Austin TX) was used for data acquisition. An accompanying analysis program (HLA Fusion version 1.2.1b, One Lambda Inc., Canoga Park CA) assisted in detecting the strength of HLA Class I and Class II antibodies. Serum samples that demonstrated a high degree of non-specific binding (Negative control fluorescence of greater than 1500 and/or Positive Control/Negative Control ratio less than 2.0) were treated with Adsorb Out beads (One Lambda Inc., Canoga Park CA) to remove non-specific binding. Once treated, the samples were re-tested. The analysis program determined a mean fluorescence intensity (MFI) value for each HLA specificity. This value corresponds with the strength of the antibody; thus the stronger the reaction, the higher the MFI. The MFI is calculated as follows. First, the raw value of the patient’s negative control is subtracted from the raw value for each individual bead. Second, the raw value from the negative control serum is subtracted from the raw value of the negative control for each individual bead. This second negative control value is subtracted from the first patient value to generate the MFI for each HLA specificity. To assess antibody strength, the trimmed MFI was utilized for each single antigen bead. To calculate the trimmed mean, beads falling in the top or bottom 5% were excluded and the mean of the remaining beads was reported. This was accomplished by a template from investigator P.J.N. An MFI>300 was considered positive. HLA antibodies detected by single antigen beads were defined at serological equivalent levels. For example if the antigen on bead had specificity to HLA-B*1501, the serologic equivalent HLA-B62 was considered as the specificity of the HLA antibody. When more than one bead had the same serologic equivalents, the bead with the highest MFI was considered as recipient specific antibody. For example if the patient had a positive result for A*0201 (MFI=9000), A*0203 (MFI=7000) and A*0205 (MFI=5000), A*02 is considered the recipient specific antibody with MFI=9000. Additionally, as HLA-DP antigen typing was not performed, it was not possible to identify it HLA-DP antibodies were cognate. Only the later lots of SAB had the capacity to detect antibodies to HLA-Cw. Since this covered only a very small subgroup of the study samples, these antibodies were not included in the analysis. Patient HLA antigen typing Low resolution Class I HLA-A, B, Cw and Class II HLA-DRB1, DRB3/4/5, DQB1 typing was performed using the LABType® SSO (One Lambda Inc., Canoga Park, CA). The kit uses sequence-specific oligonucleotide probes (SSO) bound to microspheres. The microsphere mixture consists of a set of fluorescently labeled microspheres that bear unique sequence-specific oligonucleotide probes for HLA alleles. Each microsphere mixture includes negative and positive control microspheres for subtraction of non-specific background signals and normalization of raw data to adjust for possible variation in sample quantity and reaction efficiency. DNA was extracted from 1–3 involved of peripheral blood using the Puregene® DNA Purification System (Gentra Systems, Minneapolis, MN) according to the manufacturer’s protocol. Target DNA is PCR-amplified using a group-specific primer. The PCR product is biotinylated, which allows it to be detected using R-Phycoerythrin conjugated Streptavidin. The PCR product is denatured and allowed to rehybridize to complementary DNA probes conjugated to fluorescently coded microspheres. A flow analyzer, the LABScan™ 100, identifies the fluorescence intensity of PE (phycoerythrin) on each microsphere. The assignment of the HLA

typing is based on the reaction pattern as compared to patterns associated with published HLA gene sequences using the HLA-Visual version 1.2.1b software (One Lambda Inc, Canoga Park CA). Antibodies to human neutrophil antigens (anti-HNA) The American Red Cross Neutrophil Immunology Laboratory in St. Paul, MN, screened for antibodies to human neutrophil alloantigens (HNA) using the granulocyte agglutination test (GAT) and granulocyte immunofluoresence test (GIFT), analyzed by a flow cytometer (EPICS® XL/MCL Flow Cytometer Beckman Coulter, Inc. Miami, FL). If present, HLA Class I antibodies may also cause reactive test results. When HLA Class I antibody was detected, the monoclonal antibody immobilization of neutrophil antigens assay (MAINA) was used to differentiate HNA antibodies. For all three assays, freshly donated granulocytes from previously phenotyped donors were used as the antigen source. Analogous to the way reagent erythrocytes are used in a type and screen to detect red cell antibodies, each unknown specimen was tested against a panel comprised of 5–10 granulocyte donors with known HNA phenotypes as the antigen source. EDTA-anticoagulated peripheral whole blood samples were collected from volunteer donors within 24 hours of testing and the granulocytes isolated using discontinuous Ficoll gradients. Granulocyte agglutination (GAT) Granulocyte agglutination was performed by the method of Lalezari et al.17 The donor granulocytes were washed in phosphate buffered saline and the suspension adjusted to a concentration of 5 × 10⁶/mL in granulocyte resuspension buffer. Test serum or plasma was incubated with the granulocyte suspension in a Terasaki tray for 4.5 to 6 hours at 29 – 31°C. During this time granulocyte specific antibodies in the test specimen prime the granulocytes. These primed granulocytes enter an “agglutination phase” where they form pseudopods and slowly move toward one another until membrane contact occurs. Results are evaluated microscopically and scored by the percentage of cells agglutinated on a scale of 0 – 12. The score for each reaction was added together and divided by the total number of donors used. GAT results were interpreted as positive if this average agglutination score is greater than or equal to 3.8.18 Granulocyte immunofluorescence (GIFT) by flow cytometry GIFT was performed by the method of Verheugt et al 1977,19 with minor modifications. We used panels of neutrophils from a minimum of 5 donors whose HNA types had been previously established. An assortment of donors positive and negative for common HNA antigens was created to identify antibody specificity via reactivity patterns. Gift was interpreted as positive if cells from at least one granulocyte panel donor exceeded the calculated cutoff criteria (see below). To decrease nonspecific reactions with neutrophil Fc receptors and stabilize the cell membrane, the donor granulocytes were fixed with 1% paraformaldehyde. The granulocyte suspension was washed in Hank’s Balanced Salt Solution containing 20μM HEPES buffer and 1% normal calf serum. The cell suspension was adjusted to a concentration of 1 × 10⁷/mL.18 A 1:6 dilution of specimen was incubated with the granulocytes for 30 minutes at 36 –38°C. Following a wash

step that removes unbound antibodies, the granulocytes were then incubated with F(ab’)2 IgG/IgM/IgA fragments of fluorescein isothiocyanate conjugated to goat anti-human antibody for 30 minutes at 20 – 24°C. This technique is akin to the granulocyte immunofluorescence assay18 but instead of interpretation by a technologist with a fluorescent microscope, the cells are analyzed by a flow cytometer comparing the test sample to known negative and positive antiserum. If the sample contained an antibody corresponding to an antigen on that donated granulocyte, the flow cytometer software determined a mean fluorescent intensity (MFI) and the percentage of granulocytes demonstrating fluorescence (i.e. percentage of positive cells or PPC). Using antibody negative samples, predetermined cutoff values for the MFI and the PPC were calculated by placing the cutoff at 2 standard deviations above the mean for these negative specimens. Based upon this work, a sample is determined to be antibody positive if both its MFI and PPC are greater than or equal to their respective cutoffs. GIFT strength: new variables proposed and investigated Two novel calculations were also created (D.M., R.S, David Stroncek) to possibly assess the strength of antibody reactivity by GIFT if cells from at least one donor were interpreted as positive:
a) Average mean fluorescent intensity ratio (AMFIR): In the main manuscript Table 3b, the quantity of anti-HNA was determined by AMFIR multiplied by the volume of plasma. For each granulocyte panel cell tested with an unknown serum, the mean fluorescent intensity (MFI) was divided by the cut-off to obtain a mean fluorescent intensity ratio. The sum of all ratios was divided by the number of granulocyte donors analyzed.
i. Example: Serum X is tested against a 5 granulocyte cell panel. The MFIs generated by the flow cytometer are 5, 4, 3, 2 and 1. If the cutoff value for the MFI is 2 the mean fluorescent intensity ratio for each becomes: 5; & 4; & 3; & 2; & 1 = or 2.5 & 2 & 1.5 & 1 & 0.5 2 2 2 2 2
ii. The AMFIR then becomes 2.5 +2+1.5+1+0.5 = 1.5 5
b) Mean Percentage of Positive Cells (MPPC): The flow cytometer calculates the percentage of granulocytes demonstrating fluorescence. The MPP is the average of the percentage of antibody coated granulocytes for each screening cell tested.
i. Example: Serum X is tested against 5 separate granulocyte suspensions. The percentage positive for each of these donors is 50%, 40%, 30%, 20%, and 10%.
ii. The MPPC then becomes: 50% +40% +30% +20% +10% = 30% 5
The MPPC calculation took into account all cells tested in the panel (both granulocytes that do express and that do not express the specific neutrophil alloantigen). Unless the antibody is directed against a high frequency antigen or is pan-reactive, an MPPC score of 100% is impossible.
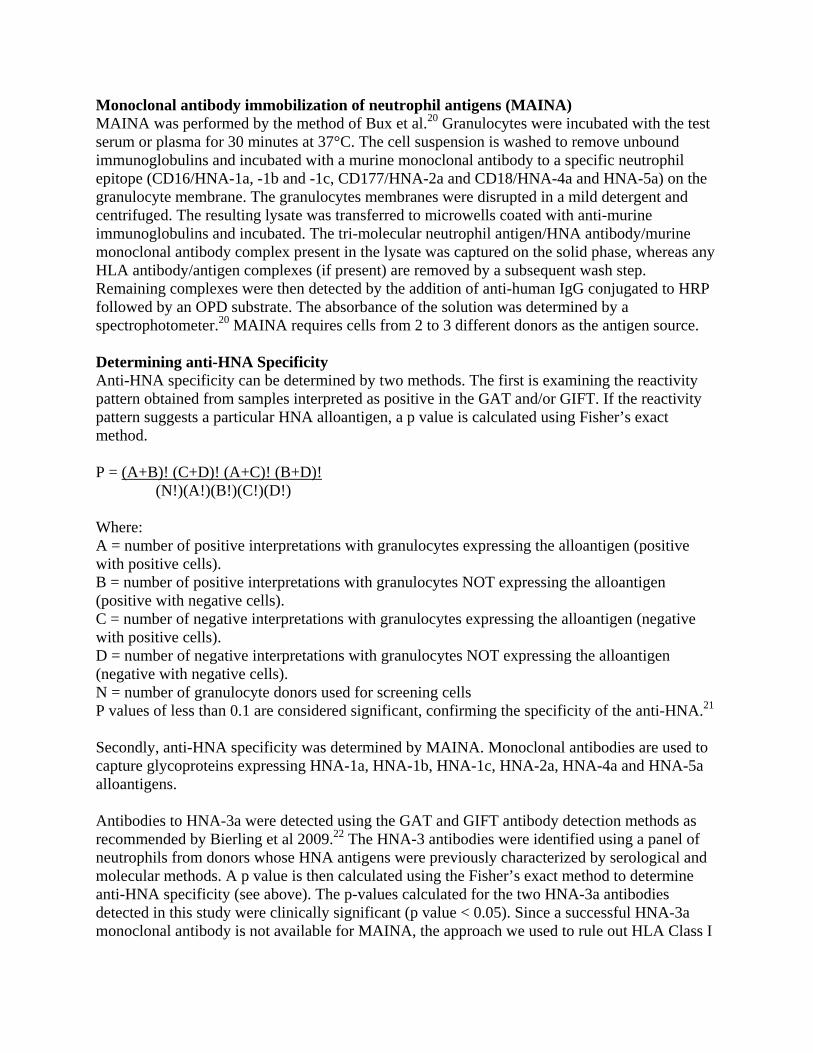
Monoclonal antibody immobilization of neutrophil antigens (MAINA) MAINA was performed by the method of Bux et al.20 Granulocytes were incubated with the test serum or plasma for 30 minutes at 37°C. The cell suspension is washed to remove unbound immunoglobulins and incubated with a murine monoclonal antibody to a specific neutrophil epitope (CD16/HNA-1a, -1b and -1c, CD177/HNA-2a and CD18/HNA-4a and HNA-5a) on the granulocyte membrane. The granulocytes membranes were disrupted in a mild detergent and centrifuged. The resulting lysate was transferred to microwells coated with anti-murine immunoglobulins and incubated. The tri-molecular neutrophil antigen/HNA antibody/murine monoclonal antibody complex present in the lysate was captured on the solid phase, whereas any HLA antibody/antigen complexes (if present) are removed by a subsequent wash step. Remaining complexes were then detected by the addition of anti-human IgG conjugated to HRP followed by an OPD substrate. The absorbance of the solution was determined by a spectrophotometer.20 MAINA requires cells from 2 to 3 different donors as the antigen source. Determining anti-HNA Specificity Anti-HNA specificity can be determined by two methods. The first is examining the reactivity pattern obtained from samples interpreted as positive in the GAT and/or GIFT. If the reactivity pattern suggests a particular HNA alloantigen, a p value is calculated using Fisher’s exact method. P = (A+B)! (C+D)! (A+C)! (B+D)! (N!)(A!)(B!)(C!)(D!) Where: A = number of positive interpretations with granulocytes expressing the alloantigen (positive with positive cells). B = number of positive interpretations with granulocytes NOT expressing the alloantigen (positive with negative cells). C = number of negative interpretations with granulocytes expressing the alloantigen (negative with positive cells). D = number of negative interpretations with granulocytes NOT expressing the alloantigen (negative with negative cells). N = number of granulocyte donors used for screening cells P values of less than 0.1 are considered significant, confirming the specificity of the anti-HNA.21 Secondly, anti-HNA specificity was determined by MAINA. Monoclonal antibodies are used to capture glycoproteins expressing HNA-1a, HNA-1b, HNA-1c, HNA-2a, HNA-4a and HNA-5a alloantigens. Antibodies to HNA-3a were detected using the GAT and GIFT antibody detection methods as recommended by Bierling et al 2009.22 The HNA-3 antibodies were identified using a panel of neutrophils from donors whose HNA antigens were previously characterized by serological and molecular methods. A p value is then calculated using the Fisher’s exact method to determine anti-HNA specificity (see above). The p-values calculated for the two HNA-3a antibodies detected in this study were clinically significant (p value < 0.05). Since a successful HNA-3a monoclonal antibody is not available for MAINA, the approach we used to rule out HLA Class I
antibody reactivity was to select granulocyte panel cells that did not express cognate HLA Class I specific antigens for the specific HLA Class I antibodies detected in the donor specimen. Statistical methods Sampling of controls We prospectively sampled controls over the same periods in which cases were ascertained at the two sites. The case-control study was designed for a 1:1 case: control ratio. During the study period, we divided the calendar time into 8-month blocks. At the beginning of each 8-month sampling block, the numbers of cases to date at each location were used to project how many controls to sample in each number of units stratum. Control sampling was stratified by calendar time and by three categories of number of associated units within six hours of the event (low 1–2 units, medium 3–9 units, high 10 or more units). As we assumed risk factors for TRALI were unknown, controls were not matched to cases by any other factor. Controls were chosen from among all eligible patients, as defined above. The control subject selected was the first patient who met inclusion criteria on or after the date of selection. Details are described below. We stratified sampling by number of units transfused over the 6 hour period during and before edema, because this was likely to be a strong risk factor and having too few controls with large numbers of units transfused would make assessment of other risk factors more difficult. Simple random sampling from among all eligible patients would have been the conceptually the optimal approach. This was not possible, however, because a list of all eligible patients from the entire ascertainment period would have been difficult to produce, and because sampling had to be done in real time, rather than retrospectively, in order to obtain the needed information about risk factors. We therefore used the following procedures to approximate a stratified random sample. We divided the calendar time into periods as shown in Table S2. Shortly before the beginning of each period, we determined a target number of controls at each site in each of three strata based on cases and controls recruited to date in those strata, along with projected numbers of new cases expected by the end of the upcoming period. The strata were defined by receiving 1 or 2 units, 3–9 units, or >9 units. We randomly sampled days within the period, without replacement and allocated across 3 equal sub-periods (except the last period, which was only 2 months long) to ensure that sampling rates would be somewhat even over time, and obtained one control on each sampled day. The stratum of the control to obtain on each day was assigned at random, restricted to match the needed number of controls in each stratum. To ensure logistical feasibility, we re-did the entire process for a period using a different random number seed if the initial sampling plan would have required controls from the >9 stratum on 2 or more consecutive days. We initially aimed to have as many controls as cases in each stratum. When no suitable control was available on a chosen day, the next day was used instead, and if necessary the day after that, and so on until the needed control was obtained. When more than one suitable control was available, we had originally intended that one be chosen based on time of day, but we discovered that research assistants were instead selecting the one who was first alphabetically by surname. Beginning July 1, 2007, we implemented new procedures to ensure that when multiple suitable controls were available on a sampled day, one was selected at random. Thereafter, we adjusted the desired numbers of controls to target having as many controls from after June 30, 2007 in each stratum as the total number of TRALI cases from the entire recruitment period. We also set

a minimum of one control in each stratum in each sub-period. This, combined with projected numbers of cases that tended to be too high due to declining incidence, resulted in the total number of controls (N=164) substantially exceeding the number of TRALI cases (N=89). We investigated the impact of excluding the initial alphabetically selected controls on the fitted models in Table 4 of the main paper. Results were qualitatively similar, but with much wider confidence intervals (reflecting effective loss of cases with few or no controls within their site-volume-date stratum) and a few somewhat changed estimates. Because the main potential confounder that might be biased by alphabetic selection is race/ethnicity, which did not appear to be substantially associated with TRALI risk, we believe that using all controls did not introduce any important bias in the study’s results. TRALI incidence analysis TRALI mitigation occurred in 2007–2008. In 2006, neither center had started TRALI mitigation. In 2009, both sites had completed TRALI mitigation. Incidence in 2006 and 2009 were compared. To assess trend, monthly counts of TRALI cases were modeled by Poisson regression, controlling for the number of transfusions in each month. Months during the mitigation phase-in period were assumed to reflect part of the estimated mitigation effect, in proportion to how much of the phase-in had occurred by each day in the month. More general negative binomial regression models did not substantially improve the fit to the data, and they produced qualitatively similar results in all cases. The “poisson” and “nbreg” commands in Stata (version 9, Statacorp, College Station, TX) were used with the number of transfusions specified as the “exposure” variable. We also analyzed incidence at the patient level in 2006 vs. 2009. “Per patient transfused” means unique medical record numbers of transfused patients, and would count the patient only once during the entire study period, even if the patient were transfused multiple times during multiple hospitalizations. Instead, we analyzed TRALI incidence “per transfused patient-days”, which was defined as unique medical record numbers among transfused patients per day (per 24 hour period). For example, a patient transfused multiple units in one day was counted once, and a patient transfused on 3 separate days was counted as 3 transfused patient-days. Risk factor analysis Although some analyses of TRALI focus on units of blood products, TRALI occurs in patients rather than in units, so our analyses treat each patient as one observation. This permits assessment of risk factors that pertain to patients, in addition to those measured in the units. In keeping with the case-control design, the primary outcome was whether the patient was a TRALI case or a control, and we modeled this using logistic regression. We initially used stratification and weights in the SAS SurveyLogistic procedure23 to account for the control sampling design. This permits assessment of the effects of number of units received, even though this was used to define sampling strata for controls. We thought that this was important because the number of units transfused was of considerable interest as a likely risk factor. Weights specific to each period (or sub-period) would be too variable and give too much influence to some controls relative to others. We therefore coarsened the weights, a practice that is common for similar reasons when weights are estimated.24 We defined weights specific to site, stratum, and whether the period was before or after TRALI mitigation. At UCSF, TRALI mitigation was phased in from March to September 2007, so we counted the first two periods as pre-mitigation and the last
four as post-mitigation. At Mayo, mitigation was phased in from November 2007 to May 2008, so we counted the first three periods as pre-mitigation and the last three as post-mitigation. Table S3 shows the numbers of eligible and sampled control patients, along with the resulting sampling fractions and weights. The increasing sampling fractions across the unit strata reflect our design and the fact that higher numbers of units are a risk factor for TRALI. The analysis weights can be thought of as the number of patients represented by each control. Because we found that the effect of number of units could be almost completely explained by other measured factors (see below), we reverted to stratified conditional logistic regression as our primary analysis method. This controls for the sampling of controls by site, number of units, and period using an alternative strategy to the survey-weighted approach. It does not permit assessment of how risk differs between strata, because the method conditions on the numbers of cases and controls in each stratum, but we thought that this was no longer essential because the number of units did not appear to be an independent risk factor. Advantages of the conditional approach are that controls in different strata contribute more evenly to the overall results and the estimation may have been less vulnerable to artifacts due to models’ becoming too complex for the available amount of information (see below for further discussion). Multivariate model building We hypothesized that the number of units transfused might be an important risk factor for TRALI. To prevent confounding with the number of units from producing spurious results for other risk factors, we controlled for the number of units received within 6 hours before TRALI (or the corresponding artificial TRALI time created for controls), which we call “involved units”, in all models used to initially evaluate potential risk factors. Thus, a patient characteristic associated with needing many units would not appear to be risky unless it also increased risk by some other mechanism. We also controlled for study site (UCSF or Mayo), as is usual practice for multi-site studies. The effect of the number of involved units appeared to be nonlinear. In order to more plausibly model this and a number of other risk factors, we assumed that the effect should be constrained so that increasing values would never decrease the risk of TRALI. This led us to a model with two terms for units: 1) an indicator for whether more than 2 units were received and 2) how many additional units beyond 9 were received (0 for those receiving 9 or fewer). This model has risk flat between 1 and 2 units, increasing between 2 and 3 units, flat from 3 to 9 units, and increasing with each unit after 9 units. More flexible preliminary models had small risk decreases between 1 and 2 units and over 3 to 9 units, although these decreases were not statistically significant. The estimated odds ratio was 4.5 for >2 units versus 1 or 2, and it was 1.32 per unit for each unit beyond 9, both with p<0.0001. We defined and evaluated a large number of potential risk factors. Many numeric predictors had right-skewed distributions, with many small values and a few much larger values. Because the assumption of a linear effect on the log odds is particularly suspect for such variables, we also evaluated logarithmic transformations of them. Several numeric risk factors had a substantial proportion of subjects with values of zero or below detection limits. For these, we also evaluated binary versions, any versus none. For some risk factors defined by measurements on units, we evaluated the total amount summed across all units that the patient received, the highest amount
in any one unit, the highest concentration or strength (NBG ratio, MFI, GAT score, AMFIR score, MPPA score) in any one unit, the total volume of units with concentrations/strengths above various thresholds, and any versus none. For SAB antibody specificities, we examined both sums of all specificities in units and the maximum mean fluorescent intensity (MFI) value over specificities and over units. We initially limited candidate variables to those that appeared most promising from initial models controlled only for number of involved units and site. Because TRALI mitigation is now widespread, when we began to analyze the data, we controlled for receipt of any female plasma or whole blood when building a multivariate model. While receipt of female plasma or whole blood was a strong risk factor (See Table 4a in the main manuscript), we still wanted to include all patients to provide information about other factors that may have contributed to why they did or did not have TRALI. Excluding those subjects who had received any female plasma or whole blood would have left only 38 cases and 109 controls. Including female plasma or whole blood made it possible to account for the likely effect of current TRALI mitigation practices, while still including all of the subjects. Beginning with site, the two variables for the number of units received, and receipt of any female plasma or whole blood, we then evaluated models that added each remaining candidate risk factor as a single additional predictor. Receipt of cognate anti-HLA-Class II was a strong risk factor. Because this is uncommon among units, and the numerical measure of it, MFI, is highly skewed when it occurs, different measures of this were considerably collinear. We selected the one measure that had the smallest p-value, which was the highest MFI for any one specificity in any one unit, modeled after logarithmic transformation. We next added peak airway pressure, modeled as having a linear effect per unit above 30 cmH20 but no effect below 30 cm H2O, with those subjects were not intubated before the first involved unit included as having a peak airway pressure below 30 cm H2O. We then added an indicator for being a liver surgery patient, at which point the estimated effect of having received 3–9 units versus having received 1 or 2 became slightly protective. Because a protective effect of getting more units is not plausible, this variable was dropped. We then added alcohol abuse, fluid balance, and the amount of GIFT Average Mean Intensity X-axis (AMFIR), at which point the effect per unit received beyond 9 units dropped to an OR of only 1.09 with p=0.18, so we dropped this variable. We also found that the indicator for having received any female plasma or whole blood was now less predictive than having received any plasma or whole blood from a woman who reported having ever been pregnant, so we substituted this variable. We then added duration of surgery and an indicator for having had surgery in the week prior to receiving the first involved unit. We did not consider the protective effect of surgery within the last week to be implausible, because this could reflect routine surgery patients’ being healthier than patients who were in the hospital for other reasons. In this model, it appeared that GIFT Avg Mix (AMFIR) amount was better modeled with logarithmic transformation. With this change, we obtained the following multivariate model in Table S4. The very large odds ratios for two uncommon risk factors, liver surgery and alcohol abuse, raised some concern about the reliability of this model, particularly because the survey weighted logistic regression software produces clearly inaccurate standard errors of zero when odds ratios are infinite. We chose the weighted approach primarily to enable estimation of the effect of number of involved units, but the effects of those variables appeared to be virtually fully
explained by other factors and they dropped out of the modeling process. We therefore adjusted our approach to use stratified logistic regression, also known as conditional logistic regression. This method conditions on the numbers of cases and controls in each stratum (defined by site, number of involved units, and pre-/post-mitigation) while evaluating prediction of which patients in each stratum are cases or controls. This approach avoids giving more weight to the low-volume controls, instead treating all controls more equally. With this alternative method, site is no longer included as a covariate, because it defines strata, and receipt of any units from a donor who reported ever being pregnant now had a larger p-value (p=0.11), so this was dropped. We then performed additional steps one at a time of adding shock at the time of the first involved unit as a risk factor (p=0.0085), dropping surgery within the last week (p=0.11), dropping duration of surgery (p=0.21), and replacing peak airway pressure as previously modeled (per unit above 30 cm H2O, p=0.073) with a dichotomous variable simply indicating whether peak airway pressure was greater than 30 cm H2O (p=0.019). We then re-examined the antibody specificities in detail, finding that the total amount of cognate anti–HLA-Class II appeared to predict somewhat better than the previous variable, the highest strength of any one cognate specificity in any one unit. These two, and the highest amount of anti–HLA-Class II in any one unit, were all fairly collinear, so none had a small p-value when controlled for any other, but the total amount received, modeled after logarithmic transformation, still appeared risky when controlled for the other, while the other appeared protective. We therefore obtained the model in Table S5. We then evaluated every potential candidate predictor when added as a single additional predictor to this model, including those that initially did not appear promising. Only two were found to be plausible, missing for only a few patients, and statistically significant: current smoking (odds ratio 3.5, p=0.021) and obstructive lung disease (odds ratio 3.7, p=0.42). We therefore evaluated current smoking and obstructive lung disease together in the multivariate model, where both had odds ratios of 3.0 but current smoking had a smaller p-value (0.054 vs. 0.12). We added current smoking to produce the primary multivariate model shown as Table 4b in the main manuscript. When added to that primary model, the patient’s plasma IL-8 level measured before the first involved unit also appeared to be risky, with an odds ratio per 10-fold increase of 3.0, CI 95% 1.30 to 6.9, and p=0.0097, but this variable was missing for 50 patients; reducing the set of analyzed patients to accommodate this variable appeared to disrupt the estimates of other risk factors somewhat, so this was not included in the primary model. Replacing the two transfusion antibody predictors in Table 4b (main manuscript) with female plasma or whole blood produced Table 4a (main manuscript), and showed that female plasma or whole blood was a predictor when controlled for patient factors. Alternative method to avoid degenerate estimates for a rare risk factor Neither survey-weighted nor stratified logistic regression can provide valid analysis when estimated log odds ratios are infinite. One variable of interest, whether the patient had bone marrow or stem cell transplant, was not present for any cases but was present for 15 controls. To evaluate this in a multivariate model, we sought a way to use a modification of logistic
regression25 that would produce estimates and standard errors suitable for use with multiple imputation (see below). This required using the SAS logistic regression procedure without stratification, so we defined weights suitable for use with this method by proportionally rescaling the survey weights for the controls so that they added to the total number of controls (cases retained their weights of 1, reflecting that all cases were sampled). Unfortunately, these weights resulted in rather different estimates from the final survey-weighted model, even without applying the modification. Rescaling all weights to add to the total number of cases and controls would produce the same estimates as the survey-weighted approach, but this would severely down weight the cases relative to the controls, producing effectively infinite standard errors and useless results. This therefore can only provide a rough assessment. When added to the final survey-weighted model with the modification to prevent degenerate estimates, the estimated odds ratio for bone marrow or stem cell transplant by this method was 0.11 (confidence interval 0.01 to 2.2, p=0.15). Multiple imputation Some key predictors of the risk of TRALI are characteristics of the units that the patients received, and these were missing for some units. Some characteristics (bioactive substances in the transfused units) could not be measured when bags were not returned to the Blood Bank after being transfused. Some characteristics (donor antibodies) could be measured on stored donor samples or new samples by donor recall, but not all donors were tested. There were also (rarely) some missing values due to assay failure or specimen problems. The common approach of only analyzing subjects with complete data was not viable, because missing values were common and a missing value on any one of a patient’s received units would drop that entire patient from the analysis. For example, PF4 was missing for 52% of units given to Control subjects, but 73% of Controls had at least one unit with missing PF4. Calculating for each patient the total exposure using only units with non-missing data would be equivalent to imputing values of zero for the units with missing information, which would be inaccurate. An alternative, known as “multiple imputation”, is widely considered a better approach, because it reduces bias and more fairly reflects the uncertainty caused by the missing information.26 We implemented a multiple imputation strategy using the “ice” package27 in STATA version 11 (StataCorp, College Station, TX). Multiple imputation was done all together for missing units for all types of subjects (TRALI case, ALI case, TACO case, or Control subject). We grouped the variables into two independent sets: Group 1) measured cytokines and other bioactive substances, variables from a specimen of the unit itself, and Group 2) donor antibody-related variables that were measured either on a bag specimen, a specimen stored at the time of donation, or by donor recall. In both sets, most variables had non-normal distributions, with several values below quantification limits or undetectable and the remaining values right-skewed with some very large values. To enable the multiple imputation software to work properly for these variables, we created two variables from each. One was a yes or no indicator of whether the variable had a quantifiable or detectable level, and the other was equal to the original variable if it was quantifiable or detectable and was set to missing if not (we term this the “nonzero” version). In the imputation process, the yes or no variables were modeled by logistic regression and the nonzero versions by linear regression (often after logarithmic transformation). Having the bolus of undetectable values set to missing when imputing the nonzero versions prevented them from distorting the mean and standard deviation of the nonzero values. The final imputed
value was then set to undetectable or below the quantification limit if the imputed yes or no variable was “no” and was set to the imputed nonzero value if the yes or no variable was “yes”. This allowed the final imputed values to reflect the distributions of the non-missing values. Group 1 variables included lysoPC, cytokines (IL-1ra, IL-1b, IL-2, IL4, IL-6, IL-8, IL-10, GMCSF, IFNγ, TNFα), VEGF, sCD40L, PF4, CD11b, and CD11b-CD66b. These were missing for 49–52% of the units given to control subjects, except IL-1b, IL-2, and IL-4 were missing for 65% of those units (these tests were dropped by the manufacturers of the kit). We recognized that the analysis of these biologic variables would be limited because of the inability to capture a higher fraction of the plasma from the donor blood bags, but we still concluded it was reasonable to analyze their potential relationship to TRALI, understanding that any conclusions would need to be verified in subsequent prospective studies. All of the measures had a large number of undetectable values except lysoPC, IL-10, TNFα, and VEGF. The variable sCD40L was measured only for platelet units and was assumed to be zero for all other units (sCD40L was found to be extremely low in non-platelet units in a pilot study). This created a bolus of zero values, so to prevent them from distorting the imputation for platelet units, we created a platelet-only version that was set to missing for non-platelet units. The imputed values of this variable were then used for platelet units, but ignored for all other types of units. We allowed all variables to be used as predictors for imputing the others in Group 1, and we also included the important predictors of component type, age of the unit, and the type of subject (TRALI case, ALI case, TACO case, or Control subject). For key analyses, the type of subject is the outcome variable, and including this in the imputation process is necessary to avoid attenuation of risk factors’ effects.28 We used logarithmic transformations to make the distributions of the nonzero variables less skewed. In addition, for some measures we Winsorized29 some extreme outliers by setting them to equal the largest observed value that was not an extreme outlier. This was to prevent them from being overly influential both in the imputation process and in subsequent analyses. Table S6 shows the Winsorizing values, number of values changed, and the transformations used in the imputation regression models. Group 2 variables included: American Red Cross Granulocyte Antibody (yes if GAT > 3.8 or GIFT > 0); GAT overall score; GIFT average mean intensity x-axis; GIFT average percent positive; HNA-1a, -1b, -1c, -2a, -4a and -5a ratios; MICA max; HLA Class I max; HLA Class II max; and HLA single antigen bead MFI measures for over 100 HLA antibody specificities. For units given to control subjects, rates of missing data were only 12% for Class I and II max and MICA max; for units given to TRALI cases missing rates were 20% for Class I and II max and MICA maximum. Measures that were imputed as zero because they were too rarely detectable to be included in the multiple imputation process were: HNA-1a, -1b, -1c, - 2a, and -3a specificities; and the single antigen bead MFI for HLA specificities DP6, DP20, and DP28 (in addition, a number of specificities that were never detected have been ignored throughout because they cannot be analyzed as risk factors). Each of the remaining Group 2 variables was imputed using both a yes or no variable and a nonzero variable, as described for Group 1. The most commonly detectable measure was MICA max, which was detectable for 1459 of 2135 measured donors/units (68%). For SAB specificities, we considered values >300 to be positive (a low cutoff), but all specificities were undetectable for 90% or more of measured units. Because there were so many variables in this group, we could not use all as predictors for imputing the
others. Instead, we specified parsimonious models for each variable, with predictors including type of subject, donor gender, and number of donor’s pregnancies for all variables. For variables that were detectable for at least 60 of the donors/units, we also included MICA max as a predictor because it most frequently had a detectable value. For imputing missing values for number of donor’s pregnancies (missing for 230 of 1148 female donors), we used type of subject, donor’s age, Class I max, Class II max, and whether GAT was detectable, as these were the strongest predictors that were available for a sizeable proportion of those with missing number of pregnancies. Table S7 shows the values used for Winsorizing, the % of detectable values that were changed, and transformations used in the multiple imputation models. For both groups of variables, imputed values were back transformed to the original units, with the imputed value set to zero if the imputed yes or no indicator for a detectable value was “no”. Imputed values were Winsorized using the limits in Tables S6 and S7, and for variables that were not Winsorized, any imputed values larger than the largest value actually observed for that measure were set to equal the largest observed value. We performed the above procedures to create 20 sets of imputed complete data on all units. Patient-level risk factors were then calculated using the values for all the units given to the patient, and these were used in analyses. The results of the 20 analyses were synthesized using the MIAnalyze procedure in SAS version 9.2 (SAS Institute, Cary, NC). Cytokines measured in the plasma of recipients and donor units For TRALI cases, specimens for testing cytokines were stored under refrigeration until adjudication confirmed that they qualified for this study. In contrast, controls were included earlier and so their specimens tended to have shorter storage times. Because storage could change levels of these variables, we performed an experiment designed to allow re-calibration of our data to a standard storage time. Unfortunately, this experiment was not successful, because values differed systematically from those on our control subjects, even though the patients providing the specimens were selected to be similar to our controls. We therefore did not adjust our measurements of these variables. This could allow some bias in our estimates. In addition, the lack of reproducibility suggests the possibility of measurement error in our data. This could bias analyses toward null results, which may contribute to the lack of statistically significant effects of cytokines as predictors when added to our primary multivariate model. Thus, we have limited evidence for or against cytokines in donor units playing a major role in the pathogenesis of TRALI. Analysis of age of red blood cell units We considered using mean, median, and maximum age of various component types as predictors variables because these have been used in previous studies. However, these approaches have some serious flaws. For a patient who received a unit that was 4 weeks old, having also received a unit that was 1 week old would reduce the mean and median age compared to not having received the 1-week-old unit. However, it is not plausible that receiving an additional unit could somehow prevent TRALI. Those predictors therefore fail to meet the basic plausibility criterion that additional units never reduce risk. Although maximum age does not suffer from this drawback, it and the others have the problem of not being defined for patients who did not receive any units of the particular component type. We have therefore used as primary predictors tallies of the numbers of units of each component type and the numbers of those that were above

certain age cutoffs. These can never be reduced by addition of fresher units, and they are well-defined (zero) for those who did not receive any units of the given type.
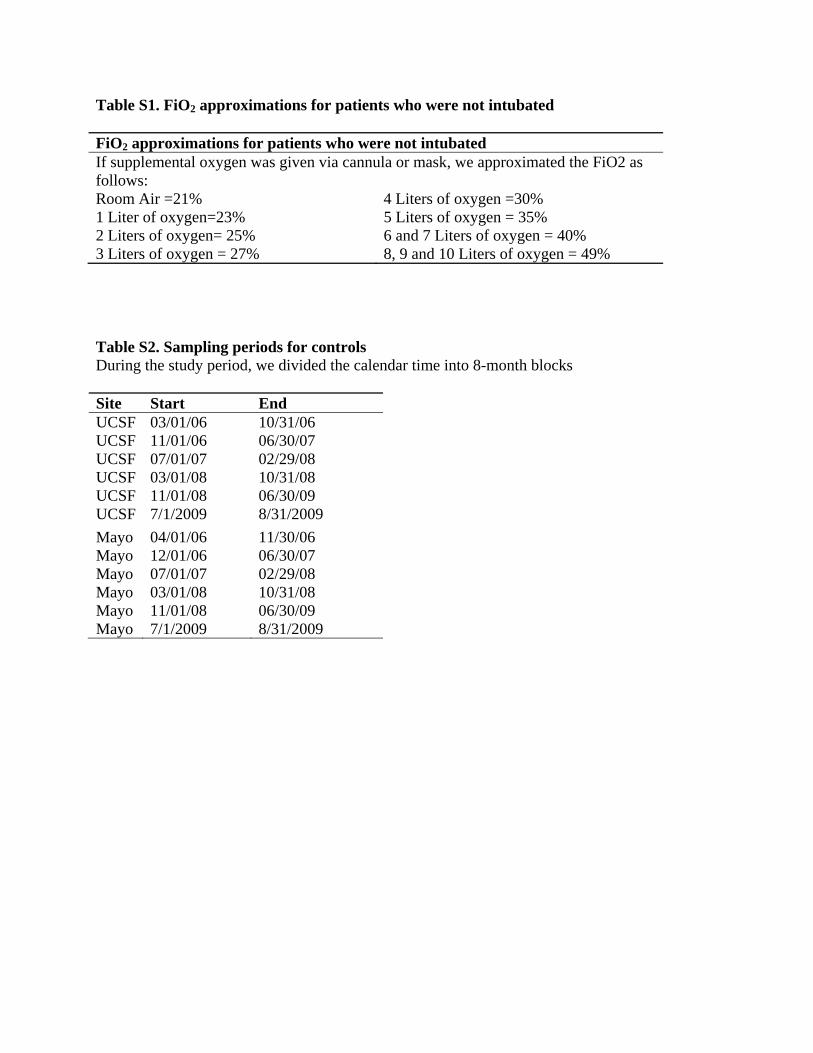
Table S1. FiO2 approximations for patients who were not intubated FiO2 approximations for patients who were not intubated If supplemental oxygen was given via cannula or mask, we approximated the FiO2 as follows: Room Air =21% 4 Liters of oxygen =30% 1 Liter of oxygen=23% 5 Liters of oxygen = 35% 2 Liters of oxygen= 25% 6 and 7 Liters of oxygen = 40% 3 Liters of oxygen = 27% 8, 9 and 10 Liters of oxygen = 49% Table S2. Sampling periods for controls During the study period, we divided the calendar time into 8-month blocks Site Start End UCSF 03/01/06 10/31/06 UCSF 11/01/06 06/30/07 UCSF 07/01/07 02/29/08 UCSF 03/01/08 10/31/08 UCSF 11/01/08 06/30/09 UCSF 7/1/2009 8/31/2009 Mayo 04/01/06 11/30/06 Mayo 12/01/06 06/30/07 Mayo 07/01/07 02/29/08 Mayo 03/01/08 10/31/08 Mayo 11/01/08 06/30/09 Mayo 7/1/2009 8/31/2009
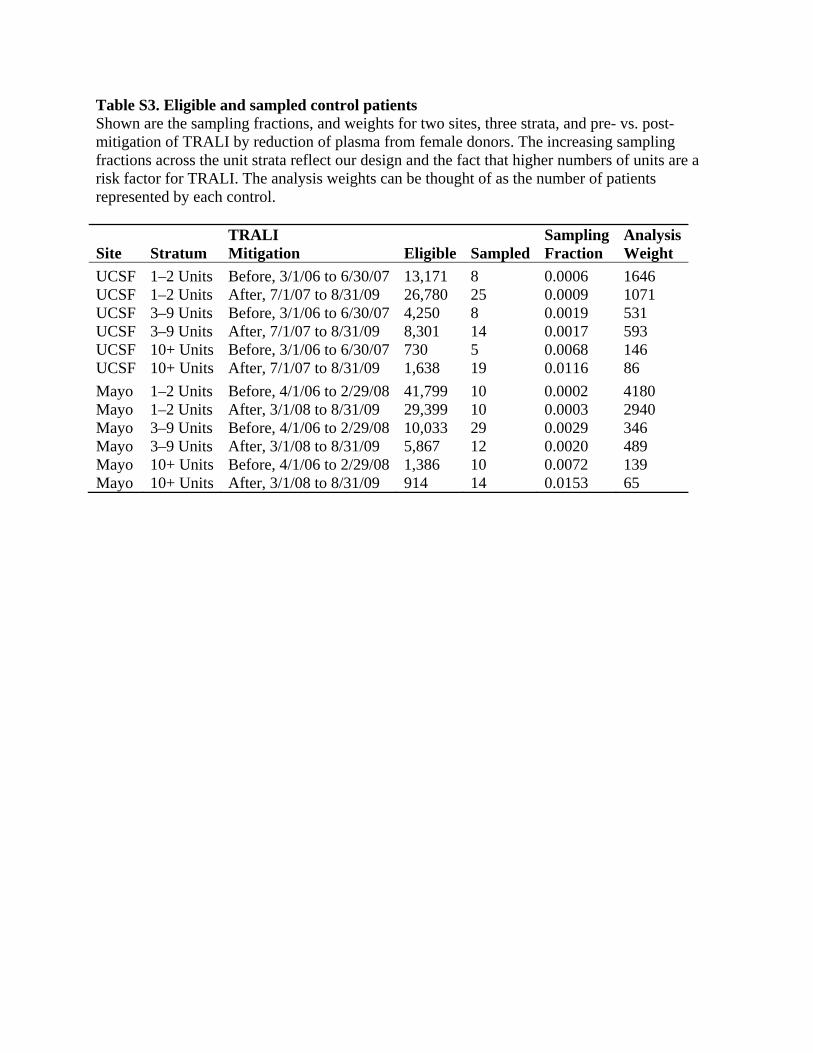
Table S3. Eligible and sampled control patients Shown are the sampling fractions, and weights for two sites, three strata, and pre- vs. post-mitigation of TRALI by reduction of plasma from female donors. The increasing sampling fractions across the unit strata reflect our design and the fact that higher numbers of units are a risk factor for TRALI. The analysis weights can be thought of as the number of patients represented by each control. TRALI Sampling AnalysisSite Stratum Mitigation Eligible Sampled Fraction Weight UCSF 1–2 Units Before, 3/1/06 to 6/30/07 13,171 8 0.0006 1646 UCSF 1–2 Units After, 7/1/07 to 8/31/09 26,780 25 0.0009 1071 UCSF 3–9 Units Before, 3/1/06 to 6/30/07 4,250 8 0.0019 531 UCSF 3–9 Units After, 7/1/07 to 8/31/09 8,301 14 0.0017 593 UCSF 10+ Units Before, 3/1/06 to 6/30/07 730 5 0.0068 146 UCSF 10+ Units After, 7/1/07 to 8/31/09 1,638 19 0.0116 86 Mayo 1–2 Units Before, 4/1/06 to 2/29/08 41,799 10 0.0002 4180 Mayo 1–2 Units After, 3/1/08 to 8/31/09 29,399 10 0.0003 2940 Mayo 3–9 Units Before, 4/1/06 to 2/29/08 10,033 29 0.0029 346 Mayo 3–9 Units After, 3/1/08 to 8/31/09 5,867 12 0.0020 489 Mayo 10+ Units Before, 4/1/06 to 2/29/08 1,386 10 0.0072 139 Mayo 10+ Units After, 3/1/08 to 8/31/09 914 14 0.0153 65
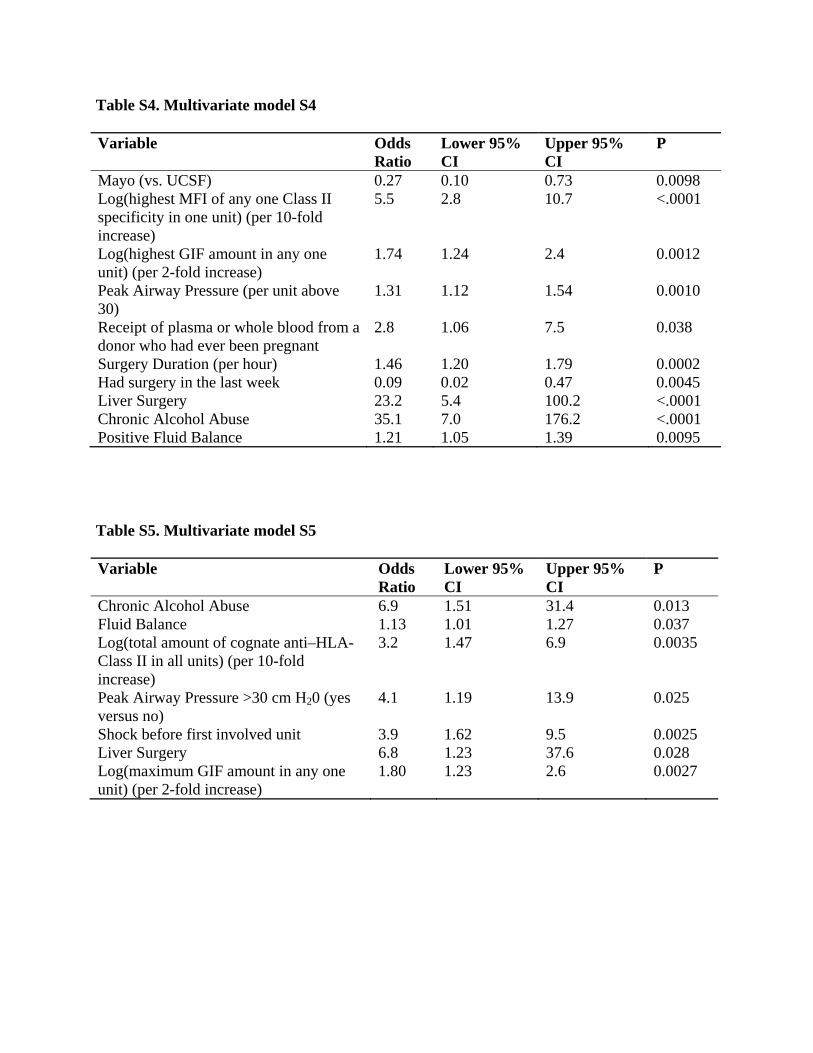
Table S4. Multivariate model S4 Variable Odds
Ratio Lower 95% CI
Upper 95% CI
P
Mayo (vs. UCSF) 0.27 0.10 0.73 0.0098 Log(highest MFI of any one Class II specificity in one unit) (per 10-fold increase)
5.5 2.8 10.7 <.0001
Log(highest GIF amount in any one unit) (per 2-fold increase)
1.74 1.24 2.4 0.0012
Peak Airway Pressure (per unit above 30)
1.31 1.12 1.54 0.0010
Receipt of plasma or whole blood from a donor who had ever been pregnant
2.8 1.06 7.5 0.038
Surgery Duration (per hour) 1.46 1.20 1.79 0.0002 Had surgery in the last week 0.09 0.02 0.47 0.0045 Liver Surgery 23.2 5.4 100.2 <.0001 Chronic Alcohol Abuse 35.1 7.0 176.2 <.0001 Positive Fluid Balance 1.21 1.05 1.39 0.0095 Table S5. Multivariate model S5 Variable Odds
Ratio Lower 95% CI
Upper 95% CI
P
Chronic Alcohol Abuse 6.9 1.51 31.4 0.013 Fluid Balance 1.13 1.01 1.27 0.037 Log(total amount of cognate anti–HLA-Class II in all units) (per 10-fold increase)
3.2 1.47 6.9 0.0035
Peak Airway Pressure >30 cm H20 (yes versus no)
4.1 1.19 13.9 0.025
Shock before first involved unit 3.9 1.62 9.5 0.0025 Liver Surgery 6.8 1.23 37.6 0.028 Log(maximum GIF amount in any one unit) (per 2-fold increase)
1.80 1.23 2.6 0.0027
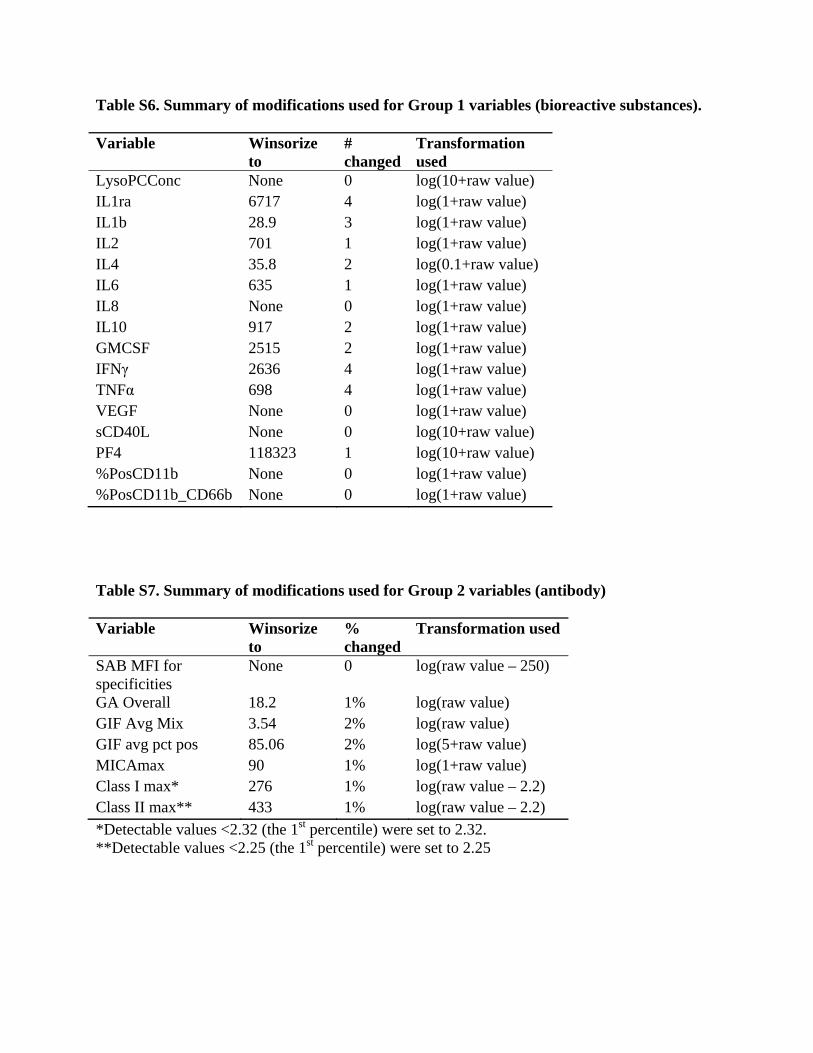
Table S6. Summary of modifications used for Group 1 variables (bioreactive substances). Variable Winsorize
to # changed
Transformation used
LysoPCConc None 0 log(10+raw value) IL1ra 6717 4 log(1+raw value) IL1b 28.9 3 log(1+raw value) IL2 701 1 log(1+raw value) IL4 35.8 2 log(0.1+raw value) IL6 635 1 log(1+raw value) IL8 None 0 log(1+raw value) IL10 917 2 log(1+raw value) GMCSF 2515 2 log(1+raw value) IFNγ 2636 4 log(1+raw value) TNFα 698 4 log(1+raw value) VEGF None 0 log(1+raw value) sCD40L None 0 log(10+raw value) PF4 118323 1 log(10+raw value) %PosCD11b None 0 log(1+raw value) %PosCD11b_CD66b None 0 log(1+raw value) Table S7. Summary of modifications used for Group 2 variables (antibody) Variable Winsorize
to % changed
Transformation used
SAB MFI for specificities
None 0 log(raw value – 250)
GA Overall 18.2 1% log(raw value) GIF Avg Mix 3.54 2% log(raw value) GIF avg pct pos 85.06 2% log(5+raw value) MICAmax 90 1% log(1+raw value) Class I max* 276 1% log(raw value – 2.2) Class II max** 433 1% log(raw value – 2.2) *Detectable values <2.32 (the 1st percentile) were set to 2.32. **Detectable values <2.25 (the 1st percentile) were set to 2.25
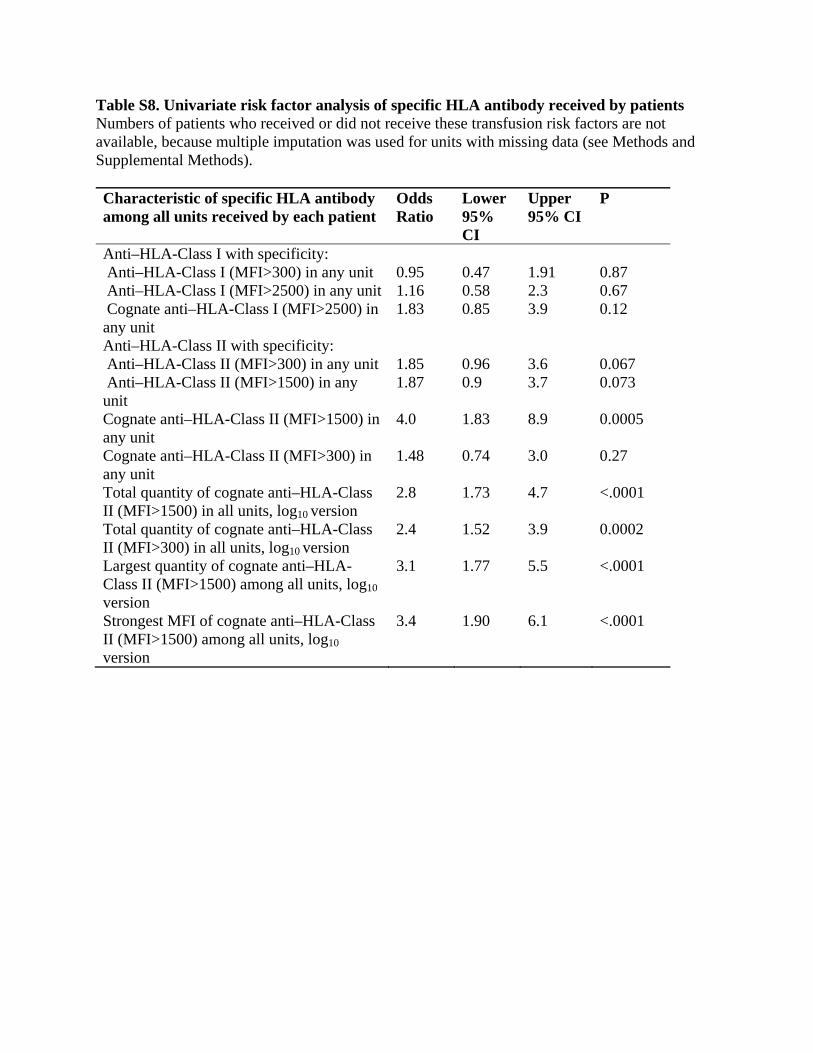
Table S8. Univariate risk factor analysis of specific HLA antibody received by patients Numbers of patients who received or did not receive these transfusion risk factors are not available, because multiple imputation was used for units with missing data (see Methods and Supplemental Methods). Characteristic of specific HLA antibody among all units received by each patient
Odds Ratio
Lower 95% CI
Upper 95% CI
P
Anti–HLA-Class I with specificity: Anti–HLA-Class I (MFI>300) in any unit 0.95 0.47 1.91 0.87 Anti–HLA-Class I (MFI>2500) in any unit 1.16 0.58 2.3 0.67 Cognate anti–HLA-Class I (MFI>2500) in any unit
1.83 0.85 3.9 0.12
Anti–HLA-Class II with specificity: Anti–HLA-Class II (MFI>300) in any unit 1.85 0.96 3.6 0.067 Anti–HLA-Class II (MFI>1500) in any unit
1.87 0.9 3.7 0.073
Cognate anti–HLA-Class II (MFI>1500) in any unit
4.0 1.83 8.9 0.0005
Cognate anti–HLA-Class II (MFI>300) in any unit
1.48 0.74 3.0 0.27
Total quantity of cognate anti–HLA-Class II (MFI>1500) in all units, log10 version
2.8 1.73 4.7 <.0001
Total quantity of cognate anti–HLA-Class II (MFI>300) in all units, log10 version
2.4 1.52 3.9 0.0002
Largest quantity of cognate anti–HLA-Class II (MFI>1500) among all units, log10 version
3.1 1.77 5.5 <.0001
Strongest MFI of cognate anti–HLA-Class II (MFI>1500) among all units, log10 version
3.4 1.90 6.1 <.0001

Table S9. Univariate risk factor analysis of HNA antibody received by patients Numbers of patients who received or did not receive these transfusion risk factors are not available, because multiple imputation was used for units with missing data (see Methods and online Supplement). Methods for the determination of AMFIR and MPPC are in the Supplemental Methods. Characteristic of anti-HNA in all units received by each patient
Odds Ratio
Lower 95% CI
Upper 95% CI
P
Anti-HNA measured by GIFT AMFIR:
Anti-HNA in any unit (AMFIR>0) 2.3 1.07 4.9 0.034 Total quantity of anti-HNA in all units (AMFIR × volume)
1.38 1.08 1.76 0.0092
Total quantity of anti-HNA in all units (AMFIR × volume), log2 version
1.43 1.14 1.79 0.0018
Anti-HNA strength measured by GIFT MPPC:
Total quantity of HNA Ab in all units (sum of MPPC × volume), log10 version
1.87 1.23 2.8 0.0032
Largest quantity of anti-HNA in a unit (MPPC × volume) among all units, log10 version
1.88 1.22 2.9 0.0042
Strongest anti-HNA in a unit (highest MPPC) among all units, log10 version
1.78 1.156 2.7 0.0089
Anti-HNA (measured by GAT): GAT greater than zero in any unit 1.40 0.709 2.8 0.33 Total quantity (GAT × volume) in all units, log2 version
1.34 1.081 1.661 0.0076
Strongest GAT among all units, log2 version
1.23 0.974 1.563 0.082
Largest quantity of anti-HNA in a unit (GAT × volume) among all units, log version
1.36 1.057 1.748 0.017
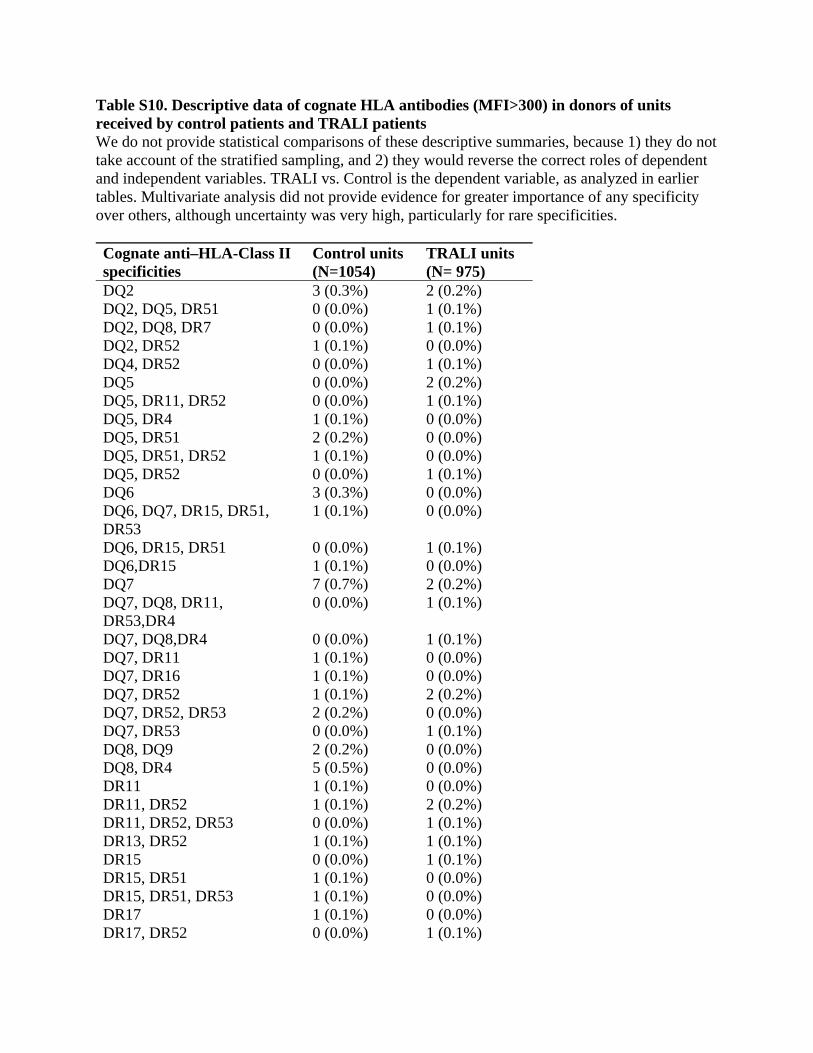
Table S10. Descriptive data of cognate HLA antibodies (MFI>300) in donors of units received by control patients and TRALI patients We do not provide statistical comparisons of these descriptive summaries, because 1) they do not take account of the stratified sampling, and 2) they would reverse the correct roles of dependent and independent variables. TRALI vs. Control is the dependent variable, as analyzed in earlier tables. Multivariate analysis did not provide evidence for greater importance of any specificity over others, although uncertainty was very high, particularly for rare specificities. Cognate anti–HLA-Class II specificities
Control units (N=1054)
TRALI units (N= 975)
DQ2 3 (0.3%) 2 (0.2%) DQ2, DQ5, DR51 0 (0.0%) 1 (0.1%) DQ2, DQ8, DR7 0 (0.0%) 1 (0.1%) DQ2, DR52 1 (0.1%) 0 (0.0%) DQ4, DR52 0 (0.0%) 1 (0.1%) DQ5 0 (0.0%) 2 (0.2%) DQ5, DR11, DR52 0 (0.0%) 1 (0.1%) DQ5, DR4 1 (0.1%) 0 (0.0%) DQ5, DR51 2 (0.2%) 0 (0.0%) DQ5, DR51, DR52 1 (0.1%) 0 (0.0%) DQ5, DR52 0 (0.0%) 1 (0.1%) DQ6 3 (0.3%) 0 (0.0%) DQ6, DQ7, DR15, DR51, DR53
1 (0.1%) 0 (0.0%)
DQ6, DR15, DR51 0 (0.0%) 1 (0.1%) DQ6,DR15 1 (0.1%) 0 (0.0%) DQ7 7 (0.7%) 2 (0.2%) DQ7, DQ8, DR11, DR53,DR4
0 (0.0%) 1 (0.1%)
DQ7, DQ8,DR4 0 (0.0%) 1 (0.1%) DQ7, DR11 1 (0.1%) 0 (0.0%) DQ7, DR16 1 (0.1%) 0 (0.0%) DQ7, DR52 1 (0.1%) 2 (0.2%) DQ7, DR52, DR53 2 (0.2%) 0 (0.0%) DQ7, DR53 0 (0.0%) 1 (0.1%) DQ8, DQ9 2 (0.2%) 0 (0.0%) DQ8, DR4 5 (0.5%) 0 (0.0%) DR11 1 (0.1%) 0 (0.0%) DR11, DR52 1 (0.1%) 2 (0.2%) DR11, DR52, DR53 0 (0.0%) 1 (0.1%) DR13, DR52 1 (0.1%) 1 (0.1%) DR15 0 (0.0%) 1 (0.1%) DR15, DR51 1 (0.1%) 0 (0.0%) DR15, DR51, DR53 1 (0.1%) 0 (0.0%) DR17 1 (0.1%) 0 (0.0%) DR17, DR52 0 (0.0%) 1 (0.1%)

DR51 0 (0.0%) 3 (0.3%) DR51, DR53 1 (0.1%) 0 (0.0%) DR52 5 (0.5%) 2 (0.2%) DR52, DR53, DR7 1 (0.1%) 0 (0.0%) DR53 3 (0.3%) 3 (0.3%) DR53,DR1 0 (0.0%) 1 (0.1%) DR53,DR7 0 (0.0%) 1 (0.1%) DR7 2 (0.2%) 0 (0.0%) DQ2, DQ4 0 (0.0%) 1 (0.1%) DQ5 1 (0.1%) 0 (0.0%) DQ5,DR1 0 (0.0%) 1 (0.1%) DQ6, DR13, DR52 0 (0.0%) 1 (0.1%) DQ7 0 (0.0%) 3 (0.3%) DQ7,DR15,DR4,DR51,DR53 1 (0.1%) 0 (0.0%) DQ8 1 (0.1%) 0 (0.0%) DQ8, DQ9 1 (0.1%) 0 (0.0%) DQ8,DR4,DR53 1 (0.1%) 1 (0.1%) DR1 0 (0.0%) 2 (0.2%) DR11 0 (0.0%) 2 (0.2%) DR11,DR13,DR52 0 (0.0%) 1 (0.1%) DR11,DR4 0 (0.0%) 1 (0.1%) DR12 1 (0.1%) 0 (0.0%) DR15 0 (0.0%) 1 (0.1%) DR15,DR4 1 (0.1%) 0 (0.0%) DR15,DR4,DR51 1 (0.1%) 0 (0.0%) DR17 0 (0.0%) 1 (0.1%) DR17, DR52 0 (0.0%) 1 (0.1%) DR4 3 (0.3%) 4 (0.4%) DR4,DR52 0 (0.0%) 1 (0.1%) DR51 1 (0.1%) 0 (0.0%) DR52,DR53 1 (0.1%) 0 (0.0%) DR52,DR9 0 (0.0%) 1 (0.1%) DR53 1 (0.1%) 0 (0.0%) DR7 0 (0.0%) 6 (0.6%) Cognate anti-Class I specificities
Control units (N=1054)
TRALI units (N= 975)
A11 2 (0.2%) 2 (0.2%) A11, CW7 1 (0.1%) 0 (0.0%) A11,A1 0 (0.0%) 1 (0.1%) A2 0 (0.0%) 1 (0.1%) A2, B44 1 (0.1%) 0 (0.0%) A24 2 (0.2%) 4 (0.4%) A24, B44, B62 0 (0.0%) 1 (0.1%) A24, B56 1 (0.1%) 0 (0.0%) A24, B58 4 (0.4%) 0 (0.0%)
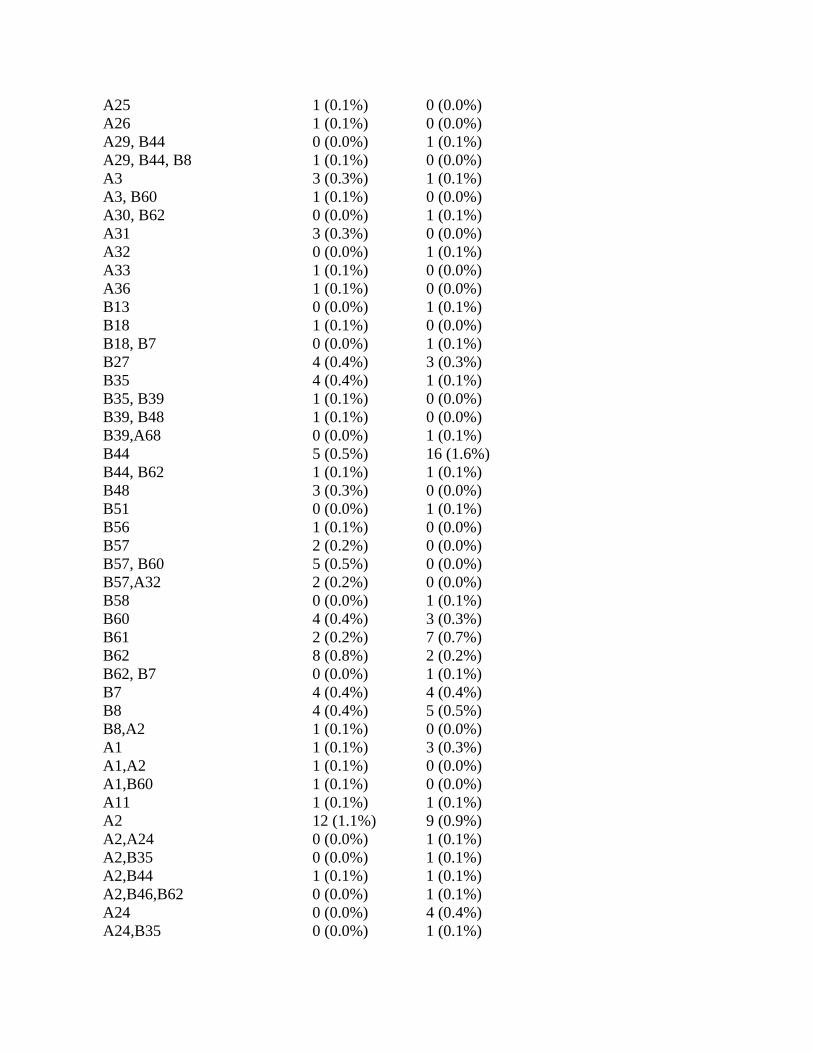
A25 1 (0.1%) 0 (0.0%) A26 1 (0.1%) 0 (0.0%) A29, B44 0 (0.0%) 1 (0.1%) A29, B44, B8 1 (0.1%) 0 (0.0%) A3 3 (0.3%) 1 (0.1%) A3, B60 1 (0.1%) 0 (0.0%) A30, B62 0 (0.0%) 1 (0.1%) A31 3 (0.3%) 0 (0.0%) A32 0 (0.0%) 1 (0.1%) A33 1 (0.1%) 0 (0.0%) A36 1 (0.1%) 0 (0.0%) B13 0 (0.0%) 1 (0.1%) B18 1 (0.1%) 0 (0.0%) B18, B7 0 (0.0%) 1 (0.1%) B27 4 (0.4%) 3 (0.3%) B35 4 (0.4%) 1 (0.1%) B35, B39 1 (0.1%) 0 (0.0%) B39, B48 1 (0.1%) 0 (0.0%) B39,A68 0 (0.0%) 1 (0.1%) B44 5 (0.5%) 16 (1.6%) B44, B62 1 (0.1%) 1 (0.1%) B48 3 (0.3%) 0 (0.0%) B51 0 (0.0%) 1 (0.1%) B56 1 (0.1%) 0 (0.0%) B57 2 (0.2%) 0 (0.0%) B57, B60 5 (0.5%) 0 (0.0%) B57,A32 2 (0.2%) 0 (0.0%) B58 0 (0.0%) 1 (0.1%) B60 4 (0.4%) 3 (0.3%) B61 2 (0.2%) 7 (0.7%) B62 8 (0.8%) 2 (0.2%) B62, B7 0 (0.0%) 1 (0.1%) B7 4 (0.4%) 4 (0.4%) B8 4 (0.4%) 5 (0.5%) B8,A2 1 (0.1%) 0 (0.0%) A1 1 (0.1%) 3 (0.3%) A1,A2 1 (0.1%) 0 (0.0%) A1,B60 1 (0.1%) 0 (0.0%) A11 1 (0.1%) 1 (0.1%) A2 12 (1.1%) 9 (0.9%) A2,A24 0 (0.0%) 1 (0.1%) A2,B35 0 (0.0%) 1 (0.1%) A2,B44 1 (0.1%) 1 (0.1%) A2,B46,B62 0 (0.0%) 1 (0.1%) A24 0 (0.0%) 4 (0.4%) A24,B35 0 (0.0%) 1 (0.1%)
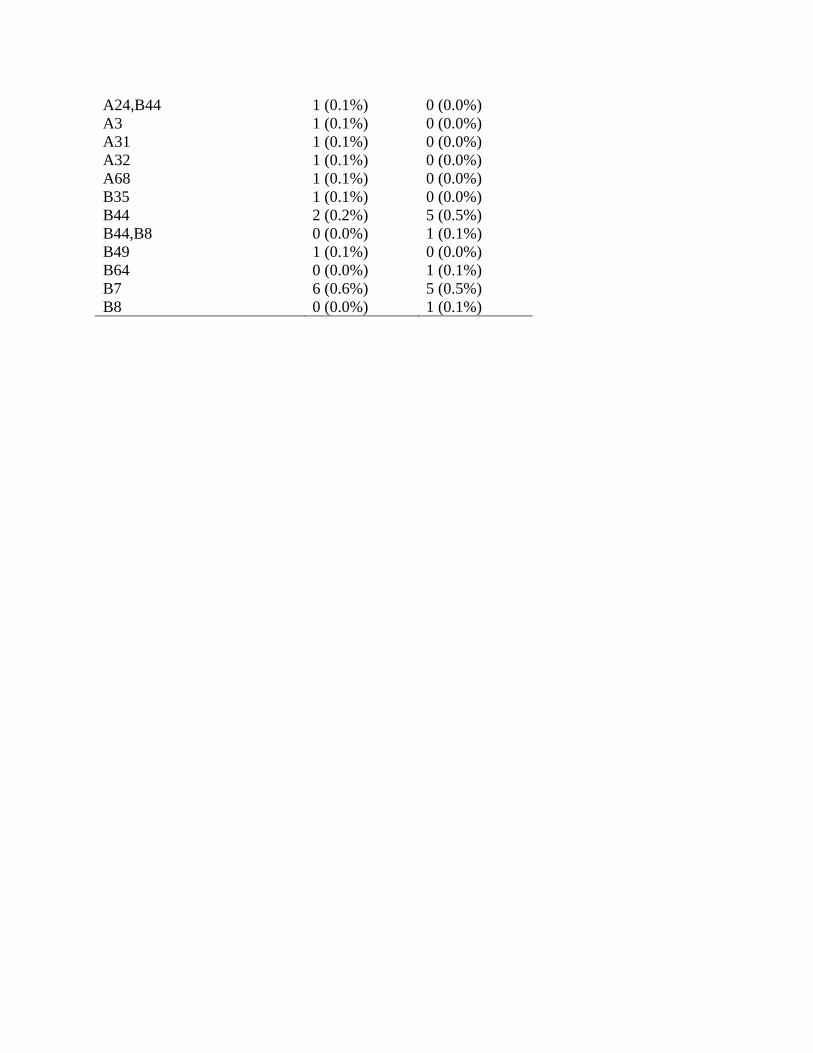
A24,B44 1 (0.1%) 0 (0.0%) A3 1 (0.1%) 0 (0.0%) A31 1 (0.1%) 0 (0.0%) A32 1 (0.1%) 0 (0.0%) A68 1 (0.1%) 0 (0.0%) B35 1 (0.1%) 0 (0.0%) B44 2 (0.2%) 5 (0.5%) B44,B8 0 (0.0%) 1 (0.1%) B49 1 (0.1%) 0 (0.0%) B64 0 (0.0%) 1 (0.1%) B7 6 (0.6%) 5 (0.5%) B8 0 (0.0%) 1 (0.1%)
Results of analyses of variables proposed to assess GIFT strength (AMFIR, MPPC) As there is no standard method to assess anti-HNA strength determined by the GIFT, we created novel candidate variables AMFIR and MPPC (see Supplement Methods above). In multivariate models, quantity of anti-HNA, AMFIR times volume, was a significant predictor of risk, better than MPPC times volume. We then explored possible cutoffs for AMFIR analogous to NBG ratios for anti–HLA-class II, examining volumes of received products with GIFT positive and with GIFT greater than each AMFIR quartile of GIFT positive units. This provided modest evidence against using a AMFIR cutoff other than just positivity itself, because the estimated difference between the lowest quartile of positive units (below 0.58) and higher AMFIR values was OR=0.99 per 100ml (CI 0.17 to 5.7, p=0.99. In addition, there was modest evidence against higher cutoffs, because the top half of values (above 0.83) were estimated to have less risk than the second quartile (0.58 to 0.83), OR=0.47 (CI 0.10 to 2.1, p=0.31). Thus, we abandoned assessment of anti-HNA strength by AMFIR. For quantity of anti-HNA, we used just anti-HNA positivity times volume in the primary multivariate model (Table 4b, main manuscript). Missing blood product bags, GIFT strength, transfusion factors not studied A limitation of this study is the amount of missing test data especially on the bioreactive substances in blood products given to the patients in this study, because transfused blood bags were not returned to the blood banks and therefore samples from the blood bags were not available for testing. It is standard hospital policy not to return transfused blood bags to the blood bank. We explained in our grant proposal that we were aware of this problem in the planning stages of the study. We carefully considered the possibility of sampling all units issued from the blood bank to all patients by the use of sterile docking devices during the study period. We found this to be cost-prohibitive. Thus, for this study, we enlisted the cooperation of the hospital staff and were able to get half of the transfused blood bags returned and available for study. Recalling a donor for a sample to test bioreactive markers was not appropriate as we needed to test the actual unit given to the study patient. In contrast, for antibody testing, we had much fewer missing data because a sample at the time of donation was often stored and available, or the donor could be recalled for another sample as leukocyte antibody levels in donors are usually stable. To prevent this problem of missing samples from blood product bags for the study of bioreactive substances, future studies might focus on specific patient groups, especially those that receive elective transfusions. In specific patients groups, it may be possible to prospectively sample units before they are issued and transfused. We handled missing data the best possible way, by using an approach known as multiple imputation,26 which preserves more information and introduces less bias than alternatives such as dropping from analysis all observations with any missing data, or filling in arbitrary values such as the overall mean. While multiple imputation is not as good as observed data, it is better than no data, or arbitrarily assigned values. This missing data, together with the drop in incidence of TRALI, contributed to another limitation: the wide confidence intervals for many of our estimates. This limited the strength of evidence that this study could provide, particularly for negative findings, which we have acknowledged where appropriate. Finally, we evaluated a large number of candidate predictors to build the model shown in the main text Table 4. While this could result in the chance inclusion of some factors with no real influence on TRALI risk, nearly all of the factors in the model had a strong a priori rating.
We attempted unsuccessfully to measure the strength of anti-HNA detected by GIFT by the two calculations AMFIR and MPPC, and therefore we did not establish a cutoff for strong anti-HNA associated with risk. There has not been an attempt to evaluate a standard quantitative determination of anti-HNA strength by the laboratories in the International Granulocyte Immunology Workshop (IGIW) consortium. The neutrophil laboratories that participate in IGIW (Europe, North America, Asia and Australia) each have developed their own methods. Each laboratory has different protocols and more importantly use different flow cytometers and different software. Proficiency samples are supplied by IGIW annually to determine assay performance based on qualitative results and antibody specificity, but assessment of antibody strength is not included. We did not test donor plasma for anti-Nak(a) which has been associated with TRALI30 because it is likely rare and we did not have the reagents. We did not test donor plasma for nonpolar lipids which primes neutrophils and is present in plasma of leukoreduced red blood cell units31 because this finding was published in 2011 after the study had closed. REFERENCES 1. Triulzi DJ, Kleinman S, Kakaiya RM, et al. The effect of previous pregnancy and transfusion on HLA alloimmunization in blood donors: implications for a transfusion-related acute lung injury risk reduction strategy. Transfusion. 2009;49(9):1825–1835. 2. Finlay HE, Cassorla L, Feiner J, Toy P. Designing and testing a computer-based screening system for transfusion-related acute lung injury. Am J Clin Pathol. 2005;124(4):601–609. 3. Finlay-Morreale HE, Louie C, Toy P. Computer-generated automatic alerts of respiratory distress after blood transfusion. J Am Med Inform Assoc. 2008;15(3):383–385. 4. Rice TW, Wheeler AP, Bernard GR, Hayden DL, Schoenfeld DA, Ware LB. Comparison of the SpO2/FIO2 ratio and the PaO2/FIO2 ratio in patients with acute lung injury or ARDS. Chest. 2007;132(2):410–417. 5. Gajic O, Gropper MA, Hubmayr RD. Pulmonary edema after transfusion: How to differentiate transfusion-associated circulatory overload from transfusion-related acute lung injury. Crit Care Med. 2006;34(5 Suppl):S109–113. 6. Toy P, Popovsky MA, Abraham E, et al. Transfusion-related acute lung injury: Definition and review. Crit Care Med. 2005;33(4):721–726. 7. Kleinman S, Caulfield T, Chan P, et al. Toward an understanding of transfusion-related acute lung injury: statement of a consensus panel. Transfusion. 2004;44(12):1774–1789. 8. Weiskopf RB, Yau R, Sanchez R, Lowell C, Toy P. Microarray kit analysis of cytokines in blood product units and segments. Transfusion. 2009;49(11):2269–2275. 9. Lavi S, McConnell JP, Rihal CS, et al. Local production of lipoprotein-associated phospholipase A2 and lysophosphatidylcholine in the coronary circulation: association with early coronary atherosclerosis and endothelial dysfunction in humans. Circulation. 2007;115(21):2715–2721. 10. The Cytokine Handbook, Fourth Edition. 4th ed. London, UK: Academic Press, Elsevier Press; 2003. 11. Khan SY, Kelher MR, Heal JM, et al. Soluble CD40 ligand accumulates in stored blood components, primes neutrophils through CD40, and is a potential cofactor in the development of transfusion-related acute lung injury. Blood. 2006;108(7):2455–2462.
12. Tuinman PR, Gerards MC, Jongsma G, Vlaar AP, Boon L, Juffermans NP. Lack of evidence of CD40 ligand involvement in transfusion-related acute lung injury. Clin Exp Immunol. 2011;165(2):278–284. 13. Silliman CC, Elzi DJ, Ambruso DR, et al. Lysophosphatidylcholines prime the NADPH oxidase and stimulate multiple neutrophil functions through changes in cytosolic calcium. J Leukoc Biol. 2003;73(4):511–524. 14. Ward RA, Nakamura M, McLeish KR. Priming of the neutrophil respiratory burst involves p38 mitogen-activated protein kinase-dependent exocytosis of flavocytochrome b558-containing granules. J Biol Chem. 2000;275(47):36713–36719. 15. Fortunati E, Kazemier KM, Grutters JC, Koenderman L, Van den Bosch JM. Human neutrophils switch to an activated phenotype after homing to the lung irrespective of inflammatory disease. Clin Exp Immunol. 2009;155(3):559–566. 16. Rubel C, Fernandez GC, Dran G, Bompadre MB, Isturiz MA, Palermo MS. Fibrinogen promotes neutrophil activation and delays apoptosis. J Immunol. 2001;166(3):2002–2010. 17. Lalezari P, Pryce S. Detection of neutrophil and platelet antibodies in immunologically induced neutroenia and thrombocytopenia. In: Rose NR, Friedman H, eds. Manual of clinical immunology. Washington, D.C.: American Society of Microbiology; 1980:744–749. 18. McCullough J, Clay M, Press C, Kline W. Granulocyte serology: A clinical laboratory guide. Chicago: ASCP Press; 1988. 19. Verheugt FW, von dem Borne AE, Decary F, Engelfriet CP. The detection of granulocyte alloantibodies with an indirect immunofluorescence test. Br J Haematol. 1977;36(4):533–544. 20. Bux J, Kober B, Kiefel V, Mueller-Eckhardt C. Analysis of granulocyte-reactive antibodies using an immunoassay based upon monoclonal-antibody–specific immobilization of granulocyte antigens. Transfus Med. 1993;3(2):157–162. 21. Harris RE, Hochman HG. Revised P values in testing blood group antibodies. Fisher's exact test revisited. Transfusion. 1986;26(6):494–499. 22. Bierling P, Bux J, Curtis B, et al. Recommendations of the ISBT Working Party on Granulocyte Immunobiology for leucocyte antibody screening in the investigation and prevention of antibody-mediated transfusion-related acute lung injury. Vox Sang. 2009;96(3):266–269. 23. The SURVEYLOGISTIC Procedure. SAS/STAT(R) 9.2 User's Guide, Second Edition 2010; http://support.sas.com/documentation/cdl/en/statug/63033/HTML/default/viewer.htm#surveylogistic_toc.htm. Accessed 02/02/2011. 24. Little RJA. Survey nonresponse adjustments for estimates of means. International Statistical Review. 1986;54:139–157. 25. Heinze G, Schemper M. A solution to the problem of separation in logistic regression. Stat Med. 30 2002;21(16):2409–2419. 26. Schafer JL. Multiple imputation: a primer. Stat Methods Med Res. 1999;8(1):3–15. 27. Royston P. Multiple imputation of missing values: Further update of ice, with an emphasis on categorical variables. Stata Journal. 2009;9(3):466–477. 28. Moons KG, Donders RA, Stijnen T, Harrell FE, Jr. Using the outcome for imputation of missing predictor values was preferred. J Clin Epidemiol. 2006;59(10):1092–1101. 29. Rivest LP. Statistical properties of Winsorized means for skewed distributions. Biometrika. 1994;81(2):373–383.

30. Nakajima F, Nishimura M, Hashimoto S, Okazaki H, Tadokoro K. Role of anti-Nak(a) antibody, monocytes and platelets in the development of transfusion-related acute lung injury. Vox Sang. 2008;95(4):318–323. 31. Silliman CC, Moore EE, Kelher MR, Khan SY, Gellar L, Elzi DJ. Identification of lipids that accumulate during the routine storage of prestorage leukoreduced red blood cells and cause acute lung injury. Transfusion. 2011, In press.