Doctoral Degree Race Analytics Report Faculty – 2016 CAATE ANALYTICS REPORT This report describes...
41
2015 – 2016 CAATE ANALYTICS REPORT This report describes Professional and Post-Professional Athletic Training programs, students, and faculty. Unless otherwise noted, the data included in this report were derived from the 2015-2016 Annual Report completed in October of 2016, data from online accreditation software profiles at the time of Annual Report submission, and from the BOC pass rate information provided by the BOC in December of 2016. This report describes only accredited Professional and Post-Professional programs in the United States, and unless otherwise indicated, the data reflect the 2015-2016 academic year. Analytics Report State Degree Institution Athletic Training Resident Outcomes Admissions Demographics Graduation Race Professional Expenses Salary Budget Doctoral Student Public Enrollment Clinical International Gender Ethnicity Masters Employment Applications Residency Program Director Bachelors Preceptor Costs Clinical Coordinator Faculty Private Post-Professional Degree Accreditation
Transcript of Doctoral Degree Race Analytics Report Faculty – 2016 CAATE ANALYTICS REPORT This report describes...

2015 – 2016CAATE ANALYTICS REPORT
This report describes Professional and Post-Professional Athletic Training programs, students, and faculty. Unless otherwise noted, the data included in this report were derived from the 2015-2016 Annual Report completed in October of 2016, data from online accreditation software profiles at the time of Annual Report submission, and from the BOC pass rate information provided by the BOC in December of 2016. This report describes only accredited Professional and Post-Professional programs in the United States, and unless otherwise indicated, the data reflect the 2015-2016 academic year.
Analytics Report State
Degree
Institution
Athletic TrainingResident
Outcomes
Admissions
Demographics Graduation
Race
Professional
Expenses
SalaryBudget
Doctoral
Student
Public
Enrollment
Clinical
International
Gender
Ethnicity
Masters
Employment
Applications
Residency
Program Director Bachelors
Preceptor
Costs
Clinical Coordinator
Faculty
PrivatePost-Professional Degree
Accreditation
2015 – 2016 CAATE ANALYTICS REPORT 2
CONTENT
2015 – 2016 CAATE ACCREDITED PROGRAMS ANALYTICS REPORT
TABLE OF CONTENTSMessage from the President ...................................................................................................................................... 4
Professional Degree Program Information (N = 370) ............................................................................. 5
Professional Program Overview ........................................................................................................................ 5
Accreditation Status, Institution Type, and Carnegie Classification ..................................... 6
Professional Athletic Training Programs by State .............................................................................. 7
Degree Level and Degree Type ......................................................................................................................... 8
2015 – 2016 Comprehensive Reviews ............................................................................................................ 9
Student Expenses ........................................................................................................................................................ 9
Program Operating Costs ...................................................................................................................................... 10
Program Faculty............................................................................................................................................................ 11
Program Admissions ................................................................................................................................................. 11
Admissions Process............................................................................................................................................. 11
Admissions Availability ..................................................................................................................................... 12
Student Demographics .......................................................................................................................................... 13
Enrollment by Gender ...................................................................................................................................... 13
Enrollment by Ethnicity .................................................................................................................................. 14
Enrollment by Race ............................................................................................................................................ 15
Clinical Education ........................................................................................................................................................ 16
Preceptor to Student Ratio .......................................................................................................................... 16
Preceptors .................................................................................................................................................................. 16
Faculty and Staff ........................................................................................................................................................... 17
Program Director .................................................................................................................................................. 17
Program Director Degree ............................................................................................................................... 18
Clinical Education Coordinator ......................................................................................................................... 19
Clinical Education Coordinator Degree .............................................................................................. 19
Faculty to Student Ratio ........................................................................................................................................ 20
Outcomes .......................................................................................................................................................................... 21
Aggregate Board of Certification Exam Pass Rates ................................................................... 21
Graduates’ Employment in Athletic Training ................................................................................. 23
Graduates’ Placement ...................................................................................................................................... 24
Post-Professional Degree Programs .................................................................................................................... 25
Post-Professional Degree Program Overview ........................................................................................ 25

2015 – 2016 CAATE ANALYTICS REPORT 3
CONTENT
TABLE OF CONTENTS (continued)
Post-Professional Degree Program Accreditation, Institution Type, and Degree ...... 26
Post-Professional Degree Programs by State ........................................................................................ 27
Program Admissions ................................................................................................................................................. 28
Admissions Process............................................................................................................................................. 28
Admissions Availability ..................................................................................................................................... 28
Program Enrollment ................................................................................................................................................. 29
Program Enrollment by Gender ............................................................................................................... 29
Program Enrollment by Ethnicity ........................................................................................................... 30
Program Enrollment by Race ..................................................................................................................... 31
Student Expenses ........................................................................................................................................................ 32
Program Operating Costs ...................................................................................................................................... 32
Faculty & Staff ................................................................................................................................................................. 33
Program Director .................................................................................................................................................. 33
Clinical Education Coordinator ................................................................................................................. 33
Faculty to Student Ratio ........................................................................................................................................ 34
Program Faculty............................................................................................................................................................ 34
Outcomes .......................................................................................................................................................................... 35
Graduates’ Employment in Athletic Training ................................................................................. 35
Post-Professional Residency Programs ............................................................................................................ 36
Admissions Availability ............................................................................................................................................ 37
Program Enrollment ................................................................................................................................................. 37
Program Enrollment by Gender ............................................................................................................... 37
Program Enrollment by Ethnicity ........................................................................................................... 38
Program Enrollment by Race ..................................................................................................................... 39
Resident Status ............................................................................................................................................................. 39
Personnel............................................................................................................................................................................ 39
Preceptors .................................................................................................................................................................. 39
Faculty ........................................................................................................................................................................... 40
Outcomes .......................................................................................................................................................................... 40
Salary .............................................................................................................................................................................. 40
Employment ............................................................................................................................................................ 40

2015 – 2016 CAATE ANALYTICS REPORT 4
MESSAGE FROM THE PRESIDENT
On behalf of the Commission on Accreditation of Athletic
Training Education, I’m pleased to bring you the following
2015-2016 CAATE Analytic Report, describing the 389 Professional,
Post-Professional, and Residency programs accredited by the
Commission. This is the Commission’s third such report and it
presents data collected from our accredited programs’ 2015-16
annual reports through our eAccreditation software platform. The
report presents complete population level data and parameters
rather than sampled data and statistics. Aside from certification
exam data provided directly from the Board of Certification, this
report is compiled from data directly entered by the individual programs into eAccreditation.
The information presented herein is valuable not only for benchmarking and future historical
comparison, but more importantly it serves to inform the public.
During 2015-2016, the CAATE accredited 389 programs across three levels (professional
N = 370 total with 307 baccalaureate and 63 Master’s; post-professional N = 14 total with 13
Master’s and 1 doctoral; residency N = 5), enrolling 13,650 students (13,326 professional; 304
post-professional; 20 residency). Total programs numbers remain relatively stable, however
the 389 total programs represent a small net decrease of 6 programs from 2014-15 (395
programs) but still a small net increase from 2013-14 (386 programs). All programs are located
within the United States; however the Commission has received its first application for
accreditation from an international program (in Spain) and international accreditation of
programs is on the horizon although much work remains before this will be accomplished.
As athletic training education continues to evolve toward the 2022-2023 finale of
baccalaureate professional education, professional programs are now heavily engaged in
their master’s degree transitions. One year ago, there were 39 professional programs that
offered master’s degrees and just a single program with a pending master’s degree transition
while 13 others indicated they were working toward a degree change. One year later, there
are now 63 professional programs who indicate that they offer a master’s degree (and
counting). Although the numbers and profile of these programs are changing, professional
programs continue to report available admissions capacity, with 4,168 of 6,540 offered
applicants accepting one of 7,164 available admission slots for which programs received
11,322 completed applications. Post-professional programs are nearer to admission capacity,
with 158 of 195 offered applicants accepting one of 170 available admission slots for which
programs received 691 completed applications. Residency programs are at or above capacity,
reporting that 21 of 23 offered applicants accepted one of 17 available admission slots for
which there were 133 completed applications.
I hope you enjoy reviewing this report and find the information herein to be both informative
and useful. As always, the Commission welcomes your feedback and suggestions on how this
report might be improved in coming years.

2015 – 2016 CAATE ANALYTICS REPORT 5
PROFESSIONAL DEGREE PROGRAM INFORMATION (N = 370)
Professional programs lead to eligibility to sit for the Board of Certification (BOC)
examination and to enter the profession of athletic training. These programs are
currently available at either the baccalaureate or master’s degree levels.
PROFESSIONAL PROGRAM OVERVIEW
The average professional AT program at a glance
Accreditation Status: Continuing Accreditation
Institution Type: Public
Degree: Baccalaureate (BSAT)
Admissions Process: Secondary Admissions
New Students Admitted: 14
Program Enrollment: 36
Student Enrollment by Gender Ratio: 11:7, Female to Male
Student Enrollment by Race Ratio: 15:4, White to all other races*
Faculty to Student Ratio (Lecture): 1:11
Faculty to Student Ratio (Lab): 1:15
Preceptor to Student Ratio (Clinical): 1:3
Program Director:Tenure Track Faculty, 10 month appointment, Academic Doctorate Degree
Clinical Education Coordinator: 10 month appointment
Number of Core Faculty: 3
Number of Preceptors: 41.2‡
*denotes decrease from last year’s ‘At a Glance’ data, ‡denotes increase from last year’s ‘At a Glance’ data

2015 – 2016 CAATE ANALYTICS REPORT 6
PROFESSIONAL DEGREE PROGRAM INFORMATION (N = 370)
Professional Program Accreditation Status
Professional Program Institution Type
Private Not-For-Profit
Public
ACCREDITATION STATUS, INSTITUTION TYPE, AND CARNEGIE CLASSIFICATIONDuring the 2015-2016 academic year, there were 370 CAATE accredited professional
programs, and seven (7) of the 370 received initial accreditation during the 2015-2016
academic year. An additional 10 programs have contacted the CAATE indicating an interest
in seeking initial accreditation, for a total of 380 professional athletic training programs that
were either accredited or seeking accreditation. Of the accredited programs (N = 370), the
majority were offered at public institutions (57%), and resulted in a baccalaureate degree
(83%). Last year (2014-2015) 56% of accredited programs were offered at public institutions
and 89% of those programs resulted in a baccalaureate degree.
Total of380
Programs
Continuing Accreditation
Initial Accreditation
Seeking Accreditation 95%
2% 3%
43%57%
Private
Public
n = 380
n = 370

2015 – 2016 CAATE ANALYTICS REPORT 7
PROFESSIONAL ATHLETIC TRAINING PROGRAMS BY STATE
Professional Program Institution Carnegie Classification
PROFESSIONAL DEGREE PROGRAM INFORMATION (N = 370)
Bachelor’s (N = 78)
College’s and Universities (N = 69)
Master’s (N = 183)
Research (N = 9)
Special Focus Institution (N = 1) – percentage at 0%
Doctorate Granting Universities (N = 30)
21%
19%
8%
50%
2%
56% Offered at Public Institutions
MS1
LA6
MN8
ND5
SD5
IA13
WI10 MI
14
NY11
VT3MT
2
WA3
OR4
ID1 WY
0
NH5 ME
4
MA10
RI0
CT5NJ
5 DE1
DC1
MD3
CA15
NV1
AZ2 NM
2
TX20
CO5
NE5
KS13
MO13
IL12
IN11
OH24
PA23
OK6 AR
6
TN9
NC19
SC6
GA6
AL5
AK0
FL14
HI1
KY6
WV8 VA
11
UT5
n = 370

2015 – 2016 CAATE ANALYTICS REPORT 8
DEGREE LEVEL AND DEGREE TYPEOf the 370 programs, 307 programs result in a Baccalaureate degree (down from 335
in 2014-2015) and 63 programs result in a Master’s degree (up from 39 in 2014-2015).
Of the programs that award a Baccalaureate degree the majority award a Bachelor of
Science of Athletic Training, while most programs that award a Master’s degree award a
Master of Science of Athletic Training. It is important to note that when reporting degree
type, programs are instructed to select all that apply, so if a program is in a transition
period with both undergraduate and graduate students, they may be awarding both
Baccalaureate and Master’s degrees.
PROFESSIONAL DEGREE PROGRAM INFORMATION (N = 370)
Professional Program Degree Level
Baccalaureate Degree
Master’s Degree
Undergraduate and Graduate
Degrees
83%
17%
Professional Program Degree Type
0 50 100 150 200 250 300
15.4
21.8
10.9
14.2
Other Master’s Degree
Master of Arts, Major in Athletic Training (MA)
Master of Science, Major in Athletic Training (MS)
Master of Science in Athletic Training (MSAT)
Master of Athletic Training (MAT)
Other Bachelor Degree
Option for BS or BA
Bachelor of Arts, Major in Athletic Training (BA)
Bachelor of Science, Major in Athletic Training (BS)
Bachelor of Science of Athletic Training (BSAT)
Master of Athletic Training (BAT)
1
1
2
38
11
4
3
6
17
276
28
n = 370
n = 387

2015 – 2016 CAATE ANALYTICS REPORT 9
2015 – 2016 COMPREHENSIVE REVIEWSFor the 2015-2016 academic year 32 programs completed the Comprehensive Review
Process. Twenty-five programs sought continuing accreditation. Continuing accreditation
awards for this time period ranged from three to 10 years, with an average award of 7.9
± 2.6 years. Seven programs sought initial accreditation, and all seven programs were
awarded the maximum five years of initial accreditation.
STUDENT EXPENSESProgram Directors reported the associated costs to attend the institution and complete
the Athletic Training Program. Laboratory fees are contained in the “Annual Fee” section.
“Annual Other Costs” included liability insurance and other publicized associated costs
for their programs. Data were reviewed for outliers, but none were identified. The mean
tuition dollar amounts, across both institution categories increased as compared to last
year’s data, but the overall cost of attendance decreased at public institutions for in-state
students, and at private institutions for all students. The percent change for all variables
are included below. Reported in-state tuition for private institutions ranged from $5,300
– $48,700, and for public institutions ranged from $910 - $35,409. Reported out of state
tuition for private institutions ranged from $5,300-$47,422, and for public institutions
ranged from $1,260 - $39,000.
Public Institutions Private Institutions
In State Out of State% Change
from 2014-2015
In State Out of State% Change
from 2014-2015
Annual Tuition
9,069 ± 6,321 19,000 ± 7,619
+0.7% (In State)
+2.7% (Out of State)
28,875 ± 7,241 28,440 ± 7,848
+4.8% (In State)
+4.0% (Out of State)
Annual Fees
1,759 ± 1,583 2,216 ± 2,914
+3.5% (In State)
-1.2% (Out of State)
1,443 ± 2,400 1,377 ± 2,346
-20.9% (In State)
-27.1% (Out of State)
Annual Other Costs
921 ± 2,242 923 ± 2,245
-55.6% (In State)
-55.1% (Out of State)
1,754 ± 3,739 1,679 ± 3,656
+39.9% (In State)
+41.0% (Out of State)
Total Annual
Cost11,887 ± 6,740 23,195 ± 12,456
-7.1% (In State)
+1.6% (Out of State)
32,164 ± 8,901 31,573 ± 9,233
-0.9% (In State)
-1.3% (Out of State)
n = 370, Mean dollars ± SD unless otherwise noted
PROFESSIONAL DEGREE PROGRAM INFORMATION (N = 370)

2015 – 2016 CAATE ANALYTICS REPORT 10
PROFESSIONAL DEGREE PROGRAM INFORMATION (N = 370)
PROGRAM OPERATING COSTSPrograms reported the program costs associated with administrative support and faculty/
instructional staff. If positions were shared between programs, respondents were instructed
to include only the amount of the position specifically charged to the program. Reported
faculty/instructional costs ranged from $10,000 to $2,600,000. A total of 62 programs
reported $0.00 in administrative support costs, which ranged from $0.00 - $306,770. For
the 2015-2016 Annual Report overall operating costs were broken out into the categories
specifically identified within the Standards for Accreditation; Capital Equipment,
Expendable Supplies, and Professional Development. A total of 86 programs indicated
$0.00* in capital equipment costs, which ranged from $0 to $450,000. Overall, 9 programs
reported $0.00 in expendable supply costs, with reported amounts ranging from $0 to
$258,678. Lastly, 18 programs indicated $0.00 in professional development costs, which
ranged from $0 - $20,221.
All Professional
Programs
% Change from
2014-2015
Public Institutions
% Change from 2014-
2015
Private Institutions
% Change from
2014-2015
Cost for Administrative Support
22,924 ± 33,608
-0.6%26,667 ± 39,285
+1.9%17,952 ± 23,224
-5.9%
Cost for Faculty/Instructional Staff
239,295 ± 189,264
+9.1%239,737 ± 145,627
+5.0%238,426 ± 236,713
+13.6%
Costs for Capital Equipment
12,358 ± 31,315
‡10,605 ± 15,500
‡14,710 ± 44,408
‡
Costs for Expendable Supplies
8,566 ± 19,109
‡7,752 ± 19,332
‡9,664 ± 18,810
‡
Costs for Professional Development
4,128 ± 3,529
‡4,258 ± 3,615
‡3,953 ± 3,413
‡
n = 370, Mean dollars ± SD unless otherwise noted, *Programs reporting “0” were cited as non-compliant within the Annual Report
‡Previous year’s data not available.

2015 – 2016 CAATE ANALYTICS REPORT 11
PROFESSIONAL DEGREE PROGRAM INFORMATION (N = 370)
PROGRAM FACULTYThe number of core faculty in each program ranged from 0* (n = 3) to 13 (n = 1). A total
of 48% (n = 176) of programs indicated having two core faculty, 27% (n = 98) reported
having three core faculty, 11% (n = 42) reported having four core faculty, and 11% (n = 42)
indicated five or more core faculty. Numbers of associated faculty ranged from 0 to 24,
and numbers of adjunct faculty ranged from 0 to 19.
All Professional Programs
Baccalaureate Programs
Master’s Degree Programs
Mean ± SD Mean ± SD Mean ± SD
Core Faculty 2.9 ± 1.5 2.9 ± 1.5 3.2 ± 1.5
Associated Faculty 2.7 ± 3.3 2.8 ± 3.4 2.3 ± 2.9
Adjunct Faculty 2.9 ± 3.4 2.9 ± 3.4 3.0 ± 3.5
n = 370, *Programs reporting 0 or 1 core faculty were cited as non-compliant within the Annual Report
PROGRAM ADMISSIONSAdmissions ProcessProgram Directors were asked to identify the admission process used by their program.
A process in which the student is admitted to the program upon admittance to the
institution is a direct admissions process, whereas a secondary admission process is one
in which the student applies to the program separately from the institution. The majority
of responding professional programs (91.4%) use a secondary admissions process. This was
an increase from last year’s 85.5%.
All Professional Programs
Baccalaureate Programs
Master’s Degree Programs
Number (%) Number (%) Number (%)
Direct Admissions 32 (8.6) 11 (3.6) 21 (33.3)
Secondary Admissions
338 (91.4) 296 (96.4) 42 (66.7)
n = 370

2015 – 2016 CAATE ANALYTICS REPORT 12
PROFESSIONAL DEGREE PROGRAM INFORMATION (N = 370)
Admissions AvailabilityProfessional programs at the undergraduate level saw a slight decrease in the average
and total numbers of completed applications this year as compared with the previous
(2014-2015) academic year. The 2014-1205 average number of completed applications
for baccalaureate programs was 31.6, with a total of 10,514 applications completed.
Master’s degree programs had an increase in the average and total number of completed
applications as compared with last year. The 2014-2015 average number of completed
applications for Master’s degree programs was 33.6, with a total of 1,344 applications
completed. Baccalaureate programs admitted students to fill 70% of their available
student spots, while Master’s degree programs admitted 75% of their reported capacity.
All Professional Programs
Baccalaureate Programs
Master’s Degree Programs
Mean Total Mean Total Mean Total
Admission Slots Available
19.4 7164 19.5 5988 18.7 1176
Completed Applications
30.6 11322 28.0 8591 43.4 2731
Students Offered Admission
17.7 6540 17.0 5223 20.9 1317
Students Accepting Offer
13.7 5050 13.6 4168 14.0 882
n = 370

2015 – 2016 CAATE ANALYTICS REPORT 13
PROFESSIONAL DEGREE PROGRAM INFORMATION (N = 370)
STUDENT DEMOGRAPHICSEnrollment by Gender
All Professional Programs
Baccalaureate Programs
Master’s Degree Programs
Mean Total Mean Total Mean Total
Total Student Enrollment
36.0 13326 36.7 11254 32.9 2072
Female Student Enrollment
22.1 8175 22.5 6908 20.1 1267
Male Student Enrollment
13.9 5144 14.1 4328 13.0 816
Transgender Student Enrollment
0.01 3 0.0 1 0.03 2
n = 370
Mean Enrollment By Gender; 3-Year Comparison
*Transgender data collection began in the 2015-2016 academic year
0
5
10
15
20
25
30
35
40
Total Enrollm
ent Baccalaureate
Total Enrollm
ent Maste
r’s
Female Enrollment B
accalaureate
Female Enrollment M
aster’s
Male Enrollment B
accalaureate
Male Enrollment M
aster’s
Transgender E
nrollment B
accalaureate*
Transgender E
nrollment M
aster’s*
2015-2016 2014-2015 2013-2014

2015 – 2016 CAATE ANALYTICS REPORT 14
PROFESSIONAL DEGREE PROGRAM INFORMATION (N = 370)
Enrollment by Ethnicity
All Professional Programs
Baccalaureate Programs
Master’s Degree Programs
Mean Total Mean Total Mean Total
Hispanic 2.4 869 2.3 703 2.6 166
Non-Hispanic/Non-Latino
30.2 11188 30.8 9459 27.4 1729
Unknown 1.8 659 1.7 527 2.1 132
n = 370
Mean Enrollment By Ethnicity; 3-Year Comparison
*Unknown ethnicity not an option in 2013-2014
0
5
10
15
20
25
30
35
Hispanic Baccalaureate
Hispanic M
aster’s
Non-Hisp
anic Baccalaureate
Non-Hisp
anic Maste
r’s
Unknown Baccalaureate*
Unknown Maste
r’s*
2015-2016 2014-2015 2013-2014

2015 – 2016 CAATE ANALYTICS REPORT 15
PROFESSIONAL DEGREE PROGRAM INFORMATION (N = 370)
Enrollment by Race
All Professional Programs
Baccalaureate Programs
Master’s Degree Programs
Mean Total Mean Total Mean Total
American Indian 0.2 63 0.2 45 0.3 18
Asian 0.9 331 0.8 236 1.5 95
Black 2.7 1005 2.7 822 2.9 183
Hawaiian/Pacific Islander
0.2 54 0.2 46 0.1 8
Other 1.5 552 1.3 400 2.6 152
Unknown 2.2 811 2.1 654 2.5 157
White 29.4 10891 30.4 9317 25.0 1574
n = 370
Mean Enrollment by Race; 3-Year Comparison
0
5
10
15
20
25
30
35
American In
dian Baccalaureate
American In
dian Maste
r’s
Asian Baccalaureate
Asian M
aster’s
Black Baccalaureate
Black Maste
r’s
Hawaiian/Pacific Islander B
accalaureate
Hawaiian/Pacific Islander M
aster’s
Other Baccalaureate
Other Maste
r’s
Unknown Baccalaureate
Unknown Maste
r’s
White Baccalaureate
White M
aster’s
2015-2016 2014-2015 2013-2014

2015 – 2016 CAATE ANALYTICS REPORT 16
PROFESSIONAL DEGREE PROGRAM INFORMATION (N = 370)
CLINICAL EDUCATIONPreceptor to Student RatioProgram Directors were asked to report the average preceptor to student ratio using
the total number active preceptors for the program with the total number of students
that are active in clinical education. The most common ratio (N = 140) was 1:2, followed
by a ratio of 1:3 (N = 97). Ninety-two programs reported ratios between 1:4 and 1:8, and 12
programs reported preceptor to student ratios between 1:10 and 1:15. There was a trend
toward lower preceptor to student ratios as compared to last year, which saw a higher
maximum ratio, and more reported ratios above 1:10.
All Professional Programs
Baccalaureate Programs
Master’s Degree Programs
Mean Maximum Mean Maximum Mean Maximum
Preceptor to Student Ratio
1:3 1:15 1:3 1:11 1:3 1:15
PreceptorsPrograms provide information about the preceptors who supervise students for the
academic year. In addition to state license numbers and preceptor training dates, this
information also includes the preceptors’ profession(s) (check all that apply). There were
15,275 active preceptors for the 2015-2016 academic year, an increase from 2014-2015’s
number of active preceptors, which was 12,722. This yields an average of 41.2 preceptors
per professional program. Of those preceptors 81% (n = 12,360) were identified as athletic
trainers, and the next highest profession designations were physical therapists and
physicians at 7.3% each (n = 1,121 and n = 1,114 respectively).
2015 – 2016 CAATE ANALYTICS REPORT 17
PROFESSIONAL DEGREE PROGRAM INFORMATION (N = 370)
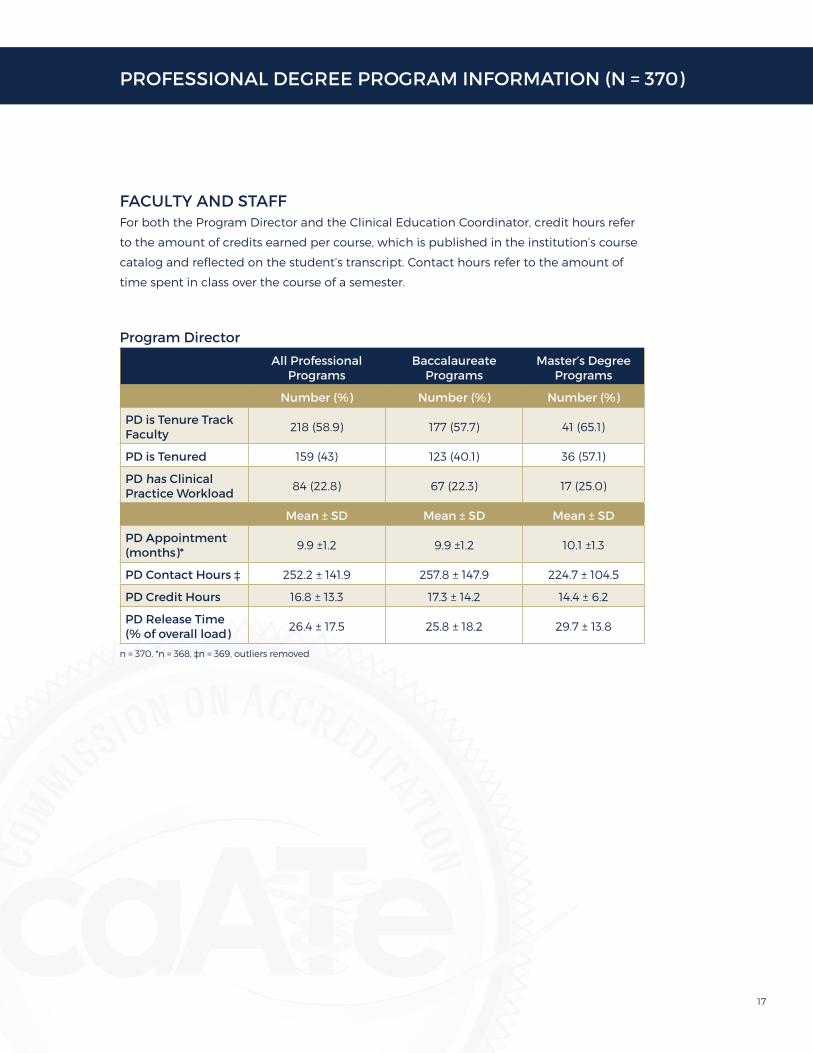
FACULTY AND STAFFFor both the Program Director and the Clinical Education Coordinator, credit hours refer
to the amount of credits earned per course, which is published in the institution’s course
catalog and reflected on the student’s transcript. Contact hours refer to the amount of
time spent in class over the course of a semester.
Program Director
All Professional Programs
Baccalaureate Programs
Master’s Degree Programs
Number (%) Number (%) Number (%)
PD is Tenure Track Faculty
218 (58.9) 177 (57.7) 41 (65.1)
PD is Tenured 159 (43) 123 (40.1) 36 (57.1)
PD has Clinical Practice Workload
84 (22.8) 67 (22.3) 17 (25.0)
Mean ± SD Mean ± SD Mean ± SD
PD Appointment (months)*
9.9 ±1.2 9.9 ±1.2 10.1 ±1.3
PD Contact Hours ‡ 252.2 ± 141.9 257.8 ± 147.9 224.7 ± 104.5
PD Credit Hours 16.8 ± 13.3 17.3 ± 14.2 14.4 ± 6.2
PD Release Time (% of overall load)
26.4 ± 17.5 25.8 ± 18.2 29.7 ± 13.8
n = 370, *n = 368, ‡n = 369, outliers removed

2015 – 2016 CAATE ANALYTICS REPORT 18
PROFESSIONAL DEGREE PROGRAM INFORMATION (N = 370)
Program Director DegreeWhen completing the Annual Report, programs are instructed to select the highest
degree earned by the program’s administrators from an available dropdown menu. The
majority (60.1%, n = 225) of Program Directors hold an Academic Doctorate degree. Those
who select Other are provided a text area to input the name of the degree; 1.1 % (n = 4)
selected this option. Of those that selected Other, DHSc (n = 2), DPE (n = 1), and DrPH
(n = 1) were the degrees listed. One program selected Clinical Doctorate, and no
respondents selected the option for Bachelor’s Degree.
Professional Program Director Highest Degree Earned
n = 370
Academic Doctorate
Clinical Doctorate – percentage at 0%
DPT
Other
Master’s Degree 61%
37%
1% 1%
0%
Degrees held by Program
Directors

2015 – 2016 CAATE ANALYTICS REPORT 19
PROFESSIONAL DEGREE PROGRAM INFORMATION (N = 370)
CLINICAL EDUCATION COORDINATORAll Professional
ProgramsBaccalaureate
ProgramsMaster’s Degree
Programs
Number (%) Number (%) Number (%)
CEC has Clinical Practice Workload
149 (40.3) 118 (38.4) 31 (49.2)
Mean ± SD Mean ± SD Mean ± SD
CEC Appointment (months)*
9.8 ± 1.1 9.8 ± 1.1 9.9 ± 1.2
CEC Contact Hours ‡ 261.5 ± 141.6 263.7 ± 143.6 250.7 ± 132.1
CEC Credit Hours 17.5 ± 13.2 17.7 ± 14.2 16.4 ± 6.7
CEC Release Time (% of overall load)
24.2 ± 18.4 23.4 ± 18.5 28.1 ± 17.5
n = 370, *n = 369, ‡n = 368, outliers removed
Clinical Education Coordinator DegreeWhen completing the Annual Report, programs are instructed to select the highest
degree earned by the program’s administrators from an available dropdown menu.
The majority (61.6%, n = 228) of Clinical Education Coordinators hold a Master’s degree.
Academic Doctorate was the second most common degree selection, at 31.9% (n = 118).
When split by degree level of the program, 66.8% of CECs at Baccalaureate Programs
have a Master’s Degree, compared to 36.5% of CECs at Master’s Degree Programs. The
majority (60.3%) of CECs at Master’s Degree Programs have an Academic Doctorate
degree. As reported for all programs, more Clinical Education Coordinators (3.0%, n = 11)
hold a Clinical Doctorate degree than do Program Directors (0.3%, n = 1).
Clinical Education Coordinator Highest Degree Earned
Degrees held by CECs
32%
n = 370
1%1%
3%
Academic Doctorate
Clinical Doctorate
Bachelor’s Degree
DPT
Master’s Degree
Other
62%
1%

2015 – 2016 CAATE ANALYTICS REPORT 20
PROFESSIONAL DEGREE PROGRAM INFORMATION (N = 370)
FACULTY TO STUDENT RATIOProgram administrators were instructed to calculate their average faculty to student ratio
for both laboratory courses and lecture courses, not including ratios for basic science
courses or courses taught outside the degree for which the AT program does not have
control. For faculty to student ratios in laboratory courses, the bimodal responses
(N = 48 and 46 respectively) reported a 1:12 and 1:10 ratio; lower than last year’s data’s
modes. and 238 (64%) Of all responding professional programs, 250 (70%) of programs
reported a faculty to student ratio of 1:13 or lower in laboratory courses. Six programs
(1.7%), an increase from last year, reported a laboratory faculty to student ratio of 1:25 or
higher. For faculty to student ratios in lecture courses, the mode (N = 39) reported a 1:15
ratio, and 311 (84%) of all responding professional programs reported a faculty to student
ratio of 1:20 or lower. Three programs (0.9%) reported a lecture faculty to student ratio of
1:40 or higher; this number is the same as last year.

2015 – 2016 CAATE ANALYTICS REPORT 21
PROFESSIONAL DEGREE PROGRAM INFORMATION (N = 370)
OUTCOMESAggregate Board of Certification Exam Pass RatesThe three-year aggregate first time BOC exam pass rate scores are used to determine
compliance with Standard 11, which mandates an aggregate BOC exam pass rate of
70% or higher. The data included in the analysis contains all BOC pass rates through the
October 2016 BOC exam window. New programs are not evaluated for compliance with
Standard 11 until the time at which they have three years of BOC Examination data. The
number of non-compliant programs decreased as compared to last year, which saw 91
programs in non-compliance.
Professional Program Compliance with Standard 11 (2014-2016)
Compliant
Non-Compliant
79%
20%
n = 370
New Program
Baccalaureate Program Compliance with Standard 11 (2014-2016)
Compliant
Non-Compliant
76%
23%
n = 307
New Program
1%
1%

2015 – 2016 CAATE ANALYTICS REPORT 22
PROFESSIONAL DEGREE PROGRAM INFORMATION (N = 370)
1st Attempt BOC Exam Pass Rate Yearly Comparison; 2016 & 2015
Master’s Degree Program Compliance with Standard 11 (2014-2016)
Compliant
Non-Compliant
92%
8%
n = 63
0
20
40
60
80
100
120
140
0-9% 10-19% 20-29% 30-39% 40-49% 50-59% 60-69% 70-79% 80-89% 90-100%
Pass Rate Percentage Range
Nu
mb
er o
f P
rgra
ms
2016 2015

2015 – 2016 CAATE ANALYTICS REPORT 23
PROFESSIONAL DEGREE PROGRAM INFORMATION (N = 370)
Graduates’ Employment in Athletic TrainingProgram Directors were asked to identify the percentage of students from their
graduating cohort that are employed in Athletic Training, including graduate
assistantships and/or internships.
Percentage of Graduating Cohort Employed in Athletic Training
0
10
20
30
40
50
60
70
80
90
0-10% 11-20% 21-30% 31-40% 41-50% 51-60% 61-70% 71-80% 81-90% 91-100%
Percentage of Graduates Employed in AT
Nu
mb
er o
f P
rgra
ms
2016 2015

2015 – 2016 CAATE ANALYTICS REPORT 24
PROFESSIONAL DEGREE PROGRAM INFORMATION (N = 370)
Graduates’ Placement
2015-2016 Graduating Student Placement
n = 4040
0
200
400
600
800
1000
1200
1400
Employ
ed as
an
Athlet
ic Tra
iner
Employ
ed as
an
Athlet
ic Tra
iner
and
in a
Degre
e Pro
gram
Employ
ed oth
er th
an
as an
Ath
letic
Train
er
Not Em
ployed
, due
to M
ilitar
y Ser
vice
Nu
mb
er o
f S
tud
ents
Do Not K
now
Not Em
ployed
Did N
ot Answ
er
Not Em
ployed
, due t
o
Enrollm
ent i
n anoth
er
Degre
e Pro
gram

2015 – 2016 CAATE ANALYTICS REPORT 25
POST-PROFESSIONAL DEGREE PROGRAMS
Post-Professional degree programs lead to a degree at the master’s or doctoral level for
students that are already credentialed as athletic trainers. These programs are intended to
expand the depth and breadth of the applied, experiential, and propositional knowledge
and skills of athletic trainers through didactic, clinical, and research experiences.
POST-PROFESSIONAL DEGREE PROGRAM OVERVIEWInstitution Type: Public
Degree: MSAT
Admissions Process: Direct
New Students Admitted: 11‡
Program Enrollment: 22‡
Student Enrollment by Gender Ratio 7:4, Female to Male
Student Enrollment by Race Ratio: 15:4, White to all other races*
Faculty to Student Ratio (Lecture): 1:11
Faculty to Student Ratio (Lab): 1:10
Program Director:Tenured Faculty, 10-month appointment, academic doctorate degree
Clinical Education Coordinator:10-month appointment, academic doctorate degree
Number of Core Faculty: 3
*denotes decrease from last year’s ‘At a Glance’ data, ‡ denotes increase from last year’s ‘At a Glance’ data
2015 – 2016 CAATE ANALYTICS REPORT 26
POST-PROFESSIONAL DEGREE PROGRAMS
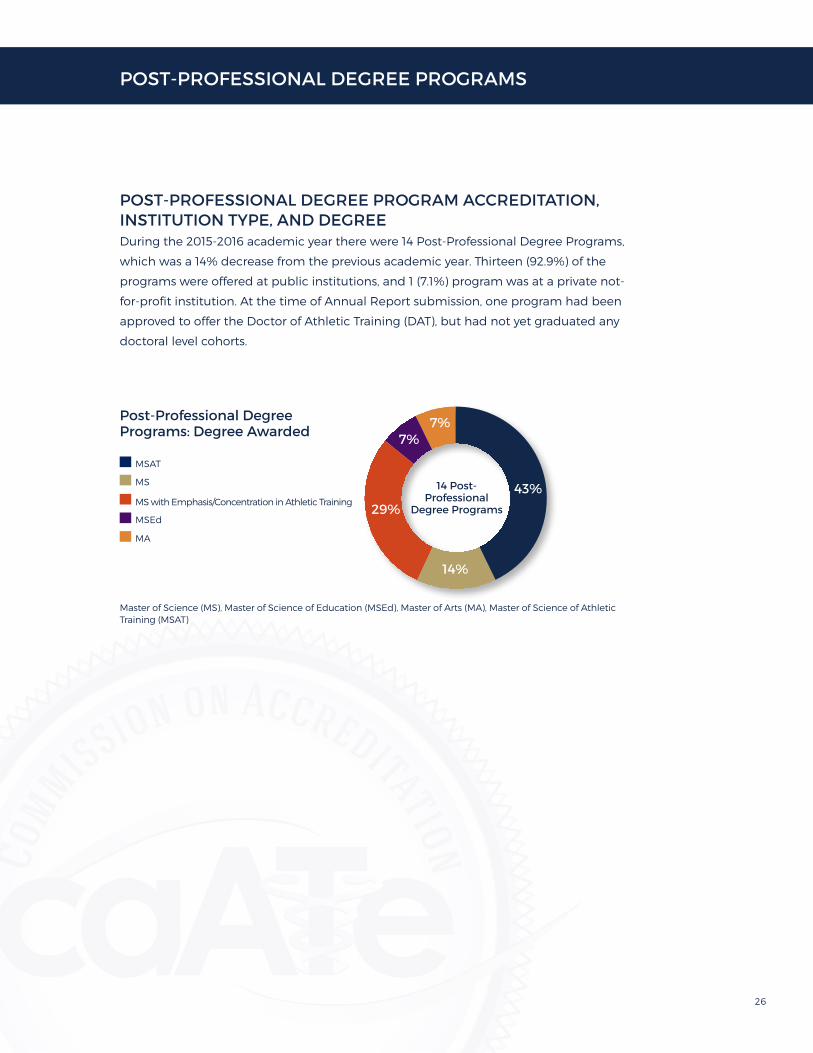
POST-PROFESSIONAL DEGREE PROGRAM ACCREDITATION, INSTITUTION TYPE, AND DEGREEDuring the 2015-2016 academic year there were 14 Post-Professional Degree Programs,
which was a 14% decrease from the previous academic year. Thirteen (92.9%) of the
programs were offered at public institutions, and 1 (7.1%) program was at a private not-
for-profit institution. At the time of Annual Report submission, one program had been
approved to offer the Doctor of Athletic Training (DAT), but had not yet graduated any
doctoral level cohorts.
Post-Professional Degree Programs: Degree Awarded
MSAT
MS
MSEd
MA
MS with Emphasis/Concentration in Athletic Training43%
14%
29%
7%
14 Post-Professional
Degree Programs
Master of Science (MS), Master of Science of Education (MSEd), Master of Arts (MA), Master of Science of Athletic Training (MSAT)
7%

2015 – 2016 CAATE ANALYTICS REPORT 27
POST-PROFESSIONAL DEGREE PROGRAMS
POST-PROFESSIONAL DEGREE PROGRAMS BY STATE
MS0
LA0
UT0
MN0
ND0
SD0
IA0
WI0 MI
1
NY0
VT0MT
0
WA0
OR1
ID0 WY
0
NH0 ME
0
MA0RI0CT0NJ
0 DE0
DC0
MD0
CA0
NV0
AZ1 NM
0
TXo
CO0
NE0
KS0
MO0
IL1
IN2
OH2
PA1
OK0 AR
0
TN0
NC1
SC0
GA0
AL0
AK0 FL
HI1
KY1
WV0 VA
2

2015 – 2016 CAATE ANALYTICS REPORT 28
POST-PROFESSIONAL DEGREE PROGRAMS
PROGRAM ADMISSIONSAdmissions ProcessProgram Directors were asked to identify the admission process used by their program.
A process in which the student is admitted to the program upon admittance to the
institution is a direct admissions process, whereas a secondary admission process is one
in which the student applies to the program separately from the institution.
Number (%)
Direct Admissions 12 (85.7)
Secondary Admissions 2 (14.3)
n = 14
Admissions Availability
Mean per Program Total for all Programs
Admission Slots Available 12.1 170
Completed Applications 49.4 691
Students Offered Admissions 13.9 195
Students Accepting Offer 11.3 158
n = 14

2015 – 2016 CAATE ANALYTICS REPORT 29
POST-PROFESSIONAL DEGREE PROGRAMS
PROGRAM ENROLLMENTProgram Enrollment by Gender
Mean per Program Sum for all Programs
Female 13.4 188
Male 8.4 118
Transgender 0.1 1
Total 21.7 304*
n = 14 programs, * Total number of students enrolled reported does not equal the total number of reported female, male, and transgender students enrolled.
Post-Professional Degree Program: Enrollment by Gender Yearly Comparison
Mean Students per Program, n = 14, *Transgender data not collected in 2015
0
5
10
15
20
25
Total Female Male Transgender*
2016 2015

2015 – 2016 CAATE ANALYTICS REPORT 30
POST-PROFESSIONAL DEGREE PROGRAMS
Program Enrollment by Ethnicity
Mean per Program Sum for all Programs
Hispanic 1.0 14
Non-Hispanic 16.4 229
Unknown 3.6 50
n = 14
Post-Professional Degree Program Student Ethnicity Yearly Comparison
Mean Students per Program, n = 14
0
2
4
6
8
10
12
14
16
18
Hispanic Non-Hispanic Unknown
2016 2015

2015 – 2016 CAATE ANALYTICS REPORT 31
POST-PROFESSIONAL DEGREE PROGRAMS
Program Enrollment by Race
Mean per Program Sum of all Programs
American Indian 0.0 0
Asian 0.6 9
Black 0.4 6
Hawaiian/Pacific Islander 0.1 1
Other 0.2 3
Unknown 3.2 45
White 17.1 240
n = 14
Post-Professional Degree Program Student Race Yearly Comparison
0
2
4
6
8
10
12
14
16
18
AmericanIndian
Asian Black Hawaiian/Pacific Islander
Other Unknown White
2016 2015

2015 – 2016 CAATE ANALYTICS REPORT 32
POST-PROFESSIONAL DEGREE PROGRAMS
STUDENT EXPENSESProgram Directors listed the associated costs to attend the institution, and were
instructed to include lab fees in the annual fee section. ‘Annual Other Costs’ included
liability insurance and other publicized associated costs for their program. The
information provided by the private institution fell within the range of data provided
for all public institutions, so therefore were not differentiated in these analyses.
In State Costs% change from previous year’s
report
Out-of-State Costs
% change from previous year’s
report
Annual Tuition 10534 ±4897 No Change 20156 ± 8368 -1.5%
Annual Fees 1054 ± 902 -13.5% 1107 ± 1022 -19.3%
Annual Other Costs 1364 ± 4244 +19.3% 1470 ± 4640 -57.7%
Total Annual Cost 12909 ± 8368 +5.9% 22733 ± 11325 +7.1%
n = 14, Mean dollars ± SD unless otherwise noted
PROGRAM OPERATING COSTSPrograms indicated the program costs associated with administrative support, faculty and
instructional staff, expendable supplies, professional development, and operational costs.
If positions were shared between programs, respondents were instructed to include only
the amount of the position specifically charged to the program.
Mean Dollars ± SD
Administrative Support 43144 ± 79911
Faculty/Instructional Staff 302517 ± 198504
Expendable Supplies* 9004 ± 18648
Professional Development 6244 ± 4637
Operational Costs 4809 ± 10602
n = 14, *n = 13; one outlier removed.

2015 – 2016 CAATE ANALYTICS REPORT 33
POST-PROFESSIONAL DEGREE PROGRAMS
FACULTY & STAFFFor both the Program Director and the Clinical Education Coordinator, credit hours refer
to the amount of credits earned per course, which is published in the institution’s course
catalog and reflected on the student’s transcript. Contact hours refer to the amount time
spent in class over the academic year.
Program DirectorAll 14 (100%) of the post-professional degree program’s Program Directors reported
holding an academic doctorate degree.
Number (%)
PD is Tenure Track Faculty 12 (85.7)
PD is Tenured 11 (78.6)
Mean ± SD
PD Appointment (months) 10.1 ± 1.5
PD Contact Hours 185.6 ± 133.7
PD Credit Hours 12.8 ± 5.1
PD Release Time (% of overall load) 20.0 ± 8.9
n = 14
Clinical Education CoordinatorClinical Education Coordinators are not required by the Standards for post-professional
degree programs. Of the 14 accredited programs, 13 reported having a designated clinical
coordinator. Nine (69.2%) of the programs’ CEC have an earned academic doctorate
degree, one (7.1%) has a master’s degree, and three (21.4%) have a DPT
Mean ± SD
CEC Appointment (months) 10.5 ± 1.2
CEC Contact Hours 183.4 ± 157.0
CEC Credit Hours 12.9 ± 8.2
CEC Release Time (% of overall load) 13.1 ± 14.2
n = 14

2015 – 2016 CAATE ANALYTICS REPORT 34
POST-PROFESSIONAL DEGREE PROGRAMS
FACULTY TO STUDENT RATIOProgram administrators were instructed to calculate their average faculty to student ratio
for both laboratory courses and lecture courses, not including ratios for basic science
courses or courses taught outside the degree for which the AT program does not have
control. For faculty to student ratios in laboratory courses 50% of programs reported a
faculty to student ratio of 1:8 or lower, with a maximum reported ratio of 1:21. For faculty
to student ratios in lecture courses, the mode (N = 4) of faculty to student ratios was
1:10. Eleven programs (78.6 %) reported a ratio of 1:10 or lower, and the maximum ratio
reported was 1:24.
For preceptor to student ratios in the clinical environment, the mode (N = 6) reported a 1:2
ratio, and 11 (78.6%) of all responding post-professional programs reported a preceptor to
student ratio of 1:4 or lower. The maximum ratio for preceptors to students was 1:8.
PROGRAM FACULTYThe number of core faculty in each program ranged from 1 (n = 2) to 8 (n = 1). The mode
(n = 5) was three core faculty, and 85.7% of programs indicated have five or fewer core
faculty. Numbers of associated faculty ranged from 0 to 3, and numbers of adjunct faculty
ranged from 0 to 5.
Mean ± SD
Core Faculty 3.2 ± 1.8
Associated Faculty 1.2 ± 0.9
Adjunct Faculty 0.7 ± 1.4
n = 14

2015 – 2016 CAATE ANALYTICS REPORT 35
POST-PROFESSIONAL DEGREE PROGRAMS
OUTCOMESGraduates’ Employment in Athletic TrainingProgram Directors were asked to identify the percentage of students from their
graduating cohort that are employed in Athletic Training, including graduate
assistantships and/or internships.
Percentage of Graduating Cohort Employed in Athletic Training
0
2
4
6
8
10
12
0-9% 10-19% 20-29% 30-39% 40-49% 50-59% 60-69% 70-79% 80-89% 90-100%
Percentage of Graduates Employed in AT
Nu
mb
er o
f P
rgra
ms
2016 2015

2015 – 2016 CAATE ANALYTICS REPORT 36
POST-PROFESSIONAL RESIDENCY PROGRAMS
Residency programs offer structured curricula, including didactic and clinical components
in an identified focused area of clinical practice to those that are already credentialed
athletic trainers. These programs are designed to build upon and expand an athletic
trainer’s knowledge and experience acquired during entry-level education. For the
2015-2016 academic year there were five accredited residency programs in Athletic Training,
one of which received initial accreditation during this time frame. The program profiles are
presented below, and all other data provided in this report have been aggregated.
Name of the ProgramFocused Area of Clinical Practice
Sponsoring Organization
Type
Residency Length
(months)
Ben Hogan Sports Medicine Athletic Training Residency
Orthopedic Rehabilitation
Hospital 12
Emory Athletic Training ResidencyMusculoskeletal Evaluation and
DiagnosisUniversity 12
Houston Methodist Sugar Land – Athletic Training Residency
Orthopedic Rehabilitation
Hospital 12
New Hampshire Musculoskeletal Institute - Integrated Clinical Sports Medicine Residency
Primary Care501(c)3
Non-Profit12
St Luke’s Sports Medicine – Athletic Training Residency
Clinical Evaluation and
DiagnosisHospital 12 (+ 1 week)
n = 5

2015 – 2016 CAATE ANALYTICS REPORT 37
POST-PROFESSIONAL RESIDENCY PROGRAMS
ADMISSIONS AVAILABILITYMean per Program Total for all Programs
Admission Slots Available 3.4 17
Completed Applications 26.6 133
Residents Offered Admissions 4.6 23
Residents Accepting Offer 4.2 21
n = 5
PROGRAM ENROLLMENTProgram Enrollment by Gender
Mean per Program Sum for all Programs
Female 2.8 14
Male 1.2 6
Transgender 0.0 0.0
Total 4.0 20
n = 5
Post-Professional Residency Program: Enrollment by Gender Yearly Comparison
Mean Residents per Program, n = 4 in 2015, n = 5 in 2016
0.0
0.5
1.0
1.5
2.0
2.5
3.0
3.5
4.0
4.5
Total Resident Enrollment
Female Resident Enrollment
Male Resident Enrollment
2016 2015

2015 – 2016 CAATE ANALYTICS REPORT 38
POST-PROFESSIONAL RESIDENCY PROGRAMS
Program Enrollment by Ethnicity
Mean per Program Sum for all Programs
Hispanic 0.6 3
Non-Hispanic 3.4 17
Unknown 0.0 0
n = 5
Post-Professional Residency Program: Enrollment by Ethnicity Yearly Comparison
Mean Residents per Program, n = 4 in 2015, n = 5 in 2016
0.0
0.5
1.0
1.5
2.0
2.5
3.0
3.5
4.0
2016 2015
Hispanic Residents Enrolled Non-Hispanic Enrolled

2015 – 2016 CAATE ANALYTICS REPORT 39
POST-PROFESSIONAL RESIDENCY PROGRAMS
Program Enrollment by Race
Mean Per Program
Sum of all Programs*
American Indian 0.0 0
Asian 0.0 0
Black 0.8 4
Hawaiian/Pacific Islander 0.0 0
Other 0.2 1
Unknown 0.0 0
White 2.6 13
n = 5, *Sum of residents of race categories was less than the total number of resident reported
RESIDENT STATUSMean Per Program
Sum of all Programs
International Resident 0.0 0
In-State Resident 0.6 3
Out-of-State Resident 3.4 17
n = 5
PERSONNELPreceptors
Mean Per Program
Sum of all Programs
Total Number of Preceptors 7.8 39
Preceptors with AT Credential 2.0 10
Preceptors with MD Credential 3.0 15
Preceptors with PT Credential 1.6 8
Preceptors with Dual AT/PT Credential 0.4 2
Preceptors with DC Credential 0.2 1
Preceptors with DPM Credential 0.2 1
Preceptors with PA Credential 0.6 3
n = 5

2015 – 2016 CAATE ANALYTICS REPORT 40
POST-PROFESSIONAL RESIDENCY PROGRAMS
Faculty
Mean Per Program
Sum of all Programs
Total Number of Faculty 8.4 42
Faculty with AT Credential 2.8 14
Faculty with MD Credential 3.6 18
Faculty with PT Credential 1.8 9
Faculty with Dual AT/PT Credential 0.4 2
n = 5
OUTCOMESSalaryResidency program directors were asked to provide the average salary made by
residents upon employment following completion of the residency program. Based
upon the reported salaries of the known residents’ employment the mean salary
obtained by residents following completion of the residency program was $47,133.
Three (3) programs reported a starting salary average of $51,000+, one program reported
that one of its residents had gone on to pursue a PhD, and the other took at position at
$40,000 (thus an average salary of $40,000) and the final program reported an average
salary of $36,500 for its two residents completing their program.
EmploymentResidency program directors were asked to provide the percentage of residents
completed that residency program during the reporting period that ultimately gained
employment within the field of athletic training. All five residency programs reported a
100% employment rate within the field of athletic training.

6850 Austin Center Blvd., Suite 100 | Austin, TX 78731 – 3184 | 512-733-9700 | 844-GO-CAATE (844-462-2283) | [email protected]
F O L L O W U S :www.caate.net |